Project
avrg: GSE58827: Dynamics of the Mouse Liver
Navigation
Downloads
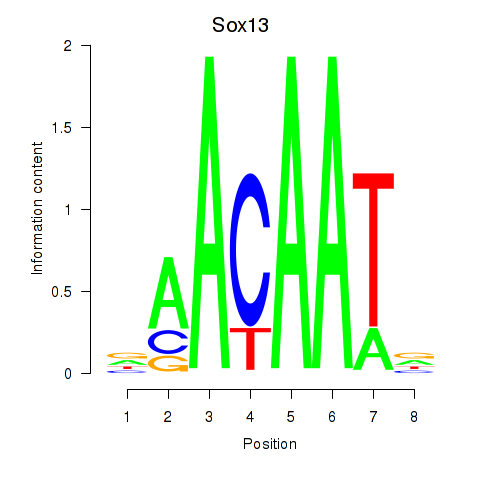
Results for Sox13
Z-value: 0.65
Motif logo
Transcription factors associated with Sox13
| Gene Symbol | Gene ID | Gene Info |
|---|---|---|
|
Sox13
|
ENSMUSG00000070643.5 | SRY (sex determining region Y)-box 13 |
Activity-expression correlation:
| Gene | Promoter | Pearson corr. coef. | P-value | Plot |
|---|---|---|---|---|
| Sox13 | mm10_v2_chr1_-_133424377_133424404 | 0.31 | 6.6e-02 | Click! |
Activity profile of Sox13 motif
Sorted Z-values of Sox13 motif
| Promoter | Log-likelihood | Transcript | Gene | Gene Info |
|---|---|---|---|---|
| chr11_-_99438143 | 3.49 |
ENSMUST00000017743.2
|
Krt20
|
keratin 20 |
| chr3_-_75270073 | 1.76 |
ENSMUST00000039047.4
|
Serpini2
|
serine (or cysteine) peptidase inhibitor, clade I, member 2 |
| chr12_+_36314160 | 1.58 |
ENSMUST00000041407.5
|
Sostdc1
|
sclerostin domain containing 1 |
| chr6_+_122513583 | 1.47 |
ENSMUST00000032210.7
ENSMUST00000148517.1 |
Mfap5
|
microfibrillar associated protein 5 |
| chr6_+_122513643 | 1.44 |
ENSMUST00000118626.1
|
Mfap5
|
microfibrillar associated protein 5 |
| chr12_+_24708984 | 1.37 |
ENSMUST00000154588.1
|
Rrm2
|
ribonucleotide reductase M2 |
| chr15_-_36879816 | 1.31 |
ENSMUST00000100713.2
|
Gm10384
|
predicted gene 10384 |
| chr7_-_132813095 | 1.13 |
ENSMUST00000106165.1
|
Fam53b
|
family with sequence similarity 53, member B |
| chr8_+_105427634 | 0.82 |
ENSMUST00000067305.6
|
Lrrc36
|
leucine rich repeat containing 36 |
| chr10_+_53596936 | 0.78 |
ENSMUST00000020004.6
|
Asf1a
|
ASF1 anti-silencing function 1 homolog A (S. cerevisiae) |
| chr15_-_34356421 | 0.77 |
ENSMUST00000179647.1
|
9430069I07Rik
|
RIKEN cDNA 9430069I07 gene |
| chrX_+_133850980 | 0.74 |
ENSMUST00000033602.8
|
Tnmd
|
tenomodulin |
| chr1_+_135729147 | 0.57 |
ENSMUST00000027677.7
|
Csrp1
|
cysteine and glycine-rich protein 1 |
| chr12_-_104473236 | 0.56 |
ENSMUST00000021513.4
|
Gsc
|
goosecoid homeobox |
| chr3_-_95251148 | 0.49 |
ENSMUST00000125515.2
ENSMUST00000107195.2 |
Bnipl
|
BCL2/adenovirus E1B 19kD interacting protein like |
| chr13_-_66851513 | 0.49 |
ENSMUST00000169322.1
|
Gm17404
|
predicted gene, 17404 |
| chr17_+_24886643 | 0.48 |
ENSMUST00000117890.1
ENSMUST00000168265.1 ENSMUST00000120943.1 ENSMUST00000068508.6 ENSMUST00000119829.1 |
Spsb3
|
splA/ryanodine receptor domain and SOCS box containing 3 |
| chr9_-_75597643 | 0.44 |
ENSMUST00000164100.1
|
Tmod2
|
tropomodulin 2 |
| chr11_+_74082907 | 0.43 |
ENSMUST00000178159.1
|
Zfp616
|
zinc finger protein 616 |
| chr2_+_25180737 | 0.43 |
ENSMUST00000104999.2
|
Nrarp
|
Notch-regulated ankyrin repeat protein |
| chr4_-_58499398 | 0.41 |
ENSMUST00000107570.1
|
Lpar1
|
lysophosphatidic acid receptor 1 |
| chr17_-_68004075 | 0.39 |
ENSMUST00000024840.5
|
Arhgap28
|
Rho GTPase activating protein 28 |
| chr4_+_48585135 | 0.39 |
ENSMUST00000030032.6
|
Tmeff1
|
transmembrane protein with EGF-like and two follistatin-like domains 1 |
| chr19_-_7241216 | 0.35 |
ENSMUST00000025675.9
|
Naa40
|
N(alpha)-acetyltransferase 40, NatD catalytic subunit, homolog (S. cerevisiae) |
| chr3_-_95251049 | 0.35 |
ENSMUST00000098871.4
|
Bnipl
|
BCL2/adenovirus E1B 19kD interacting protein like |
| chr1_+_39900883 | 0.34 |
ENSMUST00000163854.2
ENSMUST00000168431.1 |
Map4k4
|
mitogen-activated protein kinase kinase kinase kinase 4 |
| chr3_+_60877002 | 0.32 |
ENSMUST00000099086.2
|
Gm8325
|
predicted pseudogene 8325 |
| chr4_+_48585276 | 0.30 |
ENSMUST00000123476.1
|
Tmeff1
|
transmembrane protein with EGF-like and two follistatin-like domains 1 |
| chr8_-_11008458 | 0.28 |
ENSMUST00000040514.6
|
Irs2
|
insulin receptor substrate 2 |
| chr10_-_116473418 | 0.27 |
ENSMUST00000087965.4
ENSMUST00000164271.1 |
Kcnmb4
|
potassium large conductance calcium-activated channel, subfamily M, beta member 4 |
| chr3_-_141982224 | 0.25 |
ENSMUST00000029948.8
|
Bmpr1b
|
bone morphogenetic protein receptor, type 1B |
| chr3_+_87906321 | 0.24 |
ENSMUST00000005017.8
|
Hdgf
|
hepatoma-derived growth factor |
| chr5_-_8367982 | 0.23 |
ENSMUST00000088761.4
ENSMUST00000115386.1 ENSMUST00000050166.7 ENSMUST00000046838.7 ENSMUST00000115388.2 ENSMUST00000088744.5 ENSMUST00000115385.1 |
Adam22
|
a disintegrin and metallopeptidase domain 22 |
| chr3_+_34649987 | 0.22 |
ENSMUST00000099151.2
|
Sox2
|
SRY-box containing gene 2 |
| chr10_-_53647080 | 0.21 |
ENSMUST00000169866.1
|
Fam184a
|
family with sequence similarity 184, member A |
| chr6_-_56362356 | 0.20 |
ENSMUST00000044505.7
ENSMUST00000166102.1 ENSMUST00000164037.1 ENSMUST00000114327.2 |
Pde1c
|
phosphodiesterase 1C |
| chr19_-_19001099 | 0.19 |
ENSMUST00000040153.8
ENSMUST00000112828.1 |
Rorb
|
RAR-related orphan receptor beta |
| chr2_+_70039114 | 0.14 |
ENSMUST00000060208.4
|
Myo3b
|
myosin IIIB |
| chr1_-_93101825 | 0.12 |
ENSMUST00000112958.2
|
Kif1a
|
kinesin family member 1A |
| chr5_-_86518562 | 0.12 |
ENSMUST00000140095.1
|
Tmprss11g
|
transmembrane protease, serine 11g |
| chr15_+_99702278 | 0.11 |
ENSMUST00000023759.4
|
Smarcd1
|
SWI/SNF related, matrix associated, actin dependent regulator of chromatin, subfamily d, member 1 |
| chr13_-_66852017 | 0.11 |
ENSMUST00000059329.6
|
Gm17449
|
predicted gene, 17449 |
| chr1_+_17145357 | 0.11 |
ENSMUST00000026879.7
|
Gdap1
|
ganglioside-induced differentiation-associated-protein 1 |
| chr13_-_22102764 | 0.09 |
ENSMUST00000075055.2
|
Vmn1r189
|
vomeronasal 1 receptor 189 |
| chr18_+_69593361 | 0.07 |
ENSMUST00000114978.2
ENSMUST00000114977.1 |
Tcf4
|
transcription factor 4 |
| chr10_-_117238665 | 0.06 |
ENSMUST00000020392.4
|
9530003J23Rik
|
RIKEN cDNA 9530003J23 gene |
| chr11_-_77489666 | 0.04 |
ENSMUST00000037593.7
ENSMUST00000092892.3 |
Ankrd13b
|
ankyrin repeat domain 13b |
| chr13_-_66355385 | 0.03 |
ENSMUST00000099416.3
|
Vmn2r-ps104
|
vomeronasal 2, receptor, pseudogene 104 |
| chr7_-_84679346 | 0.03 |
ENSMUST00000069537.2
ENSMUST00000178385.1 |
Zfand6
|
zinc finger, AN1-type domain 6 |
| chr4_-_115781012 | 0.02 |
ENSMUST00000106521.1
|
Tex38
|
testis expressed 38 |
Network of associatons between targets according to the STRING database.

First level regulatory network of Sox13
Gene Ontology Analysis
Gene overrepresentation in biological process category:
| Log-likelihood per target | Total log-likelihood | Term | Description |
|---|---|---|---|
| 0.5 | 1.6 | GO:2000016 | negative regulation of determination of dorsal identity(GO:2000016) |
| 0.1 | 3.5 | GO:0045109 | intermediate filament organization(GO:0045109) |
| 0.1 | 0.4 | GO:1904565 | response to 1-oleoyl-sn-glycerol 3-phosphate(GO:1904565) cellular response to 1-oleoyl-sn-glycerol 3-phosphate(GO:1904566) |
| 0.1 | 0.4 | GO:1904425 | negative regulation of GTP binding(GO:1904425) |
| 0.1 | 2.9 | GO:0097435 | fibril organization(GO:0097435) |
| 0.1 | 0.8 | GO:0040009 | regulation of growth rate(GO:0040009) |
| 0.1 | 1.4 | GO:0009263 | deoxyribonucleotide biosynthetic process(GO:0009263) |
| 0.1 | 0.2 | GO:0050973 | detection of mechanical stimulus involved in equilibrioception(GO:0050973) |
| 0.1 | 0.3 | GO:0048165 | ovarian cumulus expansion(GO:0001550) fused antrum stage(GO:0048165) |
| 0.0 | 0.4 | GO:0051694 | pointed-end actin filament capping(GO:0051694) |
| 0.0 | 0.6 | GO:0014029 | neural crest formation(GO:0014029) |
| 0.0 | 0.4 | GO:0014807 | regulation of somitogenesis(GO:0014807) |
| 0.0 | 0.7 | GO:0001886 | endothelial cell morphogenesis(GO:0001886) |
| 0.0 | 0.3 | GO:0005513 | detection of calcium ion(GO:0005513) |
| 0.0 | 0.8 | GO:0034723 | DNA replication-dependent nucleosome assembly(GO:0006335) DNA replication-dependent nucleosome organization(GO:0034723) |
| 0.0 | 0.3 | GO:0010748 | negative regulation of B cell apoptotic process(GO:0002903) negative regulation of plasma membrane long-chain fatty acid transport(GO:0010748) |
| 0.0 | 1.1 | GO:0035411 | catenin import into nucleus(GO:0035411) |
| 0.0 | 0.3 | GO:0061179 | negative regulation of insulin secretion involved in cellular response to glucose stimulus(GO:0061179) |
| 0.0 | 0.4 | GO:0043968 | histone H2A acetylation(GO:0043968) |
| 0.0 | 0.2 | GO:0046549 | retinal cone cell development(GO:0046549) |
| 0.0 | 0.2 | GO:0046069 | cGMP catabolic process(GO:0046069) |
Gene overrepresentation in cellular component category:
| Log-likelihood per target | Total log-likelihood | Term | Description |
|---|---|---|---|
| 0.3 | 1.4 | GO:0005971 | ribonucleoside-diphosphate reductase complex(GO:0005971) |
| 0.2 | 2.9 | GO:0043205 | microfibril(GO:0001527) fibril(GO:0043205) |
| 0.0 | 3.5 | GO:0005882 | intermediate filament(GO:0005882) |
Gene overrepresentation in molecular function category:
| Log-likelihood per target | Total log-likelihood | Term | Description |
|---|---|---|---|
| 0.7 | 2.9 | GO:0030023 | extracellular matrix constituent conferring elasticity(GO:0030023) |
| 0.3 | 1.4 | GO:0061731 | ribonucleoside-diphosphate reductase activity, thioredoxin disulfide as acceptor(GO:0004748) oxidoreductase activity, acting on CH or CH2 groups, disulfide as acceptor(GO:0016728) ribonucleoside-diphosphate reductase activity(GO:0061731) |
| 0.1 | 1.6 | GO:0036122 | BMP binding(GO:0036122) BMP receptor activity(GO:0098821) |
| 0.1 | 0.4 | GO:0070915 | lysophosphatidic acid receptor activity(GO:0070915) |
| 0.1 | 0.3 | GO:0004111 | creatine kinase activity(GO:0004111) |
| 0.1 | 0.4 | GO:1990189 | peptide-serine-N-acetyltransferase activity(GO:1990189) |
| 0.0 | 0.2 | GO:0008502 | melatonin receptor activity(GO:0008502) |
| 0.0 | 0.3 | GO:0005025 | transforming growth factor beta receptor activity, type I(GO:0005025) |
| 0.0 | 0.2 | GO:0004117 | calmodulin-dependent cyclic-nucleotide phosphodiesterase activity(GO:0004117) calcium- and calmodulin-regulated 3',5'-cyclic-GMP phosphodiesterase activity(GO:0048101) |
| 0.0 | 0.4 | GO:0005523 | tropomyosin binding(GO:0005523) |
| 0.0 | 0.1 | GO:0001011 | transcription factor activity, sequence-specific DNA binding, RNA polymerase recruiting(GO:0001011) transcription factor activity, TFIIB-class binding(GO:0001087) |
| 0.0 | 1.8 | GO:0004867 | serine-type endopeptidase inhibitor activity(GO:0004867) |
| 0.0 | 0.6 | GO:0001103 | RNA polymerase II repressing transcription factor binding(GO:0001103) |
| 0.0 | 0.2 | GO:0001222 | transcription corepressor binding(GO:0001222) |
| 0.0 | 0.2 | GO:0035198 | miRNA binding(GO:0035198) |
| 0.0 | 0.3 | GO:0015269 | calcium-activated potassium channel activity(GO:0015269) |
Gene overrepresentation in curated gene sets: canonical pathways category:
| Log-likelihood per target | Total log-likelihood | Term | Description |
|---|---|---|---|
| 0.0 | 1.8 | PID BMP PATHWAY | BMP receptor signaling |
| 0.0 | 2.9 | PID NOTCH PATHWAY | Notch signaling pathway |
| 0.0 | 1.4 | PID E2F PATHWAY | E2F transcription factor network |
Gene overrepresentation in curated gene sets: REACTOME pathways category:
| Log-likelihood per target | Total log-likelihood | Term | Description |
|---|---|---|---|
| 0.1 | 1.4 | REACTOME G1 S SPECIFIC TRANSCRIPTION | Genes involved in G1/S-Specific Transcription |
| 0.0 | 0.3 | REACTOME SOS MEDIATED SIGNALLING | Genes involved in SOS-mediated signalling |