Project
GSE58827: Dynamics of the Mouse Liver
Navigation
Downloads
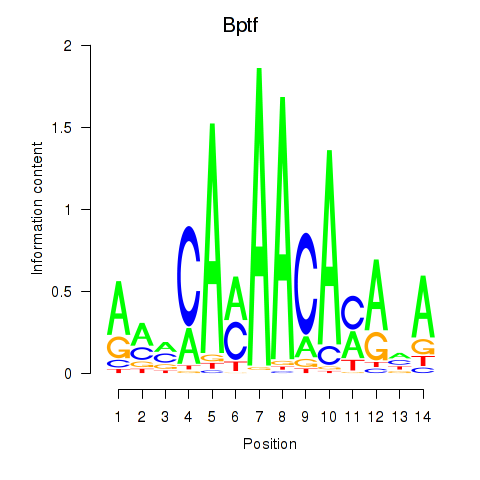
Results for Bptf
Z-value: 2.29
Motif logo
Transcription factors associated with Bptf
| Gene Symbol | Gene ID | Gene Info |
|---|---|---|
|
Bptf
|
ENSMUSG00000040481.18 | bromodomain PHD finger transcription factor |
Activity-expression correlation:
| Gene | Promoter | Pearson corr. coef. | P-value | Plot |
|---|---|---|---|---|
| Bptf | mm39_v1_chr11_-_107022940_107022993 | -0.24 | 1.7e-01 | Click! |
Activity profile of Bptf motif
Sorted Z-values of Bptf motif
| Promoter | Log-likelihood | Transcript | Gene | Gene Info |
|---|---|---|---|---|
| chr4_-_60618357 | 39.82 |
ENSMUST00000084544.5
ENSMUST00000098046.10 |
Mup11
|
major urinary protein 11 |
| chr4_-_61437704 | 31.72 |
ENSMUST00000095051.6
ENSMUST00000107483.8 |
Mup16
|
major urinary protein 16 |
| chr4_-_60377932 | 29.21 |
ENSMUST00000107506.9
ENSMUST00000122381.8 ENSMUST00000118759.8 ENSMUST00000132829.3 |
Mup9
|
major urinary protein 9 |
| chr4_-_60139857 | 27.40 |
ENSMUST00000107490.5
ENSMUST00000074700.9 |
Mup2
|
major urinary protein 2 |
| chr4_-_61592331 | 25.60 |
ENSMUST00000098040.4
|
Mup18
|
major urinary protein 18 |
| chr4_-_61700450 | 24.12 |
ENSMUST00000107477.2
ENSMUST00000080606.9 |
Mup19
|
major urinary protein 19 |
| chr4_-_60777462 | 23.14 |
ENSMUST00000211875.2
|
Mup22
|
major urinary protein 22 |
| chr4_-_61514108 | 22.95 |
ENSMUST00000107484.2
|
Mup17
|
major urinary protein 17 |
| chr4_-_60538151 | 21.52 |
ENSMUST00000098047.3
|
Mup10
|
major urinary protein 10 |
| chr4_-_61357980 | 21.25 |
ENSMUST00000095049.5
|
Mup15
|
major urinary protein 15 |
| chr4_-_61184270 | 19.36 |
ENSMUST00000072678.6
ENSMUST00000098042.10 |
Mup13
|
major urinary protein 13 |
| chr4_-_61972348 | 17.07 |
ENSMUST00000074018.4
|
Mup20
|
major urinary protein 20 |
| chr4_-_60457902 | 15.16 |
ENSMUST00000084548.11
ENSMUST00000103012.10 ENSMUST00000107499.4 |
Mup1
|
major urinary protein 1 |
| chr4_-_60697274 | 11.23 |
ENSMUST00000117932.2
|
Mup12
|
major urinary protein 12 |
| chr12_-_72675624 | 10.21 |
ENSMUST00000208039.2
ENSMUST00000207585.2 |
Gm4756
|
predicted gene 4756 |
| chr7_+_46401214 | 10.18 |
ENSMUST00000210769.2
ENSMUST00000210272.2 ENSMUST00000075982.4 |
Saa2
|
serum amyloid A 2 |
| chr7_+_131012330 | 9.91 |
ENSMUST00000015829.15
ENSMUST00000117518.2 ENSMUST00000133277.4 |
Acadsb
|
acyl-Coenzyme A dehydrogenase, short/branched chain |
| chr15_+_6474808 | 8.92 |
ENSMUST00000022749.17
ENSMUST00000239466.2 |
C9
|
complement component 9 |
| chr12_-_104010690 | 8.90 |
ENSMUST00000043915.4
|
Serpina12
|
serine (or cysteine) peptidase inhibitor, clade A (alpha-1 antiproteinase, antitrypsin), member 12 |
| chrX_-_74918122 | 8.71 |
ENSMUST00000033547.14
|
Pls3
|
plastin 3 (T-isoform) |
| chr12_-_103923145 | 7.29 |
ENSMUST00000085054.5
|
Serpina1e
|
serine (or cysteine) peptidase inhibitor, clade A, member 1E |
| chr3_-_86906591 | 7.13 |
ENSMUST00000063869.11
ENSMUST00000029717.4 |
Cd1d1
|
CD1d1 antigen |
| chr3_+_59989282 | 7.13 |
ENSMUST00000029326.6
|
Sucnr1
|
succinate receptor 1 |
| chr3_+_134986982 | 6.92 |
ENSMUST00000120397.8
ENSMUST00000029817.11 |
Bdh2
|
3-hydroxybutyrate dehydrogenase, type 2 |
| chr6_-_3988835 | 6.76 |
ENSMUST00000203257.2
|
Tfpi2
|
tissue factor pathway inhibitor 2 |
| chr7_+_26819334 | 6.50 |
ENSMUST00000003100.10
|
Cyp2f2
|
cytochrome P450, family 2, subfamily f, polypeptide 2 |
| chr19_-_39637489 | 6.36 |
ENSMUST00000067328.7
|
Cyp2c67
|
cytochrome P450, family 2, subfamily c, polypeptide 67 |
| chr16_-_45975440 | 6.01 |
ENSMUST00000059524.7
|
Gm4737
|
predicted gene 4737 |
| chr12_-_72675605 | 5.90 |
ENSMUST00000222413.2
|
Gm4756
|
predicted gene 4756 |
| chr6_-_3988900 | 5.84 |
ENSMUST00000183682.3
|
Tfpi2
|
tissue factor pathway inhibitor 2 |
| chr19_-_44095840 | 5.73 |
ENSMUST00000119591.2
ENSMUST00000026217.11 |
Chuk
|
conserved helix-loop-helix ubiquitous kinase |
| chr4_-_107928567 | 5.67 |
ENSMUST00000106701.2
|
Scp2
|
sterol carrier protein 2, liver |
| chr8_+_105775224 | 5.66 |
ENSMUST00000093222.13
ENSMUST00000093223.5 |
Ces3a
|
carboxylesterase 3A |
| chr7_-_12732067 | 5.65 |
ENSMUST00000032539.14
ENSMUST00000120903.8 |
Slc27a5
|
solute carrier family 27 (fatty acid transporter), member 5 |
| chr9_+_92157655 | 5.08 |
ENSMUST00000034932.14
ENSMUST00000180154.8 |
Plscr2
|
phospholipid scramblase 2 |
| chr2_-_23939401 | 5.08 |
ENSMUST00000051416.12
|
Hnmt
|
histamine N-methyltransferase |
| chr4_+_144619397 | 4.69 |
ENSMUST00000105744.8
ENSMUST00000171001.8 |
Dhrs3
|
dehydrogenase/reductase (SDR family) member 3 |
| chr12_-_103871146 | 4.65 |
ENSMUST00000074051.6
|
Serpina1c
|
serine (or cysteine) peptidase inhibitor, clade A, member 1C |
| chr11_+_3981769 | 4.60 |
ENSMUST00000019512.8
|
Sec14l4
|
SEC14-like lipid binding 4 |
| chr7_-_48497771 | 4.55 |
ENSMUST00000032658.14
|
Csrp3
|
cysteine and glycine-rich protein 3 |
| chr4_-_96552349 | 4.53 |
ENSMUST00000030299.8
|
Cyp2j5
|
cytochrome P450, family 2, subfamily j, polypeptide 5 |
| chr15_+_9335636 | 4.47 |
ENSMUST00000072403.7
|
Ugt3a2
|
UDP glycosyltransferases 3 family, polypeptide A2 |
| chr1_+_88062508 | 4.45 |
ENSMUST00000113134.8
ENSMUST00000140092.8 |
Ugt1a6a
|
UDP glucuronosyltransferase 1 family, polypeptide A6A |
| chr15_-_74869684 | 4.17 |
ENSMUST00000190188.2
ENSMUST00000189068.7 ENSMUST00000186526.7 ENSMUST00000187171.2 ENSMUST00000187994.7 |
Ly6a
|
lymphocyte antigen 6 complex, locus A |
| chr4_-_49506538 | 4.17 |
ENSMUST00000043056.9
|
Baat
|
bile acid-Coenzyme A: amino acid N-acyltransferase |
| chr10_+_87694117 | 3.91 |
ENSMUST00000122386.8
|
Igf1
|
insulin-like growth factor 1 |
| chr1_+_74752710 | 3.90 |
ENSMUST00000027356.7
|
Cyp27a1
|
cytochrome P450, family 27, subfamily a, polypeptide 1 |
| chr3_-_89008406 | 3.83 |
ENSMUST00000200659.2
|
Gm43738
|
predicted gene 43738 |
| chr8_-_25066313 | 3.83 |
ENSMUST00000121992.2
|
Ido2
|
indoleamine 2,3-dioxygenase 2 |
| chr2_-_23938869 | 3.80 |
ENSMUST00000114497.2
|
Hnmt
|
histamine N-methyltransferase |
| chr8_-_118398264 | 3.73 |
ENSMUST00000037955.14
|
Sdr42e1
|
short chain dehydrogenase/reductase family 42E, member 1 |
| chr9_-_78263025 | 3.71 |
ENSMUST00000125479.8
|
Gsta2
|
glutathione S-transferase, alpha 2 (Yc2) |
| chr12_-_72675670 | 3.68 |
ENSMUST00000209038.2
|
Gm4756
|
predicted gene 4756 |
| chr4_+_144619647 | 3.60 |
ENSMUST00000154208.8
|
Dhrs3
|
dehydrogenase/reductase (SDR family) member 3 |
| chr1_+_180878797 | 3.60 |
ENSMUST00000036819.7
|
9130409I23Rik
|
RIKEN cDNA 9130409I23 gene |
| chr6_+_71470987 | 3.46 |
ENSMUST00000114179.3
|
Rnf103
|
ring finger protein 103 |
| chr4_+_144619696 | 3.45 |
ENSMUST00000142808.8
|
Dhrs3
|
dehydrogenase/reductase (SDR family) member 3 |
| chr3_+_86893869 | 3.39 |
ENSMUST00000041920.5
|
Cd1d2
|
CD1d2 antigen |
| chrX_-_161671421 | 3.33 |
ENSMUST00000033723.4
|
Syap1
|
synapse associated protein 1 |
| chr16_-_75563645 | 3.30 |
ENSMUST00000114244.2
ENSMUST00000046283.16 |
Hspa13
|
heat shock protein 70 family, member 13 |
| chr1_-_192923816 | 3.29 |
ENSMUST00000160929.8
|
Hsd11b1
|
hydroxysteroid 11-beta dehydrogenase 1 |
| chr1_-_139487951 | 3.14 |
ENSMUST00000023965.8
|
Cfhr1
|
complement factor H-related 1 |
| chr10_-_53952686 | 3.13 |
ENSMUST00000220088.2
|
Man1a
|
mannosidase 1, alpha |
| chr9_+_22365586 | 3.12 |
ENSMUST00000168332.2
|
Gm17545
|
predicted gene, 17545 |
| chr2_-_93988229 | 3.11 |
ENSMUST00000028619.5
|
Hsd17b12
|
hydroxysteroid (17-beta) dehydrogenase 12 |
| chrX_-_161426624 | 3.08 |
ENSMUST00000112334.8
|
Reps2
|
RALBP1 associated Eps domain containing protein 2 |
| chr9_-_64248426 | 3.07 |
ENSMUST00000120760.8
ENSMUST00000168844.9 |
Dis3l
|
DIS3 like exosome 3'-5' exoribonuclease |
| chr12_+_59142439 | 3.02 |
ENSMUST00000219140.3
|
Mia2
|
MIA SH3 domain ER export factor 2 |
| chr1_-_139786421 | 2.96 |
ENSMUST00000194186.6
ENSMUST00000094489.5 ENSMUST00000239380.2 |
Cfhr2
|
complement factor H-related 2 |
| chr17_-_30831576 | 2.93 |
ENSMUST00000235171.2
ENSMUST00000236335.2 ENSMUST00000167624.2 |
Glo1
|
glyoxalase 1 |
| chr18_+_21077627 | 2.84 |
ENSMUST00000050004.3
|
Rnf125
|
ring finger protein 125 |
| chrX_-_72140623 | 2.81 |
ENSMUST00000114524.9
ENSMUST00000074619.6 |
Xlr3a
|
X-linked lymphocyte-regulated 3A |
| chr10_+_87694924 | 2.81 |
ENSMUST00000095360.11
|
Igf1
|
insulin-like growth factor 1 |
| chrX_-_161426542 | 2.80 |
ENSMUST00000101102.2
|
Reps2
|
RALBP1 associated Eps domain containing protein 2 |
| chr12_-_103829810 | 2.79 |
ENSMUST00000085056.8
ENSMUST00000072876.12 ENSMUST00000124717.2 |
Serpina1a
|
serine (or cysteine) peptidase inhibitor, clade A, member 1A |
| chr8_-_85500010 | 2.78 |
ENSMUST00000109764.8
|
Nfix
|
nuclear factor I/X |
| chr2_+_103900164 | 2.73 |
ENSMUST00000111131.9
ENSMUST00000111132.8 ENSMUST00000129749.8 |
Cd59b
|
CD59b antigen |
| chr14_+_25942963 | 2.73 |
ENSMUST00000184016.3
|
Cphx1
|
cytoplasmic polyadenylated homeobox 1 |
| chr2_+_122065230 | 2.65 |
ENSMUST00000110551.4
|
Sord
|
sorbitol dehydrogenase |
| chr6_+_71470833 | 2.63 |
ENSMUST00000064637.11
ENSMUST00000114178.8 |
Rnf103
|
ring finger protein 103 |
| chr11_-_46581135 | 2.62 |
ENSMUST00000169584.8
|
Timd2
|
T cell immunoglobulin and mucin domain containing 2 |
| chr4_+_86666764 | 2.60 |
ENSMUST00000045512.15
ENSMUST00000082026.14 |
Dennd4c
|
DENN/MADD domain containing 4C |
| chr17_+_41245569 | 2.57 |
ENSMUST00000169611.4
|
Mmut
|
methylmalonyl-Coenzyme A mutase |
| chr2_-_34990689 | 2.56 |
ENSMUST00000226631.2
ENSMUST00000045776.5 ENSMUST00000226972.2 |
AI182371
|
expressed sequence AI182371 |
| chr3_+_152419731 | 2.54 |
ENSMUST00000159899.8
ENSMUST00000045029.15 |
Pigk
|
phosphatidylinositol glycan anchor biosynthesis, class K |
| chr16_+_44979086 | 2.54 |
ENSMUST00000023343.4
|
Atg3
|
autophagy related 3 |
| chr4_-_61753422 | 2.51 |
ENSMUST00000082287.3
|
Mup5
|
major urinary protein 5 |
| chr12_+_17316546 | 2.50 |
ENSMUST00000057288.7
ENSMUST00000239402.2 |
Pdia6
|
protein disulfide isomerase associated 6 |
| chr3_-_73615732 | 2.49 |
ENSMUST00000029367.6
|
Bche
|
butyrylcholinesterase |
| chr9_+_77824646 | 2.49 |
ENSMUST00000034904.14
|
Elovl5
|
ELOVL family member 5, elongation of long chain fatty acids (yeast) |
| chr6_+_149043011 | 2.47 |
ENSMUST00000179873.8
ENSMUST00000047531.16 ENSMUST00000111548.8 ENSMUST00000111547.2 ENSMUST00000134306.8 ENSMUST00000147934.4 |
Etfbkmt
|
electron transfer flavoprotein beta subunit lysine methyltransferase |
| chr17_+_85335775 | 2.47 |
ENSMUST00000024944.9
|
Slc3a1
|
solute carrier family 3, member 1 |
| chr4_-_57301791 | 2.44 |
ENSMUST00000075637.11
|
Ptpn3
|
protein tyrosine phosphatase, non-receptor type 3 |
| chr1_-_170978157 | 2.40 |
ENSMUST00000155798.2
ENSMUST00000081560.5 ENSMUST00000111336.10 |
Sdhc
|
succinate dehydrogenase complex, subunit C, integral membrane protein |
| chr11_-_40646090 | 2.37 |
ENSMUST00000020576.8
|
Ccng1
|
cyclin G1 |
| chr5_-_91550853 | 2.36 |
ENSMUST00000121044.6
|
Btc
|
betacellulin, epidermal growth factor family member |
| chr17_+_47747540 | 2.36 |
ENSMUST00000037701.13
|
AI661453
|
expressed sequence AI661453 |
| chr18_+_64473091 | 2.35 |
ENSMUST00000175965.10
|
Onecut2
|
one cut domain, family member 2 |
| chr3_-_157630690 | 2.30 |
ENSMUST00000118539.2
|
Cth
|
cystathionase (cystathionine gamma-lyase) |
| chr19_-_40175709 | 2.30 |
ENSMUST00000051846.13
|
Cyp2c70
|
cytochrome P450, family 2, subfamily c, polypeptide 70 |
| chr17_-_56424577 | 2.29 |
ENSMUST00000019808.12
|
Plin5
|
perilipin 5 |
| chrX_+_36059274 | 2.28 |
ENSMUST00000016463.4
|
Slc25a5
|
solute carrier family 25 (mitochondrial carrier, adenine nucleotide translocator), member 5 |
| chr10_-_95159933 | 2.27 |
ENSMUST00000053594.7
|
Cradd
|
CASP2 and RIPK1 domain containing adaptor with death domain |
| chr16_-_11727262 | 2.25 |
ENSMUST00000127972.8
ENSMUST00000121750.2 ENSMUST00000096272.11 ENSMUST00000073371.7 |
Cpped1
|
calcineurin-like phosphoesterase domain containing 1 |
| chr12_-_103704417 | 2.24 |
ENSMUST00000095450.11
ENSMUST00000187220.2 |
Serpina1b
|
serine (or cysteine) preptidase inhibitor, clade A, member 1B |
| chr9_+_114560235 | 2.23 |
ENSMUST00000035007.10
|
Cmtm6
|
CKLF-like MARVEL transmembrane domain containing 6 |
| chr9_-_64248570 | 2.23 |
ENSMUST00000068367.14
|
Dis3l
|
DIS3 like exosome 3'-5' exoribonuclease |
| chr6_+_124489364 | 2.18 |
ENSMUST00000068593.9
|
C1ra
|
complement component 1, r subcomponent A |
| chr14_+_67470735 | 2.16 |
ENSMUST00000022637.14
|
Ebf2
|
early B cell factor 2 |
| chr1_+_166081755 | 2.15 |
ENSMUST00000194964.6
ENSMUST00000192638.6 ENSMUST00000192426.6 ENSMUST00000195557.6 ENSMUST00000192732.6 ENSMUST00000193860.2 |
Ildr2
|
immunoglobulin-like domain containing receptor 2 |
| chr16_+_43330630 | 2.14 |
ENSMUST00000114695.3
|
Zbtb20
|
zinc finger and BTB domain containing 20 |
| chr5_-_121710768 | 2.13 |
ENSMUST00000200541.5
|
Aldh2
|
aldehyde dehydrogenase 2, mitochondrial |
| chr5_+_113910809 | 2.11 |
ENSMUST00000026937.12
ENSMUST00000112311.8 ENSMUST00000112312.8 |
Iscu
|
iron-sulfur cluster assembly enzyme |
| chr11_-_17161504 | 2.10 |
ENSMUST00000020317.8
|
Pno1
|
partner of NOB1 homolog |
| chr5_+_67418137 | 2.10 |
ENSMUST00000161369.3
|
Tmem33
|
transmembrane protein 33 |
| chr4_+_40722911 | 2.09 |
ENSMUST00000164233.8
ENSMUST00000137246.8 ENSMUST00000125442.8 |
Dnaja1
|
DnaJ heat shock protein family (Hsp40) member A1 |
| chr8_-_41507808 | 2.05 |
ENSMUST00000093534.11
|
Mtus1
|
mitochondrial tumor suppressor 1 |
| chr1_-_136881336 | 2.05 |
ENSMUST00000192929.6
|
Nr5a2
|
nuclear receptor subfamily 5, group A, member 2 |
| chr10_-_81127334 | 2.03 |
ENSMUST00000219479.2
|
Tjp3
|
tight junction protein 3 |
| chr8_+_46080746 | 2.03 |
ENSMUST00000145458.9
ENSMUST00000134321.8 |
Sorbs2
|
sorbin and SH3 domain containing 2 |
| chr13_+_52000704 | 2.02 |
ENSMUST00000021903.3
|
Gadd45g
|
growth arrest and DNA-damage-inducible 45 gamma |
| chr11_-_60702081 | 1.98 |
ENSMUST00000018744.15
|
Shmt1
|
serine hydroxymethyltransferase 1 (soluble) |
| chr5_-_4154681 | 1.97 |
ENSMUST00000001507.5
|
Cyp51
|
cytochrome P450, family 51 |
| chr2_-_69542805 | 1.96 |
ENSMUST00000102706.4
ENSMUST00000073152.13 |
Fastkd1
|
FAST kinase domains 1 |
| chr9_-_103165423 | 1.94 |
ENSMUST00000123530.8
|
1300017J02Rik
|
RIKEN cDNA 1300017J02 gene |
| chr9_-_48391838 | 1.93 |
ENSMUST00000216470.2
ENSMUST00000217037.2 ENSMUST00000034524.5 ENSMUST00000213895.2 |
Rexo2
|
RNA exonuclease 2 |
| chr1_+_88030951 | 1.88 |
ENSMUST00000113135.6
ENSMUST00000113138.8 |
Ugt1a7c
Ugt1a6b
|
UDP glucuronosyltransferase 1 family, polypeptide A7C UDP glucuronosyltransferase 1 family, polypeptide A6B |
| chrX_+_141009756 | 1.88 |
ENSMUST00000112916.9
|
Nxt2
|
nuclear transport factor 2-like export factor 2 |
| chr4_-_57143437 | 1.88 |
ENSMUST00000095076.10
ENSMUST00000030142.4 |
Epb41l4b
|
erythrocyte membrane protein band 4.1 like 4b |
| chr6_+_133082202 | 1.87 |
ENSMUST00000191462.2
|
Smim10l1
|
small integral membrane protein 10 like 1 |
| chr19_+_7471398 | 1.87 |
ENSMUST00000170373.9
ENSMUST00000236308.2 ENSMUST00000235557.2 |
Atl3
|
atlastin GTPase 3 |
| chr1_-_120048667 | 1.87 |
ENSMUST00000151708.3
|
Dbi
|
diazepam binding inhibitor |
| chr4_-_150994083 | 1.83 |
ENSMUST00000105674.8
ENSMUST00000105673.8 |
Park7
|
Parkinson disease (autosomal recessive, early onset) 7 |
| chr9_+_119186447 | 1.83 |
ENSMUST00000039610.10
|
Xylb
|
xylulokinase homolog (H. influenzae) |
| chr17_+_34524884 | 1.82 |
ENSMUST00000074557.11
|
H2-Eb1
|
histocompatibility 2, class II antigen E beta |
| chr1_-_72251466 | 1.81 |
ENSMUST00000048860.9
|
Mreg
|
melanoregulin |
| chr4_-_103072343 | 1.80 |
ENSMUST00000150285.8
|
Slc35d1
|
solute carrier family 35 (UDP-glucuronic acid/UDP-N-acetylgalactosamine dual transporter), member D1 |
| chr7_+_109617456 | 1.80 |
ENSMUST00000084731.5
|
Ipo7
|
importin 7 |
| chr5_-_66238313 | 1.80 |
ENSMUST00000202700.4
ENSMUST00000094757.9 ENSMUST00000113724.6 |
Rbm47
|
RNA binding motif protein 47 |
| chr12_-_103739847 | 1.79 |
ENSMUST00000078869.6
|
Serpina1d
|
serine (or cysteine) peptidase inhibitor, clade A, member 1D |
| chr4_+_24898074 | 1.79 |
ENSMUST00000029925.10
ENSMUST00000151249.2 |
Ndufaf4
|
NADH:ubiquinone oxidoreductase complex assembly factor 4 |
| chr17_+_37269468 | 1.79 |
ENSMUST00000040177.7
|
Polr1has
|
RNA polymerase I subunit H, antisense |
| chr10_+_29189496 | 1.77 |
ENSMUST00000020034.6
|
Echdc1
|
enoyl Coenzyme A hydratase domain containing 1 |
| chr18_+_38552011 | 1.76 |
ENSMUST00000025293.5
|
Ndfip1
|
Nedd4 family interacting protein 1 |
| chr17_+_53786240 | 1.75 |
ENSMUST00000017975.7
|
Rab5a
|
RAB5A, member RAS oncogene family |
| chr15_+_36174156 | 1.75 |
ENSMUST00000180159.8
ENSMUST00000057177.7 |
Polr2k
|
polymerase (RNA) II (DNA directed) polypeptide K |
| chr15_+_99291491 | 1.74 |
ENSMUST00000159531.3
|
Tmbim6
|
transmembrane BAX inhibitor motif containing 6 |
| chr17_+_56312672 | 1.74 |
ENSMUST00000133998.8
|
Mpnd
|
MPN domain containing |
| chr8_+_34143266 | 1.74 |
ENSMUST00000033992.9
|
Gsr
|
glutathione reductase |
| chr13_+_55862437 | 1.74 |
ENSMUST00000021959.11
|
Txndc15
|
thioredoxin domain containing 15 |
| chr2_+_34764408 | 1.73 |
ENSMUST00000113068.9
ENSMUST00000047447.13 |
Cutal
|
cutA divalent cation tolerance homolog-like |
| chr6_+_129157576 | 1.73 |
ENSMUST00000032260.6
|
Clec2d
|
C-type lectin domain family 2, member d |
| chr11_+_66915969 | 1.72 |
ENSMUST00000079077.12
ENSMUST00000061786.6 |
Tmem220
|
transmembrane protein 220 |
| chr2_+_30254239 | 1.72 |
ENSMUST00000077977.14
ENSMUST00000140075.9 ENSMUST00000142801.8 ENSMUST00000100214.10 |
Miga2
|
mitoguardin 2 |
| chr3_+_122688721 | 1.71 |
ENSMUST00000023820.6
|
Fabp2
|
fatty acid binding protein 2, intestinal |
| chr6_+_149043136 | 1.70 |
ENSMUST00000166416.8
ENSMUST00000111551.2 |
Etfbkmt
|
electron transfer flavoprotein beta subunit lysine methyltransferase |
| chr5_+_67417908 | 1.69 |
ENSMUST00000037918.12
ENSMUST00000162543.8 ENSMUST00000161233.8 ENSMUST00000160352.8 |
Tmem33
|
transmembrane protein 33 |
| chr15_+_3300249 | 1.69 |
ENSMUST00000082424.12
ENSMUST00000159158.9 ENSMUST00000159216.10 ENSMUST00000160311.3 |
Selenop
|
selenoprotein P |
| chr18_+_84106188 | 1.68 |
ENSMUST00000060223.4
|
Zadh2
|
zinc binding alcohol dehydrogenase, domain containing 2 |
| chr5_-_104169785 | 1.68 |
ENSMUST00000031251.16
|
Hsd17b11
|
hydroxysteroid (17-beta) dehydrogenase 11 |
| chr17_+_34524841 | 1.68 |
ENSMUST00000235530.2
|
H2-Eb1
|
histocompatibility 2, class II antigen E beta |
| chr18_-_12429048 | 1.67 |
ENSMUST00000234212.2
|
Ankrd29
|
ankyrin repeat domain 29 |
| chr5_-_151113619 | 1.67 |
ENSMUST00000062015.15
ENSMUST00000110483.9 |
Stard13
|
StAR-related lipid transfer (START) domain containing 13 |
| chr12_-_81015479 | 1.67 |
ENSMUST00000218162.2
|
Slc10a1
|
solute carrier family 10 (sodium/bile acid cotransporter family), member 1 |
| chrX_-_37723943 | 1.66 |
ENSMUST00000058265.8
|
C1galt1c1
|
C1GALT1-specific chaperone 1 |
| chr6_+_40448400 | 1.65 |
ENSMUST00000121360.8
ENSMUST00000117411.8 ENSMUST00000117830.2 |
Ssbp1
|
single-stranded DNA binding protein 1 |
| chr7_+_119160922 | 1.65 |
ENSMUST00000130583.2
ENSMUST00000084647.13 |
Acsm2
|
acyl-CoA synthetase medium-chain family member 2 |
| chr1_+_166081664 | 1.65 |
ENSMUST00000111416.7
|
Ildr2
|
immunoglobulin-like domain containing receptor 2 |
| chr15_+_99291455 | 1.63 |
ENSMUST00000162624.8
|
Tmbim6
|
transmembrane BAX inhibitor motif containing 6 |
| chr12_+_41074089 | 1.63 |
ENSMUST00000132121.8
|
Immp2l
|
IMP2 inner mitochondrial membrane peptidase-like (S. cerevisiae) |
| chr12_-_12991828 | 1.63 |
ENSMUST00000043396.15
|
Mycn
|
v-myc avian myelocytomatosis viral related oncogene, neuroblastoma derived |
| chr15_-_31453708 | 1.62 |
ENSMUST00000110408.3
|
Ropn1l
|
ropporin 1-like |
| chr18_+_50261268 | 1.62 |
ENSMUST00000025385.7
|
Hsd17b4
|
hydroxysteroid (17-beta) dehydrogenase 4 |
| chr15_+_41652777 | 1.61 |
ENSMUST00000230778.2
ENSMUST00000022918.15 ENSMUST00000090095.13 |
Oxr1
|
oxidation resistance 1 |
| chrX_-_55643429 | 1.61 |
ENSMUST00000059899.3
|
Mmgt1
|
membrane magnesium transporter 1 |
| chr16_-_44979013 | 1.61 |
ENSMUST00000023344.10
|
Slc35a5
|
solute carrier family 35, member A5 |
| chr17_+_37269513 | 1.61 |
ENSMUST00000173814.2
|
Polr1has
|
RNA polymerase I subunit H, antisense |
| chr1_+_172525613 | 1.60 |
ENSMUST00000038495.5
|
Crp
|
C-reactive protein, pentraxin-related |
| chr9_-_65815958 | 1.60 |
ENSMUST00000119245.8
ENSMUST00000134338.8 ENSMUST00000179395.8 |
Trip4
|
thyroid hormone receptor interactor 4 |
| chr11_+_60619224 | 1.58 |
ENSMUST00000018743.5
|
Mief2
|
mitochondrial elongation factor 2 |
| chr2_+_155907100 | 1.58 |
ENSMUST00000038860.12
|
Spag4
|
sperm associated antigen 4 |
| chr5_+_92702893 | 1.57 |
ENSMUST00000146417.9
|
Fam47e
|
family with sequence similarity 47, member E |
| chr13_-_42001075 | 1.56 |
ENSMUST00000179758.8
|
Adtrp
|
androgen dependent TFPI regulating protein |
| chrX_-_105055486 | 1.56 |
ENSMUST00000238718.2
ENSMUST00000033583.14 ENSMUST00000151689.9 |
Magt1
|
magnesium transporter 1 |
| chr18_+_56533389 | 1.56 |
ENSMUST00000237355.2
ENSMUST00000237422.2 |
Gramd3
|
GRAM domain containing 3 |
| chr6_+_54572096 | 1.56 |
ENSMUST00000119706.8
|
Plekha8
|
pleckstrin homology domain containing, family A (phosphoinositide binding specific) member 8 |
| chr1_+_167136217 | 1.54 |
ENSMUST00000193446.6
|
Tmco1
|
transmembrane and coiled-coil domains 1 |
| chr8_+_34582184 | 1.54 |
ENSMUST00000095345.5
|
Mboat4
|
membrane bound O-acyltransferase domain containing 4 |
| chr19_+_26725589 | 1.54 |
ENSMUST00000207812.2
ENSMUST00000175791.9 ENSMUST00000207118.2 ENSMUST00000209085.2 ENSMUST00000112637.10 ENSMUST00000207054.2 ENSMUST00000208589.2 ENSMUST00000176475.9 ENSMUST00000176698.9 ENSMUST00000207832.2 ENSMUST00000177252.9 ENSMUST00000208712.2 ENSMUST00000208186.2 ENSMUST00000208806.2 ENSMUST00000208027.2 |
Smarca2
|
SWI/SNF related, matrix associated, actin dependent regulator of chromatin, subfamily a, member 2 |
| chr4_+_80828883 | 1.54 |
ENSMUST00000055922.4
|
Lurap1l
|
leucine rich adaptor protein 1-like |
| chr4_+_133280680 | 1.53 |
ENSMUST00000042706.3
|
Nr0b2
|
nuclear receptor subfamily 0, group B, member 2 |
| chr1_+_160806194 | 1.53 |
ENSMUST00000064725.11
ENSMUST00000191936.2 |
Serpinc1
|
serine (or cysteine) peptidase inhibitor, clade C (antithrombin), member 1 |
| chr10_-_24712034 | 1.53 |
ENSMUST00000218044.2
ENSMUST00000020169.9 |
Enpp3
|
ectonucleotide pyrophosphatase/phosphodiesterase 3 |
| chr3_-_121056944 | 1.53 |
ENSMUST00000128909.8
ENSMUST00000029777.14 |
Tlcd4
|
TLC domain containing 4 |
| chr2_+_67935015 | 1.52 |
ENSMUST00000042456.4
|
B3galt1
|
UDP-Gal:betaGlcNAc beta 1,3-galactosyltransferase, polypeptide 1 |
| chr1_+_176642226 | 1.52 |
ENSMUST00000056773.15
ENSMUST00000027785.15 |
Sdccag8
|
serologically defined colon cancer antigen 8 |
| chr11_-_110142565 | 1.51 |
ENSMUST00000044003.14
|
Abca6
|
ATP-binding cassette, sub-family A (ABC1), member 6 |
| chr7_+_143376871 | 1.51 |
ENSMUST00000128454.8
ENSMUST00000073878.12 |
Dhcr7
|
7-dehydrocholesterol reductase |
| chr6_-_146988499 | 1.51 |
ENSMUST00000123367.2
ENSMUST00000100780.3 |
Mansc4
|
MANSC domain containing 4 |
| chr17_-_31852128 | 1.50 |
ENSMUST00000236909.2
|
Cbs
|
cystathionine beta-synthase |
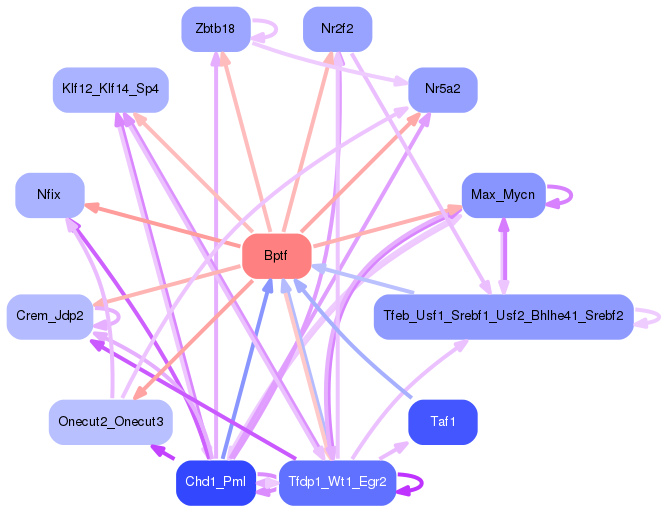
Network of associatons between targets according to the STRING database.

First level regulatory network of Bptf
Gene Ontology Analysis
Gene overrepresentation in biological process category:
| Log-likelihood per target | Total log-likelihood | Term | Description |
|---|---|---|---|
| 4.6 | 55.7 | GO:0071394 | cellular response to testosterone stimulus(GO:0071394) |
| 2.8 | 17.1 | GO:0008355 | olfactory learning(GO:0008355) |
| 2.4 | 7.1 | GO:0045404 | positive regulation of interleukin-4 biosynthetic process(GO:0045404) antigen processing and presentation of lipid antigen via MHC class Ib(GO:0048003) antigen processing and presentation, exogenous lipid antigen via MHC class Ib(GO:0048007) |
| 2.3 | 4.5 | GO:2000863 | positive regulation of estrogen secretion(GO:2000863) |
| 2.2 | 6.5 | GO:0090420 | naphthalene metabolic process(GO:0018931) naphthalene-containing compound metabolic process(GO:0090420) |
| 1.8 | 8.9 | GO:0001692 | histamine metabolic process(GO:0001692) |
| 1.5 | 4.6 | GO:1903920 | positive regulation of actin filament severing(GO:1903920) |
| 1.4 | 5.7 | GO:1901373 | positive regulation of intracellular lipid transport(GO:0032379) positive regulation of intracellular sterol transport(GO:0032382) positive regulation of intracellular cholesterol transport(GO:0032385) lipid hydroperoxide transport(GO:1901373) |
| 1.4 | 5.6 | GO:0046951 | ketone body biosynthetic process(GO:0046951) |
| 1.4 | 4.2 | GO:1904733 | negative regulation of electron carrier activity(GO:1904733) regulation of fatty acid beta-oxidation using acyl-CoA dehydrogenase(GO:1904735) negative regulation of fatty acid beta-oxidation using acyl-CoA dehydrogenase(GO:1904736) |
| 1.3 | 2.7 | GO:0006059 | hexitol metabolic process(GO:0006059) |
| 1.3 | 3.8 | GO:1903896 | positive regulation of IRE1-mediated unfolded protein response(GO:1903896) |
| 1.1 | 3.3 | GO:0006713 | glucocorticoid catabolic process(GO:0006713) |
| 1.1 | 4.4 | GO:1903197 | enzyme active site formation via L-cysteine sulfinic acid(GO:0018323) primary alcohol biosynthetic process(GO:0034309) cellular response to glyoxal(GO:0036471) glycolate biosynthetic process(GO:0046295) negative regulation of TRAIL-activated apoptotic signaling pathway(GO:1903122) regulation of pyrroline-5-carboxylate reductase activity(GO:1903167) positive regulation of pyrroline-5-carboxylate reductase activity(GO:1903168) regulation of tyrosine 3-monooxygenase activity(GO:1903176) positive regulation of tyrosine 3-monooxygenase activity(GO:1903178) L-dopa metabolic process(GO:1903184) L-dopa biosynthetic process(GO:1903185) glyoxal metabolic process(GO:1903189) regulation of L-dopa biosynthetic process(GO:1903195) positive regulation of L-dopa biosynthetic process(GO:1903197) regulation of L-dopa decarboxylase activity(GO:1903198) positive regulation of L-dopa decarboxylase activity(GO:1903200) positive regulation of cellular amino acid biosynthetic process(GO:2000284) |
| 1.0 | 6.7 | GO:1904075 | regulation of trophectodermal cell proliferation(GO:1904073) positive regulation of trophectodermal cell proliferation(GO:1904075) |
| 1.0 | 3.8 | GO:0019343 | cysteine biosynthetic process via cystathionine(GO:0019343) |
| 0.8 | 1.7 | GO:0006710 | androgen catabolic process(GO:0006710) |
| 0.7 | 2.7 | GO:0001969 | activation of membrane attack complex(GO:0001905) regulation of activation of membrane attack complex(GO:0001969) |
| 0.7 | 3.4 | GO:0031437 | regulation of mRNA cleavage(GO:0031437) negative regulation of mRNA cleavage(GO:0031438) regulation of mRNA endonucleolytic cleavage involved in unfolded protein response(GO:1904720) negative regulation of mRNA endonucleolytic cleavage involved in unfolded protein response(GO:1904721) |
| 0.7 | 2.0 | GO:0019264 | glycine biosynthetic process from serine(GO:0019264) |
| 0.7 | 5.9 | GO:0042769 | DNA damage response, detection of DNA damage(GO:0042769) |
| 0.6 | 3.1 | GO:0035359 | negative regulation of peroxisome proliferator activated receptor signaling pathway(GO:0035359) |
| 0.6 | 1.9 | GO:0006711 | estrogen catabolic process(GO:0006711) |
| 0.6 | 2.4 | GO:0034036 | purine ribonucleoside bisphosphate biosynthetic process(GO:0034036) 3'-phosphoadenosine 5'-phosphosulfate biosynthetic process(GO:0050428) |
| 0.6 | 1.8 | GO:0042732 | D-xylose metabolic process(GO:0042732) |
| 0.6 | 12.6 | GO:0048387 | negative regulation of retinoic acid receptor signaling pathway(GO:0048387) |
| 0.6 | 18.7 | GO:0080184 | response to phenylpropanoid(GO:0080184) |
| 0.6 | 1.7 | GO:0045204 | MAPK export from nucleus(GO:0045204) |
| 0.6 | 1.7 | GO:1903899 | positive regulation of PERK-mediated unfolded protein response(GO:1903899) |
| 0.5 | 2.2 | GO:0090004 | positive regulation of Golgi to plasma membrane protein transport(GO:0042998) positive regulation of establishment of protein localization to plasma membrane(GO:0090004) regulation of phosphatidylcholine biosynthetic process(GO:2001245) |
| 0.5 | 1.6 | GO:0061300 | cerebellum vasculature development(GO:0061300) |
| 0.5 | 3.3 | GO:0036112 | medium-chain fatty-acyl-CoA metabolic process(GO:0036112) |
| 0.5 | 1.6 | GO:0035627 | ceramide transport(GO:0035627) |
| 0.5 | 8.9 | GO:0045721 | negative regulation of gluconeogenesis(GO:0045721) |
| 0.5 | 5.7 | GO:1902741 | type I interferon secretion(GO:0072641) interferon-alpha secretion(GO:0072642) regulation of interferon-alpha secretion(GO:1902739) positive regulation of interferon-alpha secretion(GO:1902741) |
| 0.5 | 1.6 | GO:0016561 | protein import into peroxisome matrix, translocation(GO:0016561) |
| 0.5 | 1.5 | GO:1904582 | positive regulation of intracellular mRNA localization(GO:1904582) |
| 0.5 | 1.5 | GO:0016131 | brassinosteroid metabolic process(GO:0016131) brassinosteroid biosynthetic process(GO:0016132) |
| 0.5 | 2.4 | GO:0006121 | mitochondrial electron transport, succinate to ubiquinone(GO:0006121) |
| 0.5 | 1.4 | GO:0046338 | phosphatidylethanolamine catabolic process(GO:0046338) |
| 0.5 | 3.3 | GO:0045919 | positive regulation of cytolysis(GO:0045919) |
| 0.5 | 8.0 | GO:0006957 | complement activation, alternative pathway(GO:0006957) |
| 0.5 | 2.3 | GO:0010636 | positive regulation of mitochondrial fusion(GO:0010636) |
| 0.5 | 1.9 | GO:0036151 | phosphatidylcholine acyl-chain remodeling(GO:0036151) |
| 0.5 | 1.4 | GO:1902524 | positive regulation of protein K48-linked ubiquitination(GO:1902524) |
| 0.5 | 5.1 | GO:0006569 | tryptophan catabolic process(GO:0006569) tryptophan catabolic process to kynurenine(GO:0019441) indole-containing compound catabolic process(GO:0042436) indolalkylamine catabolic process(GO:0046218) |
| 0.5 | 0.5 | GO:0050787 | detoxification of mercury ion(GO:0050787) |
| 0.5 | 3.6 | GO:0051095 | regulation of helicase activity(GO:0051095) positive regulation of helicase activity(GO:0051096) |
| 0.5 | 1.4 | GO:0042450 | arginine biosynthetic process via ornithine(GO:0042450) |
| 0.4 | 4.4 | GO:0052697 | flavonoid glucuronidation(GO:0052696) xenobiotic glucuronidation(GO:0052697) |
| 0.4 | 5.3 | GO:0090503 | RNA phosphodiester bond hydrolysis, exonucleolytic(GO:0090503) |
| 0.4 | 1.3 | GO:0006714 | sesquiterpenoid metabolic process(GO:0006714) phytol metabolic process(GO:0033306) fatty alcohol metabolic process(GO:1903173) |
| 0.4 | 2.5 | GO:0014016 | neuroblast differentiation(GO:0014016) |
| 0.4 | 1.2 | GO:0070212 | protein poly-ADP-ribosylation(GO:0070212) |
| 0.4 | 1.2 | GO:1900106 | hyaluranon cable assembly(GO:0036118) regulation of hyaluranon cable assembly(GO:1900104) positive regulation of hyaluranon cable assembly(GO:1900106) |
| 0.4 | 3.2 | GO:0007597 | blood coagulation, intrinsic pathway(GO:0007597) |
| 0.4 | 1.6 | GO:0038016 | insulin receptor internalization(GO:0038016) |
| 0.4 | 3.1 | GO:0032929 | negative regulation of superoxide anion generation(GO:0032929) |
| 0.4 | 1.2 | GO:1900039 | positive regulation of cellular response to hypoxia(GO:1900039) |
| 0.4 | 1.1 | GO:2000813 | actin filament uncapping(GO:0051695) negative regulation of barbed-end actin filament capping(GO:2000813) |
| 0.4 | 1.1 | GO:0036500 | ATF6-mediated unfolded protein response(GO:0036500) |
| 0.3 | 0.7 | GO:0060585 | regulation of prostaglandin-endoperoxide synthase activity(GO:0060584) positive regulation of prostaglandin-endoperoxide synthase activity(GO:0060585) |
| 0.3 | 1.3 | GO:0051182 | coenzyme transport(GO:0051182) |
| 0.3 | 1.0 | GO:0070460 | thyroid-stimulating hormone secretion(GO:0070460) |
| 0.3 | 1.3 | GO:0046381 | CMP-N-acetylneuraminate metabolic process(GO:0046381) |
| 0.3 | 1.7 | GO:0097498 | endothelial tube lumen extension(GO:0097498) |
| 0.3 | 1.0 | GO:0021558 | trochlear nerve development(GO:0021558) |
| 0.3 | 1.3 | GO:0060849 | regulation of transcription involved in lymphatic endothelial cell fate commitment(GO:0060849) |
| 0.3 | 2.3 | GO:1901029 | negative regulation of mitochondrial outer membrane permeabilization involved in apoptotic signaling pathway(GO:1901029) |
| 0.3 | 8.1 | GO:0051639 | actin filament network formation(GO:0051639) |
| 0.3 | 1.6 | GO:0046684 | response to pyrethroid(GO:0046684) |
| 0.3 | 0.9 | GO:1904154 | positive regulation of retrograde protein transport, ER to cytosol(GO:1904154) |
| 0.3 | 0.9 | GO:0046098 | guanine metabolic process(GO:0046098) |
| 0.3 | 2.1 | GO:0016255 | attachment of GPI anchor to protein(GO:0016255) |
| 0.3 | 0.9 | GO:0003167 | atrioventricular bundle cell differentiation(GO:0003167) |
| 0.3 | 1.8 | GO:0048294 | negative regulation of isotype switching to IgE isotypes(GO:0048294) |
| 0.3 | 2.9 | GO:0051596 | methylglyoxal catabolic process to D-lactate via S-lactoyl-glutathione(GO:0019243) methylglyoxal catabolic process(GO:0051596) methylglyoxal catabolic process to lactate(GO:0061727) |
| 0.3 | 1.2 | GO:0010510 | regulation of acetyl-CoA biosynthetic process from pyruvate(GO:0010510) |
| 0.3 | 1.5 | GO:0045085 | negative regulation of interleukin-2 biosynthetic process(GO:0045085) |
| 0.3 | 6.9 | GO:0019184 | nonribosomal peptide biosynthetic process(GO:0019184) |
| 0.3 | 0.8 | GO:0033577 | protein glycosylation in endoplasmic reticulum(GO:0033577) |
| 0.3 | 1.1 | GO:0000239 | pachytene(GO:0000239) |
| 0.3 | 1.1 | GO:2000872 | positive regulation of progesterone secretion(GO:2000872) |
| 0.3 | 5.7 | GO:0006699 | bile acid biosynthetic process(GO:0006699) |
| 0.3 | 2.1 | GO:0097428 | protein maturation by iron-sulfur cluster transfer(GO:0097428) |
| 0.3 | 0.8 | GO:0000270 | peptidoglycan metabolic process(GO:0000270) peptidoglycan catabolic process(GO:0009253) negative regulation of natural killer cell differentiation(GO:0032824) negative regulation of natural killer cell differentiation involved in immune response(GO:0032827) |
| 0.3 | 0.8 | GO:0051439 | negative regulation of ubiquitin-protein ligase activity involved in mitotic cell cycle(GO:0051436) regulation of ubiquitin-protein ligase activity involved in mitotic cell cycle(GO:0051439) |
| 0.3 | 1.5 | GO:1990166 | protein localization to site of double-strand break(GO:1990166) |
| 0.3 | 3.1 | GO:0051045 | negative regulation of membrane protein ectodomain proteolysis(GO:0051045) |
| 0.3 | 1.3 | GO:0098971 | anterograde dendritic transport of neurotransmitter receptor complex(GO:0098971) |
| 0.3 | 1.3 | GO:0014012 | peripheral nervous system axon regeneration(GO:0014012) |
| 0.3 | 2.5 | GO:0061113 | pancreas morphogenesis(GO:0061113) |
| 0.3 | 1.0 | GO:0002760 | positive regulation of antimicrobial humoral response(GO:0002760) |
| 0.3 | 1.0 | GO:0006772 | thiamine metabolic process(GO:0006772) thiamine-containing compound metabolic process(GO:0042723) |
| 0.3 | 0.8 | GO:0021759 | globus pallidus development(GO:0021759) |
| 0.2 | 1.0 | GO:0052805 | imidazole-containing compound catabolic process(GO:0052805) |
| 0.2 | 2.0 | GO:0042270 | protection from natural killer cell mediated cytotoxicity(GO:0042270) |
| 0.2 | 2.2 | GO:0019375 | galactosylceramide biosynthetic process(GO:0006682) galactolipid biosynthetic process(GO:0019375) |
| 0.2 | 3.9 | GO:0043562 | cellular response to nitrogen starvation(GO:0006995) cellular response to nitrogen levels(GO:0043562) |
| 0.2 | 1.9 | GO:1901503 | ether lipid biosynthetic process(GO:0008611) glycerol ether biosynthetic process(GO:0046504) ether biosynthetic process(GO:1901503) |
| 0.2 | 1.7 | GO:0016266 | O-glycan processing(GO:0016266) |
| 0.2 | 0.2 | GO:2000388 | positive regulation of ovarian follicle development(GO:2000386) regulation of antral ovarian follicle growth(GO:2000387) positive regulation of antral ovarian follicle growth(GO:2000388) |
| 0.2 | 1.7 | GO:0030950 | establishment or maintenance of actin cytoskeleton polarity(GO:0030950) |
| 0.2 | 4.5 | GO:0015693 | magnesium ion transport(GO:0015693) |
| 0.2 | 6.3 | GO:0019373 | epoxygenase P450 pathway(GO:0019373) |
| 0.2 | 0.9 | GO:0033615 | mitochondrial proton-transporting ATP synthase complex assembly(GO:0033615) |
| 0.2 | 2.1 | GO:0033184 | positive regulation of histone ubiquitination(GO:0033184) |
| 0.2 | 1.4 | GO:0046121 | deoxyribonucleoside catabolic process(GO:0046121) |
| 0.2 | 0.7 | GO:0021502 | neural fold elevation formation(GO:0021502) intestinal epithelial cell maturation(GO:0060574) |
| 0.2 | 1.8 | GO:0051036 | regulation of endosome size(GO:0051036) |
| 0.2 | 0.9 | GO:1904428 | negative regulation of tubulin deacetylation(GO:1904428) |
| 0.2 | 5.2 | GO:0044804 | nucleophagy(GO:0044804) |
| 0.2 | 0.7 | GO:0090170 | regulation of Golgi inheritance(GO:0090170) |
| 0.2 | 0.6 | GO:1990180 | mitochondrial tRNA 3'-end processing(GO:1990180) |
| 0.2 | 0.6 | GO:0090327 | negative regulation of locomotion involved in locomotory behavior(GO:0090327) |
| 0.2 | 0.6 | GO:0042560 | 10-formyltetrahydrofolate catabolic process(GO:0009258) folic acid-containing compound catabolic process(GO:0009397) pteridine-containing compound catabolic process(GO:0042560) |
| 0.2 | 1.1 | GO:1902498 | regulation of protein autoubiquitination(GO:1902498) |
| 0.2 | 1.1 | GO:0046341 | CDP-diacylglycerol metabolic process(GO:0046341) |
| 0.2 | 1.1 | GO:0014028 | notochord formation(GO:0014028) |
| 0.2 | 1.7 | GO:0001887 | selenium compound metabolic process(GO:0001887) |
| 0.2 | 0.6 | GO:0038060 | nitric oxide-cGMP-mediated signaling pathway(GO:0038060) |
| 0.2 | 1.9 | GO:0030242 | pexophagy(GO:0030242) |
| 0.2 | 1.0 | GO:0019853 | L-ascorbic acid biosynthetic process(GO:0019853) |
| 0.2 | 1.3 | GO:0031120 | snRNA pseudouridine synthesis(GO:0031120) |
| 0.2 | 0.6 | GO:0051866 | general adaptation syndrome(GO:0051866) |
| 0.2 | 2.5 | GO:0034625 | fatty acid elongation, saturated fatty acid(GO:0019367) fatty acid elongation, unsaturated fatty acid(GO:0019368) fatty acid elongation, monounsaturated fatty acid(GO:0034625) fatty acid elongation, polyunsaturated fatty acid(GO:0034626) |
| 0.2 | 1.4 | GO:0035887 | aortic smooth muscle cell differentiation(GO:0035887) |
| 0.2 | 0.6 | GO:0034124 | regulation of MyD88-dependent toll-like receptor signaling pathway(GO:0034124) |
| 0.2 | 0.8 | GO:0070317 | negative regulation of G0 to G1 transition(GO:0070317) |
| 0.2 | 0.8 | GO:0006532 | aspartate biosynthetic process(GO:0006532) |
| 0.2 | 1.6 | GO:0090074 | negative regulation of protein homodimerization activity(GO:0090074) |
| 0.2 | 0.8 | GO:0090155 | negative regulation of sphingolipid biosynthetic process(GO:0090155) cellular sphingolipid homeostasis(GO:0090156) negative regulation of ceramide biosynthetic process(GO:1900060) |
| 0.2 | 1.5 | GO:0072321 | chaperone-mediated protein transport(GO:0072321) |
| 0.2 | 0.7 | GO:0070125 | mitochondrial translational elongation(GO:0070125) |
| 0.2 | 0.4 | GO:1901536 | negative regulation of DNA demethylation(GO:1901536) |
| 0.2 | 1.3 | GO:0009449 | gamma-aminobutyric acid biosynthetic process(GO:0009449) |
| 0.2 | 0.6 | GO:1902161 | transepithelial water transport(GO:0035377) positive regulation of cyclic nucleotide-gated ion channel activity(GO:1902161) positive regulation of establishment of Sertoli cell barrier(GO:1904446) negative regulation of type B pancreatic cell development(GO:2000077) |
| 0.2 | 1.3 | GO:0045716 | positive regulation of low-density lipoprotein particle receptor biosynthetic process(GO:0045716) |
| 0.2 | 0.6 | GO:0010705 | meiotic DNA double-strand break processing involved in reciprocal meiotic recombination(GO:0010705) |
| 0.2 | 0.6 | GO:0097535 | lymphoid lineage cell migration(GO:0097534) lymphoid lineage cell migration into thymus(GO:0097535) |
| 0.2 | 1.8 | GO:0030206 | chondroitin sulfate biosynthetic process(GO:0030206) |
| 0.2 | 2.7 | GO:0034030 | coenzyme A biosynthetic process(GO:0015937) nucleoside bisphosphate biosynthetic process(GO:0033866) ribonucleoside bisphosphate biosynthetic process(GO:0034030) purine nucleoside bisphosphate biosynthetic process(GO:0034033) |
| 0.2 | 2.3 | GO:0016554 | cytidine to uridine editing(GO:0016554) |
| 0.2 | 0.9 | GO:0019516 | lactate oxidation(GO:0019516) |
| 0.2 | 4.8 | GO:0006491 | N-glycan processing(GO:0006491) |
| 0.2 | 0.7 | GO:2000983 | regulation of ATP citrate synthase activity(GO:2000983) negative regulation of ATP citrate synthase activity(GO:2000984) |
| 0.2 | 1.2 | GO:1901843 | positive regulation of high voltage-gated calcium channel activity(GO:1901843) |
| 0.2 | 1.1 | GO:0060023 | soft palate development(GO:0060023) |
| 0.2 | 0.6 | GO:0021905 | pancreatic A cell development(GO:0003322) forebrain-midbrain boundary formation(GO:0021905) somatic motor neuron fate commitment(GO:0021917) regulation of transcription from RNA polymerase II promoter involved in somatic motor neuron fate commitment(GO:0021918) sensory neuron migration(GO:1904937) |
| 0.2 | 1.0 | GO:0034975 | protein folding in endoplasmic reticulum(GO:0034975) |
| 0.2 | 0.5 | GO:0010520 | regulation of reciprocal meiotic recombination(GO:0010520) positive regulation of reciprocal meiotic recombination(GO:0010845) |
| 0.2 | 5.5 | GO:1905145 | acetylcholine receptor signaling pathway(GO:0095500) signal transduction involved in cellular response to ammonium ion(GO:1903831) response to acetylcholine(GO:1905144) cellular response to acetylcholine(GO:1905145) |
| 0.2 | 1.9 | GO:0051549 | positive regulation of keratinocyte migration(GO:0051549) |
| 0.2 | 0.9 | GO:0006556 | S-adenosylmethionine biosynthetic process(GO:0006556) |
| 0.2 | 0.5 | GO:0002572 | pro-T cell differentiation(GO:0002572) |
| 0.2 | 0.5 | GO:0060535 | trachea cartilage morphogenesis(GO:0060535) |
| 0.2 | 1.2 | GO:0030718 | germ-line stem cell population maintenance(GO:0030718) |
| 0.1 | 0.7 | GO:0018076 | N-terminal peptidyl-lysine acetylation(GO:0018076) |
| 0.1 | 0.4 | GO:0071033 | nuclear retention of pre-mRNA at the site of transcription(GO:0071033) |
| 0.1 | 0.3 | GO:0000706 | meiotic DNA double-strand break processing(GO:0000706) |
| 0.1 | 1.8 | GO:0006122 | mitochondrial electron transport, ubiquinol to cytochrome c(GO:0006122) |
| 0.1 | 2.8 | GO:0021707 | cerebellar granular layer formation(GO:0021684) cerebellar granule cell differentiation(GO:0021707) |
| 0.1 | 1.3 | GO:0034141 | positive regulation of toll-like receptor 3 signaling pathway(GO:0034141) |
| 0.1 | 2.0 | GO:0000185 | activation of MAPKKK activity(GO:0000185) |
| 0.1 | 1.7 | GO:2000980 | regulation of auditory receptor cell differentiation(GO:0045607) regulation of mechanoreceptor differentiation(GO:0045631) regulation of inner ear receptor cell differentiation(GO:2000980) |
| 0.1 | 0.6 | GO:0006083 | acetate metabolic process(GO:0006083) |
| 0.1 | 0.4 | GO:0032618 | interleukin-15 production(GO:0032618) response to immune response of other organism involved in symbiotic interaction(GO:0052564) response to host immune response(GO:0052572) |
| 0.1 | 1.1 | GO:0010792 | DNA double-strand break processing involved in repair via single-strand annealing(GO:0010792) |
| 0.1 | 1.0 | GO:0070072 | vacuolar proton-transporting V-type ATPase complex assembly(GO:0070072) |
| 0.1 | 2.3 | GO:0042407 | cristae formation(GO:0042407) |
| 0.1 | 1.1 | GO:0045657 | positive regulation of monocyte differentiation(GO:0045657) |
| 0.1 | 1.0 | GO:0006499 | N-terminal protein myristoylation(GO:0006499) |
| 0.1 | 0.4 | GO:2000451 | immune complex clearance by monocytes and macrophages(GO:0002436) regulation of immune complex clearance by monocytes and macrophages(GO:0090264) positive regulation of immune complex clearance by monocytes and macrophages(GO:0090265) negative regulation of eosinophil activation(GO:1902567) positive regulation of CD8-positive, alpha-beta T cell extravasation(GO:2000451) |
| 0.1 | 1.2 | GO:0021943 | formation of radial glial scaffolds(GO:0021943) |
| 0.1 | 1.6 | GO:1902510 | regulation of apoptotic DNA fragmentation(GO:1902510) |
| 0.1 | 2.7 | GO:0019886 | antigen processing and presentation of exogenous peptide antigen via MHC class II(GO:0019886) |
| 0.1 | 0.7 | GO:0003349 | epicardium-derived cardiac endothelial cell differentiation(GO:0003349) |
| 0.1 | 1.2 | GO:0072513 | positive regulation of secondary heart field cardioblast proliferation(GO:0072513) |
| 0.1 | 0.4 | GO:1901080 | regulation of relaxation of smooth muscle(GO:1901080) positive regulation of relaxation of smooth muscle(GO:1901082) |
| 0.1 | 0.8 | GO:2000301 | negative regulation of synaptic vesicle exocytosis(GO:2000301) |
| 0.1 | 1.7 | GO:0006983 | ER overload response(GO:0006983) |
| 0.1 | 0.6 | GO:2000049 | positive regulation of cell-cell adhesion mediated by cadherin(GO:2000049) |
| 0.1 | 0.4 | GO:1903251 | multi-ciliated epithelial cell differentiation(GO:1903251) |
| 0.1 | 1.0 | GO:0051790 | short-chain fatty acid biosynthetic process(GO:0051790) |
| 0.1 | 0.4 | GO:0042275 | error-free postreplication DNA repair(GO:0042275) |
| 0.1 | 0.8 | GO:0045590 | negative regulation of regulatory T cell differentiation(GO:0045590) |
| 0.1 | 0.4 | GO:0060618 | nipple development(GO:0060618) |
| 0.1 | 0.6 | GO:0032074 | negative regulation of nuclease activity(GO:0032074) |
| 0.1 | 0.8 | GO:0031161 | phosphatidylinositol catabolic process(GO:0031161) |
| 0.1 | 1.3 | GO:0006104 | succinyl-CoA metabolic process(GO:0006104) |
| 0.1 | 0.9 | GO:0070127 | tRNA aminoacylation for mitochondrial protein translation(GO:0070127) |
| 0.1 | 0.9 | GO:1904219 | regulation of CDP-diacylglycerol-serine O-phosphatidyltransferase activity(GO:1904217) positive regulation of CDP-diacylglycerol-serine O-phosphatidyltransferase activity(GO:1904219) positive regulation of serine C-palmitoyltransferase activity(GO:1904222) |
| 0.1 | 2.3 | GO:0048935 | peripheral nervous system neuron differentiation(GO:0048934) peripheral nervous system neuron development(GO:0048935) |
| 0.1 | 0.4 | GO:0035973 | aggrephagy(GO:0035973) |
| 0.1 | 0.5 | GO:2000293 | regulation of defecation(GO:2000292) negative regulation of defecation(GO:2000293) |
| 0.1 | 0.7 | GO:0019532 | oxalate transport(GO:0019532) |
| 0.1 | 0.6 | GO:0018242 | protein O-linked glycosylation via serine(GO:0018242) |
| 0.1 | 0.4 | GO:0040031 | snRNA modification(GO:0040031) |
| 0.1 | 0.2 | GO:0061153 | trachea submucosa development(GO:0061152) trachea gland development(GO:0061153) |
| 0.1 | 0.8 | GO:0007527 | adult somatic muscle development(GO:0007527) |
| 0.1 | 0.4 | GO:1901491 | negative regulation of lymphangiogenesis(GO:1901491) |
| 0.1 | 1.4 | GO:1904636 | response to ionomycin(GO:1904636) cellular response to ionomycin(GO:1904637) |
| 0.1 | 0.6 | GO:0001550 | ovarian cumulus expansion(GO:0001550) fused antrum stage(GO:0048165) |
| 0.1 | 0.7 | GO:0038128 | ERBB2 signaling pathway(GO:0038128) |
| 0.1 | 0.5 | GO:0044830 | modulation by host of viral RNA genome replication(GO:0044830) |
| 0.1 | 0.3 | GO:0097065 | cervix development(GO:0060067) anterior head development(GO:0097065) regulation of anterior head development(GO:2000742) positive regulation of anterior head development(GO:2000744) |
| 0.1 | 2.0 | GO:0035810 | positive regulation of urine volume(GO:0035810) |
| 0.1 | 0.6 | GO:0097577 | intracellular sequestering of iron ion(GO:0006880) sequestering of iron ion(GO:0097577) |
| 0.1 | 0.7 | GO:1902237 | positive regulation of endoplasmic reticulum stress-induced intrinsic apoptotic signaling pathway(GO:1902237) |
| 0.1 | 0.8 | GO:0032466 | negative regulation of cytokinesis(GO:0032466) |
| 0.1 | 3.8 | GO:0015985 | energy coupled proton transport, down electrochemical gradient(GO:0015985) ATP synthesis coupled proton transport(GO:0015986) |
| 0.1 | 0.5 | GO:0071596 | ubiquitin-dependent protein catabolic process via the N-end rule pathway(GO:0071596) |
| 0.1 | 1.0 | GO:0045162 | clustering of voltage-gated sodium channels(GO:0045162) |
| 0.1 | 0.9 | GO:0051612 | negative regulation of neurotransmitter uptake(GO:0051581) negative regulation of serotonin uptake(GO:0051612) |
| 0.1 | 0.7 | GO:0071421 | manganese ion transmembrane transport(GO:0071421) |
| 0.1 | 1.1 | GO:0016338 | calcium-independent cell-cell adhesion via plasma membrane cell-adhesion molecules(GO:0016338) |
| 0.1 | 0.3 | GO:0051546 | keratinocyte migration(GO:0051546) |
| 0.1 | 0.3 | GO:0001762 | beta-alanine transport(GO:0001762) taurine transport(GO:0015734) |
| 0.1 | 0.3 | GO:0006685 | sphingomyelin catabolic process(GO:0006685) |
| 0.1 | 0.5 | GO:0002121 | inter-male aggressive behavior(GO:0002121) |
| 0.1 | 0.6 | GO:0038031 | non-canonical Wnt signaling pathway via JNK cascade(GO:0038031) |
| 0.1 | 0.3 | GO:1903347 | negative regulation of bicellular tight junction assembly(GO:1903347) |
| 0.1 | 1.9 | GO:0042574 | retinal metabolic process(GO:0042574) |
| 0.1 | 1.9 | GO:0060484 | lung-associated mesenchyme development(GO:0060484) |
| 0.1 | 2.0 | GO:0034587 | piRNA metabolic process(GO:0034587) |
| 0.1 | 0.7 | GO:1900122 | B cell proliferation involved in immune response(GO:0002322) positive regulation of receptor binding(GO:1900122) |
| 0.1 | 1.6 | GO:0090286 | cytoskeletal anchoring at nuclear membrane(GO:0090286) |
| 0.1 | 0.7 | GO:1900170 | negative regulation of glucocorticoid mediated signaling pathway(GO:1900170) |
| 0.1 | 0.3 | GO:0042262 | DNA protection(GO:0042262) |
| 0.1 | 0.6 | GO:0001920 | negative regulation of receptor recycling(GO:0001920) |
| 0.1 | 1.2 | GO:0015936 | coenzyme A metabolic process(GO:0015936) |
| 0.1 | 1.6 | GO:0071447 | cellular response to hydroperoxide(GO:0071447) |
| 0.1 | 0.4 | GO:0006421 | asparaginyl-tRNA aminoacylation(GO:0006421) |
| 0.1 | 2.2 | GO:0035563 | positive regulation of chromatin binding(GO:0035563) |
| 0.1 | 0.4 | GO:0090282 | positive regulation of transcription involved in G2/M transition of mitotic cell cycle(GO:0090282) |
| 0.1 | 1.1 | GO:1903351 | response to dopamine(GO:1903350) cellular response to dopamine(GO:1903351) |
| 0.1 | 0.6 | GO:0045905 | translational frameshifting(GO:0006452) positive regulation of translational termination(GO:0045905) |
| 0.1 | 0.8 | GO:0071494 | cellular response to UV-C(GO:0071494) |
| 0.1 | 3.6 | GO:0048240 | sperm capacitation(GO:0048240) |
| 0.1 | 0.5 | GO:1990564 | protein polyufmylation(GO:1990564) protein K69-linked ufmylation(GO:1990592) |
| 0.1 | 1.0 | GO:0000056 | ribosomal small subunit export from nucleus(GO:0000056) |
| 0.1 | 1.0 | GO:1901727 | positive regulation of histone deacetylase activity(GO:1901727) |
| 0.1 | 0.9 | GO:0033353 | S-adenosylmethionine cycle(GO:0033353) |
| 0.1 | 1.2 | GO:0061302 | smooth muscle cell-matrix adhesion(GO:0061302) |
| 0.1 | 0.8 | GO:0098870 | neuronal action potential propagation(GO:0019227) action potential propagation(GO:0098870) |
| 0.1 | 1.0 | GO:0008053 | mitochondrial fusion(GO:0008053) |
| 0.1 | 0.7 | GO:1902748 | positive regulation of lens fiber cell differentiation(GO:1902748) |
| 0.1 | 1.7 | GO:0033327 | Leydig cell differentiation(GO:0033327) |
| 0.1 | 0.3 | GO:0001543 | ovarian follicle rupture(GO:0001543) |
| 0.1 | 0.5 | GO:0046878 | positive regulation of saliva secretion(GO:0046878) |
| 0.1 | 0.4 | GO:1903070 | negative regulation of ER-associated ubiquitin-dependent protein catabolic process(GO:1903070) |
| 0.1 | 8.1 | GO:0030433 | ER-associated ubiquitin-dependent protein catabolic process(GO:0030433) |
| 0.1 | 0.1 | GO:0060559 | positive regulation of vitamin metabolic process(GO:0046136) positive regulation of vitamin D biosynthetic process(GO:0060557) positive regulation of calcidiol 1-monooxygenase activity(GO:0060559) |
| 0.1 | 0.4 | GO:0097298 | regulation of nucleus size(GO:0097298) |
| 0.1 | 0.3 | GO:0034769 | basement membrane disassembly(GO:0034769) |
| 0.1 | 0.2 | GO:0070973 | protein localization to endoplasmic reticulum exit site(GO:0070973) |
| 0.1 | 0.4 | GO:1904294 | positive regulation of ERAD pathway(GO:1904294) |
| 0.1 | 1.0 | GO:0060501 | positive regulation of epithelial cell proliferation involved in lung morphogenesis(GO:0060501) |
| 0.1 | 0.6 | GO:0006120 | mitochondrial electron transport, NADH to ubiquinone(GO:0006120) |
| 0.1 | 0.1 | GO:0061156 | pulmonary artery morphogenesis(GO:0061156) |
| 0.1 | 0.3 | GO:1902037 | negative regulation of hematopoietic stem cell differentiation(GO:1902037) |
| 0.1 | 1.3 | GO:0036315 | cellular response to sterol(GO:0036315) |
| 0.1 | 0.5 | GO:0042373 | vitamin K metabolic process(GO:0042373) |
| 0.1 | 0.5 | GO:0044539 | long-chain fatty acid import(GO:0044539) |
| 0.1 | 0.2 | GO:0000349 | generation of catalytic spliceosome for first transesterification step(GO:0000349) |
| 0.1 | 1.7 | GO:1902414 | protein localization to cell junction(GO:1902414) |
| 0.1 | 0.5 | GO:0071351 | cellular response to interleukin-18(GO:0071351) |
| 0.1 | 0.4 | GO:0060478 | acrosomal vesicle exocytosis(GO:0060478) |
| 0.1 | 1.0 | GO:2001288 | positive regulation of caveolin-mediated endocytosis(GO:2001288) |
| 0.1 | 0.5 | GO:0030970 | retrograde protein transport, ER to cytosol(GO:0030970) |
| 0.1 | 0.2 | GO:1901856 | negative regulation of cellular respiration(GO:1901856) |
| 0.1 | 0.5 | GO:0032510 | endosome to lysosome transport via multivesicular body sorting pathway(GO:0032510) |
| 0.1 | 0.6 | GO:0036337 | Fas signaling pathway(GO:0036337) |
| 0.1 | 0.8 | GO:0034349 | glial cell apoptotic process(GO:0034349) |
| 0.1 | 0.2 | GO:0006500 | N-terminal protein palmitoylation(GO:0006500) |
| 0.1 | 0.2 | GO:1904826 | regulation of hydrogen sulfide biosynthetic process(GO:1904826) positive regulation of hydrogen sulfide biosynthetic process(GO:1904828) |
| 0.1 | 1.3 | GO:0000188 | inactivation of MAPK activity(GO:0000188) |
| 0.1 | 1.8 | GO:0010884 | positive regulation of lipid storage(GO:0010884) |
| 0.1 | 0.2 | GO:0051030 | snRNA transport(GO:0051030) |
| 0.1 | 0.5 | GO:0015722 | canalicular bile acid transport(GO:0015722) |
| 0.1 | 0.7 | GO:0006729 | tetrahydrobiopterin biosynthetic process(GO:0006729) |
| 0.1 | 4.5 | GO:0006637 | acyl-CoA metabolic process(GO:0006637) thioester metabolic process(GO:0035383) |
| 0.1 | 3.5 | GO:0046513 | ceramide biosynthetic process(GO:0046513) |
| 0.1 | 1.0 | GO:0035435 | phosphate ion transmembrane transport(GO:0035435) |
| 0.1 | 1.5 | GO:0015884 | folic acid transport(GO:0015884) |
| 0.1 | 1.7 | GO:0015721 | bile acid and bile salt transport(GO:0015721) |
| 0.1 | 1.6 | GO:0050995 | negative regulation of lipid catabolic process(GO:0050995) |
| 0.1 | 0.2 | GO:0031554 | regulation of DNA-templated transcription, termination(GO:0031554) |
| 0.1 | 3.0 | GO:0055090 | acylglycerol homeostasis(GO:0055090) triglyceride homeostasis(GO:0070328) |
| 0.1 | 0.2 | GO:0021666 | rhombomere formation(GO:0021594) rhombomere 3 formation(GO:0021660) rhombomere 5 morphogenesis(GO:0021664) rhombomere 5 formation(GO:0021666) |
| 0.1 | 0.4 | GO:0070863 | positive regulation of protein exit from endoplasmic reticulum(GO:0070863) |
| 0.1 | 3.2 | GO:0010257 | NADH dehydrogenase complex assembly(GO:0010257) mitochondrial respiratory chain complex I assembly(GO:0032981) mitochondrial respiratory chain complex I biogenesis(GO:0097031) |
| 0.1 | 0.2 | GO:0009730 | detection of carbohydrate stimulus(GO:0009730) detection of hexose stimulus(GO:0009732) detection of monosaccharide stimulus(GO:0034287) detection of glucose(GO:0051594) |
| 0.1 | 5.5 | GO:0045454 | cell redox homeostasis(GO:0045454) |
| 0.1 | 0.2 | GO:0060903 | positive regulation of meiosis I(GO:0060903) |
| 0.1 | 0.1 | GO:0060741 | prostate gland stromal morphogenesis(GO:0060741) |
| 0.1 | 0.5 | GO:0032026 | response to magnesium ion(GO:0032026) |
| 0.1 | 1.3 | GO:0042640 | anagen(GO:0042640) |
| 0.1 | 0.4 | GO:1901842 | negative regulation of high voltage-gated calcium channel activity(GO:1901842) |
| 0.1 | 0.9 | GO:0015747 | urate transport(GO:0015747) |
| 0.1 | 0.3 | GO:1900169 | regulation of glucocorticoid mediated signaling pathway(GO:1900169) |
| 0.1 | 0.6 | GO:0060136 | embryonic process involved in female pregnancy(GO:0060136) |
| 0.1 | 0.2 | GO:1903378 | positive regulation of oxidative stress-induced neuron intrinsic apoptotic signaling pathway(GO:1903378) |
| 0.1 | 0.4 | GO:0017062 | respiratory chain complex III assembly(GO:0017062) mitochondrial respiratory chain complex III assembly(GO:0034551) |
| 0.1 | 0.7 | GO:0061339 | establishment of monopolar cell polarity(GO:0061162) establishment or maintenance of monopolar cell polarity(GO:0061339) |
| 0.1 | 0.3 | GO:0035106 | operant conditioning(GO:0035106) |
| 0.1 | 0.9 | GO:0021860 | pyramidal neuron development(GO:0021860) |
| 0.1 | 0.4 | GO:0032488 | Cdc42 protein signal transduction(GO:0032488) |
| 0.1 | 0.6 | GO:0001514 | selenocysteine incorporation(GO:0001514) translational readthrough(GO:0006451) |
| 0.1 | 0.7 | GO:0015838 | amino-acid betaine transport(GO:0015838) |
| 0.1 | 0.4 | GO:0006287 | base-excision repair, gap-filling(GO:0006287) |
| 0.1 | 1.2 | GO:0001580 | detection of chemical stimulus involved in sensory perception of bitter taste(GO:0001580) |
| 0.1 | 0.5 | GO:0060467 | negative regulation of fertilization(GO:0060467) |
| 0.1 | 0.7 | GO:0007008 | outer mitochondrial membrane organization(GO:0007008) |
| 0.1 | 1.2 | GO:0034204 | lipid translocation(GO:0034204) |
| 0.1 | 0.6 | GO:0010155 | regulation of proton transport(GO:0010155) |
| 0.1 | 0.3 | GO:1903966 | monounsaturated fatty acid metabolic process(GO:1903964) monounsaturated fatty acid biosynthetic process(GO:1903966) |
| 0.1 | 0.3 | GO:1903422 | negative regulation of synaptic vesicle recycling(GO:1903422) regulation of spontaneous neurotransmitter secretion(GO:1904048) |
| 0.1 | 0.7 | GO:0061038 | uterus morphogenesis(GO:0061038) |
| 0.1 | 0.7 | GO:1902916 | positive regulation of protein polyubiquitination(GO:1902916) |
| 0.1 | 0.3 | GO:0006735 | NADH regeneration(GO:0006735) canonical glycolysis(GO:0061621) glucose catabolic process to pyruvate(GO:0061718) |
| 0.1 | 0.4 | GO:0070447 | positive regulation of oligodendrocyte progenitor proliferation(GO:0070447) |
| 0.1 | 0.3 | GO:0021747 | cochlear nucleus development(GO:0021747) |
| 0.1 | 0.3 | GO:0001705 | ectoderm formation(GO:0001705) ectodermal cell fate commitment(GO:0001712) |
| 0.1 | 0.2 | GO:0097476 | spinal cord motor neuron migration(GO:0097476) |
| 0.1 | 0.7 | GO:0019433 | triglyceride catabolic process(GO:0019433) |
| 0.1 | 1.5 | GO:0010960 | magnesium ion homeostasis(GO:0010960) |
| 0.0 | 0.2 | GO:1904393 | regulation of skeletal muscle acetylcholine-gated channel clustering(GO:1904393) |
| 0.0 | 0.2 | GO:0072318 | clathrin coat disassembly(GO:0072318) |
| 0.0 | 0.6 | GO:0051418 | interphase microtubule nucleation by interphase microtubule organizing center(GO:0051415) microtubule nucleation by microtubule organizing center(GO:0051418) |
| 0.0 | 1.3 | GO:0050911 | detection of chemical stimulus involved in sensory perception of smell(GO:0050911) |
| 0.0 | 0.1 | GO:0006216 | cytidine catabolic process(GO:0006216) cytidine deamination(GO:0009972) cytidine metabolic process(GO:0046087) |
| 0.0 | 0.2 | GO:0080163 | regulation of protein serine/threonine phosphatase activity(GO:0080163) |
| 0.0 | 0.3 | GO:0001542 | ovulation from ovarian follicle(GO:0001542) |
| 0.0 | 0.3 | GO:0001777 | T cell homeostatic proliferation(GO:0001777) regulation of T cell homeostatic proliferation(GO:0046013) |
| 0.0 | 2.1 | GO:0003298 | physiological muscle hypertrophy(GO:0003298) physiological cardiac muscle hypertrophy(GO:0003301) cell growth involved in cardiac muscle cell development(GO:0061049) |
| 0.0 | 0.2 | GO:1901837 | negative regulation of transcription of nuclear large rRNA transcript from RNA polymerase I promoter(GO:1901837) |
| 0.0 | 1.7 | GO:0070884 | regulation of calcineurin-NFAT signaling cascade(GO:0070884) |
| 0.0 | 0.7 | GO:0032525 | somite rostral/caudal axis specification(GO:0032525) |
| 0.0 | 0.1 | GO:0021627 | olfactory nerve morphogenesis(GO:0021627) olfactory nerve structural organization(GO:0021629) |
| 0.0 | 0.2 | GO:0000480 | endonucleolytic cleavage in 5'-ETS of tricistronic rRNA transcript (SSU-rRNA, 5.8S rRNA, LSU-rRNA)(GO:0000480) |
| 0.0 | 12.8 | GO:0010466 | negative regulation of peptidase activity(GO:0010466) |
| 0.0 | 0.8 | GO:0006515 | misfolded or incompletely synthesized protein catabolic process(GO:0006515) |
| 0.0 | 0.1 | GO:0021750 | cerebellar molecular layer development(GO:0021679) vestibular nucleus development(GO:0021750) |
| 0.0 | 2.6 | GO:0007029 | endoplasmic reticulum organization(GO:0007029) |
| 0.0 | 0.7 | GO:0001783 | B cell apoptotic process(GO:0001783) |
| 0.0 | 0.8 | GO:0043457 | regulation of cellular respiration(GO:0043457) |
| 0.0 | 0.2 | GO:1902268 | negative regulation of polyamine transmembrane transport(GO:1902268) |
| 0.0 | 3.1 | GO:0009062 | fatty acid catabolic process(GO:0009062) |
| 0.0 | 0.4 | GO:0045542 | positive regulation of cholesterol biosynthetic process(GO:0045542) positive regulation of cholesterol metabolic process(GO:0090205) |
| 0.0 | 0.6 | GO:0090141 | positive regulation of mitochondrial fission(GO:0090141) |
| 0.0 | 0.2 | GO:0023016 | signal transduction by trans-phosphorylation(GO:0023016) |
| 0.0 | 0.1 | GO:1902606 | regulation of large conductance calcium-activated potassium channel activity(GO:1902606) positive regulation of large conductance calcium-activated potassium channel activity(GO:1902608) |
| 0.0 | 0.3 | GO:0060339 | negative regulation of type I interferon-mediated signaling pathway(GO:0060339) |
| 0.0 | 0.2 | GO:0044330 | canonical Wnt signaling pathway involved in positive regulation of wound healing(GO:0044330) |
| 0.0 | 0.2 | GO:0099525 | presynaptic dense core granule exocytosis(GO:0099525) |
| 0.0 | 0.5 | GO:1900383 | regulation of synaptic plasticity by receptor localization to synapse(GO:1900383) |
| 0.0 | 1.6 | GO:0007339 | binding of sperm to zona pellucida(GO:0007339) |
| 0.0 | 1.2 | GO:0050892 | intestinal absorption(GO:0050892) |
| 0.0 | 0.8 | GO:0090196 | chemokine secretion(GO:0090195) regulation of chemokine secretion(GO:0090196) positive regulation of chemokine secretion(GO:0090197) |
| 0.0 | 1.5 | GO:0032008 | positive regulation of TOR signaling(GO:0032008) |
| 0.0 | 0.4 | GO:0046784 | viral mRNA export from host cell nucleus(GO:0046784) |
| 0.0 | 0.2 | GO:1905150 | regulation of voltage-gated sodium channel activity(GO:1905150) |
| 0.0 | 0.3 | GO:0046010 | regulation of circadian sleep/wake cycle, non-REM sleep(GO:0045188) positive regulation of circadian sleep/wake cycle, non-REM sleep(GO:0046010) |
| 0.0 | 0.4 | GO:0032876 | negative regulation of DNA endoreduplication(GO:0032876) |
| 0.0 | 0.4 | GO:0019885 | antigen processing and presentation of endogenous peptide antigen via MHC class I(GO:0019885) |
| 0.0 | 0.2 | GO:0031284 | positive regulation of guanylate cyclase activity(GO:0031284) |
| 0.0 | 0.4 | GO:0007158 | neuron cell-cell adhesion(GO:0007158) |
| 0.0 | 0.2 | GO:2000344 | positive regulation of acrosome reaction(GO:2000344) |
| 0.0 | 0.8 | GO:0003148 | outflow tract septum morphogenesis(GO:0003148) |
| 0.0 | 1.0 | GO:0046827 | positive regulation of protein export from nucleus(GO:0046827) |
| 0.0 | 0.1 | GO:0030450 | regulation of complement activation, classical pathway(GO:0030450) |
| 0.0 | 0.2 | GO:0006517 | protein deglycosylation(GO:0006517) |
| 0.0 | 0.3 | GO:0060017 | parathyroid gland development(GO:0060017) |
| 0.0 | 0.6 | GO:0044872 | lipoprotein transport(GO:0042953) lipoprotein localization(GO:0044872) |
| 0.0 | 1.0 | GO:0007064 | mitotic sister chromatid cohesion(GO:0007064) |
| 0.0 | 0.3 | GO:0086073 | bundle of His cell-Purkinje myocyte adhesion involved in cell communication(GO:0086073) |
| 0.0 | 0.1 | GO:0045585 | regulation of cytotoxic T cell differentiation(GO:0045583) positive regulation of cytotoxic T cell differentiation(GO:0045585) |
| 0.0 | 0.1 | GO:0048388 | endosomal lumen acidification(GO:0048388) |
| 0.0 | 0.3 | GO:0097151 | positive regulation of inhibitory postsynaptic potential(GO:0097151) modulation of inhibitory postsynaptic potential(GO:0098828) |
| 0.0 | 0.8 | GO:0099514 | anterograde synaptic vesicle transport(GO:0048490) synaptic vesicle cytoskeletal transport(GO:0099514) synaptic vesicle transport along microtubule(GO:0099517) |
| 0.0 | 1.9 | GO:0032543 | mitochondrial translation(GO:0032543) |
| 0.0 | 0.1 | GO:0000103 | sulfate assimilation(GO:0000103) |
| 0.0 | 1.5 | GO:0086010 | membrane depolarization during action potential(GO:0086010) |
| 0.0 | 0.4 | GO:0032836 | glomerular basement membrane development(GO:0032836) |
| 0.0 | 0.1 | GO:0030091 | protein repair(GO:0030091) |
| 0.0 | 2.5 | GO:0051591 | response to cAMP(GO:0051591) |
| 0.0 | 0.1 | GO:0042539 | hypotonic salinity response(GO:0042539) cellular hypotonic salinity response(GO:0071477) |
| 0.0 | 0.6 | GO:1903861 | positive regulation of dendrite extension(GO:1903861) |
| 0.0 | 0.2 | GO:2001032 | regulation of double-strand break repair via nonhomologous end joining(GO:2001032) |
| 0.0 | 0.5 | GO:0021554 | optic nerve development(GO:0021554) |
| 0.0 | 0.8 | GO:0043984 | histone H4-K16 acetylation(GO:0043984) |
| 0.0 | 0.7 | GO:0060009 | Sertoli cell development(GO:0060009) |
| 0.0 | 0.0 | GO:0021966 | corticospinal neuron axon guidance(GO:0021966) |
| 0.0 | 0.3 | GO:0006878 | cellular copper ion homeostasis(GO:0006878) |
| 0.0 | 0.2 | GO:1904306 | positive regulation of gastro-intestinal system smooth muscle contraction(GO:1904306) |
| 0.0 | 0.5 | GO:0003283 | atrial septum development(GO:0003283) |
| 0.0 | 0.4 | GO:0060965 | negative regulation of gene silencing by miRNA(GO:0060965) |
| 0.0 | 0.3 | GO:0071763 | nuclear membrane organization(GO:0071763) |
| 0.0 | 0.4 | GO:0030150 | protein import into mitochondrial matrix(GO:0030150) |
| 0.0 | 1.5 | GO:0045599 | negative regulation of fat cell differentiation(GO:0045599) |
| 0.0 | 0.1 | GO:0000389 | mRNA 3'-splice site recognition(GO:0000389) |
| 0.0 | 0.9 | GO:0007202 | activation of phospholipase C activity(GO:0007202) |
| 0.0 | 0.3 | GO:0009143 | nucleoside triphosphate catabolic process(GO:0009143) |
| 0.0 | 0.4 | GO:0006390 | transcription from mitochondrial promoter(GO:0006390) |
| 0.0 | 0.2 | GO:0061743 | motor learning(GO:0061743) |
| 0.0 | 0.2 | GO:0070417 | cellular response to cold(GO:0070417) |
| 0.0 | 0.1 | GO:1904784 | NLRP1 inflammasome complex assembly(GO:1904784) |
| 0.0 | 0.2 | GO:0089711 | L-glutamate transmembrane transport(GO:0089711) |
| 0.0 | 0.5 | GO:0070584 | mitochondrion morphogenesis(GO:0070584) |
| 0.0 | 1.1 | GO:0051642 | centrosome localization(GO:0051642) |
| 0.0 | 0.6 | GO:0050910 | detection of mechanical stimulus involved in sensory perception of sound(GO:0050910) |
| 0.0 | 0.2 | GO:0003417 | growth plate cartilage development(GO:0003417) |
| 0.0 | 0.7 | GO:0007130 | synaptonemal complex assembly(GO:0007130) |
| 0.0 | 0.0 | GO:0021524 | visceral motor neuron differentiation(GO:0021524) |
| 0.0 | 0.8 | GO:0010758 | regulation of macrophage chemotaxis(GO:0010758) |
| 0.0 | 0.3 | GO:0006398 | mRNA 3'-end processing by stem-loop binding and cleavage(GO:0006398) |
| 0.0 | 0.3 | GO:0022038 | corpus callosum development(GO:0022038) |
| 0.0 | 0.4 | GO:0040023 | nuclear migration(GO:0007097) establishment of nucleus localization(GO:0040023) |
| 0.0 | 0.9 | GO:0016239 | positive regulation of macroautophagy(GO:0016239) |
| 0.0 | 0.4 | GO:0040033 | miRNA mediated inhibition of translation(GO:0035278) negative regulation of translation, ncRNA-mediated(GO:0040033) regulation of translation, ncRNA-mediated(GO:0045974) |
| 0.0 | 0.1 | GO:1902714 | negative regulation of interferon-gamma secretion(GO:1902714) |
| 0.0 | 0.2 | GO:0030214 | hyaluronan catabolic process(GO:0030214) |
| 0.0 | 0.3 | GO:0033617 | mitochondrial respiratory chain complex IV assembly(GO:0033617) |
| 0.0 | 0.4 | GO:0043517 | positive regulation of DNA damage response, signal transduction by p53 class mediator(GO:0043517) |
| 0.0 | 1.8 | GO:0031016 | pancreas development(GO:0031016) |
| 0.0 | 0.3 | GO:0001867 | complement activation, lectin pathway(GO:0001867) |
| 0.0 | 0.6 | GO:0046688 | response to copper ion(GO:0046688) |
| 0.0 | 0.9 | GO:0035640 | exploration behavior(GO:0035640) |
| 0.0 | 0.7 | GO:0006458 | 'de novo' protein folding(GO:0006458) |
| 0.0 | 0.9 | GO:0043124 | negative regulation of I-kappaB kinase/NF-kappaB signaling(GO:0043124) |
| 0.0 | 0.1 | GO:0021764 | amygdala development(GO:0021764) |
| 0.0 | 0.3 | GO:0010225 | response to UV-C(GO:0010225) |
| 0.0 | 0.8 | GO:2000311 | regulation of alpha-amino-3-hydroxy-5-methyl-4-isoxazole propionate selective glutamate receptor activity(GO:2000311) |
| 0.0 | 0.4 | GO:0042178 | xenobiotic catabolic process(GO:0042178) |
| 0.0 | 0.1 | GO:1902475 | lysine transport(GO:0015819) L-alpha-amino acid transmembrane transport(GO:1902475) |
| 0.0 | 1.5 | GO:0032024 | positive regulation of insulin secretion(GO:0032024) |
| 0.0 | 0.4 | GO:0007413 | axonal fasciculation(GO:0007413) |
| 0.0 | 0.7 | GO:0000413 | protein peptidyl-prolyl isomerization(GO:0000413) |
| 0.0 | 0.1 | GO:0035036 | sperm-egg recognition(GO:0035036) |
| 0.0 | 0.5 | GO:0042118 | endothelial cell activation(GO:0042118) |
| 0.0 | 0.1 | GO:1901314 | negative regulation of histone ubiquitination(GO:0033183) negative regulation of protein K63-linked ubiquitination(GO:1900045) regulation of histone H2A K63-linked ubiquitination(GO:1901314) negative regulation of histone H2A K63-linked ubiquitination(GO:1901315) negative regulation of protein polyubiquitination(GO:1902915) |
| 0.0 | 0.1 | GO:0031914 | negative regulation of synaptic plasticity(GO:0031914) |
| 0.0 | 1.0 | GO:0043666 | regulation of phosphoprotein phosphatase activity(GO:0043666) |
| 0.0 | 0.8 | GO:0046677 | response to antibiotic(GO:0046677) |
| 0.0 | 0.2 | GO:0002890 | negative regulation of B cell mediated immunity(GO:0002713) negative regulation of immunoglobulin mediated immune response(GO:0002890) negative regulation of humoral immune response mediated by circulating immunoglobulin(GO:0002924) |
| 0.0 | 0.4 | GO:0051601 | exocyst localization(GO:0051601) |
| 0.0 | 0.1 | GO:0008295 | spermidine biosynthetic process(GO:0008295) |
| 0.0 | 0.2 | GO:0090394 | negative regulation of excitatory postsynaptic potential(GO:0090394) |
| 0.0 | 0.1 | GO:0031339 | negative regulation of vesicle fusion(GO:0031339) |
| 0.0 | 0.2 | GO:0006824 | cobalt ion transport(GO:0006824) |
| 0.0 | 1.4 | GO:0050771 | negative regulation of axonogenesis(GO:0050771) |
| 0.0 | 0.6 | GO:0032292 | myelination in peripheral nervous system(GO:0022011) peripheral nervous system axon ensheathment(GO:0032292) |
| 0.0 | 0.3 | GO:0003413 | chondrocyte differentiation involved in endochondral bone morphogenesis(GO:0003413) |
| 0.0 | 0.3 | GO:0000076 | DNA replication checkpoint(GO:0000076) |
| 0.0 | 0.1 | GO:0070893 | transposon integration(GO:0070893) regulation of transposon integration(GO:0070894) negative regulation of transposon integration(GO:0070895) |
| 0.0 | 0.7 | GO:0042149 | cellular response to glucose starvation(GO:0042149) |
| 0.0 | 1.6 | GO:0045333 | cellular respiration(GO:0045333) |
| 0.0 | 1.1 | GO:0006919 | activation of cysteine-type endopeptidase activity involved in apoptotic process(GO:0006919) |
| 0.0 | 0.3 | GO:0008090 | retrograde axonal transport(GO:0008090) |
| 0.0 | 0.3 | GO:0048733 | sebaceous gland development(GO:0048733) |
| 0.0 | 0.2 | GO:0051574 | positive regulation of histone H3-K9 methylation(GO:0051574) |
| 0.0 | 0.7 | GO:0007212 | dopamine receptor signaling pathway(GO:0007212) |
| 0.0 | 0.5 | GO:0002089 | lens morphogenesis in camera-type eye(GO:0002089) |
| 0.0 | 1.7 | GO:0007631 | feeding behavior(GO:0007631) |
| 0.0 | 0.2 | GO:0002087 | regulation of respiratory gaseous exchange by neurological system process(GO:0002087) |
| 0.0 | 0.1 | GO:0032218 | riboflavin transport(GO:0032218) |
| 0.0 | 0.1 | GO:0006432 | phenylalanyl-tRNA aminoacylation(GO:0006432) |
| 0.0 | 0.5 | GO:1901998 | toxin transport(GO:1901998) |
| 0.0 | 0.2 | GO:0044406 | adhesion of symbiont to host(GO:0044406) |
| 0.0 | 0.1 | GO:0006658 | phosphatidylserine metabolic process(GO:0006658) glycerophospholipid catabolic process(GO:0046475) |
| 0.0 | 0.7 | GO:0042439 | ethanolamine-containing compound metabolic process(GO:0042439) |
| 0.0 | 0.2 | GO:0051151 | negative regulation of smooth muscle cell differentiation(GO:0051151) |
| 0.0 | 0.1 | GO:0021794 | thalamus development(GO:0021794) |
| 0.0 | 0.1 | GO:0044725 | chromatin reprogramming in the zygote(GO:0044725) DNA demethylation of male pronucleus(GO:0044727) |
| 0.0 | 0.1 | GO:0060272 | embryonic skeletal joint morphogenesis(GO:0060272) |
| 0.0 | 0.1 | GO:0060080 | inhibitory postsynaptic potential(GO:0060080) |
| 0.0 | 0.2 | GO:0035094 | response to nicotine(GO:0035094) |
| 0.0 | 0.5 | GO:0035272 | exocrine system development(GO:0035272) |
| 0.0 | 0.4 | GO:0000186 | activation of MAPKK activity(GO:0000186) |
| 0.0 | 0.8 | GO:0080171 | lysosome organization(GO:0007040) lytic vacuole organization(GO:0080171) |
| 0.0 | 0.1 | GO:0031953 | negative regulation of protein autophosphorylation(GO:0031953) |
| 0.0 | 0.5 | GO:0045744 | negative regulation of G-protein coupled receptor protein signaling pathway(GO:0045744) |
| 0.0 | 0.1 | GO:0005513 | detection of calcium ion(GO:0005513) |
| 0.0 | 0.2 | GO:0010453 | regulation of cell fate commitment(GO:0010453) |
| 0.0 | 0.5 | GO:0035329 | hippo signaling(GO:0035329) |
| 0.0 | 0.3 | GO:0051703 | social behavior(GO:0035176) intraspecies interaction between organisms(GO:0051703) |
| 0.0 | 0.3 | GO:0043171 | peptide catabolic process(GO:0043171) |
| 0.0 | 0.3 | GO:0015914 | phospholipid transport(GO:0015914) |
| 0.0 | 0.3 | GO:0035136 | forelimb morphogenesis(GO:0035136) |
| 0.0 | 0.2 | GO:0046085 | adenosine metabolic process(GO:0046085) |
| 0.0 | 0.8 | GO:0050852 | T cell receptor signaling pathway(GO:0050852) |
| 0.0 | 1.1 | GO:0071222 | cellular response to lipopolysaccharide(GO:0071222) |
| 0.0 | 0.2 | GO:0048791 | calcium ion-regulated exocytosis of neurotransmitter(GO:0048791) |
| 0.0 | 0.4 | GO:0006891 | intra-Golgi vesicle-mediated transport(GO:0006891) |
| 0.0 | 0.1 | GO:0009133 | nucleoside diphosphate biosynthetic process(GO:0009133) |
| 0.0 | 0.5 | GO:0030317 | sperm motility(GO:0030317) |
Gene overrepresentation in cellular component category:
| Log-likelihood per target | Total log-likelihood | Term | Description |
|---|---|---|---|
| 1.5 | 8.9 | GO:0044279 | other organism cell membrane(GO:0044218) other organism membrane(GO:0044279) |
| 0.6 | 2.5 | GO:0097447 | dendritic tree(GO:0097447) |
| 0.6 | 6.2 | GO:0042567 | insulin-like growth factor ternary complex(GO:0042567) |
| 0.6 | 2.4 | GO:0005749 | mitochondrial respiratory chain complex II, succinate dehydrogenase complex (ubiquinone)(GO:0005749) succinate dehydrogenase complex (ubiquinone)(GO:0045257) respiratory chain complex II(GO:0045273) succinate dehydrogenase complex(GO:0045281) fumarate reductase complex(GO:0045283) |
| 0.6 | 1.8 | GO:0098842 | postsynaptic early endosome(GO:0098842) |
| 0.5 | 1.6 | GO:0042720 | mitochondrial inner membrane peptidase complex(GO:0042720) |
| 0.5 | 2.7 | GO:0031314 | extrinsic component of mitochondrial inner membrane(GO:0031314) |
| 0.4 | 5.7 | GO:0031315 | extrinsic component of mitochondrial outer membrane(GO:0031315) |
| 0.4 | 6.4 | GO:0008385 | IkappaB kinase complex(GO:0008385) |
| 0.4 | 1.2 | GO:0005967 | mitochondrial pyruvate dehydrogenase complex(GO:0005967) |
| 0.4 | 4.7 | GO:0072546 | ER membrane protein complex(GO:0072546) |
| 0.3 | 1.0 | GO:0043291 | RAVE complex(GO:0043291) |
| 0.3 | 1.5 | GO:0071817 | MMXD complex(GO:0071817) |
| 0.3 | 0.9 | GO:0048269 | methionine adenosyltransferase complex(GO:0048269) |
| 0.3 | 2.1 | GO:0042765 | GPI-anchor transamidase complex(GO:0042765) |
| 0.3 | 2.3 | GO:0061617 | MICOS complex(GO:0061617) |
| 0.3 | 3.3 | GO:0045275 | respiratory chain complex III(GO:0045275) |
| 0.3 | 1.0 | GO:0002189 | ribose phosphate diphosphokinase complex(GO:0002189) |
| 0.3 | 10.5 | GO:0034364 | high-density lipoprotein particle(GO:0034364) |
| 0.2 | 3.0 | GO:0042613 | MHC class II protein complex(GO:0042613) |
| 0.2 | 2.9 | GO:0008250 | oligosaccharyltransferase complex(GO:0008250) |
| 0.2 | 3.6 | GO:0000177 | cytoplasmic exosome (RNase complex)(GO:0000177) |
| 0.2 | 0.7 | GO:0005712 | chiasma(GO:0005712) |
| 0.2 | 1.1 | GO:0010370 | perinucleolar chromocenter(GO:0010370) |
| 0.2 | 0.9 | GO:0017133 | mitochondrial electron transfer flavoprotein complex(GO:0017133) electron transfer flavoprotein complex(GO:0045251) |
| 0.2 | 1.4 | GO:0048237 | rough endoplasmic reticulum lumen(GO:0048237) |
| 0.2 | 3.2 | GO:0000276 | mitochondrial proton-transporting ATP synthase complex, coupling factor F(o)(GO:0000276) |
| 0.2 | 1.9 | GO:0031595 | nuclear proteasome complex(GO:0031595) |
| 0.2 | 1.1 | GO:0005672 | transcription factor TFIIA complex(GO:0005672) |
| 0.2 | 1.3 | GO:0072588 | box H/ACA snoRNP complex(GO:0031429) box H/ACA RNP complex(GO:0072588) |
| 0.2 | 2.6 | GO:0032593 | insulin-responsive compartment(GO:0032593) |
| 0.2 | 0.7 | GO:1990415 | Pex17p-Pex14p docking complex(GO:1990415) peroxisomal importomer complex(GO:1990429) |
| 0.2 | 0.7 | GO:0033165 | interphotoreceptor matrix(GO:0033165) |
| 0.2 | 1.3 | GO:0033503 | HULC complex(GO:0033503) |
| 0.2 | 2.5 | GO:0034663 | endoplasmic reticulum chaperone complex(GO:0034663) |
| 0.2 | 1.5 | GO:0000178 | exosome (RNase complex)(GO:0000178) |
| 0.2 | 1.0 | GO:0034448 | EGO complex(GO:0034448) |
| 0.2 | 1.0 | GO:0032777 | Piccolo NuA4 histone acetyltransferase complex(GO:0032777) |
| 0.2 | 0.8 | GO:0035339 | SPOTS complex(GO:0035339) |
| 0.2 | 0.5 | GO:0036501 | UFD1-NPL4 complex(GO:0036501) |
| 0.2 | 1.7 | GO:0045179 | apical cortex(GO:0045179) |
| 0.2 | 4.1 | GO:0031362 | anchored component of external side of plasma membrane(GO:0031362) |
| 0.1 | 0.7 | GO:0034271 | phosphatidylinositol 3-kinase complex, class III, type I(GO:0034271) phosphatidylinositol 3-kinase complex, class III, type II(GO:0034272) |
| 0.1 | 0.9 | GO:0070876 | SOSS complex(GO:0070876) |
| 0.1 | 0.6 | GO:0070722 | Tle3-Aes complex(GO:0070722) |
| 0.1 | 1.4 | GO:0031462 | Cul2-RING ubiquitin ligase complex(GO:0031462) |
| 0.1 | 2.4 | GO:0005641 | nuclear envelope lumen(GO:0005641) |
| 0.1 | 1.1 | GO:0071986 | Ragulator complex(GO:0071986) |
| 0.1 | 0.7 | GO:0097454 | Schwann cell microvillus(GO:0097454) |
| 0.1 | 0.9 | GO:0089701 | U2AF(GO:0089701) |
| 0.1 | 0.4 | GO:0031372 | UBC13-MMS2 complex(GO:0031372) |
| 0.1 | 1.7 | GO:0005736 | DNA-directed RNA polymerase I complex(GO:0005736) |
| 0.1 | 5.2 | GO:0032839 | dendrite cytoplasm(GO:0032839) |
| 0.1 | 0.5 | GO:0016035 | zeta DNA polymerase complex(GO:0016035) |
| 0.1 | 5.1 | GO:0042470 | melanosome(GO:0042470) pigment granule(GO:0048770) |
| 0.1 | 0.7 | GO:0033553 | rDNA heterochromatin(GO:0033553) |
| 0.1 | 6.4 | GO:0030964 | mitochondrial respiratory chain complex I(GO:0005747) NADH dehydrogenase complex(GO:0030964) respiratory chain complex I(GO:0045271) |
| 0.1 | 1.0 | GO:0031313 | extrinsic component of endosome membrane(GO:0031313) |
| 0.1 | 2.8 | GO:0001518 | voltage-gated sodium channel complex(GO:0001518) |
| 0.1 | 1.1 | GO:0044352 | pinosome(GO:0044352) macropinosome(GO:0044354) |
| 0.1 | 0.6 | GO:0030121 | AP-1 adaptor complex(GO:0030121) |
| 0.1 | 0.7 | GO:0030870 | Mre11 complex(GO:0030870) |
| 0.1 | 0.4 | GO:0097598 | sperm cytoplasmic droplet(GO:0097598) |
| 0.1 | 1.8 | GO:0070852 | cell body fiber(GO:0070852) |
| 0.1 | 1.3 | GO:0036128 | CatSper complex(GO:0036128) |
| 0.1 | 0.4 | GO:0005785 | signal recognition particle receptor complex(GO:0005785) |
| 0.1 | 0.3 | GO:0097209 | epidermal lamellar body(GO:0097209) |
| 0.1 | 2.3 | GO:0031907 | peroxisomal matrix(GO:0005782) microbody lumen(GO:0031907) |
| 0.1 | 1.9 | GO:0030057 | desmosome(GO:0030057) |
| 0.1 | 0.5 | GO:0042719 | mitochondrial intermembrane space protein transporter complex(GO:0042719) |
| 0.1 | 9.4 | GO:0005811 | lipid particle(GO:0005811) |
| 0.1 | 3.3 | GO:0045334 | clathrin-coated endocytic vesicle(GO:0045334) |
| 0.1 | 2.8 | GO:0071782 | endoplasmic reticulum tubular network(GO:0071782) |
| 0.1 | 0.6 | GO:0000931 | gamma-tubulin large complex(GO:0000931) gamma-tubulin ring complex(GO:0008274) |
| 0.1 | 4.7 | GO:0042645 | nucleoid(GO:0009295) mitochondrial nucleoid(GO:0042645) |
| 0.1 | 0.2 | GO:1904602 | serotonin-activated cation-selective channel complex(GO:1904602) |
| 0.1 | 3.0 | GO:0070971 | endoplasmic reticulum exit site(GO:0070971) |
| 0.1 | 0.4 | GO:0002079 | inner acrosomal membrane(GO:0002079) |
| 0.1 | 0.6 | GO:0031205 | endoplasmic reticulum Sec complex(GO:0031205) |
| 0.1 | 1.6 | GO:0000153 | cytoplasmic ubiquitin ligase complex(GO:0000153) |
| 0.1 | 1.2 | GO:0034045 | pre-autophagosomal structure membrane(GO:0034045) |
| 0.1 | 12.0 | GO:0030176 | integral component of endoplasmic reticulum membrane(GO:0030176) |
| 0.1 | 0.5 | GO:0072487 | MSL complex(GO:0072487) |
| 0.1 | 1.6 | GO:0031011 | Ino80 complex(GO:0031011) |
| 0.1 | 2.8 | GO:0090544 | BAF-type complex(GO:0090544) |
| 0.1 | 5.7 | GO:0032420 | stereocilium(GO:0032420) |
| 0.1 | 0.4 | GO:0008282 | ATP-sensitive potassium channel complex(GO:0008282) |
| 0.1 | 2.1 | GO:0097038 | perinuclear endoplasmic reticulum(GO:0097038) |
| 0.1 | 0.4 | GO:0005587 | collagen type IV trimer(GO:0005587) network-forming collagen trimer(GO:0098642) collagen network(GO:0098645) basement membrane collagen trimer(GO:0098651) |
| 0.1 | 4.3 | GO:0005793 | endoplasmic reticulum-Golgi intermediate compartment(GO:0005793) |
| 0.1 | 0.5 | GO:0097129 | cyclin D2-CDK4 complex(GO:0097129) |
| 0.1 | 0.2 | GO:0005594 | collagen type IX trimer(GO:0005594) |
| 0.1 | 0.7 | GO:0032584 | growth cone membrane(GO:0032584) |
| 0.1 | 0.6 | GO:0002177 | manchette(GO:0002177) |
| 0.1 | 2.0 | GO:0030173 | integral component of Golgi membrane(GO:0030173) |
| 0.1 | 0.5 | GO:0098574 | cytoplasmic side of lysosomal membrane(GO:0098574) |
| 0.1 | 0.4 | GO:0000220 | vacuolar proton-transporting V-type ATPase, V0 domain(GO:0000220) |
| 0.1 | 1.9 | GO:0000314 | organellar small ribosomal subunit(GO:0000314) mitochondrial small ribosomal subunit(GO:0005763) |
| 0.1 | 0.6 | GO:0044754 | autolysosome(GO:0044754) |
| 0.1 | 0.8 | GO:0031209 | SCAR complex(GO:0031209) |
| 0.1 | 0.3 | GO:0030896 | checkpoint clamp complex(GO:0030896) |
| 0.1 | 0.6 | GO:0030123 | AP-3 adaptor complex(GO:0030123) |
| 0.0 | 0.6 | GO:0017119 | Golgi transport complex(GO:0017119) |
| 0.0 | 0.2 | GO:0005914 | spot adherens junction(GO:0005914) |
| 0.0 | 0.3 | GO:0071439 | clathrin complex(GO:0071439) |
| 0.0 | 0.6 | GO:0090576 | RNA polymerase III transcription factor complex(GO:0090576) |
| 0.0 | 3.8 | GO:0031903 | peroxisomal membrane(GO:0005778) microbody membrane(GO:0031903) |
| 0.0 | 0.4 | GO:0000439 | core TFIIH complex(GO:0000439) |
| 0.0 | 0.6 | GO:0000801 | central element(GO:0000801) |
| 0.0 | 0.6 | GO:0005642 | annulate lamellae(GO:0005642) |
| 0.0 | 1.1 | GO:0000407 | pre-autophagosomal structure(GO:0000407) |
| 0.0 | 0.4 | GO:0030125 | clathrin vesicle coat(GO:0030125) |
| 0.0 | 0.5 | GO:0034464 | BBSome(GO:0034464) |
| 0.0 | 1.2 | GO:0034451 | centriolar satellite(GO:0034451) |
| 0.0 | 1.7 | GO:0032588 | trans-Golgi network membrane(GO:0032588) |
| 0.0 | 0.4 | GO:0000347 | THO complex(GO:0000347) THO complex part of transcription export complex(GO:0000445) |
| 0.0 | 0.4 | GO:0097433 | dense body(GO:0097433) |
| 0.0 | 1.1 | GO:0031305 | intrinsic component of mitochondrial inner membrane(GO:0031304) integral component of mitochondrial inner membrane(GO:0031305) |
| 0.0 | 0.4 | GO:0001940 | male pronucleus(GO:0001940) |
| 0.0 | 1.0 | GO:0071437 | invadopodium(GO:0071437) |
| 0.0 | 0.3 | GO:0001673 | male germ cell nucleus(GO:0001673) |
| 0.0 | 0.7 | GO:0005832 | chaperonin-containing T-complex(GO:0005832) |
| 0.0 | 0.4 | GO:0005797 | Golgi medial cisterna(GO:0005797) |
| 0.0 | 1.5 | GO:0035861 | site of double-strand break(GO:0035861) |
| 0.0 | 1.5 | GO:0032592 | integral component of mitochondrial membrane(GO:0032592) |
| 0.0 | 0.4 | GO:0005952 | cAMP-dependent protein kinase complex(GO:0005952) |
| 0.0 | 0.3 | GO:0001652 | granular component(GO:0001652) |
| 0.0 | 1.1 | GO:0016327 | apicolateral plasma membrane(GO:0016327) |
| 0.0 | 2.1 | GO:0048786 | presynaptic active zone(GO:0048786) |
| 0.0 | 0.7 | GO:0032279 | asymmetric synapse(GO:0032279) |
| 0.0 | 0.7 | GO:0005916 | fascia adherens(GO:0005916) |
| 0.0 | 1.0 | GO:0043218 | compact myelin(GO:0043218) |
| 0.0 | 5.2 | GO:0005741 | mitochondrial outer membrane(GO:0005741) |
| 0.0 | 0.9 | GO:0016010 | dystrophin-associated glycoprotein complex(GO:0016010) glycoprotein complex(GO:0090665) |
| 0.0 | 0.5 | GO:0046581 | intercellular canaliculus(GO:0046581) |
| 0.0 | 0.6 | GO:0032045 | guanyl-nucleotide exchange factor complex(GO:0032045) |
| 0.0 | 55.2 | GO:0005783 | endoplasmic reticulum(GO:0005783) |
| 0.0 | 5.5 | GO:0000139 | Golgi membrane(GO:0000139) |
| 0.0 | 0.4 | GO:0031264 | death-inducing signaling complex(GO:0031264) |
| 0.0 | 0.6 | GO:0035102 | PRC1 complex(GO:0035102) |
| 0.0 | 0.6 | GO:0097225 | sperm midpiece(GO:0097225) |
| 0.0 | 0.9 | GO:0032281 | AMPA glutamate receptor complex(GO:0032281) |
| 0.0 | 0.2 | GO:0005801 | cis-Golgi network(GO:0005801) |
| 0.0 | 0.4 | GO:0005862 | muscle thin filament tropomyosin(GO:0005862) |
| 0.0 | 1.7 | GO:0045171 | intercellular bridge(GO:0045171) |
| 0.0 | 0.2 | GO:0030119 | AP-type membrane coat adaptor complex(GO:0030119) |
| 0.0 | 0.3 | GO:0000015 | phosphopyruvate hydratase complex(GO:0000015) |
| 0.0 | 0.1 | GO:0032299 | ribonuclease H2 complex(GO:0032299) |
| 0.0 | 0.1 | GO:0072558 | NLRP1 inflammasome complex(GO:0072558) |
| 0.0 | 0.4 | GO:0031045 | dense core granule(GO:0031045) |
| 0.0 | 2.2 | GO:0008076 | voltage-gated potassium channel complex(GO:0008076) |
| 0.0 | 0.9 | GO:0005891 | voltage-gated calcium channel complex(GO:0005891) |
| 0.0 | 0.1 | GO:1990923 | PET complex(GO:1990923) |
| 0.0 | 0.3 | GO:0010369 | chromocenter(GO:0010369) |
| 0.0 | 2.5 | GO:0000795 | synaptonemal complex(GO:0000795) |
| 0.0 | 0.5 | GO:0045095 | keratin filament(GO:0045095) |
| 0.0 | 0.4 | GO:0043196 | varicosity(GO:0043196) |
| 0.0 | 0.2 | GO:0072669 | tRNA-splicing ligase complex(GO:0072669) |
| 0.0 | 0.2 | GO:0045098 | type III intermediate filament(GO:0045098) |
| 0.0 | 0.6 | GO:0030118 | clathrin coat(GO:0030118) |
| 0.0 | 0.2 | GO:0036156 | inner dynein arm(GO:0036156) |
| 0.0 | 0.1 | GO:0005663 | DNA replication factor C complex(GO:0005663) |
| 0.0 | 0.1 | GO:0000814 | ESCRT II complex(GO:0000814) |
| 0.0 | 0.3 | GO:0005922 | connexon complex(GO:0005922) |
| 0.0 | 0.1 | GO:0034685 | integrin alphav-beta6 complex(GO:0034685) |
| 0.0 | 0.0 | GO:0031084 | BLOC-2 complex(GO:0031084) |
| 0.0 | 0.1 | GO:0031251 | PAN complex(GO:0031251) |
| 0.0 | 0.1 | GO:0071547 | piP-body(GO:0071547) |
| 0.0 | 0.1 | GO:0089717 | spanning component of plasma membrane(GO:0044214) spanning component of membrane(GO:0089717) |
| 0.0 | 1.0 | GO:0031526 | brush border membrane(GO:0031526) |
| 0.0 | 0.2 | GO:0042105 | alpha-beta T cell receptor complex(GO:0042105) |
| 0.0 | 1.0 | GO:0042579 | peroxisome(GO:0005777) microbody(GO:0042579) |
| 0.0 | 0.1 | GO:0035189 | Rb-E2F complex(GO:0035189) |
Gene overrepresentation in molecular function category:
| Log-likelihood per target | Total log-likelihood | Term | Description |
|---|---|---|---|
| 6.4 | 32.2 | GO:0005186 | pheromone activity(GO:0005186) |
| 2.3 | 6.9 | GO:0003858 | 3-hydroxybutyrate dehydrogenase activity(GO:0003858) |
| 1.7 | 11.7 | GO:0052650 | NADP-retinol dehydrogenase activity(GO:0052650) |
| 1.6 | 1.6 | GO:0016508 | long-chain-enoyl-CoA hydratase activity(GO:0016508) |
| 1.4 | 5.7 | GO:0050632 | propanoyl-CoA C-acyltransferase activity(GO:0033814) propionyl-CoA C2-trimethyltridecanoyltransferase activity(GO:0050632) phosphatidylethanolamine transporter activity(GO:1904121) |
| 1.3 | 3.8 | GO:0033754 | indoleamine 2,3-dioxygenase activity(GO:0033754) |
| 1.3 | 7.5 | GO:0008384 | IkappaB kinase activity(GO:0008384) |
| 1.1 | 3.3 | GO:0003845 | 11-beta-hydroxysteroid dehydrogenase [NAD(P)] activity(GO:0003845) |
| 1.1 | 4.4 | GO:0036478 | tyrosine 3-monooxygenase activator activity(GO:0036470) L-dopa decarboxylase activator activity(GO:0036478) |
| 1.0 | 3.1 | GO:0016509 | long-chain-3-hydroxyacyl-CoA dehydrogenase activity(GO:0016509) |
| 0.9 | 3.5 | GO:0042284 | sphingolipid delta-4 desaturase activity(GO:0042284) |
| 0.8 | 2.5 | GO:0019776 | Atg8 ligase activity(GO:0019776) |
| 0.8 | 2.5 | GO:0003990 | acetylcholinesterase activity(GO:0003990) |
| 0.8 | 2.3 | GO:0004658 | propionyl-CoA carboxylase activity(GO:0004658) |
| 0.8 | 3.0 | GO:0070905 | serine binding(GO:0070905) |
| 0.7 | 5.1 | GO:0071723 | lipopeptide binding(GO:0071723) |
| 0.7 | 5.0 | GO:0061629 | RNA polymerase II sequence-specific DNA binding transcription factor binding(GO:0061629) |
| 0.7 | 4.7 | GO:0030549 | acetylcholine receptor activator activity(GO:0030549) |
| 0.6 | 2.4 | GO:0004779 | adenylylsulfate kinase activity(GO:0004020) sulfate adenylyltransferase activity(GO:0004779) sulfate adenylyltransferase (ATP) activity(GO:0004781) |
| 0.6 | 2.4 | GO:0000104 | succinate dehydrogenase activity(GO:0000104) |
| 0.6 | 1.8 | GO:0004492 | methylmalonyl-CoA decarboxylase activity(GO:0004492) |
| 0.6 | 2.3 | GO:0016899 | oxidoreductase activity, acting on the CH-OH group of donors, oxygen as acceptor(GO:0016899) |
| 0.6 | 3.4 | GO:0060698 | endoribonuclease inhibitor activity(GO:0060698) |
| 0.6 | 2.2 | GO:0047275 | glucosaminylgalactosylglucosylceramide beta-galactosyltransferase activity(GO:0047275) |
| 0.5 | 1.6 | GO:0017099 | very-long-chain-acyl-CoA dehydrogenase activity(GO:0017099) |
| 0.5 | 4.8 | GO:0055131 | C3HC4-type RING finger domain binding(GO:0055131) |
| 0.5 | 2.6 | GO:0070287 | ferritin receptor activity(GO:0070287) |
| 0.5 | 1.5 | GO:0009918 | sterol delta7 reductase activity(GO:0009918) 7-dehydrocholesterol reductase activity(GO:0047598) |
| 0.5 | 1.5 | GO:0070025 | cystathionine beta-synthase activity(GO:0004122) oxidoreductase activity, acting on other nitrogenous compounds as donors, cytochrome as acceptor(GO:0016662) nitrite reductase (NO-forming) activity(GO:0050421) carbon monoxide binding(GO:0070025) nitric oxide binding(GO:0070026) |
| 0.5 | 1.9 | GO:0018455 | alcohol dehydrogenase [NAD(P)+] activity(GO:0018455) |
| 0.5 | 1.9 | GO:0030156 | benzodiazepine receptor binding(GO:0030156) |
| 0.4 | 1.3 | GO:0030338 | CMP-N-acetylneuraminate monooxygenase activity(GO:0030338) |
| 0.4 | 2.6 | GO:0004594 | pantothenate kinase activity(GO:0004594) |
| 0.4 | 1.7 | GO:0047522 | 13-prostaglandin reductase activity(GO:0036132) 15-oxoprostaglandin 13-oxidase activity(GO:0047522) |
| 0.4 | 1.3 | GO:0004774 | succinate-CoA ligase activity(GO:0004774) |
| 0.4 | 2.0 | GO:0016778 | diphosphotransferase activity(GO:0016778) |
| 0.4 | 1.2 | GO:0042282 | hydroxymethylglutaryl-CoA reductase (NADPH) activity(GO:0004420) hydroxymethylglutaryl-CoA reductase activity(GO:0042282) |
| 0.4 | 3.3 | GO:0008121 | ubiquinol-cytochrome-c reductase activity(GO:0008121) oxidoreductase activity, acting on diphenols and related substances as donors, cytochrome as acceptor(GO:0016681) |
| 0.4 | 1.2 | GO:0008330 | protein tyrosine/threonine phosphatase activity(GO:0008330) |
| 0.4 | 7.4 | GO:0015245 | fatty acid transporter activity(GO:0015245) |
| 0.4 | 4.9 | GO:0004571 | mannosyl-oligosaccharide 1,2-alpha-mannosidase activity(GO:0004571) |
| 0.4 | 14.1 | GO:0016712 | oxidoreductase activity, acting on paired donors, with incorporation or reduction of molecular oxygen, reduced flavin or flavoprotein as one donor, and incorporation of one atom of oxygen(GO:0016712) |
| 0.3 | 1.7 | GO:0004528 | phosphodiesterase I activity(GO:0004528) |
| 0.3 | 1.7 | GO:0048531 | beta-1,3-galactosyltransferase activity(GO:0048531) |
| 0.3 | 5.2 | GO:0016846 | carbon-sulfur lyase activity(GO:0016846) |
| 0.3 | 6.5 | GO:0003995 | acyl-CoA dehydrogenase activity(GO:0003995) |
| 0.3 | 1.2 | GO:0050501 | hyaluronan synthase activity(GO:0050501) |
| 0.3 | 1.6 | GO:0097001 | ceramide binding(GO:0097001) |
| 0.3 | 25.9 | GO:0005550 | pheromone binding(GO:0005550) |
| 0.3 | 2.1 | GO:0070404 | NADH binding(GO:0070404) |
| 0.3 | 1.2 | GO:0033883 | pyridoxal phosphatase activity(GO:0033883) |
| 0.3 | 2.1 | GO:0003923 | GPI-anchor transamidase activity(GO:0003923) |
| 0.3 | 1.2 | GO:0004740 | pyruvate dehydrogenase (acetyl-transferring) kinase activity(GO:0004740) |
| 0.3 | 0.9 | GO:0015924 | mannosyl-oligosaccharide mannosidase activity(GO:0015924) |
| 0.3 | 2.9 | GO:0004579 | oligosaccharyl transferase activity(GO:0004576) dolichyl-diphosphooligosaccharide-protein glycotransferase activity(GO:0004579) |
| 0.3 | 2.6 | GO:0015217 | ATP transmembrane transporter activity(GO:0005347) ADP transmembrane transporter activity(GO:0015217) |
| 0.3 | 1.4 | GO:0004174 | electron-transferring-flavoprotein dehydrogenase activity(GO:0004174) oxidoreductase activity, acting on the CH-NH group of donors, quinone or similar compound as acceptor(GO:0016649) |
| 0.3 | 1.1 | GO:0046403 | polynucleotide 3'-phosphatase activity(GO:0046403) |
| 0.3 | 11.1 | GO:0042056 | chemoattractant activity(GO:0042056) |
| 0.3 | 1.3 | GO:0051185 | coenzyme transporter activity(GO:0051185) |
| 0.3 | 41.4 | GO:0004867 | serine-type endopeptidase inhibitor activity(GO:0004867) |
| 0.3 | 0.8 | GO:0016005 | phospholipase A2 activator activity(GO:0016005) |
| 0.3 | 2.3 | GO:0000268 | peroxisome targeting sequence binding(GO:0000268) |
| 0.3 | 1.0 | GO:0004800 | thyroxine 5'-deiodinase activity(GO:0004800) |
| 0.2 | 0.7 | GO:0008124 | 4-alpha-hydroxytetrahydrobiopterin dehydratase activity(GO:0008124) |
| 0.2 | 3.1 | GO:0035473 | lipase binding(GO:0035473) |
| 0.2 | 9.9 | GO:0015020 | glucuronosyltransferase activity(GO:0015020) |
| 0.2 | 4.2 | GO:0015037 | peptide disulfide oxidoreductase activity(GO:0015037) |
| 0.2 | 2.3 | GO:1901612 | cardiolipin binding(GO:1901612) |
| 0.2 | 1.6 | GO:0009019 | tRNA (guanine-N1-)-methyltransferase activity(GO:0009019) |
| 0.2 | 1.1 | GO:0034584 | piRNA binding(GO:0034584) |
| 0.2 | 0.6 | GO:0016155 | formyltetrahydrofolate dehydrogenase activity(GO:0016155) |
| 0.2 | 0.9 | GO:0042008 | interleukin-18 receptor activity(GO:0042008) |
| 0.2 | 0.8 | GO:0003998 | acylphosphatase activity(GO:0003998) |
| 0.2 | 0.6 | GO:0005157 | macrophage colony-stimulating factor receptor binding(GO:0005157) |
| 0.2 | 0.8 | GO:0000026 | alpha-1,2-mannosyltransferase activity(GO:0000026) |
| 0.2 | 2.5 | GO:0009922 | fatty acid elongase activity(GO:0009922) 3-oxo-arachidoyl-CoA synthase activity(GO:0102336) 3-oxo-cerotoyl-CoA synthase activity(GO:0102337) 3-oxo-lignoceronyl-CoA synthase activity(GO:0102338) |
| 0.2 | 1.6 | GO:0003996 | acyl-CoA ligase activity(GO:0003996) |
| 0.2 | 1.6 | GO:0001849 | complement component C1q binding(GO:0001849) |
| 0.2 | 1.8 | GO:0015165 | pyrimidine nucleotide-sugar transmembrane transporter activity(GO:0015165) |
| 0.2 | 0.8 | GO:0004069 | L-aspartate:2-oxoglutarate aminotransferase activity(GO:0004069) |
| 0.2 | 1.2 | GO:0042289 | MHC class II protein binding(GO:0042289) |
| 0.2 | 3.3 | GO:0030957 | Tat protein binding(GO:0030957) |
| 0.2 | 3.5 | GO:0001848 | complement binding(GO:0001848) |
| 0.2 | 0.6 | GO:0019807 | aspartoacylase activity(GO:0019807) |
| 0.2 | 0.6 | GO:1901375 | acetylcholine transmembrane transporter activity(GO:0005277) acetate ester transmembrane transporter activity(GO:1901375) |
| 0.2 | 8.1 | GO:0008395 | steroid hydroxylase activity(GO:0008395) |
| 0.2 | 0.6 | GO:0008900 | hydrogen:potassium-exchanging ATPase activity(GO:0008900) |
| 0.2 | 0.6 | GO:0019002 | GMP binding(GO:0019002) |
| 0.2 | 4.3 | GO:0005351 | sugar:proton symporter activity(GO:0005351) |
| 0.2 | 1.3 | GO:0004351 | glutamate decarboxylase activity(GO:0004351) |
| 0.2 | 0.6 | GO:0005260 | channel-conductance-controlling ATPase activity(GO:0005260) |
| 0.2 | 0.5 | GO:0000386 | second spliceosomal transesterification activity(GO:0000386) |
| 0.2 | 1.6 | GO:0015087 | cobalt ion transmembrane transporter activity(GO:0015087) |
| 0.2 | 1.3 | GO:0034513 | box H/ACA snoRNA binding(GO:0034513) |
| 0.2 | 1.8 | GO:0051021 | GDP-dissociation inhibitor binding(GO:0051021) |
| 0.2 | 0.7 | GO:0019237 | centromeric DNA binding(GO:0019237) |
| 0.2 | 0.7 | GO:0031708 | endothelin B receptor binding(GO:0031708) |
| 0.2 | 0.5 | GO:0071820 | N-box binding(GO:0071820) |
| 0.2 | 0.7 | GO:0051381 | histamine binding(GO:0051381) |
| 0.2 | 0.5 | GO:0004090 | carbonyl reductase (NADPH) activity(GO:0004090) |
| 0.2 | 0.7 | GO:0004559 | alpha-mannosidase activity(GO:0004559) |
| 0.2 | 1.0 | GO:0008745 | N-acetylmuramoyl-L-alanine amidase activity(GO:0008745) peptidoglycan receptor activity(GO:0016019) |
| 0.2 | 4.3 | GO:0043295 | glutathione binding(GO:0043295) oligopeptide binding(GO:1900750) |
| 0.2 | 1.6 | GO:0008889 | glycerophosphodiester phosphodiesterase activity(GO:0008889) |
| 0.2 | 1.0 | GO:0004792 | thiosulfate sulfurtransferase activity(GO:0004792) |
| 0.2 | 0.6 | GO:0031699 | beta-3 adrenergic receptor binding(GO:0031699) |
| 0.2 | 1.6 | GO:0031419 | cobalamin binding(GO:0031419) |
| 0.2 | 0.6 | GO:0035650 | AP-1 adaptor complex binding(GO:0035650) |
| 0.2 | 0.5 | GO:0033149 | FFAT motif binding(GO:0033149) |
| 0.2 | 4.6 | GO:0017128 | phospholipid scramblase activity(GO:0017128) |
| 0.2 | 0.8 | GO:0052834 | inositol monophosphate 1-phosphatase activity(GO:0008934) inositol monophosphate 3-phosphatase activity(GO:0052832) inositol monophosphate 4-phosphatase activity(GO:0052833) inositol monophosphate phosphatase activity(GO:0052834) |
| 0.2 | 6.8 | GO:0005159 | insulin-like growth factor receptor binding(GO:0005159) |
| 0.1 | 2.7 | GO:0102391 | decanoate--CoA ligase activity(GO:0102391) |
| 0.1 | 4.5 | GO:0017056 | structural constituent of nuclear pore(GO:0017056) |
| 0.1 | 1.4 | GO:0050291 | sphingosine N-acyltransferase activity(GO:0050291) |
| 0.1 | 0.4 | GO:0008457 | beta-galactosyl-N-acetylglucosaminylgalactosylglucosyl-ceramide beta-1,3-acetylglucosaminyltransferase activity(GO:0008457) lactosylceramide 1,3-N-acetyl-beta-D-glucosaminyltransferase activity(GO:0047256) |
| 0.1 | 0.7 | GO:0008310 | single-stranded DNA 3'-5' exodeoxyribonuclease activity(GO:0008310) |
| 0.1 | 0.4 | GO:0031531 | thyrotropin-releasing hormone receptor binding(GO:0031531) |
| 0.1 | 0.8 | GO:0008401 | retinoic acid 4-hydroxylase activity(GO:0008401) |
| 0.1 | 1.4 | GO:0047499 | calcium-independent phospholipase A2 activity(GO:0047499) |
| 0.1 | 1.7 | GO:0001055 | RNA polymerase I activity(GO:0001054) RNA polymerase II activity(GO:0001055) |
| 0.1 | 2.4 | GO:0016832 | aldehyde-lyase activity(GO:0016832) |
| 0.1 | 0.8 | GO:0036402 | proteasome-activating ATPase activity(GO:0036402) |
| 0.1 | 1.3 | GO:0016174 | NAD(P)H oxidase activity(GO:0016174) |
| 0.1 | 0.9 | GO:0016802 | adenosylhomocysteinase activity(GO:0004013) trialkylsulfonium hydrolase activity(GO:0016802) |
| 0.1 | 0.7 | GO:1990254 | keratin filament binding(GO:1990254) |
| 0.1 | 0.7 | GO:0004883 | glucocorticoid receptor activity(GO:0004883) transcription factor activity, ligand-activated RNA polymerase II transcription factor binding(GO:0038049) glucocorticoid-activated RNA polymerase II transcription factor binding transcription factor activity(GO:0038051) |
| 0.1 | 2.5 | GO:0070513 | death domain binding(GO:0070513) |
| 0.1 | 1.3 | GO:0051870 | methotrexate binding(GO:0051870) |
| 0.1 | 0.7 | GO:0045322 | unmethylated CpG binding(GO:0045322) |
| 0.1 | 1.7 | GO:0004303 | estradiol 17-beta-dehydrogenase activity(GO:0004303) |
| 0.1 | 1.9 | GO:0008430 | selenium binding(GO:0008430) |
| 0.1 | 2.1 | GO:0003993 | acid phosphatase activity(GO:0003993) |
| 0.1 | 0.2 | GO:0032190 | acrosin binding(GO:0032190) |
| 0.1 | 0.4 | GO:0004794 | L-threonine ammonia-lyase activity(GO:0004794) |
| 0.1 | 0.9 | GO:0008379 | thioredoxin peroxidase activity(GO:0008379) |
| 0.1 | 1.1 | GO:0016724 | ferroxidase activity(GO:0004322) oxidoreductase activity, oxidizing metal ions, oxygen as acceptor(GO:0016724) |
| 0.1 | 0.3 | GO:0004911 | interleukin-2 receptor activity(GO:0004911) |
| 0.1 | 1.0 | GO:0016812 | hydrolase activity, acting on carbon-nitrogen (but not peptide) bonds, in cyclic amides(GO:0016812) |
| 0.1 | 0.3 | GO:0005368 | beta-alanine transmembrane transporter activity(GO:0001761) taurine transmembrane transporter activity(GO:0005368) taurine:sodium symporter activity(GO:0005369) |
| 0.1 | 0.2 | GO:0001147 | transcription termination site sequence-specific DNA binding(GO:0001147) transcription termination site DNA binding(GO:0001160) |
| 0.1 | 0.3 | GO:0035539 | 8-oxo-7,8-dihydroguanosine triphosphate pyrophosphatase activity(GO:0008413) 8-oxo-7,8-dihydrodeoxyguanosine triphosphate pyrophosphatase activity(GO:0035539) |
| 0.1 | 2.1 | GO:0035174 | histone serine kinase activity(GO:0035174) |
| 0.1 | 1.0 | GO:0004767 | sphingomyelin phosphodiesterase activity(GO:0004767) |
| 0.1 | 0.4 | GO:0004816 | asparagine-tRNA ligase activity(GO:0004816) |
| 0.1 | 2.9 | GO:0051537 | 2 iron, 2 sulfur cluster binding(GO:0051537) |
| 0.1 | 0.8 | GO:0001594 | trace-amine receptor activity(GO:0001594) |
| 0.1 | 1.9 | GO:0046703 | natural killer cell lectin-like receptor binding(GO:0046703) |
| 0.1 | 1.6 | GO:0005078 | MAP-kinase scaffold activity(GO:0005078) |
| 0.1 | 0.3 | GO:0001156 | TFIIIC-class transcription factor binding(GO:0001156) |
| 0.1 | 0.8 | GO:0008597 | calcium-dependent protein serine/threonine phosphatase regulator activity(GO:0008597) |
| 0.1 | 1.5 | GO:0043495 | protein anchor(GO:0043495) |
| 0.1 | 3.0 | GO:0005545 | 1-phosphatidylinositol binding(GO:0005545) |
| 0.1 | 0.9 | GO:0003909 | DNA ligase activity(GO:0003909) DNA ligase (ATP) activity(GO:0003910) |
| 0.1 | 10.1 | GO:0008170 | N-methyltransferase activity(GO:0008170) |
| 0.1 | 2.3 | GO:0003746 | translation elongation factor activity(GO:0003746) |
| 0.1 | 1.8 | GO:0005528 | macrolide binding(GO:0005527) FK506 binding(GO:0005528) |
| 0.1 | 0.9 | GO:0086080 | protein binding involved in heterotypic cell-cell adhesion(GO:0086080) |
| 0.1 | 1.3 | GO:0001972 | retinoic acid binding(GO:0001972) |
| 0.1 | 0.2 | GO:0046980 | peptide antigen-transporting ATPase activity(GO:0015433) tapasin binding(GO:0046980) |
| 0.1 | 0.8 | GO:0015252 | hydrogen ion channel activity(GO:0015252) |
| 0.1 | 3.0 | GO:0044183 | protein binding involved in protein folding(GO:0044183) |
| 0.1 | 2.8 | GO:0005248 | voltage-gated sodium channel activity(GO:0005248) |
| 0.1 | 0.5 | GO:0005223 | intracellular cyclic nucleotide activated cation channel activity(GO:0005221) intracellular cGMP activated cation channel activity(GO:0005223) |
| 0.1 | 0.3 | GO:0036033 | mediator complex binding(GO:0036033) |
| 0.1 | 3.0 | GO:0000175 | 3'-5'-exoribonuclease activity(GO:0000175) |
| 0.1 | 0.8 | GO:0030550 | acetylcholine receptor inhibitor activity(GO:0030550) |
| 0.1 | 0.6 | GO:0032184 | SUMO polymer binding(GO:0032184) |
| 0.1 | 1.4 | GO:0019531 | oxalate transmembrane transporter activity(GO:0019531) |
| 0.1 | 0.9 | GO:0030628 | pre-mRNA 3'-splice site binding(GO:0030628) |
| 0.1 | 0.4 | GO:0003960 | NADPH:quinone reductase activity(GO:0003960) |
| 0.1 | 1.2 | GO:0005436 | sodium:phosphate symporter activity(GO:0005436) |
| 0.1 | 0.3 | GO:0003918 | DNA topoisomerase type II (ATP-hydrolyzing) activity(GO:0003918) DNA topoisomerase II activity(GO:0061505) |
| 0.1 | 0.8 | GO:0046972 | histone acetyltransferase activity (H4-K5 specific)(GO:0043995) histone acetyltransferase activity (H4-K8 specific)(GO:0043996) histone acetyltransferase activity (H4-K16 specific)(GO:0046972) |
| 0.1 | 0.5 | GO:0031849 | olfactory receptor binding(GO:0031849) |
| 0.1 | 0.7 | GO:0004468 | lysine N-acetyltransferase activity, acting on acetyl phosphate as donor(GO:0004468) |
| 0.1 | 0.9 | GO:0015194 | L-serine transmembrane transporter activity(GO:0015194) serine transmembrane transporter activity(GO:0022889) |
| 0.1 | 0.3 | GO:0016608 | growth hormone-releasing hormone activity(GO:0016608) |
| 0.1 | 0.2 | GO:0050253 | retinyl-palmitate esterase activity(GO:0050253) |
| 0.1 | 1.0 | GO:0019911 | structural constituent of myelin sheath(GO:0019911) |
| 0.1 | 1.0 | GO:0051400 | BH domain binding(GO:0051400) |
| 0.1 | 3.6 | GO:0031624 | ubiquitin conjugating enzyme binding(GO:0031624) |
| 0.1 | 2.6 | GO:0080025 | phosphatidylinositol-3,5-bisphosphate binding(GO:0080025) |
| 0.1 | 1.0 | GO:0035925 | mRNA 3'-UTR AU-rich region binding(GO:0035925) |
| 0.1 | 2.2 | GO:0005104 | fibroblast growth factor receptor binding(GO:0005104) |
| 0.1 | 0.8 | GO:0017034 | Rap guanyl-nucleotide exchange factor activity(GO:0017034) |
| 0.1 | 0.2 | GO:0030943 | mitochondrion targeting sequence binding(GO:0030943) |
| 0.1 | 0.6 | GO:0005007 | fibroblast growth factor-activated receptor activity(GO:0005007) |
| 0.1 | 1.7 | GO:0005251 | delayed rectifier potassium channel activity(GO:0005251) |
| 0.1 | 0.9 | GO:0015143 | urate transmembrane transporter activity(GO:0015143) salt transmembrane transporter activity(GO:1901702) |
| 0.1 | 1.5 | GO:0042975 | peroxisome proliferator activated receptor binding(GO:0042975) |
| 0.1 | 0.3 | GO:0032896 | palmitoyl-CoA 9-desaturase activity(GO:0032896) |
| 0.1 | 0.2 | GO:0042392 | sphingosine-1-phosphate phosphatase activity(GO:0042392) |
| 0.1 | 1.0 | GO:0019871 | sodium channel inhibitor activity(GO:0019871) |
| 0.1 | 0.5 | GO:0036435 | K48-linked polyubiquitin binding(GO:0036435) |
| 0.1 | 0.2 | GO:0004342 | glucosamine-6-phosphate deaminase activity(GO:0004342) |
| 0.1 | 0.7 | GO:0001161 | intronic transcription regulatory region sequence-specific DNA binding(GO:0001161) |
| 0.1 | 1.6 | GO:0016922 | ligand-dependent nuclear receptor binding(GO:0016922) |
| 0.1 | 1.1 | GO:0008276 | protein methyltransferase activity(GO:0008276) |
| 0.1 | 0.2 | GO:0034617 | tetrahydrobiopterin binding(GO:0034617) |
| 0.0 | 1.1 | GO:0016805 | dipeptidase activity(GO:0016805) |
| 0.0 | 1.2 | GO:0003950 | NAD+ ADP-ribosyltransferase activity(GO:0003950) |
| 0.0 | 0.2 | GO:0022850 | serotonin-gated cation channel activity(GO:0022850) |
| 0.0 | 0.2 | GO:0055105 | ubiquitin-protein transferase inhibitor activity(GO:0055105) |
| 0.0 | 0.5 | GO:0050815 | phosphoserine binding(GO:0050815) |
| 0.0 | 0.2 | GO:0033906 | hyaluronoglucuronidase activity(GO:0033906) |
| 0.0 | 0.4 | GO:0005519 | cytoskeletal regulatory protein binding(GO:0005519) |
| 0.0 | 1.0 | GO:0005540 | hyaluronic acid binding(GO:0005540) |
| 0.0 | 1.6 | GO:0001223 | transcription coactivator binding(GO:0001223) |
| 0.0 | 2.4 | GO:0005154 | epidermal growth factor receptor binding(GO:0005154) |
| 0.0 | 0.1 | GO:0001566 | phorbol ester receptor activity(GO:0001565) non-kinase phorbol ester receptor activity(GO:0001566) |
| 0.0 | 0.4 | GO:0032051 | clathrin light chain binding(GO:0032051) |
| 0.0 | 0.2 | GO:0008073 | ornithine decarboxylase inhibitor activity(GO:0008073) |
| 0.0 | 1.3 | GO:0008574 | ATP-dependent microtubule motor activity, plus-end-directed(GO:0008574) |
| 0.0 | 0.2 | GO:0004985 | opioid receptor activity(GO:0004985) |
| 0.0 | 2.6 | GO:0001784 | phosphotyrosine binding(GO:0001784) |
| 0.0 | 2.5 | GO:0005245 | voltage-gated calcium channel activity(GO:0005245) |
| 0.0 | 0.4 | GO:0008199 | ferric iron binding(GO:0008199) |
| 0.0 | 0.3 | GO:0097108 | hedgehog family protein binding(GO:0097108) |
| 0.0 | 0.7 | GO:0004708 | MAP kinase kinase activity(GO:0004708) |
| 0.0 | 0.2 | GO:0000099 | sulfur amino acid transmembrane transporter activity(GO:0000099) |
| 0.0 | 0.7 | GO:0030955 | potassium ion binding(GO:0030955) |
| 0.0 | 0.4 | GO:0070700 | BMP receptor binding(GO:0070700) |
| 0.0 | 1.1 | GO:0031435 | mitogen-activated protein kinase kinase kinase binding(GO:0031435) |
| 0.0 | 0.2 | GO:0050252 | retinol O-fatty-acyltransferase activity(GO:0050252) |
| 0.0 | 0.6 | GO:0019215 | intermediate filament binding(GO:0019215) |
| 0.0 | 1.3 | GO:0005242 | inward rectifier potassium channel activity(GO:0005242) |
| 0.0 | 0.4 | GO:0038062 | protein tyrosine kinase collagen receptor activity(GO:0038062) |
| 0.0 | 1.3 | GO:0070412 | R-SMAD binding(GO:0070412) |
| 0.0 | 1.3 | GO:1990841 | promoter-specific chromatin binding(GO:1990841) |
| 0.0 | 0.6 | GO:0015299 | solute:proton antiporter activity(GO:0015299) |
| 0.0 | 0.2 | GO:0005220 | inositol 1,4,5-trisphosphate-sensitive calcium-release channel activity(GO:0005220) |
| 0.0 | 0.7 | GO:0004806 | triglyceride lipase activity(GO:0004806) |
| 0.0 | 0.8 | GO:0035259 | glucocorticoid receptor binding(GO:0035259) |
| 0.0 | 0.4 | GO:0000182 | rDNA binding(GO:0000182) |
| 0.0 | 0.5 | GO:0001011 | transcription factor activity, sequence-specific DNA binding, RNA polymerase recruiting(GO:0001011) transcription factor activity, TFIIB-class binding(GO:0001087) |
| 0.0 | 0.1 | GO:0030144 | alpha-1,6-mannosylglycoprotein 6-beta-N-acetylglucosaminyltransferase activity(GO:0030144) |
| 0.0 | 0.7 | GO:0050811 | GABA receptor binding(GO:0050811) |
| 0.0 | 0.3 | GO:0070492 | oligosaccharide binding(GO:0070492) |
| 0.0 | 0.5 | GO:0003906 | DNA-(apurinic or apyrimidinic site) lyase activity(GO:0003906) DNA N-glycosylase activity(GO:0019104) |
| 0.0 | 1.9 | GO:0098531 | RNA polymerase II transcription factor activity, ligand-activated sequence-specific DNA binding(GO:0004879) transcription factor activity, direct ligand regulated sequence-specific DNA binding(GO:0098531) |
| 0.0 | 0.4 | GO:0008603 | cAMP-dependent protein kinase regulator activity(GO:0008603) |
| 0.0 | 1.6 | GO:0017112 | Rab guanyl-nucleotide exchange factor activity(GO:0017112) |
| 0.0 | 0.7 | GO:0003755 | peptidyl-prolyl cis-trans isomerase activity(GO:0003755) |
| 0.0 | 0.7 | GO:0045295 | gamma-catenin binding(GO:0045295) |
| 0.0 | 0.3 | GO:0005025 | transforming growth factor beta receptor activity, type I(GO:0005025) |
| 0.0 | 0.1 | GO:0005152 | interleukin-1 receptor antagonist activity(GO:0005152) |
| 0.0 | 1.6 | GO:0030145 | manganese ion binding(GO:0030145) |
| 0.0 | 0.1 | GO:0010428 | methyl-CpNpG binding(GO:0010428) |
| 0.0 | 0.1 | GO:0004062 | aryl sulfotransferase activity(GO:0004062) |
| 0.0 | 0.7 | GO:0070006 | metalloaminopeptidase activity(GO:0070006) |
| 0.0 | 0.6 | GO:0042923 | neuropeptide binding(GO:0042923) |
| 0.0 | 0.5 | GO:0051787 | misfolded protein binding(GO:0051787) |
| 0.0 | 0.6 | GO:0015238 | drug transmembrane transporter activity(GO:0015238) |
| 0.0 | 0.1 | GO:0035827 | rubidium ion transmembrane transporter activity(GO:0035827) |
| 0.0 | 2.8 | GO:0019888 | protein phosphatase regulator activity(GO:0019888) |
| 0.0 | 1.2 | GO:0008536 | Ran GTPase binding(GO:0008536) |
| 0.0 | 0.6 | GO:0005537 | mannose binding(GO:0005537) |
| 0.0 | 0.8 | GO:0004012 | phospholipid-translocating ATPase activity(GO:0004012) |
| 0.0 | 0.3 | GO:0004634 | phosphopyruvate hydratase activity(GO:0004634) |
| 0.0 | 0.1 | GO:0070579 | methylcytosine dioxygenase activity(GO:0070579) |
| 0.0 | 1.0 | GO:0016831 | carboxy-lyase activity(GO:0016831) |
| 0.0 | 0.1 | GO:0015189 | L-lysine transmembrane transporter activity(GO:0015189) |
| 0.0 | 0.1 | GO:0061649 | ubiquitinated histone binding(GO:0061649) |
| 0.0 | 2.6 | GO:0016410 | N-acyltransferase activity(GO:0016410) |
| 0.0 | 1.1 | GO:0019200 | carbohydrate kinase activity(GO:0019200) |
| 0.0 | 0.4 | GO:1904264 | ubiquitin protein ligase activity involved in ERAD pathway(GO:1904264) |
| 0.0 | 0.7 | GO:0017166 | vinculin binding(GO:0017166) |
| 0.0 | 0.2 | GO:0008508 | bile acid:sodium symporter activity(GO:0008508) |
| 0.0 | 0.4 | GO:0004550 | nucleoside diphosphate kinase activity(GO:0004550) |
| 0.0 | 0.5 | GO:0070577 | lysine-acetylated histone binding(GO:0070577) |
| 0.0 | 0.1 | GO:0033743 | peptide-methionine (R)-S-oxide reductase activity(GO:0033743) |
| 0.0 | 0.2 | GO:0001665 | alpha-N-acetylgalactosaminide alpha-2,6-sialyltransferase activity(GO:0001665) |
| 0.0 | 0.2 | GO:0046790 | virion binding(GO:0046790) |
| 0.0 | 1.1 | GO:0008028 | monocarboxylic acid transmembrane transporter activity(GO:0008028) |
| 0.0 | 0.2 | GO:0005432 | calcium:sodium antiporter activity(GO:0005432) calcium:cation antiporter activity(GO:0015368) |
| 0.0 | 0.7 | GO:0051879 | Hsp90 protein binding(GO:0051879) |
| 0.0 | 0.2 | GO:0019869 | chloride channel inhibitor activity(GO:0019869) |
| 0.0 | 0.5 | GO:0050136 | NADH dehydrogenase (ubiquinone) activity(GO:0008137) NADH dehydrogenase (quinone) activity(GO:0050136) |
| 0.0 | 0.4 | GO:0017091 | AU-rich element binding(GO:0017091) |
| 0.0 | 4.1 | GO:0001078 | transcriptional repressor activity, RNA polymerase II core promoter proximal region sequence-specific binding(GO:0001078) |
| 0.0 | 2.1 | GO:0005506 | iron ion binding(GO:0005506) |
| 0.0 | 0.1 | GO:0032217 | riboflavin transporter activity(GO:0032217) |
| 0.0 | 0.2 | GO:0001206 | transcriptional repressor activity, RNA polymerase II distal enhancer sequence-specific binding(GO:0001206) |
| 0.0 | 0.1 | GO:0004126 | cytidine deaminase activity(GO:0004126) |
| 0.0 | 0.8 | GO:0048487 | beta-tubulin binding(GO:0048487) |
| 0.0 | 0.0 | GO:0034191 | apolipoprotein A-I receptor binding(GO:0034191) |
| 0.0 | 0.5 | GO:0071837 | HMG box domain binding(GO:0071837) |
| 0.0 | 0.3 | GO:0016493 | C-C chemokine receptor activity(GO:0016493) |
| 0.0 | 0.1 | GO:0008517 | folic acid transporter activity(GO:0008517) |
| 0.0 | 0.3 | GO:0005521 | lamin binding(GO:0005521) |
| 0.0 | 0.3 | GO:0051011 | microtubule minus-end binding(GO:0051011) |
| 0.0 | 0.1 | GO:0016813 | hydrolase activity, acting on carbon-nitrogen (but not peptide) bonds, in linear amidines(GO:0016813) |
| 0.0 | 0.2 | GO:0009008 | DNA-methyltransferase activity(GO:0009008) |
| 0.0 | 0.3 | GO:0099589 | G-protein coupled serotonin receptor activity(GO:0004993) serotonin receptor activity(GO:0099589) |
| 0.0 | 0.1 | GO:0022851 | GABA-gated chloride ion channel activity(GO:0022851) |
| 0.0 | 0.2 | GO:0042166 | acetylcholine binding(GO:0042166) |
| 0.0 | 0.3 | GO:0008510 | sodium:bicarbonate symporter activity(GO:0008510) |
| 0.0 | 0.1 | GO:0019966 | interleukin-1 binding(GO:0019966) |
| 0.0 | 0.1 | GO:0003796 | lysozyme activity(GO:0003796) |
| 0.0 | 0.4 | GO:0004115 | 3',5'-cyclic-AMP phosphodiesterase activity(GO:0004115) |
| 0.0 | 1.2 | GO:0019905 | syntaxin binding(GO:0019905) |
| 0.0 | 0.2 | GO:0042608 | T cell receptor binding(GO:0042608) |
Gene overrepresentation in curated gene sets: canonical pathways category:
| Log-likelihood per target | Total log-likelihood | Term | Description |
|---|---|---|---|
| 0.3 | 1.0 | PID FAS PATHWAY | FAS (CD95) signaling pathway |
| 0.2 | 17.1 | PID TAP63 PATHWAY | Validated transcriptional targets of TAp63 isoforms |
| 0.1 | 12.3 | PID CERAMIDE PATHWAY | Ceramide signaling pathway |
| 0.1 | 1.5 | PID ERB GENOMIC PATHWAY | Validated nuclear estrogen receptor beta network |
| 0.1 | 2.9 | PID GLYPICAN 1PATHWAY | Glypican 1 network |
| 0.1 | 2.6 | PID ERBB NETWORK PATHWAY | ErbB receptor signaling network |
| 0.1 | 5.1 | PID HNF3A PATHWAY | FOXA1 transcription factor network |
| 0.1 | 0.7 | SIG BCR SIGNALING PATHWAY | Members of the BCR signaling pathway |
| 0.1 | 4.7 | PID TCR CALCIUM PATHWAY | Calcium signaling in the CD4+ TCR pathway |
| 0.1 | 4.1 | PID ALPHA SYNUCLEIN PATHWAY | Alpha-synuclein signaling |
| 0.1 | 6.6 | PID AR TF PATHWAY | Regulation of Androgen receptor activity |
| 0.1 | 0.9 | PID INTEGRIN A9B1 PATHWAY | Alpha9 beta1 integrin signaling events |
| 0.1 | 0.6 | SA FAS SIGNALING | The TNF-type receptor Fas induces apoptosis on ligand binding. |
| 0.1 | 0.6 | SA PROGRAMMED CELL DEATH | Programmed cell death, or apoptosis, eliminates damaged or unneeded cells. |
| 0.1 | 0.7 | PID IL6 7 PATHWAY | IL6-mediated signaling events |
| 0.0 | 2.5 | PID ECADHERIN STABILIZATION PATHWAY | Stabilization and expansion of the E-cadherin adherens junction |
| 0.0 | 1.7 | PID PI3KCI AKT PATHWAY | Class I PI3K signaling events mediated by Akt |
| 0.0 | 0.4 | PID CXCR4 PATHWAY | CXCR4-mediated signaling events |
| 0.0 | 1.0 | PID DNA PK PATHWAY | DNA-PK pathway in nonhomologous end joining |
| 0.0 | 0.2 | ST PHOSPHOINOSITIDE 3 KINASE PATHWAY | PI3K Pathway |
| 0.0 | 3.1 | PID AJDISS 2PATHWAY | Posttranslational regulation of adherens junction stability and dissassembly |
| 0.0 | 0.8 | PID NECTIN PATHWAY | Nectin adhesion pathway |
| 0.0 | 0.7 | ST G ALPHA S PATHWAY | G alpha s Pathway |
| 0.0 | 0.7 | PID WNT CANONICAL PATHWAY | Canonical Wnt signaling pathway |
| 0.0 | 1.0 | PID P38 MKK3 6PATHWAY | p38 MAPK signaling pathway |
| 0.0 | 1.7 | PID NETRIN PATHWAY | Netrin-mediated signaling events |
| 0.0 | 1.7 | PID ATF2 PATHWAY | ATF-2 transcription factor network |
| 0.0 | 1.0 | ST WNT CA2 CYCLIC GMP PATHWAY | Wnt/Ca2+/cyclic GMP signaling. |
| 0.0 | 0.4 | PID INTEGRIN A4B1 PATHWAY | Alpha4 beta1 integrin signaling events |
| 0.0 | 0.7 | PID VEGFR1 PATHWAY | VEGFR1 specific signals |
| 0.0 | 2.5 | WNT SIGNALING | Genes related to Wnt-mediated signal transduction |
| 0.0 | 0.8 | PID ARF6 TRAFFICKING PATHWAY | Arf6 trafficking events |
| 0.0 | 1.0 | PID CDC42 REG PATHWAY | Regulation of CDC42 activity |
| 0.0 | 0.9 | NABA COLLAGENS | Genes encoding collagen proteins |
| 0.0 | 0.7 | PID FGF PATHWAY | FGF signaling pathway |
| 0.0 | 0.4 | ST JNK MAPK PATHWAY | JNK MAPK Pathway |
| 0.0 | 0.1 | PID ECADHERIN KERATINOCYTE PATHWAY | E-cadherin signaling in keratinocytes |
Gene overrepresentation in curated gene sets: REACTOME pathways category:
| Log-likelihood per target | Total log-likelihood | Term | Description |
|---|---|---|---|
| 1.0 | 11.5 | REACTOME RECYCLING OF BILE ACIDS AND SALTS | Genes involved in Recycling of bile acids and salts |
| 0.6 | 12.1 | REACTOME SYNTHESIS OF BILE ACIDS AND BILE SALTS VIA 7ALPHA HYDROXYCHOLESTEROL | Genes involved in Synthesis of bile acids and bile salts via 7alpha-hydroxycholesterol |
| 0.5 | 6.1 | REACTOME IRAK1 RECRUITS IKK COMPLEX | Genes involved in IRAK1 recruits IKK complex |
| 0.4 | 5.1 | REACTOME TRYPTOPHAN CATABOLISM | Genes involved in Tryptophan catabolism |
| 0.3 | 9.5 | REACTOME COMPLEMENT CASCADE | Genes involved in Complement cascade |
| 0.3 | 8.3 | REACTOME SYNTHESIS OF VERY LONG CHAIN FATTY ACYL COAS | Genes involved in Synthesis of very long-chain fatty acyl-CoAs |
| 0.2 | 6.2 | REACTOME BRANCHED CHAIN AMINO ACID CATABOLISM | Genes involved in Branched-chain amino acid catabolism |
| 0.2 | 0.9 | REACTOME INFLUENZA VIRAL RNA TRANSCRIPTION AND REPLICATION | Genes involved in Influenza Viral RNA Transcription and Replication |
| 0.2 | 3.8 | REACTOME VITAMIN B5 PANTOTHENATE METABOLISM | Genes involved in Vitamin B5 (pantothenate) metabolism |
| 0.2 | 0.2 | REACTOME VIF MEDIATED DEGRADATION OF APOBEC3G | Genes involved in Vif-mediated degradation of APOBEC3G |
| 0.2 | 0.2 | REACTOME DESTABILIZATION OF MRNA BY BRF1 | Genes involved in Destabilization of mRNA by Butyrate Response Factor 1 (BRF1) |
| 0.2 | 2.1 | REACTOME ETHANOL OXIDATION | Genes involved in Ethanol oxidation |
| 0.2 | 4.1 | REACTOME SYNTHESIS SECRETION AND DEACYLATION OF GHRELIN | Genes involved in Synthesis, Secretion, and Deacylation of Ghrelin |
| 0.2 | 2.4 | REACTOME CYTOSOLIC SULFONATION OF SMALL MOLECULES | Genes involved in Cytosolic sulfonation of small molecules |
| 0.2 | 3.2 | REACTOME FORMATION OF ATP BY CHEMIOSMOTIC COUPLING | Genes involved in Formation of ATP by chemiosmotic coupling |
| 0.1 | 5.0 | REACTOME SULFUR AMINO ACID METABOLISM | Genes involved in Sulfur amino acid metabolism |
| 0.1 | 3.1 | REACTOME CITRIC ACID CYCLE TCA CYCLE | Genes involved in Citric acid cycle (TCA cycle) |
| 0.1 | 1.4 | REACTOME GLUCURONIDATION | Genes involved in Glucuronidation |
| 0.1 | 2.4 | REACTOME TRAF3 DEPENDENT IRF ACTIVATION PATHWAY | Genes involved in TRAF3-dependent IRF activation pathway |
| 0.1 | 2.5 | REACTOME ABCA TRANSPORTERS IN LIPID HOMEOSTASIS | Genes involved in ABCA transporters in lipid homeostasis |
| 0.1 | 1.2 | REACTOME REGULATION OF PYRUVATE DEHYDROGENASE PDH COMPLEX | Genes involved in Regulation of pyruvate dehydrogenase (PDH) complex |
| 0.1 | 1.3 | REACTOME CS DS DEGRADATION | Genes involved in CS/DS degradation |
| 0.1 | 1.6 | REACTOME ANTIGEN PRESENTATION FOLDING ASSEMBLY AND PEPTIDE LOADING OF CLASS I MHC | Genes involved in Antigen Presentation: Folding, assembly and peptide loading of class I MHC |
| 0.1 | 6.7 | REACTOME RESPIRATORY ELECTRON TRANSPORT | Genes involved in Respiratory electron transport |
| 0.1 | 0.3 | REACTOME ENDOSOMAL VACUOLAR PATHWAY | Genes involved in Endosomal/Vacuolar pathway |
| 0.1 | 2.7 | REACTOME CHOLESTEROL BIOSYNTHESIS | Genes involved in Cholesterol biosynthesis |
| 0.1 | 0.6 | REACTOME COMMON PATHWAY | Genes involved in Common Pathway |
| 0.1 | 1.1 | REACTOME ACTIVATION OF CHAPERONES BY ATF6 ALPHA | Genes involved in Activation of Chaperones by ATF6-alpha |
| 0.1 | 2.0 | REACTOME DESTABILIZATION OF MRNA BY TRISTETRAPROLIN TTP | Genes involved in Destabilization of mRNA by Tristetraprolin (TTP) |
| 0.1 | 3.7 | REACTOME GLUTATHIONE CONJUGATION | Genes involved in Glutathione conjugation |
| 0.1 | 1.1 | REACTOME PHASE II CONJUGATION | Genes involved in Phase II conjugation |
| 0.1 | 1.5 | REACTOME FGFR4 LIGAND BINDING AND ACTIVATION | Genes involved in FGFR4 ligand binding and activation |
| 0.1 | 0.7 | REACTOME NOD1 2 SIGNALING PATHWAY | Genes involved in NOD1/2 Signaling Pathway |
| 0.1 | 3.8 | REACTOME METABOLISM OF VITAMINS AND COFACTORS | Genes involved in Metabolism of vitamins and cofactors |
| 0.1 | 1.5 | REACTOME CTLA4 INHIBITORY SIGNALING | Genes involved in CTLA4 inhibitory signaling |
| 0.1 | 1.1 | REACTOME PURINE CATABOLISM | Genes involved in Purine catabolism |
| 0.1 | 2.6 | REACTOME NEUROTRANSMITTER RELEASE CYCLE | Genes involved in Neurotransmitter Release Cycle |
| 0.1 | 0.6 | REACTOME SYNTHESIS SECRETION AND INACTIVATION OF GIP | Genes involved in Synthesis, Secretion, and Inactivation of Glucose-dependent Insulinotropic Polypeptide (GIP) |
| 0.1 | 0.6 | REACTOME ROLE OF SECOND MESSENGERS IN NETRIN1 SIGNALING | Genes involved in Role of second messengers in netrin-1 signaling |
| 0.1 | 0.8 | REACTOME ROLE OF DCC IN REGULATING APOPTOSIS | Genes involved in Role of DCC in regulating apoptosis |
| 0.1 | 0.7 | REACTOME FACILITATIVE NA INDEPENDENT GLUCOSE TRANSPORTERS | Genes involved in Facilitative Na+-independent glucose transporters |
| 0.1 | 2.8 | REACTOME ACTIVATION OF CHAPERONE GENES BY XBP1S | Genes involved in Activation of Chaperone Genes by XBP1(S) |
| 0.1 | 2.1 | REACTOME TIGHT JUNCTION INTERACTIONS | Genes involved in Tight junction interactions |
| 0.1 | 0.3 | REACTOME G PROTEIN ACTIVATION | Genes involved in G-protein activation |
| 0.1 | 3.5 | REACTOME PI3K EVENTS IN ERBB4 SIGNALING | Genes involved in PI3K events in ERBB4 signaling |
| 0.0 | 5.1 | REACTOME NUCLEAR RECEPTOR TRANSCRIPTION PATHWAY | Genes involved in Nuclear Receptor transcription pathway |
| 0.0 | 1.3 | REACTOME INHIBITION OF VOLTAGE GATED CA2 CHANNELS VIA GBETA GAMMA SUBUNITS | Genes involved in Inhibition of voltage gated Ca2+ channels via Gbeta/gamma subunits |
| 0.0 | 0.4 | REACTOME BETA DEFENSINS | Genes involved in Beta defensins |
| 0.0 | 0.7 | REACTOME SYNTHESIS OF PIPS AT THE LATE ENDOSOME MEMBRANE | Genes involved in Synthesis of PIPs at the late endosome membrane |
| 0.0 | 0.8 | REACTOME P130CAS LINKAGE TO MAPK SIGNALING FOR INTEGRINS | Genes involved in p130Cas linkage to MAPK signaling for integrins |
| 0.0 | 2.2 | REACTOME MEIOTIC SYNAPSIS | Genes involved in Meiotic Synapsis |
| 0.0 | 2.6 | REACTOME VOLTAGE GATED POTASSIUM CHANNELS | Genes involved in Voltage gated Potassium channels |
| 0.0 | 2.6 | REACTOME NCAM1 INTERACTIONS | Genes involved in NCAM1 interactions |
| 0.0 | 0.8 | REACTOME AMINE DERIVED HORMONES | Genes involved in Amine-derived hormones |
| 0.0 | 0.8 | REACTOME INTRINSIC PATHWAY | Genes involved in Intrinsic Pathway |
| 0.0 | 2.2 | REACTOME O LINKED GLYCOSYLATION OF MUCINS | Genes involved in O-linked glycosylation of mucins |
| 0.0 | 1.2 | REACTOME TRANSPORT TO THE GOLGI AND SUBSEQUENT MODIFICATION | Genes involved in Transport to the Golgi and subsequent modification |
| 0.0 | 2.8 | REACTOME NOTCH1 INTRACELLULAR DOMAIN REGULATES TRANSCRIPTION | Genes involved in NOTCH1 Intracellular Domain Regulates Transcription |
| 0.0 | 2.3 | REACTOME AMINO ACID AND OLIGOPEPTIDE SLC TRANSPORTERS | Genes involved in Amino acid and oligopeptide SLC transporters |
| 0.0 | 0.2 | REACTOME ELEVATION OF CYTOSOLIC CA2 LEVELS | Genes involved in Elevation of cytosolic Ca2+ levels |
| 0.0 | 0.9 | REACTOME REGULATION OF INSULIN SECRETION | Genes involved in Regulation of Insulin Secretion |
| 0.0 | 0.8 | REACTOME CELL EXTRACELLULAR MATRIX INTERACTIONS | Genes involved in Cell-extracellular matrix interactions |
| 0.0 | 0.2 | REACTOME REGULATION OF WATER BALANCE BY RENAL AQUAPORINS | Genes involved in Regulation of Water Balance by Renal Aquaporins |
| 0.0 | 0.6 | REACTOME RNA POL III CHAIN ELONGATION | Genes involved in RNA Polymerase III Chain Elongation |
| 0.0 | 0.5 | REACTOME DCC MEDIATED ATTRACTIVE SIGNALING | Genes involved in DCC mediated attractive signaling |
| 0.0 | 1.8 | REACTOME TRANSPORT OF INORGANIC CATIONS ANIONS AND AMINO ACIDS OLIGOPEPTIDES | Genes involved in Transport of inorganic cations/anions and amino acids/oligopeptides |
| 0.0 | 1.0 | REACTOME AMINE LIGAND BINDING RECEPTORS | Genes involved in Amine ligand-binding receptors |
| 0.0 | 0.2 | REACTOME APOPTOTIC CLEAVAGE OF CELL ADHESION PROTEINS | Genes involved in Apoptotic cleavage of cell adhesion proteins |
| 0.0 | 0.3 | REACTOME CALNEXIN CALRETICULIN CYCLE | Genes involved in Calnexin/calreticulin cycle |
| 0.0 | 0.4 | REACTOME BILE SALT AND ORGANIC ANION SLC TRANSPORTERS | Genes involved in Bile salt and organic anion SLC transporters |
| 0.0 | 0.2 | REACTOME REGULATION OF ORNITHINE DECARBOXYLASE ODC | Genes involved in Regulation of ornithine decarboxylase (ODC) |
| 0.0 | 0.6 | REACTOME DOWNREGULATION OF TGF BETA RECEPTOR SIGNALING | Genes involved in Downregulation of TGF-beta receptor signaling |
| 0.0 | 0.8 | REACTOME METAL ION SLC TRANSPORTERS | Genes involved in Metal ion SLC transporters |
| 0.0 | 0.3 | REACTOME IL RECEPTOR SHC SIGNALING | Genes involved in Interleukin receptor SHC signaling |
| 0.0 | 0.4 | REACTOME SIGNAL ATTENUATION | Genes involved in Signal attenuation |
| 0.0 | 0.2 | REACTOME REGULATION OF GENE EXPRESSION IN BETA CELLS | Genes involved in Regulation of gene expression in beta cells |
| 0.0 | 0.3 | REACTOME ABC FAMILY PROTEINS MEDIATED TRANSPORT | Genes involved in ABC-family proteins mediated transport |
| 0.0 | 0.4 | REACTOME NEPHRIN INTERACTIONS | Genes involved in Nephrin interactions |
| 0.0 | 0.7 | REACTOME TRAFFICKING OF AMPA RECEPTORS | Genes involved in Trafficking of AMPA receptors |
| 0.0 | 0.2 | REACTOME CTNNB1 PHOSPHORYLATION CASCADE | Genes involved in Beta-catenin phosphorylation cascade |
| 0.0 | 0.6 | REACTOME INTERACTION BETWEEN L1 AND ANKYRINS | Genes involved in Interaction between L1 and Ankyrins |
| 0.0 | 0.2 | REACTOME PRESYNAPTIC NICOTINIC ACETYLCHOLINE RECEPTORS | Genes involved in Presynaptic nicotinic acetylcholine receptors |
| 0.0 | 0.6 | REACTOME COLLAGEN FORMATION | Genes involved in Collagen formation |
| 0.0 | 0.2 | REACTOME PECAM1 INTERACTIONS | Genes involved in PECAM1 interactions |
| 0.0 | 0.2 | REACTOME TRAF6 MEDIATED IRF7 ACTIVATION | Genes involved in TRAF6 mediated IRF7 activation |
| 0.0 | 0.1 | REACTOME METABOLISM OF POLYAMINES | Genes involved in Metabolism of polyamines |
| 0.0 | 0.3 | REACTOME SIGNALING BY BMP | Genes involved in Signaling by BMP |
| 0.0 | 0.1 | REACTOME CYCLIN E ASSOCIATED EVENTS DURING G1 S TRANSITION | Genes involved in Cyclin E associated events during G1/S transition |
| 0.0 | 0.4 | REACTOME ASSOCIATION OF TRIC CCT WITH TARGET PROTEINS DURING BIOSYNTHESIS | Genes involved in Association of TriC/CCT with target proteins during biosynthesis |