Project
GSE58827: Dynamics of the Mouse Liver
Navigation
Downloads
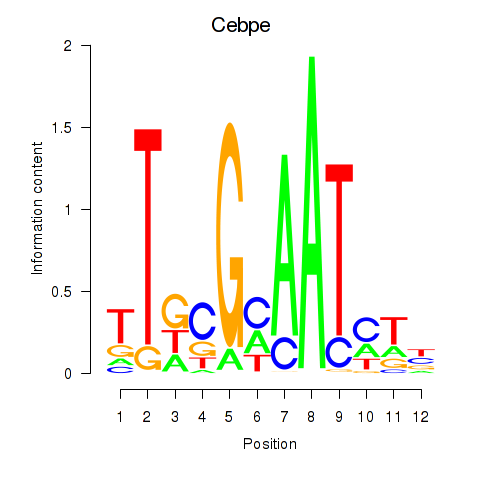
Results for Cebpe
Z-value: 3.65
Motif logo
Transcription factors associated with Cebpe
| Gene Symbol | Gene ID | Gene Info |
|---|---|---|
|
Cebpe
|
ENSMUSG00000052435.8 | CCAAT/enhancer binding protein (C/EBP), epsilon |
Activity-expression correlation:
| Gene | Promoter | Pearson corr. coef. | P-value | Plot |
|---|---|---|---|---|
| Cebpe | mm39_v1_chr14_-_54949596_54949631 | -0.79 | 9.1e-09 | Click! |
Activity profile of Cebpe motif
Sorted Z-values of Cebpe motif
| Promoter | Log-likelihood | Transcript | Gene | Gene Info |
|---|---|---|---|---|
| chr5_-_87240405 | 49.34 |
ENSMUST00000132667.2
ENSMUST00000145617.8 ENSMUST00000094649.11 |
Ugt2b36
|
UDP glucuronosyltransferase 2 family, polypeptide B36 |
| chr5_-_87485023 | 47.31 |
ENSMUST00000031195.3
|
Ugt2a3
|
UDP glucuronosyltransferase 2 family, polypeptide A3 |
| chr19_+_39275518 | 43.47 |
ENSMUST00000003137.15
|
Cyp2c29
|
cytochrome P450, family 2, subfamily c, polypeptide 29 |
| chr6_-_55152002 | 40.83 |
ENSMUST00000003569.6
|
Inmt
|
indolethylamine N-methyltransferase |
| chr5_-_87288177 | 39.41 |
ENSMUST00000067790.7
|
Ugt2b5
|
UDP glucuronosyltransferase 2 family, polypeptide B5 |
| chr4_-_60538151 | 36.04 |
ENSMUST00000098047.3
|
Mup10
|
major urinary protein 10 |
| chr4_-_60455331 | 34.82 |
ENSMUST00000135953.2
|
Mup1
|
major urinary protein 1 |
| chr4_-_60618357 | 34.37 |
ENSMUST00000084544.5
ENSMUST00000098046.10 |
Mup11
|
major urinary protein 11 |
| chr4_-_60377932 | 34.35 |
ENSMUST00000107506.9
ENSMUST00000122381.8 ENSMUST00000118759.8 ENSMUST00000132829.3 |
Mup9
|
major urinary protein 9 |
| chr4_-_61592331 | 32.11 |
ENSMUST00000098040.4
|
Mup18
|
major urinary protein 18 |
| chr1_-_139708906 | 30.64 |
ENSMUST00000111986.8
ENSMUST00000027612.11 ENSMUST00000111989.9 |
Cfhr4
|
complement factor H-related 4 |
| chr10_+_128089965 | 30.40 |
ENSMUST00000060782.5
ENSMUST00000218722.2 |
Apon
|
apolipoprotein N |
| chr15_+_9335636 | 28.47 |
ENSMUST00000072403.7
|
Ugt3a2
|
UDP glycosyltransferases 3 family, polypeptide A2 |
| chr19_+_39980868 | 27.59 |
ENSMUST00000049178.3
|
Cyp2c37
|
cytochrome P450, family 2. subfamily c, polypeptide 37 |
| chr4_-_60139857 | 26.45 |
ENSMUST00000107490.5
ENSMUST00000074700.9 |
Mup2
|
major urinary protein 2 |
| chr12_+_104304631 | 26.44 |
ENSMUST00000043058.5
ENSMUST00000101078.12 |
Serpina3k
Serpina3m
|
serine (or cysteine) peptidase inhibitor, clade A, member 3K serine (or cysteine) peptidase inhibitor, clade A, member 3M |
| chr13_+_4486105 | 26.43 |
ENSMUST00000156277.2
|
Akr1c6
|
aldo-keto reductase family 1, member C6 |
| chr5_-_87074380 | 25.36 |
ENSMUST00000031183.3
|
Ugt2b1
|
UDP glucuronosyltransferase 2 family, polypeptide B1 |
| chr4_-_107975701 | 25.02 |
ENSMUST00000149106.8
|
Scp2
|
sterol carrier protein 2, liver |
| chr1_+_87998487 | 24.92 |
ENSMUST00000073772.5
|
Ugt1a9
|
UDP glucuronosyltransferase 1 family, polypeptide A9 |
| chr4_-_61259997 | 23.67 |
ENSMUST00000071005.9
ENSMUST00000075206.12 |
Mup14
|
major urinary protein 14 |
| chr4_-_60222580 | 22.12 |
ENSMUST00000095058.5
ENSMUST00000163931.8 |
Mup8
|
major urinary protein 8 |
| chr4_-_61259801 | 21.82 |
ENSMUST00000125461.8
|
Mup14
|
major urinary protein 14 |
| chr3_-_98537568 | 21.12 |
ENSMUST00000044094.6
|
Hsd3b5
|
hydroxy-delta-5-steroid dehydrogenase, 3 beta- and steroid delta-isomerase 5 |
| chr19_-_39451509 | 20.65 |
ENSMUST00000035488.3
|
Cyp2c38
|
cytochrome P450, family 2, subfamily c, polypeptide 38 |
| chr5_-_87572060 | 20.20 |
ENSMUST00000072818.6
|
Ugt2b38
|
UDP glucuronosyltransferase 2 family, polypeptide B38 |
| chr4_-_60457902 | 20.11 |
ENSMUST00000084548.11
ENSMUST00000103012.10 ENSMUST00000107499.4 |
Mup1
|
major urinary protein 1 |
| chr14_+_40827317 | 18.92 |
ENSMUST00000047286.7
|
Mat1a
|
methionine adenosyltransferase I, alpha |
| chr15_+_6474808 | 18.52 |
ENSMUST00000022749.17
ENSMUST00000239466.2 |
C9
|
complement component 9 |
| chr7_+_13357892 | 18.23 |
ENSMUST00000108525.4
|
Sult2a5
|
sulfotransferase family 2A, dehydroepiandrosterone (DHEA)-preferring, member 5 |
| chr7_+_46401214 | 17.78 |
ENSMUST00000210769.2
ENSMUST00000210272.2 ENSMUST00000075982.4 |
Saa2
|
serum amyloid A 2 |
| chr8_-_72966663 | 17.47 |
ENSMUST00000098630.5
|
Cib3
|
calcium and integrin binding family member 3 |
| chr19_-_39637489 | 17.30 |
ENSMUST00000067328.7
|
Cyp2c67
|
cytochrome P450, family 2, subfamily c, polypeptide 67 |
| chr2_+_172994841 | 17.09 |
ENSMUST00000029017.6
|
Pck1
|
phosphoenolpyruvate carboxykinase 1, cytosolic |
| chr10_+_87694117 | 16.89 |
ENSMUST00000122386.8
|
Igf1
|
insulin-like growth factor 1 |
| chr2_+_121978156 | 16.78 |
ENSMUST00000102476.5
|
B2m
|
beta-2 microglobulin |
| chr13_-_24098981 | 16.42 |
ENSMUST00000110407.4
|
Slc17a4
|
solute carrier family 17 (sodium phosphate), member 4 |
| chr5_-_145946408 | 16.18 |
ENSMUST00000138870.2
ENSMUST00000068317.13 |
Cyp3a25
|
cytochrome P450, family 3, subfamily a, polypeptide 25 |
| chr7_+_51530060 | 15.58 |
ENSMUST00000145049.2
|
Gas2
|
growth arrest specific 2 |
| chr3_-_67422821 | 15.55 |
ENSMUST00000054825.5
|
Rarres1
|
retinoic acid receptor responder (tazarotene induced) 1 |
| chr9_-_71075939 | 15.41 |
ENSMUST00000113570.8
|
Aqp9
|
aquaporin 9 |
| chr19_-_20704896 | 15.37 |
ENSMUST00000025656.4
|
Aldh1a7
|
aldehyde dehydrogenase family 1, subfamily A7 |
| chr6_-_141801897 | 15.24 |
ENSMUST00000165990.8
|
Slco1a4
|
solute carrier organic anion transporter family, member 1a4 |
| chr13_-_24098951 | 15.04 |
ENSMUST00000021769.16
|
Slc17a4
|
solute carrier family 17 (sodium phosphate), member 4 |
| chr4_-_107975723 | 14.76 |
ENSMUST00000030340.15
|
Scp2
|
sterol carrier protein 2, liver |
| chr1_+_88093726 | 14.70 |
ENSMUST00000097659.5
|
Ugt1a5
|
UDP glucuronosyltransferase 1 family, polypeptide A5 |
| chr6_-_128503666 | 14.60 |
ENSMUST00000143664.2
ENSMUST00000112132.8 |
Pzp
|
PZP, alpha-2-macroglobulin like |
| chr14_+_40826970 | 14.47 |
ENSMUST00000225720.2
|
Mat1a
|
methionine adenosyltransferase I, alpha |
| chr15_+_4756657 | 14.38 |
ENSMUST00000162585.8
|
C6
|
complement component 6 |
| chr2_+_43445333 | 14.36 |
ENSMUST00000028223.9
ENSMUST00000112826.8 |
Kynu
|
kynureninase |
| chr19_-_8382424 | 14.14 |
ENSMUST00000064507.12
ENSMUST00000120540.2 ENSMUST00000096269.11 |
Slc22a30
|
solute carrier family 22, member 30 |
| chr15_+_4756684 | 13.99 |
ENSMUST00000161997.8
ENSMUST00000022788.15 |
C6
|
complement component 6 |
| chr7_+_119125426 | 13.85 |
ENSMUST00000066465.3
|
Acsm5
|
acyl-CoA synthetase medium-chain family member 5 |
| chr7_+_119125443 | 13.59 |
ENSMUST00000207440.2
|
Acsm5
|
acyl-CoA synthetase medium-chain family member 5 |
| chr19_+_38995463 | 13.43 |
ENSMUST00000025966.5
|
Cyp2c55
|
cytochrome P450, family 2, subfamily c, polypeptide 55 |
| chr14_+_40827108 | 13.37 |
ENSMUST00000224514.2
|
Mat1a
|
methionine adenosyltransferase I, alpha |
| chr7_-_132178101 | 13.31 |
ENSMUST00000084500.8
|
Oat
|
ornithine aminotransferase |
| chr14_+_66208498 | 13.24 |
ENSMUST00000128539.8
|
Clu
|
clusterin |
| chr4_+_115268821 | 12.96 |
ENSMUST00000094887.4
|
Cyp4a12b
|
cytochrome P450, family 4, subfamily a, polypeptide 12B |
| chr5_+_8010445 | 12.95 |
ENSMUST00000115421.3
|
Steap4
|
STEAP family member 4 |
| chr4_-_62069046 | 12.81 |
ENSMUST00000077719.4
|
Mup21
|
major urinary protein 21 |
| chr19_-_8109346 | 12.80 |
ENSMUST00000065651.5
|
Slc22a28
|
solute carrier family 22, member 28 |
| chr15_+_9279915 | 12.72 |
ENSMUST00000022861.9
|
Ugt3a1
|
UDP glycosyltransferases 3 family, polypeptide A1 |
| chr19_-_7779943 | 12.68 |
ENSMUST00000120522.8
|
Slc22a26
|
solute carrier family 22 (organic cation transporter), member 26 |
| chr3_-_137945419 | 12.62 |
ENSMUST00000199804.3
ENSMUST00000185122.8 ENSMUST00000183783.8 |
4930579F01Rik
0610031O16Rik
|
RIKEN cDNA 4930579F01 gene RIKEN cDNA 0610031O16 gene |
| chr17_-_57535003 | 12.56 |
ENSMUST00000177046.2
ENSMUST00000024988.15 |
C3
|
complement component 3 |
| chr19_-_40175709 | 12.33 |
ENSMUST00000051846.13
|
Cyp2c70
|
cytochrome P450, family 2, subfamily c, polypeptide 70 |
| chr2_+_43445359 | 11.80 |
ENSMUST00000050511.7
|
Kynu
|
kynureninase |
| chr7_+_119125546 | 11.73 |
ENSMUST00000207387.2
ENSMUST00000207813.2 |
Acsm5
|
acyl-CoA synthetase medium-chain family member 5 |
| chr4_-_96552349 | 11.65 |
ENSMUST00000030299.8
|
Cyp2j5
|
cytochrome P450, family 2, subfamily j, polypeptide 5 |
| chr6_-_141892686 | 11.55 |
ENSMUST00000042119.6
|
Slco1a1
|
solute carrier organic anion transporter family, member 1a1 |
| chr6_-_141801918 | 11.45 |
ENSMUST00000163678.2
|
Slco1a4
|
solute carrier organic anion transporter family, member 1a4 |
| chr19_-_7943365 | 11.42 |
ENSMUST00000182102.8
ENSMUST00000075619.5 |
Slc22a27
|
solute carrier family 22, member 27 |
| chr10_-_115198093 | 11.21 |
ENSMUST00000219890.2
ENSMUST00000218731.2 ENSMUST00000217887.2 ENSMUST00000092170.7 |
Tmem19
|
transmembrane protein 19 |
| chr7_-_25176959 | 11.20 |
ENSMUST00000098668.3
ENSMUST00000206687.2 ENSMUST00000206676.2 ENSMUST00000205308.2 ENSMUST00000098669.8 ENSMUST00000206171.2 ENSMUST00000098666.9 |
Ceacam1
|
carcinoembryonic antigen-related cell adhesion molecule 1 |
| chr1_-_139786421 | 11.19 |
ENSMUST00000194186.6
ENSMUST00000094489.5 ENSMUST00000239380.2 |
Cfhr2
|
complement factor H-related 2 |
| chr16_+_22769822 | 10.74 |
ENSMUST00000023590.9
|
Hrg
|
histidine-rich glycoprotein |
| chr6_-_141892517 | 10.74 |
ENSMUST00000168119.8
|
Slco1a1
|
solute carrier organic anion transporter family, member 1a1 |
| chr1_-_162812087 | 10.40 |
ENSMUST00000028010.9
|
Fmo3
|
flavin containing monooxygenase 3 |
| chr16_+_22769844 | 10.31 |
ENSMUST00000232422.2
|
Hrg
|
histidine-rich glycoprotein |
| chr9_+_119170360 | 10.18 |
ENSMUST00000039784.12
|
Acaa1a
|
acetyl-Coenzyme A acyltransferase 1A |
| chr3_+_59939175 | 10.12 |
ENSMUST00000029325.5
|
Aadac
|
arylacetamide deacetylase |
| chr11_+_101932328 | 10.09 |
ENSMUST00000123895.8
ENSMUST00000017453.12 ENSMUST00000107163.9 ENSMUST00000107164.3 |
Cd300lg
|
CD300 molecule like family member G |
| chr1_-_180027151 | 10.06 |
ENSMUST00000161743.3
|
Coq8a
|
coenzyme Q8A |
| chr8_-_72966840 | 10.00 |
ENSMUST00000238973.2
|
Cib3
|
calcium and integrin binding family member 3 |
| chr12_+_8062331 | 9.96 |
ENSMUST00000171239.2
|
Apob
|
apolipoprotein B |
| chr16_+_37400590 | 9.93 |
ENSMUST00000159787.8
|
Hgd
|
homogentisate 1, 2-dioxygenase |
| chr15_-_76191301 | 9.81 |
ENSMUST00000171340.9
ENSMUST00000023222.13 ENSMUST00000164189.2 |
Oplah
|
5-oxoprolinase (ATP-hydrolysing) |
| chr17_-_35081129 | 9.78 |
ENSMUST00000154526.8
|
Cfb
|
complement factor B |
| chr17_-_35081456 | 9.75 |
ENSMUST00000025229.11
ENSMUST00000176203.9 ENSMUST00000128767.8 |
Cfb
|
complement factor B |
| chr8_+_105858432 | 9.74 |
ENSMUST00000161289.2
|
Ces4a
|
carboxylesterase 4A |
| chr3_+_20039775 | 9.73 |
ENSMUST00000172860.2
|
Cp
|
ceruloplasmin |
| chr11_+_75358866 | 9.54 |
ENSMUST00000043598.14
ENSMUST00000108435.2 |
Tlcd2
|
TLC domain containing 2 |
| chr10_-_24803336 | 9.52 |
ENSMUST00000020161.10
|
Arg1
|
arginase, liver |
| chr18_+_21077627 | 9.49 |
ENSMUST00000050004.3
|
Rnf125
|
ring finger protein 125 |
| chr5_-_116560916 | 9.46 |
ENSMUST00000036991.5
|
Hspb8
|
heat shock protein 8 |
| chr16_+_37400500 | 9.35 |
ENSMUST00000160847.2
|
Hgd
|
homogentisate 1, 2-dioxygenase |
| chr7_+_67297152 | 9.05 |
ENSMUST00000032774.16
ENSMUST00000107471.8 |
Ttc23
|
tetratricopeptide repeat domain 23 |
| chr5_-_87402659 | 9.01 |
ENSMUST00000075858.4
|
Ugt2b37
|
UDP glucuronosyltransferase 2 family, polypeptide B37 |
| chr14_+_66208059 | 8.97 |
ENSMUST00000127387.8
|
Clu
|
clusterin |
| chr3_-_63872079 | 8.97 |
ENSMUST00000161659.8
|
Slc33a1
|
solute carrier family 33 (acetyl-CoA transporter), member 1 |
| chr16_+_22738987 | 8.87 |
ENSMUST00000023587.12
|
Fetub
|
fetuin beta |
| chr1_-_121260298 | 8.75 |
ENSMUST00000071064.13
|
Insig2
|
insulin induced gene 2 |
| chr1_+_21310803 | 8.70 |
ENSMUST00000027067.15
|
Gsta3
|
glutathione S-transferase, alpha 3 |
| chr9_-_15212849 | 8.66 |
ENSMUST00000034414.10
|
4931406C07Rik
|
RIKEN cDNA 4931406C07 gene |
| chr10_+_21253190 | 8.46 |
ENSMUST00000042699.14
|
Aldh8a1
|
aldehyde dehydrogenase 8 family, member A1 |
| chr1_+_21310821 | 8.45 |
ENSMUST00000121676.8
ENSMUST00000124990.3 |
Gsta3
|
glutathione S-transferase, alpha 3 |
| chr9_+_119170486 | 8.35 |
ENSMUST00000175743.8
ENSMUST00000176397.8 |
Acaa1a
|
acetyl-Coenzyme A acyltransferase 1A |
| chr7_-_25239229 | 8.23 |
ENSMUST00000044547.10
ENSMUST00000066503.14 ENSMUST00000064862.13 |
Ceacam2
|
carcinoembryonic antigen-related cell adhesion molecule 2 |
| chr5_-_147831610 | 8.17 |
ENSMUST00000118527.8
ENSMUST00000031655.4 ENSMUST00000138244.2 |
Slc46a3
|
solute carrier family 46, member 3 |
| chr15_-_96947963 | 7.89 |
ENSMUST00000230907.2
|
Slc38a4
|
solute carrier family 38, member 4 |
| chr13_+_55862437 | 7.87 |
ENSMUST00000021959.11
|
Txndc15
|
thioredoxin domain containing 15 |
| chr14_+_66208613 | 7.57 |
ENSMUST00000144619.2
|
Clu
|
clusterin |
| chr7_+_51537645 | 7.56 |
ENSMUST00000208711.2
|
Gas2
|
growth arrest specific 2 |
| chr6_+_133082202 | 7.51 |
ENSMUST00000191462.2
|
Smim10l1
|
small integral membrane protein 10 like 1 |
| chr9_+_78197205 | 7.43 |
ENSMUST00000119823.8
ENSMUST00000121273.2 |
Gsta5
|
glutathione S-transferase alpha 5 |
| chr8_-_41668182 | 7.36 |
ENSMUST00000034003.5
|
Fgl1
|
fibrinogen-like protein 1 |
| chr17_-_35100980 | 7.29 |
ENSMUST00000152417.8
ENSMUST00000146299.8 |
C2
Gm20547
|
complement component 2 (within H-2S) predicted gene 20547 |
| chr7_-_126873219 | 7.25 |
ENSMUST00000082428.6
|
Sephs2
|
selenophosphate synthetase 2 |
| chr10_+_62756409 | 7.24 |
ENSMUST00000044977.10
|
Slc25a16
|
solute carrier family 25 (mitochondrial carrier, Graves disease autoantigen), member 16 |
| chr17_-_13159204 | 7.20 |
ENSMUST00000043923.12
|
Acat3
|
acetyl-Coenzyme A acetyltransferase 3 |
| chr17_-_59320257 | 7.19 |
ENSMUST00000174122.2
ENSMUST00000025065.12 |
Nudt12
|
nudix (nucleoside diphosphate linked moiety X)-type motif 12 |
| chr11_-_21521934 | 7.12 |
ENSMUST00000239073.2
|
Mdh1
|
malate dehydrogenase 1, NAD (soluble) |
| chr5_+_87148697 | 7.06 |
ENSMUST00000031186.9
|
Ugt2b35
|
UDP glucuronosyltransferase 2 family, polypeptide B35 |
| chr9_+_114560235 | 7.06 |
ENSMUST00000035007.10
|
Cmtm6
|
CKLF-like MARVEL transmembrane domain containing 6 |
| chr7_+_65511482 | 7.01 |
ENSMUST00000176199.8
|
Pcsk6
|
proprotein convertase subtilisin/kexin type 6 |
| chr9_+_74860133 | 6.99 |
ENSMUST00000215370.2
|
Fam214a
|
family with sequence similarity 214, member A |
| chr1_+_88022776 | 6.99 |
ENSMUST00000150634.8
ENSMUST00000058237.14 |
Ugt1a7c
|
UDP glucuronosyltransferase 1 family, polypeptide A7C |
| chr9_-_65815958 | 6.95 |
ENSMUST00000119245.8
ENSMUST00000134338.8 ENSMUST00000179395.8 |
Trip4
|
thyroid hormone receptor interactor 4 |
| chr1_-_13730732 | 6.90 |
ENSMUST00000027071.7
|
Lactb2
|
lactamase, beta 2 |
| chr9_+_103940575 | 6.90 |
ENSMUST00000120854.8
|
Acad11
|
acyl-Coenzyme A dehydrogenase family, member 11 |
| chr13_+_4283729 | 6.83 |
ENSMUST00000081326.7
|
Akr1c19
|
aldo-keto reductase family 1, member C19 |
| chr10_-_24712034 | 6.83 |
ENSMUST00000218044.2
ENSMUST00000020169.9 |
Enpp3
|
ectonucleotide pyrophosphatase/phosphodiesterase 3 |
| chr7_+_26508305 | 6.80 |
ENSMUST00000040944.9
|
Cyp2g1
|
cytochrome P450, family 2, subfamily g, polypeptide 1 |
| chr5_+_90708962 | 6.79 |
ENSMUST00000094615.8
ENSMUST00000200765.2 |
Albfm1
|
albumin superfamily member 1 |
| chr8_+_35842872 | 6.76 |
ENSMUST00000210337.2
ENSMUST00000070481.8 ENSMUST00000211648.2 |
Ppp1r3b
|
protein phosphatase 1, regulatory subunit 3B |
| chr17_+_80434874 | 6.76 |
ENSMUST00000039205.11
|
Galm
|
galactose mutarotase |
| chr15_+_54975713 | 6.74 |
ENSMUST00000096433.10
|
Deptor
|
DEP domain containing MTOR-interacting protein |
| chr9_-_44714263 | 6.70 |
ENSMUST00000044694.8
|
Ttc36
|
tetratricopeptide repeat domain 36 |
| chr15_+_7120089 | 6.64 |
ENSMUST00000228723.2
|
Lifr
|
LIF receptor alpha |
| chr17_-_35101069 | 6.60 |
ENSMUST00000025230.15
|
C2
|
complement component 2 (within H-2S) |
| chr3_+_89366425 | 6.56 |
ENSMUST00000029564.12
|
Pmvk
|
phosphomevalonate kinase |
| chr14_-_45715308 | 6.55 |
ENSMUST00000141424.2
|
Fermt2
|
fermitin family member 2 |
| chr1_-_121260274 | 6.48 |
ENSMUST00000161068.2
|
Insig2
|
insulin induced gene 2 |
| chr1_-_140111138 | 6.46 |
ENSMUST00000111976.9
ENSMUST00000066859.13 |
Cfh
|
complement component factor h |
| chr11_-_109986763 | 6.41 |
ENSMUST00000046223.14
ENSMUST00000106664.10 ENSMUST00000106662.2 |
Abca8a
|
ATP-binding cassette, sub-family A (ABC1), member 8a |
| chr5_-_87054796 | 6.40 |
ENSMUST00000031181.16
ENSMUST00000113333.2 |
Ugt2b34
|
UDP glucuronosyltransferase 2 family, polypeptide B34 |
| chr7_+_67305162 | 6.34 |
ENSMUST00000107470.2
|
Ttc23
|
tetratricopeptide repeat domain 23 |
| chr3_+_20011251 | 6.33 |
ENSMUST00000108328.8
|
Cp
|
ceruloplasmin |
| chr5_+_21391282 | 6.31 |
ENSMUST00000036031.13
ENSMUST00000198937.2 |
Gsap
|
gamma-secretase activating protein |
| chr2_-_60114684 | 6.29 |
ENSMUST00000028356.9
ENSMUST00000074606.11 |
Cd302
|
CD302 antigen |
| chr2_-_86180622 | 6.27 |
ENSMUST00000099894.5
ENSMUST00000213564.3 |
Olfr1055
|
olfactory receptor 1055 |
| chr3_+_20011201 | 6.27 |
ENSMUST00000091309.12
ENSMUST00000108329.8 ENSMUST00000003714.13 |
Cp
|
ceruloplasmin |
| chr3_-_129126362 | 6.26 |
ENSMUST00000029658.14
|
Enpep
|
glutamyl aminopeptidase |
| chr3_-_95811993 | 6.24 |
ENSMUST00000147962.3
ENSMUST00000036181.15 |
Car14
|
carbonic anhydrase 14 |
| chr17_+_79922486 | 6.23 |
ENSMUST00000225357.2
|
Rmdn2
|
regulator of microtubule dynamics 2 |
| chr1_-_140111018 | 6.12 |
ENSMUST00000192880.6
ENSMUST00000111977.8 |
Cfh
|
complement component factor h |
| chr1_-_39616445 | 6.04 |
ENSMUST00000062525.11
|
Rnf149
|
ring finger protein 149 |
| chr11_-_95966407 | 6.04 |
ENSMUST00000107686.8
ENSMUST00000107684.2 |
Atp5g1
|
ATP synthase, H+ transporting, mitochondrial F0 complex, subunit C1 (subunit 9) |
| chr9_+_103940879 | 6.01 |
ENSMUST00000047799.13
ENSMUST00000189998.3 |
Acad11
|
acyl-Coenzyme A dehydrogenase family, member 11 |
| chr8_+_105318067 | 5.96 |
ENSMUST00000059588.8
|
Pdp2
|
pyruvate dehyrogenase phosphatase catalytic subunit 2 |
| chr7_-_13571334 | 5.92 |
ENSMUST00000108522.5
|
Sult2a1
|
sulfotransferase family 2A, dehydroepiandrosterone (DHEA)-preferring, member 1 |
| chr5_-_135773047 | 5.82 |
ENSMUST00000153399.2
|
Tmem120a
|
transmembrane protein 120A |
| chr2_+_120807498 | 5.81 |
ENSMUST00000067582.14
|
Tmem62
|
transmembrane protein 62 |
| chr2_-_69172944 | 5.79 |
ENSMUST00000102709.8
ENSMUST00000102710.10 ENSMUST00000180142.2 |
Abcb11
|
ATP-binding cassette, sub-family B (MDR/TAP), member 11 |
| chr6_+_121709891 | 5.77 |
ENSMUST00000204124.2
|
Gm7298
|
predicted gene 7298 |
| chr2_-_32314017 | 5.71 |
ENSMUST00000113307.9
|
Slc25a25
|
solute carrier family 25 (mitochondrial carrier, phosphate carrier), member 25 |
| chr10_-_128425519 | 5.70 |
ENSMUST00000082059.7
|
Erbb3
|
erb-b2 receptor tyrosine kinase 3 |
| chr6_+_54246120 | 5.69 |
ENSMUST00000114401.8
|
Chn2
|
chimerin 2 |
| chr6_+_149043011 | 5.69 |
ENSMUST00000179873.8
ENSMUST00000047531.16 ENSMUST00000111548.8 ENSMUST00000111547.2 ENSMUST00000134306.8 ENSMUST00000147934.4 |
Etfbkmt
|
electron transfer flavoprotein beta subunit lysine methyltransferase |
| chr11_-_59937302 | 5.69 |
ENSMUST00000000310.14
ENSMUST00000102693.9 ENSMUST00000148512.2 |
Pemt
|
phosphatidylethanolamine N-methyltransferase |
| chr11_+_105956867 | 5.67 |
ENSMUST00000002048.8
|
Taco1
|
translational activator of mitochondrially encoded cytochrome c oxidase I |
| chr13_+_24511387 | 5.67 |
ENSMUST00000224953.2
ENSMUST00000050859.13 ENSMUST00000167746.8 ENSMUST00000224819.2 |
Cmah
|
cytidine monophospho-N-acetylneuraminic acid hydroxylase |
| chr12_-_81014849 | 5.67 |
ENSMUST00000095572.5
|
Slc10a1
|
solute carrier family 10 (sodium/bile acid cotransporter family), member 1 |
| chr12_-_81531847 | 5.64 |
ENSMUST00000166723.8
ENSMUST00000110340.9 ENSMUST00000168463.8 ENSMUST00000169124.2 ENSMUST00000002757.11 |
Cox16
|
cytochrome c oxidase assembly protein 16 |
| chr1_+_171041583 | 5.58 |
ENSMUST00000111328.8
|
Nr1i3
|
nuclear receptor subfamily 1, group I, member 3 |
| chr11_-_77784922 | 5.57 |
ENSMUST00000017597.5
|
Pipox
|
pipecolic acid oxidase |
| chr3_-_63872189 | 5.55 |
ENSMUST00000029402.15
|
Slc33a1
|
solute carrier family 33 (acetyl-CoA transporter), member 1 |
| chr18_+_84869456 | 5.52 |
ENSMUST00000160180.9
|
Cyb5a
|
cytochrome b5 type A (microsomal) |
| chr9_-_54467419 | 5.52 |
ENSMUST00000041901.7
|
Cib2
|
calcium and integrin binding family member 2 |
| chr11_-_11848107 | 5.51 |
ENSMUST00000178704.8
|
Ddc
|
dopa decarboxylase |
| chr11_-_11848044 | 5.45 |
ENSMUST00000066237.10
|
Ddc
|
dopa decarboxylase |
| chr19_+_39499288 | 5.44 |
ENSMUST00000025968.5
|
Cyp2c39
|
cytochrome P450, family 2, subfamily c, polypeptide 39 |
| chr14_+_66872699 | 5.42 |
ENSMUST00000159365.8
ENSMUST00000054661.8 ENSMUST00000225182.2 ENSMUST00000159068.2 |
Adra1a
|
adrenergic receptor, alpha 1a |
| chr3_+_20011405 | 5.39 |
ENSMUST00000108325.9
|
Cp
|
ceruloplasmin |
| chr1_+_171041539 | 5.38 |
ENSMUST00000005820.11
ENSMUST00000075469.12 ENSMUST00000155126.8 |
Nr1i3
|
nuclear receptor subfamily 1, group I, member 3 |
| chr13_+_3684032 | 5.36 |
ENSMUST00000042288.8
|
Asb13
|
ankyrin repeat and SOCS box-containing 13 |
| chr19_-_6134703 | 5.29 |
ENSMUST00000161548.8
|
Zfpl1
|
zinc finger like protein 1 |
| chr15_+_31224616 | 5.27 |
ENSMUST00000186547.7
|
Dap
|
death-associated protein |
| chr15_+_3300249 | 5.25 |
ENSMUST00000082424.12
ENSMUST00000159158.9 ENSMUST00000159216.10 ENSMUST00000160311.3 |
Selenop
|
selenoprotein P |
| chr3_-_107952146 | 5.24 |
ENSMUST00000178808.8
ENSMUST00000106670.2 ENSMUST00000029489.15 |
Gstm4
|
glutathione S-transferase, mu 4 |
| chr11_-_95966477 | 5.23 |
ENSMUST00000090541.12
|
Atp5g1
|
ATP synthase, H+ transporting, mitochondrial F0 complex, subunit C1 (subunit 9) |
| chr10_+_62756426 | 5.19 |
ENSMUST00000144459.2
|
Slc25a16
|
solute carrier family 25 (mitochondrial carrier, Graves disease autoantigen), member 16 |
| chr15_+_99290763 | 5.17 |
ENSMUST00000023749.15
|
Tmbim6
|
transmembrane BAX inhibitor motif containing 6 |
| chr8_+_45522174 | 5.17 |
ENSMUST00000067984.9
|
Mtnr1a
|
melatonin receptor 1A |
| chr2_-_75768752 | 5.16 |
ENSMUST00000099996.5
|
Ttc30b
|
tetratricopeptide repeat domain 30B |
| chr1_+_16758629 | 5.13 |
ENSMUST00000026881.11
|
Ly96
|
lymphocyte antigen 96 |
| chr18_-_62044871 | 5.11 |
ENSMUST00000166783.3
ENSMUST00000049378.15 |
Ablim3
|
actin binding LIM protein family, member 3 |
| chr6_+_17463748 | 5.11 |
ENSMUST00000115443.8
|
Met
|
met proto-oncogene |
| chr16_+_19916292 | 5.08 |
ENSMUST00000023509.5
ENSMUST00000232088.2 ENSMUST00000231842.2 |
Klhl24
|
kelch-like 24 |
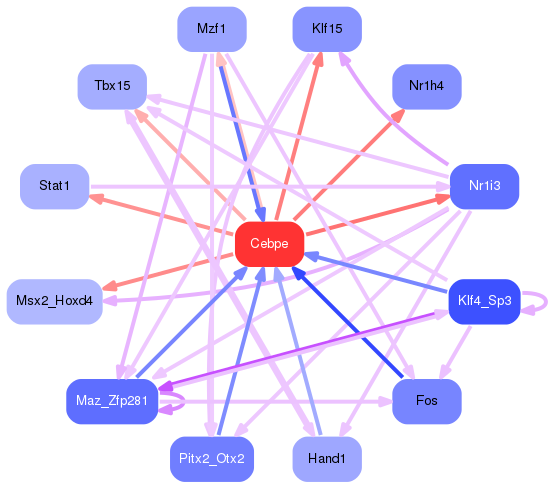
Network of associatons between targets according to the STRING database.

First level regulatory network of Cebpe
Gene Ontology Analysis
Gene overrepresentation in biological process category:
| Log-likelihood per target | Total log-likelihood | Term | Description |
|---|---|---|---|
| 15.6 | 46.8 | GO:0009087 | methionine catabolic process(GO:0009087) |
| 10.2 | 40.9 | GO:0001970 | positive regulation of activation of membrane attack complex(GO:0001970) |
| 9.9 | 39.8 | GO:1901373 | positive regulation of intracellular lipid transport(GO:0032379) positive regulation of intracellular sterol transport(GO:0032382) positive regulation of intracellular cholesterol transport(GO:0032385) lipid hydroperoxide transport(GO:1901373) |
| 8.8 | 26.4 | GO:0009753 | response to jasmonic acid(GO:0009753) cellular response to jasmonic acid stimulus(GO:0071395) |
| 8.7 | 26.2 | GO:0019442 | tryptophan catabolic process to acetyl-CoA(GO:0019442) |
| 8.5 | 25.4 | GO:0018879 | biphenyl metabolic process(GO:0018879) |
| 7.4 | 89.3 | GO:0071394 | cellular response to testosterone stimulus(GO:0071394) |
| 7.2 | 21.5 | GO:0034758 | positive regulation of iron ion transport(GO:0034758) positive regulation of iron ion transmembrane transport(GO:0034761) regulation of iron ion import(GO:1900390) regulation of ferrous iron import into cell(GO:1903989) positive regulation of ferrous iron import into cell(GO:1903991) regulation of ferrous iron binding(GO:1904432) positive regulation of ferrous iron binding(GO:1904434) regulation of transferrin receptor binding(GO:1904435) positive regulation of transferrin receptor binding(GO:1904437) regulation of ferrous iron import across plasma membrane(GO:1904438) positive regulation of ferrous iron import across plasma membrane(GO:1904440) |
| 7.0 | 21.1 | GO:0097037 | heme export(GO:0097037) |
| 6.7 | 93.4 | GO:0052695 | cellular glucuronidation(GO:0052695) |
| 5.8 | 11.6 | GO:2000863 | positive regulation of estrogen secretion(GO:2000863) |
| 5.7 | 17.2 | GO:0046223 | mycotoxin catabolic process(GO:0043387) aflatoxin catabolic process(GO:0046223) organic heteropentacyclic compound catabolic process(GO:1901377) |
| 5.0 | 29.8 | GO:1902998 | regulation of neuronal signal transduction(GO:1902847) positive regulation of neurofibrillary tangle assembly(GO:1902998) |
| 4.6 | 152.6 | GO:0019373 | epoxygenase P450 pathway(GO:0019373) |
| 4.3 | 17.1 | GO:0006114 | glycerol biosynthetic process(GO:0006114) positive regulation of transcription from RNA polymerase II promoter in response to acidic pH(GO:0061402) |
| 3.9 | 15.4 | GO:0015851 | nucleobase transport(GO:0015851) pyrimidine nucleobase transport(GO:0015855) |
| 3.7 | 112.4 | GO:0080184 | response to phenylpropanoid(GO:0080184) |
| 3.7 | 11.2 | GO:0070237 | positive regulation of activation-induced cell death of T cells(GO:0070237) |
| 3.7 | 11.1 | GO:0046491 | L-methylmalonyl-CoA metabolic process(GO:0046491) |
| 3.4 | 10.2 | GO:0034240 | negative regulation of macrophage fusion(GO:0034240) |
| 3.4 | 51.0 | GO:0015747 | urate transport(GO:0015747) |
| 3.4 | 50.6 | GO:0006957 | complement activation, alternative pathway(GO:0006957) |
| 3.4 | 10.1 | GO:0002414 | immunoglobulin transcytosis in epithelial cells(GO:0002414) |
| 3.3 | 13.3 | GO:0019287 | isopentenyl diphosphate biosynthetic process, mevalonate pathway(GO:0019287) |
| 3.1 | 9.4 | GO:1904736 | negative regulation of electron carrier activity(GO:1904733) regulation of fatty acid beta-oxidation using acyl-CoA dehydrogenase(GO:1904735) negative regulation of fatty acid beta-oxidation using acyl-CoA dehydrogenase(GO:1904736) |
| 2.4 | 16.9 | GO:1904073 | regulation of trophectodermal cell proliferation(GO:1904073) positive regulation of trophectodermal cell proliferation(GO:1904075) |
| 2.1 | 19.3 | GO:0006572 | tyrosine catabolic process(GO:0006572) |
| 2.1 | 4.1 | GO:0051795 | positive regulation of catagen(GO:0051795) |
| 2.0 | 4.0 | GO:0003330 | regulation of extracellular matrix constituent secretion(GO:0003330) positive regulation of extracellular matrix constituent secretion(GO:0003331) |
| 2.0 | 15.7 | GO:0001887 | selenium compound metabolic process(GO:0001887) |
| 1.9 | 9.5 | GO:0090467 | regulation of amino acid import(GO:0010958) L-arginine import(GO:0043091) arginine import(GO:0090467) |
| 1.9 | 5.6 | GO:0006553 | lysine metabolic process(GO:0006553) |
| 1.8 | 16.5 | GO:0034214 | protein hexamerization(GO:0034214) |
| 1.8 | 9.1 | GO:0032497 | detection of lipopolysaccharide(GO:0032497) |
| 1.8 | 5.4 | GO:0001983 | baroreceptor response to increased systemic arterial blood pressure(GO:0001983) |
| 1.8 | 1.8 | GO:0060025 | regulation of synaptic activity(GO:0060025) |
| 1.7 | 6.8 | GO:0009609 | response to symbiont(GO:0009608) response to symbiotic bacterium(GO:0009609) response to selenium ion(GO:0010269) |
| 1.7 | 6.8 | GO:0033499 | galactose catabolic process via UDP-galactose(GO:0033499) |
| 1.7 | 5.0 | GO:0046967 | cytosol to ER transport(GO:0046967) |
| 1.6 | 4.7 | GO:0018199 | peptidyl-glutamine modification(GO:0018199) |
| 1.6 | 11.0 | GO:0015842 | aminergic neurotransmitter loading into synaptic vesicle(GO:0015842) |
| 1.5 | 15.1 | GO:0010886 | positive regulation of cholesterol storage(GO:0010886) |
| 1.4 | 10.1 | GO:2000427 | positive regulation of apoptotic cell clearance(GO:2000427) |
| 1.3 | 8.1 | GO:0015889 | cobalamin transport(GO:0015889) |
| 1.3 | 3.9 | GO:0046294 | formaldehyde catabolic process(GO:0046294) |
| 1.3 | 13.0 | GO:0033216 | ferric iron import(GO:0033216) ferric iron import into cell(GO:0097461) ferric iron import across plasma membrane(GO:0098706) |
| 1.3 | 5.1 | GO:2000312 | regulation of kainate selective glutamate receptor activity(GO:2000312) |
| 1.3 | 5.1 | GO:0038183 | histone H3-R17 methylation(GO:0034971) bile acid signaling pathway(GO:0038183) |
| 1.2 | 8.6 | GO:0045716 | positive regulation of low-density lipoprotein particle receptor biosynthetic process(GO:0045716) |
| 1.2 | 7.0 | GO:0032902 | nerve growth factor production(GO:0032902) |
| 1.2 | 5.8 | GO:0046618 | drug export(GO:0046618) |
| 1.1 | 7.8 | GO:0070494 | regulation of thrombin receptor signaling pathway(GO:0070494) negative regulation of thrombin receptor signaling pathway(GO:0070495) |
| 1.1 | 3.3 | GO:0000715 | nucleotide-excision repair, DNA damage recognition(GO:0000715) |
| 1.1 | 5.4 | GO:0006880 | intracellular sequestering of iron ion(GO:0006880) sequestering of iron ion(GO:0097577) |
| 1.1 | 3.2 | GO:0042231 | interleukin-13 biosynthetic process(GO:0042231) |
| 1.0 | 4.2 | GO:0016237 | lysosomal microautophagy(GO:0016237) piecemeal microautophagy of nucleus(GO:0034727) suppression by virus of host autophagy(GO:0039521) amino acid homeostasis(GO:0080144) negative regulation of sphingolipid biosynthesis involved in cellular sphingolipid homeostasis(GO:0090157) |
| 1.0 | 5.2 | GO:1904720 | regulation of mRNA cleavage(GO:0031437) negative regulation of mRNA cleavage(GO:0031438) regulation of mRNA endonucleolytic cleavage involved in unfolded protein response(GO:1904720) negative regulation of mRNA endonucleolytic cleavage involved in unfolded protein response(GO:1904721) |
| 1.0 | 2.9 | GO:0090649 | rRNA export from nucleus(GO:0006407) response to oxygen-glucose deprivation(GO:0090649) cellular response to oxygen-glucose deprivation(GO:0090650) |
| 1.0 | 27.9 | GO:0006825 | copper ion transport(GO:0006825) |
| 0.9 | 6.6 | GO:0048861 | oncostatin-M-mediated signaling pathway(GO:0038165) leukemia inhibitory factor signaling pathway(GO:0048861) |
| 0.9 | 12.3 | GO:0010898 | positive regulation of triglyceride catabolic process(GO:0010898) |
| 0.9 | 8.5 | GO:0042905 | 9-cis-retinoic acid biosynthetic process(GO:0042904) 9-cis-retinoic acid metabolic process(GO:0042905) |
| 0.9 | 15.2 | GO:0060363 | cranial suture morphogenesis(GO:0060363) |
| 0.9 | 5.4 | GO:0034975 | protein folding in endoplasmic reticulum(GO:0034975) |
| 0.9 | 4.4 | GO:1903215 | negative regulation of protein targeting to mitochondrion(GO:1903215) |
| 0.9 | 26.7 | GO:0043252 | sodium-independent organic anion transport(GO:0043252) |
| 0.9 | 4.3 | GO:0035752 | lysosomal lumen pH elevation(GO:0035752) |
| 0.8 | 8.5 | GO:0001514 | selenocysteine incorporation(GO:0001514) translational readthrough(GO:0006451) |
| 0.8 | 11.0 | GO:2001199 | negative regulation of dendritic cell differentiation(GO:2001199) |
| 0.8 | 7.6 | GO:0045657 | positive regulation of monocyte differentiation(GO:0045657) |
| 0.8 | 3.3 | GO:0009106 | lipoate metabolic process(GO:0009106) |
| 0.8 | 8.2 | GO:0070345 | negative regulation of fat cell proliferation(GO:0070345) |
| 0.8 | 7.1 | GO:0006108 | malate metabolic process(GO:0006108) |
| 0.8 | 3.2 | GO:0010593 | negative regulation of lamellipodium assembly(GO:0010593) |
| 0.8 | 0.8 | GO:0045917 | positive regulation of complement activation(GO:0045917) positive regulation of protein activation cascade(GO:2000259) |
| 0.8 | 4.6 | GO:1903071 | positive regulation of ER-associated ubiquitin-dependent protein catabolic process(GO:1903071) |
| 0.8 | 3.8 | GO:0035694 | mitochondrial protein catabolic process(GO:0035694) |
| 0.7 | 5.2 | GO:0018916 | nitrobenzene metabolic process(GO:0018916) |
| 0.7 | 3.7 | GO:0070859 | positive regulation of bile acid biosynthetic process(GO:0070859) positive regulation of bile acid metabolic process(GO:1904253) |
| 0.7 | 2.9 | GO:1901475 | pyruvate transmembrane transport(GO:1901475) |
| 0.7 | 2.1 | GO:0043181 | vacuolar sequestering(GO:0043181) |
| 0.7 | 0.7 | GO:0009216 | purine deoxyribonucleoside triphosphate biosynthetic process(GO:0009216) |
| 0.7 | 5.4 | GO:0008078 | mesodermal cell migration(GO:0008078) |
| 0.6 | 3.2 | GO:0060971 | embryonic heart tube left/right pattern formation(GO:0060971) |
| 0.6 | 2.5 | GO:0030647 | polyketide metabolic process(GO:0030638) aminoglycoside antibiotic metabolic process(GO:0030647) daunorubicin metabolic process(GO:0044597) doxorubicin metabolic process(GO:0044598) |
| 0.6 | 10.0 | GO:0042573 | retinoic acid metabolic process(GO:0042573) |
| 0.6 | 1.9 | GO:0030860 | regulation of polarized epithelial cell differentiation(GO:0030860) |
| 0.6 | 20.7 | GO:0015986 | energy coupled proton transport, down electrochemical gradient(GO:0015985) ATP synthesis coupled proton transport(GO:0015986) |
| 0.6 | 3.0 | GO:0014063 | negative regulation of serotonin secretion(GO:0014063) |
| 0.6 | 3.6 | GO:0008295 | spermidine biosynthetic process(GO:0008295) |
| 0.6 | 3.6 | GO:0006172 | ADP biosynthetic process(GO:0006172) |
| 0.6 | 1.8 | GO:0000349 | generation of catalytic spliceosome for first transesterification step(GO:0000349) |
| 0.6 | 2.4 | GO:1900060 | negative regulation of ceramide biosynthetic process(GO:1900060) |
| 0.6 | 2.9 | GO:1902714 | regulation of natural killer cell degranulation(GO:0043321) negative regulation of interferon-gamma secretion(GO:1902714) |
| 0.6 | 5.7 | GO:0006686 | sphingomyelin biosynthetic process(GO:0006686) |
| 0.6 | 6.2 | GO:0015670 | carbon dioxide transport(GO:0015670) |
| 0.6 | 12.4 | GO:0033539 | fatty acid beta-oxidation using acyl-CoA dehydrogenase(GO:0033539) |
| 0.6 | 3.9 | GO:0060309 | elastin catabolic process(GO:0060309) |
| 0.5 | 4.8 | GO:0019532 | oxalate transport(GO:0019532) |
| 0.5 | 2.1 | GO:0090004 | positive regulation of Golgi to plasma membrane protein transport(GO:0042998) positive regulation of establishment of protein localization to plasma membrane(GO:0090004) regulation of phosphatidylcholine biosynthetic process(GO:2001245) |
| 0.5 | 1.6 | GO:0098928 | presynaptic signal transduction(GO:0098928) presynapse to nucleus signaling pathway(GO:0099526) |
| 0.5 | 2.1 | GO:0080163 | regulation of protein serine/threonine phosphatase activity(GO:0080163) |
| 0.5 | 2.1 | GO:1903237 | negative regulation of leukocyte tethering or rolling(GO:1903237) |
| 0.5 | 6.7 | GO:0051204 | protein insertion into mitochondrial membrane(GO:0051204) |
| 0.5 | 16.4 | GO:0008206 | bile acid metabolic process(GO:0008206) |
| 0.5 | 1.5 | GO:1903225 | negative regulation of endodermal cell differentiation(GO:1903225) |
| 0.5 | 10.8 | GO:0045792 | negative regulation of cell size(GO:0045792) |
| 0.5 | 4.1 | GO:0032929 | negative regulation of superoxide anion generation(GO:0032929) |
| 0.5 | 10.7 | GO:0015721 | bile acid and bile salt transport(GO:0015721) |
| 0.5 | 2.5 | GO:0010360 | negative regulation of anion channel activity(GO:0010360) |
| 0.5 | 47.1 | GO:0006637 | acyl-CoA metabolic process(GO:0006637) thioester metabolic process(GO:0035383) |
| 0.5 | 3.5 | GO:0006776 | vitamin A metabolic process(GO:0006776) |
| 0.5 | 3.0 | GO:0009249 | protein lipoylation(GO:0009249) |
| 0.5 | 7.9 | GO:0071318 | cellular response to ATP(GO:0071318) |
| 0.5 | 1.9 | GO:0044860 | protein localization to plasma membrane raft(GO:0044860) |
| 0.5 | 3.9 | GO:0035610 | protein side chain deglutamylation(GO:0035610) |
| 0.5 | 2.4 | GO:1901165 | positive regulation of trophoblast cell migration(GO:1901165) |
| 0.5 | 1.0 | GO:0014053 | negative regulation of gamma-aminobutyric acid secretion(GO:0014053) |
| 0.5 | 3.4 | GO:0002003 | angiotensin maturation(GO:0002003) |
| 0.5 | 1.4 | GO:0097402 | neuroblast migration(GO:0097402) |
| 0.5 | 1.4 | GO:1903722 | regulation of centriole elongation(GO:1903722) |
| 0.5 | 1.4 | GO:0021524 | visceral motor neuron differentiation(GO:0021524) |
| 0.5 | 4.2 | GO:0006682 | galactosylceramide biosynthetic process(GO:0006682) galactolipid biosynthetic process(GO:0019375) |
| 0.5 | 1.8 | GO:0048382 | mesendoderm development(GO:0048382) |
| 0.5 | 10.4 | GO:0017144 | drug metabolic process(GO:0017144) |
| 0.5 | 5.9 | GO:0005981 | regulation of glycogen catabolic process(GO:0005981) |
| 0.5 | 6.3 | GO:1902004 | positive regulation of beta-amyloid formation(GO:1902004) |
| 0.5 | 2.7 | GO:0060295 | regulation of cilium movement involved in cell motility(GO:0060295) regulation of cilium beat frequency involved in ciliary motility(GO:0060296) regulation of cilium-dependent cell motility(GO:1902019) |
| 0.4 | 1.3 | GO:0018008 | N-terminal peptidyl-glycine N-myristoylation(GO:0018008) |
| 0.4 | 2.1 | GO:0032918 | polyamine acetylation(GO:0032917) spermidine acetylation(GO:0032918) |
| 0.4 | 1.3 | GO:0060722 | spongiotrophoblast cell proliferation(GO:0060720) cell proliferation involved in embryonic placenta development(GO:0060722) |
| 0.4 | 1.3 | GO:0061300 | cerebellum vasculature development(GO:0061300) |
| 0.4 | 3.3 | GO:0006166 | purine ribonucleoside salvage(GO:0006166) |
| 0.4 | 1.9 | GO:0006311 | meiotic gene conversion(GO:0006311) gene conversion(GO:0035822) |
| 0.4 | 0.8 | GO:0031554 | regulation of DNA-templated transcription, termination(GO:0031554) |
| 0.4 | 3.0 | GO:0060267 | positive regulation of respiratory burst(GO:0060267) |
| 0.4 | 6.0 | GO:0035970 | peptidyl-threonine dephosphorylation(GO:0035970) |
| 0.4 | 1.1 | GO:1902527 | positive regulation of protein monoubiquitination(GO:1902527) |
| 0.4 | 3.6 | GO:0006983 | ER overload response(GO:0006983) |
| 0.4 | 6.4 | GO:0006977 | DNA damage response, signal transduction by p53 class mediator resulting in cell cycle arrest(GO:0006977) |
| 0.4 | 8.5 | GO:1901663 | ubiquinone biosynthetic process(GO:0006744) quinone biosynthetic process(GO:1901663) |
| 0.4 | 6.0 | GO:0030828 | positive regulation of cGMP biosynthetic process(GO:0030828) |
| 0.3 | 5.2 | GO:0009143 | nucleoside triphosphate catabolic process(GO:0009143) |
| 0.3 | 1.4 | GO:1904428 | negative regulation of tubulin deacetylation(GO:1904428) |
| 0.3 | 5.5 | GO:0006488 | dolichol-linked oligosaccharide biosynthetic process(GO:0006488) |
| 0.3 | 2.7 | GO:0046485 | ether lipid metabolic process(GO:0046485) |
| 0.3 | 1.6 | GO:1904970 | brush border assembly(GO:1904970) |
| 0.3 | 1.7 | GO:0033685 | negative regulation of luteinizing hormone secretion(GO:0033685) |
| 0.3 | 1.7 | GO:0003352 | regulation of cilium movement(GO:0003352) |
| 0.3 | 4.6 | GO:0015697 | quaternary ammonium group transport(GO:0015697) |
| 0.3 | 1.1 | GO:1901628 | positive regulation of postsynaptic membrane organization(GO:1901628) positive regulation of skeletal muscle acetylcholine-gated channel clustering(GO:1904395) |
| 0.3 | 2.0 | GO:0007527 | adult somatic muscle development(GO:0007527) |
| 0.3 | 1.4 | GO:0009597 | detection of virus(GO:0009597) |
| 0.3 | 3.4 | GO:0048245 | eosinophil chemotaxis(GO:0048245) |
| 0.3 | 5.6 | GO:0006120 | mitochondrial electron transport, NADH to ubiquinone(GO:0006120) |
| 0.3 | 0.8 | GO:0018171 | peptidyl-cysteine oxidation(GO:0018171) |
| 0.3 | 0.8 | GO:0006391 | transcription initiation from mitochondrial promoter(GO:0006391) |
| 0.3 | 4.4 | GO:0035635 | entry of bacterium into host cell(GO:0035635) regulation of entry of bacterium into host cell(GO:2000535) |
| 0.3 | 5.0 | GO:0006415 | translational termination(GO:0006415) |
| 0.3 | 0.8 | GO:0046168 | glycerol-3-phosphate catabolic process(GO:0046168) |
| 0.3 | 0.8 | GO:0060268 | negative regulation of respiratory burst(GO:0060268) |
| 0.3 | 2.2 | GO:0035457 | cellular response to interferon-alpha(GO:0035457) |
| 0.3 | 0.8 | GO:0044376 | RNA polymerase II complex import to nucleus(GO:0044376) RNA polymerase III complex localization to nucleus(GO:1990022) |
| 0.3 | 1.1 | GO:0032417 | positive regulation of sodium:proton antiporter activity(GO:0032417) |
| 0.3 | 5.9 | GO:0051923 | sulfation(GO:0051923) |
| 0.3 | 3.5 | GO:0042178 | xenobiotic catabolic process(GO:0042178) |
| 0.3 | 3.4 | GO:0006123 | mitochondrial electron transport, cytochrome c to oxygen(GO:0006123) |
| 0.3 | 1.6 | GO:1990166 | positive regulation of maintenance of mitotic sister chromatid cohesion(GO:0034184) protein localization to site of double-strand break(GO:1990166) |
| 0.3 | 0.8 | GO:0061763 | multivesicular body-lysosome fusion(GO:0061763) |
| 0.3 | 1.3 | GO:0035660 | MyD88-dependent toll-like receptor 4 signaling pathway(GO:0035660) |
| 0.3 | 1.3 | GO:0006616 | SRP-dependent cotranslational protein targeting to membrane, translocation(GO:0006616) |
| 0.2 | 0.5 | GO:0031635 | adenylate cyclase-inhibiting opioid receptor signaling pathway(GO:0031635) |
| 0.2 | 0.7 | GO:2000158 | positive regulation of ubiquitin-specific protease activity(GO:2000158) |
| 0.2 | 2.4 | GO:0019336 | phenol-containing compound catabolic process(GO:0019336) |
| 0.2 | 1.2 | GO:0007207 | adenylate cyclase-inhibiting G-protein coupled acetylcholine receptor signaling pathway(GO:0007197) phospholipase C-activating G-protein coupled acetylcholine receptor signaling pathway(GO:0007207) |
| 0.2 | 1.9 | GO:0035887 | aortic smooth muscle cell differentiation(GO:0035887) |
| 0.2 | 1.4 | GO:0060005 | vestibular reflex(GO:0060005) |
| 0.2 | 0.9 | GO:1902309 | negative regulation of peptidyl-serine dephosphorylation(GO:1902309) |
| 0.2 | 2.3 | GO:0006729 | tetrahydrobiopterin biosynthetic process(GO:0006729) |
| 0.2 | 1.4 | GO:0046116 | queuosine biosynthetic process(GO:0008616) queuosine metabolic process(GO:0046116) |
| 0.2 | 9.0 | GO:0033622 | integrin activation(GO:0033622) |
| 0.2 | 0.7 | GO:0021762 | substantia nigra development(GO:0021762) corticotropin hormone secreting cell differentiation(GO:0060128) |
| 0.2 | 2.3 | GO:0048241 | epinephrine transport(GO:0048241) epinephrine secretion(GO:0048242) |
| 0.2 | 3.2 | GO:0021860 | pyramidal neuron development(GO:0021860) |
| 0.2 | 0.9 | GO:1903207 | neuron death in response to hydrogen peroxide(GO:0036476) regulation of hydrogen peroxide-induced neuron death(GO:1903207) negative regulation of hydrogen peroxide-induced neuron death(GO:1903208) |
| 0.2 | 2.2 | GO:0035021 | negative regulation of Rac protein signal transduction(GO:0035021) |
| 0.2 | 1.8 | GO:0008635 | activation of cysteine-type endopeptidase activity involved in apoptotic process by cytochrome c(GO:0008635) |
| 0.2 | 5.0 | GO:0042775 | mitochondrial ATP synthesis coupled electron transport(GO:0042775) |
| 0.2 | 1.3 | GO:0002248 | connective tissue replacement involved in inflammatory response wound healing(GO:0002248) |
| 0.2 | 1.3 | GO:0038128 | ERBB2 signaling pathway(GO:0038128) |
| 0.2 | 2.9 | GO:0043983 | histone H4-K12 acetylation(GO:0043983) |
| 0.2 | 36.2 | GO:0009636 | response to toxic substance(GO:0009636) |
| 0.2 | 1.7 | GO:0032926 | negative regulation of activin receptor signaling pathway(GO:0032926) |
| 0.2 | 3.5 | GO:0043508 | negative regulation of JUN kinase activity(GO:0043508) |
| 0.2 | 1.2 | GO:0002925 | positive regulation of humoral immune response mediated by circulating immunoglobulin(GO:0002925) |
| 0.2 | 1.6 | GO:2001183 | negative regulation of interleukin-12 secretion(GO:2001183) |
| 0.2 | 0.8 | GO:0060468 | prevention of polyspermy(GO:0060468) |
| 0.2 | 0.6 | GO:0051612 | negative regulation of neurotransmitter uptake(GO:0051581) negative regulation of serotonin uptake(GO:0051612) |
| 0.2 | 0.6 | GO:0015881 | creatine transport(GO:0015881) |
| 0.2 | 1.3 | GO:0071787 | endoplasmic reticulum tubular network assembly(GO:0071787) |
| 0.2 | 1.5 | GO:0044821 | meiotic telomere tethering at nuclear periphery(GO:0044821) meiotic attachment of telomere to nuclear envelope(GO:0070197) chromosome attachment to the nuclear envelope(GO:0097240) |
| 0.2 | 5.3 | GO:0015813 | L-glutamate transport(GO:0015813) |
| 0.2 | 5.6 | GO:0006491 | N-glycan processing(GO:0006491) |
| 0.2 | 0.9 | GO:0048850 | hypophysis morphogenesis(GO:0048850) |
| 0.2 | 4.4 | GO:0001783 | B cell apoptotic process(GO:0001783) |
| 0.2 | 1.3 | GO:0015862 | uridine transport(GO:0015862) |
| 0.2 | 0.5 | GO:0043382 | defense response to nematode(GO:0002215) positive regulation of memory T cell differentiation(GO:0043382) |
| 0.2 | 5.7 | GO:0003197 | endocardial cushion development(GO:0003197) |
| 0.2 | 1.1 | GO:0045919 | positive regulation of cytolysis(GO:0045919) |
| 0.2 | 3.3 | GO:0034497 | protein localization to pre-autophagosomal structure(GO:0034497) |
| 0.2 | 8.6 | GO:0007339 | binding of sperm to zona pellucida(GO:0007339) |
| 0.2 | 3.8 | GO:0046069 | cGMP catabolic process(GO:0046069) |
| 0.2 | 1.0 | GO:0060332 | positive regulation of response to interferon-gamma(GO:0060332) positive regulation of interferon-gamma-mediated signaling pathway(GO:0060335) |
| 0.2 | 4.8 | GO:0072112 | renal filtration cell differentiation(GO:0061318) glomerular visceral epithelial cell differentiation(GO:0072112) glomerular epithelial cell differentiation(GO:0072311) |
| 0.2 | 0.8 | GO:1905150 | regulation of voltage-gated sodium channel activity(GO:1905150) |
| 0.2 | 0.5 | GO:0009730 | detection of carbohydrate stimulus(GO:0009730) detection of hexose stimulus(GO:0009732) detection of monosaccharide stimulus(GO:0034287) detection of glucose(GO:0051594) |
| 0.2 | 1.9 | GO:0061343 | cell adhesion involved in heart morphogenesis(GO:0061343) |
| 0.2 | 12.7 | GO:0060395 | SMAD protein signal transduction(GO:0060395) |
| 0.2 | 1.0 | GO:0033140 | negative regulation of peptidyl-serine phosphorylation of STAT protein(GO:0033140) |
| 0.2 | 0.5 | GO:0061723 | glycophagy(GO:0061723) |
| 0.2 | 0.6 | GO:0010808 | positive regulation of synaptic vesicle priming(GO:0010808) |
| 0.2 | 5.7 | GO:0002021 | response to dietary excess(GO:0002021) |
| 0.2 | 3.4 | GO:0050912 | detection of chemical stimulus involved in sensory perception of taste(GO:0050912) |
| 0.2 | 1.8 | GO:0010839 | negative regulation of keratinocyte proliferation(GO:0010839) |
| 0.1 | 2.4 | GO:0043248 | proteasome assembly(GO:0043248) |
| 0.1 | 7.2 | GO:0006635 | fatty acid beta-oxidation(GO:0006635) |
| 0.1 | 5.3 | GO:0002089 | lens morphogenesis in camera-type eye(GO:0002089) |
| 0.1 | 0.3 | GO:0019858 | cytosine metabolic process(GO:0019858) |
| 0.1 | 11.0 | GO:0010507 | negative regulation of autophagy(GO:0010507) |
| 0.1 | 0.4 | GO:0044028 | DNA hypomethylation(GO:0044028) hypomethylation of CpG island(GO:0044029) |
| 0.1 | 0.8 | GO:0071918 | urea transmembrane transport(GO:0071918) |
| 0.1 | 1.5 | GO:0051045 | negative regulation of membrane protein ectodomain proteolysis(GO:0051045) |
| 0.1 | 0.8 | GO:0033313 | meiotic cell cycle checkpoint(GO:0033313) |
| 0.1 | 1.7 | GO:0031145 | anaphase-promoting complex-dependent catabolic process(GO:0031145) |
| 0.1 | 0.6 | GO:0046110 | xanthine catabolic process(GO:0009115) xanthine metabolic process(GO:0046110) |
| 0.1 | 0.4 | GO:0033563 | dorsal/ventral axon guidance(GO:0033563) |
| 0.1 | 2.3 | GO:0071712 | ER-associated misfolded protein catabolic process(GO:0071712) |
| 0.1 | 2.1 | GO:0040033 | miRNA mediated inhibition of translation(GO:0035278) negative regulation of translation, ncRNA-mediated(GO:0040033) regulation of translation, ncRNA-mediated(GO:0045974) |
| 0.1 | 1.2 | GO:2001269 | positive regulation of cysteine-type endopeptidase activity involved in apoptotic signaling pathway(GO:2001269) |
| 0.1 | 1.7 | GO:0090286 | cytoskeletal anchoring at nuclear membrane(GO:0090286) |
| 0.1 | 0.4 | GO:2001226 | negative regulation of chloride transport(GO:2001226) |
| 0.1 | 2.2 | GO:0033617 | mitochondrial respiratory chain complex IV assembly(GO:0033617) mitochondrial respiratory chain complex IV biogenesis(GO:0097034) |
| 0.1 | 0.4 | GO:0014016 | neuroblast differentiation(GO:0014016) |
| 0.1 | 2.8 | GO:0014883 | transition between fast and slow fiber(GO:0014883) |
| 0.1 | 5.4 | GO:0090162 | establishment of epithelial cell polarity(GO:0090162) |
| 0.1 | 1.7 | GO:0036159 | inner dynein arm assembly(GO:0036159) |
| 0.1 | 4.4 | GO:0097031 | NADH dehydrogenase complex assembly(GO:0010257) mitochondrial respiratory chain complex I assembly(GO:0032981) mitochondrial respiratory chain complex I biogenesis(GO:0097031) |
| 0.1 | 0.7 | GO:0007597 | blood coagulation, intrinsic pathway(GO:0007597) |
| 0.1 | 7.0 | GO:0030520 | intracellular estrogen receptor signaling pathway(GO:0030520) |
| 0.1 | 0.4 | GO:0033082 | regulation of extrathymic T cell differentiation(GO:0033082) |
| 0.1 | 2.9 | GO:0052646 | alditol phosphate metabolic process(GO:0052646) |
| 0.1 | 1.0 | GO:0005513 | detection of calcium ion(GO:0005513) |
| 0.1 | 0.8 | GO:0006390 | transcription from mitochondrial promoter(GO:0006390) |
| 0.1 | 0.8 | GO:0036438 | maintenance of lens transparency(GO:0036438) |
| 0.1 | 0.8 | GO:0033689 | negative regulation of osteoblast proliferation(GO:0033689) |
| 0.1 | 3.3 | GO:0060009 | Sertoli cell development(GO:0060009) |
| 0.1 | 0.6 | GO:0060478 | acrosomal vesicle exocytosis(GO:0060478) |
| 0.1 | 0.8 | GO:0015669 | gas transport(GO:0015669) oxygen transport(GO:0015671) |
| 0.1 | 1.2 | GO:0048386 | positive regulation of retinoic acid receptor signaling pathway(GO:0048386) |
| 0.1 | 0.6 | GO:0031665 | negative regulation of lipopolysaccharide-mediated signaling pathway(GO:0031665) |
| 0.1 | 1.4 | GO:0043353 | enucleate erythrocyte differentiation(GO:0043353) |
| 0.1 | 0.4 | GO:2000297 | negative regulation of synapse maturation(GO:2000297) |
| 0.1 | 1.9 | GO:0046475 | glycerophospholipid catabolic process(GO:0046475) |
| 0.1 | 1.3 | GO:0045059 | positive thymic T cell selection(GO:0045059) |
| 0.1 | 0.6 | GO:0036337 | Fas signaling pathway(GO:0036337) |
| 0.1 | 0.9 | GO:0072619 | interleukin-21 production(GO:0032625) interleukin-21 secretion(GO:0072619) response to ionomycin(GO:1904636) cellular response to ionomycin(GO:1904637) |
| 0.1 | 1.1 | GO:0015937 | coenzyme A biosynthetic process(GO:0015937) |
| 0.1 | 1.4 | GO:2001204 | regulation of osteoclast development(GO:2001204) |
| 0.1 | 0.9 | GO:0071763 | nuclear membrane organization(GO:0071763) |
| 0.1 | 0.3 | GO:0009955 | adaxial/abaxial pattern specification(GO:0009955) regulation of adaxial/abaxial pattern formation(GO:2000011) |
| 0.1 | 16.6 | GO:0007050 | cell cycle arrest(GO:0007050) |
| 0.1 | 1.9 | GO:0044406 | adhesion of symbiont to host(GO:0044406) |
| 0.1 | 0.6 | GO:0006642 | triglyceride mobilization(GO:0006642) |
| 0.1 | 3.6 | GO:0006879 | cellular iron ion homeostasis(GO:0006879) |
| 0.1 | 0.6 | GO:1903691 | positive regulation of wound healing, spreading of epidermal cells(GO:1903691) |
| 0.1 | 3.0 | GO:0031424 | keratinization(GO:0031424) |
| 0.1 | 4.0 | GO:0006890 | retrograde vesicle-mediated transport, Golgi to ER(GO:0006890) |
| 0.1 | 0.5 | GO:1901029 | negative regulation of mitochondrial outer membrane permeabilization involved in apoptotic signaling pathway(GO:1901029) |
| 0.1 | 0.9 | GO:0060012 | synaptic transmission, glycinergic(GO:0060012) |
| 0.1 | 0.4 | GO:0014835 | myoblast differentiation involved in skeletal muscle regeneration(GO:0014835) |
| 0.1 | 0.6 | GO:0003222 | ventricular trabecula myocardium morphogenesis(GO:0003222) |
| 0.1 | 0.7 | GO:0070294 | renal sodium ion transport(GO:0003096) renal sodium ion absorption(GO:0070294) |
| 0.1 | 1.1 | GO:1900037 | regulation of cellular response to hypoxia(GO:1900037) |
| 0.1 | 0.3 | GO:0002759 | regulation of antimicrobial humoral response(GO:0002759) |
| 0.1 | 5.5 | GO:0046426 | negative regulation of JAK-STAT cascade(GO:0046426) negative regulation of STAT cascade(GO:1904893) |
| 0.1 | 0.7 | GO:0007144 | female meiosis I(GO:0007144) |
| 0.1 | 11.1 | GO:0035725 | sodium ion transmembrane transport(GO:0035725) |
| 0.1 | 1.4 | GO:0099612 | protein localization to axon(GO:0099612) |
| 0.1 | 1.6 | GO:0060088 | auditory receptor cell stereocilium organization(GO:0060088) |
| 0.1 | 1.0 | GO:0006465 | signal peptide processing(GO:0006465) |
| 0.1 | 4.7 | GO:0042073 | intraciliary transport(GO:0042073) |
| 0.1 | 1.8 | GO:0008090 | retrograde axonal transport(GO:0008090) |
| 0.1 | 0.7 | GO:0045060 | negative thymic T cell selection(GO:0045060) positive regulation of isotype switching to IgG isotypes(GO:0048304) |
| 0.1 | 0.6 | GO:1903564 | regulation of protein localization to cilium(GO:1903564) |
| 0.1 | 0.9 | GO:0019368 | fatty acid elongation, saturated fatty acid(GO:0019367) fatty acid elongation, unsaturated fatty acid(GO:0019368) fatty acid elongation, monounsaturated fatty acid(GO:0034625) fatty acid elongation, polyunsaturated fatty acid(GO:0034626) |
| 0.1 | 1.2 | GO:0021520 | spinal cord motor neuron cell fate specification(GO:0021520) |
| 0.1 | 1.2 | GO:0003215 | cardiac right ventricle morphogenesis(GO:0003215) |
| 0.1 | 0.7 | GO:0051546 | keratinocyte migration(GO:0051546) |
| 0.1 | 2.8 | GO:0002474 | antigen processing and presentation of peptide antigen via MHC class I(GO:0002474) |
| 0.1 | 1.2 | GO:0006826 | iron ion transport(GO:0006826) |
| 0.1 | 0.4 | GO:0002082 | regulation of oxidative phosphorylation(GO:0002082) respiratory chain complex III assembly(GO:0017062) mitochondrial respiratory chain complex III assembly(GO:0034551) mitochondrial respiratory chain complex III biogenesis(GO:0097033) |
| 0.1 | 2.0 | GO:0071384 | cellular response to corticosteroid stimulus(GO:0071384) cellular response to glucocorticoid stimulus(GO:0071385) |
| 0.1 | 0.8 | GO:0000012 | single strand break repair(GO:0000012) |
| 0.1 | 0.6 | GO:0006705 | mineralocorticoid biosynthetic process(GO:0006705) |
| 0.1 | 1.5 | GO:0010758 | regulation of macrophage chemotaxis(GO:0010758) |
| 0.1 | 0.4 | GO:0060028 | non-canonical Wnt signaling pathway via JNK cascade(GO:0038031) convergent extension involved in axis elongation(GO:0060028) |
| 0.1 | 1.2 | GO:0031069 | hair follicle morphogenesis(GO:0031069) |
| 0.1 | 1.1 | GO:0090077 | foam cell differentiation(GO:0090077) |
| 0.1 | 2.0 | GO:0030225 | macrophage differentiation(GO:0030225) |
| 0.1 | 0.3 | GO:0002035 | brain renin-angiotensin system(GO:0002035) |
| 0.1 | 0.6 | GO:0002070 | epithelial cell maturation(GO:0002070) |
| 0.1 | 10.7 | GO:0043401 | steroid hormone mediated signaling pathway(GO:0043401) |
| 0.1 | 1.7 | GO:0042311 | vasodilation(GO:0042311) |
| 0.1 | 0.2 | GO:0051977 | lysophospholipid transport(GO:0051977) |
| 0.1 | 0.8 | GO:1901898 | negative regulation of relaxation of cardiac muscle(GO:1901898) |
| 0.1 | 1.4 | GO:0034219 | carbohydrate transmembrane transport(GO:0034219) |
| 0.1 | 1.1 | GO:0007141 | male meiosis I(GO:0007141) |
| 0.1 | 0.3 | GO:0016557 | peroxisome membrane biogenesis(GO:0016557) |
| 0.1 | 2.3 | GO:0046513 | ceramide biosynthetic process(GO:0046513) |
| 0.1 | 2.4 | GO:0010501 | RNA secondary structure unwinding(GO:0010501) |
| 0.1 | 2.1 | GO:0030195 | negative regulation of blood coagulation(GO:0030195) negative regulation of hemostasis(GO:1900047) |
| 0.1 | 0.7 | GO:1903301 | positive regulation of glucokinase activity(GO:0033133) positive regulation of hexokinase activity(GO:1903301) |
| 0.1 | 0.6 | GO:0006851 | mitochondrial calcium ion transport(GO:0006851) |
| 0.0 | 1.8 | GO:2000300 | regulation of synaptic vesicle exocytosis(GO:2000300) |
| 0.0 | 0.5 | GO:0030432 | peristalsis(GO:0030432) |
| 0.0 | 0.2 | GO:0042256 | mature ribosome assembly(GO:0042256) |
| 0.0 | 4.1 | GO:0032436 | positive regulation of proteasomal ubiquitin-dependent protein catabolic process(GO:0032436) |
| 0.0 | 0.2 | GO:0043031 | negative regulation of macrophage activation(GO:0043031) |
| 0.0 | 0.2 | GO:0001920 | negative regulation of receptor recycling(GO:0001920) |
| 0.0 | 0.4 | GO:0045955 | negative regulation of calcium ion-dependent exocytosis(GO:0045955) |
| 0.0 | 0.4 | GO:0045760 | positive regulation of action potential(GO:0045760) |
| 0.0 | 1.1 | GO:0000028 | ribosomal small subunit assembly(GO:0000028) |
| 0.0 | 0.4 | GO:1900003 | regulation of serine-type endopeptidase activity(GO:1900003) negative regulation of serine-type endopeptidase activity(GO:1900004) regulation of serine-type peptidase activity(GO:1902571) negative regulation of serine-type peptidase activity(GO:1902572) |
| 0.0 | 1.5 | GO:0010800 | positive regulation of peptidyl-threonine phosphorylation(GO:0010800) |
| 0.0 | 0.3 | GO:0016560 | protein import into peroxisome matrix, docking(GO:0016560) |
| 0.0 | 0.5 | GO:0051694 | pointed-end actin filament capping(GO:0051694) |
| 0.0 | 1.0 | GO:0030033 | microvillus assembly(GO:0030033) |
| 0.0 | 0.5 | GO:0035313 | wound healing, spreading of epidermal cells(GO:0035313) |
| 0.0 | 1.0 | GO:0072673 | lamellipodium morphogenesis(GO:0072673) |
| 0.0 | 0.8 | GO:0014741 | negative regulation of cardiac muscle hypertrophy(GO:0010614) negative regulation of muscle hypertrophy(GO:0014741) |
| 0.0 | 1.0 | GO:0003401 | axis elongation(GO:0003401) |
| 0.0 | 3.2 | GO:0036503 | ERAD pathway(GO:0036503) |
| 0.0 | 1.0 | GO:0048745 | smooth muscle tissue development(GO:0048745) |
| 0.0 | 1.1 | GO:0006767 | water-soluble vitamin metabolic process(GO:0006767) |
| 0.0 | 1.5 | GO:0045668 | negative regulation of osteoblast differentiation(GO:0045668) |
| 0.0 | 0.5 | GO:0035745 | T-helper 2 cell cytokine production(GO:0035745) |
| 0.0 | 0.9 | GO:0016339 | calcium-dependent cell-cell adhesion via plasma membrane cell adhesion molecules(GO:0016339) |
| 0.0 | 1.6 | GO:0045454 | cell redox homeostasis(GO:0045454) |
| 0.0 | 0.3 | GO:0009404 | toxin metabolic process(GO:0009404) |
| 0.0 | 0.8 | GO:0001947 | heart looping(GO:0001947) |
| 0.0 | 0.7 | GO:0001958 | endochondral ossification(GO:0001958) replacement ossification(GO:0036075) |
| 0.0 | 1.4 | GO:0048701 | embryonic cranial skeleton morphogenesis(GO:0048701) |
| 0.0 | 0.3 | GO:0010835 | regulation of protein ADP-ribosylation(GO:0010835) |
| 0.0 | 4.8 | GO:0007416 | synapse assembly(GO:0007416) |
| 0.0 | 1.0 | GO:0000184 | nuclear-transcribed mRNA catabolic process, nonsense-mediated decay(GO:0000184) |
| 0.0 | 0.5 | GO:0034587 | piRNA metabolic process(GO:0034587) |
| 0.0 | 0.3 | GO:0051292 | nuclear pore complex assembly(GO:0051292) |
| 0.0 | 0.4 | GO:0045199 | maintenance of epithelial cell apical/basal polarity(GO:0045199) |
| 0.0 | 1.7 | GO:0008542 | visual learning(GO:0008542) |
| 0.0 | 0.4 | GO:0071428 | ribosomal subunit export from nucleus(GO:0000054) ribosome localization(GO:0033750) establishment of ribosome localization(GO:0033753) rRNA-containing ribonucleoprotein complex export from nucleus(GO:0071428) |
| 0.0 | 0.7 | GO:0006182 | cGMP biosynthetic process(GO:0006182) |
| 0.0 | 0.9 | GO:0006303 | double-strand break repair via nonhomologous end joining(GO:0006303) |
| 0.0 | 0.1 | GO:0034473 | U1 snRNA 3'-end processing(GO:0034473) U5 snRNA 3'-end processing(GO:0034476) nuclear polyadenylation-dependent mRNA catabolic process(GO:0071042) polyadenylation-dependent mRNA catabolic process(GO:0071047) |
| 0.0 | 0.6 | GO:0051497 | negative regulation of stress fiber assembly(GO:0051497) |
| 0.0 | 0.2 | GO:0006359 | regulation of transcription from RNA polymerase III promoter(GO:0006359) |
| 0.0 | 0.5 | GO:0030148 | sphingolipid biosynthetic process(GO:0030148) |
| 0.0 | 2.0 | GO:0006814 | sodium ion transport(GO:0006814) |
| 0.0 | 0.1 | GO:0010944 | negative regulation of transcription by competitive promoter binding(GO:0010944) |
| 0.0 | 0.8 | GO:1901381 | positive regulation of potassium ion transmembrane transport(GO:1901381) |
| 0.0 | 0.3 | GO:0035404 | histone-serine phosphorylation(GO:0035404) |
| 0.0 | 0.2 | GO:0042711 | maternal behavior(GO:0042711) |
| 0.0 | 2.1 | GO:0051291 | protein heterooligomerization(GO:0051291) |
| 0.0 | 0.4 | GO:0008045 | motor neuron axon guidance(GO:0008045) |
| 0.0 | 1.6 | GO:0007156 | homophilic cell adhesion via plasma membrane adhesion molecules(GO:0007156) |
| 0.0 | 1.2 | GO:0042147 | retrograde transport, endosome to Golgi(GO:0042147) |
| 0.0 | 1.5 | GO:0018107 | peptidyl-threonine phosphorylation(GO:0018107) |
| 0.0 | 1.9 | GO:0006821 | chloride transport(GO:0006821) |
| 0.0 | 0.8 | GO:0007566 | embryo implantation(GO:0007566) |
| 0.0 | 0.7 | GO:0034605 | cellular response to heat(GO:0034605) |
| 0.0 | 0.0 | GO:1901509 | regulation of endothelial tube morphogenesis(GO:1901509) |
| 0.0 | 1.2 | GO:0007030 | Golgi organization(GO:0007030) |
| 0.0 | 0.2 | GO:0048266 | behavioral response to pain(GO:0048266) |
| 0.0 | 0.7 | GO:0031338 | regulation of vesicle fusion(GO:0031338) |
| 0.0 | 0.4 | GO:0000002 | mitochondrial genome maintenance(GO:0000002) |
| 0.0 | 0.4 | GO:0046676 | negative regulation of insulin secretion(GO:0046676) |
| 0.0 | 0.2 | GO:0044458 | motile cilium assembly(GO:0044458) |
| 0.0 | 3.4 | GO:0006470 | protein dephosphorylation(GO:0006470) |
| 0.0 | 0.2 | GO:0006353 | DNA-templated transcription, termination(GO:0006353) |
| 0.0 | 0.0 | GO:1903575 | cornified envelope assembly(GO:1903575) |
| 0.0 | 0.1 | GO:0071578 | zinc II ion transmembrane import(GO:0071578) |
Gene overrepresentation in cellular component category:
| Log-likelihood per target | Total log-likelihood | Term | Description |
|---|---|---|---|
| 7.0 | 21.1 | GO:0061474 | phagolysosome membrane(GO:0061474) |
| 5.2 | 46.9 | GO:0005579 | membrane attack complex(GO:0005579) |
| 4.8 | 14.5 | GO:0034359 | mature chylomicron(GO:0034359) |
| 4.1 | 16.5 | GO:0043541 | UDP-N-acetylglucosamine transferase complex(GO:0043541) |
| 3.1 | 40.6 | GO:0031315 | extrinsic component of mitochondrial outer membrane(GO:0031315) |
| 2.0 | 29.8 | GO:0034366 | spherical high-density lipoprotein particle(GO:0034366) |
| 1.9 | 15.2 | GO:0032937 | SREBP-SCAP-Insig complex(GO:0032937) |
| 1.7 | 16.9 | GO:0042567 | insulin-like growth factor ternary complex(GO:0042567) |
| 1.7 | 21.5 | GO:1990712 | HFE-transferrin receptor complex(GO:1990712) |
| 1.1 | 3.3 | GO:0043159 | acrosomal matrix(GO:0043159) |
| 1.1 | 18.4 | GO:0045263 | proton-transporting ATP synthase complex, coupling factor F(o)(GO:0045263) |
| 1.0 | 8.0 | GO:0097413 | Lewy body(GO:0097413) |
| 0.9 | 7.5 | GO:0046696 | lipopolysaccharide receptor complex(GO:0046696) |
| 0.9 | 5.5 | GO:0032437 | cuticular plate(GO:0032437) |
| 0.9 | 2.6 | GO:0036501 | UFD1-NPL4 complex(GO:0036501) |
| 0.9 | 22.6 | GO:0034364 | high-density lipoprotein particle(GO:0034364) |
| 0.8 | 3.3 | GO:0071942 | XPC complex(GO:0071942) |
| 0.7 | 2.9 | GO:0033596 | TSC1-TSC2 complex(GO:0033596) |
| 0.7 | 3.5 | GO:0043202 | lysosomal lumen(GO:0043202) |
| 0.7 | 2.7 | GO:0097543 | ciliary inversin compartment(GO:0097543) |
| 0.6 | 5.0 | GO:0042825 | TAP complex(GO:0042825) |
| 0.6 | 6.3 | GO:0031983 | vesicle lumen(GO:0031983) |
| 0.6 | 3.4 | GO:0097629 | extrinsic component of omegasome membrane(GO:0097629) |
| 0.5 | 5.9 | GO:0042587 | glycogen granule(GO:0042587) |
| 0.5 | 1.6 | GO:0044317 | rod spherule(GO:0044317) |
| 0.5 | 4.7 | GO:0017059 | serine C-palmitoyltransferase complex(GO:0017059) endoplasmic reticulum palmitoyltransferase complex(GO:0031211) |
| 0.5 | 2.0 | GO:1990769 | proximal neuron projection(GO:1990769) |
| 0.5 | 3.0 | GO:1990111 | spermatoproteasome complex(GO:1990111) |
| 0.5 | 14.9 | GO:0042101 | T cell receptor complex(GO:0042101) |
| 0.5 | 2.9 | GO:0090498 | extrinsic component of Golgi membrane(GO:0090498) |
| 0.5 | 1.9 | GO:0070722 | Tle3-Aes complex(GO:0070722) |
| 0.4 | 28.8 | GO:0046658 | anchored component of plasma membrane(GO:0046658) |
| 0.4 | 5.4 | GO:0072546 | ER membrane protein complex(GO:0072546) |
| 0.4 | 3.6 | GO:0045261 | mitochondrial proton-transporting ATP synthase complex, catalytic core F(1)(GO:0000275) proton-transporting ATP synthase complex, catalytic core F(1)(GO:0045261) |
| 0.4 | 2.8 | GO:0005742 | mitochondrial outer membrane translocase complex(GO:0005742) |
| 0.4 | 2.0 | GO:1990745 | GARP complex(GO:0000938) EARP complex(GO:1990745) |
| 0.4 | 5.4 | GO:0044754 | autolysosome(GO:0044754) |
| 0.4 | 4.8 | GO:0032584 | growth cone membrane(GO:0032584) |
| 0.4 | 0.7 | GO:0098636 | protein complex involved in cell adhesion(GO:0098636) |
| 0.3 | 2.0 | GO:0097226 | sperm mitochondrial sheath(GO:0097226) |
| 0.3 | 5.8 | GO:0046581 | intercellular canaliculus(GO:0046581) |
| 0.3 | 4.2 | GO:0000015 | phosphopyruvate hydratase complex(GO:0000015) |
| 0.3 | 4.0 | GO:0020005 | symbiont-containing vacuole membrane(GO:0020005) |
| 0.3 | 0.8 | GO:0009331 | glycerol-3-phosphate dehydrogenase complex(GO:0009331) |
| 0.3 | 0.8 | GO:0060473 | cortical granule(GO:0060473) |
| 0.3 | 65.0 | GO:0005777 | peroxisome(GO:0005777) microbody(GO:0042579) |
| 0.3 | 133.5 | GO:0005743 | mitochondrial inner membrane(GO:0005743) |
| 0.3 | 1.8 | GO:0097441 | basilar dendrite(GO:0097441) |
| 0.3 | 3.8 | GO:0034045 | pre-autophagosomal structure membrane(GO:0034045) |
| 0.2 | 0.7 | GO:0005712 | chiasma(GO:0005712) |
| 0.2 | 5.7 | GO:0000407 | pre-autophagosomal structure(GO:0000407) |
| 0.2 | 2.8 | GO:0048500 | signal recognition particle(GO:0048500) |
| 0.2 | 7.3 | GO:0030057 | desmosome(GO:0030057) |
| 0.2 | 0.7 | GO:0016939 | kinesin II complex(GO:0016939) |
| 0.2 | 1.1 | GO:1990131 | Gtr1-Gtr2 GTPase complex(GO:1990131) |
| 0.2 | 1.7 | GO:0034992 | microtubule organizing center attachment site(GO:0034992) LINC complex(GO:0034993) |
| 0.2 | 3.1 | GO:0031209 | SCAR complex(GO:0031209) |
| 0.2 | 7.1 | GO:0030992 | intraciliary transport particle B(GO:0030992) |
| 0.2 | 2.5 | GO:0017119 | Golgi transport complex(GO:0017119) |
| 0.2 | 4.1 | GO:0030008 | TRAPP complex(GO:0030008) |
| 0.2 | 1.7 | GO:0070545 | PeBoW complex(GO:0070545) |
| 0.2 | 3.8 | GO:0031229 | integral component of nuclear inner membrane(GO:0005639) intrinsic component of nuclear inner membrane(GO:0031229) |
| 0.2 | 1.2 | GO:0005964 | phosphorylase kinase complex(GO:0005964) |
| 0.2 | 42.2 | GO:0005759 | mitochondrial matrix(GO:0005759) |
| 0.2 | 1.4 | GO:0031673 | H zone(GO:0031673) |
| 0.2 | 0.8 | GO:0030896 | checkpoint clamp complex(GO:0030896) |
| 0.2 | 0.6 | GO:0098831 | presynaptic active zone cytoplasmic component(GO:0098831) |
| 0.2 | 0.9 | GO:0042406 | extrinsic component of endoplasmic reticulum membrane(GO:0042406) |
| 0.2 | 3.8 | GO:0032426 | stereocilium tip(GO:0032426) |
| 0.1 | 9.5 | GO:0031941 | filamentous actin(GO:0031941) |
| 0.1 | 53.2 | GO:0016323 | basolateral plasma membrane(GO:0016323) |
| 0.1 | 0.4 | GO:0005943 | phosphatidylinositol 3-kinase complex, class IA(GO:0005943) |
| 0.1 | 1.1 | GO:0098574 | cytoplasmic side of lysosomal membrane(GO:0098574) |
| 0.1 | 0.6 | GO:0002079 | inner acrosomal membrane(GO:0002079) |
| 0.1 | 33.5 | GO:0072562 | blood microparticle(GO:0072562) |
| 0.1 | 12.3 | GO:0005811 | lipid particle(GO:0005811) |
| 0.1 | 19.2 | GO:0016363 | nuclear matrix(GO:0016363) |
| 0.1 | 3.6 | GO:0005665 | DNA-directed RNA polymerase II, core complex(GO:0005665) |
| 0.1 | 1.7 | GO:0036156 | inner dynein arm(GO:0036156) |
| 0.1 | 2.1 | GO:0031307 | integral component of mitochondrial outer membrane(GO:0031307) |
| 0.1 | 29.2 | GO:0044429 | mitochondrial part(GO:0044429) |
| 0.1 | 1.6 | GO:0034464 | BBSome(GO:0034464) |
| 0.1 | 2.7 | GO:0005922 | connexon complex(GO:0005922) |
| 0.1 | 3.2 | GO:0000786 | nucleosome(GO:0000786) |
| 0.1 | 1.1 | GO:0005921 | gap junction(GO:0005921) |
| 0.1 | 1.2 | GO:0032279 | asymmetric synapse(GO:0032279) |
| 0.1 | 1.0 | GO:0005787 | signal peptidase complex(GO:0005787) |
| 0.1 | 3.5 | GO:0016235 | aggresome(GO:0016235) |
| 0.1 | 2.0 | GO:0031527 | filopodium membrane(GO:0031527) |
| 0.1 | 173.2 | GO:0005783 | endoplasmic reticulum(GO:0005783) |
| 0.1 | 0.6 | GO:1990923 | PET complex(GO:1990923) |
| 0.1 | 0.8 | GO:0061574 | ASAP complex(GO:0061574) |
| 0.1 | 1.2 | GO:0090543 | Flemming body(GO:0090543) |
| 0.1 | 1.9 | GO:0071564 | npBAF complex(GO:0071564) |
| 0.1 | 4.1 | GO:0008287 | protein serine/threonine phosphatase complex(GO:0008287) phosphatase complex(GO:1903293) |
| 0.1 | 2.0 | GO:0001533 | cornified envelope(GO:0001533) |
| 0.1 | 0.6 | GO:0034362 | low-density lipoprotein particle(GO:0034362) |
| 0.1 | 0.7 | GO:0036057 | filtration diaphragm(GO:0036056) slit diaphragm(GO:0036057) |
| 0.1 | 1.0 | GO:0005839 | proteasome core complex(GO:0005839) |
| 0.1 | 1.7 | GO:0031588 | nucleotide-activated protein kinase complex(GO:0031588) |
| 0.1 | 0.4 | GO:0070381 | endosome to plasma membrane transport vesicle(GO:0070381) |
| 0.1 | 3.4 | GO:0031594 | neuromuscular junction(GO:0031594) |
| 0.1 | 9.2 | GO:0008021 | synaptic vesicle(GO:0008021) |
| 0.0 | 0.2 | GO:0032444 | activin responsive factor complex(GO:0032444) |
| 0.0 | 0.9 | GO:0042588 | zymogen granule(GO:0042588) |
| 0.0 | 0.3 | GO:0033269 | internode region of axon(GO:0033269) |
| 0.0 | 60.1 | GO:0005887 | integral component of plasma membrane(GO:0005887) |
| 0.0 | 0.7 | GO:0008074 | guanylate cyclase complex, soluble(GO:0008074) |
| 0.0 | 0.8 | GO:0031235 | intrinsic component of the cytoplasmic side of the plasma membrane(GO:0031235) |
| 0.0 | 0.5 | GO:0002080 | acrosomal membrane(GO:0002080) |
| 0.0 | 0.7 | GO:0042734 | presynaptic membrane(GO:0042734) |
| 0.0 | 0.1 | GO:0000221 | vacuolar proton-transporting V-type ATPase, V1 domain(GO:0000221) |
| 0.0 | 3.3 | GO:0043235 | receptor complex(GO:0043235) |
| 0.0 | 4.2 | GO:0045211 | postsynaptic membrane(GO:0045211) |
| 0.0 | 1.1 | GO:0005901 | caveola(GO:0005901) |
| 0.0 | 0.3 | GO:0001739 | sex chromatin(GO:0001739) |
| 0.0 | 0.2 | GO:0036128 | CatSper complex(GO:0036128) |
| 0.0 | 0.7 | GO:0031526 | brush border membrane(GO:0031526) |
| 0.0 | 25.6 | GO:0005739 | mitochondrion(GO:0005739) |
| 0.0 | 1.7 | GO:0005581 | collagen trimer(GO:0005581) |
| 0.0 | 1.2 | GO:0010494 | cytoplasmic stress granule(GO:0010494) |
| 0.0 | 0.4 | GO:0035145 | exon-exon junction complex(GO:0035145) |
| 0.0 | 1.2 | GO:0043197 | dendritic spine(GO:0043197) |
| 0.0 | 0.1 | GO:0044613 | nuclear pore central transport channel(GO:0044613) |
| 0.0 | 0.1 | GO:0070449 | elongin complex(GO:0070449) |
| 0.0 | 0.3 | GO:0045095 | keratin filament(GO:0045095) |
Gene overrepresentation in molecular function category:
| Log-likelihood per target | Total log-likelihood | Term | Description |
|---|---|---|---|
| 18.3 | 54.9 | GO:0005009 | insulin-activated receptor activity(GO:0005009) |
| 11.7 | 46.8 | GO:0004478 | methionine adenosyltransferase activity(GO:0004478) |
| 10.7 | 64.4 | GO:0034875 | oxidoreductase activity, acting on CH or CH2 groups, quinone or similar compound as acceptor(GO:0033695) caffeine oxidase activity(GO:0034875) |
| 9.9 | 39.8 | GO:0050632 | propanoyl-CoA C-acyltransferase activity(GO:0033814) propionyl-CoA C2-trimethyltridecanoyltransferase activity(GO:0050632) phosphatidylethanolamine transporter activity(GO:1904121) |
| 8.8 | 26.4 | GO:0047006 | 17-alpha,20-alpha-dihydroxypregn-4-en-3-one dehydrogenase activity(GO:0047006) |
| 7.1 | 290.6 | GO:0015020 | glucuronosyltransferase activity(GO:0015020) |
| 6.5 | 26.2 | GO:0016822 | hydrolase activity, acting on acid carbon-carbon bonds(GO:0016822) hydrolase activity, acting on acid carbon-carbon bonds, in ketonic substances(GO:0016823) |
| 6.2 | 18.5 | GO:0008775 | acetate CoA-transferase activity(GO:0008775) |
| 5.7 | 17.1 | GO:0004611 | phosphoenolpyruvate carboxykinase activity(GO:0004611) phosphoenolpyruvate carboxykinase (GTP) activity(GO:0004613) |
| 5.4 | 16.2 | GO:0008390 | testosterone 16-alpha-hydroxylase activity(GO:0008390) |
| 5.1 | 40.8 | GO:0008172 | S-methyltransferase activity(GO:0008172) |
| 5.0 | 40.3 | GO:0003996 | acyl-CoA ligase activity(GO:0003996) |
| 4.3 | 12.9 | GO:0017099 | very-long-chain-acyl-CoA dehydrogenase activity(GO:0017099) |
| 3.9 | 27.1 | GO:0050656 | alcohol sulfotransferase activity(GO:0004027) 3'-phosphoadenosine 5'-phosphosulfate binding(GO:0050656) |
| 3.7 | 11.1 | GO:0004493 | methylmalonyl-CoA epimerase activity(GO:0004493) |
| 3.4 | 13.4 | GO:0071614 | linoleic acid epoxygenase activity(GO:0071614) |
| 3.1 | 53.5 | GO:1901702 | urate transmembrane transporter activity(GO:0015143) salt transmembrane transporter activity(GO:1901702) |
| 3.1 | 15.4 | GO:0005345 | purine nucleobase transmembrane transporter activity(GO:0005345) pyrimidine nucleobase transmembrane transporter activity(GO:0005350) nucleobase transmembrane transporter activity(GO:0015205) |
| 3.1 | 15.4 | GO:0018479 | benzaldehyde dehydrogenase (NAD+) activity(GO:0018479) |
| 2.9 | 14.5 | GO:0051185 | coenzyme transporter activity(GO:0051185) |
| 2.8 | 62.6 | GO:0015125 | bile acid transmembrane transporter activity(GO:0015125) |
| 2.7 | 11.0 | GO:0036468 | aromatic-L-amino-acid decarboxylase activity(GO:0004058) L-dopa decarboxylase activity(GO:0036468) |
| 2.6 | 73.4 | GO:0008392 | arachidonic acid epoxygenase activity(GO:0008392) |
| 2.5 | 27.4 | GO:0004322 | ferroxidase activity(GO:0004322) oxidoreductase activity, oxidizing metal ions, oxygen as acceptor(GO:0016724) |
| 2.4 | 7.2 | GO:0016781 | selenide, water dikinase activity(GO:0004756) phosphotransferase activity, paired acceptors(GO:0016781) |
| 2.3 | 14.0 | GO:0035529 | NADH pyrophosphatase activity(GO:0035529) |
| 2.2 | 31.5 | GO:0005436 | sodium:phosphate symporter activity(GO:0005436) |
| 2.0 | 7.8 | GO:0005008 | hepatocyte growth factor-activated receptor activity(GO:0005008) |
| 1.9 | 13.3 | GO:0001851 | complement component C3b binding(GO:0001851) |
| 1.9 | 5.7 | GO:0030338 | CMP-N-acetylneuraminate monooxygenase activity(GO:0030338) |
| 1.7 | 5.0 | GO:0046980 | peptide antigen-transporting ATPase activity(GO:0015433) tapasin binding(GO:0046980) |
| 1.7 | 5.0 | GO:0008431 | vitamin E binding(GO:0008431) |
| 1.6 | 13.0 | GO:0052851 | cupric reductase activity(GO:0008823) ferric-chelate reductase (NADPH) activity(GO:0052851) |
| 1.5 | 9.1 | GO:0001875 | lipopolysaccharide receptor activity(GO:0001875) |
| 1.5 | 6.0 | GO:0016453 | acetyl-CoA C-acetyltransferase activity(GO:0003985) C-acetyltransferase activity(GO:0016453) |
| 1.5 | 6.0 | GO:0004741 | [pyruvate dehydrogenase (lipoamide)] phosphatase activity(GO:0004741) |
| 1.4 | 7.1 | GO:0030060 | L-malate dehydrogenase activity(GO:0030060) |
| 1.4 | 4.2 | GO:0005157 | macrophage colony-stimulating factor receptor binding(GO:0005157) |
| 1.4 | 5.4 | GO:0004937 | alpha1-adrenergic receptor activity(GO:0004937) |
| 1.3 | 6.6 | GO:0004923 | leukemia inhibitory factor receptor activity(GO:0004923) |
| 1.3 | 21.1 | GO:0003854 | 3-beta-hydroxy-delta5-steroid dehydrogenase activity(GO:0003854) |
| 1.2 | 16.0 | GO:0004887 | thyroid hormone receptor activity(GO:0004887) |
| 1.2 | 21.6 | GO:0048406 | nerve growth factor binding(GO:0048406) |
| 1.2 | 13.1 | GO:0016813 | hydrolase activity, acting on carbon-nitrogen (but not peptide) bonds, in linear amidines(GO:0016813) |
| 1.2 | 6.0 | GO:0008502 | melatonin receptor activity(GO:0008502) |
| 1.1 | 29.8 | GO:0051787 | misfolded protein binding(GO:0051787) |
| 1.1 | 14.5 | GO:0035473 | lipase binding(GO:0035473) |
| 1.1 | 9.8 | GO:0016812 | hydrolase activity, acting on carbon-nitrogen (but not peptide) bonds, in cyclic amides(GO:0016812) |
| 1.0 | 4.2 | GO:0047275 | glucosaminylgalactosylglucosylceramide beta-galactosyltransferase activity(GO:0047275) |
| 1.0 | 4.2 | GO:0019778 | Atg12 activating enzyme activity(GO:0019778) Atg8 activating enzyme activity(GO:0019779) |
| 1.0 | 22.3 | GO:0015347 | sodium-independent organic anion transmembrane transporter activity(GO:0015347) |
| 1.0 | 2.9 | GO:0052642 | lysophosphatidic acid phosphatase activity(GO:0052642) |
| 0.9 | 10.4 | GO:0004499 | N,N-dimethylaniline monooxygenase activity(GO:0004499) |
| 0.9 | 19.8 | GO:0070513 | death domain binding(GO:0070513) |
| 0.9 | 0.9 | GO:0031177 | phosphopantetheine binding(GO:0031177) |
| 0.9 | 5.6 | GO:0016647 | oxidoreductase activity, acting on the CH-NH group of donors, oxygen as acceptor(GO:0016647) |
| 0.9 | 2.7 | GO:0050479 | glyceryl-ether monooxygenase activity(GO:0050479) |
| 0.9 | 3.5 | GO:0008109 | N-acetyllactosaminide beta-1,6-N-acetylglucosaminyltransferase activity(GO:0008109) |
| 0.9 | 5.2 | GO:0060698 | endoribonuclease inhibitor activity(GO:0060698) |
| 0.9 | 10.2 | GO:0031730 | CCR5 chemokine receptor binding(GO:0031730) |
| 0.8 | 15.9 | GO:0046933 | proton-transporting ATP synthase activity, rotational mechanism(GO:0046933) |
| 0.8 | 8.1 | GO:0031419 | cobalamin binding(GO:0031419) |
| 0.8 | 3.2 | GO:0033797 | selenate reductase activity(GO:0033797) |
| 0.8 | 1.6 | GO:0008970 | phosphatidylcholine 1-acylhydrolase activity(GO:0008970) |
| 0.8 | 4.7 | GO:0032450 | maltose alpha-glucosidase activity(GO:0032450) |
| 0.8 | 2.3 | GO:0016838 | carbon-oxygen lyase activity, acting on phosphates(GO:0016838) |
| 0.8 | 4.6 | GO:0005329 | dopamine transmembrane transporter activity(GO:0005329) |
| 0.7 | 13.3 | GO:0016712 | oxidoreductase activity, acting on paired donors, with incorporation or reduction of molecular oxygen, reduced flavin or flavoprotein as one donor, and incorporation of one atom of oxygen(GO:0016712) aromatase activity(GO:0070330) |
| 0.7 | 3.5 | GO:0003960 | NADPH:quinone reductase activity(GO:0003960) |
| 0.7 | 2.1 | GO:0016979 | lipoate-protein ligase activity(GO:0016979) |
| 0.7 | 2.0 | GO:0047936 | glucose 1-dehydrogenase [NAD(P)] activity(GO:0047936) |
| 0.7 | 5.3 | GO:0001758 | retinal dehydrogenase activity(GO:0001758) |
| 0.7 | 3.3 | GO:0034603 | pyruvate dehydrogenase activity(GO:0004738) pyruvate dehydrogenase [NAD(P)+] activity(GO:0034603) pyruvate dehydrogenase (NAD+) activity(GO:0034604) |
| 0.6 | 14.7 | GO:0019865 | immunoglobulin binding(GO:0019865) |
| 0.6 | 3.2 | GO:0004315 | 3-oxoacyl-[acyl-carrier-protein] synthase activity(GO:0004315) |
| 0.6 | 3.7 | GO:0004594 | pantothenate kinase activity(GO:0004594) |
| 0.6 | 5.0 | GO:0008079 | translation release factor activity(GO:0003747) translation termination factor activity(GO:0008079) |
| 0.6 | 5.5 | GO:0004768 | stearoyl-CoA 9-desaturase activity(GO:0004768) |
| 0.6 | 2.4 | GO:0004800 | thyroxine 5'-deiodinase activity(GO:0004800) |
| 0.6 | 4.1 | GO:0047288 | monosialoganglioside sialyltransferase activity(GO:0047288) |
| 0.6 | 2.3 | GO:0047961 | glycine N-acyltransferase activity(GO:0047961) |
| 0.6 | 5.7 | GO:0038132 | neuregulin binding(GO:0038132) |
| 0.6 | 19.4 | GO:0042056 | chemoattractant activity(GO:0042056) |
| 0.5 | 2.2 | GO:0060230 | lipoprotein lipase activator activity(GO:0060230) |
| 0.5 | 2.7 | GO:1904288 | BAT3 complex binding(GO:1904288) |
| 0.5 | 2.1 | GO:0019809 | spermidine binding(GO:0019809) |
| 0.5 | 6.8 | GO:0004602 | glutathione peroxidase activity(GO:0004602) |
| 0.5 | 2.1 | GO:0031735 | CCR10 chemokine receptor binding(GO:0031735) |
| 0.5 | 10.1 | GO:0004806 | triglyceride lipase activity(GO:0004806) |
| 0.5 | 2.5 | GO:0004060 | arylamine N-acetyltransferase activity(GO:0004060) |
| 0.5 | 2.4 | GO:2001069 | glycogen binding(GO:2001069) |
| 0.5 | 2.3 | GO:0004758 | serine C-palmitoyltransferase activity(GO:0004758) C-palmitoyltransferase activity(GO:0016454) |
| 0.4 | 5.2 | GO:0008430 | selenium binding(GO:0008430) |
| 0.4 | 1.3 | GO:0019107 | glycylpeptide N-tetradecanoyltransferase activity(GO:0004379) myristoyltransferase activity(GO:0019107) |
| 0.4 | 4.7 | GO:0039706 | co-receptor binding(GO:0039706) |
| 0.4 | 2.9 | GO:0050833 | pyruvate transmembrane transporter activity(GO:0050833) |
| 0.4 | 8.9 | GO:0008191 | metalloendopeptidase inhibitor activity(GO:0008191) |
| 0.4 | 6.8 | GO:0016857 | racemase and epimerase activity, acting on carbohydrates and derivatives(GO:0016857) |
| 0.4 | 3.2 | GO:0008379 | thioredoxin peroxidase activity(GO:0008379) |
| 0.4 | 1.2 | GO:0051431 | corticotropin-releasing hormone receptor 2 binding(GO:0051431) |
| 0.4 | 4.7 | GO:0004571 | mannosyl-oligosaccharide 1,2-alpha-mannosidase activity(GO:0004571) |
| 0.4 | 22.2 | GO:0004364 | glutathione transferase activity(GO:0004364) |
| 0.4 | 4.6 | GO:0035368 | selenocysteine insertion sequence binding(GO:0035368) |
| 0.4 | 1.5 | GO:0004176 | ATP-dependent peptidase activity(GO:0004176) |
| 0.4 | 8.9 | GO:0005537 | mannose binding(GO:0005537) |
| 0.4 | 13.3 | GO:0008483 | transaminase activity(GO:0008483) |
| 0.4 | 1.1 | GO:0031531 | thyrotropin-releasing hormone receptor binding(GO:0031531) |
| 0.3 | 2.1 | GO:0004118 | cGMP-stimulated cyclic-nucleotide phosphodiesterase activity(GO:0004118) |
| 0.3 | 6.2 | GO:0004089 | carbonate dehydratase activity(GO:0004089) |
| 0.3 | 12.2 | GO:0016655 | oxidoreductase activity, acting on NAD(P)H, quinone or similar compound as acceptor(GO:0016655) |
| 0.3 | 11.5 | GO:0016702 | oxidoreductase activity, acting on single donors with incorporation of molecular oxygen, incorporation of two atoms of oxygen(GO:0016702) |
| 0.3 | 2.0 | GO:0051032 | nucleic acid transmembrane transporter activity(GO:0051032) RNA transmembrane transporter activity(GO:0051033) |
| 0.3 | 2.9 | GO:0016936 | galactoside binding(GO:0016936) |
| 0.3 | 0.9 | GO:0001160 | transcription termination site sequence-specific DNA binding(GO:0001147) transcription termination site DNA binding(GO:0001160) |
| 0.3 | 1.6 | GO:0002046 | opsin binding(GO:0002046) |
| 0.3 | 1.2 | GO:0047710 | bis(5'-adenosyl)-triphosphatase activity(GO:0047710) |
| 0.3 | 1.5 | GO:0001010 | transcription factor activity, sequence-specific DNA binding transcription factor recruiting(GO:0001010) |
| 0.3 | 8.8 | GO:0015002 | cytochrome-c oxidase activity(GO:0004129) heme-copper terminal oxidase activity(GO:0015002) oxidoreductase activity, acting on a heme group of donors, oxygen as acceptor(GO:0016676) |
| 0.3 | 4.2 | GO:0004634 | phosphopyruvate hydratase activity(GO:0004634) |
| 0.3 | 1.2 | GO:0005502 | 11-cis retinal binding(GO:0005502) |
| 0.3 | 2.2 | GO:0004366 | glycerol-3-phosphate O-acyltransferase activity(GO:0004366) |
| 0.3 | 2.5 | GO:0015217 | ATP transmembrane transporter activity(GO:0005347) ADP transmembrane transporter activity(GO:0015217) |
| 0.3 | 0.8 | GO:0070002 | glutamic-type peptidase activity(GO:0070002) |
| 0.3 | 0.8 | GO:0008967 | phosphoglycolate phosphatase activity(GO:0008967) |
| 0.3 | 1.1 | GO:0001591 | dopamine neurotransmitter receptor activity, coupled via Gi/Go(GO:0001591) |
| 0.3 | 2.2 | GO:0047631 | ADP-ribose diphosphatase activity(GO:0047631) |
| 0.3 | 4.8 | GO:0019531 | oxalate transmembrane transporter activity(GO:0019531) |
| 0.3 | 2.3 | GO:0035381 | extracellular ATP-gated cation channel activity(GO:0004931) ATP-gated ion channel activity(GO:0035381) |
| 0.3 | 3.6 | GO:0004017 | adenylate kinase activity(GO:0004017) |
| 0.2 | 1.5 | GO:0008568 | microtubule-severing ATPase activity(GO:0008568) |
| 0.2 | 35.3 | GO:0004867 | serine-type endopeptidase inhibitor activity(GO:0004867) |
| 0.2 | 4.4 | GO:0070403 | NAD+ binding(GO:0070403) |
| 0.2 | 0.7 | GO:0035800 | deubiquitinase activator activity(GO:0035800) |
| 0.2 | 3.2 | GO:0017154 | semaphorin receptor activity(GO:0017154) |
| 0.2 | 6.3 | GO:0070006 | metalloaminopeptidase activity(GO:0070006) |
| 0.2 | 0.2 | GO:0005072 | transforming growth factor beta receptor, cytoplasmic mediator activity(GO:0005072) |
| 0.2 | 2.6 | GO:0036435 | K48-linked polyubiquitin binding(GO:0036435) |
| 0.2 | 1.7 | GO:0070699 | type II activin receptor binding(GO:0070699) |
| 0.2 | 3.1 | GO:0001054 | RNA polymerase I activity(GO:0001054) RNA polymerase II activity(GO:0001055) |
| 0.2 | 1.2 | GO:0016907 | G-protein coupled acetylcholine receptor activity(GO:0016907) |
| 0.2 | 3.0 | GO:0047617 | acyl-CoA hydrolase activity(GO:0047617) |
| 0.2 | 2.3 | GO:0030550 | acetylcholine receptor inhibitor activity(GO:0030550) |
| 0.2 | 10.9 | GO:0016776 | phosphotransferase activity, phosphate group as acceptor(GO:0016776) |
| 0.2 | 2.2 | GO:0070008 | serine-type exopeptidase activity(GO:0070008) |
| 0.2 | 3.5 | GO:0034450 | ubiquitin-ubiquitin ligase activity(GO:0034450) |
| 0.2 | 5.0 | GO:0005313 | L-glutamate transmembrane transporter activity(GO:0005313) |
| 0.2 | 12.6 | GO:0031624 | ubiquitin conjugating enzyme binding(GO:0031624) |
| 0.2 | 1.1 | GO:0043295 | glutathione binding(GO:0043295) oligopeptide binding(GO:1900750) |
| 0.2 | 1.3 | GO:0005047 | signal recognition particle binding(GO:0005047) |
| 0.2 | 2.4 | GO:1990825 | sequence-specific mRNA binding(GO:1990825) |
| 0.2 | 0.6 | GO:0005308 | creatine transmembrane transporter activity(GO:0005308) |
| 0.2 | 1.8 | GO:0047498 | calcium-dependent phospholipase A2 activity(GO:0047498) |
| 0.2 | 4.5 | GO:0016805 | dipeptidase activity(GO:0016805) |
| 0.2 | 1.7 | GO:0008429 | phosphatidylethanolamine binding(GO:0008429) |
| 0.2 | 0.7 | GO:0019237 | centromeric DNA binding(GO:0019237) |
| 0.2 | 3.7 | GO:0001972 | retinoic acid binding(GO:0001972) |
| 0.2 | 0.9 | GO:0016174 | NAD(P)H oxidase activity(GO:0016174) |
| 0.2 | 1.1 | GO:0004985 | opioid receptor activity(GO:0004985) |
| 0.2 | 1.2 | GO:0004689 | phosphorylase kinase activity(GO:0004689) |
| 0.2 | 0.7 | GO:0047874 | dolichyldiphosphatase activity(GO:0047874) |
| 0.2 | 0.9 | GO:0008853 | exodeoxyribonuclease III activity(GO:0008853) |
| 0.2 | 1.5 | GO:0016892 | endoribonuclease activity, producing 3'-phosphomonoesters(GO:0016892) |
| 0.2 | 2.7 | GO:0005243 | gap junction channel activity(GO:0005243) |
| 0.2 | 25.1 | GO:0005496 | steroid binding(GO:0005496) |
| 0.2 | 12.6 | GO:0005547 | phosphatidylinositol-3,4,5-trisphosphate binding(GO:0005547) |
| 0.2 | 2.0 | GO:0051378 | serotonin binding(GO:0051378) |
| 0.2 | 0.8 | GO:0004367 | glycerol-3-phosphate dehydrogenase [NAD+] activity(GO:0004367) |
| 0.2 | 0.5 | GO:0070698 | type I activin receptor binding(GO:0070698) |
| 0.2 | 6.4 | GO:0016922 | ligand-dependent nuclear receptor binding(GO:0016922) |
| 0.2 | 2.6 | GO:0002161 | aminoacyl-tRNA editing activity(GO:0002161) |
| 0.2 | 5.0 | GO:0004181 | metallocarboxypeptidase activity(GO:0004181) |
| 0.2 | 1.7 | GO:0070739 | protein-glutamic acid ligase activity(GO:0070739) |
| 0.2 | 0.5 | GO:0008457 | beta-galactosyl-N-acetylglucosaminylgalactosylglucosyl-ceramide beta-1,3-acetylglucosaminyltransferase activity(GO:0008457) lactosylceramide 1,3-N-acetyl-beta-D-glucosaminyltransferase activity(GO:0047256) |
| 0.2 | 4.0 | GO:0070003 | threonine-type endopeptidase activity(GO:0004298) threonine-type peptidase activity(GO:0070003) |
| 0.2 | 1.7 | GO:0048101 | calmodulin-dependent cyclic-nucleotide phosphodiesterase activity(GO:0004117) calcium- and calmodulin-regulated 3',5'-cyclic-GMP phosphodiesterase activity(GO:0048101) |
| 0.1 | 2.1 | GO:0031210 | phosphatidylcholine binding(GO:0031210) |
| 0.1 | 6.6 | GO:0016836 | hydro-lyase activity(GO:0016836) |
| 0.1 | 0.9 | GO:0016934 | extracellular-glycine-gated ion channel activity(GO:0016933) extracellular-glycine-gated chloride channel activity(GO:0016934) |
| 0.1 | 10.8 | GO:0004497 | monooxygenase activity(GO:0004497) |
| 0.1 | 4.9 | GO:0008028 | monocarboxylic acid transmembrane transporter activity(GO:0008028) |
| 0.1 | 0.9 | GO:0003828 | alpha-N-acetylneuraminate alpha-2,8-sialyltransferase activity(GO:0003828) |
| 0.1 | 0.7 | GO:0004974 | leukotriene receptor activity(GO:0004974) |
| 0.1 | 1.6 | GO:0022829 | wide pore channel activity(GO:0022829) |
| 0.1 | 1.3 | GO:0098821 | BMP receptor activity(GO:0098821) |
| 0.1 | 3.3 | GO:0080025 | phosphatidylinositol-3,5-bisphosphate binding(GO:0080025) |
| 0.1 | 2.9 | GO:0032794 | GTPase activating protein binding(GO:0032794) |
| 0.1 | 0.4 | GO:0003990 | acetylcholinesterase activity(GO:0003990) |
| 0.1 | 1.9 | GO:0045294 | alpha-catenin binding(GO:0045294) |
| 0.1 | 25.0 | GO:0004252 | serine-type endopeptidase activity(GO:0004252) |
| 0.1 | 16.7 | GO:0052689 | carboxylic ester hydrolase activity(GO:0052689) |
| 0.1 | 0.8 | GO:0016972 | thiol oxidase activity(GO:0016972) |
| 0.1 | 1.1 | GO:0043024 | ribosomal small subunit binding(GO:0043024) |
| 0.1 | 1.2 | GO:0008527 | taste receptor activity(GO:0008527) |
| 0.1 | 6.3 | GO:0043531 | ADP binding(GO:0043531) |
| 0.1 | 2.2 | GO:0102391 | decanoate--CoA ligase activity(GO:0102391) |
| 0.1 | 2.5 | GO:0004601 | peroxidase activity(GO:0004601) |
| 0.1 | 1.9 | GO:0004993 | G-protein coupled serotonin receptor activity(GO:0004993) |
| 0.1 | 1.1 | GO:0008235 | metalloexopeptidase activity(GO:0008235) |
| 0.1 | 0.6 | GO:0016623 | aldehyde oxidase activity(GO:0004031) xanthine dehydrogenase activity(GO:0004854) oxidoreductase activity, acting on the aldehyde or oxo group of donors, oxygen as acceptor(GO:0016623) oxidoreductase activity, acting on CH or CH2 groups, NAD or NADP as acceptor(GO:0016726) |
| 0.1 | 0.6 | GO:0032184 | SUMO polymer binding(GO:0032184) |
| 0.1 | 1.1 | GO:0008239 | dipeptidyl-peptidase activity(GO:0008239) |
| 0.1 | 0.8 | GO:0005344 | oxygen transporter activity(GO:0005344) |
| 0.1 | 2.5 | GO:0005212 | structural constituent of eye lens(GO:0005212) |
| 0.1 | 1.5 | GO:0043495 | protein anchor(GO:0043495) |
| 0.1 | 0.6 | GO:0004969 | histamine receptor activity(GO:0004969) |
| 0.1 | 1.0 | GO:0022833 | mechanically-gated ion channel activity(GO:0008381) mechanically gated channel activity(GO:0022833) |
| 0.1 | 1.9 | GO:0045499 | chemorepellent activity(GO:0045499) |
| 0.1 | 10.8 | GO:0019888 | protein phosphatase regulator activity(GO:0019888) |
| 0.1 | 0.7 | GO:0017040 | ceramidase activity(GO:0017040) |
| 0.1 | 0.5 | GO:0004994 | somatostatin receptor activity(GO:0004994) |
| 0.1 | 1.4 | GO:0008301 | DNA binding, bending(GO:0008301) |
| 0.1 | 1.4 | GO:0005522 | profilin binding(GO:0005522) |
| 0.1 | 0.7 | GO:0015272 | ATP-activated inward rectifier potassium channel activity(GO:0015272) |
| 0.1 | 6.1 | GO:0004722 | protein serine/threonine phosphatase activity(GO:0004722) |
| 0.1 | 3.6 | GO:0031435 | mitogen-activated protein kinase kinase kinase binding(GO:0031435) |
| 0.1 | 1.3 | GO:0005337 | nucleoside transmembrane transporter activity(GO:0005337) |
| 0.1 | 3.7 | GO:0030170 | pyridoxal phosphate binding(GO:0030170) |
| 0.1 | 0.7 | GO:0008479 | queuine tRNA-ribosyltransferase activity(GO:0008479) |
| 0.1 | 1.4 | GO:0042923 | neuropeptide binding(GO:0042923) |
| 0.1 | 9.5 | GO:0003727 | single-stranded RNA binding(GO:0003727) |
| 0.1 | 1.6 | GO:0003995 | acyl-CoA dehydrogenase activity(GO:0003995) |
| 0.1 | 0.6 | GO:0047184 | 1-acylglycerophosphocholine O-acyltransferase activity(GO:0047184) |
| 0.1 | 0.9 | GO:0050815 | phosphoserine binding(GO:0050815) |
| 0.1 | 0.9 | GO:0102336 | fatty acid elongase activity(GO:0009922) 3-oxo-arachidoyl-CoA synthase activity(GO:0102336) 3-oxo-cerotoyl-CoA synthase activity(GO:0102337) 3-oxo-lignoceronyl-CoA synthase activity(GO:0102338) |
| 0.1 | 2.5 | GO:0042605 | peptide antigen binding(GO:0042605) |
| 0.1 | 0.8 | GO:0004859 | phospholipase inhibitor activity(GO:0004859) |
| 0.1 | 2.0 | GO:0045295 | gamma-catenin binding(GO:0045295) |
| 0.1 | 5.8 | GO:0016279 | lysine N-methyltransferase activity(GO:0016278) protein-lysine N-methyltransferase activity(GO:0016279) |
| 0.1 | 0.9 | GO:0010181 | FMN binding(GO:0010181) |
| 0.1 | 4.2 | GO:0001540 | beta-amyloid binding(GO:0001540) |
| 0.1 | 2.0 | GO:0008569 | ATP-dependent microtubule motor activity, minus-end-directed(GO:0008569) |
| 0.1 | 14.7 | GO:0000287 | magnesium ion binding(GO:0000287) |
| 0.1 | 0.6 | GO:0003720 | telomerase activity(GO:0003720) RNA-directed DNA polymerase activity(GO:0003964) |
| 0.1 | 3.4 | GO:0004712 | protein serine/threonine/tyrosine kinase activity(GO:0004712) |
| 0.1 | 0.2 | GO:0009383 | rRNA (cytosine-C5-)-methyltransferase activity(GO:0009383) |
| 0.1 | 2.0 | GO:0017166 | vinculin binding(GO:0017166) |
| 0.1 | 4.9 | GO:0015078 | hydrogen ion transmembrane transporter activity(GO:0015078) |
| 0.1 | 11.1 | GO:0048037 | cofactor binding(GO:0048037) |
| 0.1 | 0.7 | GO:0017034 | Rap guanyl-nucleotide exchange factor activity(GO:0017034) |
| 0.1 | 1.6 | GO:0005031 | tumor necrosis factor-activated receptor activity(GO:0005031) death receptor activity(GO:0005035) |
| 0.1 | 1.0 | GO:0070300 | phosphatidic acid binding(GO:0070300) |
| 0.1 | 0.2 | GO:0035650 | AP-1 adaptor complex binding(GO:0035650) |
| 0.1 | 2.4 | GO:0005109 | frizzled binding(GO:0005109) |
| 0.1 | 0.2 | GO:0001588 | dopamine neurotransmitter receptor activity, coupled via Gs(GO:0001588) |
| 0.1 | 0.3 | GO:0004965 | G-protein coupled GABA receptor activity(GO:0004965) |
| 0.1 | 0.4 | GO:0005042 | netrin receptor activity(GO:0005042) |
| 0.1 | 1.1 | GO:0005521 | lamin binding(GO:0005521) |
| 0.1 | 0.5 | GO:0005375 | copper ion transmembrane transporter activity(GO:0005375) |
| 0.1 | 1.0 | GO:0030296 | protein tyrosine kinase activator activity(GO:0030296) |
| 0.0 | 0.3 | GO:0005052 | peroxisome matrix targeting signal-1 binding(GO:0005052) |
| 0.0 | 0.3 | GO:0070579 | methylcytosine dioxygenase activity(GO:0070579) |
| 0.0 | 1.1 | GO:0010485 | H4 histone acetyltransferase activity(GO:0010485) |
| 0.0 | 0.2 | GO:0001007 | transcription factor activity, RNA polymerase III transcription factor binding(GO:0001007) RNA polymerase III type 3 promoter DNA binding(GO:0001032) |
| 0.0 | 0.4 | GO:0004687 | myosin light chain kinase activity(GO:0004687) |
| 0.0 | 2.2 | GO:0061631 | ubiquitin conjugating enzyme activity(GO:0061631) |
| 0.0 | 1.1 | GO:0015269 | calcium-activated potassium channel activity(GO:0015269) |
| 0.0 | 2.3 | GO:0005160 | transforming growth factor beta receptor binding(GO:0005160) |
| 0.0 | 0.4 | GO:0051525 | NFAT protein binding(GO:0051525) |
| 0.0 | 0.8 | GO:0017171 | serine-type peptidase activity(GO:0008236) serine hydrolase activity(GO:0017171) |
| 0.0 | 1.6 | GO:0051059 | NF-kappaB binding(GO:0051059) |
| 0.0 | 1.2 | GO:0043015 | gamma-tubulin binding(GO:0043015) |
| 0.0 | 1.6 | GO:0003707 | steroid hormone receptor activity(GO:0003707) |
| 0.0 | 0.1 | GO:0071820 | N-box binding(GO:0071820) |
| 0.0 | 2.2 | GO:0003743 | translation initiation factor activity(GO:0003743) |
| 0.0 | 0.3 | GO:0008454 | alpha-1,3-mannosylglycoprotein 4-beta-N-acetylglucosaminyltransferase activity(GO:0008454) |
| 0.0 | 2.1 | GO:0001105 | RNA polymerase II transcription coactivator activity(GO:0001105) |
| 0.0 | 0.5 | GO:0051011 | microtubule minus-end binding(GO:0051011) |
| 0.0 | 0.6 | GO:0008195 | phosphatidate phosphatase activity(GO:0008195) |
| 0.0 | 0.3 | GO:0038191 | neuropilin binding(GO:0038191) |
| 0.0 | 0.7 | GO:0008276 | protein methyltransferase activity(GO:0008276) |
| 0.0 | 2.5 | GO:0008201 | heparin binding(GO:0008201) |
| 0.0 | 0.2 | GO:0030548 | acetylcholine receptor regulator activity(GO:0030548) neurotransmitter receptor regulator activity(GO:0099602) |
| 0.0 | 0.3 | GO:0035174 | histone serine kinase activity(GO:0035174) |
| 0.0 | 0.2 | GO:0042608 | T cell receptor binding(GO:0042608) |
| 0.0 | 1.1 | GO:0015459 | potassium channel regulator activity(GO:0015459) |
| 0.0 | 0.4 | GO:0031489 | myosin V binding(GO:0031489) |
| 0.0 | 0.5 | GO:0005385 | zinc ion transmembrane transporter activity(GO:0005385) |
| 0.0 | 0.5 | GO:0005164 | tumor necrosis factor receptor binding(GO:0005164) |
| 0.0 | 0.9 | GO:0005518 | collagen binding(GO:0005518) |
| 0.0 | 0.1 | GO:0097371 | MDM2/MDM4 family protein binding(GO:0097371) |
| 0.0 | 0.4 | GO:1990841 | promoter-specific chromatin binding(GO:1990841) |
Gene overrepresentation in curated gene sets: canonical pathways category:
| Log-likelihood per target | Total log-likelihood | Term | Description |
|---|---|---|---|
| 0.9 | 10.2 | ST TYPE I INTERFERON PATHWAY | Type I Interferon (alpha/beta IFN) Pathway |
| 0.7 | 19.5 | ST G ALPHA S PATHWAY | G alpha s Pathway |
| 0.6 | 12.0 | PID ERB GENOMIC PATHWAY | Validated nuclear estrogen receptor beta network |
| 0.3 | 7.2 | PID IL12 STAT4 PATHWAY | IL12 signaling mediated by STAT4 |
| 0.3 | 22.3 | PID ECADHERIN STABILIZATION PATHWAY | Stabilization and expansion of the E-cadherin adherens junction |
| 0.2 | 22.6 | PID MYC REPRESS PATHWAY | Validated targets of C-MYC transcriptional repression |
| 0.2 | 18.0 | PID HNF3B PATHWAY | FOXA2 and FOXA3 transcription factor networks |
| 0.2 | 3.6 | PID TOLL ENDOGENOUS PATHWAY | Endogenous TLR signaling |
| 0.2 | 11.8 | PID HNF3A PATHWAY | FOXA1 transcription factor network |
| 0.2 | 15.9 | PID CD8 TCR DOWNSTREAM PATHWAY | Downstream signaling in naïve CD8+ T cells |
| 0.2 | 4.6 | PID ERBB NETWORK PATHWAY | ErbB receptor signaling network |
| 0.2 | 16.6 | PID MTOR 4PATHWAY | mTOR signaling pathway |
| 0.1 | 4.6 | PID RHODOPSIN PATHWAY | Visual signal transduction: Rods |
| 0.1 | 11.2 | PID HIF1 TFPATHWAY | HIF-1-alpha transcription factor network |
| 0.1 | 6.2 | PID ERA GENOMIC PATHWAY | Validated nuclear estrogen receptor alpha network |
| 0.1 | 5.2 | PID RXR VDR PATHWAY | RXR and RAR heterodimerization with other nuclear receptor |
| 0.1 | 6.4 | PID TAP63 PATHWAY | Validated transcriptional targets of TAp63 isoforms |
| 0.1 | 4.3 | NABA PROTEOGLYCANS | Genes encoding proteoglycans |
| 0.1 | 4.4 | PID HIV NEF PATHWAY | HIV-1 Nef: Negative effector of Fas and TNF-alpha |
| 0.1 | 2.7 | PID WNT CANONICAL PATHWAY | Canonical Wnt signaling pathway |
| 0.1 | 2.0 | PID SYNDECAN 2 PATHWAY | Syndecan-2-mediated signaling events |
| 0.1 | 0.6 | SA PROGRAMMED CELL DEATH | Programmed cell death, or apoptosis, eliminates damaged or unneeded cells. |
| 0.1 | 5.2 | PID IL4 2PATHWAY | IL4-mediated signaling events |
| 0.1 | 2.3 | ST JNK MAPK PATHWAY | JNK MAPK Pathway |
| 0.1 | 2.9 | PID BMP PATHWAY | BMP receptor signaling |
| 0.1 | 2.1 | PID AR TF PATHWAY | Regulation of Androgen receptor activity |
| 0.0 | 1.3 | PID WNT SIGNALING PATHWAY | Wnt signaling network |
| 0.0 | 1.4 | PID IL6 7 PATHWAY | IL6-mediated signaling events |
| 0.0 | 1.8 | PID REG GR PATHWAY | Glucocorticoid receptor regulatory network |
| 0.0 | 1.8 | PID CASPASE PATHWAY | Caspase cascade in apoptosis |
| 0.0 | 0.7 | PID RB 1PATHWAY | Regulation of retinoblastoma protein |
| 0.0 | 1.1 | NABA BASEMENT MEMBRANES | Genes encoding structural components of basement membranes |
| 0.0 | 0.5 | PID FRA PATHWAY | Validated transcriptional targets of AP1 family members Fra1 and Fra2 |
| 0.0 | 1.5 | NABA COLLAGENS | Genes encoding collagen proteins |
| 0.0 | 0.7 | PID SYNDECAN 4 PATHWAY | Syndecan-4-mediated signaling events |
| 0.0 | 0.3 | PID ANGIOPOIETIN RECEPTOR PATHWAY | Angiopoietin receptor Tie2-mediated signaling |
| 0.0 | 1.5 | PID FAK PATHWAY | Signaling events mediated by focal adhesion kinase |
| 0.0 | 0.4 | ST PHOSPHOINOSITIDE 3 KINASE PATHWAY | PI3K Pathway |
| 0.0 | 0.5 | PID ARF6 PATHWAY | Arf6 signaling events |
| 0.0 | 1.6 | PID P53 DOWNSTREAM PATHWAY | Direct p53 effectors |
| 0.0 | 0.4 | PID PS1 PATHWAY | Presenilin action in Notch and Wnt signaling |
Gene overrepresentation in curated gene sets: REACTOME pathways category:
| Log-likelihood per target | Total log-likelihood | Term | Description |
|---|---|---|---|
| 5.6 | 16.8 | REACTOME ENDOSOMAL VACUOLAR PATHWAY | Genes involved in Endosomal/Vacuolar pathway |
| 4.2 | 58.6 | REACTOME REGULATION OF COMPLEMENT CASCADE | Genes involved in Regulation of Complement cascade |
| 3.6 | 39.1 | REACTOME GLUCURONIDATION | Genes involved in Glucuronidation |
| 3.0 | 51.0 | REACTOME COMPLEMENT CASCADE | Genes involved in Complement cascade |
| 2.0 | 45.6 | REACTOME SYNTHESIS OF BILE ACIDS AND BILE SALTS VIA 7ALPHA HYDROXYCHOLESTEROL | Genes involved in Synthesis of bile acids and bile salts via 7alpha-hydroxycholesterol |
| 1.9 | 26.2 | REACTOME TRYPTOPHAN CATABOLISM | Genes involved in Tryptophan catabolism |
| 1.5 | 52.1 | REACTOME SULFUR AMINO ACID METABOLISM | Genes involved in Sulfur amino acid metabolism |
| 1.5 | 10.7 | REACTOME RECYCLING OF BILE ACIDS AND SALTS | Genes involved in Recycling of bile acids and salts |
| 1.0 | 14.0 | REACTOME PASSIVE TRANSPORT BY AQUAPORINS | Genes involved in Passive Transport by Aquaporins |
| 1.0 | 16.2 | REACTOME VITAMIN B5 PANTOTHENATE METABOLISM | Genes involved in Vitamin B5 (pantothenate) metabolism |
| 0.8 | 17.1 | REACTOME FORMATION OF ATP BY CHEMIOSMOTIC COUPLING | Genes involved in Formation of ATP by chemiosmotic coupling |
| 0.7 | 9.3 | REACTOME REGULATION OF PYRUVATE DEHYDROGENASE PDH COMPLEX | Genes involved in Regulation of pyruvate dehydrogenase (PDH) complex |
| 0.7 | 11.9 | REACTOME MITOCHONDRIAL FATTY ACID BETA OXIDATION | Genes involved in Mitochondrial Fatty Acid Beta-Oxidation |
| 0.7 | 10.9 | REACTOME ABACAVIR TRANSPORT AND METABOLISM | Genes involved in Abacavir transport and metabolism |
| 0.7 | 2.7 | REACTOME BINDING AND ENTRY OF HIV VIRION | Genes involved in Binding and entry of HIV virion |
| 0.7 | 30.3 | REACTOME GLUTATHIONE CONJUGATION | Genes involved in Glutathione conjugation |
| 0.7 | 27.8 | REACTOME METAL ION SLC TRANSPORTERS | Genes involved in Metal ion SLC transporters |
| 0.6 | 2.6 | REACTOME DIGESTION OF DIETARY CARBOHYDRATE | Genes involved in Digestion of dietary carbohydrate |
| 0.6 | 23.1 | REACTOME CASPASE MEDIATED CLEAVAGE OF CYTOSKELETAL PROTEINS | Genes involved in Caspase-mediated cleavage of cytoskeletal proteins |
| 0.6 | 9.5 | REACTOME IL 6 SIGNALING | Genes involved in Interleukin-6 signaling |
| 0.5 | 14.5 | REACTOME CHYLOMICRON MEDIATED LIPID TRANSPORT | Genes involved in Chylomicron-mediated lipid transport |
| 0.4 | 13.3 | REACTOME CHOLESTEROL BIOSYNTHESIS | Genes involved in Cholesterol biosynthesis |
| 0.4 | 5.5 | REACTOME PURINE CATABOLISM | Genes involved in Purine catabolism |
| 0.4 | 5.9 | REACTOME CYTOSOLIC SULFONATION OF SMALL MOLECULES | Genes involved in Cytosolic sulfonation of small molecules |
| 0.4 | 8.4 | REACTOME AMINE DERIVED HORMONES | Genes involved in Amine-derived hormones |
| 0.4 | 5.2 | REACTOME IKK COMPLEX RECRUITMENT MEDIATED BY RIP1 | Genes involved in IKK complex recruitment mediated by RIP1 |
| 0.3 | 15.8 | REACTOME TRANSPORT OF VITAMINS NUCLEOSIDES AND RELATED MOLECULES | Genes involved in Transport of vitamins, nucleosides, and related molecules |
| 0.3 | 4.4 | REACTOME REGULATION OF RHEB GTPASE ACTIVITY BY AMPK | Genes involved in Regulation of Rheb GTPase activity by AMPK |
| 0.3 | 3.0 | REACTOME SEROTONIN RECEPTORS | Genes involved in Serotonin receptors |
| 0.3 | 3.6 | REACTOME METABOLISM OF POLYAMINES | Genes involved in Metabolism of polyamines |
| 0.3 | 8.1 | REACTOME AMINO ACID SYNTHESIS AND INTERCONVERSION TRANSAMINATION | Genes involved in Amino acid synthesis and interconversion (transamination) |
| 0.3 | 5.0 | REACTOME ANTIGEN PRESENTATION FOLDING ASSEMBLY AND PEPTIDE LOADING OF CLASS I MHC | Genes involved in Antigen Presentation: Folding, assembly and peptide loading of class I MHC |
| 0.3 | 7.7 | REACTOME SIGNALING BY NODAL | Genes involved in Signaling by NODAL |
| 0.2 | 13.7 | REACTOME PHASE1 FUNCTIONALIZATION OF COMPOUNDS | Genes involved in Phase 1 - Functionalization of compounds |
| 0.2 | 6.8 | REACTOME SYNTHESIS AND INTERCONVERSION OF NUCLEOTIDE DI AND TRIPHOSPHATES | Genes involved in Synthesis and interconversion of nucleotide di- and triphosphates |
| 0.2 | 6.2 | REACTOME AMINE LIGAND BINDING RECEPTORS | Genes involved in Amine ligand-binding receptors |
| 0.2 | 15.7 | REACTOME RESPIRATORY ELECTRON TRANSPORT | Genes involved in Respiratory electron transport |
| 0.2 | 10.5 | REACTOME GLUCONEOGENESIS | Genes involved in Gluconeogenesis |
| 0.2 | 6.1 | REACTOME CELL EXTRACELLULAR MATRIX INTERACTIONS | Genes involved in Cell-extracellular matrix interactions |
| 0.2 | 23.1 | REACTOME RESPONSE TO ELEVATED PLATELET CYTOSOLIC CA2 | Genes involved in Response to elevated platelet cytosolic Ca2+ |
| 0.2 | 3.2 | REACTOME COMMON PATHWAY | Genes involved in Common Pathway |
| 0.2 | 1.4 | REACTOME NFKB ACTIVATION THROUGH FADD RIP1 PATHWAY MEDIATED BY CASPASE 8 AND10 | Genes involved in NF-kB activation through FADD/RIP-1 pathway mediated by caspase-8 and -10 |
| 0.2 | 7.2 | REACTOME METABOLISM OF STEROID HORMONES AND VITAMINS A AND D | Genes involved in Metabolism of steroid hormones and vitamins A and D |
| 0.2 | 8.1 | REACTOME SEMA4D IN SEMAPHORIN SIGNALING | Genes involved in Sema4D in semaphorin signaling |
| 0.2 | 2.9 | REACTOME BILE SALT AND ORGANIC ANION SLC TRANSPORTERS | Genes involved in Bile salt and organic anion SLC transporters |
| 0.2 | 5.2 | REACTOME REGULATORY RNA PATHWAYS | Genes involved in Regulatory RNA pathways |
| 0.1 | 3.3 | REACTOME FORMATION OF INCISION COMPLEX IN GG NER | Genes involved in Formation of incision complex in GG-NER |
| 0.1 | 2.7 | REACTOME GAP JUNCTION ASSEMBLY | Genes involved in Gap junction assembly |
| 0.1 | 20.9 | REACTOME METABOLISM OF AMINO ACIDS AND DERIVATIVES | Genes involved in Metabolism of amino acids and derivatives |
| 0.1 | 4.4 | REACTOME DEADENYLATION OF MRNA | Genes involved in Deadenylation of mRNA |
| 0.1 | 3.8 | REACTOME DCC MEDIATED ATTRACTIVE SIGNALING | Genes involved in DCC mediated attractive signaling |
| 0.1 | 4.3 | REACTOME CGMP EFFECTS | Genes involved in cGMP effects |
| 0.1 | 1.3 | REACTOME TRANSLOCATION OF ZAP 70 TO IMMUNOLOGICAL SYNAPSE | Genes involved in Translocation of ZAP-70 to Immunological synapse |
| 0.1 | 13.0 | REACTOME NUCLEAR RECEPTOR TRANSCRIPTION PATHWAY | Genes involved in Nuclear Receptor transcription pathway |
| 0.1 | 1.5 | REACTOME EXTRINSIC PATHWAY FOR APOPTOSIS | Genes involved in Extrinsic Pathway for Apoptosis |
| 0.1 | 2.9 | REACTOME DOWNREGULATION OF ERBB2 ERBB3 SIGNALING | Genes involved in Downregulation of ERBB2:ERBB3 signaling |
| 0.1 | 3.2 | REACTOME OTHER SEMAPHORIN INTERACTIONS | Genes involved in Other semaphorin interactions |
| 0.1 | 3.4 | REACTOME SIGNALING BY BMP | Genes involved in Signaling by BMP |
| 0.1 | 5.4 | REACTOME INTRINSIC PATHWAY FOR APOPTOSIS | Genes involved in Intrinsic Pathway for Apoptosis |
| 0.1 | 2.2 | REACTOME ANTIVIRAL MECHANISM BY IFN STIMULATED GENES | Genes involved in Antiviral mechanism by IFN-stimulated genes |
| 0.1 | 3.1 | REACTOME SYNTHESIS OF VERY LONG CHAIN FATTY ACYL COAS | Genes involved in Synthesis of very long-chain fatty acyl-CoAs |
| 0.1 | 0.8 | REACTOME TETRAHYDROBIOPTERIN BH4 SYNTHESIS RECYCLING SALVAGE AND REGULATION | Genes involved in Tetrahydrobiopterin (BH4) synthesis, recycling, salvage and regulation |
| 0.1 | 4.6 | REACTOME METABOLISM OF VITAMINS AND COFACTORS | Genes involved in Metabolism of vitamins and cofactors |
| 0.1 | 1.2 | REACTOME GLYCOGEN BREAKDOWN GLYCOGENOLYSIS | Genes involved in Glycogen breakdown (glycogenolysis) |
| 0.1 | 2.1 | REACTOME NEGATIVE REGULATORS OF RIG I MDA5 SIGNALING | Genes involved in Negative regulators of RIG-I/MDA5 signaling |
| 0.1 | 3.3 | REACTOME TRIGLYCERIDE BIOSYNTHESIS | Genes involved in Triglyceride Biosynthesis |
| 0.1 | 2.7 | REACTOME ACTIVATED NOTCH1 TRANSMITS SIGNAL TO THE NUCLEUS | Genes involved in Activated NOTCH1 Transmits Signal to the Nucleus |
| 0.1 | 0.5 | REACTOME DESTABILIZATION OF MRNA BY KSRP | Genes involved in Destabilization of mRNA by KSRP |
| 0.1 | 1.4 | REACTOME SYNTHESIS SECRETION AND DEACYLATION OF GHRELIN | Genes involved in Synthesis, Secretion, and Deacylation of Ghrelin |
| 0.1 | 0.7 | REACTOME CD28 DEPENDENT VAV1 PATHWAY | Genes involved in CD28 dependent Vav1 pathway |
| 0.1 | 1.2 | REACTOME CLASS C 3 METABOTROPIC GLUTAMATE PHEROMONE RECEPTORS | Genes involved in Class C/3 (Metabotropic glutamate/pheromone receptors) |
| 0.1 | 1.2 | REACTOME ACTIVATION OF GENES BY ATF4 | Genes involved in Activation of Genes by ATF4 |
| 0.1 | 0.6 | REACTOME NOREPINEPHRINE NEUROTRANSMITTER RELEASE CYCLE | Genes involved in Norepinephrine Neurotransmitter Release Cycle |
| 0.1 | 0.8 | REACTOME AMINE COMPOUND SLC TRANSPORTERS | Genes involved in Amine compound SLC transporters |
| 0.0 | 1.1 | REACTOME NEPHRIN INTERACTIONS | Genes involved in Nephrin interactions |
| 0.0 | 0.3 | REACTOME ACTIVATION OF RAC | Genes involved in Activation of Rac |
| 0.0 | 0.3 | REACTOME INWARDLY RECTIFYING K CHANNELS | Genes involved in Inwardly rectifying K+ channels |
| 0.0 | 0.7 | REACTOME FGFR4 LIGAND BINDING AND ACTIVATION | Genes involved in FGFR4 ligand binding and activation |
| 0.0 | 0.4 | REACTOME PRE NOTCH PROCESSING IN GOLGI | Genes involved in Pre-NOTCH Processing in Golgi |
| 0.0 | 0.9 | REACTOME SIGNALING BY HIPPO | Genes involved in Signaling by Hippo |
| 0.0 | 0.8 | REACTOME SIGNALING BY FGFR1 FUSION MUTANTS | Genes involved in Signaling by FGFR1 fusion mutants |
| 0.0 | 0.6 | REACTOME REGULATION OF GENE EXPRESSION IN BETA CELLS | Genes involved in Regulation of gene expression in beta cells |
| 0.0 | 0.7 | REACTOME ACYL CHAIN REMODELLING OF PC | Genes involved in Acyl chain remodelling of PC |
| 0.0 | 1.7 | REACTOME COLLAGEN FORMATION | Genes involved in Collagen formation |
| 0.0 | 0.8 | REACTOME LIGAND GATED ION CHANNEL TRANSPORT | Genes involved in Ligand-gated ion channel transport |
| 0.0 | 0.9 | REACTOME NCAM1 INTERACTIONS | Genes involved in NCAM1 interactions |
| 0.0 | 0.8 | REACTOME DARPP 32 EVENTS | Genes involved in DARPP-32 events |
| 0.0 | 0.4 | REACTOME GRB2 EVENTS IN ERBB2 SIGNALING | Genes involved in GRB2 events in ERBB2 signaling |
| 0.0 | 0.7 | REACTOME GLYCOSPHINGOLIPID METABOLISM | Genes involved in Glycosphingolipid metabolism |
| 0.0 | 0.1 | REACTOME REGULATION OF APOPTOSIS | Genes involved in Regulation of Apoptosis |
| 0.0 | 0.5 | REACTOME G PROTEIN ACTIVATION | Genes involved in G-protein activation |