Project
GSE58827: Dynamics of the Mouse Liver
Navigation
Downloads
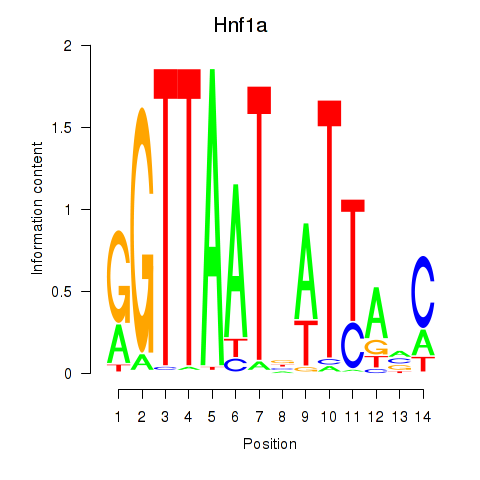
Results for Hnf1a
Z-value: 2.22
Motif logo
Transcription factors associated with Hnf1a
| Gene Symbol | Gene ID | Gene Info |
|---|---|---|
|
Hnf1a
|
ENSMUSG00000029556.13 | HNF1 homeobox A |
Activity-expression correlation:
| Gene | Promoter | Pearson corr. coef. | P-value | Plot |
|---|---|---|---|---|
| Hnf1a | mm39_v1_chr5_-_115109118_115109138 | 0.63 | 3.9e-05 | Click! |
Activity profile of Hnf1a motif
Sorted Z-values of Hnf1a motif
| Promoter | Log-likelihood | Transcript | Gene | Gene Info |
|---|---|---|---|---|
| chr14_+_51333816 | 33.41 |
ENSMUST00000169895.3
|
Rnase4
|
ribonuclease, RNase A family 4 |
| chr7_+_140343652 | 32.22 |
ENSMUST00000026552.9
ENSMUST00000209253.2 ENSMUST00000210235.2 |
Cyp2e1
|
cytochrome P450, family 2, subfamily e, polypeptide 1 |
| chr5_+_90666791 | 27.47 |
ENSMUST00000113179.9
ENSMUST00000128740.2 |
Afm
|
afamin |
| chr1_+_88139678 | 26.95 |
ENSMUST00000073049.7
|
Ugt1a1
|
UDP glucuronosyltransferase 1 family, polypeptide A1 |
| chr11_+_101258368 | 26.28 |
ENSMUST00000019469.3
|
G6pc
|
glucose-6-phosphatase, catalytic |
| chr1_-_130589321 | 25.79 |
ENSMUST00000137276.3
|
C4bp
|
complement component 4 binding protein |
| chr1_-_130589349 | 25.50 |
ENSMUST00000027657.14
|
C4bp
|
complement component 4 binding protein |
| chr5_-_89605622 | 24.53 |
ENSMUST00000049209.13
|
Gc
|
vitamin D binding protein |
| chr12_-_103739847 | 21.79 |
ENSMUST00000078869.6
|
Serpina1d
|
serine (or cysteine) peptidase inhibitor, clade A, member 1D |
| chr6_+_141575226 | 21.38 |
ENSMUST00000042812.9
|
Slco1b2
|
solute carrier organic anion transporter family, member 1b2 |
| chr12_-_103871146 | 17.64 |
ENSMUST00000074051.6
|
Serpina1c
|
serine (or cysteine) peptidase inhibitor, clade A, member 1C |
| chr12_-_103704417 | 16.84 |
ENSMUST00000095450.11
ENSMUST00000187220.2 |
Serpina1b
|
serine (or cysteine) preptidase inhibitor, clade A, member 1B |
| chr12_-_103829810 | 16.46 |
ENSMUST00000085056.8
ENSMUST00000072876.12 ENSMUST00000124717.2 |
Serpina1a
|
serine (or cysteine) peptidase inhibitor, clade A, member 1A |
| chr9_-_71070506 | 16.44 |
ENSMUST00000074465.9
|
Aqp9
|
aquaporin 9 |
| chr2_-_91466739 | 16.41 |
ENSMUST00000111335.2
ENSMUST00000028681.15 |
F2
|
coagulation factor II |
| chr17_+_12597490 | 15.59 |
ENSMUST00000014578.7
|
Plg
|
plasminogen |
| chr2_-_34990689 | 14.48 |
ENSMUST00000226631.2
ENSMUST00000045776.5 ENSMUST00000226972.2 |
AI182371
|
expressed sequence AI182371 |
| chr10_+_87695117 | 14.27 |
ENSMUST00000105300.9
|
Igf1
|
insulin-like growth factor 1 |
| chr5_+_90608751 | 14.22 |
ENSMUST00000031314.10
|
Alb
|
albumin |
| chr15_+_10216041 | 13.47 |
ENSMUST00000130720.8
|
Prlr
|
prolactin receptor |
| chr3_+_129630380 | 13.44 |
ENSMUST00000077918.7
|
Cfi
|
complement component factor i |
| chr10_+_87694924 | 12.94 |
ENSMUST00000095360.11
|
Igf1
|
insulin-like growth factor 1 |
| chr19_+_42034231 | 12.15 |
ENSMUST00000172244.8
ENSMUST00000081714.5 |
Hoga1
|
4-hydroxy-2-oxoglutarate aldolase 1 |
| chr2_-_34951443 | 11.64 |
ENSMUST00000028233.7
|
Hc
|
hemolytic complement |
| chr1_+_88066086 | 11.53 |
ENSMUST00000014263.6
|
Ugt1a6a
|
UDP glucuronosyltransferase 1 family, polypeptide A6A |
| chr1_+_87998487 | 11.03 |
ENSMUST00000073772.5
|
Ugt1a9
|
UDP glucuronosyltransferase 1 family, polypeptide A9 |
| chr2_-_134396268 | 10.96 |
ENSMUST00000028704.3
|
Hao1
|
hydroxyacid oxidase 1, liver |
| chr8_-_122671588 | 9.60 |
ENSMUST00000057653.8
|
Car5a
|
carbonic anhydrase 5a, mitochondrial |
| chr5_+_31454939 | 9.32 |
ENSMUST00000201675.3
|
Gckr
|
glucokinase regulatory protein |
| chr5_+_35198853 | 9.24 |
ENSMUST00000030985.10
ENSMUST00000202573.2 |
Hgfac
|
hepatocyte growth factor activator |
| chr4_+_150938376 | 9.12 |
ENSMUST00000073600.9
|
Errfi1
|
ERBB receptor feedback inhibitor 1 |
| chr2_-_32314017 | 8.42 |
ENSMUST00000113307.9
|
Slc25a25
|
solute carrier family 25 (mitochondrial carrier, phosphate carrier), member 25 |
| chr4_+_138694422 | 8.19 |
ENSMUST00000116094.5
ENSMUST00000239443.2 |
Rnf186
|
ring finger protein 186 |
| chr7_+_51537645 | 8.03 |
ENSMUST00000208711.2
|
Gas2
|
growth arrest specific 2 |
| chr11_-_84058292 | 7.74 |
ENSMUST00000050771.8
|
Gm11437
|
predicted gene 11437 |
| chr16_-_38253507 | 7.72 |
ENSMUST00000002926.8
|
Pla1a
|
phospholipase A1 member A |
| chr2_+_163389068 | 7.71 |
ENSMUST00000109411.8
ENSMUST00000018094.13 |
Hnf4a
|
hepatic nuclear factor 4, alpha |
| chr19_+_56276375 | 7.65 |
ENSMUST00000166049.8
|
Habp2
|
hyaluronic acid binding protein 2 |
| chr1_+_172525613 | 7.45 |
ENSMUST00000038495.5
|
Crp
|
C-reactive protein, pentraxin-related |
| chr9_-_70841881 | 7.18 |
ENSMUST00000214995.2
|
Lipc
|
lipase, hepatic |
| chr11_-_11848107 | 6.99 |
ENSMUST00000178704.8
|
Ddc
|
dopa decarboxylase |
| chr11_+_70410445 | 6.98 |
ENSMUST00000179000.2
|
Gltpd2
|
glycolipid transfer protein domain containing 2 |
| chr19_+_56276343 | 6.82 |
ENSMUST00000095948.11
|
Habp2
|
hyaluronic acid binding protein 2 |
| chr5_+_31454787 | 6.71 |
ENSMUST00000201166.4
ENSMUST00000072228.9 |
Gckr
|
glucokinase regulatory protein |
| chrX_-_137985960 | 6.32 |
ENSMUST00000033626.15
ENSMUST00000060824.4 |
Serpina7
|
serine (or cysteine) peptidase inhibitor, clade A (alpha-1 antiproteinase, antitrypsin), member 7 |
| chrX_+_100420873 | 6.14 |
ENSMUST00000052130.14
|
Gjb1
|
gap junction protein, beta 1 |
| chr11_-_11848044 | 6.01 |
ENSMUST00000066237.10
|
Ddc
|
dopa decarboxylase |
| chr10_-_125164399 | 5.98 |
ENSMUST00000063318.10
|
Slc16a7
|
solute carrier family 16 (monocarboxylic acid transporters), member 7 |
| chr7_-_79492091 | 5.62 |
ENSMUST00000049004.8
|
Anpep
|
alanyl (membrane) aminopeptidase |
| chr5_+_24633206 | 5.59 |
ENSMUST00000115049.9
|
Slc4a2
|
solute carrier family 4 (anion exchanger), member 2 |
| chr18_+_56533389 | 5.56 |
ENSMUST00000237355.2
ENSMUST00000237422.2 |
Gramd3
|
GRAM domain containing 3 |
| chr12_-_103923145 | 5.54 |
ENSMUST00000085054.5
|
Serpina1e
|
serine (or cysteine) peptidase inhibitor, clade A, member 1E |
| chrX_-_137985979 | 5.54 |
ENSMUST00000152457.2
|
Serpina7
|
serine (or cysteine) peptidase inhibitor, clade A (alpha-1 antiproteinase, antitrypsin), member 7 |
| chr2_+_162829250 | 5.52 |
ENSMUST00000018012.14
|
Sgk2
|
serum/glucocorticoid regulated kinase 2 |
| chr4_-_140344373 | 5.23 |
ENSMUST00000154979.2
|
Arhgef10l
|
Rho guanine nucleotide exchange factor (GEF) 10-like |
| chr13_+_55300453 | 5.06 |
ENSMUST00000005452.6
|
Fgfr4
|
fibroblast growth factor receptor 4 |
| chr2_+_162829422 | 4.82 |
ENSMUST00000117123.2
|
Sgk2
|
serum/glucocorticoid regulated kinase 2 |
| chr9_-_70842090 | 4.71 |
ENSMUST00000034731.10
|
Lipc
|
lipase, hepatic |
| chr2_+_163348728 | 4.27 |
ENSMUST00000143911.8
|
Hnf4a
|
hepatic nuclear factor 4, alpha |
| chr8_-_95869114 | 4.24 |
ENSMUST00000212554.2
ENSMUST00000169748.9 ENSMUST00000034240.15 |
Kifc3
|
kinesin family member C3 |
| chr10_+_60925130 | 4.11 |
ENSMUST00000020298.8
|
Pcbd1
|
pterin 4 alpha carbinolamine dehydratase/dimerization cofactor of hepatocyte nuclear factor 1 alpha (TCF1) 1 |
| chr1_-_20688196 | 4.06 |
ENSMUST00000088448.12
|
Pkhd1
|
polycystic kidney and hepatic disease 1 |
| chrX_+_100419965 | 4.06 |
ENSMUST00000119080.8
|
Gjb1
|
gap junction protein, beta 1 |
| chr10_+_60925108 | 3.91 |
ENSMUST00000218005.2
|
Pcbd1
|
pterin 4 alpha carbinolamine dehydratase/dimerization cofactor of hepatocyte nuclear factor 1 alpha (TCF1) 1 |
| chr9_+_21746785 | 3.81 |
ENSMUST00000058777.8
|
Angptl8
|
angiopoietin-like 8 |
| chr7_-_44711771 | 3.70 |
ENSMUST00000210101.2
ENSMUST00000209219.2 |
Prrg2
|
proline-rich Gla (G-carboxyglutamic acid) polypeptide 2 |
| chr12_+_76580386 | 3.60 |
ENSMUST00000219063.2
|
Plekhg3
|
pleckstrin homology domain containing, family G (with RhoGef domain) member 3 |
| chr17_+_12803019 | 3.20 |
ENSMUST00000046959.9
ENSMUST00000233066.2 |
Slc22a2
|
solute carrier family 22 (organic cation transporter), member 2 |
| chr9_-_106035308 | 3.11 |
ENSMUST00000159809.2
ENSMUST00000162562.2 ENSMUST00000036382.13 |
Glyctk
|
glycerate kinase |
| chr9_-_106035332 | 3.03 |
ENSMUST00000112543.9
|
Glyctk
|
glycerate kinase |
| chr3_-_82957104 | 3.01 |
ENSMUST00000048246.5
|
Fgb
|
fibrinogen beta chain |
| chr1_+_133237516 | 2.92 |
ENSMUST00000094557.7
ENSMUST00000192465.2 ENSMUST00000193888.6 ENSMUST00000194044.6 ENSMUST00000184603.8 |
Golt1a
Gm28040
Gm28040
|
golgi transport 1A predicted gene, 28040 predicted gene, 28040 |
| chr11_+_70410009 | 2.90 |
ENSMUST00000057685.3
|
Gltpd2
|
glycolipid transfer protein domain containing 2 |
| chr11_+_118319029 | 2.64 |
ENSMUST00000124861.2
|
C1qtnf1
|
C1q and tumor necrosis factor related protein 1 |
| chr19_-_43879031 | 2.63 |
ENSMUST00000212048.2
|
Dnmbp
|
dynamin binding protein |
| chr17_+_14087827 | 2.52 |
ENSMUST00000239324.2
|
Afdn
|
afadin, adherens junction formation factor |
| chr5_-_114796425 | 2.46 |
ENSMUST00000112225.8
ENSMUST00000071968.9 |
Trpv4
|
transient receptor potential cation channel, subfamily V, member 4 |
| chr9_+_108925727 | 2.37 |
ENSMUST00000130366.2
|
Plxnb1
|
plexin B1 |
| chr12_+_59142439 | 2.32 |
ENSMUST00000219140.3
|
Mia2
|
MIA SH3 domain ER export factor 2 |
| chr6_-_52160816 | 2.23 |
ENSMUST00000134831.2
|
Hoxa3
|
homeobox A3 |
| chr3_-_75177378 | 2.22 |
ENSMUST00000039047.5
|
Serpini2
|
serine (or cysteine) peptidase inhibitor, clade I, member 2 |
| chr12_-_103597663 | 1.94 |
ENSMUST00000121625.2
ENSMUST00000044231.12 |
Serpina10
|
serine (or cysteine) peptidase inhibitor, clade A (alpha-1 antiproteinase, antitrypsin), member 10 |
| chr2_+_91095597 | 1.94 |
ENSMUST00000028691.7
|
Arfgap2
|
ADP-ribosylation factor GTPase activating protein 2 |
| chr4_+_97665992 | 1.94 |
ENSMUST00000107062.9
ENSMUST00000052018.12 ENSMUST00000107057.8 |
Nfia
|
nuclear factor I/A |
| chr11_+_83742961 | 1.84 |
ENSMUST00000146786.8
|
Hnf1b
|
HNF1 homeobox B |
| chr12_-_103623418 | 1.80 |
ENSMUST00000044159.7
|
Serpina6
|
serine (or cysteine) peptidase inhibitor, clade A, member 6 |
| chr10_+_34359395 | 1.68 |
ENSMUST00000019913.15
|
Frk
|
fyn-related kinase |
| chr4_-_32923505 | 1.57 |
ENSMUST00000084749.8
|
Ankrd6
|
ankyrin repeat domain 6 |
| chr4_-_32923389 | 1.49 |
ENSMUST00000035719.11
|
Ankrd6
|
ankyrin repeat domain 6 |
| chr10_+_34359513 | 1.45 |
ENSMUST00000170771.3
|
Frk
|
fyn-related kinase |
| chr3_+_94305824 | 1.44 |
ENSMUST00000050975.6
|
Lingo4
|
leucine rich repeat and Ig domain containing 4 |
| chr17_-_35265702 | 1.43 |
ENSMUST00000097338.11
|
Msh5
|
mutS homolog 5 |
| chr8_+_65399831 | 1.42 |
ENSMUST00000026595.13
ENSMUST00000209852.2 ENSMUST00000079896.9 |
Tmem192
|
transmembrane protein 192 |
| chr3_+_82933383 | 1.37 |
ENSMUST00000029630.15
ENSMUST00000166581.4 |
Fga
|
fibrinogen alpha chain |
| chr4_-_139695337 | 1.35 |
ENSMUST00000105031.4
|
Klhdc7a
|
kelch domain containing 7A |
| chr4_+_97665843 | 1.30 |
ENSMUST00000075448.13
ENSMUST00000092532.13 |
Nfia
|
nuclear factor I/A |
| chr5_+_102992873 | 1.26 |
ENSMUST00000070000.6
|
Arhgap24
|
Rho GTPase activating protein 24 |
| chr5_+_33261563 | 1.04 |
ENSMUST00000011178.5
|
Slc5a1
|
solute carrier family 5 (sodium/glucose cotransporter), member 1 |
| chr7_+_140796559 | 0.81 |
ENSMUST00000148975.3
|
Rassf7
|
Ras association (RalGDS/AF-6) domain family (N-terminal) member 7 |
| chr7_+_140795866 | 0.79 |
ENSMUST00000210993.2
ENSMUST00000133763.8 |
Rassf7
|
Ras association (RalGDS/AF-6) domain family (N-terminal) member 7 |
| chr11_+_115197980 | 0.78 |
ENSMUST00000055490.9
|
Otop2
|
otopetrin 2 |
| chr2_+_74557418 | 0.73 |
ENSMUST00000111980.4
|
Hoxd4
|
homeobox D4 |
| chr17_-_35351026 | 0.68 |
ENSMUST00000025249.7
|
Apom
|
apolipoprotein M |
| chr3_-_122778052 | 0.65 |
ENSMUST00000199401.2
ENSMUST00000197314.5 ENSMUST00000197934.5 ENSMUST00000090379.7 |
Usp53
|
ubiquitin specific peptidase 53 |
| chr14_-_36641470 | 0.59 |
ENSMUST00000182042.2
|
Ccser2
|
coiled-coil serine rich 2 |
| chr18_+_65158873 | 0.46 |
ENSMUST00000226058.2
|
Nedd4l
|
neural precursor cell expressed, developmentally down-regulated gene 4-like |
| chr15_+_7840327 | 0.43 |
ENSMUST00000022744.5
|
Gdnf
|
glial cell line derived neurotrophic factor |
| chr14_-_36641270 | 0.32 |
ENSMUST00000182797.8
|
Ccser2
|
coiled-coil serine rich 2 |
| chr7_+_140796096 | 0.31 |
ENSMUST00000153081.2
|
Rassf7
|
Ras association (RalGDS/AF-6) domain family (N-terminal) member 7 |
| chr6_-_52217821 | 0.27 |
ENSMUST00000121043.2
|
Hoxa10
|
homeobox A10 |
| chr16_+_24266829 | 0.26 |
ENSMUST00000078988.10
|
Lpp
|
LIM domain containing preferred translocation partner in lipoma |
| chrX_-_42256694 | 0.23 |
ENSMUST00000115058.8
ENSMUST00000115059.8 |
Tenm1
|
teneurin transmembrane protein 1 |
| chr15_-_58261093 | 0.22 |
ENSMUST00000227274.3
|
Anxa13
|
annexin A13 |
| chr19_-_47907628 | 0.03 |
ENSMUST00000237029.2
|
Itprip
|
inositol 1,4,5-triphosphate receptor interacting protein |
| chr11_-_78313043 | 0.02 |
ENSMUST00000001122.6
|
Slc13a2
|
solute carrier family 13 (sodium-dependent dicarboxylate transporter), member 2 |
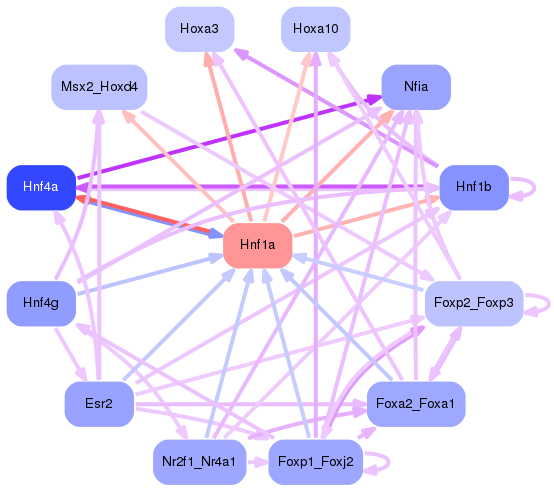
Network of associatons between targets according to the STRING database.

First level regulatory network of Hnf1a
Gene Ontology Analysis
Gene overrepresentation in biological process category:
| Log-likelihood per target | Total log-likelihood | Term | Description |
|---|---|---|---|
| 9.0 | 26.9 | GO:0018879 | biphenyl metabolic process(GO:0018879) |
| 4.7 | 14.2 | GO:0051659 | maintenance of mitochondrion location(GO:0051659) |
| 4.1 | 16.4 | GO:0015855 | nucleobase transport(GO:0015851) pyrimidine nucleobase transport(GO:0015855) |
| 4.0 | 12.0 | GO:1902569 | regulation of activation of JAK2 kinase activity(GO:0010534) activation of JAK2 kinase activity(GO:0042977) negative regulation of activation of JAK2 kinase activity(GO:1902569) |
| 4.0 | 11.9 | GO:0033189 | response to vitamin A(GO:0033189) |
| 3.9 | 27.2 | GO:1904073 | regulation of trophectodermal cell proliferation(GO:1904073) positive regulation of trophectodermal cell proliferation(GO:1904075) |
| 3.3 | 16.4 | GO:1900738 | positive regulation of phospholipase C-activating G-protein coupled receptor signaling pathway(GO:1900738) |
| 3.1 | 15.6 | GO:0051919 | positive regulation of fibrinolysis(GO:0051919) |
| 3.0 | 12.2 | GO:0009436 | glyoxylate catabolic process(GO:0009436) |
| 2.6 | 26.3 | GO:0015760 | hexose phosphate transport(GO:0015712) glucose-6-phosphate transport(GO:0015760) |
| 2.4 | 11.9 | GO:0034371 | chylomicron remodeling(GO:0034371) |
| 2.3 | 11.6 | GO:0010760 | negative regulation of macrophage chemotaxis(GO:0010760) |
| 2.3 | 16.0 | GO:0009750 | response to fructose(GO:0009750) |
| 2.2 | 13.5 | GO:0038161 | prolactin signaling pathway(GO:0038161) |
| 2.2 | 11.0 | GO:0009441 | glycolate metabolic process(GO:0009441) |
| 2.1 | 22.6 | GO:0052696 | flavonoid glucuronidation(GO:0052696) xenobiotic glucuronidation(GO:0052697) |
| 1.9 | 13.0 | GO:0015842 | aminergic neurotransmitter loading into synaptic vesicle(GO:0015842) |
| 1.7 | 5.1 | GO:0061144 | alveolar secondary septum development(GO:0061144) |
| 1.5 | 9.1 | GO:0010616 | negative regulation of cardiac muscle adaptation(GO:0010616) negative regulation of cardiac muscle hypertrophy in response to stress(GO:1903243) |
| 1.2 | 24.5 | GO:0042359 | vitamin D metabolic process(GO:0042359) |
| 1.1 | 4.4 | GO:0043152 | induction of bacterial agglutination(GO:0043152) |
| 1.1 | 31.2 | GO:0017144 | drug metabolic process(GO:0017144) |
| 1.1 | 16.8 | GO:0006857 | oligopeptide transport(GO:0006857) |
| 0.9 | 7.5 | GO:0032929 | negative regulation of superoxide anion generation(GO:0032929) |
| 0.9 | 10.2 | GO:0015868 | purine ribonucleotide transport(GO:0015868) |
| 0.9 | 6.0 | GO:1901475 | pyruvate transmembrane transport(GO:1901475) |
| 0.8 | 2.5 | GO:0071640 | regulation of macrophage inflammatory protein 1 alpha production(GO:0071640) |
| 0.8 | 8.0 | GO:0006729 | tetrahydrobiopterin biosynthetic process(GO:0006729) |
| 0.6 | 3.8 | GO:0051005 | negative regulation of lipoprotein lipase activity(GO:0051005) |
| 0.6 | 4.2 | GO:0045218 | zonula adherens maintenance(GO:0045218) |
| 0.6 | 2.4 | GO:1900220 | semaphorin-plexin signaling pathway involved in bone trabecula morphogenesis(GO:1900220) |
| 0.5 | 1.8 | GO:0061206 | regulation of pronephros size(GO:0035565) mesonephros morphogenesis(GO:0061206) mesonephric nephron development(GO:0061215) mesonephric nephron morphogenesis(GO:0061228) mesenchymal stem cell maintenance involved in mesonephric nephron morphogenesis(GO:0061235) regulation of mesenchymal cell apoptotic process involved in mesonephric nephron morphogenesis(GO:0061295) negative regulation of mesenchymal cell apoptotic process involved in mesonephric nephron morphogenesis(GO:0061296) mesenchymal cell apoptotic process involved in mesonephric nephron morphogenesis(GO:1901146) |
| 0.4 | 22.1 | GO:0051180 | vitamin transport(GO:0051180) |
| 0.4 | 2.5 | GO:0034334 | adherens junction maintenance(GO:0034334) |
| 0.4 | 64.7 | GO:0006958 | complement activation, classical pathway(GO:0006958) |
| 0.4 | 2.2 | GO:0021615 | specification of organ position(GO:0010159) glossopharyngeal nerve morphogenesis(GO:0021615) |
| 0.3 | 16.8 | GO:0006953 | acute-phase response(GO:0006953) |
| 0.3 | 5.6 | GO:0035814 | negative regulation of renal sodium excretion(GO:0035814) |
| 0.3 | 2.6 | GO:2000860 | positive regulation of mineralocorticoid secretion(GO:2000857) positive regulation of aldosterone secretion(GO:2000860) |
| 0.2 | 0.7 | GO:0034443 | negative regulation of lipoprotein oxidation(GO:0034443) |
| 0.2 | 0.4 | GO:0072107 | regulation of ureteric bud formation(GO:0072106) positive regulation of ureteric bud formation(GO:0072107) |
| 0.2 | 5.2 | GO:0071501 | response to sterol depletion(GO:0006991) SREBP signaling pathway(GO:0032933) cellular response to sterol depletion(GO:0071501) |
| 0.2 | 1.0 | GO:0001951 | intestinal D-glucose absorption(GO:0001951) |
| 0.2 | 8.4 | GO:0014823 | response to activity(GO:0014823) |
| 0.2 | 3.1 | GO:2000096 | positive regulation of Wnt signaling pathway, planar cell polarity pathway(GO:2000096) |
| 0.2 | 3.2 | GO:0015697 | quaternary ammonium group transport(GO:0015697) |
| 0.2 | 33.4 | GO:0009267 | cellular response to starvation(GO:0009267) |
| 0.2 | 3.2 | GO:0072189 | ureter development(GO:0072189) |
| 0.1 | 9.6 | GO:0006094 | gluconeogenesis(GO:0006094) |
| 0.1 | 61.4 | GO:0043434 | response to peptide hormone(GO:0043434) |
| 0.1 | 1.3 | GO:0035021 | negative regulation of Rac protein signal transduction(GO:0035021) |
| 0.1 | 1.4 | GO:0051026 | chiasma assembly(GO:0051026) |
| 0.1 | 4.1 | GO:0051898 | negative regulation of protein kinase B signaling(GO:0051898) |
| 0.1 | 2.3 | GO:0070328 | acylglycerol homeostasis(GO:0055090) triglyceride homeostasis(GO:0070328) |
| 0.1 | 10.4 | GO:0032411 | positive regulation of transporter activity(GO:0032411) |
| 0.1 | 5.6 | GO:0051453 | regulation of intracellular pH(GO:0051453) |
| 0.0 | 8.0 | GO:0007050 | cell cycle arrest(GO:0007050) |
| 0.0 | 3.1 | GO:0038083 | peptidyl-tyrosine autophosphorylation(GO:0038083) |
| 0.0 | 5.6 | GO:0016042 | lipid catabolic process(GO:0016042) |
| 0.0 | 0.7 | GO:0010996 | response to auditory stimulus(GO:0010996) |
| 0.0 | 0.3 | GO:0060065 | uterus development(GO:0060065) |
| 0.0 | 3.0 | GO:0035023 | regulation of Rho protein signal transduction(GO:0035023) |
| 0.0 | 1.4 | GO:0051965 | positive regulation of synapse assembly(GO:0051965) |
Gene overrepresentation in cellular component category:
| Log-likelihood per target | Total log-likelihood | Term | Description |
|---|---|---|---|
| 2.7 | 27.2 | GO:0042567 | insulin-like growth factor ternary complex(GO:0042567) |
| 2.6 | 15.6 | GO:0044279 | other organism cell membrane(GO:0044218) other organism membrane(GO:0044279) |
| 1.8 | 26.9 | GO:0034663 | endoplasmic reticulum chaperone complex(GO:0034663) |
| 1.5 | 11.6 | GO:0005579 | membrane attack complex(GO:0005579) |
| 0.5 | 4.4 | GO:0005577 | fibrinogen complex(GO:0005577) |
| 0.4 | 10.2 | GO:0005922 | connexon complex(GO:0005922) |
| 0.4 | 5.6 | GO:0031983 | vesicle lumen(GO:0031983) |
| 0.3 | 82.6 | GO:0072562 | blood microparticle(GO:0072562) |
| 0.3 | 12.6 | GO:0034364 | high-density lipoprotein particle(GO:0034364) |
| 0.3 | 58.1 | GO:0031227 | intrinsic component of endoplasmic reticulum membrane(GO:0031227) |
| 0.3 | 4.2 | GO:0005915 | zonula adherens(GO:0005915) |
| 0.2 | 7.7 | GO:0002080 | acrosomal membrane(GO:0002080) |
| 0.1 | 9.2 | GO:0005791 | rough endoplasmic reticulum(GO:0005791) |
| 0.1 | 6.7 | GO:0005881 | cytoplasmic microtubule(GO:0005881) |
| 0.1 | 2.3 | GO:0070971 | endoplasmic reticulum exit site(GO:0070971) |
| 0.1 | 22.1 | GO:0016323 | basolateral plasma membrane(GO:0016323) |
| 0.1 | 12.3 | GO:0031234 | extrinsic component of cytoplasmic side of plasma membrane(GO:0031234) |
| 0.1 | 7.5 | GO:0030175 | filopodium(GO:0030175) |
| 0.1 | 13.0 | GO:0008021 | synaptic vesicle(GO:0008021) |
| 0.0 | 11.0 | GO:0005777 | peroxisome(GO:0005777) microbody(GO:0042579) |
| 0.0 | 76.8 | GO:0005794 | Golgi apparatus(GO:0005794) |
| 0.0 | 4.1 | GO:0072686 | mitotic spindle(GO:0072686) |
| 0.0 | 18.1 | GO:0005743 | mitochondrial inner membrane(GO:0005743) |
| 0.0 | 2.6 | GO:0005581 | collagen trimer(GO:0005581) |
| 0.0 | 12.4 | GO:0005667 | transcription factor complex(GO:0005667) |
| 0.0 | 2.5 | GO:0005913 | cell-cell adherens junction(GO:0005913) |
| 0.0 | 1.4 | GO:0031463 | Cul3-RING ubiquitin ligase complex(GO:0031463) |
| 0.0 | 1.4 | GO:0005770 | late endosome(GO:0005770) |
| 0.0 | 1.4 | GO:0000795 | synaptonemal complex(GO:0000795) |
Gene overrepresentation in molecular function category:
| Log-likelihood per target | Total log-likelihood | Term | Description |
|---|---|---|---|
| 9.2 | 27.5 | GO:0008431 | vitamin E binding(GO:0008431) |
| 6.6 | 26.3 | GO:0004346 | glucose-6-phosphatase activity(GO:0004346) sugar-terminal-phosphatase activity(GO:0050309) |
| 6.1 | 24.5 | GO:1902271 | D3 vitamins binding(GO:1902271) |
| 4.0 | 12.0 | GO:0070540 | stearic acid binding(GO:0070540) |
| 3.3 | 16.4 | GO:0005350 | purine nucleobase transmembrane transporter activity(GO:0005345) pyrimidine nucleobase transmembrane transporter activity(GO:0005350) nucleobase transmembrane transporter activity(GO:0015205) glycerol channel activity(GO:0015254) |
| 3.3 | 19.6 | GO:0008970 | phosphatidylcholine 1-acylhydrolase activity(GO:0008970) |
| 3.2 | 13.0 | GO:0036468 | aromatic-L-amino-acid decarboxylase activity(GO:0004058) L-dopa decarboxylase activity(GO:0036468) |
| 3.0 | 12.2 | GO:0016833 | oxo-acid-lyase activity(GO:0016833) |
| 2.7 | 11.0 | GO:0016899 | oxidoreductase activity, acting on the CH-OH group of donors, oxygen as acceptor(GO:0016899) |
| 2.7 | 13.5 | GO:0004925 | prolactin receptor activity(GO:0004925) |
| 2.7 | 8.0 | GO:0008124 | 4-alpha-hydroxytetrahydrobiopterin dehydratase activity(GO:0008124) |
| 1.9 | 16.8 | GO:0015198 | oligopeptide transporter activity(GO:0015198) |
| 1.6 | 16.0 | GO:0070095 | fructose-6-phosphate binding(GO:0070095) |
| 1.5 | 16.4 | GO:0070053 | thrombospondin receptor activity(GO:0070053) |
| 1.2 | 49.5 | GO:0015020 | glucuronosyltransferase activity(GO:0015020) |
| 1.1 | 3.2 | GO:0005333 | acetylcholine transmembrane transporter activity(GO:0005277) norepinephrine transmembrane transporter activity(GO:0005333) acetate ester transmembrane transporter activity(GO:1901375) |
| 1.0 | 15.6 | GO:1990405 | protein antigen binding(GO:1990405) |
| 0.9 | 7.5 | GO:0001849 | complement component C1q binding(GO:0001849) |
| 0.9 | 32.2 | GO:0008392 | arachidonic acid epoxygenase activity(GO:0008392) |
| 0.9 | 6.0 | GO:0050833 | pyruvate transmembrane transporter activity(GO:0050833) |
| 0.8 | 2.5 | GO:0015275 | stretch-activated, cation-selective, calcium channel activity(GO:0015275) |
| 0.8 | 8.4 | GO:0015217 | ATP transmembrane transporter activity(GO:0005347) ADP transmembrane transporter activity(GO:0015217) |
| 0.7 | 14.2 | GO:0015643 | toxic substance binding(GO:0015643) |
| 0.6 | 10.2 | GO:0005243 | gap junction channel activity(GO:0005243) |
| 0.6 | 27.2 | GO:0043539 | insulin-like growth factor receptor binding(GO:0005159) protein serine/threonine kinase activator activity(GO:0043539) |
| 0.5 | 83.8 | GO:0004867 | serine-type endopeptidase inhibitor activity(GO:0004867) |
| 0.5 | 9.6 | GO:0004089 | carbonate dehydratase activity(GO:0004089) |
| 0.5 | 5.1 | GO:0005007 | fibroblast growth factor-activated receptor activity(GO:0005007) |
| 0.4 | 10.3 | GO:0017081 | chloride channel regulator activity(GO:0017081) |
| 0.3 | 5.6 | GO:0008510 | sodium:bicarbonate symporter activity(GO:0008510) |
| 0.2 | 32.5 | GO:0004540 | ribonuclease activity(GO:0004540) |
| 0.2 | 11.5 | GO:0005044 | scavenger receptor activity(GO:0005044) |
| 0.2 | 5.6 | GO:0070006 | metalloaminopeptidase activity(GO:0070006) |
| 0.2 | 2.4 | GO:0017154 | semaphorin receptor activity(GO:0017154) |
| 0.2 | 2.5 | GO:0030274 | LIM domain binding(GO:0030274) |
| 0.1 | 0.4 | GO:0030116 | glial cell-derived neurotrophic factor receptor binding(GO:0030116) |
| 0.1 | 4.2 | GO:0008569 | ATP-dependent microtubule motor activity, minus-end-directed(GO:0008569) |
| 0.1 | 23.0 | GO:0004252 | serine-type endopeptidase activity(GO:0004252) |
| 0.1 | 1.4 | GO:0030983 | mismatched DNA binding(GO:0030983) |
| 0.1 | 10.7 | GO:0004866 | endopeptidase inhibitor activity(GO:0004866) |
| 0.1 | 8.2 | GO:0005089 | Rho guanyl-nucleotide exchange factor activity(GO:0005089) |
| 0.0 | 2.2 | GO:0071837 | HMG box domain binding(GO:0071837) |
| 0.0 | 3.1 | GO:0004715 | non-membrane spanning protein tyrosine kinase activity(GO:0004715) |
| 0.0 | 9.1 | GO:0017124 | SH3 domain binding(GO:0017124) |
| 0.0 | 2.6 | GO:0005518 | collagen binding(GO:0005518) |
| 0.0 | 3.0 | GO:0051087 | chaperone binding(GO:0051087) |
| 0.0 | 0.5 | GO:0019871 | sodium channel inhibitor activity(GO:0019871) |
| 0.0 | 0.2 | GO:1901611 | phosphatidylglycerol binding(GO:1901611) |
Gene overrepresentation in curated gene sets: canonical pathways category:
| Log-likelihood per target | Total log-likelihood | Term | Description |
|---|---|---|---|
| 0.7 | 16.4 | PID THROMBIN PAR4 PATHWAY | PAR4-mediated thrombin signaling events |
| 0.4 | 27.2 | PID ER NONGENOMIC PATHWAY | Plasma membrane estrogen receptor signaling |
| 0.4 | 20.0 | PID UPA UPAR PATHWAY | Urokinase-type plasminogen activator (uPA) and uPAR-mediated signaling |
| 0.3 | 26.3 | PID FOXO PATHWAY | FoxO family signaling |
| 0.3 | 16.1 | PID HNF3B PATHWAY | FOXA2 and FOXA3 transcription factor networks |
| 0.2 | 13.5 | PID PTP1B PATHWAY | Signaling events mediated by PTP1B |
| 0.1 | 7.5 | PID IL6 7 PATHWAY | IL6-mediated signaling events |
| 0.1 | 28.7 | NABA ECM REGULATORS | Genes encoding enzymes and their regulators involved in the remodeling of the extracellular matrix |
| 0.1 | 12.0 | PID SMAD2 3NUCLEAR PATHWAY | Regulation of nuclear SMAD2/3 signaling |
| 0.1 | 5.1 | PID FGF PATHWAY | FGF signaling pathway |
| 0.1 | 4.5 | PID ECADHERIN STABILIZATION PATHWAY | Stabilization and expansion of the E-cadherin adherens junction |
| 0.1 | 6.7 | PID CASPASE PATHWAY | Caspase cascade in apoptosis |
| 0.1 | 3.2 | PID HNF3A PATHWAY | FOXA1 transcription factor network |
| 0.1 | 5.6 | PID CMYB PATHWAY | C-MYB transcription factor network |
| 0.0 | 3.6 | PID RHOA REG PATHWAY | Regulation of RhoA activity |
| 0.0 | 2.6 | PID CDC42 REG PATHWAY | Regulation of CDC42 activity |
| 0.0 | 6.1 | NABA SECRETED FACTORS | Genes encoding secreted soluble factors |
| 0.0 | 0.8 | ST WNT BETA CATENIN PATHWAY | Wnt/beta-catenin Pathway |
| 0.0 | 0.3 | PID HDAC CLASSIII PATHWAY | Signaling events mediated by HDAC Class III |
Gene overrepresentation in curated gene sets: REACTOME pathways category:
| Log-likelihood per target | Total log-likelihood | Term | Description |
|---|---|---|---|
| 10.7 | 32.2 | REACTOME XENOBIOTICS | Genes involved in Xenobiotics |
| 3.5 | 38.0 | REACTOME GLUCURONIDATION | Genes involved in Glucuronidation |
| 1.3 | 14.2 | REACTOME RECYCLING OF BILE ACIDS AND SALTS | Genes involved in Recycling of bile acids and salts |
| 1.2 | 20.8 | REACTOME COMMON PATHWAY | Genes involved in Common Pathway |
| 1.2 | 16.4 | REACTOME PASSIVE TRANSPORT BY AQUAPORINS | Genes involved in Passive Transport by Aquaporins |
| 1.0 | 13.4 | REACTOME REGULATION OF COMPLEMENT CASCADE | Genes involved in Regulation of Complement cascade |
| 0.9 | 7.5 | REACTOME CREATION OF C4 AND C2 ACTIVATORS | Genes involved in Creation of C4 and C2 activators |
| 0.7 | 42.3 | REACTOME GLUCOSE TRANSPORT | Genes involved in Glucose transport |
| 0.6 | 13.0 | REACTOME AMINE DERIVED HORMONES | Genes involved in Amine-derived hormones |
| 0.6 | 24.5 | REACTOME STEROID HORMONES | Genes involved in Steroid hormones |
| 0.5 | 15.6 | REACTOME DEGRADATION OF THE EXTRACELLULAR MATRIX | Genes involved in Degradation of the extracellular matrix |
| 0.5 | 10.2 | REACTOME GAP JUNCTION ASSEMBLY | Genes involved in Gap junction assembly |
| 0.5 | 13.5 | REACTOME PROLACTIN RECEPTOR SIGNALING | Genes involved in Prolactin receptor signaling |
| 0.4 | 11.9 | REACTOME CHYLOMICRON MEDIATED LIPID TRANSPORT | Genes involved in Chylomicron-mediated lipid transport |
| 0.4 | 6.0 | REACTOME BILE SALT AND ORGANIC ANION SLC TRANSPORTERS | Genes involved in Bile salt and organic anion SLC transporters |
| 0.3 | 10.3 | REACTOME REGULATION OF GENE EXPRESSION IN BETA CELLS | Genes involved in Regulation of gene expression in beta cells |
| 0.3 | 5.1 | REACTOME FGFR4 LIGAND BINDING AND ACTIVATION | Genes involved in FGFR4 ligand binding and activation |
| 0.2 | 3.2 | REACTOME NOREPINEPHRINE NEUROTRANSMITTER RELEASE CYCLE | Genes involved in Norepinephrine Neurotransmitter Release Cycle |
| 0.2 | 8.0 | REACTOME CASPASE MEDIATED CLEAVAGE OF CYTOSKELETAL PROTEINS | Genes involved in Caspase-mediated cleavage of cytoskeletal proteins |
| 0.1 | 1.8 | REACTOME REGULATION OF BETA CELL DEVELOPMENT | Genes involved in Regulation of beta-cell development |
| 0.1 | 4.2 | REACTOME ASSOCIATION OF TRIC CCT WITH TARGET PROTEINS DURING BIOSYNTHESIS | Genes involved in Association of TriC/CCT with target proteins during biosynthesis |
| 0.1 | 18.1 | REACTOME METABOLISM OF AMINO ACIDS AND DERIVATIVES | Genes involved in Metabolism of amino acids and derivatives |
| 0.1 | 2.4 | REACTOME SEMA4D INDUCED CELL MIGRATION AND GROWTH CONE COLLAPSE | Genes involved in Sema4D induced cell migration and growth-cone collapse |
| 0.0 | 1.4 | REACTOME MEIOTIC RECOMBINATION | Genes involved in Meiotic Recombination |
| 0.0 | 5.6 | REACTOME TRANSPORT OF INORGANIC CATIONS ANIONS AND AMINO ACIDS OLIGOPEPTIDES | Genes involved in Transport of inorganic cations/anions and amino acids/oligopeptides |