Project
GSE58827: Dynamics of the Mouse Liver
Navigation
Downloads
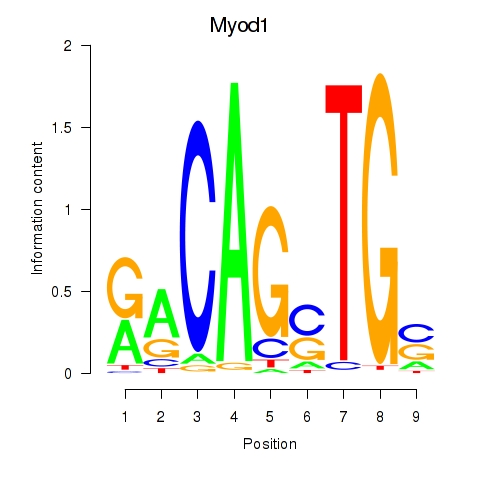
Results for Myod1
Z-value: 1.50
Motif logo
Transcription factors associated with Myod1
| Gene Symbol | Gene ID | Gene Info |
|---|---|---|
|
Myod1
|
ENSMUSG00000009471.5 | myogenic differentiation 1 |
Activity-expression correlation:
| Gene | Promoter | Pearson corr. coef. | P-value | Plot |
|---|---|---|---|---|
| Myod1 | mm39_v1_chr7_+_46025890_46025904 | 0.65 | 2.0e-05 | Click! |
Activity profile of Myod1 motif
Sorted Z-values of Myod1 motif
| Promoter | Log-likelihood | Transcript | Gene | Gene Info |
|---|---|---|---|---|
| chr8_+_23629080 | 20.37 |
ENSMUST00000033947.15
|
Ank1
|
ankyrin 1, erythroid |
| chr8_+_23629046 | 15.54 |
ENSMUST00000121075.8
|
Ank1
|
ankyrin 1, erythroid |
| chr1_-_132318039 | 13.05 |
ENSMUST00000132435.2
|
Tmcc2
|
transmembrane and coiled-coil domains 2 |
| chr17_+_37180437 | 12.90 |
ENSMUST00000060524.11
|
Trim10
|
tripartite motif-containing 10 |
| chr7_-_142223662 | 10.51 |
ENSMUST00000228850.2
|
Gm49394
|
predicted gene, 49394 |
| chr7_+_141995545 | 10.23 |
ENSMUST00000105971.8
ENSMUST00000145287.8 |
Tnni2
|
troponin I, skeletal, fast 2 |
| chr6_-_125471666 | 9.83 |
ENSMUST00000032492.9
|
Cd9
|
CD9 antigen |
| chr7_+_126810780 | 9.71 |
ENSMUST00000032910.13
|
Mylpf
|
myosin light chain, phosphorylatable, fast skeletal muscle |
| chr12_-_76756772 | 9.30 |
ENSMUST00000166101.2
|
Sptb
|
spectrin beta, erythrocytic |
| chr12_+_109425769 | 9.04 |
ENSMUST00000173812.2
|
Dlk1
|
delta like non-canonical Notch ligand 1 |
| chr7_+_44866635 | 8.99 |
ENSMUST00000097216.5
ENSMUST00000209343.2 ENSMUST00000209678.2 |
Tead2
|
TEA domain family member 2 |
| chr11_-_53918916 | 8.72 |
ENSMUST00000020586.7
|
Slc22a4
|
solute carrier family 22 (organic cation transporter), member 4 |
| chr3_-_100396635 | 8.61 |
ENSMUST00000061455.9
|
Tent5c
|
terminal nucleotidyltransferase 5C |
| chr18_+_34973605 | 8.49 |
ENSMUST00000043484.8
|
Reep2
|
receptor accessory protein 2 |
| chr5_+_123214332 | 8.06 |
ENSMUST00000067505.15
ENSMUST00000111619.10 ENSMUST00000160344.2 |
Tmem120b
|
transmembrane protein 120B |
| chr11_-_69496655 | 7.98 |
ENSMUST00000047889.13
|
Atp1b2
|
ATPase, Na+/K+ transporting, beta 2 polypeptide |
| chr7_+_126811831 | 7.47 |
ENSMUST00000127710.3
|
Mylpf
|
myosin light chain, phosphorylatable, fast skeletal muscle |
| chr11_+_58531220 | 7.45 |
ENSMUST00000075084.5
|
Trim58
|
tripartite motif-containing 58 |
| chr11_+_115790768 | 7.35 |
ENSMUST00000152171.8
|
Smim5
|
small integral membrane protein 5 |
| chr4_-_43523388 | 7.31 |
ENSMUST00000107913.10
ENSMUST00000030184.12 |
Tpm2
|
tropomyosin 2, beta |
| chr1_-_75110511 | 7.19 |
ENSMUST00000027405.6
|
Slc23a3
|
solute carrier family 23 (nucleobase transporters), member 3 |
| chr17_-_26417982 | 7.09 |
ENSMUST00000142410.2
ENSMUST00000120333.8 ENSMUST00000039113.14 |
Pdia2
|
protein disulfide isomerase associated 2 |
| chr17_-_26420300 | 6.66 |
ENSMUST00000025019.9
|
Arhgdig
|
Rho GDP dissociation inhibitor (GDI) gamma |
| chrX_-_138772383 | 6.61 |
ENSMUST00000033811.14
ENSMUST00000087401.12 |
Morc4
|
microrchidia 4 |
| chr2_+_103800553 | 6.59 |
ENSMUST00000111140.3
ENSMUST00000111139.3 |
Lmo2
|
LIM domain only 2 |
| chr2_-_113883285 | 6.58 |
ENSMUST00000090269.7
|
Actc1
|
actin, alpha, cardiac muscle 1 |
| chr8_+_95703728 | 6.37 |
ENSMUST00000179619.9
|
Adgrg1
|
adhesion G protein-coupled receptor G1 |
| chr2_+_103800459 | 6.35 |
ENSMUST00000111143.8
ENSMUST00000138815.2 |
Lmo2
|
LIM domain only 2 |
| chr8_-_112417633 | 6.34 |
ENSMUST00000034435.7
|
Ctrb1
|
chymotrypsinogen B1 |
| chr7_+_110371811 | 6.18 |
ENSMUST00000005829.13
|
Ampd3
|
adenosine monophosphate deaminase 3 |
| chr9_+_107852733 | 6.15 |
ENSMUST00000035216.11
|
Uba7
|
ubiquitin-like modifier activating enzyme 7 |
| chrX_-_51702790 | 5.81 |
ENSMUST00000069360.14
|
Gpc3
|
glypican 3 |
| chr4_-_43523595 | 5.80 |
ENSMUST00000107914.10
|
Tpm2
|
tropomyosin 2, beta |
| chr17_+_47816042 | 5.64 |
ENSMUST00000183044.8
ENSMUST00000037333.17 |
Ccnd3
|
cyclin D3 |
| chr4_-_133600308 | 5.60 |
ENSMUST00000137486.3
|
Rps6ka1
|
ribosomal protein S6 kinase polypeptide 1 |
| chr11_+_115790951 | 5.56 |
ENSMUST00000142089.2
ENSMUST00000131566.2 |
Smim5
|
small integral membrane protein 5 |
| chr10_-_128236317 | 5.55 |
ENSMUST00000167859.2
ENSMUST00000218858.2 |
Slc39a5
|
solute carrier family 39 (metal ion transporter), member 5 |
| chr11_+_104468107 | 5.51 |
ENSMUST00000106956.10
|
Myl4
|
myosin, light polypeptide 4 |
| chr17_+_47815968 | 5.43 |
ENSMUST00000182129.8
ENSMUST00000171031.8 |
Ccnd3
|
cyclin D3 |
| chr17_-_26420332 | 5.42 |
ENSMUST00000121959.3
|
Arhgdig
|
Rho GDP dissociation inhibitor (GDI) gamma |
| chr9_-_21874802 | 5.40 |
ENSMUST00000006397.7
|
Epor
|
erythropoietin receptor |
| chr17_+_47816074 | 5.39 |
ENSMUST00000183177.8
ENSMUST00000182848.8 |
Ccnd3
|
cyclin D3 |
| chr4_-_43523745 | 5.27 |
ENSMUST00000150592.2
|
Tpm2
|
tropomyosin 2, beta |
| chr15_-_66703471 | 5.08 |
ENSMUST00000164163.8
|
Sla
|
src-like adaptor |
| chr11_-_53371050 | 5.04 |
ENSMUST00000104955.4
|
Sowaha
|
sosondowah ankyrin repeat domain family member A |
| chr17_+_47816137 | 5.03 |
ENSMUST00000182935.8
ENSMUST00000182506.8 |
Ccnd3
|
cyclin D3 |
| chr9_+_62746055 | 4.94 |
ENSMUST00000034776.13
|
Cln6
|
ceroid-lipofuscinosis, neuronal 6 |
| chr4_+_114945905 | 4.88 |
ENSMUST00000171877.8
ENSMUST00000177647.8 ENSMUST00000106548.9 ENSMUST00000030488.3 |
Pdzk1ip1
|
PDZK1 interacting protein 1 |
| chr7_+_19144950 | 4.85 |
ENSMUST00000208710.2
ENSMUST00000003643.3 |
Ckm
|
creatine kinase, muscle |
| chrX_-_51702813 | 4.84 |
ENSMUST00000114857.2
|
Gpc3
|
glypican 3 |
| chr3_+_95496270 | 4.83 |
ENSMUST00000176674.8
ENSMUST00000177389.8 ENSMUST00000176755.8 ENSMUST00000177399.2 |
Golph3l
|
golgi phosphoprotein 3-like |
| chr11_+_104467791 | 4.78 |
ENSMUST00000106957.8
|
Myl4
|
myosin, light polypeptide 4 |
| chr3_+_95496239 | 4.68 |
ENSMUST00000177390.8
ENSMUST00000060323.12 ENSMUST00000098861.11 |
Golph3l
|
golgi phosphoprotein 3-like |
| chr4_-_116228921 | 4.68 |
ENSMUST00000239239.2
ENSMUST00000239177.2 |
Mast2
|
microtubule associated serine/threonine kinase 2 |
| chr7_+_28533279 | 4.60 |
ENSMUST00000208971.2
ENSMUST00000066723.15 |
Lgals4
|
lectin, galactose binding, soluble 4 |
| chr11_+_69806866 | 4.48 |
ENSMUST00000134581.2
|
Gps2
|
G protein pathway suppressor 2 |
| chr17_+_28988271 | 4.36 |
ENSMUST00000233984.2
ENSMUST00000233460.2 |
Mapk13
|
mitogen-activated protein kinase 13 |
| chr1_-_88133472 | 4.32 |
ENSMUST00000119972.4
|
Dnajb3
|
DnaJ heat shock protein family (Hsp40) member B3 |
| chr15_-_78657640 | 4.25 |
ENSMUST00000018313.6
|
Mfng
|
MFNG O-fucosylpeptide 3-beta-N-acetylglucosaminyltransferase |
| chr17_+_28988354 | 4.25 |
ENSMUST00000233109.2
ENSMUST00000004986.14 |
Mapk13
|
mitogen-activated protein kinase 13 |
| chr2_+_30306116 | 4.20 |
ENSMUST00000113601.10
ENSMUST00000113603.10 |
Ptpa
|
protein phosphatase 2 protein activator |
| chr11_+_97340962 | 4.12 |
ENSMUST00000107601.8
|
Arhgap23
|
Rho GTPase activating protein 23 |
| chr7_+_141996067 | 4.12 |
ENSMUST00000149529.8
|
Tnni2
|
troponin I, skeletal, fast 2 |
| chr11_+_101207743 | 4.10 |
ENSMUST00000151385.2
|
Psme3
|
proteaseome (prosome, macropain) activator subunit 3 (PA28 gamma, Ki) |
| chr15_+_78810919 | 4.09 |
ENSMUST00000089377.6
|
Lgals1
|
lectin, galactose binding, soluble 1 |
| chr4_-_133694607 | 4.07 |
ENSMUST00000105893.8
|
Hmgn2
|
high mobility group nucleosomal binding domain 2 |
| chr11_+_96820091 | 4.01 |
ENSMUST00000054311.6
ENSMUST00000107636.4 |
Prr15l
|
proline rich 15-like |
| chr11_+_96820220 | 4.00 |
ENSMUST00000062172.6
|
Prr15l
|
proline rich 15-like |
| chrX_-_36253309 | 4.00 |
ENSMUST00000060474.14
ENSMUST00000053456.11 ENSMUST00000115239.10 |
Septin6
|
septin 6 |
| chr2_+_30306045 | 3.99 |
ENSMUST00000042055.10
|
Ptpa
|
protein phosphatase 2 protein activator |
| chr2_-_122441719 | 3.98 |
ENSMUST00000028624.9
|
Gatm
|
glycine amidinotransferase (L-arginine:glycine amidinotransferase) |
| chr4_-_137157824 | 3.80 |
ENSMUST00000102522.5
|
Cela3b
|
chymotrypsin-like elastase family, member 3B |
| chr13_+_91609169 | 3.79 |
ENSMUST00000004094.15
ENSMUST00000042122.15 |
Ssbp2
|
single-stranded DNA binding protein 2 |
| chr1_-_75482975 | 3.71 |
ENSMUST00000113567.10
ENSMUST00000113565.3 |
Obsl1
|
obscurin-like 1 |
| chr1_+_130659700 | 3.69 |
ENSMUST00000039323.8
|
AA986860
|
expressed sequence AA986860 |
| chr6_+_30639217 | 3.69 |
ENSMUST00000031806.10
|
Cpa1
|
carboxypeptidase A1, pancreatic |
| chr4_-_133694543 | 3.57 |
ENSMUST00000123234.8
|
Hmgn2
|
high mobility group nucleosomal binding domain 2 |
| chr10_+_128745214 | 3.55 |
ENSMUST00000220308.2
|
Cd63
|
CD63 antigen |
| chr2_-_164621641 | 3.52 |
ENSMUST00000103095.5
|
Tnnc2
|
troponin C2, fast |
| chr11_-_5753693 | 3.49 |
ENSMUST00000020768.4
|
Pgam2
|
phosphoglycerate mutase 2 |
| chr4_-_93223746 | 3.45 |
ENSMUST00000066774.6
|
Tusc1
|
tumor suppressor candidate 1 |
| chr4_-_63090355 | 3.42 |
ENSMUST00000156618.9
ENSMUST00000030042.3 |
Kif12
|
kinesin family member 12 |
| chr6_-_91093766 | 3.42 |
ENSMUST00000113509.2
ENSMUST00000032179.14 |
Nup210
|
nucleoporin 210 |
| chr1_+_163889551 | 3.40 |
ENSMUST00000192047.6
ENSMUST00000027871.13 |
Sell
|
selectin, lymphocyte |
| chr3_+_146110387 | 3.39 |
ENSMUST00000106151.8
ENSMUST00000106153.9 ENSMUST00000039021.11 ENSMUST00000106149.8 ENSMUST00000149262.8 |
Ssx2ip
|
synovial sarcoma, X 2 interacting protein |
| chr15_-_54953819 | 3.38 |
ENSMUST00000110231.2
ENSMUST00000023059.13 |
Dscc1
|
DNA replication and sister chromatid cohesion 1 |
| chr1_+_75336965 | 3.35 |
ENSMUST00000027409.10
|
Des
|
desmin |
| chr9_+_62754252 | 3.27 |
ENSMUST00000124984.2
|
Cln6
|
ceroid-lipofuscinosis, neuronal 6 |
| chr7_-_126046814 | 3.24 |
ENSMUST00000146973.2
|
Atp2a1
|
ATPase, Ca++ transporting, cardiac muscle, fast twitch 1 |
| chr8_+_95720864 | 3.24 |
ENSMUST00000212141.2
|
Adgrg1
|
adhesion G protein-coupled receptor G1 |
| chr8_+_95703506 | 3.24 |
ENSMUST00000212581.2
|
Adgrg1
|
adhesion G protein-coupled receptor G1 |
| chr5_+_105563605 | 3.18 |
ENSMUST00000112707.3
|
Lrrc8b
|
leucine rich repeat containing 8 family, member B |
| chr1_+_135764092 | 3.04 |
ENSMUST00000188028.7
ENSMUST00000178204.8 ENSMUST00000190451.7 ENSMUST00000189732.7 ENSMUST00000189355.7 |
Tnnt2
|
troponin T2, cardiac |
| chr4_-_133599616 | 3.02 |
ENSMUST00000157067.9
|
Rps6ka1
|
ribosomal protein S6 kinase polypeptide 1 |
| chrX_+_139857640 | 3.01 |
ENSMUST00000112971.2
|
Atg4a
|
autophagy related 4A, cysteine peptidase |
| chr11_+_101207021 | 2.98 |
ENSMUST00000142640.8
ENSMUST00000019470.14 |
Psme3
|
proteaseome (prosome, macropain) activator subunit 3 (PA28 gamma, Ki) |
| chr3_+_137570248 | 2.96 |
ENSMUST00000041045.14
|
H2az1
|
H2A.Z variant histone 1 |
| chr8_+_95721019 | 2.96 |
ENSMUST00000212976.2
ENSMUST00000212995.2 |
Adgrg1
|
adhesion G protein-coupled receptor G1 |
| chr7_+_142025817 | 2.89 |
ENSMUST00000105966.2
|
Lsp1
|
lymphocyte specific 1 |
| chr5_+_115149170 | 2.88 |
ENSMUST00000031530.9
|
Sppl3
|
signal peptide peptidase 3 |
| chr8_-_106198112 | 2.86 |
ENSMUST00000014990.13
|
Tppp3
|
tubulin polymerization-promoting protein family member 3 |
| chr7_+_142025575 | 2.84 |
ENSMUST00000038946.9
|
Lsp1
|
lymphocyte specific 1 |
| chr7_+_28140352 | 2.81 |
ENSMUST00000078845.13
|
Gmfg
|
glia maturation factor, gamma |
| chr11_+_99748741 | 2.80 |
ENSMUST00000107434.2
|
Gm11568
|
predicted gene 11568 |
| chr11_-_90578397 | 2.79 |
ENSMUST00000107869.9
ENSMUST00000154599.2 ENSMUST00000107868.8 ENSMUST00000020849.9 |
Tom1l1
|
target of myb1-like 1 (chicken) |
| chr1_+_135060431 | 2.73 |
ENSMUST00000187985.7
ENSMUST00000049449.11 |
Ptpn7
|
protein tyrosine phosphatase, non-receptor type 7 |
| chrX_+_139857688 | 2.70 |
ENSMUST00000239541.1
|
Atg4a
|
autophagy related 4A, cysteine peptidase |
| chr11_-_97673203 | 2.69 |
ENSMUST00000128801.2
ENSMUST00000103146.5 |
Rpl23
|
ribosomal protein L23 |
| chr7_-_127593003 | 2.67 |
ENSMUST00000033056.5
|
Pycard
|
PYD and CARD domain containing |
| chr5_-_68004743 | 2.64 |
ENSMUST00000072971.13
ENSMUST00000113652.8 ENSMUST00000113651.8 ENSMUST00000037380.15 |
Atp8a1
|
ATPase, aminophospholipid transporter (APLT), class I, type 8A, member 1 |
| chr17_+_73144531 | 2.64 |
ENSMUST00000233886.2
|
Ypel5
|
yippee like 5 |
| chr14_+_62529924 | 2.63 |
ENSMUST00000166879.8
|
Rnaseh2b
|
ribonuclease H2, subunit B |
| chr9_-_39515420 | 2.57 |
ENSMUST00000042485.11
ENSMUST00000141370.8 |
AW551984
|
expressed sequence AW551984 |
| chr1_+_180762587 | 2.53 |
ENSMUST00000037361.9
|
Lefty1
|
left right determination factor 1 |
| chr19_+_46345319 | 2.51 |
ENSMUST00000086969.13
|
Mfsd13a
|
major facilitator superfamily domain containing 13a |
| chr13_+_91609264 | 2.51 |
ENSMUST00000231481.2
|
Ssbp2
|
single-stranded DNA binding protein 2 |
| chr2_+_156681991 | 2.51 |
ENSMUST00000073352.10
|
Tgif2
|
TGFB-induced factor homeobox 2 |
| chr19_+_5118103 | 2.51 |
ENSMUST00000070630.8
|
Cd248
|
CD248 antigen, endosialin |
| chr7_+_3339077 | 2.47 |
ENSMUST00000203566.3
|
Myadm
|
myeloid-associated differentiation marker |
| chr3_+_88523730 | 2.45 |
ENSMUST00000175779.8
|
Arhgef2
|
rho/rac guanine nucleotide exchange factor (GEF) 2 |
| chr1_+_163889713 | 2.43 |
ENSMUST00000097491.10
|
Sell
|
selectin, lymphocyte |
| chr7_+_121888520 | 2.43 |
ENSMUST00000064989.12
ENSMUST00000064921.5 |
Prkcb
|
protein kinase C, beta |
| chr7_+_28140450 | 2.41 |
ENSMUST00000135686.2
|
Gmfg
|
glia maturation factor, gamma |
| chr7_+_3339059 | 2.39 |
ENSMUST00000096744.8
|
Myadm
|
myeloid-associated differentiation marker |
| chr5_+_35146727 | 2.38 |
ENSMUST00000114284.8
|
Rgs12
|
regulator of G-protein signaling 12 |
| chr5_+_75735576 | 2.37 |
ENSMUST00000144270.8
ENSMUST00000005815.7 |
Kit
|
KIT proto-oncogene receptor tyrosine kinase |
| chr2_+_122479770 | 2.34 |
ENSMUST00000047498.15
ENSMUST00000110512.4 |
AA467197
|
expressed sequence AA467197 |
| chr19_+_46044972 | 2.32 |
ENSMUST00000111899.8
ENSMUST00000099392.10 ENSMUST00000062322.11 |
Pprc1
|
peroxisome proliferative activated receptor, gamma, coactivator-related 1 |
| chr5_+_64969679 | 2.31 |
ENSMUST00000166409.6
ENSMUST00000197879.2 |
Klf3
|
Kruppel-like factor 3 (basic) |
| chr13_-_32522548 | 2.30 |
ENSMUST00000041859.9
|
Gmds
|
GDP-mannose 4, 6-dehydratase |
| chr10_+_126899468 | 2.30 |
ENSMUST00000120226.8
ENSMUST00000133115.8 |
Cdk4
|
cyclin-dependent kinase 4 |
| chr9_+_107468146 | 2.27 |
ENSMUST00000195746.2
|
Ifrd2
|
interferon-related developmental regulator 2 |
| chr3_-_116047148 | 2.27 |
ENSMUST00000090473.7
|
Gpr88
|
G-protein coupled receptor 88 |
| chr11_-_34674677 | 2.27 |
ENSMUST00000093193.12
ENSMUST00000101365.9 |
Dock2
|
dedicator of cyto-kinesis 2 |
| chr17_+_25690538 | 2.26 |
ENSMUST00000234449.2
ENSMUST00000025002.3 ENSMUST00000235033.2 |
Tekt4
|
tektin 4 |
| chr11_+_115705550 | 2.24 |
ENSMUST00000021134.10
ENSMUST00000106481.9 |
Tsen54
|
tRNA splicing endonuclease subunit 54 |
| chr11_+_69856222 | 2.24 |
ENSMUST00000018713.13
|
Cldn7
|
claudin 7 |
| chr7_+_44866095 | 2.20 |
ENSMUST00000209437.2
|
Tead2
|
TEA domain family member 2 |
| chr15_-_63869818 | 2.19 |
ENSMUST00000164532.3
|
Cyrib
|
CYFIP related Rac1 interactor B |
| chr13_+_24822619 | 2.17 |
ENSMUST00000110384.9
ENSMUST00000058009.16 ENSMUST00000038477.7 |
Ripor2
|
RHO family interacting cell polarization regulator 2 |
| chr5_-_110801213 | 2.16 |
ENSMUST00000042147.6
|
Noc4l
|
NOC4 like |
| chr7_+_67602565 | 2.15 |
ENSMUST00000005671.10
|
Igf1r
|
insulin-like growth factor I receptor |
| chr8_-_123187406 | 2.13 |
ENSMUST00000006762.7
|
Snai3
|
snail family zinc finger 3 |
| chr7_+_89779564 | 2.09 |
ENSMUST00000208742.2
ENSMUST00000049537.9 |
Picalm
|
phosphatidylinositol binding clathrin assembly protein |
| chrX_+_100492684 | 2.07 |
ENSMUST00000033674.6
|
Itgb1bp2
|
integrin beta 1 binding protein 2 |
| chr11_-_107607343 | 2.07 |
ENSMUST00000021065.6
|
Cacng1
|
calcium channel, voltage-dependent, gamma subunit 1 |
| chr7_+_45289391 | 2.07 |
ENSMUST00000148532.4
|
Mamstr
|
MEF2 activating motif and SAP domain containing transcriptional regulator |
| chr16_+_35590745 | 2.06 |
ENSMUST00000231579.2
|
Hspbap1
|
Hspb associated protein 1 |
| chr5_+_35146880 | 2.06 |
ENSMUST00000114285.8
|
Rgs12
|
regulator of G-protein signaling 12 |
| chr7_-_16651107 | 2.01 |
ENSMUST00000173139.2
|
Calm3
|
calmodulin 3 |
| chrX_-_56384089 | 2.01 |
ENSMUST00000033468.11
|
Arhgef6
|
Rac/Cdc42 guanine nucleotide exchange factor (GEF) 6 |
| chr10_-_120037464 | 2.00 |
ENSMUST00000020448.11
|
Irak3
|
interleukin-1 receptor-associated kinase 3 |
| chr2_-_84652890 | 1.98 |
ENSMUST00000028471.6
|
Smtnl1
|
smoothelin-like 1 |
| chr8_-_34578880 | 1.98 |
ENSMUST00000080152.5
|
Gm10131
|
predicted pseudogene 10131 |
| chr13_-_111945499 | 1.92 |
ENSMUST00000109267.9
|
Map3k1
|
mitogen-activated protein kinase kinase kinase 1 |
| chr3_+_88523440 | 1.90 |
ENSMUST00000177498.8
ENSMUST00000176500.8 |
Arhgef2
|
rho/rac guanine nucleotide exchange factor (GEF) 2 |
| chr10_-_117681864 | 1.90 |
ENSMUST00000064667.9
|
Rap1b
|
RAS related protein 1b |
| chr17_-_48739874 | 1.90 |
ENSMUST00000046549.5
|
Apobec2
|
apolipoprotein B mRNA editing enzyme, catalytic polypeptide 2 |
| chr8_+_46338498 | 1.89 |
ENSMUST00000034053.7
|
Pdlim3
|
PDZ and LIM domain 3 |
| chr16_+_87350202 | 1.89 |
ENSMUST00000026700.8
|
Map3k7cl
|
Map3k7 C-terminal like |
| chr7_-_24771717 | 1.88 |
ENSMUST00000003468.10
|
Grik5
|
glutamate receptor, ionotropic, kainate 5 (gamma 2) |
| chr10_-_80649315 | 1.83 |
ENSMUST00000181039.8
ENSMUST00000180438.2 |
Jsrp1
|
junctional sarcoplasmic reticulum protein 1 |
| chr5_-_38718967 | 1.83 |
ENSMUST00000201260.4
|
Wdr1
|
WD repeat domain 1 |
| chr19_+_32463151 | 1.82 |
ENSMUST00000025827.10
|
Minpp1
|
multiple inositol polyphosphate histidine phosphatase 1 |
| chr4_+_98812047 | 1.80 |
ENSMUST00000030289.9
|
Usp1
|
ubiquitin specific peptidase 1 |
| chr8_+_117822593 | 1.80 |
ENSMUST00000034308.16
ENSMUST00000176860.2 |
Bco1
|
beta-carotene oxygenase 1 |
| chr5_+_145217272 | 1.78 |
ENSMUST00000200246.2
|
Zscan25
|
zinc finger and SCAN domain containing 25 |
| chr9_+_50664288 | 1.78 |
ENSMUST00000214962.2
ENSMUST00000216755.2 |
Cryab
|
crystallin, alpha B |
| chr19_+_47167259 | 1.75 |
ENSMUST00000111808.11
|
Neurl1a
|
neuralized E3 ubiquitin protein ligase 1A |
| chr7_-_131012202 | 1.75 |
ENSMUST00000207243.2
ENSMUST00000128432.3 ENSMUST00000121033.8 ENSMUST00000046306.15 |
Ikzf5
|
IKAROS family zinc finger 5 |
| chr4_+_98812082 | 1.75 |
ENSMUST00000091358.11
|
Usp1
|
ubiquitin specific peptidase 1 |
| chr4_-_141553306 | 1.74 |
ENSMUST00000102481.4
|
Cela2a
|
chymotrypsin-like elastase family, member 2A |
| chr7_-_126626152 | 1.74 |
ENSMUST00000206254.2
ENSMUST00000206291.2 |
Maz
|
MYC-associated zinc finger protein (purine-binding transcription factor) |
| chr16_+_57173456 | 1.74 |
ENSMUST00000159816.8
|
Filip1l
|
filamin A interacting protein 1-like |
| chr8_+_46338557 | 1.72 |
ENSMUST00000210422.2
|
Pdlim3
|
PDZ and LIM domain 3 |
| chr12_-_40087393 | 1.72 |
ENSMUST00000146905.2
|
Arl4a
|
ADP-ribosylation factor-like 4A |
| chr16_+_48814548 | 1.71 |
ENSMUST00000117994.8
ENSMUST00000048374.6 |
Cip2a
|
cell proliferation regulating inhibitor of protein phosphatase 2A |
| chr11_-_82761954 | 1.71 |
ENSMUST00000108173.10
ENSMUST00000071152.14 |
Rffl
|
ring finger and FYVE like domain containing protein |
| chr7_-_44174065 | 1.70 |
ENSMUST00000165208.4
|
Mybpc2
|
myosin binding protein C, fast-type |
| chr2_-_33321306 | 1.69 |
ENSMUST00000113158.8
|
Zbtb34
|
zinc finger and BTB domain containing 34 |
| chr8_-_71249630 | 1.68 |
ENSMUST00000166004.3
|
Mast3
|
microtubule associated serine/threonine kinase 3 |
| chrX_-_141089165 | 1.66 |
ENSMUST00000134825.3
|
Kcne1l
|
potassium voltage-gated channel, Isk-related family, member 1-like, pseudogene |
| chr2_+_152753231 | 1.63 |
ENSMUST00000028970.8
|
Mylk2
|
myosin, light polypeptide kinase 2, skeletal muscle |
| chr19_+_6155804 | 1.63 |
ENSMUST00000044451.4
|
Naaladl1
|
N-acetylated alpha-linked acidic dipeptidase-like 1 |
| chr17_-_48235325 | 1.61 |
ENSMUST00000113263.8
ENSMUST00000097311.9 |
Foxp4
|
forkhead box P4 |
| chr11_-_102210568 | 1.59 |
ENSMUST00000173870.8
|
Ubtf
|
upstream binding transcription factor, RNA polymerase I |
| chr10_+_74802996 | 1.59 |
ENSMUST00000037813.5
|
Gnaz
|
guanine nucleotide binding protein, alpha z subunit |
| chr8_+_105267431 | 1.58 |
ENSMUST00000056051.11
|
Car7
|
carbonic anhydrase 7 |
| chr8_+_121264161 | 1.57 |
ENSMUST00000118136.2
|
Gse1
|
genetic suppressor element 1, coiled-coil protein |
| chr2_+_163916042 | 1.56 |
ENSMUST00000018353.14
|
Stk4
|
serine/threonine kinase 4 |
| chr9_+_21249118 | 1.54 |
ENSMUST00000034697.8
|
Slc44a2
|
solute carrier family 44, member 2 |
| chr11_-_54853729 | 1.54 |
ENSMUST00000108885.8
ENSMUST00000102730.9 ENSMUST00000018482.13 ENSMUST00000108886.8 ENSMUST00000102731.8 |
Tnip1
|
TNFAIP3 interacting protein 1 |
| chr13_+_21365308 | 1.54 |
ENSMUST00000221464.2
|
Trim27
|
tripartite motif-containing 27 |
| chr10_-_21036792 | 1.53 |
ENSMUST00000188495.8
|
Myb
|
myeloblastosis oncogene |
| chr7_-_29204812 | 1.53 |
ENSMUST00000183096.8
ENSMUST00000085809.11 |
Sipa1l3
|
signal-induced proliferation-associated 1 like 3 |
| chr6_+_17307639 | 1.53 |
ENSMUST00000115453.2
|
Cav1
|
caveolin 1, caveolae protein |
| chr1_-_133352115 | 1.50 |
ENSMUST00000153799.8
|
Sox13
|
SRY (sex determining region Y)-box 13 |
| chr11_+_68582923 | 1.49 |
ENSMUST00000018887.15
|
Myh10
|
myosin, heavy polypeptide 10, non-muscle |
| chr11_-_120538928 | 1.49 |
ENSMUST00000239158.2
ENSMUST00000026134.3 |
Myadml2
|
myeloid-associated differentiation marker-like 2 |
| chrX_+_158491589 | 1.49 |
ENSMUST00000080394.13
|
Sh3kbp1
|
SH3-domain kinase binding protein 1 |
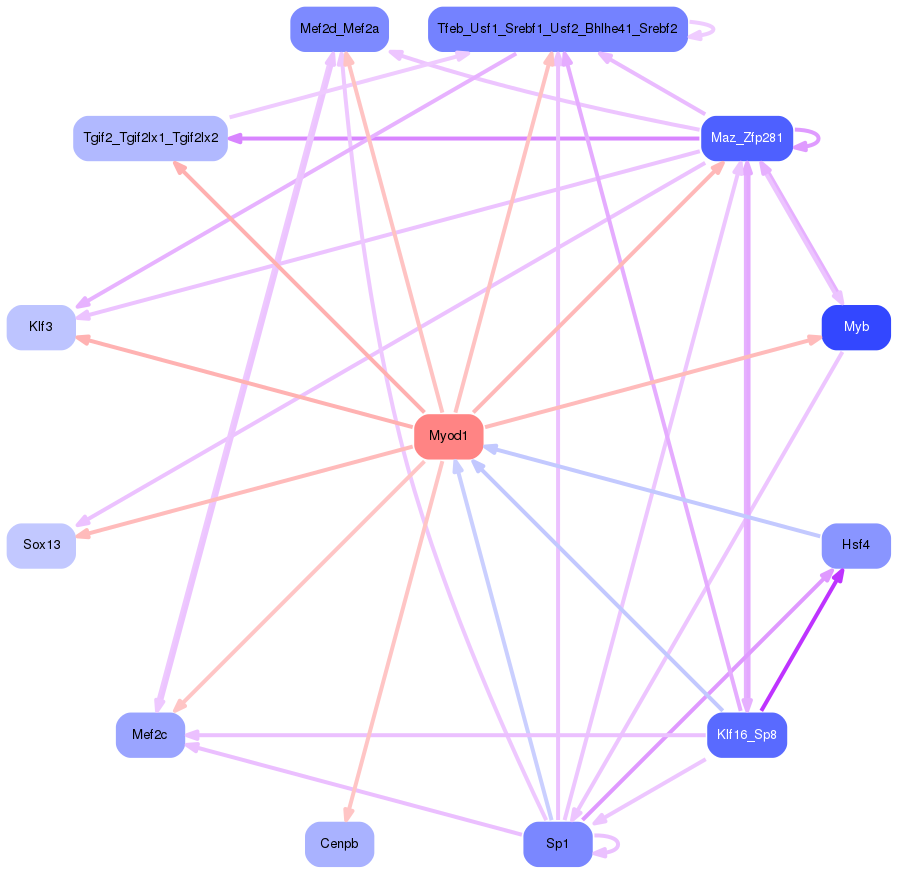
Network of associatons between targets according to the STRING database.

First level regulatory network of Myod1
Gene Ontology Analysis
Gene overrepresentation in biological process category:
| Log-likelihood per target | Total log-likelihood | Term | Description |
|---|---|---|---|
| 2.7 | 8.2 | GO:0030472 | mitotic spindle organization in nucleus(GO:0030472) |
| 2.1 | 10.7 | GO:0072138 | mesenchymal cell proliferation involved in ureteric bud development(GO:0072138) |
| 1.7 | 5.2 | GO:0071846 | actin filament debranching(GO:0071846) |
| 1.6 | 4.9 | GO:0002277 | myeloid dendritic cell activation involved in immune response(GO:0002277) |
| 1.6 | 8.0 | GO:1903288 | positive regulation of potassium ion import(GO:1903288) |
| 1.4 | 8.5 | GO:0050916 | sensory perception of sweet taste(GO:0050916) |
| 1.4 | 4.1 | GO:0034117 | erythrocyte aggregation(GO:0034117) regulation of erythrocyte aggregation(GO:0034118) |
| 1.3 | 4.0 | GO:0006601 | creatine biosynthetic process(GO:0006601) |
| 1.2 | 4.9 | GO:0031448 | regulation of fast-twitch skeletal muscle fiber contraction(GO:0031446) positive regulation of fast-twitch skeletal muscle fiber contraction(GO:0031448) |
| 1.1 | 5.6 | GO:0034224 | cellular response to zinc ion starvation(GO:0034224) |
| 1.0 | 1.0 | GO:1901003 | regulation of fermentation(GO:0043465) negative regulation of fermentation(GO:1901003) |
| 1.0 | 44.9 | GO:0006779 | porphyrin-containing compound biosynthetic process(GO:0006779) |
| 1.0 | 8.7 | GO:0015879 | carnitine transport(GO:0015879) |
| 1.0 | 8.6 | GO:2000491 | positive regulation of hepatic stellate cell activation(GO:2000491) |
| 0.9 | 4.4 | GO:0038032 | termination of G-protein coupled receptor signaling pathway(GO:0038032) |
| 0.9 | 14.8 | GO:0097067 | cellular response to thyroid hormone stimulus(GO:0097067) |
| 0.8 | 21.2 | GO:0030213 | hyaluronan biosynthetic process(GO:0030213) |
| 0.8 | 2.5 | GO:1903778 | protein localization to vacuolar membrane(GO:1903778) |
| 0.8 | 9.8 | GO:0030913 | paranodal junction assembly(GO:0030913) |
| 0.8 | 5.7 | GO:0051697 | protein delipidation(GO:0051697) |
| 0.8 | 12.6 | GO:0048194 | Golgi vesicle budding(GO:0048194) |
| 0.8 | 7.9 | GO:0032264 | IMP salvage(GO:0032264) |
| 0.8 | 6.1 | GO:0032020 | ISG15-protein conjugation(GO:0032020) |
| 0.8 | 3.0 | GO:0032972 | regulation of muscle filament sliding speed(GO:0032972) |
| 0.7 | 7.3 | GO:0030240 | skeletal muscle thin filament assembly(GO:0030240) |
| 0.7 | 2.2 | GO:1903904 | negative regulation of establishment of T cell polarity(GO:1903904) |
| 0.7 | 2.8 | GO:0072717 | cellular response to actinomycin D(GO:0072717) |
| 0.7 | 4.8 | GO:0035735 | intraciliary transport involved in cilium morphogenesis(GO:0035735) |
| 0.7 | 3.4 | GO:0034421 | post-translational protein acetylation(GO:0034421) |
| 0.7 | 2.6 | GO:0070650 | actin filament bundle distribution(GO:0070650) |
| 0.6 | 15.8 | GO:0021796 | cerebral cortex regionalization(GO:0021796) |
| 0.6 | 1.2 | GO:0035582 | sequestering of BMP in extracellular matrix(GO:0035582) |
| 0.6 | 3.6 | GO:2000680 | regulation of rubidium ion transport(GO:2000680) |
| 0.6 | 8.2 | GO:0007042 | lysosomal lumen acidification(GO:0007042) |
| 0.6 | 3.5 | GO:0043456 | regulation of pentose-phosphate shunt(GO:0043456) |
| 0.5 | 4.3 | GO:0071802 | negative regulation of podosome assembly(GO:0071802) |
| 0.5 | 3.3 | GO:0030043 | actin filament fragmentation(GO:0030043) |
| 0.5 | 2.7 | GO:1900108 | negative regulation of nodal signaling pathway(GO:1900108) |
| 0.5 | 2.1 | GO:1903943 | regulation of hepatocyte apoptotic process(GO:1903943) negative regulation of hepatocyte apoptotic process(GO:1903944) |
| 0.5 | 12.2 | GO:0046597 | negative regulation of viral entry into host cell(GO:0046597) |
| 0.5 | 4.1 | GO:0090038 | negative regulation of protein kinase C signaling(GO:0090038) |
| 0.5 | 5.0 | GO:0006362 | transcription elongation from RNA polymerase I promoter(GO:0006362) |
| 0.5 | 5.4 | GO:0071688 | striated muscle myosin thick filament assembly(GO:0071688) |
| 0.5 | 1.5 | GO:0007225 | patched ligand maturation(GO:0007225) signal maturation(GO:0035638) |
| 0.5 | 3.3 | GO:0010936 | negative regulation of macrophage cytokine production(GO:0010936) |
| 0.5 | 11.2 | GO:0048368 | lateral mesoderm development(GO:0048368) |
| 0.5 | 2.3 | GO:0080154 | regulation of fertilization(GO:0080154) |
| 0.4 | 2.6 | GO:1900041 | negative regulation of interleukin-2 secretion(GO:1900041) |
| 0.4 | 1.3 | GO:0097065 | anterior head development(GO:0097065) regulation of anterior head development(GO:2000742) positive regulation of anterior head development(GO:2000744) |
| 0.4 | 1.7 | GO:2001271 | negative regulation of cysteine-type endopeptidase activity involved in execution phase of apoptosis(GO:2001271) |
| 0.4 | 2.5 | GO:1900085 | negative regulation of peptidyl-tyrosine autophosphorylation(GO:1900085) negative regulation of inward rectifier potassium channel activity(GO:1903609) |
| 0.4 | 3.6 | GO:0051533 | positive regulation of NFAT protein import into nucleus(GO:0051533) |
| 0.4 | 1.6 | GO:0032849 | positive regulation of cellular pH reduction(GO:0032849) |
| 0.4 | 4.7 | GO:0035520 | monoubiquitinated protein deubiquitination(GO:0035520) |
| 0.4 | 4.7 | GO:0042090 | interleukin-12 biosynthetic process(GO:0042090) regulation of interleukin-12 biosynthetic process(GO:0045075) |
| 0.4 | 1.2 | GO:0014908 | myotube differentiation involved in skeletal muscle regeneration(GO:0014908) |
| 0.4 | 1.1 | GO:0006500 | N-terminal protein palmitoylation(GO:0006500) |
| 0.4 | 1.5 | GO:0060800 | regulation of cell differentiation involved in embryonic placenta development(GO:0060800) |
| 0.4 | 1.5 | GO:0000379 | tRNA-type intron splice site recognition and cleavage(GO:0000379) |
| 0.4 | 18.8 | GO:0003009 | skeletal muscle contraction(GO:0003009) |
| 0.4 | 1.4 | GO:0015770 | disaccharide transport(GO:0015766) sucrose transport(GO:0015770) oligosaccharide transport(GO:0015772) |
| 0.4 | 5.4 | GO:0061032 | visceral serous pericardium development(GO:0061032) |
| 0.3 | 2.1 | GO:1902962 | regulation of metalloendopeptidase activity involved in amyloid precursor protein catabolic process(GO:1902962) negative regulation of metalloendopeptidase activity involved in amyloid precursor protein catabolic process(GO:1902963) |
| 0.3 | 1.4 | GO:0060988 | lipid tube assembly(GO:0060988) |
| 0.3 | 2.3 | GO:0061743 | motor learning(GO:0061743) |
| 0.3 | 2.6 | GO:0060923 | cardiac muscle cell fate commitment(GO:0060923) |
| 0.3 | 0.9 | GO:0002017 | regulation of blood volume by renal aldosterone(GO:0002017) |
| 0.3 | 4.5 | GO:0002315 | marginal zone B cell differentiation(GO:0002315) |
| 0.3 | 0.9 | GO:0098749 | cerebellar neuron development(GO:0098749) |
| 0.3 | 7.6 | GO:0040034 | regulation of development, heterochronic(GO:0040034) |
| 0.3 | 1.1 | GO:1904247 | positive regulation of polynucleotide adenylyltransferase activity(GO:1904247) |
| 0.3 | 0.8 | GO:0051542 | elastin biosynthetic process(GO:0051542) |
| 0.3 | 2.4 | GO:0035405 | histone-threonine phosphorylation(GO:0035405) |
| 0.3 | 1.9 | GO:0006621 | protein retention in ER lumen(GO:0006621) |
| 0.3 | 1.3 | GO:0070966 | nuclear-transcribed mRNA catabolic process, no-go decay(GO:0070966) |
| 0.3 | 0.8 | GO:0015825 | L-serine transport(GO:0015825) |
| 0.3 | 8.2 | GO:0045780 | positive regulation of bone resorption(GO:0045780) positive regulation of bone remodeling(GO:0046852) |
| 0.3 | 2.3 | GO:0019673 | GDP-mannose metabolic process(GO:0019673) |
| 0.3 | 1.0 | GO:0032298 | positive regulation of DNA-dependent DNA replication initiation(GO:0032298) |
| 0.2 | 2.7 | GO:0007021 | tubulin complex assembly(GO:0007021) |
| 0.2 | 1.2 | GO:0044727 | DNA demethylation of male pronucleus(GO:0044727) |
| 0.2 | 2.7 | GO:0006369 | termination of RNA polymerase II transcription(GO:0006369) |
| 0.2 | 2.6 | GO:1901250 | regulation of lung goblet cell differentiation(GO:1901249) negative regulation of lung goblet cell differentiation(GO:1901250) |
| 0.2 | 1.2 | GO:1904636 | response to ionomycin(GO:1904636) cellular response to ionomycin(GO:1904637) |
| 0.2 | 0.9 | GO:0009814 | defense response, incompatible interaction(GO:0009814) defense response to bacterium, incompatible interaction(GO:0009816) regulation of defense response to bacterium, incompatible interaction(GO:1902477) |
| 0.2 | 0.4 | GO:2000286 | receptor internalization involved in canonical Wnt signaling pathway(GO:2000286) |
| 0.2 | 1.1 | GO:0002906 | mature B cell apoptotic process(GO:0002901) regulation of mature B cell apoptotic process(GO:0002905) negative regulation of mature B cell apoptotic process(GO:0002906) |
| 0.2 | 0.9 | GO:0042125 | protein glycosylation at cell surface(GO:0033575) protein galactosylation at cell surface(GO:0033580) protein galactosylation(GO:0042125) |
| 0.2 | 1.9 | GO:2000301 | negative regulation of synaptic vesicle exocytosis(GO:2000301) |
| 0.2 | 5.8 | GO:0090023 | positive regulation of neutrophil chemotaxis(GO:0090023) |
| 0.2 | 0.6 | GO:0070682 | proteasome regulatory particle assembly(GO:0070682) |
| 0.2 | 3.0 | GO:0051574 | positive regulation of histone H3-K9 methylation(GO:0051574) |
| 0.2 | 1.4 | GO:0007258 | JUN phosphorylation(GO:0007258) |
| 0.2 | 1.5 | GO:1903003 | positive regulation of protein deubiquitination(GO:1903003) |
| 0.2 | 2.1 | GO:0006348 | chromatin silencing at telomere(GO:0006348) |
| 0.2 | 2.4 | GO:0048170 | positive regulation of long-term neuronal synaptic plasticity(GO:0048170) |
| 0.2 | 1.3 | GO:0070889 | platelet alpha granule organization(GO:0070889) |
| 0.2 | 0.8 | GO:0046882 | negative regulation of follicle-stimulating hormone secretion(GO:0046882) |
| 0.2 | 7.3 | GO:1902175 | regulation of oxidative stress-induced intrinsic apoptotic signaling pathway(GO:1902175) |
| 0.2 | 1.5 | GO:0036309 | protein localization to M-band(GO:0036309) protein localization to T-tubule(GO:0036371) |
| 0.2 | 2.5 | GO:0038092 | nodal signaling pathway(GO:0038092) |
| 0.2 | 6.6 | GO:0002026 | regulation of the force of heart contraction(GO:0002026) |
| 0.2 | 1.9 | GO:0051198 | negative regulation of glycolytic process(GO:0045820) negative regulation of cofactor metabolic process(GO:0051195) negative regulation of coenzyme metabolic process(GO:0051198) |
| 0.1 | 0.1 | GO:0051385 | response to mineralocorticoid(GO:0051385) |
| 0.1 | 2.4 | GO:0060033 | anatomical structure regression(GO:0060033) |
| 0.1 | 1.1 | GO:0030046 | parallel actin filament bundle assembly(GO:0030046) |
| 0.1 | 1.7 | GO:0060372 | regulation of atrial cardiac muscle cell membrane repolarization(GO:0060372) |
| 0.1 | 1.2 | GO:0060666 | dichotomous subdivision of terminal units involved in salivary gland branching(GO:0060666) |
| 0.1 | 0.7 | GO:0043091 | regulation of amino acid import(GO:0010958) L-arginine import(GO:0043091) arginine import(GO:0090467) |
| 0.1 | 2.0 | GO:0046498 | S-adenosylhomocysteine metabolic process(GO:0046498) |
| 0.1 | 1.2 | GO:0098528 | skeletal muscle fiber differentiation(GO:0098528) |
| 0.1 | 7.8 | GO:0042982 | amyloid precursor protein metabolic process(GO:0042982) |
| 0.1 | 2.2 | GO:0032463 | negative regulation of protein homooligomerization(GO:0032463) |
| 0.1 | 0.6 | GO:1902498 | regulation of protein autoubiquitination(GO:1902498) |
| 0.1 | 2.6 | GO:2000001 | regulation of DNA damage checkpoint(GO:2000001) |
| 0.1 | 1.0 | GO:0015671 | oxygen transport(GO:0015671) |
| 0.1 | 1.0 | GO:0070940 | dephosphorylation of RNA polymerase II C-terminal domain(GO:0070940) |
| 0.1 | 2.7 | GO:0061436 | establishment of skin barrier(GO:0061436) |
| 0.1 | 2.3 | GO:0043496 | regulation of protein homodimerization activity(GO:0043496) |
| 0.1 | 1.5 | GO:0007035 | vacuolar acidification(GO:0007035) |
| 0.1 | 0.6 | GO:0006543 | glutamine catabolic process(GO:0006543) |
| 0.1 | 0.6 | GO:0001915 | negative regulation of T cell mediated cytotoxicity(GO:0001915) |
| 0.1 | 0.8 | GO:0043569 | negative regulation of insulin-like growth factor receptor signaling pathway(GO:0043569) |
| 0.1 | 1.1 | GO:1902895 | positive regulation of pri-miRNA transcription from RNA polymerase II promoter(GO:1902895) |
| 0.1 | 2.0 | GO:0075522 | IRES-dependent viral translational initiation(GO:0075522) |
| 0.1 | 0.8 | GO:0060017 | parathyroid gland development(GO:0060017) |
| 0.1 | 1.0 | GO:0032808 | lacrimal gland development(GO:0032808) |
| 0.1 | 2.6 | GO:0045109 | intermediate filament organization(GO:0045109) |
| 0.1 | 1.1 | GO:0071340 | skeletal muscle acetylcholine-gated channel clustering(GO:0071340) |
| 0.1 | 1.3 | GO:0006123 | mitochondrial electron transport, cytochrome c to oxygen(GO:0006123) |
| 0.1 | 1.6 | GO:0010831 | positive regulation of myotube differentiation(GO:0010831) |
| 0.1 | 1.9 | GO:0061029 | eyelid development in camera-type eye(GO:0061029) |
| 0.1 | 0.7 | GO:1900118 | negative regulation of execution phase of apoptosis(GO:1900118) |
| 0.1 | 0.5 | GO:0086018 | SA node cell action potential(GO:0086015) SA node cell to atrial cardiac muscle cell signalling(GO:0086018) SA node cell to atrial cardiac muscle cell communication(GO:0086070) |
| 0.1 | 1.7 | GO:0051457 | maintenance of protein location in nucleus(GO:0051457) |
| 0.1 | 1.9 | GO:0080111 | DNA demethylation(GO:0080111) |
| 0.1 | 2.8 | GO:0006308 | DNA catabolic process(GO:0006308) |
| 0.1 | 0.7 | GO:0002074 | extraocular skeletal muscle development(GO:0002074) |
| 0.1 | 0.2 | GO:0098903 | regulation of membrane repolarization during action potential(GO:0098903) |
| 0.1 | 0.9 | GO:0051415 | interphase microtubule nucleation by interphase microtubule organizing center(GO:0051415) microtubule nucleation by microtubule organizing center(GO:0051418) |
| 0.1 | 0.2 | GO:0001698 | gastrin-induced gastric acid secretion(GO:0001698) |
| 0.1 | 0.8 | GO:0003172 | primary heart field specification(GO:0003138) sinoatrial valve development(GO:0003172) sinoatrial valve morphogenesis(GO:0003185) positive regulation of macrophage apoptotic process(GO:2000111) |
| 0.1 | 0.6 | GO:2000399 | negative regulation of T cell differentiation in thymus(GO:0033085) positive regulation of thymocyte apoptotic process(GO:0070245) negative regulation of thymocyte aggregation(GO:2000399) |
| 0.1 | 0.2 | GO:0035720 | intraciliary anterograde transport(GO:0035720) |
| 0.1 | 6.7 | GO:0032755 | positive regulation of interleukin-6 production(GO:0032755) |
| 0.1 | 2.1 | GO:0070296 | sarcoplasmic reticulum calcium ion transport(GO:0070296) |
| 0.1 | 1.2 | GO:0034497 | protein localization to pre-autophagosomal structure(GO:0034497) |
| 0.1 | 0.5 | GO:2000234 | positive regulation of ribosome biogenesis(GO:0090070) positive regulation of rRNA processing(GO:2000234) |
| 0.1 | 2.5 | GO:0000462 | maturation of SSU-rRNA from tricistronic rRNA transcript (SSU-rRNA, 5.8S rRNA, LSU-rRNA)(GO:0000462) |
| 0.1 | 1.5 | GO:0045907 | positive regulation of vasoconstriction(GO:0045907) |
| 0.1 | 0.2 | GO:0001550 | ovarian cumulus expansion(GO:0001550) fused antrum stage(GO:0048165) |
| 0.1 | 1.1 | GO:0006670 | sphingosine metabolic process(GO:0006670) |
| 0.1 | 0.4 | GO:0031179 | peptide modification(GO:0031179) |
| 0.1 | 1.1 | GO:0043306 | positive regulation of mast cell activation involved in immune response(GO:0033008) positive regulation of mast cell degranulation(GO:0043306) |
| 0.1 | 0.6 | GO:0006610 | ribosomal protein import into nucleus(GO:0006610) |
| 0.1 | 2.8 | GO:0046329 | negative regulation of JNK cascade(GO:0046329) |
| 0.1 | 7.0 | GO:0010950 | positive regulation of endopeptidase activity(GO:0010950) |
| 0.1 | 1.5 | GO:0010592 | positive regulation of lamellipodium assembly(GO:0010592) |
| 0.1 | 0.6 | GO:0045586 | regulation of gamma-delta T cell differentiation(GO:0045586) regulation of gamma-delta T cell activation(GO:0046643) |
| 0.1 | 0.3 | GO:0090214 | spongiotrophoblast layer developmental growth(GO:0090214) |
| 0.1 | 0.7 | GO:0042534 | tumor necrosis factor biosynthetic process(GO:0042533) regulation of tumor necrosis factor biosynthetic process(GO:0042534) |
| 0.0 | 14.5 | GO:0006936 | muscle contraction(GO:0006936) |
| 0.0 | 0.3 | GO:0033140 | negative regulation of peptidyl-serine phosphorylation of STAT protein(GO:0033140) |
| 0.0 | 0.2 | GO:1901675 | negative regulation of histone H3-K27 acetylation(GO:1901675) |
| 0.0 | 0.1 | GO:0003344 | pericardium morphogenesis(GO:0003344) |
| 0.0 | 1.1 | GO:0048745 | smooth muscle tissue development(GO:0048745) |
| 0.0 | 0.1 | GO:0061009 | common bile duct development(GO:0061009) |
| 0.0 | 0.6 | GO:0001672 | regulation of chromatin assembly or disassembly(GO:0001672) |
| 0.0 | 0.5 | GO:0007525 | somatic muscle development(GO:0007525) |
| 0.0 | 0.2 | GO:0071894 | histone H2B conserved C-terminal lysine ubiquitination(GO:0071894) |
| 0.0 | 2.8 | GO:0045839 | negative regulation of mitotic nuclear division(GO:0045839) |
| 0.0 | 1.1 | GO:0045898 | regulation of RNA polymerase II transcriptional preinitiation complex assembly(GO:0045898) |
| 0.0 | 0.5 | GO:0010766 | negative regulation of sodium ion transport(GO:0010766) |
| 0.0 | 0.7 | GO:0032695 | negative regulation of interleukin-12 production(GO:0032695) |
| 0.0 | 8.2 | GO:0007519 | skeletal muscle tissue development(GO:0007519) |
| 0.0 | 0.6 | GO:0031507 | heterochromatin assembly(GO:0031507) |
| 0.0 | 1.0 | GO:0048268 | clathrin coat assembly(GO:0048268) |
| 0.0 | 0.6 | GO:0007343 | egg activation(GO:0007343) |
| 0.0 | 0.3 | GO:0017196 | N-terminal peptidyl-methionine acetylation(GO:0017196) |
| 0.0 | 3.2 | GO:0038083 | peptidyl-tyrosine autophosphorylation(GO:0038083) |
| 0.0 | 0.2 | GO:0043619 | regulation of transcription from RNA polymerase II promoter in response to oxidative stress(GO:0043619) |
| 0.0 | 1.7 | GO:0007193 | adenylate cyclase-inhibiting G-protein coupled receptor signaling pathway(GO:0007193) |
| 0.0 | 0.2 | GO:0048245 | eosinophil chemotaxis(GO:0048245) |
| 0.0 | 0.2 | GO:0006701 | progesterone biosynthetic process(GO:0006701) |
| 0.0 | 0.6 | GO:0045672 | positive regulation of osteoclast differentiation(GO:0045672) |
| 0.0 | 0.4 | GO:0033147 | negative regulation of intracellular estrogen receptor signaling pathway(GO:0033147) |
| 0.0 | 0.8 | GO:0071711 | basement membrane organization(GO:0071711) |
| 0.0 | 0.3 | GO:0015760 | hexose phosphate transport(GO:0015712) glucose-6-phosphate transport(GO:0015760) |
| 0.0 | 3.4 | GO:0051028 | mRNA transport(GO:0051028) |
| 0.0 | 2.1 | GO:0046785 | microtubule polymerization(GO:0046785) |
| 0.0 | 0.2 | GO:0015074 | DNA integration(GO:0015074) |
| 0.0 | 1.0 | GO:0051973 | positive regulation of telomerase activity(GO:0051973) |
| 0.0 | 0.5 | GO:0006825 | copper ion transport(GO:0006825) |
| 0.0 | 1.2 | GO:0042398 | cellular modified amino acid biosynthetic process(GO:0042398) |
| 0.0 | 0.4 | GO:0070886 | positive regulation of calcineurin-NFAT signaling cascade(GO:0070886) |
| 0.0 | 0.3 | GO:2000324 | positive regulation of glucocorticoid receptor signaling pathway(GO:2000324) |
| 0.0 | 0.1 | GO:0021633 | optic nerve structural organization(GO:0021633) |
| 0.0 | 0.1 | GO:2001012 | mesenchymal cell differentiation involved in kidney development(GO:0072161) mesenchymal cell differentiation involved in renal system development(GO:2001012) |
| 0.0 | 0.7 | GO:0010501 | RNA secondary structure unwinding(GO:0010501) |
| 0.0 | 0.2 | GO:2000114 | regulation of establishment of cell polarity(GO:2000114) |
| 0.0 | 1.0 | GO:0007569 | cell aging(GO:0007569) |
| 0.0 | 0.0 | GO:0002661 | B cell tolerance induction(GO:0002514) regulation of tolerance induction to self antigen(GO:0002649) regulation of B cell tolerance induction(GO:0002661) positive regulation of B cell tolerance induction(GO:0002663) endocardial cushion fusion(GO:0003274) growth plate cartilage chondrocyte growth(GO:0003430) cell adhesion involved in heart morphogenesis(GO:0061343) positive regulation of epithelial to mesenchymal transition involved in endocardial cushion formation(GO:1905007) positive regulation of CD4-positive, alpha-beta T cell proliferation(GO:2000563) |
| 0.0 | 0.3 | GO:0016082 | synaptic vesicle priming(GO:0016082) |
| 0.0 | 0.7 | GO:0006446 | regulation of translational initiation(GO:0006446) |
| 0.0 | 0.1 | GO:0035754 | B cell chemotaxis(GO:0035754) |
| 0.0 | 1.5 | GO:0006910 | phagocytosis, recognition(GO:0006910) |
| 0.0 | 0.3 | GO:0000186 | activation of MAPKK activity(GO:0000186) |
Gene overrepresentation in cellular component category:
| Log-likelihood per target | Total log-likelihood | Term | Description |
|---|---|---|---|
| 3.3 | 9.8 | GO:0042643 | actomyosin, actin portion(GO:0042643) |
| 2.8 | 11.2 | GO:0071149 | TEAD-2-YAP complex(GO:0071149) |
| 1.5 | 42.8 | GO:0014731 | spectrin-associated cytoskeleton(GO:0014731) |
| 1.4 | 15.8 | GO:0097451 | glial limiting end-foot(GO:0097451) |
| 1.3 | 19.4 | GO:0005862 | muscle thin filament tropomyosin(GO:0005862) |
| 1.2 | 3.6 | GO:0031904 | endosome lumen(GO:0031904) |
| 1.2 | 7.1 | GO:0008537 | proteasome activator complex(GO:0008537) |
| 1.1 | 20.9 | GO:0005861 | troponin complex(GO:0005861) |
| 0.8 | 8.0 | GO:0005890 | sodium:potassium-exchanging ATPase complex(GO:0005890) |
| 0.7 | 2.7 | GO:0097169 | AIM2 inflammasome complex(GO:0097169) |
| 0.5 | 2.2 | GO:0060171 | stereocilium membrane(GO:0060171) |
| 0.5 | 6.5 | GO:0097512 | cardiac myofibril(GO:0097512) |
| 0.5 | 2.9 | GO:0098553 | integral component of cytoplasmic side of endoplasmic reticulum membrane(GO:0071458) integral component of lumenal side of endoplasmic reticulum membrane(GO:0071556) lumenal side of endoplasmic reticulum membrane(GO:0098553) |
| 0.5 | 1.4 | GO:0044302 | dentate gyrus mossy fiber(GO:0044302) |
| 0.4 | 2.6 | GO:0032299 | ribonuclease H2 complex(GO:0032299) |
| 0.4 | 3.2 | GO:0031673 | H zone(GO:0031673) |
| 0.4 | 2.6 | GO:0097513 | myosin II filament(GO:0097513) |
| 0.3 | 3.4 | GO:0031390 | Ctf18 RFC-like complex(GO:0031390) |
| 0.3 | 2.2 | GO:0030689 | Noc complex(GO:0030689) |
| 0.3 | 22.4 | GO:0000307 | cyclin-dependent protein kinase holoenzyme complex(GO:0000307) |
| 0.3 | 18.5 | GO:0031672 | A band(GO:0031672) |
| 0.3 | 2.1 | GO:0070381 | endosome to plasma membrane transport vesicle(GO:0070381) |
| 0.3 | 0.8 | GO:0034673 | inhibin-betaglycan-ActRII complex(GO:0034673) inhibin A complex(GO:0043512) |
| 0.3 | 8.3 | GO:0000159 | protein phosphatase type 2A complex(GO:0000159) |
| 0.2 | 1.5 | GO:0000214 | tRNA-intron endonuclease complex(GO:0000214) |
| 0.2 | 1.9 | GO:0032983 | kainate selective glutamate receptor complex(GO:0032983) |
| 0.2 | 2.9 | GO:0097427 | microtubule bundle(GO:0097427) |
| 0.2 | 1.1 | GO:0044194 | cytolytic granule(GO:0044194) |
| 0.2 | 3.7 | GO:0005751 | mitochondrial respiratory chain complex IV(GO:0005751) |
| 0.2 | 1.3 | GO:0005955 | calcineurin complex(GO:0005955) |
| 0.2 | 2.1 | GO:0035867 | alphav-beta3 integrin-IGF-1-IGF1R complex(GO:0035867) |
| 0.2 | 2.0 | GO:0044666 | MLL3/4 complex(GO:0044666) |
| 0.1 | 2.5 | GO:0034098 | VCP-NPL4-UFD1 AAA ATPase complex(GO:0034098) |
| 0.1 | 12.1 | GO:0016459 | myosin complex(GO:0016459) |
| 0.1 | 7.0 | GO:0005637 | nuclear inner membrane(GO:0005637) |
| 0.1 | 9.1 | GO:0046658 | anchored component of plasma membrane(GO:0046658) |
| 0.1 | 4.3 | GO:0034451 | centriolar satellite(GO:0034451) |
| 0.1 | 0.9 | GO:0000931 | gamma-tubulin large complex(GO:0000931) gamma-tubulin ring complex(GO:0008274) |
| 0.1 | 1.2 | GO:0001940 | male pronucleus(GO:0001940) |
| 0.1 | 5.4 | GO:0097440 | apical dendrite(GO:0097440) |
| 0.1 | 1.5 | GO:0031209 | SCAR complex(GO:0031209) |
| 0.1 | 8.5 | GO:0031985 | Golgi cisterna(GO:0031985) |
| 0.1 | 7.9 | GO:0005881 | cytoplasmic microtubule(GO:0005881) |
| 0.1 | 2.4 | GO:0000421 | autophagosome membrane(GO:0000421) |
| 0.1 | 3.8 | GO:0030904 | retromer complex(GO:0030904) |
| 0.1 | 4.3 | GO:0030173 | integral component of Golgi membrane(GO:0030173) |
| 0.1 | 0.2 | GO:0043291 | RAVE complex(GO:0043291) |
| 0.1 | 2.3 | GO:0005795 | Golgi stack(GO:0005795) |
| 0.1 | 1.2 | GO:0001527 | microfibril(GO:0001527) fibril(GO:0043205) |
| 0.1 | 3.2 | GO:0031941 | filamentous actin(GO:0031941) |
| 0.1 | 3.2 | GO:0002102 | podosome(GO:0002102) |
| 0.1 | 1.4 | GO:0044300 | cerebellar mossy fiber(GO:0044300) |
| 0.1 | 0.7 | GO:0016281 | eukaryotic translation initiation factor 4F complex(GO:0016281) |
| 0.1 | 0.6 | GO:0005677 | chromatin silencing complex(GO:0005677) |
| 0.1 | 1.1 | GO:0042405 | nuclear inclusion body(GO:0042405) |
| 0.1 | 1.5 | GO:0010369 | chromocenter(GO:0010369) |
| 0.1 | 2.3 | GO:0097228 | sperm principal piece(GO:0097228) |
| 0.1 | 0.2 | GO:1990452 | Parkin-FBXW7-Cul1 ubiquitin ligase complex(GO:1990452) |
| 0.0 | 0.6 | GO:0008540 | proteasome regulatory particle, base subcomplex(GO:0008540) |
| 0.0 | 0.7 | GO:0031618 | nuclear pericentric heterochromatin(GO:0031618) |
| 0.0 | 0.8 | GO:0035371 | microtubule plus-end(GO:0035371) |
| 0.0 | 0.8 | GO:0099634 | postsynaptic specialization membrane(GO:0099634) |
| 0.0 | 2.3 | GO:0005891 | voltage-gated calcium channel complex(GO:0005891) |
| 0.0 | 3.4 | GO:0005643 | nuclear pore(GO:0005643) |
| 0.0 | 2.7 | GO:0022625 | cytosolic large ribosomal subunit(GO:0022625) |
| 0.0 | 0.8 | GO:0000145 | exocyst(GO:0000145) |
| 0.0 | 18.2 | GO:0009897 | external side of plasma membrane(GO:0009897) |
| 0.0 | 1.1 | GO:0032588 | trans-Golgi network membrane(GO:0032588) |
| 0.0 | 0.3 | GO:0072669 | tRNA-splicing ligase complex(GO:0072669) |
| 0.0 | 1.0 | GO:0051233 | spindle midzone(GO:0051233) |
| 0.0 | 0.3 | GO:0031415 | NatA complex(GO:0031415) |
| 0.0 | 3.8 | GO:0017053 | transcriptional repressor complex(GO:0017053) |
| 0.0 | 0.5 | GO:0035102 | PRC1 complex(GO:0035102) |
| 0.0 | 0.3 | GO:0048787 | presynaptic active zone membrane(GO:0048787) |
| 0.0 | 4.6 | GO:0001650 | fibrillar center(GO:0001650) |
| 0.0 | 0.5 | GO:0001518 | voltage-gated sodium channel complex(GO:0001518) |
| 0.0 | 0.2 | GO:0044232 | organelle membrane contact site(GO:0044232) |
| 0.0 | 1.3 | GO:0005758 | mitochondrial intermembrane space(GO:0005758) |
| 0.0 | 3.9 | GO:0009898 | cytoplasmic side of plasma membrane(GO:0009898) |
| 0.0 | 1.3 | GO:0005811 | lipid particle(GO:0005811) |
Gene overrepresentation in molecular function category:
| Log-likelihood per target | Total log-likelihood | Term | Description |
|---|---|---|---|
| 3.4 | 34.4 | GO:0008093 | cytoskeletal adaptor activity(GO:0008093) |
| 2.2 | 8.7 | GO:0015199 | amino-acid betaine transmembrane transporter activity(GO:0015199) carnitine transmembrane transporter activity(GO:0015226) |
| 2.0 | 8.2 | GO:0008160 | protein tyrosine phosphatase activator activity(GO:0008160) |
| 1.4 | 14.3 | GO:0031014 | troponin T binding(GO:0031014) |
| 1.4 | 4.3 | GO:0033829 | O-fucosylpeptide 3-beta-N-acetylglucosaminyltransferase activity(GO:0033829) |
| 1.3 | 12.1 | GO:0005094 | Rho GDP-dissociation inhibitor activity(GO:0005094) |
| 1.2 | 6.1 | GO:0004839 | ubiquitin activating enzyme activity(GO:0004839) |
| 1.2 | 3.5 | GO:0004619 | bisphosphoglycerate mutase activity(GO:0004082) phosphoglycerate mutase activity(GO:0004619) 2,3-bisphosphoglycerate-dependent phosphoglycerate mutase activity(GO:0046538) |
| 1.0 | 4.1 | GO:0048030 | disaccharide binding(GO:0048030) |
| 0.8 | 5.0 | GO:0001165 | RNA polymerase I upstream control element sequence-specific DNA binding(GO:0001165) |
| 0.8 | 7.9 | GO:0003876 | AMP deaminase activity(GO:0003876) adenosine-phosphate deaminase activity(GO:0047623) |
| 0.8 | 3.0 | GO:0030172 | troponin C binding(GO:0030172) |
| 0.7 | 4.9 | GO:0004111 | creatine kinase activity(GO:0004111) |
| 0.7 | 8.0 | GO:0005391 | sodium:potassium-exchanging ATPase activity(GO:0005391) |
| 0.7 | 44.5 | GO:0008307 | structural constituent of muscle(GO:0008307) |
| 0.6 | 7.1 | GO:0061133 | endopeptidase activator activity(GO:0061133) |
| 0.6 | 2.5 | GO:0038100 | nodal binding(GO:0038100) |
| 0.6 | 2.4 | GO:0045183 | translation factor activity, non-nucleic acid binding(GO:0045183) |
| 0.6 | 3.0 | GO:0071987 | WD40-repeat domain binding(GO:0071987) |
| 0.6 | 7.1 | GO:0031545 | peptidyl-proline 4-dioxygenase activity(GO:0031545) |
| 0.5 | 11.2 | GO:0001134 | transcription factor activity, transcription factor recruiting(GO:0001134) |
| 0.5 | 4.6 | GO:0016936 | galactoside binding(GO:0016936) |
| 0.5 | 2.0 | GO:0031800 | type 3 metabotropic glutamate receptor binding(GO:0031800) |
| 0.5 | 1.8 | GO:0052743 | inositol tetrakisphosphate phosphatase activity(GO:0052743) |
| 0.4 | 2.5 | GO:0070320 | inward rectifier potassium channel inhibitor activity(GO:0070320) |
| 0.4 | 2.0 | GO:0004719 | protein-L-isoaspartate (D-aspartate) O-methyltransferase activity(GO:0004719) |
| 0.4 | 22.6 | GO:0004693 | cyclin-dependent protein serine/threonine kinase activity(GO:0004693) |
| 0.4 | 2.7 | GO:0070180 | large ribosomal subunit rRNA binding(GO:0070180) |
| 0.4 | 2.6 | GO:0004523 | RNA-DNA hybrid ribonuclease activity(GO:0004523) |
| 0.4 | 1.4 | GO:0015154 | sucrose:proton symporter activity(GO:0008506) sucrose transmembrane transporter activity(GO:0008515) disaccharide transmembrane transporter activity(GO:0015154) oligosaccharide transmembrane transporter activity(GO:0015157) |
| 0.3 | 8.6 | GO:0004707 | MAP kinase activity(GO:0004707) |
| 0.3 | 1.0 | GO:0001096 | TFIIF-class transcription factor binding(GO:0001096) |
| 0.3 | 10.5 | GO:0043395 | heparan sulfate proteoglycan binding(GO:0043395) |
| 0.3 | 9.4 | GO:0030506 | ankyrin binding(GO:0030506) |
| 0.3 | 1.9 | GO:0004706 | JUN kinase kinase kinase activity(GO:0004706) |
| 0.3 | 1.9 | GO:0015277 | kainate selective glutamate receptor activity(GO:0015277) |
| 0.3 | 0.9 | GO:0003845 | 11-beta-hydroxysteroid dehydrogenase [NAD(P)] activity(GO:0003845) |
| 0.3 | 3.4 | GO:0003689 | DNA clamp loader activity(GO:0003689) protein-DNA loading ATPase activity(GO:0033170) |
| 0.3 | 2.9 | GO:0042500 | aspartic endopeptidase activity, intramembrane cleaving(GO:0042500) |
| 0.3 | 1.1 | GO:0042392 | sphingosine-1-phosphate phosphatase activity(GO:0042392) |
| 0.3 | 4.8 | GO:0005523 | tropomyosin binding(GO:0005523) |
| 0.3 | 3.9 | GO:0071933 | Arp2/3 complex binding(GO:0071933) |
| 0.3 | 10.7 | GO:0070273 | phosphatidylinositol-4-phosphate binding(GO:0070273) |
| 0.3 | 2.4 | GO:0004716 | receptor signaling protein tyrosine kinase activity(GO:0004716) |
| 0.2 | 3.2 | GO:0005338 | nucleotide-sugar transmembrane transporter activity(GO:0005338) |
| 0.2 | 1.5 | GO:0000213 | tRNA-intron endonuclease activity(GO:0000213) |
| 0.2 | 5.8 | GO:0051861 | glycolipid binding(GO:0051861) |
| 0.2 | 1.6 | GO:0032027 | myosin light chain binding(GO:0032027) |
| 0.2 | 1.2 | GO:0061649 | ubiquitinated histone binding(GO:0061649) |
| 0.2 | 3.2 | GO:0005225 | volume-sensitive anion channel activity(GO:0005225) |
| 0.2 | 1.3 | GO:0034714 | type III transforming growth factor beta receptor binding(GO:0034714) |
| 0.2 | 2.4 | GO:0035184 | histone threonine kinase activity(GO:0035184) |
| 0.2 | 16.2 | GO:0050840 | extracellular matrix binding(GO:0050840) |
| 0.2 | 1.9 | GO:0004126 | cytidine deaminase activity(GO:0004126) |
| 0.2 | 9.5 | GO:0003785 | actin monomer binding(GO:0003785) |
| 0.2 | 0.6 | GO:0016005 | phospholipase A2 activator activity(GO:0016005) |
| 0.2 | 1.8 | GO:0031994 | insulin-like growth factor I binding(GO:0031994) |
| 0.2 | 6.6 | GO:0030676 | Rac guanyl-nucleotide exchange factor activity(GO:0030676) |
| 0.2 | 1.2 | GO:0070579 | methylcytosine dioxygenase activity(GO:0070579) |
| 0.2 | 4.1 | GO:0005212 | structural constituent of eye lens(GO:0005212) |
| 0.2 | 0.7 | GO:0003696 | satellite DNA binding(GO:0003696) |
| 0.2 | 1.2 | GO:0008479 | queuine tRNA-ribosyltransferase activity(GO:0008479) |
| 0.2 | 2.8 | GO:0005078 | MAP-kinase scaffold activity(GO:0005078) |
| 0.1 | 0.6 | GO:0031433 | telethonin binding(GO:0031433) FATZ binding(GO:0051373) |
| 0.1 | 0.9 | GO:0047276 | N-acetyllactosaminide 3-alpha-galactosyltransferase activity(GO:0047276) |
| 0.1 | 1.1 | GO:0015166 | polyol transmembrane transporter activity(GO:0015166) |
| 0.1 | 2.0 | GO:1990829 | C-rich single-stranded DNA binding(GO:1990829) |
| 0.1 | 8.6 | GO:0043027 | cysteine-type endopeptidase inhibitor activity involved in apoptotic process(GO:0043027) |
| 0.1 | 2.1 | GO:0032050 | clathrin heavy chain binding(GO:0032050) |
| 0.1 | 9.8 | GO:0043425 | bHLH transcription factor binding(GO:0043425) |
| 0.1 | 5.6 | GO:0005385 | zinc ion transmembrane transporter activity(GO:0005385) |
| 0.1 | 1.1 | GO:0001594 | trace-amine receptor activity(GO:0001594) |
| 0.1 | 3.7 | GO:0004129 | cytochrome-c oxidase activity(GO:0004129) heme-copper terminal oxidase activity(GO:0015002) oxidoreductase activity, acting on a heme group of donors, oxygen as acceptor(GO:0016676) |
| 0.1 | 3.7 | GO:0004181 | metallocarboxypeptidase activity(GO:0004181) |
| 0.1 | 0.7 | GO:0050816 | phosphothreonine binding(GO:0050816) |
| 0.1 | 0.7 | GO:0033192 | calmodulin-dependent protein phosphatase activity(GO:0033192) |
| 0.1 | 1.0 | GO:0005344 | oxygen transporter activity(GO:0005344) |
| 0.1 | 2.6 | GO:0030898 | actin-dependent ATPase activity(GO:0030898) |
| 0.1 | 3.8 | GO:0004012 | phospholipid-translocating ATPase activity(GO:0004012) |
| 0.1 | 0.4 | GO:0016842 | amidine-lyase activity(GO:0016842) |
| 0.1 | 0.6 | GO:0004359 | glutaminase activity(GO:0004359) |
| 0.1 | 4.0 | GO:0016769 | transferase activity, transferring nitrogenous groups(GO:0016769) |
| 0.1 | 0.8 | GO:0034711 | inhibin binding(GO:0034711) |
| 0.1 | 1.5 | GO:0015197 | peptide transporter activity(GO:0015197) |
| 0.1 | 2.5 | GO:0042171 | lysophosphatidic acid acyltransferase activity(GO:0042171) |
| 0.1 | 1.6 | GO:0004089 | carbonate dehydratase activity(GO:0004089) |
| 0.1 | 1.0 | GO:0032051 | clathrin light chain binding(GO:0032051) |
| 0.1 | 2.0 | GO:0042800 | histone methyltransferase activity (H3-K4 specific)(GO:0042800) |
| 0.1 | 8.8 | GO:0004197 | cysteine-type endopeptidase activity(GO:0004197) |
| 0.1 | 0.6 | GO:0010859 | calcium-dependent cysteine-type endopeptidase inhibitor activity(GO:0010859) |
| 0.1 | 1.6 | GO:0016805 | dipeptidase activity(GO:0016805) |
| 0.1 | 0.2 | GO:0010698 | acetyltransferase activator activity(GO:0010698) |
| 0.1 | 0.8 | GO:0022858 | L-alanine transmembrane transporter activity(GO:0015180) L-proline transmembrane transporter activity(GO:0015193) alanine transmembrane transporter activity(GO:0022858) |
| 0.1 | 5.1 | GO:0005070 | SH3/SH2 adaptor activity(GO:0005070) |
| 0.1 | 1.2 | GO:0043495 | protein anchor(GO:0043495) |
| 0.1 | 2.3 | GO:0003950 | NAD+ ADP-ribosyltransferase activity(GO:0003950) |
| 0.1 | 0.6 | GO:0008440 | inositol-1,4,5-trisphosphate 3-kinase activity(GO:0008440) |
| 0.1 | 10.5 | GO:0005178 | integrin binding(GO:0005178) |
| 0.1 | 1.9 | GO:0004709 | MAP kinase kinase kinase activity(GO:0004709) |
| 0.1 | 0.5 | GO:0086006 | voltage-gated sodium channel activity involved in cardiac muscle cell action potential(GO:0086006) |
| 0.1 | 0.7 | GO:0016813 | hydrolase activity, acting on carbon-nitrogen (but not peptide) bonds, in linear amidines(GO:0016813) |
| 0.1 | 1.8 | GO:0016702 | oxidoreductase activity, acting on single donors with incorporation of molecular oxygen, incorporation of two atoms of oxygen(GO:0016702) |
| 0.1 | 7.6 | GO:0003697 | single-stranded DNA binding(GO:0003697) |
| 0.1 | 0.6 | GO:0008454 | alpha-1,3-mannosylglycoprotein 4-beta-N-acetylglucosaminyltransferase activity(GO:0008454) |
| 0.1 | 0.2 | GO:0016015 | morphogen activity(GO:0016015) |
| 0.1 | 1.1 | GO:0016863 | intramolecular oxidoreductase activity, transposing C=C bonds(GO:0016863) |
| 0.1 | 3.3 | GO:0001965 | G-protein alpha-subunit binding(GO:0001965) |
| 0.1 | 0.9 | GO:0051011 | microtubule minus-end binding(GO:0051011) |
| 0.0 | 3.8 | GO:0017022 | myosin binding(GO:0017022) |
| 0.0 | 0.5 | GO:0016724 | ferroxidase activity(GO:0004322) oxidoreductase activity, oxidizing metal ions, oxygen as acceptor(GO:0016724) |
| 0.0 | 1.4 | GO:0048156 | tau protein binding(GO:0048156) |
| 0.0 | 0.7 | GO:0086008 | voltage-gated potassium channel activity involved in cardiac muscle cell action potential repolarization(GO:0086008) |
| 0.0 | 2.6 | GO:0005245 | voltage-gated calcium channel activity(GO:0005245) |
| 0.0 | 0.3 | GO:0031821 | G-protein coupled serotonin receptor binding(GO:0031821) |
| 0.0 | 0.5 | GO:0008097 | 5S rRNA binding(GO:0008097) |
| 0.0 | 0.3 | GO:0030375 | thyroid hormone receptor coactivator activity(GO:0030375) |
| 0.0 | 2.3 | GO:0016836 | hydro-lyase activity(GO:0016836) |
| 0.0 | 2.8 | GO:0004536 | deoxyribonuclease activity(GO:0004536) |
| 0.0 | 1.1 | GO:0048027 | mRNA 5'-UTR binding(GO:0048027) |
| 0.0 | 0.8 | GO:0003680 | AT DNA binding(GO:0003680) |
| 0.0 | 1.5 | GO:0051019 | mitogen-activated protein kinase binding(GO:0051019) |
| 0.0 | 1.9 | GO:0019003 | GDP binding(GO:0019003) |
| 0.0 | 4.2 | GO:0004896 | cytokine receptor activity(GO:0004896) |
| 0.0 | 0.3 | GO:0035612 | AP-2 adaptor complex binding(GO:0035612) |
| 0.0 | 2.2 | GO:0002039 | p53 binding(GO:0002039) |
| 0.0 | 1.3 | GO:0070063 | RNA polymerase binding(GO:0070063) |
| 0.0 | 1.9 | GO:0005200 | structural constituent of cytoskeleton(GO:0005200) |
| 0.0 | 0.2 | GO:0001849 | complement component C1q binding(GO:0001849) |
| 0.0 | 0.1 | GO:0030280 | structural constituent of epidermis(GO:0030280) |
| 0.0 | 0.2 | GO:0005025 | transforming growth factor beta receptor activity, type I(GO:0005025) |
| 0.0 | 0.6 | GO:0051059 | NF-kappaB binding(GO:0051059) |
| 0.0 | 0.6 | GO:0008139 | nuclear localization sequence binding(GO:0008139) |
| 0.0 | 2.0 | GO:0001104 | RNA polymerase II transcription cofactor activity(GO:0001104) |
| 0.0 | 0.1 | GO:0001069 | regulatory region RNA binding(GO:0001069) |
| 0.0 | 0.2 | GO:0031802 | type 5 metabotropic glutamate receptor binding(GO:0031802) |
| 0.0 | 5.8 | GO:0001227 | transcriptional repressor activity, RNA polymerase II transcription regulatory region sequence-specific binding(GO:0001227) |
| 0.0 | 0.1 | GO:0031849 | olfactory receptor binding(GO:0031849) |
| 0.0 | 0.5 | GO:0004115 | 3',5'-cyclic-AMP phosphodiesterase activity(GO:0004115) |
| 0.0 | 1.1 | GO:0003724 | RNA helicase activity(GO:0003724) ATP-dependent RNA helicase activity(GO:0004004) RNA-dependent ATPase activity(GO:0008186) |
| 0.0 | 0.3 | GO:0004596 | peptide alpha-N-acetyltransferase activity(GO:0004596) |
| 0.0 | 0.2 | GO:0030274 | LIM domain binding(GO:0030274) |
| 0.0 | 5.7 | GO:0015631 | tubulin binding(GO:0015631) |
| 0.0 | 0.4 | GO:0001103 | RNA polymerase II repressing transcription factor binding(GO:0001103) |
| 0.0 | 0.1 | GO:0015016 | [heparan sulfate]-glucosamine N-sulfotransferase activity(GO:0015016) |
| 0.0 | 2.2 | GO:0051015 | actin filament binding(GO:0051015) |
| 0.0 | 4.6 | GO:0005096 | GTPase activator activity(GO:0005096) |
| 0.0 | 0.3 | GO:0070006 | metalloaminopeptidase activity(GO:0070006) |
| 0.0 | 1.5 | GO:0034987 | immunoglobulin receptor binding(GO:0034987) |
| 0.0 | 3.1 | GO:0001664 | G-protein coupled receptor binding(GO:0001664) |
| 0.0 | 0.4 | GO:0051721 | protein phosphatase 2A binding(GO:0051721) |
| 0.0 | 0.9 | GO:0003730 | mRNA 3'-UTR binding(GO:0003730) |
Gene overrepresentation in curated gene sets: canonical pathways category:
| Log-likelihood per target | Total log-likelihood | Term | Description |
|---|---|---|---|
| 0.5 | 8.6 | PID P38 GAMMA DELTA PATHWAY | Signaling mediated by p38-gamma and p38-delta |
| 0.4 | 5.8 | SA MMP CYTOKINE CONNECTION | Cytokines can induce activation of matrix metalloproteinases, which degrade extracellular matrix. |
| 0.3 | 5.2 | PID TCR JNK PATHWAY | JNK signaling in the CD4+ TCR pathway |
| 0.3 | 19.4 | PID IL2 STAT5 PATHWAY | IL2 signaling events mediated by STAT5 |
| 0.3 | 8.6 | PID LYMPH ANGIOGENESIS PATHWAY | VEGFR3 signaling in lymphatic endothelium |
| 0.2 | 2.7 | PID TCR RAS PATHWAY | Ras signaling in the CD4+ TCR pathway |
| 0.2 | 9.3 | PID A6B1 A6B4 INTEGRIN PATHWAY | a6b1 and a6b4 Integrin signaling |
| 0.2 | 4.9 | PID P38 MK2 PATHWAY | p38 signaling mediated by MAPKAP kinases |
| 0.1 | 11.0 | PID RB 1PATHWAY | Regulation of retinoblastoma protein |
| 0.1 | 19.4 | PID ERBB1 DOWNSTREAM PATHWAY | ErbB1 downstream signaling |
| 0.1 | 6.3 | PID KIT PATHWAY | Signaling events mediated by Stem cell factor receptor (c-Kit) |
| 0.1 | 13.4 | PID RHOA REG PATHWAY | Regulation of RhoA activity |
| 0.1 | 2.5 | PID PDGFRA PATHWAY | PDGFR-alpha signaling pathway |
| 0.1 | 1.6 | PID S1P S1P4 PATHWAY | S1P4 pathway |
| 0.1 | 4.1 | PID RAS PATHWAY | Regulation of Ras family activation |
| 0.1 | 4.1 | PID RAC1 REG PATHWAY | Regulation of RAC1 activity |
| 0.1 | 2.1 | PID IGF1 PATHWAY | IGF1 pathway |
| 0.1 | 4.6 | PID AURORA B PATHWAY | Aurora B signaling |
| 0.1 | 1.7 | PID MAPK TRK PATHWAY | Trk receptor signaling mediated by the MAPK pathway |
| 0.1 | 1.6 | PID IL2 PI3K PATHWAY | IL2 signaling events mediated by PI3K |
| 0.1 | 4.8 | PID PDGFRB PATHWAY | PDGFR-beta signaling pathway |
| 0.1 | 1.2 | PID INTEGRIN5 PATHWAY | Beta5 beta6 beta7 and beta8 integrin cell surface interactions |
| 0.1 | 11.5 | NABA ECM AFFILIATED | Genes encoding proteins affiliated structurally or functionally to extracellular matrix proteins |
| 0.1 | 2.0 | PID IL1 PATHWAY | IL1-mediated signaling events |
| 0.1 | 2.8 | PID FANCONI PATHWAY | Fanconi anemia pathway |
| 0.1 | 1.4 | ST GRANULE CELL SURVIVAL PATHWAY | Granule Cell Survival Pathway is a specific case of more general PAC1 Receptor Pathway. |
| 0.0 | 4.9 | PID ERA GENOMIC PATHWAY | Validated nuclear estrogen receptor alpha network |
| 0.0 | 1.3 | PID ALK1 PATHWAY | ALK1 signaling events |
| 0.0 | 4.6 | PID NOTCH PATHWAY | Notch signaling pathway |
| 0.0 | 2.0 | PID ARF6 TRAFFICKING PATHWAY | Arf6 trafficking events |
| 0.0 | 1.4 | PID ERBB4 PATHWAY | ErbB4 signaling events |
| 0.0 | 1.3 | PID BCR 5PATHWAY | BCR signaling pathway |
| 0.0 | 2.2 | PID SMAD2 3NUCLEAR PATHWAY | Regulation of nuclear SMAD2/3 signaling |
| 0.0 | 1.0 | PID TNF PATHWAY | TNF receptor signaling pathway |
| 0.0 | 3.7 | PID P53 DOWNSTREAM PATHWAY | Direct p53 effectors |
| 0.0 | 0.7 | PID HNF3A PATHWAY | FOXA1 transcription factor network |
| 0.0 | 1.1 | PID P53 REGULATION PATHWAY | p53 pathway |
| 0.0 | 0.2 | PID ERBB2 ERBB3 PATHWAY | ErbB2/ErbB3 signaling events |
| 0.0 | 0.3 | PID HDAC CLASSIII PATHWAY | Signaling events mediated by HDAC Class III |
| 0.0 | 0.2 | PID HIF1A PATHWAY | Hypoxic and oxygen homeostasis regulation of HIF-1-alpha |
Gene overrepresentation in curated gene sets: REACTOME pathways category:
| Log-likelihood per target | Total log-likelihood | Term | Description |
|---|---|---|---|
| 0.8 | 54.8 | REACTOME STRIATED MUSCLE CONTRACTION | Genes involved in Striated Muscle Contraction |
| 0.8 | 42.1 | REACTOME INTERACTION BETWEEN L1 AND ANKYRINS | Genes involved in Interaction between L1 and Ankyrins |
| 0.6 | 8.7 | REACTOME ORGANIC CATION ANION ZWITTERION TRANSPORT | Genes involved in Organic cation/anion/zwitterion transport |
| 0.4 | 10.7 | REACTOME HS GAG DEGRADATION | Genes involved in HS-GAG degradation |
| 0.4 | 8.6 | REACTOME DSCAM INTERACTIONS | Genes involved in DSCAM interactions |
| 0.4 | 22.4 | REACTOME G1 PHASE | Genes involved in G1 Phase |
| 0.4 | 3.5 | REACTOME REGULATION OF THE FANCONI ANEMIA PATHWAY | Genes involved in Regulation of the Fanconi anemia pathway |
| 0.3 | 7.9 | REACTOME PURINE SALVAGE | Genes involved in Purine salvage |
| 0.3 | 5.0 | REACTOME RNA POL I PROMOTER OPENING | Genes involved in RNA Polymerase I Promoter Opening |
| 0.3 | 15.0 | REACTOME ION TRANSPORT BY P TYPE ATPASES | Genes involved in Ion transport by P-type ATPases |
| 0.2 | 7.8 | REACTOME ERK MAPK TARGETS | Genes involved in ERK/MAPK targets |
| 0.2 | 5.6 | REACTOME ZINC TRANSPORTERS | Genes involved in Zinc transporters |
| 0.2 | 3.9 | REACTOME IONOTROPIC ACTIVITY OF KAINATE RECEPTORS | Genes involved in Ionotropic activity of Kainate Receptors |
| 0.2 | 7.5 | REACTOME YAP1 AND WWTR1 TAZ STIMULATED GENE EXPRESSION | Genes involved in YAP1- and WWTR1 (TAZ)-stimulated gene expression |
| 0.2 | 2.7 | REACTOME THE NLRP3 INFLAMMASOME | Genes involved in The NLRP3 inflammasome |
| 0.2 | 6.5 | REACTOME ACTIVATED NOTCH1 TRANSMITS SIGNAL TO THE NUCLEUS | Genes involved in Activated NOTCH1 Transmits Signal to the Nucleus |
| 0.1 | 7.3 | REACTOME NEGATIVE REGULATORS OF RIG I MDA5 SIGNALING | Genes involved in Negative regulators of RIG-I/MDA5 signaling |
| 0.1 | 3.5 | REACTOME DEGRADATION OF THE EXTRACELLULAR MATRIX | Genes involved in Degradation of the extracellular matrix |
| 0.1 | 2.9 | REACTOME PRE NOTCH PROCESSING IN GOLGI | Genes involved in Pre-NOTCH Processing in Golgi |
| 0.1 | 2.7 | REACTOME SIGNALING BY NODAL | Genes involved in Signaling by NODAL |
| 0.1 | 2.4 | REACTOME TRAFFICKING OF GLUR2 CONTAINING AMPA RECEPTORS | Genes involved in Trafficking of GluR2-containing AMPA receptors |
| 0.1 | 3.5 | REACTOME GLYCOLYSIS | Genes involved in Glycolysis |
| 0.1 | 10.1 | REACTOME RESPONSE TO ELEVATED PLATELET CYTOSOLIC CA2 | Genes involved in Response to elevated platelet cytosolic Ca2+ |
| 0.1 | 3.4 | REACTOME TRANSPORT OF RIBONUCLEOPROTEINS INTO THE HOST NUCLEUS | Genes involved in Transport of Ribonucleoproteins into the Host Nucleus |
| 0.1 | 1.9 | REACTOME TRAF6 MEDIATED NFKB ACTIVATION | Genes involved in TRAF6 mediated NF-kB activation |
| 0.1 | 1.9 | REACTOME P130CAS LINKAGE TO MAPK SIGNALING FOR INTEGRINS | Genes involved in p130Cas linkage to MAPK signaling for integrins |
| 0.1 | 2.3 | REACTOME SMAD2 SMAD3 SMAD4 HETEROTRIMER REGULATES TRANSCRIPTION | Genes involved in SMAD2/SMAD3:SMAD4 heterotrimer regulates transcription |
| 0.1 | 4.9 | REACTOME IMMUNOREGULATORY INTERACTIONS BETWEEN A LYMPHOID AND A NON LYMPHOID CELL | Genes involved in Immunoregulatory interactions between a Lymphoid and a non-Lymphoid cell |
| 0.1 | 2.4 | REACTOME REGULATION OF KIT SIGNALING | Genes involved in Regulation of KIT signaling |
| 0.1 | 2.3 | REACTOME THE ROLE OF NEF IN HIV1 REPLICATION AND DISEASE PATHOGENESIS | Genes involved in The role of Nef in HIV-1 replication and disease pathogenesis |
| 0.1 | 2.4 | REACTOME SIGNALING BY HIPPO | Genes involved in Signaling by Hippo |
| 0.1 | 2.0 | REACTOME CELL EXTRACELLULAR MATRIX INTERACTIONS | Genes involved in Cell-extracellular matrix interactions |
| 0.1 | 0.8 | REACTOME GLYCOPROTEIN HORMONES | Genes involved in Glycoprotein hormones |
| 0.1 | 2.5 | REACTOME ENOS ACTIVATION AND REGULATION | Genes involved in eNOS activation and regulation |
| 0.1 | 14.3 | REACTOME SIGNALING BY RHO GTPASES | Genes involved in Signaling by Rho GTPases |
| 0.1 | 1.3 | REACTOME DARPP 32 EVENTS | Genes involved in DARPP-32 events |
| 0.1 | 1.5 | REACTOME EGFR DOWNREGULATION | Genes involved in EGFR downregulation |
| 0.1 | 0.9 | REACTOME RECRUITMENT OF NUMA TO MITOTIC CENTROSOMES | Genes involved in Recruitment of NuMA to mitotic centrosomes |
| 0.0 | 0.9 | REACTOME INTEGRIN CELL SURFACE INTERACTIONS | Genes involved in Integrin cell surface interactions |
| 0.0 | 1.5 | REACTOME SYNTHESIS OF PC | Genes involved in Synthesis of PC |
| 0.0 | 2.0 | REACTOME IL1 SIGNALING | Genes involved in Interleukin-1 signaling |
| 0.0 | 10.2 | REACTOME METABOLISM OF AMINO ACIDS AND DERIVATIVES | Genes involved in Metabolism of amino acids and derivatives |
| 0.0 | 2.1 | REACTOME GOLGI ASSOCIATED VESICLE BIOGENESIS | Genes involved in Golgi Associated Vesicle Biogenesis |
| 0.0 | 0.8 | REACTOME INSULIN SYNTHESIS AND PROCESSING | Genes involved in Insulin Synthesis and Processing |
| 0.0 | 0.9 | REACTOME GRB2 EVENTS IN ERBB2 SIGNALING | Genes involved in GRB2 events in ERBB2 signaling |
| 0.0 | 0.8 | REACTOME PROCESSING OF INTRONLESS PRE MRNAS | Genes involved in Processing of Intronless Pre-mRNAs |
| 0.0 | 0.9 | REACTOME OTHER SEMAPHORIN INTERACTIONS | Genes involved in Other semaphorin interactions |
| 0.0 | 0.8 | REACTOME REGULATION OF SIGNALING BY CBL | Genes involved in Regulation of signaling by CBL |
| 0.0 | 0.7 | REACTOME SYNTHESIS SECRETION AND DEACYLATION OF GHRELIN | Genes involved in Synthesis, Secretion, and Deacylation of Ghrelin |
| 0.0 | 0.8 | REACTOME CIRCADIAN CLOCK | Genes involved in Circadian Clock |
| 0.0 | 0.1 | REACTOME P53 DEPENDENT G1 DNA DAMAGE RESPONSE | Genes involved in p53-Dependent G1 DNA Damage Response |
| 0.0 | 0.6 | REACTOME DESTABILIZATION OF MRNA BY TRISTETRAPROLIN TTP | Genes involved in Destabilization of mRNA by Tristetraprolin (TTP) |
| 0.0 | 1.3 | REACTOME G PROTEIN ACTIVATION | Genes involved in G-protein activation |
| 0.0 | 1.1 | REACTOME SPHINGOLIPID DE NOVO BIOSYNTHESIS | Genes involved in Sphingolipid de novo biosynthesis |
| 0.0 | 0.6 | REACTOME N GLYCAN ANTENNAE ELONGATION | Genes involved in N-Glycan antennae elongation |
| 0.0 | 2.7 | REACTOME PEPTIDE CHAIN ELONGATION | Genes involved in Peptide chain elongation |
| 0.0 | 0.2 | REACTOME INHIBITION OF INSULIN SECRETION BY ADRENALINE NORADRENALINE | Genes involved in Inhibition of Insulin Secretion by Adrenaline/Noradrenaline |
| 0.0 | 1.0 | REACTOME ANTIVIRAL MECHANISM BY IFN STIMULATED GENES | Genes involved in Antiviral mechanism by IFN-stimulated genes |
| 0.0 | 0.2 | REACTOME REGULATION OF HYPOXIA INDUCIBLE FACTOR HIF BY OXYGEN | Genes involved in Regulation of Hypoxia-inducible Factor (HIF) by Oxygen |
| 0.0 | 0.2 | REACTOME GLUCAGON TYPE LIGAND RECEPTORS | Genes involved in Glucagon-type ligand receptors |
| 0.0 | 0.7 | REACTOME NCAM1 INTERACTIONS | Genes involved in NCAM1 interactions |
| 0.0 | 0.2 | REACTOME SIGNALING BY BMP | Genes involved in Signaling by BMP |
| 0.0 | 2.0 | REACTOME G ALPHA I SIGNALLING EVENTS | Genes involved in G alpha (i) signalling events |