Project
GSE58827: Dynamics of the Mouse Liver
Navigation
Downloads
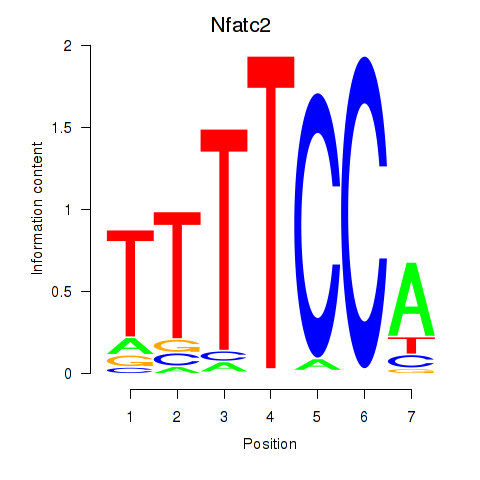
Results for Nfatc2
Z-value: 1.34
Motif logo
Transcription factors associated with Nfatc2
| Gene Symbol | Gene ID | Gene Info |
|---|---|---|
|
Nfatc2
|
ENSMUSG00000027544.17 | nuclear factor of activated T cells, cytoplasmic, calcineurin dependent 2 |
Activity-expression correlation:
| Gene | Promoter | Pearson corr. coef. | P-value | Plot |
|---|---|---|---|---|
| Nfatc2 | mm39_v1_chr2_-_168432235_168432308 | 0.60 | 9.9e-05 | Click! |
Activity profile of Nfatc2 motif
Sorted Z-values of Nfatc2 motif
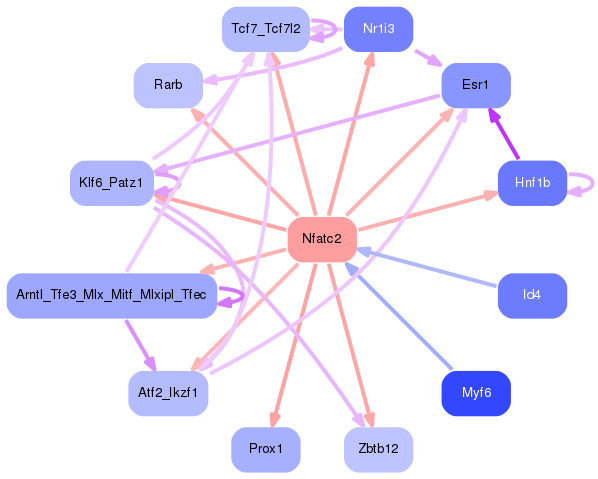
Network of associatons between targets according to the STRING database.

First level regulatory network of Nfatc2
Gene Ontology Analysis
Gene overrepresentation in biological process category:
| Log-likelihood per target | Total log-likelihood | Term | Description |
|---|---|---|---|
| 1.5 | 6.0 | GO:2000503 | positive regulation of natural killer cell chemotaxis(GO:2000503) |
| 0.9 | 2.7 | GO:0006597 | spermine biosynthetic process(GO:0006597) |
| 0.8 | 3.2 | GO:1903225 | negative regulation of endodermal cell differentiation(GO:1903225) |
| 0.7 | 2.2 | GO:0061357 | positive regulation of Wnt protein secretion(GO:0061357) |
| 0.6 | 7.3 | GO:0048251 | elastic fiber assembly(GO:0048251) |
| 0.6 | 2.9 | GO:0070315 | G1 to G0 transition involved in cell differentiation(GO:0070315) |
| 0.6 | 2.3 | GO:0061215 | regulation of pronephros size(GO:0035565) mesonephros morphogenesis(GO:0061206) mesonephric nephron development(GO:0061215) mesonephric nephron morphogenesis(GO:0061228) mesenchymal stem cell maintenance involved in mesonephric nephron morphogenesis(GO:0061235) regulation of mesenchymal cell apoptotic process involved in mesonephric nephron morphogenesis(GO:0061295) negative regulation of mesenchymal cell apoptotic process involved in mesonephric nephron morphogenesis(GO:0061296) mesenchymal cell apoptotic process involved in mesonephric nephron morphogenesis(GO:1901146) |
| 0.6 | 1.7 | GO:1904117 | response to vasopressin(GO:1904116) cellular response to vasopressin(GO:1904117) |
| 0.5 | 2.2 | GO:0042710 | biofilm formation(GO:0042710) single-species biofilm formation(GO:0044010) single-species biofilm formation in or on host organism(GO:0044407) membrane disruption in other organism(GO:0051673) regulation of single-species biofilm formation(GO:1900190) negative regulation of single-species biofilm formation(GO:1900191) regulation of single-species biofilm formation in or on host organism(GO:1900228) negative regulation of single-species biofilm formation in or on host organism(GO:1900229) |
| 0.5 | 1.5 | GO:0042853 | glycine biosynthetic process, by transamination of glyoxylate(GO:0019265) L-alanine catabolic process(GO:0042853) oxalic acid secretion(GO:0046724) |
| 0.5 | 1.5 | GO:0097037 | heme export(GO:0097037) |
| 0.5 | 1.4 | GO:0046619 | optic placode formation involved in camera-type eye formation(GO:0046619) |
| 0.5 | 1.9 | GO:0051933 | amino acid neurotransmitter reuptake(GO:0051933) glutamate reuptake(GO:0051935) |
| 0.5 | 1.4 | GO:0071288 | cellular response to mercury ion(GO:0071288) |
| 0.4 | 1.3 | GO:0015920 | lipopolysaccharide transport(GO:0015920) |
| 0.4 | 1.6 | GO:1900756 | protein processing in phagocytic vesicle(GO:1900756) regulation of protein processing in phagocytic vesicle(GO:1903921) positive regulation of protein processing in phagocytic vesicle(GO:1903923) |
| 0.4 | 1.5 | GO:0010510 | regulation of acetyl-CoA biosynthetic process from pyruvate(GO:0010510) |
| 0.4 | 1.5 | GO:0010751 | negative regulation of nitric oxide mediated signal transduction(GO:0010751) |
| 0.3 | 2.6 | GO:0090080 | positive regulation of MAPKKK cascade by fibroblast growth factor receptor signaling pathway(GO:0090080) |
| 0.3 | 1.0 | GO:0045074 | interleukin-10 biosynthetic process(GO:0042091) regulation of interleukin-10 biosynthetic process(GO:0045074) |
| 0.3 | 1.0 | GO:0045004 | DNA replication proofreading(GO:0045004) |
| 0.3 | 0.9 | GO:1904024 | negative regulation of NAD metabolic process(GO:1902689) negative regulation of glucose catabolic process to lactate via pyruvate(GO:1904024) |
| 0.3 | 1.5 | GO:0002752 | cell surface pattern recognition receptor signaling pathway(GO:0002752) |
| 0.3 | 1.5 | GO:0070543 | response to linoleic acid(GO:0070543) |
| 0.3 | 0.9 | GO:1902226 | regulation of macrophage colony-stimulating factor signaling pathway(GO:1902226) regulation of response to macrophage colony-stimulating factor(GO:1903969) regulation of cellular response to macrophage colony-stimulating factor stimulus(GO:1903972) |
| 0.3 | 0.9 | GO:0030070 | insulin processing(GO:0030070) |
| 0.3 | 2.0 | GO:0019661 | glucose catabolic process to lactate(GO:0019659) glycolytic fermentation(GO:0019660) glucose catabolic process to lactate via pyruvate(GO:0019661) |
| 0.3 | 1.1 | GO:1904009 | response to monosodium glutamate(GO:1904008) cellular response to monosodium glutamate(GO:1904009) |
| 0.3 | 0.9 | GO:0002545 | chronic inflammatory response to non-antigenic stimulus(GO:0002545) regulation of chronic inflammatory response to non-antigenic stimulus(GO:0002880) |
| 0.3 | 1.7 | GO:0035585 | calcium-mediated signaling using extracellular calcium source(GO:0035585) |
| 0.3 | 0.8 | GO:1903348 | positive regulation of bicellular tight junction assembly(GO:1903348) |
| 0.3 | 0.8 | GO:0018879 | biphenyl metabolic process(GO:0018879) |
| 0.3 | 0.8 | GO:1903433 | regulation of constitutive secretory pathway(GO:1903433) |
| 0.3 | 0.8 | GO:0060939 | transforming growth factor beta receptor complex assembly(GO:0007181) cardiac fibroblast cell differentiation(GO:0060935) cardiac fibroblast cell development(GO:0060936) epicardium-derived cardiac fibroblast cell differentiation(GO:0060938) epicardium-derived cardiac fibroblast cell development(GO:0060939) |
| 0.3 | 0.8 | GO:0045660 | positive regulation of neutrophil differentiation(GO:0045660) |
| 0.3 | 2.5 | GO:0045719 | negative regulation of glycogen biosynthetic process(GO:0045719) |
| 0.3 | 1.8 | GO:0007341 | penetration of zona pellucida(GO:0007341) |
| 0.3 | 2.3 | GO:2000491 | positive regulation of hepatic stellate cell activation(GO:2000491) |
| 0.3 | 0.3 | GO:2000642 | negative regulation of vacuolar transport(GO:1903336) negative regulation of early endosome to late endosome transport(GO:2000642) |
| 0.2 | 2.5 | GO:0042760 | very long-chain fatty acid catabolic process(GO:0042760) |
| 0.2 | 1.0 | GO:0010286 | heat acclimation(GO:0010286) |
| 0.2 | 2.2 | GO:0035589 | G-protein coupled purinergic nucleotide receptor signaling pathway(GO:0035589) |
| 0.2 | 3.1 | GO:0010724 | regulation of definitive erythrocyte differentiation(GO:0010724) |
| 0.2 | 0.5 | GO:0060849 | regulation of transcription involved in lymphatic endothelial cell fate commitment(GO:0060849) |
| 0.2 | 0.9 | GO:1902396 | protein localization to bicellular tight junction(GO:1902396) |
| 0.2 | 0.9 | GO:0001732 | formation of cytoplasmic translation initiation complex(GO:0001732) |
| 0.2 | 0.6 | GO:0006478 | peptidyl-tyrosine sulfation(GO:0006478) |
| 0.2 | 0.4 | GO:2000393 | negative regulation of lamellipodium morphogenesis(GO:2000393) |
| 0.2 | 0.6 | GO:1900158 | negative regulation of bone mineralization involved in bone maturation(GO:1900158) |
| 0.2 | 0.6 | GO:1904633 | glomerular visceral epithelial cell apoptotic process(GO:1903210) regulation of glomerular visceral epithelial cell apoptotic process(GO:1904633) positive regulation of glomerular visceral epithelial cell apoptotic process(GO:1904635) positive regulation of progesterone biosynthetic process(GO:2000184) |
| 0.2 | 0.4 | GO:0010710 | regulation of collagen catabolic process(GO:0010710) |
| 0.2 | 1.0 | GO:0070966 | nuclear-transcribed mRNA catabolic process, no-go decay(GO:0070966) |
| 0.2 | 0.6 | GO:0097401 | synaptic vesicle lumen acidification(GO:0097401) |
| 0.2 | 2.2 | GO:0097067 | cellular response to thyroid hormone stimulus(GO:0097067) |
| 0.2 | 0.8 | GO:1903279 | regulation of calcium:sodium antiporter activity(GO:1903279) |
| 0.2 | 1.2 | GO:0060523 | prostate epithelial cord elongation(GO:0060523) |
| 0.2 | 0.8 | GO:0015855 | nucleobase transport(GO:0015851) pyrimidine nucleobase transport(GO:0015855) |
| 0.2 | 0.7 | GO:0006297 | nucleotide-excision repair, DNA gap filling(GO:0006297) |
| 0.2 | 1.1 | GO:2001170 | negative regulation of ATP biosynthetic process(GO:2001170) |
| 0.2 | 1.5 | GO:0090074 | negative regulation of protein homodimerization activity(GO:0090074) |
| 0.2 | 0.5 | GO:0003032 | detection of oxygen(GO:0003032) |
| 0.2 | 0.5 | GO:0009087 | methionine catabolic process(GO:0009087) |
| 0.2 | 0.9 | GO:0060336 | negative regulation of response to interferon-gamma(GO:0060331) negative regulation of interferon-gamma-mediated signaling pathway(GO:0060336) |
| 0.2 | 3.6 | GO:0006027 | glycosaminoglycan catabolic process(GO:0006027) |
| 0.2 | 3.5 | GO:0061179 | negative regulation of insulin secretion involved in cellular response to glucose stimulus(GO:0061179) |
| 0.2 | 0.7 | GO:1904395 | positive regulation of skeletal muscle acetylcholine-gated channel clustering(GO:1904395) |
| 0.2 | 0.5 | GO:0060414 | aorta smooth muscle tissue morphogenesis(GO:0060414) |
| 0.2 | 1.4 | GO:1900747 | negative regulation of vascular endothelial growth factor signaling pathway(GO:1900747) |
| 0.2 | 0.7 | GO:1901301 | regulation of cargo loading into COPII-coated vesicle(GO:1901301) |
| 0.2 | 1.0 | GO:1903054 | negative regulation of extracellular matrix organization(GO:1903054) |
| 0.2 | 1.3 | GO:0071802 | negative regulation of podosome assembly(GO:0071802) |
| 0.2 | 2.9 | GO:0075522 | IRES-dependent viral translational initiation(GO:0075522) |
| 0.2 | 1.0 | GO:0003406 | retinal pigment epithelium development(GO:0003406) |
| 0.2 | 0.5 | GO:0034117 | erythrocyte aggregation(GO:0034117) regulation of erythrocyte aggregation(GO:0034118) |
| 0.2 | 0.8 | GO:0035723 | interleukin-15-mediated signaling pathway(GO:0035723) cellular response to interleukin-15(GO:0071350) |
| 0.2 | 1.3 | GO:0071557 | histone H3-K27 demethylation(GO:0071557) |
| 0.2 | 1.3 | GO:0042699 | follicle-stimulating hormone signaling pathway(GO:0042699) |
| 0.2 | 0.8 | GO:0046952 | ketone body catabolic process(GO:0046952) |
| 0.2 | 0.3 | GO:0051832 | evasion or tolerance of host defenses by virus(GO:0019049) avoidance of host defenses(GO:0044413) evasion or tolerance of host defenses(GO:0044415) avoidance of defenses of other organism involved in symbiotic interaction(GO:0051832) evasion or tolerance of defenses of other organism involved in symbiotic interaction(GO:0051834) |
| 0.2 | 1.7 | GO:2000766 | negative regulation of cytoplasmic translation(GO:2000766) |
| 0.2 | 0.6 | GO:1902164 | mRNA localization resulting in posttranscriptional regulation of gene expression(GO:0010609) positive regulation of DNA damage response, signal transduction by p53 class mediator resulting in transcription of p21 class mediator(GO:1902164) |
| 0.2 | 1.7 | GO:0060710 | chorio-allantoic fusion(GO:0060710) |
| 0.2 | 0.8 | GO:0048478 | replication fork protection(GO:0048478) |
| 0.2 | 0.5 | GO:1990751 | regulation of Schwann cell chemotaxis(GO:1904266) positive regulation of Schwann cell chemotaxis(GO:1904268) Schwann cell chemotaxis(GO:1990751) |
| 0.2 | 0.6 | GO:0006710 | androgen catabolic process(GO:0006710) |
| 0.2 | 0.6 | GO:2000297 | negative regulation of synapse maturation(GO:2000297) |
| 0.1 | 0.4 | GO:0035526 | retrograde transport, plasma membrane to Golgi(GO:0035526) |
| 0.1 | 0.9 | GO:1901314 | negative regulation of histone ubiquitination(GO:0033183) regulation of histone H2A K63-linked ubiquitination(GO:1901314) negative regulation of histone H2A K63-linked ubiquitination(GO:1901315) |
| 0.1 | 1.3 | GO:0034316 | negative regulation of Arp2/3 complex-mediated actin nucleation(GO:0034316) |
| 0.1 | 0.4 | GO:0071707 | immunoglobulin heavy chain V-D-J recombination(GO:0071707) |
| 0.1 | 0.4 | GO:0021693 | cerebellar Purkinje cell layer structural organization(GO:0021693) |
| 0.1 | 0.3 | GO:0019046 | release from viral latency(GO:0019046) |
| 0.1 | 0.4 | GO:1904632 | negative regulation of interleukin-12 biosynthetic process(GO:0045083) response to diterpene(GO:1904629) cellular response to diterpene(GO:1904630) response to glucoside(GO:1904631) cellular response to glucoside(GO:1904632) |
| 0.1 | 1.1 | GO:0033153 | somatic diversification of T cell receptor genes(GO:0002568) somatic recombination of T cell receptor gene segments(GO:0002681) T cell receptor V(D)J recombination(GO:0033153) |
| 0.1 | 2.3 | GO:0033572 | transferrin transport(GO:0033572) |
| 0.1 | 0.1 | GO:0007521 | muscle cell fate determination(GO:0007521) |
| 0.1 | 3.9 | GO:0030212 | hyaluronan metabolic process(GO:0030212) |
| 0.1 | 1.5 | GO:0003433 | chondrocyte development involved in endochondral bone morphogenesis(GO:0003433) |
| 0.1 | 1.1 | GO:0032020 | ISG15-protein conjugation(GO:0032020) |
| 0.1 | 1.1 | GO:0010886 | positive regulation of cholesterol storage(GO:0010886) |
| 0.1 | 4.1 | GO:0070208 | protein heterotrimerization(GO:0070208) |
| 0.1 | 1.2 | GO:2000234 | positive regulation of ribosome biogenesis(GO:0090070) positive regulation of rRNA processing(GO:2000234) |
| 0.1 | 0.6 | GO:0001802 | type III hypersensitivity(GO:0001802) regulation of type III hypersensitivity(GO:0001803) positive regulation of type III hypersensitivity(GO:0001805) |
| 0.1 | 0.6 | GO:0032918 | polyamine acetylation(GO:0032917) spermidine acetylation(GO:0032918) |
| 0.1 | 0.6 | GO:1903378 | positive regulation of oxidative stress-induced neuron intrinsic apoptotic signaling pathway(GO:1903378) |
| 0.1 | 3.0 | GO:0031115 | negative regulation of microtubule polymerization(GO:0031115) |
| 0.1 | 1.1 | GO:0032596 | protein transport into membrane raft(GO:0032596) |
| 0.1 | 0.4 | GO:0034442 | regulation of lipoprotein oxidation(GO:0034442) negative regulation of lipoprotein oxidation(GO:0034443) |
| 0.1 | 0.7 | GO:0034334 | adherens junction maintenance(GO:0034334) |
| 0.1 | 0.9 | GO:0035735 | intraciliary transport involved in cilium morphogenesis(GO:0035735) |
| 0.1 | 4.0 | GO:0006825 | copper ion transport(GO:0006825) |
| 0.1 | 1.2 | GO:2000467 | positive regulation of glycogen (starch) synthase activity(GO:2000467) |
| 0.1 | 0.7 | GO:0007217 | tachykinin receptor signaling pathway(GO:0007217) |
| 0.1 | 0.7 | GO:2001045 | negative regulation of integrin-mediated signaling pathway(GO:2001045) |
| 0.1 | 0.4 | GO:0015734 | beta-alanine transport(GO:0001762) taurine transport(GO:0015734) |
| 0.1 | 1.1 | GO:0071787 | endoplasmic reticulum tubular network assembly(GO:0071787) |
| 0.1 | 1.1 | GO:0006477 | protein sulfation(GO:0006477) |
| 0.1 | 1.5 | GO:0046485 | ether lipid metabolic process(GO:0046485) |
| 0.1 | 0.4 | GO:0060734 | regulation of endoplasmic reticulum stress-induced eIF2 alpha phosphorylation(GO:0060734) |
| 0.1 | 0.9 | GO:0061304 | retinal blood vessel morphogenesis(GO:0061304) |
| 0.1 | 0.9 | GO:0009405 | pathogenesis(GO:0009405) |
| 0.1 | 0.6 | GO:1905161 | protein localization to phagocytic vesicle(GO:1905161) regulation of protein localization to phagocytic vesicle(GO:1905169) positive regulation of protein localization to phagocytic vesicle(GO:1905171) |
| 0.1 | 0.7 | GO:0003065 | positive regulation of heart rate by epinephrine(GO:0003065) |
| 0.1 | 0.6 | GO:0044330 | canonical Wnt signaling pathway involved in positive regulation of wound healing(GO:0044330) |
| 0.1 | 0.7 | GO:0072592 | oxygen metabolic process(GO:0072592) |
| 0.1 | 0.6 | GO:0035519 | protein K29-linked ubiquitination(GO:0035519) |
| 0.1 | 0.3 | GO:0051030 | snRNA transport(GO:0051030) |
| 0.1 | 0.7 | GO:0045578 | negative regulation of B cell differentiation(GO:0045578) |
| 0.1 | 0.5 | GO:0023016 | signal transduction by trans-phosphorylation(GO:0023016) |
| 0.1 | 0.3 | GO:1901492 | positive regulation of lymphangiogenesis(GO:1901492) |
| 0.1 | 0.8 | GO:0030263 | apoptotic chromosome condensation(GO:0030263) |
| 0.1 | 1.1 | GO:1903690 | negative regulation of wound healing, spreading of epidermal cells(GO:1903690) |
| 0.1 | 0.5 | GO:0050902 | leukocyte adhesive activation(GO:0050902) |
| 0.1 | 0.6 | GO:1900748 | positive regulation of vascular endothelial growth factor signaling pathway(GO:1900748) |
| 0.1 | 0.9 | GO:1903142 | positive regulation of endothelial cell development(GO:1901552) positive regulation of establishment of endothelial barrier(GO:1903142) |
| 0.1 | 0.4 | GO:0016584 | nucleosome positioning(GO:0016584) |
| 0.1 | 0.3 | GO:0043323 | positive regulation of natural killer cell degranulation(GO:0043323) |
| 0.1 | 4.7 | GO:0046627 | negative regulation of insulin receptor signaling pathway(GO:0046627) |
| 0.1 | 0.7 | GO:1902748 | melanocyte migration(GO:0097324) positive regulation of lens fiber cell differentiation(GO:1902748) |
| 0.1 | 0.3 | GO:0060166 | olfactory pit development(GO:0060166) Harderian gland development(GO:0070384) |
| 0.1 | 0.4 | GO:0042539 | hypotonic salinity response(GO:0042539) cellular hypotonic salinity response(GO:0071477) |
| 0.1 | 1.4 | GO:0071481 | cellular response to X-ray(GO:0071481) |
| 0.1 | 0.3 | GO:0060854 | patterning of lymph vessels(GO:0060854) |
| 0.1 | 0.6 | GO:0071442 | N-terminal peptidyl-lysine acetylation(GO:0018076) positive regulation of histone H3-K14 acetylation(GO:0071442) |
| 0.1 | 0.2 | GO:0010481 | epidermal cell division(GO:0010481) regulation of epidermal cell division(GO:0010482) |
| 0.1 | 0.4 | GO:2001035 | tongue muscle cell differentiation(GO:0035981) positive regulation of skeletal muscle fiber differentiation(GO:1902811) regulation of tongue muscle cell differentiation(GO:2001035) positive regulation of tongue muscle cell differentiation(GO:2001037) |
| 0.1 | 0.6 | GO:0090168 | Golgi reassembly(GO:0090168) |
| 0.1 | 0.2 | GO:0035564 | regulation of kidney size(GO:0035564) |
| 0.1 | 0.3 | GO:0090076 | regulation of fast-twitch skeletal muscle fiber contraction(GO:0031446) positive regulation of fast-twitch skeletal muscle fiber contraction(GO:0031448) maintenance of mitochondrion location(GO:0051659) relaxation of skeletal muscle(GO:0090076) |
| 0.1 | 0.3 | GO:0006533 | fumarate metabolic process(GO:0006106) glycerol biosynthetic process(GO:0006114) aspartate catabolic process(GO:0006533) |
| 0.1 | 0.9 | GO:2000484 | positive regulation of interleukin-8 secretion(GO:2000484) |
| 0.1 | 0.7 | GO:1901164 | negative regulation of trophoblast cell migration(GO:1901164) |
| 0.1 | 0.6 | GO:0042256 | mature ribosome assembly(GO:0042256) |
| 0.1 | 0.8 | GO:0060665 | regulation of branching involved in salivary gland morphogenesis by mesenchymal-epithelial signaling(GO:0060665) |
| 0.1 | 0.5 | GO:0051684 | maintenance of Golgi location(GO:0051684) |
| 0.1 | 0.5 | GO:0034472 | snRNA 3'-end processing(GO:0034472) |
| 0.1 | 0.4 | GO:0060279 | positive regulation of ovulation(GO:0060279) |
| 0.1 | 0.5 | GO:0033030 | negative regulation of neutrophil apoptotic process(GO:0033030) |
| 0.1 | 0.5 | GO:2000402 | negative regulation of lymphocyte migration(GO:2000402) |
| 0.1 | 0.4 | GO:0018343 | protein farnesylation(GO:0018343) |
| 0.1 | 0.2 | GO:0002184 | cytoplasmic translational termination(GO:0002184) |
| 0.1 | 0.7 | GO:0060017 | parathyroid gland development(GO:0060017) |
| 0.1 | 1.4 | GO:0030388 | fructose 1,6-bisphosphate metabolic process(GO:0030388) |
| 0.1 | 0.3 | GO:0006226 | dUMP biosynthetic process(GO:0006226) |
| 0.1 | 0.3 | GO:0060744 | thelarche(GO:0042695) mammary gland branching involved in thelarche(GO:0060744) |
| 0.1 | 0.4 | GO:0072734 | response to staurosporine(GO:0072733) cellular response to staurosporine(GO:0072734) |
| 0.1 | 0.5 | GO:0098532 | histone H3-K27 trimethylation(GO:0098532) |
| 0.1 | 1.7 | GO:0006474 | N-terminal protein amino acid acetylation(GO:0006474) |
| 0.1 | 0.3 | GO:0021993 | initiation of neural tube closure(GO:0021993) |
| 0.1 | 0.4 | GO:0030202 | heparin metabolic process(GO:0030202) |
| 0.1 | 0.3 | GO:0006436 | tryptophanyl-tRNA aminoacylation(GO:0006436) |
| 0.1 | 0.4 | GO:0045629 | negative regulation of T-helper 2 cell differentiation(GO:0045629) |
| 0.1 | 0.3 | GO:0055071 | cellular manganese ion homeostasis(GO:0030026) Golgi calcium ion homeostasis(GO:0032468) manganese ion homeostasis(GO:0055071) |
| 0.1 | 0.4 | GO:0060686 | negative regulation of prostatic bud formation(GO:0060686) |
| 0.1 | 2.4 | GO:0035855 | megakaryocyte development(GO:0035855) |
| 0.1 | 0.3 | GO:0035963 | response to interleukin-13(GO:0035962) cellular response to interleukin-13(GO:0035963) |
| 0.1 | 0.3 | GO:0034552 | respiratory chain complex II assembly(GO:0034552) mitochondrial respiratory chain complex II assembly(GO:0034553) mitochondrial respiratory chain complex II biogenesis(GO:0097032) |
| 0.1 | 0.6 | GO:0000056 | ribosomal small subunit export from nucleus(GO:0000056) |
| 0.1 | 2.4 | GO:0097320 | membrane tubulation(GO:0097320) |
| 0.1 | 0.8 | GO:2000346 | negative regulation of hepatocyte proliferation(GO:2000346) |
| 0.1 | 0.5 | GO:0090038 | negative regulation of protein kinase C signaling(GO:0090038) |
| 0.1 | 0.9 | GO:0045876 | positive regulation of sister chromatid cohesion(GO:0045876) |
| 0.1 | 0.2 | GO:0014739 | positive regulation of muscle hyperplasia(GO:0014739) |
| 0.1 | 0.5 | GO:0021564 | vagus nerve development(GO:0021564) |
| 0.1 | 0.8 | GO:0019065 | receptor-mediated endocytosis of virus by host cell(GO:0019065) endocytosis involved in viral entry into host cell(GO:0075509) |
| 0.1 | 0.4 | GO:0071918 | urea transmembrane transport(GO:0071918) |
| 0.1 | 0.3 | GO:1904247 | positive regulation of polynucleotide adenylyltransferase activity(GO:1904247) |
| 0.1 | 0.4 | GO:1903756 | regulation of transcription from RNA polymerase II promoter by histone modification(GO:1903756) negative regulation of transcription from RNA polymerase II promoter by histone modification(GO:1903758) |
| 0.1 | 1.2 | GO:0030322 | stabilization of membrane potential(GO:0030322) |
| 0.1 | 0.5 | GO:0006621 | protein retention in ER lumen(GO:0006621) |
| 0.1 | 0.9 | GO:0043517 | positive regulation of DNA damage response, signal transduction by p53 class mediator(GO:0043517) |
| 0.1 | 0.8 | GO:0019368 | fatty acid elongation, saturated fatty acid(GO:0019367) fatty acid elongation, unsaturated fatty acid(GO:0019368) fatty acid elongation, monounsaturated fatty acid(GO:0034625) fatty acid elongation, polyunsaturated fatty acid(GO:0034626) |
| 0.1 | 0.3 | GO:0061181 | regulation of chondrocyte development(GO:0061181) |
| 0.1 | 1.9 | GO:0032060 | bleb assembly(GO:0032060) |
| 0.1 | 0.6 | GO:0045075 | interleukin-12 biosynthetic process(GO:0042090) regulation of interleukin-12 biosynthetic process(GO:0045075) |
| 0.1 | 0.6 | GO:0090037 | positive regulation of protein kinase C signaling(GO:0090037) |
| 0.1 | 0.3 | GO:0035617 | stress granule disassembly(GO:0035617) |
| 0.1 | 0.1 | GO:1901074 | regulation of engulfment of apoptotic cell(GO:1901074) |
| 0.1 | 0.7 | GO:0006335 | DNA replication-dependent nucleosome assembly(GO:0006335) DNA replication-dependent nucleosome organization(GO:0034723) |
| 0.1 | 0.4 | GO:2001184 | positive regulation of interleukin-12 secretion(GO:2001184) |
| 0.1 | 1.5 | GO:0035024 | negative regulation of Rho protein signal transduction(GO:0035024) |
| 0.1 | 0.7 | GO:0031666 | positive regulation of lipopolysaccharide-mediated signaling pathway(GO:0031666) |
| 0.1 | 0.4 | GO:0042373 | vitamin K metabolic process(GO:0042373) |
| 0.1 | 0.5 | GO:0070493 | thrombin receptor signaling pathway(GO:0070493) |
| 0.1 | 0.3 | GO:0006189 | 'de novo' IMP biosynthetic process(GO:0006189) |
| 0.1 | 0.4 | GO:0001880 | Mullerian duct regression(GO:0001880) |
| 0.1 | 0.3 | GO:0010796 | regulation of multivesicular body size(GO:0010796) |
| 0.1 | 0.5 | GO:1900118 | negative regulation of execution phase of apoptosis(GO:1900118) |
| 0.1 | 0.5 | GO:0097647 | calcitonin family receptor signaling pathway(GO:0097646) amylin receptor signaling pathway(GO:0097647) |
| 0.1 | 0.9 | GO:0060670 | branching involved in labyrinthine layer morphogenesis(GO:0060670) |
| 0.1 | 2.1 | GO:2000369 | regulation of clathrin-mediated endocytosis(GO:2000369) |
| 0.1 | 0.5 | GO:0010792 | DNA double-strand break processing involved in repair via single-strand annealing(GO:0010792) |
| 0.1 | 0.8 | GO:0070389 | chaperone cofactor-dependent protein refolding(GO:0070389) |
| 0.1 | 0.3 | GO:0060282 | positive regulation of chronic inflammatory response(GO:0002678) positive regulation of oocyte development(GO:0060282) |
| 0.1 | 1.0 | GO:1904776 | regulation of protein localization to cell cortex(GO:1904776) positive regulation of protein localization to cell cortex(GO:1904778) |
| 0.1 | 0.7 | GO:1904424 | regulation of GTP binding(GO:1904424) |
| 0.1 | 0.4 | GO:1900262 | regulation of DNA-directed DNA polymerase activity(GO:1900262) positive regulation of DNA-directed DNA polymerase activity(GO:1900264) |
| 0.1 | 0.3 | GO:0061073 | ciliary body morphogenesis(GO:0061073) |
| 0.1 | 0.7 | GO:0032096 | negative regulation of response to food(GO:0032096) |
| 0.1 | 0.3 | GO:1904706 | negative regulation of vascular smooth muscle cell proliferation(GO:1904706) |
| 0.1 | 0.8 | GO:0002176 | male germ cell proliferation(GO:0002176) |
| 0.1 | 1.6 | GO:0051764 | actin crosslink formation(GO:0051764) |
| 0.1 | 0.8 | GO:0006488 | dolichol-linked oligosaccharide biosynthetic process(GO:0006488) |
| 0.1 | 0.3 | GO:0038161 | prolactin signaling pathway(GO:0038161) |
| 0.1 | 0.2 | GO:0006780 | uroporphyrinogen III biosynthetic process(GO:0006780) |
| 0.1 | 0.4 | GO:2000271 | positive regulation of fibroblast apoptotic process(GO:2000271) |
| 0.1 | 0.5 | GO:0070474 | positive regulation of uterine smooth muscle contraction(GO:0070474) |
| 0.0 | 1.2 | GO:0005980 | glycogen catabolic process(GO:0005980) glucan catabolic process(GO:0009251) cellular polysaccharide catabolic process(GO:0044247) |
| 0.0 | 0.1 | GO:0000715 | nucleotide-excision repair, DNA damage recognition(GO:0000715) |
| 0.0 | 0.1 | GO:0072356 | chromosome passenger complex localization to kinetochore(GO:0072356) |
| 0.0 | 0.2 | GO:0061534 | gamma-aminobutyric acid secretion, neurotransmission(GO:0061534) |
| 0.0 | 0.5 | GO:0006370 | 7-methylguanosine mRNA capping(GO:0006370) |
| 0.0 | 0.4 | GO:0019375 | galactosylceramide biosynthetic process(GO:0006682) galactolipid biosynthetic process(GO:0019375) |
| 0.0 | 0.5 | GO:1900364 | negative regulation of mRNA polyadenylation(GO:1900364) |
| 0.0 | 0.2 | GO:0070309 | lens fiber cell morphogenesis(GO:0070309) |
| 0.0 | 0.6 | GO:0090110 | cargo loading into COPII-coated vesicle(GO:0090110) |
| 0.0 | 0.2 | GO:0072137 | condensed mesenchymal cell proliferation(GO:0072137) |
| 0.0 | 1.5 | GO:0010758 | regulation of macrophage chemotaxis(GO:0010758) |
| 0.0 | 0.2 | GO:0035694 | mitochondrial protein catabolic process(GO:0035694) |
| 0.0 | 1.5 | GO:0051443 | positive regulation of ubiquitin-protein transferase activity(GO:0051443) |
| 0.0 | 0.5 | GO:0006398 | mRNA 3'-end processing by stem-loop binding and cleavage(GO:0006398) |
| 0.0 | 0.2 | GO:0089700 | protein kinase D signaling(GO:0089700) |
| 0.0 | 0.8 | GO:0016075 | rRNA catabolic process(GO:0016075) |
| 0.0 | 0.3 | GO:0046985 | positive regulation of hemoglobin biosynthetic process(GO:0046985) |
| 0.0 | 0.4 | GO:1903003 | positive regulation of protein deubiquitination(GO:1903003) |
| 0.0 | 0.8 | GO:0030644 | cellular chloride ion homeostasis(GO:0030644) |
| 0.0 | 0.6 | GO:0035721 | intraciliary retrograde transport(GO:0035721) |
| 0.0 | 0.7 | GO:0031507 | heterochromatin assembly(GO:0031507) |
| 0.0 | 0.4 | GO:0045898 | regulation of RNA polymerase II transcriptional preinitiation complex assembly(GO:0045898) |
| 0.0 | 0.2 | GO:0010157 | response to chlorate(GO:0010157) |
| 0.0 | 0.5 | GO:0032331 | negative regulation of chondrocyte differentiation(GO:0032331) |
| 0.0 | 0.6 | GO:0090557 | establishment of endothelial intestinal barrier(GO:0090557) |
| 0.0 | 0.6 | GO:0030953 | astral microtubule organization(GO:0030953) |
| 0.0 | 0.7 | GO:0033234 | negative regulation of protein sumoylation(GO:0033234) |
| 0.0 | 1.1 | GO:0072673 | lamellipodium morphogenesis(GO:0072673) |
| 0.0 | 1.4 | GO:0071353 | cellular response to interleukin-4(GO:0071353) |
| 0.0 | 0.2 | GO:1900222 | negative regulation of beta-amyloid clearance(GO:1900222) |
| 0.0 | 0.8 | GO:0060218 | hematopoietic stem cell differentiation(GO:0060218) |
| 0.0 | 0.4 | GO:0036309 | protein localization to M-band(GO:0036309) protein localization to T-tubule(GO:0036371) |
| 0.0 | 1.0 | GO:0033539 | fatty acid beta-oxidation using acyl-CoA dehydrogenase(GO:0033539) |
| 0.0 | 0.6 | GO:1901223 | negative regulation of NIK/NF-kappaB signaling(GO:1901223) |
| 0.0 | 0.2 | GO:0051581 | negative regulation of neurotransmitter uptake(GO:0051581) negative regulation of serotonin uptake(GO:0051612) |
| 0.0 | 1.8 | GO:0090162 | establishment of epithelial cell polarity(GO:0090162) |
| 0.0 | 1.3 | GO:0008053 | mitochondrial fusion(GO:0008053) |
| 0.0 | 0.6 | GO:0032780 | negative regulation of ATPase activity(GO:0032780) |
| 0.0 | 0.4 | GO:0043353 | enucleate erythrocyte differentiation(GO:0043353) |
| 0.0 | 0.8 | GO:0010669 | epithelial structure maintenance(GO:0010669) |
| 0.0 | 0.9 | GO:0006353 | DNA-templated transcription, termination(GO:0006353) |
| 0.0 | 0.1 | GO:2000328 | regulation of T-helper 17 cell lineage commitment(GO:2000328) |
| 0.0 | 0.2 | GO:0048087 | positive regulation of developmental pigmentation(GO:0048087) regulation of pigment cell differentiation(GO:0050932) positive regulation of pigment cell differentiation(GO:0050942) |
| 0.0 | 1.5 | GO:0006767 | water-soluble vitamin metabolic process(GO:0006767) |
| 0.0 | 0.4 | GO:0007168 | receptor guanylyl cyclase signaling pathway(GO:0007168) |
| 0.0 | 0.2 | GO:0043497 | regulation of protein heterodimerization activity(GO:0043497) |
| 0.0 | 0.2 | GO:1903546 | protein localization to photoreceptor outer segment(GO:1903546) |
| 0.0 | 0.1 | GO:0072361 | regulation of glycolytic process by regulation of transcription from RNA polymerase II promoter(GO:0072361) |
| 0.0 | 0.8 | GO:0050860 | negative regulation of T cell receptor signaling pathway(GO:0050860) |
| 0.0 | 0.2 | GO:0002441 | histamine production involved in inflammatory response(GO:0002349) histamine secretion involved in inflammatory response(GO:0002441) histamine secretion by mast cell(GO:0002553) |
| 0.0 | 4.2 | GO:0010811 | positive regulation of cell-substrate adhesion(GO:0010811) |
| 0.0 | 0.5 | GO:1904263 | positive regulation of TORC1 signaling(GO:1904263) |
| 0.0 | 0.5 | GO:0097264 | self proteolysis(GO:0097264) |
| 0.0 | 0.2 | GO:0061086 | negative regulation of histone H3-K27 methylation(GO:0061086) |
| 0.0 | 0.3 | GO:0001887 | selenium compound metabolic process(GO:0001887) |
| 0.0 | 0.4 | GO:1901621 | negative regulation of smoothened signaling pathway involved in dorsal/ventral neural tube patterning(GO:1901621) |
| 0.0 | 0.5 | GO:0030150 | protein import into mitochondrial matrix(GO:0030150) |
| 0.0 | 0.3 | GO:0035331 | negative regulation of hippo signaling(GO:0035331) |
| 0.0 | 0.3 | GO:0002315 | marginal zone B cell differentiation(GO:0002315) |
| 0.0 | 0.2 | GO:0044154 | histone H3-K14 acetylation(GO:0044154) |
| 0.0 | 0.0 | GO:0042780 | tRNA 3'-end processing(GO:0042780) |
| 0.0 | 0.4 | GO:0044819 | mitotic G1 DNA damage checkpoint(GO:0031571) mitotic G1/S transition checkpoint(GO:0044819) |
| 0.0 | 0.3 | GO:0070940 | dephosphorylation of RNA polymerase II C-terminal domain(GO:0070940) |
| 0.0 | 0.4 | GO:0051016 | barbed-end actin filament capping(GO:0051016) |
| 0.0 | 0.1 | GO:1902953 | positive regulation of ER to Golgi vesicle-mediated transport(GO:1902953) |
| 0.0 | 0.1 | GO:0002759 | regulation of antimicrobial humoral response(GO:0002759) |
| 0.0 | 0.7 | GO:0015701 | bicarbonate transport(GO:0015701) |
| 0.0 | 0.2 | GO:0098734 | protein depalmitoylation(GO:0002084) macromolecule depalmitoylation(GO:0098734) |
| 0.0 | 0.5 | GO:0003094 | glomerular filtration(GO:0003094) renal filtration(GO:0097205) |
| 0.0 | 0.9 | GO:0002467 | germinal center formation(GO:0002467) |
| 0.0 | 1.1 | GO:0000154 | rRNA modification(GO:0000154) |
| 0.0 | 0.8 | GO:2000144 | positive regulation of DNA-templated transcription, initiation(GO:2000144) |
| 0.0 | 0.1 | GO:0015886 | heme transport(GO:0015886) |
| 0.0 | 0.5 | GO:0048387 | negative regulation of retinoic acid receptor signaling pathway(GO:0048387) |
| 0.0 | 0.2 | GO:1901750 | peptide modification(GO:0031179) leukotriene D4 metabolic process(GO:1901748) leukotriene D4 biosynthetic process(GO:1901750) |
| 0.0 | 2.2 | GO:0045576 | mast cell activation(GO:0045576) |
| 0.0 | 0.4 | GO:1904871 | protein localization to nuclear body(GO:1903405) protein localization to Cajal body(GO:1904867) regulation of protein localization to Cajal body(GO:1904869) positive regulation of protein localization to Cajal body(GO:1904871) protein localization to nucleoplasm(GO:1990173) |
| 0.0 | 0.3 | GO:0006620 | posttranslational protein targeting to membrane(GO:0006620) |
| 0.0 | 1.3 | GO:0006376 | mRNA splice site selection(GO:0006376) |
| 0.0 | 0.3 | GO:0060394 | negative regulation of pathway-restricted SMAD protein phosphorylation(GO:0060394) |
| 0.0 | 0.1 | GO:0051342 | regulation of cyclic-nucleotide phosphodiesterase activity(GO:0051342) |
| 0.0 | 0.2 | GO:0016255 | attachment of GPI anchor to protein(GO:0016255) |
| 0.0 | 3.6 | GO:0006910 | phagocytosis, recognition(GO:0006910) |
| 0.0 | 0.2 | GO:0032224 | positive regulation of synaptic transmission, cholinergic(GO:0032224) |
| 0.0 | 0.4 | GO:0051601 | exocyst localization(GO:0051601) |
| 0.0 | 0.4 | GO:2000194 | regulation of female gonad development(GO:2000194) |
| 0.0 | 0.5 | GO:0046069 | cGMP catabolic process(GO:0046069) |
| 0.0 | 0.2 | GO:0006868 | glutamine transport(GO:0006868) |
| 0.0 | 0.2 | GO:0060044 | negative regulation of cardiac muscle cell proliferation(GO:0060044) |
| 0.0 | 1.1 | GO:0031529 | ruffle organization(GO:0031529) |
| 0.0 | 0.1 | GO:0015788 | UDP-N-acetylglucosamine transport(GO:0015788) |
| 0.0 | 0.7 | GO:0046856 | phosphatidylinositol dephosphorylation(GO:0046856) |
| 0.0 | 0.2 | GO:2000741 | positive regulation of mesenchymal stem cell differentiation(GO:2000741) |
| 0.0 | 0.4 | GO:0010528 | regulation of transposition(GO:0010528) negative regulation of transposition(GO:0010529) |
| 0.0 | 0.1 | GO:0070171 | negative regulation of tooth mineralization(GO:0070171) |
| 0.0 | 0.2 | GO:0015712 | hexose phosphate transport(GO:0015712) glucose-6-phosphate transport(GO:0015760) |
| 0.0 | 0.8 | GO:0070296 | sarcoplasmic reticulum calcium ion transport(GO:0070296) |
| 0.0 | 0.2 | GO:0006983 | ER overload response(GO:0006983) |
| 0.0 | 1.4 | GO:0006367 | transcription initiation from RNA polymerase II promoter(GO:0006367) |
| 0.0 | 1.5 | GO:0030032 | lamellipodium assembly(GO:0030032) |
| 0.0 | 0.2 | GO:0000963 | mitochondrial RNA processing(GO:0000963) |
| 0.0 | 0.4 | GO:0006044 | N-acetylglucosamine metabolic process(GO:0006044) |
| 0.0 | 1.4 | GO:0006446 | regulation of translational initiation(GO:0006446) |
| 0.0 | 0.1 | GO:0051645 | Golgi localization(GO:0051645) spindle assembly involved in meiosis(GO:0090306) |
| 0.0 | 0.6 | GO:0045671 | negative regulation of osteoclast differentiation(GO:0045671) |
| 0.0 | 1.7 | GO:0006970 | response to osmotic stress(GO:0006970) |
| 0.0 | 0.4 | GO:0072395 | signal transduction involved in cell cycle checkpoint(GO:0072395) signal transduction involved in DNA integrity checkpoint(GO:0072401) signal transduction involved in DNA damage checkpoint(GO:0072422) |
| 0.0 | 0.2 | GO:0015961 | diadenosine polyphosphate catabolic process(GO:0015961) |
| 0.0 | 0.3 | GO:0006654 | phosphatidic acid biosynthetic process(GO:0006654) |
| 0.0 | 0.5 | GO:0040015 | negative regulation of multicellular organism growth(GO:0040015) |
| 0.0 | 0.1 | GO:0061734 | parkin-mediated mitophagy in response to mitochondrial depolarization(GO:0061734) |
| 0.0 | 0.6 | GO:0030199 | collagen fibril organization(GO:0030199) |
| 0.0 | 0.6 | GO:0000462 | maturation of SSU-rRNA from tricistronic rRNA transcript (SSU-rRNA, 5.8S rRNA, LSU-rRNA)(GO:0000462) |
| 0.0 | 0.6 | GO:0010800 | positive regulation of peptidyl-threonine phosphorylation(GO:0010800) |
| 0.0 | 0.9 | GO:0000381 | regulation of alternative mRNA splicing, via spliceosome(GO:0000381) |
| 0.0 | 0.4 | GO:0033235 | positive regulation of protein sumoylation(GO:0033235) |
| 0.0 | 0.7 | GO:0015804 | neutral amino acid transport(GO:0015804) |
| 0.0 | 0.4 | GO:0071218 | cellular response to misfolded protein(GO:0071218) |
| 0.0 | 0.3 | GO:0001522 | pseudouridine synthesis(GO:0001522) |
| 0.0 | 0.6 | GO:0007080 | mitotic metaphase plate congression(GO:0007080) |
| 0.0 | 0.2 | GO:0070828 | heterochromatin organization(GO:0070828) |
| 0.0 | 0.1 | GO:0043569 | negative regulation of insulin-like growth factor receptor signaling pathway(GO:0043569) |
| 0.0 | 0.1 | GO:0097368 | establishment of Sertoli cell barrier(GO:0097368) |
| 0.0 | 0.1 | GO:0090315 | negative regulation of protein targeting to membrane(GO:0090315) |
| 0.0 | 0.1 | GO:0007290 | spermatid nucleus elongation(GO:0007290) |
| 0.0 | 1.0 | GO:0018279 | protein N-linked glycosylation via asparagine(GO:0018279) |
| 0.0 | 0.9 | GO:0070301 | cellular response to hydrogen peroxide(GO:0070301) |
| 0.0 | 0.2 | GO:0043982 | histone H4-K5 acetylation(GO:0043981) histone H4-K8 acetylation(GO:0043982) |
| 0.0 | 0.3 | GO:0015809 | arginine transport(GO:0015809) |
| 0.0 | 0.2 | GO:0071732 | cellular response to nitric oxide(GO:0071732) |
| 0.0 | 0.2 | GO:0032264 | purine nucleotide salvage(GO:0032261) IMP salvage(GO:0032264) |
| 0.0 | 0.2 | GO:0021692 | cerebellar Purkinje cell layer morphogenesis(GO:0021692) |
| 0.0 | 0.1 | GO:1901581 | post-embryonic appendage morphogenesis(GO:0035120) post-embryonic limb morphogenesis(GO:0035127) post-embryonic forelimb morphogenesis(GO:0035128) telomeric repeat-containing RNA transcription(GO:0097393) telomeric repeat-containing RNA transcription from RNA pol II promoter(GO:0097394) regulation of telomeric RNA transcription from RNA pol II promoter(GO:1901580) negative regulation of telomeric RNA transcription from RNA pol II promoter(GO:1901581) positive regulation of telomeric RNA transcription from RNA pol II promoter(GO:1901582) |
| 0.0 | 0.4 | GO:0000460 | maturation of 5.8S rRNA(GO:0000460) |
| 0.0 | 0.5 | GO:0071108 | protein K48-linked deubiquitination(GO:0071108) |
| 0.0 | 0.1 | GO:0032876 | negative regulation of DNA endoreduplication(GO:0032876) |
| 0.0 | 0.2 | GO:0006613 | cotranslational protein targeting to membrane(GO:0006613) |
| 0.0 | 0.2 | GO:0090036 | regulation of protein kinase C signaling(GO:0090036) |
| 0.0 | 0.3 | GO:0045005 | DNA-dependent DNA replication maintenance of fidelity(GO:0045005) |
| 0.0 | 0.2 | GO:0000083 | regulation of transcription involved in G1/S transition of mitotic cell cycle(GO:0000083) |
| 0.0 | 0.4 | GO:0000184 | nuclear-transcribed mRNA catabolic process, nonsense-mediated decay(GO:0000184) |
| 0.0 | 0.2 | GO:0032515 | negative regulation of phosphoprotein phosphatase activity(GO:0032515) |
| 0.0 | 0.5 | GO:1903146 | regulation of mitophagy(GO:1903146) |
| 0.0 | 0.1 | GO:0030242 | pexophagy(GO:0030242) |
| 0.0 | 0.9 | GO:0043966 | histone H3 acetylation(GO:0043966) |
| 0.0 | 1.3 | GO:1903322 | positive regulation of protein modification by small protein conjugation or removal(GO:1903322) |
| 0.0 | 0.4 | GO:0006891 | intra-Golgi vesicle-mediated transport(GO:0006891) |
| 0.0 | 0.1 | GO:0021563 | glossopharyngeal nerve development(GO:0021563) |
| 0.0 | 1.3 | GO:0051028 | mRNA transport(GO:0051028) |
| 0.0 | 0.5 | GO:0006270 | DNA replication initiation(GO:0006270) |
| 0.0 | 0.4 | GO:0044342 | type B pancreatic cell proliferation(GO:0044342) |
| 0.0 | 0.1 | GO:0048859 | formation of anatomical boundary(GO:0048859) |
| 0.0 | 0.1 | GO:0060385 | axonogenesis involved in innervation(GO:0060385) |
| 0.0 | 0.1 | GO:0010586 | miRNA metabolic process(GO:0010586) |
| 0.0 | 0.1 | GO:1904219 | regulation of CDP-diacylglycerol-serine O-phosphatidyltransferase activity(GO:1904217) positive regulation of CDP-diacylglycerol-serine O-phosphatidyltransferase activity(GO:1904219) positive regulation of serine C-palmitoyltransferase activity(GO:1904222) |
| 0.0 | 0.1 | GO:0021894 | cerebral cortex GABAergic interneuron migration(GO:0021853) cerebral cortex GABAergic interneuron development(GO:0021894) interneuron migration(GO:1904936) |
| 0.0 | 1.3 | GO:0007030 | Golgi organization(GO:0007030) |
| 0.0 | 0.2 | GO:0043278 | response to isoquinoline alkaloid(GO:0014072) response to morphine(GO:0043278) |
| 0.0 | 0.1 | GO:0035814 | negative regulation of renal sodium excretion(GO:0035814) |
| 0.0 | 0.2 | GO:0006607 | NLS-bearing protein import into nucleus(GO:0006607) |
| 0.0 | 0.3 | GO:2000279 | negative regulation of DNA biosynthetic process(GO:2000279) |
| 0.0 | 0.4 | GO:0045026 | plasma membrane fusion(GO:0045026) |
| 0.0 | 0.3 | GO:0000413 | protein peptidyl-prolyl isomerization(GO:0000413) |
| 0.0 | 0.2 | GO:0010667 | negative regulation of cardiac muscle cell apoptotic process(GO:0010667) |
| 0.0 | 0.0 | GO:0046501 | protoporphyrinogen IX metabolic process(GO:0046501) |
| 0.0 | 0.1 | GO:0030916 | otic vesicle formation(GO:0030916) |
| 0.0 | 0.1 | GO:0051534 | negative regulation of NFAT protein import into nucleus(GO:0051534) |
| 0.0 | 0.1 | GO:2001199 | negative regulation of dendritic cell differentiation(GO:2001199) |
| 0.0 | 0.2 | GO:0002931 | response to ischemia(GO:0002931) |
| 0.0 | 0.3 | GO:0018345 | protein palmitoylation(GO:0018345) |
Gene overrepresentation in cellular component category:
| Log-likelihood per target | Total log-likelihood | Term | Description |
|---|---|---|---|
| 1.5 | 7.3 | GO:0071953 | elastic fiber(GO:0071953) |
| 1.1 | 3.2 | GO:0005588 | collagen type V trimer(GO:0005588) |
| 0.7 | 2.1 | GO:0036398 | TCR signalosome(GO:0036398) |
| 0.5 | 1.5 | GO:0061474 | phagolysosome membrane(GO:0061474) |
| 0.4 | 2.2 | GO:0044279 | other organism cell membrane(GO:0044218) other organism membrane(GO:0044279) |
| 0.4 | 1.1 | GO:0034359 | mature chylomicron(GO:0034359) |
| 0.4 | 1.1 | GO:1904511 | cortical microtubule plus-end(GO:1903754) cytoplasmic microtubule plus-end(GO:1904511) |
| 0.3 | 1.0 | GO:0005584 | collagen type I trimer(GO:0005584) |
| 0.3 | 1.9 | GO:0042585 | germinal vesicle(GO:0042585) |
| 0.3 | 0.9 | GO:0043614 | multi-eIF complex(GO:0043614) |
| 0.3 | 0.8 | GO:0005673 | transcription factor TFIIE complex(GO:0005673) |
| 0.3 | 2.4 | GO:0030485 | smooth muscle contractile fiber(GO:0030485) |
| 0.3 | 0.8 | GO:0034673 | inhibin-betaglycan-ActRII complex(GO:0034673) |
| 0.3 | 1.6 | GO:0097433 | dense body(GO:0097433) |
| 0.3 | 1.8 | GO:0097550 | transcriptional preinitiation complex(GO:0097550) |
| 0.2 | 1.7 | GO:0031095 | platelet dense tubular network membrane(GO:0031095) |
| 0.2 | 1.0 | GO:0045251 | mitochondrial electron transfer flavoprotein complex(GO:0017133) electron transfer flavoprotein complex(GO:0045251) |
| 0.2 | 0.4 | GO:0043512 | inhibin A complex(GO:0043512) |
| 0.2 | 0.6 | GO:0032998 | Fc receptor complex(GO:0032997) Fc-epsilon receptor I complex(GO:0032998) |
| 0.2 | 1.1 | GO:0045160 | myosin I complex(GO:0045160) |
| 0.2 | 2.1 | GO:0030478 | actin cap(GO:0030478) |
| 0.2 | 0.6 | GO:1990843 | subsarcolemmal mitochondrion(GO:1990843) interfibrillar mitochondrion(GO:1990844) |
| 0.2 | 1.0 | GO:0008622 | epsilon DNA polymerase complex(GO:0008622) |
| 0.2 | 1.5 | GO:0031232 | extrinsic component of external side of plasma membrane(GO:0031232) |
| 0.2 | 0.4 | GO:0034365 | discoidal high-density lipoprotein particle(GO:0034365) |
| 0.2 | 1.4 | GO:0097129 | cyclin D2-CDK4 complex(GO:0097129) |
| 0.2 | 2.3 | GO:1990712 | HFE-transferrin receptor complex(GO:1990712) |
| 0.2 | 0.7 | GO:0097447 | dendritic tree(GO:0097447) |
| 0.2 | 1.1 | GO:0005638 | lamin filament(GO:0005638) |
| 0.2 | 2.6 | GO:0098644 | complex of collagen trimers(GO:0098644) |
| 0.2 | 1.3 | GO:0005577 | fibrinogen complex(GO:0005577) |
| 0.2 | 0.6 | GO:1990452 | Parkin-FBXW7-Cul1 ubiquitin ligase complex(GO:1990452) |
| 0.2 | 1.1 | GO:0036194 | muscle cell projection(GO:0036194) muscle cell projection membrane(GO:0036195) |
| 0.2 | 0.5 | GO:0034680 | integrin alpha10-beta1 complex(GO:0034680) |
| 0.1 | 0.4 | GO:0071001 | U4/U6 snRNP(GO:0071001) |
| 0.1 | 0.3 | GO:0031673 | H zone(GO:0031673) |
| 0.1 | 4.3 | GO:0005614 | interstitial matrix(GO:0005614) |
| 0.1 | 1.2 | GO:0031428 | box C/D snoRNP complex(GO:0031428) |
| 0.1 | 1.5 | GO:0001739 | sex chromatin(GO:0001739) |
| 0.1 | 1.1 | GO:0045298 | tubulin complex(GO:0045298) |
| 0.1 | 1.2 | GO:0071141 | SMAD protein complex(GO:0071141) |
| 0.1 | 2.9 | GO:0008074 | guanylate cyclase complex, soluble(GO:0008074) |
| 0.1 | 0.8 | GO:0005850 | eukaryotic translation initiation factor 2 complex(GO:0005850) |
| 0.1 | 0.8 | GO:0031298 | replication fork protection complex(GO:0031298) |
| 0.1 | 0.6 | GO:0005899 | insulin receptor complex(GO:0005899) |
| 0.1 | 2.2 | GO:0031143 | pseudopodium(GO:0031143) |
| 0.1 | 1.1 | GO:0005677 | chromatin silencing complex(GO:0005677) |
| 0.1 | 1.5 | GO:0005862 | muscle thin filament tropomyosin(GO:0005862) |
| 0.1 | 0.8 | GO:0070775 | H3 histone acetyltransferase complex(GO:0070775) MOZ/MORF histone acetyltransferase complex(GO:0070776) |
| 0.1 | 0.8 | GO:0032585 | multivesicular body membrane(GO:0032585) |
| 0.1 | 0.9 | GO:0042382 | paraspeckles(GO:0042382) |
| 0.1 | 0.9 | GO:0045179 | apical cortex(GO:0045179) |
| 0.1 | 0.8 | GO:0061574 | ASAP complex(GO:0061574) |
| 0.1 | 0.6 | GO:0097513 | myosin II filament(GO:0097513) |
| 0.1 | 0.3 | GO:0005965 | protein farnesyltransferase complex(GO:0005965) |
| 0.1 | 0.2 | GO:0018444 | translation release factor complex(GO:0018444) |
| 0.1 | 1.4 | GO:0000974 | Prp19 complex(GO:0000974) |
| 0.1 | 0.7 | GO:0072357 | PTW/PP1 phosphatase complex(GO:0072357) |
| 0.1 | 0.3 | GO:0035101 | FACT complex(GO:0035101) |
| 0.1 | 1.2 | GO:0031209 | SCAR complex(GO:0031209) |
| 0.1 | 3.8 | GO:0002102 | podosome(GO:0002102) |
| 0.1 | 1.0 | GO:0016281 | eukaryotic translation initiation factor 4F complex(GO:0016281) |
| 0.1 | 0.5 | GO:1903440 | calcitonin family receptor complex(GO:1903439) amylin receptor complex(GO:1903440) |
| 0.1 | 0.4 | GO:0000308 | cytoplasmic cyclin-dependent protein kinase holoenzyme complex(GO:0000308) |
| 0.1 | 1.3 | GO:0030127 | COPII vesicle coat(GO:0030127) |
| 0.1 | 0.4 | GO:0005663 | DNA replication factor C complex(GO:0005663) |
| 0.1 | 1.8 | GO:0035686 | sperm fibrous sheath(GO:0035686) |
| 0.1 | 0.3 | GO:1990131 | Gtr1-Gtr2 GTPase complex(GO:1990131) |
| 0.1 | 0.8 | GO:0008024 | cyclin/CDK positive transcription elongation factor complex(GO:0008024) |
| 0.1 | 1.6 | GO:1990124 | messenger ribonucleoprotein complex(GO:1990124) |
| 0.1 | 0.2 | GO:0044753 | amphisome(GO:0044753) |
| 0.1 | 0.3 | GO:0097425 | smooth endoplasmic reticulum membrane(GO:0030868) smooth endoplasmic reticulum part(GO:0097425) |
| 0.1 | 1.2 | GO:0005847 | mRNA cleavage and polyadenylation specificity factor complex(GO:0005847) |
| 0.1 | 5.1 | GO:0005581 | collagen trimer(GO:0005581) |
| 0.1 | 1.0 | GO:0042582 | primary lysosome(GO:0005766) azurophil granule(GO:0042582) |
| 0.1 | 1.4 | GO:0005605 | basal lamina(GO:0005605) |
| 0.1 | 0.8 | GO:0034663 | endoplasmic reticulum chaperone complex(GO:0034663) |
| 0.1 | 0.9 | GO:0031258 | lamellipodium membrane(GO:0031258) |
| 0.1 | 1.3 | GO:0030014 | CCR4-NOT complex(GO:0030014) |
| 0.1 | 0.3 | GO:0070826 | paraferritin complex(GO:0070826) |
| 0.1 | 0.7 | GO:0031080 | nuclear pore outer ring(GO:0031080) |
| 0.1 | 0.3 | GO:0005945 | 6-phosphofructokinase complex(GO:0005945) |
| 0.0 | 3.5 | GO:0046658 | anchored component of plasma membrane(GO:0046658) |
| 0.0 | 0.6 | GO:0030688 | preribosome, small subunit precursor(GO:0030688) |
| 0.0 | 0.1 | GO:0000110 | nucleotide-excision repair factor 1 complex(GO:0000110) |
| 0.0 | 0.9 | GO:0031618 | nuclear pericentric heterochromatin(GO:0031618) |
| 0.0 | 0.6 | GO:0033256 | I-kappaB/NF-kappaB complex(GO:0033256) |
| 0.0 | 0.7 | GO:0005915 | zonula adherens(GO:0005915) |
| 0.0 | 0.5 | GO:0031254 | uropod(GO:0001931) cell trailing edge(GO:0031254) |
| 0.0 | 0.6 | GO:0005642 | annulate lamellae(GO:0005642) |
| 0.0 | 1.2 | GO:0035098 | ESC/E(Z) complex(GO:0035098) |
| 0.0 | 0.9 | GO:0005671 | Ada2/Gcn5/Ada3 transcription activator complex(GO:0005671) |
| 0.0 | 2.5 | GO:0008180 | COP9 signalosome(GO:0008180) |
| 0.0 | 0.5 | GO:0031415 | NatA complex(GO:0031415) |
| 0.0 | 0.6 | GO:0042581 | specific granule(GO:0042581) |
| 0.0 | 0.6 | GO:0071439 | clathrin complex(GO:0071439) |
| 0.0 | 6.4 | GO:0005901 | caveola(GO:0005901) |
| 0.0 | 0.3 | GO:0005828 | kinetochore microtubule(GO:0005828) |
| 0.0 | 0.5 | GO:0042555 | MCM complex(GO:0042555) |
| 0.0 | 1.0 | GO:0031616 | spindle pole centrosome(GO:0031616) |
| 0.0 | 0.6 | GO:0005852 | eukaryotic translation initiation factor 3 complex(GO:0005852) |
| 0.0 | 0.4 | GO:0000176 | nuclear exosome (RNase complex)(GO:0000176) |
| 0.0 | 0.4 | GO:0060091 | kinocilium(GO:0060091) |
| 0.0 | 1.1 | GO:0071782 | endoplasmic reticulum tubular network(GO:0071782) |
| 0.0 | 0.8 | GO:0097449 | astrocyte projection(GO:0097449) |
| 0.0 | 0.3 | GO:0000408 | EKC/KEOPS complex(GO:0000408) |
| 0.0 | 6.0 | GO:0090575 | RNA polymerase II transcription factor complex(GO:0090575) |
| 0.0 | 0.9 | GO:0005782 | peroxisomal matrix(GO:0005782) microbody lumen(GO:0031907) |
| 0.0 | 1.6 | GO:0097610 | cleavage furrow(GO:0032154) cell surface furrow(GO:0097610) |
| 0.0 | 0.5 | GO:0000506 | glycosylphosphatidylinositol-N-acetylglucosaminyltransferase (GPI-GnT) complex(GO:0000506) |
| 0.0 | 0.6 | GO:0032045 | guanyl-nucleotide exchange factor complex(GO:0032045) |
| 0.0 | 0.4 | GO:0008290 | F-actin capping protein complex(GO:0008290) |
| 0.0 | 0.9 | GO:0005719 | nuclear euchromatin(GO:0005719) |
| 0.0 | 3.3 | GO:0005882 | intermediate filament(GO:0005882) |
| 0.0 | 0.1 | GO:0030670 | phagocytic vesicle membrane(GO:0030670) |
| 0.0 | 0.7 | GO:0030134 | ER to Golgi transport vesicle(GO:0030134) |
| 0.0 | 0.7 | GO:0005859 | muscle myosin complex(GO:0005859) |
| 0.0 | 1.2 | GO:0035869 | ciliary transition zone(GO:0035869) |
| 0.0 | 0.3 | GO:0033180 | proton-transporting V-type ATPase, V1 domain(GO:0033180) |
| 0.0 | 0.2 | GO:0042765 | GPI-anchor transamidase complex(GO:0042765) |
| 0.0 | 0.7 | GO:0055038 | recycling endosome membrane(GO:0055038) |
| 0.0 | 0.4 | GO:0005952 | cAMP-dependent protein kinase complex(GO:0005952) |
| 0.0 | 1.1 | GO:0000307 | cyclin-dependent protein kinase holoenzyme complex(GO:0000307) |
| 0.0 | 0.4 | GO:0017119 | Golgi transport complex(GO:0017119) |
| 0.0 | 1.8 | GO:0005834 | heterotrimeric G-protein complex(GO:0005834) |
| 0.0 | 0.4 | GO:0035145 | exon-exon junction complex(GO:0035145) |
| 0.0 | 0.2 | GO:0034388 | Pwp2p-containing subcomplex of 90S preribosome(GO:0034388) |
| 0.0 | 0.5 | GO:0071004 | U2-type prespliceosome(GO:0071004) |
| 0.0 | 0.2 | GO:0097504 | Gemini of coiled bodies(GO:0097504) |
| 0.0 | 0.7 | GO:0097228 | sperm principal piece(GO:0097228) |
| 0.0 | 0.1 | GO:0034272 | phosphatidylinositol 3-kinase complex, class III, type I(GO:0034271) phosphatidylinositol 3-kinase complex, class III, type II(GO:0034272) |
| 0.0 | 0.4 | GO:0005832 | chaperonin-containing T-complex(GO:0005832) |
| 0.0 | 0.5 | GO:0005666 | DNA-directed RNA polymerase III complex(GO:0005666) |
| 0.0 | 0.3 | GO:0034709 | methylosome(GO:0034709) |
| 0.0 | 0.3 | GO:0031932 | TORC2 complex(GO:0031932) |
| 0.0 | 0.2 | GO:0090533 | cation-transporting ATPase complex(GO:0090533) |
| 0.0 | 0.4 | GO:0031588 | nucleotide-activated protein kinase complex(GO:0031588) |
| 0.0 | 0.7 | GO:0043034 | costamere(GO:0043034) |
| 0.0 | 1.4 | GO:0010494 | cytoplasmic stress granule(GO:0010494) |
| 0.0 | 0.4 | GO:0032039 | integrator complex(GO:0032039) |
| 0.0 | 0.6 | GO:0031307 | integral component of mitochondrial outer membrane(GO:0031307) |
| 0.0 | 2.0 | GO:0032432 | actin filament bundle(GO:0032432) |
| 0.0 | 0.4 | GO:0000145 | exocyst(GO:0000145) |
| 0.0 | 0.3 | GO:0042405 | nuclear inclusion body(GO:0042405) |
| 0.0 | 1.9 | GO:0016363 | nuclear matrix(GO:0016363) |
| 0.0 | 0.8 | GO:0016235 | aggresome(GO:0016235) |
| 0.0 | 0.3 | GO:0070822 | Sin3-type complex(GO:0070822) |
| 0.0 | 0.1 | GO:0032593 | insulin-responsive compartment(GO:0032593) |
| 0.0 | 1.4 | GO:0031463 | Cul3-RING ubiquitin ligase complex(GO:0031463) |
| 0.0 | 1.1 | GO:0016328 | lateral plasma membrane(GO:0016328) |
| 0.0 | 2.4 | GO:0005681 | spliceosomal complex(GO:0005681) |
| 0.0 | 0.9 | GO:0022627 | cytosolic small ribosomal subunit(GO:0022627) |
| 0.0 | 1.8 | GO:0042571 | immunoglobulin complex, circulating(GO:0042571) |
| 0.0 | 5.2 | GO:0016607 | nuclear speck(GO:0016607) |
| 0.0 | 0.5 | GO:0031941 | filamentous actin(GO:0031941) |
| 0.0 | 0.4 | GO:0016327 | apicolateral plasma membrane(GO:0016327) |
| 0.0 | 0.4 | GO:0043218 | compact myelin(GO:0043218) |
| 0.0 | 2.2 | GO:0001726 | ruffle(GO:0001726) |
| 0.0 | 0.1 | GO:0005786 | signal recognition particle, endoplasmic reticulum targeting(GO:0005786) |
| 0.0 | 0.3 | GO:0005790 | smooth endoplasmic reticulum(GO:0005790) |
| 0.0 | 0.5 | GO:0001772 | immunological synapse(GO:0001772) |
| 0.0 | 4.3 | GO:0005925 | focal adhesion(GO:0005925) |
| 0.0 | 0.3 | GO:0005680 | anaphase-promoting complex(GO:0005680) |
| 0.0 | 0.0 | GO:0034457 | Mpp10 complex(GO:0034457) |
| 0.0 | 2.2 | GO:0005802 | trans-Golgi network(GO:0005802) |
| 0.0 | 0.1 | GO:0070578 | RISC complex(GO:0016442) RNAi effector complex(GO:0031332) RISC-loading complex(GO:0070578) |
| 0.0 | 1.8 | GO:0010008 | endosome membrane(GO:0010008) |
| 0.0 | 0.2 | GO:0044665 | MLL1/2 complex(GO:0044665) MLL1 complex(GO:0071339) |
| 0.0 | 0.1 | GO:0032009 | early phagosome(GO:0032009) |
| 0.0 | 0.1 | GO:0019773 | proteasome core complex, alpha-subunit complex(GO:0019773) |
| 0.0 | 0.8 | GO:0044439 | peroxisomal membrane(GO:0005778) microbody membrane(GO:0031903) microbody part(GO:0044438) peroxisomal part(GO:0044439) |
| 0.0 | 0.5 | GO:0016459 | myosin complex(GO:0016459) |
| 0.0 | 0.2 | GO:0031083 | BLOC-1 complex(GO:0031083) |
| 0.0 | 0.1 | GO:0031983 | vesicle lumen(GO:0031983) |
Gene overrepresentation in molecular function category:
| Log-likelihood per target | Total log-likelihood | Term | Description |
|---|---|---|---|
| 2.0 | 6.0 | GO:0031726 | CCR1 chemokine receptor binding(GO:0031726) |
| 0.6 | 3.5 | GO:0017077 | oxidative phosphorylation uncoupler activity(GO:0017077) |
| 0.5 | 1.5 | GO:0050479 | glyceryl-ether monooxygenase activity(GO:0050479) |
| 0.5 | 3.3 | GO:0019808 | polyamine binding(GO:0019808) |
| 0.5 | 2.3 | GO:0004998 | transferrin receptor activity(GO:0004998) |
| 0.4 | 2.7 | GO:0030294 | receptor signaling protein tyrosine kinase inhibitor activity(GO:0030294) |
| 0.4 | 1.3 | GO:0031896 | V2 vasopressin receptor binding(GO:0031896) |
| 0.4 | 0.9 | GO:0019960 | C-X3-C chemokine binding(GO:0019960) |
| 0.4 | 1.2 | GO:0031798 | type 1 metabotropic glutamate receptor binding(GO:0031798) RNA polymerase II transcription factor activity, estrogen-activated sequence-specific DNA binding(GO:0038052) |
| 0.4 | 2.3 | GO:0008269 | JAK pathway signal transduction adaptor activity(GO:0008269) |
| 0.4 | 1.5 | GO:0004740 | pyruvate dehydrogenase (acetyl-transferring) kinase activity(GO:0004740) |
| 0.4 | 1.5 | GO:0045159 | myosin II binding(GO:0045159) |
| 0.4 | 1.1 | GO:0004373 | glycogen (starch) synthase activity(GO:0004373) |
| 0.3 | 1.5 | GO:0070892 | lipoteichoic acid receptor activity(GO:0070892) |
| 0.3 | 0.9 | GO:0005157 | macrophage colony-stimulating factor receptor binding(GO:0005157) |
| 0.3 | 0.9 | GO:0035500 | MH2 domain binding(GO:0035500) |
| 0.3 | 2.2 | GO:0043423 | 3-phosphoinositide-dependent protein kinase binding(GO:0043423) |
| 0.3 | 2.9 | GO:0004322 | ferroxidase activity(GO:0004322) oxidoreductase activity, oxidizing metal ions, oxygen as acceptor(GO:0016724) |
| 0.3 | 1.8 | GO:0015265 | urea channel activity(GO:0015265) |
| 0.3 | 1.5 | GO:0008453 | alanine-glyoxylate transaminase activity(GO:0008453) |
| 0.2 | 1.7 | GO:0008294 | calcium- and calmodulin-responsive adenylate cyclase activity(GO:0008294) |
| 0.2 | 1.0 | GO:0032422 | purine-rich negative regulatory element binding(GO:0032422) |
| 0.2 | 4.0 | GO:0048407 | platelet-derived growth factor binding(GO:0048407) |
| 0.2 | 0.7 | GO:0038085 | vascular endothelial growth factor binding(GO:0038085) |
| 0.2 | 0.6 | GO:0008476 | protein-tyrosine sulfotransferase activity(GO:0008476) |
| 0.2 | 0.6 | GO:0005021 | vascular endothelial growth factor-activated receptor activity(GO:0005021) |
| 0.2 | 2.9 | GO:1990829 | C-rich single-stranded DNA binding(GO:1990829) |
| 0.2 | 0.6 | GO:0098640 | integrin binding involved in cell-matrix adhesion(GO:0098640) |
| 0.2 | 4.9 | GO:0055103 | ligase regulator activity(GO:0055103) |
| 0.2 | 0.8 | GO:0008260 | 3-oxoacid CoA-transferase activity(GO:0008260) |
| 0.2 | 1.0 | GO:0004563 | beta-N-acetylhexosaminidase activity(GO:0004563) |
| 0.2 | 1.0 | GO:0004174 | electron-transferring-flavoprotein dehydrogenase activity(GO:0004174) oxidoreductase activity, acting on the CH-NH group of donors, quinone or similar compound as acceptor(GO:0016649) |
| 0.2 | 2.0 | GO:0004459 | L-lactate dehydrogenase activity(GO:0004459) |
| 0.2 | 1.1 | GO:0042296 | ISG15 transferase activity(GO:0042296) |
| 0.2 | 1.3 | GO:0071558 | histone demethylase activity (H3-K27 specific)(GO:0071558) |
| 0.2 | 1.1 | GO:0008467 | [heparan sulfate]-glucosamine 3-sulfotransferase 1 activity(GO:0008467) |
| 0.2 | 2.3 | GO:0004887 | thyroid hormone receptor activity(GO:0004887) |
| 0.2 | 0.7 | GO:0008184 | glycogen phosphorylase activity(GO:0008184) |
| 0.2 | 6.7 | GO:0001968 | fibronectin binding(GO:0001968) |
| 0.2 | 0.7 | GO:0042392 | sphingosine-1-phosphate phosphatase activity(GO:0042392) |
| 0.2 | 1.5 | GO:0008131 | primary amine oxidase activity(GO:0008131) |
| 0.2 | 0.5 | GO:0008192 | RNA guanylyltransferase activity(GO:0008192) |
| 0.2 | 4.0 | GO:0005537 | mannose binding(GO:0005537) |
| 0.2 | 2.1 | GO:0050692 | DBD domain binding(GO:0050692) |
| 0.2 | 0.8 | GO:0004974 | leukotriene receptor activity(GO:0004974) |
| 0.2 | 0.6 | GO:0072320 | volume-sensitive chloride channel activity(GO:0072320) |
| 0.1 | 2.2 | GO:0031852 | mu-type opioid receptor binding(GO:0031852) |
| 0.1 | 1.3 | GO:0070891 | lipoteichoic acid binding(GO:0070891) |
| 0.1 | 0.7 | GO:0071987 | WD40-repeat domain binding(GO:0071987) |
| 0.1 | 1.0 | GO:0052798 | beta-galactoside alpha-2,3-sialyltransferase activity(GO:0052798) |
| 0.1 | 0.7 | GO:0047696 | beta-adrenergic receptor kinase activity(GO:0047696) |
| 0.1 | 1.5 | GO:0033691 | sialic acid binding(GO:0033691) |
| 0.1 | 1.2 | GO:1990189 | peptide-serine-N-acetyltransferase activity(GO:1990189) |
| 0.1 | 1.4 | GO:0005114 | type II transforming growth factor beta receptor binding(GO:0005114) |
| 0.1 | 0.5 | GO:0004478 | methionine adenosyltransferase activity(GO:0004478) |
| 0.1 | 0.8 | GO:0008321 | Ral guanyl-nucleotide exchange factor activity(GO:0008321) |
| 0.1 | 1.3 | GO:0045340 | mercury ion binding(GO:0045340) |
| 0.1 | 1.8 | GO:0071933 | Arp2/3 complex binding(GO:0071933) |
| 0.1 | 0.6 | GO:0019767 | IgE receptor activity(GO:0019767) |
| 0.1 | 0.5 | GO:0023029 | MHC class Ib protein binding(GO:0023029) |
| 0.1 | 2.3 | GO:1990226 | histone methyltransferase binding(GO:1990226) |
| 0.1 | 2.9 | GO:0005540 | hyaluronic acid binding(GO:0005540) |
| 0.1 | 1.1 | GO:0043262 | adenosine-diphosphatase activity(GO:0043262) |
| 0.1 | 0.4 | GO:0004342 | glucosamine-6-phosphate deaminase activity(GO:0004342) |
| 0.1 | 0.5 | GO:0048030 | disaccharide binding(GO:0048030) |
| 0.1 | 0.4 | GO:0001761 | beta-alanine transmembrane transporter activity(GO:0001761) taurine transmembrane transporter activity(GO:0005368) taurine:sodium symporter activity(GO:0005369) |
| 0.1 | 1.1 | GO:0035033 | histone deacetylase regulator activity(GO:0035033) |
| 0.1 | 2.1 | GO:0048273 | mitogen-activated protein kinase p38 binding(GO:0048273) |
| 0.1 | 2.3 | GO:0015643 | toxic substance binding(GO:0015643) |
| 0.1 | 2.0 | GO:0000900 | translation repressor activity, nucleic acid binding(GO:0000900) |
| 0.1 | 2.1 | GO:0042288 | MHC class I protein binding(GO:0042288) |
| 0.1 | 2.2 | GO:0001530 | lipopolysaccharide binding(GO:0001530) |
| 0.1 | 0.4 | GO:0047275 | glucosaminylgalactosylglucosylceramide beta-galactosyltransferase activity(GO:0047275) |
| 0.1 | 2.1 | GO:0001608 | G-protein coupled nucleotide receptor activity(GO:0001608) G-protein coupled purinergic nucleotide receptor activity(GO:0045028) |
| 0.1 | 3.3 | GO:0004181 | metallocarboxypeptidase activity(GO:0004181) |
| 0.1 | 0.9 | GO:0005324 | long-chain fatty acid transporter activity(GO:0005324) |
| 0.1 | 1.2 | GO:0005068 | transmembrane receptor protein tyrosine kinase adaptor activity(GO:0005068) |
| 0.1 | 0.5 | GO:0042610 | CD8 receptor binding(GO:0042610) |
| 0.1 | 2.5 | GO:0017160 | Ral GTPase binding(GO:0017160) |
| 0.1 | 1.0 | GO:0046976 | histone methyltransferase activity (H3-K27 specific)(GO:0046976) |
| 0.1 | 0.4 | GO:0035827 | rubidium ion transmembrane transporter activity(GO:0035827) |
| 0.1 | 1.0 | GO:0008310 | single-stranded DNA 3'-5' exodeoxyribonuclease activity(GO:0008310) |
| 0.1 | 1.2 | GO:0035473 | lipase binding(GO:0035473) |
| 0.1 | 0.3 | GO:0080130 | L-phenylalanine:2-oxoglutarate aminotransferase activity(GO:0080130) |
| 0.1 | 1.8 | GO:0004707 | MAP kinase activity(GO:0004707) |
| 0.1 | 0.5 | GO:0008240 | tripeptidyl-peptidase activity(GO:0008240) |
| 0.1 | 0.4 | GO:0030621 | U4 snRNA binding(GO:0030621) |
| 0.1 | 0.4 | GO:0004694 | eukaryotic translation initiation factor 2alpha kinase activity(GO:0004694) |
| 0.1 | 1.1 | GO:0001069 | regulatory region RNA binding(GO:0001069) |
| 0.1 | 1.9 | GO:0008510 | sodium:bicarbonate symporter activity(GO:0008510) |
| 0.1 | 0.4 | GO:0034211 | GTP-dependent protein kinase activity(GO:0034211) |
| 0.1 | 0.3 | GO:0004660 | protein farnesyltransferase activity(GO:0004660) |
| 0.1 | 0.8 | GO:0045504 | dynein heavy chain binding(GO:0045504) |
| 0.1 | 0.3 | GO:0016314 | phosphatidylinositol-3,4,5-trisphosphate 3-phosphatase activity(GO:0016314) |
| 0.1 | 0.7 | GO:0001515 | opioid peptide activity(GO:0001515) |
| 0.1 | 0.6 | GO:0061629 | RNA polymerase II sequence-specific DNA binding transcription factor binding(GO:0061629) |
| 0.1 | 0.6 | GO:0004957 | prostaglandin E receptor activity(GO:0004957) |
| 0.1 | 1.5 | GO:0031681 | G-protein beta-subunit binding(GO:0031681) |
| 0.1 | 0.7 | GO:0005094 | Rho GDP-dissociation inhibitor activity(GO:0005094) |
| 0.1 | 1.2 | GO:0030274 | LIM domain binding(GO:0030274) |
| 0.1 | 0.5 | GO:0008607 | phosphorylase kinase regulator activity(GO:0008607) |
| 0.1 | 0.7 | GO:0017166 | vinculin binding(GO:0017166) |
| 0.1 | 0.6 | GO:0033592 | RNA strand annealing activity(GO:0033592) |
| 0.1 | 0.3 | GO:0019862 | IgA binding(GO:0019862) |
| 0.1 | 0.5 | GO:0046920 | alpha-(1->3)-fucosyltransferase activity(GO:0046920) |
| 0.1 | 0.6 | GO:0005095 | GTPase inhibitor activity(GO:0005095) |
| 0.1 | 2.4 | GO:0043274 | phospholipase binding(GO:0043274) |
| 0.1 | 0.3 | GO:0004830 | tryptophan-tRNA ligase activity(GO:0004830) |
| 0.1 | 0.3 | GO:0015410 | manganese-transporting ATPase activity(GO:0015410) |
| 0.1 | 2.0 | GO:0042975 | peroxisome proliferator activated receptor binding(GO:0042975) |
| 0.1 | 0.5 | GO:0097643 | amylin receptor activity(GO:0097643) |
| 0.1 | 0.2 | GO:0016434 | rRNA (cytosine) methyltransferase activity(GO:0016434) |
| 0.1 | 0.7 | GO:0016428 | tRNA (cytosine-5-)-methyltransferase activity(GO:0016428) |
| 0.1 | 0.4 | GO:0047844 | deoxycytidine deaminase activity(GO:0047844) |
| 0.1 | 0.5 | GO:0001849 | complement component C1q binding(GO:0001849) |
| 0.1 | 0.6 | GO:0017040 | ceramidase activity(GO:0017040) |
| 0.1 | 1.0 | GO:0042731 | PH domain binding(GO:0042731) |
| 0.1 | 1.0 | GO:0003708 | retinoic acid receptor activity(GO:0003708) |
| 0.1 | 1.3 | GO:0035612 | AP-2 adaptor complex binding(GO:0035612) |
| 0.1 | 4.0 | GO:0001786 | phosphatidylserine binding(GO:0001786) |
| 0.1 | 0.5 | GO:0070061 | fructose binding(GO:0070061) |
| 0.1 | 0.9 | GO:0001055 | RNA polymerase II activity(GO:0001055) |
| 0.1 | 3.7 | GO:0005070 | SH3/SH2 adaptor activity(GO:0005070) |
| 0.1 | 0.2 | GO:0017099 | very-long-chain-acyl-CoA dehydrogenase activity(GO:0017099) |
| 0.1 | 0.8 | GO:0009922 | fatty acid elongase activity(GO:0009922) 3-oxo-arachidoyl-CoA synthase activity(GO:0102336) 3-oxo-cerotoyl-CoA synthase activity(GO:0102337) 3-oxo-lignoceronyl-CoA synthase activity(GO:0102338) |
| 0.1 | 1.2 | GO:0008484 | sulfuric ester hydrolase activity(GO:0008484) |
| 0.1 | 1.0 | GO:0030235 | nitric-oxide synthase regulator activity(GO:0030235) |
| 0.1 | 0.6 | GO:0004468 | lysine N-acetyltransferase activity, acting on acetyl phosphate as donor(GO:0004468) |
| 0.1 | 0.6 | GO:0050786 | RAGE receptor binding(GO:0050786) |
| 0.1 | 1.2 | GO:0022841 | potassium ion leak channel activity(GO:0022841) |
| 0.1 | 0.3 | GO:0030618 | transforming growth factor beta receptor, pathway-specific cytoplasmic mediator activity(GO:0030618) |
| 0.1 | 0.4 | GO:0004920 | interleukin-10 receptor activity(GO:0004920) |
| 0.1 | 0.3 | GO:0004925 | prolactin receptor activity(GO:0004925) |
| 0.1 | 0.4 | GO:0016941 | natriuretic peptide receptor activity(GO:0016941) |
| 0.1 | 0.7 | GO:0004499 | N,N-dimethylaniline monooxygenase activity(GO:0004499) |
| 0.1 | 0.4 | GO:0004090 | carbonyl reductase (NADPH) activity(GO:0004090) |
| 0.1 | 0.2 | GO:0004105 | choline-phosphate cytidylyltransferase activity(GO:0004105) |
| 0.1 | 0.2 | GO:0004176 | ATP-dependent peptidase activity(GO:0004176) |
| 0.1 | 1.2 | GO:0030296 | protein tyrosine kinase activator activity(GO:0030296) |
| 0.1 | 0.6 | GO:0017034 | Rap guanyl-nucleotide exchange factor activity(GO:0017034) |
| 0.1 | 2.1 | GO:0017134 | fibroblast growth factor binding(GO:0017134) |
| 0.1 | 0.5 | GO:0008440 | inositol-1,4,5-trisphosphate 3-kinase activity(GO:0008440) |
| 0.1 | 1.6 | GO:0017075 | syntaxin-1 binding(GO:0017075) |
| 0.1 | 0.3 | GO:0004719 | protein-L-isoaspartate (D-aspartate) O-methyltransferase activity(GO:0004719) |
| 0.1 | 1.2 | GO:0048027 | mRNA 5'-UTR binding(GO:0048027) |
| 0.1 | 0.2 | GO:0004346 | glucose-6-phosphatase activity(GO:0004346) sugar-terminal-phosphatase activity(GO:0050309) |
| 0.1 | 0.3 | GO:0015094 | cadmium ion transmembrane transporter activity(GO:0015086) lead ion transmembrane transporter activity(GO:0015094) vanadium ion transmembrane transporter activity(GO:0015100) ferrous iron uptake transmembrane transporter activity(GO:0015639) |
| 0.1 | 0.3 | GO:0003872 | 6-phosphofructokinase activity(GO:0003872) |
| 0.1 | 0.3 | GO:0071532 | ankyrin repeat binding(GO:0071532) |
| 0.1 | 0.6 | GO:0034713 | type I transforming growth factor beta receptor binding(GO:0034713) |
| 0.1 | 1.3 | GO:0005201 | extracellular matrix structural constituent(GO:0005201) |
| 0.0 | 0.4 | GO:0034711 | inhibin binding(GO:0034711) |
| 0.0 | 0.6 | GO:0097322 | 7SK snRNA binding(GO:0097322) |
| 0.0 | 1.3 | GO:0051400 | BH domain binding(GO:0051400) |
| 0.0 | 0.5 | GO:0019869 | chloride channel inhibitor activity(GO:0019869) |
| 0.0 | 4.2 | GO:0005518 | collagen binding(GO:0005518) |
| 0.0 | 1.1 | GO:0005388 | calcium-transporting ATPase activity(GO:0005388) |
| 0.0 | 1.8 | GO:0030676 | Rac guanyl-nucleotide exchange factor activity(GO:0030676) |
| 0.0 | 0.0 | GO:0003681 | bent DNA binding(GO:0003681) |
| 0.0 | 1.0 | GO:0002162 | dystroglycan binding(GO:0002162) |
| 0.0 | 0.2 | GO:0047710 | bis(5'-adenosyl)-triphosphatase activity(GO:0047710) |
| 0.0 | 0.5 | GO:0048101 | calmodulin-dependent cyclic-nucleotide phosphodiesterase activity(GO:0004117) calcium- and calmodulin-regulated 3',5'-cyclic-GMP phosphodiesterase activity(GO:0048101) |
| 0.0 | 0.6 | GO:0005049 | nuclear export signal receptor activity(GO:0005049) |
| 0.0 | 0.5 | GO:0050308 | sugar-phosphatase activity(GO:0050308) |
| 0.0 | 0.4 | GO:0015386 | potassium:proton antiporter activity(GO:0015386) |
| 0.0 | 0.4 | GO:0003720 | telomerase activity(GO:0003720) RNA-directed DNA polymerase activity(GO:0003964) |
| 0.0 | 0.6 | GO:0046527 | glucosyltransferase activity(GO:0046527) |
| 0.0 | 1.0 | GO:0004535 | poly(A)-specific ribonuclease activity(GO:0004535) |
| 0.0 | 0.3 | GO:0015272 | ATP-activated inward rectifier potassium channel activity(GO:0015272) |
| 0.0 | 0.4 | GO:0004687 | myosin light chain kinase activity(GO:0004687) |
| 0.0 | 0.1 | GO:0034188 | apolipoprotein receptor activity(GO:0030226) apolipoprotein A-I receptor activity(GO:0034188) phosphatidylserine-translocating ATPase activity(GO:0090556) |
| 0.0 | 0.3 | GO:0070324 | thyroid hormone binding(GO:0070324) |
| 0.0 | 0.5 | GO:0000014 | single-stranded DNA endodeoxyribonuclease activity(GO:0000014) |
| 0.0 | 0.4 | GO:0017151 | DEAD/H-box RNA helicase binding(GO:0017151) |
| 0.0 | 0.5 | GO:0004596 | peptide alpha-N-acetyltransferase activity(GO:0004596) |
| 0.0 | 0.3 | GO:0004366 | glycerol-3-phosphate O-acyltransferase activity(GO:0004366) |
| 0.0 | 0.1 | GO:0015168 | glycerol transmembrane transporter activity(GO:0015168) |
| 0.0 | 0.5 | GO:0017176 | phosphatidylinositol N-acetylglucosaminyltransferase activity(GO:0017176) |
| 0.0 | 0.4 | GO:0003689 | DNA clamp loader activity(GO:0003689) protein-DNA loading ATPase activity(GO:0033170) |
| 0.0 | 0.4 | GO:0004691 | cAMP-dependent protein kinase activity(GO:0004691) |
| 0.0 | 2.7 | GO:0003743 | translation initiation factor activity(GO:0003743) |
| 0.0 | 2.9 | GO:0045309 | protein phosphorylated amino acid binding(GO:0045309) |
| 0.0 | 0.1 | GO:0043125 | ErbB-3 class receptor binding(GO:0043125) |
| 0.0 | 0.4 | GO:0043995 | histone acetyltransferase activity (H4-K5 specific)(GO:0043995) histone acetyltransferase activity (H4-K8 specific)(GO:0043996) histone acetyltransferase activity (H4-K16 specific)(GO:0046972) |
| 0.0 | 0.7 | GO:0001618 | virus receptor activity(GO:0001618) |
| 0.0 | 1.0 | GO:0003950 | NAD+ ADP-ribosyltransferase activity(GO:0003950) |
| 0.0 | 0.5 | GO:0070742 | C2H2 zinc finger domain binding(GO:0070742) |
| 0.0 | 0.3 | GO:0070411 | I-SMAD binding(GO:0070411) |
| 0.0 | 0.4 | GO:0004017 | adenylate kinase activity(GO:0004017) |
| 0.0 | 0.4 | GO:0005391 | sodium:potassium-exchanging ATPase activity(GO:0005391) |
| 0.0 | 0.9 | GO:0031489 | myosin V binding(GO:0031489) |
| 0.0 | 0.3 | GO:0015181 | arginine transmembrane transporter activity(GO:0015181) |
| 0.0 | 0.2 | GO:0031849 | olfactory receptor binding(GO:0031849) |
| 0.0 | 0.2 | GO:0003747 | translation release factor activity(GO:0003747) translation termination factor activity(GO:0008079) |
| 0.0 | 0.6 | GO:0030898 | actin-dependent ATPase activity(GO:0030898) |
| 0.0 | 0.2 | GO:0008158 | smoothened binding(GO:0005119) hedgehog receptor activity(GO:0008158) |
| 0.0 | 0.5 | GO:0003688 | DNA replication origin binding(GO:0003688) |
| 0.0 | 1.5 | GO:0008307 | structural constituent of muscle(GO:0008307) |
| 0.0 | 0.2 | GO:0042609 | CD4 receptor binding(GO:0042609) |
| 0.0 | 0.1 | GO:0008312 | 7S RNA binding(GO:0008312) |
| 0.0 | 0.8 | GO:0008187 | poly-pyrimidine tract binding(GO:0008187) |
| 0.0 | 0.4 | GO:0097200 | cysteine-type endopeptidase activity involved in execution phase of apoptosis(GO:0097200) |
| 0.0 | 0.1 | GO:0004430 | 1-phosphatidylinositol 4-kinase activity(GO:0004430) |
| 0.0 | 0.4 | GO:0008301 | DNA binding, bending(GO:0008301) |
| 0.0 | 0.7 | GO:0005112 | Notch binding(GO:0005112) |
| 0.0 | 0.9 | GO:0042056 | chemoattractant activity(GO:0042056) |
| 0.0 | 0.1 | GO:0046923 | ER retention sequence binding(GO:0046923) |
| 0.0 | 0.5 | GO:0008409 | 5'-3' exonuclease activity(GO:0008409) |
| 0.0 | 0.4 | GO:0035325 | Toll-like receptor binding(GO:0035325) |
| 0.0 | 2.5 | GO:0043621 | protein self-association(GO:0043621) |
| 0.0 | 3.4 | GO:0005089 | Rho guanyl-nucleotide exchange factor activity(GO:0005089) |
| 0.0 | 0.2 | GO:0045545 | syndecan binding(GO:0045545) |
| 0.0 | 1.5 | GO:0004714 | transmembrane receptor protein tyrosine kinase activity(GO:0004714) |
| 0.0 | 1.2 | GO:0042974 | retinoic acid receptor binding(GO:0042974) |
| 0.0 | 0.1 | GO:0010385 | double-stranded methylated DNA binding(GO:0010385) |
| 0.0 | 0.6 | GO:0032041 | histone deacetylase activity (H3-K14 specific)(GO:0031078) NAD-dependent histone deacetylase activity (H3-K14 specific)(GO:0032041) |
| 0.0 | 0.1 | GO:0003960 | NADPH:quinone reductase activity(GO:0003960) |
| 0.0 | 0.3 | GO:0071253 | connexin binding(GO:0071253) |
| 0.0 | 0.2 | GO:0003923 | GPI-anchor transamidase activity(GO:0003923) |
| 0.0 | 0.7 | GO:0031005 | filamin binding(GO:0031005) |
| 0.0 | 0.6 | GO:0019956 | chemokine binding(GO:0019956) |
| 0.0 | 0.2 | GO:0004852 | uroporphyrinogen-III synthase activity(GO:0004852) |
| 0.0 | 1.4 | GO:0004693 | cyclin-dependent protein serine/threonine kinase activity(GO:0004693) |
| 0.0 | 3.4 | GO:0005178 | integrin binding(GO:0005178) |
| 0.0 | 1.2 | GO:0003785 | actin monomer binding(GO:0003785) |
| 0.0 | 0.2 | GO:0015186 | L-glutamine transmembrane transporter activity(GO:0015186) |
| 0.0 | 2.9 | GO:0042626 | ATPase activity, coupled to transmembrane movement of substances(GO:0042626) |
| 0.0 | 0.7 | GO:0070064 | proline-rich region binding(GO:0070064) |
| 0.0 | 0.4 | GO:0004303 | estradiol 17-beta-dehydrogenase activity(GO:0004303) |
| 0.0 | 0.2 | GO:0004311 | farnesyltranstransferase activity(GO:0004311) |
| 0.0 | 0.5 | GO:0070410 | co-SMAD binding(GO:0070410) |
| 0.0 | 0.5 | GO:0042813 | Wnt-activated receptor activity(GO:0042813) |
| 0.0 | 0.1 | GO:0052834 | inositol monophosphate 1-phosphatase activity(GO:0008934) inositol monophosphate 3-phosphatase activity(GO:0052832) inositol monophosphate 4-phosphatase activity(GO:0052833) inositol monophosphate phosphatase activity(GO:0052834) |
| 0.0 | 0.1 | GO:0015232 | heme transporter activity(GO:0015232) |
| 0.0 | 0.1 | GO:0005093 | Rab GDP-dissociation inhibitor activity(GO:0005093) |
| 0.0 | 1.4 | GO:0016278 | lysine N-methyltransferase activity(GO:0016278) protein-lysine N-methyltransferase activity(GO:0016279) |
| 0.0 | 0.2 | GO:0043560 | insulin receptor substrate binding(GO:0043560) |
| 0.0 | 0.6 | GO:0005184 | neuropeptide hormone activity(GO:0005184) |
| 0.0 | 0.3 | GO:0051864 | histone demethylase activity (H3-K36 specific)(GO:0051864) |
| 0.0 | 2.1 | GO:0008013 | beta-catenin binding(GO:0008013) |
| 0.0 | 0.4 | GO:0005528 | macrolide binding(GO:0005527) FK506 binding(GO:0005528) |
| 0.0 | 0.3 | GO:0047555 | 3',5'-cyclic-GMP phosphodiesterase activity(GO:0047555) |
| 0.0 | 0.3 | GO:0005436 | sodium:phosphate symporter activity(GO:0005436) |
| 0.0 | 0.6 | GO:0051019 | mitogen-activated protein kinase binding(GO:0051019) |
| 0.0 | 0.5 | GO:0046966 | thyroid hormone receptor binding(GO:0046966) |
| 0.0 | 1.3 | GO:0005080 | protein kinase C binding(GO:0005080) |
| 0.0 | 0.6 | GO:0003899 | DNA-directed RNA polymerase activity(GO:0003899) RNA polymerase activity(GO:0034062) |
| 0.0 | 0.4 | GO:0031369 | translation initiation factor binding(GO:0031369) |
| 0.0 | 0.9 | GO:0043022 | ribosome binding(GO:0043022) |
| 0.0 | 0.2 | GO:0004697 | protein kinase C activity(GO:0004697) |
| 0.0 | 0.2 | GO:0008474 | palmitoyl-(protein) hydrolase activity(GO:0008474) palmitoyl hydrolase activity(GO:0098599) |
| 0.0 | 0.8 | GO:0015175 | neutral amino acid transmembrane transporter activity(GO:0015175) |
| 0.0 | 0.1 | GO:0061676 | importin-alpha family protein binding(GO:0061676) |
| 0.0 | 0.0 | GO:0030519 | snoRNP binding(GO:0030519) |
| 0.0 | 2.4 | GO:0004867 | serine-type endopeptidase inhibitor activity(GO:0004867) |
| 0.0 | 0.2 | GO:0003876 | AMP deaminase activity(GO:0003876) adenosine-phosphate deaminase activity(GO:0047623) |
| 0.0 | 0.3 | GO:0009982 | pseudouridine synthase activity(GO:0009982) |
| 0.0 | 1.2 | GO:0035064 | methylated histone binding(GO:0035064) |
| 0.0 | 0.2 | GO:0070412 | R-SMAD binding(GO:0070412) |
| 0.0 | 0.9 | GO:0051219 | phosphoprotein binding(GO:0051219) |
| 0.0 | 0.5 | GO:0044183 | protein binding involved in protein folding(GO:0044183) |
| 0.0 | 1.0 | GO:0003724 | RNA helicase activity(GO:0003724) ATP-dependent RNA helicase activity(GO:0004004) RNA-dependent ATPase activity(GO:0008186) |
| 0.0 | 0.6 | GO:0005158 | insulin receptor binding(GO:0005158) |
| 0.0 | 0.2 | GO:0051787 | misfolded protein binding(GO:0051787) |
| 0.0 | 0.2 | GO:0005149 | interleukin-1 receptor binding(GO:0005149) |
| 0.0 | 0.6 | GO:0004527 | exonuclease activity(GO:0004527) |
| 0.0 | 0.4 | GO:0000993 | RNA polymerase II core binding(GO:0000993) |
| 0.0 | 3.1 | GO:0044822 | mRNA binding(GO:0003729) poly(A) RNA binding(GO:0044822) |
| 0.0 | 1.1 | GO:0004197 | cysteine-type endopeptidase activity(GO:0004197) |
| 0.0 | 0.2 | GO:0008430 | selenium binding(GO:0008430) |
| 0.0 | 0.3 | GO:0003841 | 1-acylglycerol-3-phosphate O-acyltransferase activity(GO:0003841) |
| 0.0 | 0.1 | GO:0005124 | scavenger receptor binding(GO:0005124) |
| 0.0 | 0.0 | GO:0004063 | aryldialkylphosphatase activity(GO:0004063) |
| 0.0 | 0.3 | GO:0043325 | phosphatidylinositol-3,4-bisphosphate binding(GO:0043325) |
| 0.0 | 0.9 | GO:0016811 | hydrolase activity, acting on carbon-nitrogen (but not peptide) bonds, in linear amides(GO:0016811) |
| 0.0 | 0.3 | GO:0004709 | MAP kinase kinase kinase activity(GO:0004709) |
| 0.0 | 0.1 | GO:0070180 | large ribosomal subunit rRNA binding(GO:0070180) |
| 0.0 | 0.6 | GO:0050699 | WW domain binding(GO:0050699) |
Gene overrepresentation in curated gene sets: canonical pathways category:
| Log-likelihood per target | Total log-likelihood | Term | Description |
|---|---|---|---|
| 0.2 | 3.9 | PID TCR JNK PATHWAY | JNK signaling in the CD4+ TCR pathway |
| 0.2 | 11.4 | PID SYNDECAN 1 PATHWAY | Syndecan-1-mediated signaling events |
| 0.2 | 2.6 | PID P38 GAMMA DELTA PATHWAY | Signaling mediated by p38-gamma and p38-delta |
| 0.2 | 2.9 | PID ANTHRAX PATHWAY | Cellular roles of Anthrax toxin |
| 0.1 | 7.7 | PID HNF3B PATHWAY | FOXA2 and FOXA3 transcription factor networks |
| 0.1 | 1.0 | PID VEGF VEGFR PATHWAY | VEGF and VEGFR signaling network |
| 0.1 | 1.9 | PID LPA4 PATHWAY | LPA4-mediated signaling events |
| 0.1 | 4.4 | PID INTEGRIN A4B1 PATHWAY | Alpha4 beta1 integrin signaling events |
| 0.1 | 0.4 | PID A6B1 A6B4 INTEGRIN PATHWAY | a6b1 and a6b4 Integrin signaling |
| 0.1 | 1.7 | PID S1P S1P2 PATHWAY | S1P2 pathway |
| 0.1 | 0.6 | PID GMCSF PATHWAY | GMCSF-mediated signaling events |
| 0.1 | 2.7 | PID IL8 CXCR1 PATHWAY | IL8- and CXCR1-mediated signaling events |
| 0.1 | 3.4 | PID AMB2 NEUTROPHILS PATHWAY | amb2 Integrin signaling |
| 0.1 | 4.5 | PID CDC42 REG PATHWAY | Regulation of CDC42 activity |
| 0.1 | 4.6 | PID INSULIN PATHWAY | Insulin Pathway |
| 0.1 | 1.9 | PID NECTIN PATHWAY | Nectin adhesion pathway |
| 0.1 | 0.5 | ST PAC1 RECEPTOR PATHWAY | PAC1 Receptor Pathway |
| 0.1 | 1.0 | PID AVB3 OPN PATHWAY | Osteopontin-mediated events |
| 0.1 | 0.5 | PID EPHA2 FWD PATHWAY | EPHA2 forward signaling |
| 0.1 | 5.1 | PID HIF1 TFPATHWAY | HIF-1-alpha transcription factor network |
| 0.1 | 1.7 | PID ALK1 PATHWAY | ALK1 signaling events |
| 0.1 | 1.9 | PID ANGIOPOIETIN RECEPTOR PATHWAY | Angiopoietin receptor Tie2-mediated signaling |
| 0.1 | 2.3 | PID FOXM1 PATHWAY | FOXM1 transcription factor network |
| 0.1 | 1.8 | PID RHOA PATHWAY | RhoA signaling pathway |
| 0.1 | 1.7 | PID FRA PATHWAY | Validated transcriptional targets of AP1 family members Fra1 and Fra2 |
| 0.1 | 1.8 | PID RETINOIC ACID PATHWAY | Retinoic acid receptors-mediated signaling |
| 0.0 | 2.0 | PID ARF6 TRAFFICKING PATHWAY | Arf6 trafficking events |
| 0.0 | 1.0 | PID INTEGRIN A9B1 PATHWAY | Alpha9 beta1 integrin signaling events |
| 0.0 | 1.7 | PID WNT NONCANONICAL PATHWAY | Noncanonical Wnt signaling pathway |
| 0.0 | 1.2 | ST ERK1 ERK2 MAPK PATHWAY | ERK1/ERK2 MAPK Pathway |
| 0.0 | 9.1 | NABA ECM GLYCOPROTEINS | Genes encoding structural ECM glycoproteins |
| 0.0 | 3.7 | PID E2F PATHWAY | E2F transcription factor network |
| 0.0 | 3.7 | PID RHOA REG PATHWAY | Regulation of RhoA activity |
| 0.0 | 1.1 | PID IL2 1PATHWAY | IL2-mediated signaling events |
| 0.0 | 0.5 | PID IL2 STAT5 PATHWAY | IL2 signaling events mediated by STAT5 |
| 0.0 | 0.2 | PID AR NONGENOMIC PATHWAY | Nongenotropic Androgen signaling |
| 0.0 | 1.8 | PID AURORA B PATHWAY | Aurora B signaling |
| 0.0 | 4.6 | PID PDGFRB PATHWAY | PDGFR-beta signaling pathway |
| 0.0 | 0.3 | PID BETA CATENIN DEG PATHWAY | Degradation of beta catenin |
| 0.0 | 0.3 | ST INTERLEUKIN 4 PATHWAY | Interleukin 4 (IL-4) Pathway |
| 0.0 | 0.7 | PID ATM PATHWAY | ATM pathway |
| 0.0 | 0.7 | PID IL2 PI3K PATHWAY | IL2 signaling events mediated by PI3K |
| 0.0 | 2.0 | PID FGF PATHWAY | FGF signaling pathway |
| 0.0 | 0.7 | ST DIFFERENTIATION PATHWAY IN PC12 CELLS | Differentiation Pathway in PC12 Cells; this is a specific case of PAC1 Receptor Pathway. |
| 0.0 | 2.5 | PID NOTCH PATHWAY | Notch signaling pathway |
| 0.0 | 0.1 | SA G1 AND S PHASES | Cdk2, 4, and 6 bind cyclin D in G1, while cdk2/cyclin E promotes the G1/S transition. |
| 0.0 | 0.6 | PID RANBP2 PATHWAY | Sumoylation by RanBP2 regulates transcriptional repression |
| 0.0 | 0.9 | PID IL6 7 PATHWAY | IL6-mediated signaling events |
| 0.0 | 0.7 | PID ALPHA SYNUCLEIN PATHWAY | Alpha-synuclein signaling |
| 0.0 | 1.2 | PID ATR PATHWAY | ATR signaling pathway |
| 0.0 | 2.0 | PID REG GR PATHWAY | Glucocorticoid receptor regulatory network |
| 0.0 | 0.8 | PID KIT PATHWAY | Signaling events mediated by Stem cell factor receptor (c-Kit) |
| 0.0 | 1.8 | PID TCR PATHWAY | TCR signaling in naïve CD4+ T cells |
| 0.0 | 0.7 | PID FANCONI PATHWAY | Fanconi anemia pathway |
| 0.0 | 0.1 | PID AVB3 INTEGRIN PATHWAY | Integrins in angiogenesis |
| 0.0 | 0.5 | PID ECADHERIN STABILIZATION PATHWAY | Stabilization and expansion of the E-cadherin adherens junction |
| 0.0 | 0.6 | PID FCER1 PATHWAY | Fc-epsilon receptor I signaling in mast cells |
| 0.0 | 1.3 | PID HEDGEHOG GLI PATHWAY | Hedgehog signaling events mediated by Gli proteins |
| 0.0 | 0.4 | PID DNA PK PATHWAY | DNA-PK pathway in nonhomologous end joining |
| 0.0 | 0.4 | PID HEDGEHOG 2PATHWAY | Signaling events mediated by the Hedgehog family |
| 0.0 | 4.3 | NABA ECM AFFILIATED | Genes encoding proteins affiliated structurally or functionally to extracellular matrix proteins |
| 0.0 | 0.5 | PID ERBB2 ERBB3 PATHWAY | ErbB2/ErbB3 signaling events |
| 0.0 | 0.0 | SA B CELL RECEPTOR COMPLEXES | Antigen binding to B cell receptors activates protein tyrosine kinases, such as the Src family, which ultimate activate MAP kinases. |
| 0.0 | 1.0 | PID MTOR 4PATHWAY | mTOR signaling pathway |
| 0.0 | 0.4 | PID IL4 2PATHWAY | IL4-mediated signaling events |
| 0.0 | 0.8 | PID PLK1 PATHWAY | PLK1 signaling events |
| 0.0 | 4.6 | NABA ECM REGULATORS | Genes encoding enzymes and their regulators involved in the remodeling of the extracellular matrix |
| 0.0 | 0.5 | SA CASPASE CASCADE | Apoptosis is mediated by caspases, cysteine proteases arranged in a proteolytic cascade. |
| 0.0 | 0.3 | PID HIF2PATHWAY | HIF-2-alpha transcription factor network |
| 0.0 | 0.5 | PID BMP PATHWAY | BMP receptor signaling |
| 0.0 | 0.2 | PID ECADHERIN NASCENT AJ PATHWAY | E-cadherin signaling in the nascent adherens junction |
| 0.0 | 0.2 | SIG INSULIN RECEPTOR PATHWAY IN CARDIAC MYOCYTES | Genes related to the insulin receptor pathway |
| 0.0 | 0.2 | NABA COLLAGENS | Genes encoding collagen proteins |
| 0.0 | 0.2 | PID P38 ALPHA BETA PATHWAY | Regulation of p38-alpha and p38-beta |
| 0.0 | 0.4 | PID P75 NTR PATHWAY | p75(NTR)-mediated signaling |
| 0.0 | 0.1 | PID PI3KCI AKT PATHWAY | Class I PI3K signaling events mediated by Akt |
| 0.0 | 0.7 | PID CMYB PATHWAY | C-MYB transcription factor network |
| 0.0 | 0.1 | PID CIRCADIAN PATHWAY | Circadian rhythm pathway |
Gene overrepresentation in curated gene sets: REACTOME pathways category:
| Log-likelihood per target | Total log-likelihood | Term | Description |
|---|---|---|---|
| 0.4 | 5.1 | REACTOME HYALURONAN UPTAKE AND DEGRADATION | Genes involved in Hyaluronan uptake and degradation |
| 0.1 | 4.3 | REACTOME SIGNAL REGULATORY PROTEIN SIRP FAMILY INTERACTIONS | Genes involved in Signal regulatory protein (SIRP) family interactions |
| 0.1 | 1.9 | REACTOME REGULATION OF INSULIN SECRETION BY ACETYLCHOLINE | Genes involved in Regulation of Insulin Secretion by Acetylcholine |
| 0.1 | 3.6 | REACTOME PYRUVATE METABOLISM | Genes involved in Pyruvate metabolism |
| 0.1 | 3.3 | REACTOME SIGNAL ATTENUATION | Genes involved in Signal attenuation |
| 0.1 | 2.4 | REACTOME REPAIR SYNTHESIS FOR GAP FILLING BY DNA POL IN TC NER | Genes involved in Repair synthesis for gap-filling by DNA polymerase in TC-NER |
| 0.1 | 2.1 | REACTOME PLATELET ADHESION TO EXPOSED COLLAGEN | Genes involved in Platelet Adhesion to exposed collagen |
| 0.1 | 1.4 | REACTOME CS DS DEGRADATION | Genes involved in CS/DS degradation |
| 0.1 | 0.5 | REACTOME MRNA CAPPING | Genes involved in mRNA Capping |
| 0.1 | 2.1 | REACTOME P2Y RECEPTORS | Genes involved in P2Y receptors |
| 0.1 | 3.2 | REACTOME CELL EXTRACELLULAR MATRIX INTERACTIONS | Genes involved in Cell-extracellular matrix interactions |
| 0.1 | 1.9 | REACTOME ADENYLATE CYCLASE ACTIVATING PATHWAY | Genes involved in Adenylate cyclase activating pathway |
| 0.1 | 5.5 | REACTOME SMOOTH MUSCLE CONTRACTION | Genes involved in Smooth Muscle Contraction |
| 0.1 | 1.3 | REACTOME GRB2 SOS PROVIDES LINKAGE TO MAPK SIGNALING FOR INTERGRINS | Genes involved in GRB2:SOS provides linkage to MAPK signaling for Intergrins |
| 0.1 | 2.1 | REACTOME CYCLIN A B1 ASSOCIATED EVENTS DURING G2 M TRANSITION | Genes involved in Cyclin A/B1 associated events during G2/M transition |
| 0.1 | 5.5 | REACTOME CHEMOKINE RECEPTORS BIND CHEMOKINES | Genes involved in Chemokine receptors bind chemokines |
| 0.1 | 0.8 | REACTOME THE ACTIVATION OF ARYLSULFATASES | Genes involved in The activation of arylsulfatases |
| 0.1 | 2.9 | REACTOME AMYLOIDS | Genes involved in Amyloids |
| 0.1 | 3.3 | REACTOME GENERATION OF SECOND MESSENGER MOLECULES | Genes involved in Generation of second messenger molecules |
| 0.1 | 1.0 | REACTOME VEGF LIGAND RECEPTOR INTERACTIONS | Genes involved in VEGF ligand-receptor interactions |
| 0.1 | 5.6 | REACTOME IRON UPTAKE AND TRANSPORT | Genes involved in Iron uptake and transport |
| 0.1 | 1.6 | REACTOME DSCAM INTERACTIONS | Genes involved in DSCAM interactions |
| 0.1 | 2.1 | REACTOME ABCA TRANSPORTERS IN LIPID HOMEOSTASIS | Genes involved in ABCA transporters in lipid homeostasis |
| 0.1 | 1.2 | REACTOME PASSIVE TRANSPORT BY AQUAPORINS | Genes involved in Passive Transport by Aquaporins |
| 0.1 | 5.7 | REACTOME COLLAGEN FORMATION | Genes involved in Collagen formation |
| 0.1 | 1.2 | REACTOME TANDEM PORE DOMAIN POTASSIUM CHANNELS | Genes involved in Tandem pore domain potassium channels |
| 0.1 | 1.3 | REACTOME METABOLISM OF POLYAMINES | Genes involved in Metabolism of polyamines |
| 0.1 | 2.6 | REACTOME FGFR LIGAND BINDING AND ACTIVATION | Genes involved in FGFR ligand binding and activation |
| 0.1 | 1.0 | REACTOME TRAFFICKING AND PROCESSING OF ENDOSOMAL TLR | Genes involved in Trafficking and processing of endosomal TLR |
| 0.1 | 1.7 | REACTOME INSULIN SYNTHESIS AND PROCESSING | Genes involved in Insulin Synthesis and Processing |
| 0.1 | 3.1 | REACTOME THROMBIN SIGNALLING THROUGH PROTEINASE ACTIVATED RECEPTORS PARS | Genes involved in Thrombin signalling through proteinase activated receptors (PARs) |
| 0.1 | 1.3 | REACTOME DEPOSITION OF NEW CENPA CONTAINING NUCLEOSOMES AT THE CENTROMERE | Genes involved in Deposition of New CENPA-containing Nucleosomes at the Centromere |
| 0.1 | 1.2 | REACTOME ANTIGEN PRESENTATION FOLDING ASSEMBLY AND PEPTIDE LOADING OF CLASS I MHC | Genes involved in Antigen Presentation: Folding, assembly and peptide loading of class I MHC |
| 0.1 | 0.7 | REACTOME RECEPTOR LIGAND BINDING INITIATES THE SECOND PROTEOLYTIC CLEAVAGE OF NOTCH RECEPTOR | Genes involved in Receptor-ligand binding initiates the second proteolytic cleavage of Notch receptor |
| 0.1 | 2.2 | REACTOME GROWTH HORMONE RECEPTOR SIGNALING | Genes involved in Growth hormone receptor signaling |
| 0.1 | 2.7 | REACTOME NEGATIVE REGULATORS OF RIG I MDA5 SIGNALING | Genes involved in Negative regulators of RIG-I/MDA5 signaling |
| 0.1 | 4.1 | REACTOME ANTIGEN PROCESSING CROSS PRESENTATION | Genes involved in Antigen processing-Cross presentation |
| 0.0 | 1.0 | REACTOME METABOLISM OF PORPHYRINS | Genes involved in Metabolism of porphyrins |
| 0.0 | 2.5 | REACTOME G1 PHASE | Genes involved in G1 Phase |
| 0.0 | 2.3 | REACTOME RNA POL II TRANSCRIPTION PRE INITIATION AND PROMOTER OPENING | Genes involved in RNA Polymerase II Transcription Pre-Initiation And Promoter Opening |
| 0.0 | 0.8 | REACTOME IL 7 SIGNALING | Genes involved in Interleukin-7 signaling |
| 0.0 | 1.1 | REACTOME PLATELET SENSITIZATION BY LDL | Genes involved in Platelet sensitization by LDL |
| 0.0 | 0.8 | REACTOME TIE2 SIGNALING | Genes involved in Tie2 Signaling |
| 0.0 | 0.7 | REACTOME HOMOLOGOUS RECOMBINATION REPAIR OF REPLICATION INDEPENDENT DOUBLE STRAND BREAKS | Genes involved in Homologous recombination repair of replication-independent double-strand breaks |
| 0.0 | 0.5 | REACTOME RNA POL II PRE TRANSCRIPTION EVENTS | Genes involved in RNA Polymerase II Pre-transcription Events |
| 0.0 | 0.6 | REACTOME DCC MEDIATED ATTRACTIVE SIGNALING | Genes involved in DCC mediated attractive signaling |
| 0.0 | 0.8 | REACTOME REGULATION OF SIGNALING BY CBL | Genes involved in Regulation of signaling by CBL |
| 0.0 | 0.6 | REACTOME DESTABILIZATION OF MRNA BY KSRP | Genes involved in Destabilization of mRNA by KSRP |
| 0.0 | 1.9 | REACTOME IMMUNOREGULATORY INTERACTIONS BETWEEN A LYMPHOID AND A NON LYMPHOID CELL | Genes involved in Immunoregulatory interactions between a Lymphoid and a non-Lymphoid cell |
| 0.0 | 2.0 | REACTOME ASSOCIATION OF TRIC CCT WITH TARGET PROTEINS DURING BIOSYNTHESIS | Genes involved in Association of TriC/CCT with target proteins during biosynthesis |
| 0.0 | 0.5 | REACTOME NEF MEDIATED DOWNREGULATION OF MHC CLASS I COMPLEX CELL SURFACE EXPRESSION | Genes involved in Nef mediated downregulation of MHC class I complex cell surface expression |
| 0.0 | 1.3 | REACTOME DEADENYLATION OF MRNA | Genes involved in Deadenylation of mRNA |
| 0.0 | 0.3 | REACTOME REGULATION OF ORNITHINE DECARBOXYLASE ODC | Genes involved in Regulation of ornithine decarboxylase (ODC) |
| 0.0 | 0.8 | REACTOME PROCESSING OF INTRONLESS PRE MRNAS | Genes involved in Processing of Intronless Pre-mRNAs |
| 0.0 | 0.5 | REACTOME APOPTOSIS INDUCED DNA FRAGMENTATION | Genes involved in Apoptosis induced DNA fragmentation |
| 0.0 | 0.6 | REACTOME RNA POL III CHAIN ELONGATION | Genes involved in RNA Polymerase III Chain Elongation |
| 0.0 | 1.1 | REACTOME SIGNALING BY HIPPO | Genes involved in Signaling by Hippo |
| 0.0 | 0.3 | REACTOME PROSTANOID LIGAND RECEPTORS | Genes involved in Prostanoid ligand receptors |
| 0.0 | 0.8 | REACTOME ALPHA LINOLENIC ACID ALA METABOLISM | Genes involved in alpha-linolenic acid (ALA) metabolism |
| 0.0 | 0.5 | REACTOME UNWINDING OF DNA | Genes involved in Unwinding of DNA |
| 0.0 | 1.5 | REACTOME RECYCLING PATHWAY OF L1 | Genes involved in Recycling pathway of L1 |
| 0.0 | 0.6 | REACTOME RNA POL I TRANSCRIPTION INITIATION | Genes involved in RNA Polymerase I Transcription Initiation |
| 0.0 | 1.7 | REACTOME REGULATION OF BETA CELL DEVELOPMENT | Genes involved in Regulation of beta-cell development |
| 0.0 | 0.9 | REACTOME CA DEPENDENT EVENTS | Genes involved in Ca-dependent events |
| 0.0 | 0.4 | REACTOME REGULATION OF RHEB GTPASE ACTIVITY BY AMPK | Genes involved in Regulation of Rheb GTPase activity by AMPK |
| 0.0 | 2.0 | REACTOME FORMATION OF THE TERNARY COMPLEX AND SUBSEQUENTLY THE 43S COMPLEX | Genes involved in Formation of the ternary complex, and subsequently, the 43S complex |
| 0.0 | 1.6 | REACTOME STRIATED MUSCLE CONTRACTION | Genes involved in Striated Muscle Contraction |
| 0.0 | 1.9 | REACTOME MYOGENESIS | Genes involved in Myogenesis |
| 0.0 | 3.2 | REACTOME RESPIRATORY ELECTRON TRANSPORT ATP SYNTHESIS BY CHEMIOSMOTIC COUPLING AND HEAT PRODUCTION BY UNCOUPLING PROTEINS | Genes involved in Respiratory electron transport, ATP synthesis by chemiosmotic coupling, and heat production by uncoupling proteins. |
| 0.0 | 0.4 | REACTOME PERK REGULATED GENE EXPRESSION | Genes involved in PERK regulated gene expression |
| 0.0 | 0.8 | REACTOME PRE NOTCH PROCESSING IN GOLGI | Genes involved in Pre-NOTCH Processing in Golgi |
| 0.0 | 0.6 | REACTOME SEMA4D INDUCED CELL MIGRATION AND GROWTH CONE COLLAPSE | Genes involved in Sema4D induced cell migration and growth-cone collapse |
| 0.0 | 0.9 | REACTOME DOWNREGULATION OF SMAD2 3 SMAD4 TRANSCRIPTIONAL ACTIVITY | Genes involved in Downregulation of SMAD2/3:SMAD4 transcriptional activity |
| 0.0 | 2.2 | REACTOME NUCLEAR RECEPTOR TRANSCRIPTION PATHWAY | Genes involved in Nuclear Receptor transcription pathway |
| 0.0 | 0.6 | REACTOME SYNTHESIS OF PIPS AT THE GOLGI MEMBRANE | Genes involved in Synthesis of PIPs at the Golgi membrane |
| 0.0 | 5.5 | REACTOME SIGNALING BY RHO GTPASES | Genes involved in Signaling by Rho GTPases |
| 0.0 | 0.3 | REACTOME CD28 DEPENDENT PI3K AKT SIGNALING | Genes involved in CD28 dependent PI3K/Akt signaling |
| 0.0 | 2.1 | REACTOME RESPONSE TO ELEVATED PLATELET CYTOSOLIC CA2 | Genes involved in Response to elevated platelet cytosolic Ca2+ |
| 0.0 | 0.3 | REACTOME FORMATION OF TUBULIN FOLDING INTERMEDIATES BY CCT TRIC | Genes involved in Formation of tubulin folding intermediates by CCT/TriC |
| 0.0 | 0.3 | REACTOME METABOLISM OF NON CODING RNA | Genes involved in Metabolism of non-coding RNA |
| 0.0 | 1.1 | REACTOME CELL SURFACE INTERACTIONS AT THE VASCULAR WALL | Genes involved in Cell surface interactions at the vascular wall |
| 0.0 | 0.3 | REACTOME AUTODEGRADATION OF CDH1 BY CDH1 APC C | Genes involved in Autodegradation of Cdh1 by Cdh1:APC/C |
| 0.0 | 0.8 | REACTOME HS GAG BIOSYNTHESIS | Genes involved in HS-GAG biosynthesis |
| 0.0 | 1.1 | REACTOME ANTIVIRAL MECHANISM BY IFN STIMULATED GENES | Genes involved in Antiviral mechanism by IFN-stimulated genes |
| 0.0 | 2.0 | REACTOME MRNA SPLICING | Genes involved in mRNA Splicing |
| 0.0 | 0.3 | REACTOME PURINE RIBONUCLEOSIDE MONOPHOSPHATE BIOSYNTHESIS | Genes involved in Purine ribonucleoside monophosphate biosynthesis |
| 0.0 | 0.3 | REACTOME AQUAPORIN MEDIATED TRANSPORT | Genes involved in Aquaporin-mediated transport |
| 0.0 | 0.6 | REACTOME BIOSYNTHESIS OF THE N GLYCAN PRECURSOR DOLICHOL LIPID LINKED OLIGOSACCHARIDE LLO AND TRANSFER TO A NASCENT PROTEIN | Genes involved in Biosynthesis of the N-glycan precursor (dolichol lipid-linked oligosaccharide, LLO) and transfer to a nascent protein |
| 0.0 | 0.8 | REACTOME ACTIVATION OF CHAPERONE GENES BY XBP1S | Genes involved in Activation of Chaperone Genes by XBP1(S) |
| 0.0 | 2.1 | REACTOME TRANSPORT OF INORGANIC CATIONS ANIONS AND AMINO ACIDS OLIGOPEPTIDES | Genes involved in Transport of inorganic cations/anions and amino acids/oligopeptides |
| 0.0 | 0.2 | REACTOME ENOS ACTIVATION AND REGULATION | Genes involved in eNOS activation and regulation |
| 0.0 | 0.1 | REACTOME GLOBAL GENOMIC NER GG NER | Genes involved in Global Genomic NER (GG-NER) |
| 0.0 | 0.2 | REACTOME TRANSCRIPTIONAL REGULATION OF WHITE ADIPOCYTE DIFFERENTIATION | Genes involved in Transcriptional Regulation of White Adipocyte Differentiation |
| 0.0 | 0.5 | REACTOME TRANSPORT TO THE GOLGI AND SUBSEQUENT MODIFICATION | Genes involved in Transport to the Golgi and subsequent modification |
| 0.0 | 0.5 | REACTOME DOWNSTREAM SIGNAL TRANSDUCTION | Genes involved in Downstream signal transduction |
| 0.0 | 0.1 | REACTOME GLYCOPROTEIN HORMONES | Genes involved in Glycoprotein hormones |
| 0.0 | 0.3 | REACTOME CGMP EFFECTS | Genes involved in cGMP effects |
| 0.0 | 0.8 | REACTOME LOSS OF NLP FROM MITOTIC CENTROSOMES | Genes involved in Loss of Nlp from mitotic centrosomes |
| 0.0 | 0.3 | REACTOME SULFUR AMINO ACID METABOLISM | Genes involved in Sulfur amino acid metabolism |
| 0.0 | 0.4 | REACTOME INTRINSIC PATHWAY FOR APOPTOSIS | Genes involved in Intrinsic Pathway for Apoptosis |
| 0.0 | 0.3 | REACTOME DOWNREGULATION OF TGF BETA RECEPTOR SIGNALING | Genes involved in Downregulation of TGF-beta receptor signaling |
| 0.0 | 0.2 | REACTOME GLUCOSE TRANSPORT | Genes involved in Glucose transport |
| 0.0 | 1.0 | REACTOME TOLL RECEPTOR CASCADES | Genes involved in Toll Receptor Cascades |
| 0.0 | 0.2 | REACTOME IL1 SIGNALING | Genes involved in Interleukin-1 signaling |
| 0.0 | 0.4 | REACTOME BMAL1 CLOCK NPAS2 ACTIVATES CIRCADIAN EXPRESSION | Genes involved in BMAL1:CLOCK/NPAS2 Activates Circadian Expression |