Project
GSE58827: Dynamics of the Mouse Liver
Navigation
Downloads
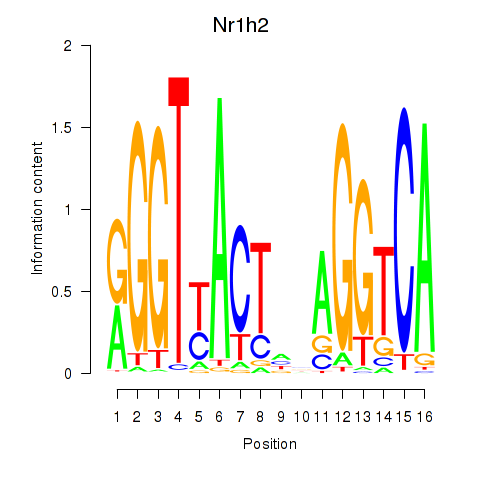
Results for Nr1h2
Z-value: 2.12
Motif logo
Transcription factors associated with Nr1h2
| Gene Symbol | Gene ID | Gene Info |
|---|---|---|
|
Nr1h2
|
ENSMUSG00000060601.14 | nuclear receptor subfamily 1, group H, member 2 |
Activity-expression correlation:
| Gene | Promoter | Pearson corr. coef. | P-value | Plot |
|---|---|---|---|---|
| Nr1h2 | mm39_v1_chr7_-_44203319_44203392 | -0.70 | 2.4e-06 | Click! |
Activity profile of Nr1h2 motif
Sorted Z-values of Nr1h2 motif
| Promoter | Log-likelihood | Transcript | Gene | Gene Info |
|---|---|---|---|---|
| chr7_-_97066937 | 49.03 |
ENSMUST00000043077.8
|
Thrsp
|
thyroid hormone responsive |
| chr2_+_102488985 | 14.26 |
ENSMUST00000080210.10
|
Slc1a2
|
solute carrier family 1 (glial high affinity glutamate transporter), member 2 |
| chr3_+_146302832 | 13.49 |
ENSMUST00000029837.14
ENSMUST00000147409.2 ENSMUST00000121133.2 |
Uox
|
urate oxidase |
| chr11_-_60101235 | 13.44 |
ENSMUST00000144942.2
|
Srebf1
|
sterol regulatory element binding transcription factor 1 |
| chr17_-_84154173 | 12.66 |
ENSMUST00000000687.9
|
Haao
|
3-hydroxyanthranilate 3,4-dioxygenase |
| chr17_-_84154196 | 12.15 |
ENSMUST00000234214.2
|
Haao
|
3-hydroxyanthranilate 3,4-dioxygenase |
| chr11_-_120715351 | 11.44 |
ENSMUST00000055655.9
|
Fasn
|
fatty acid synthase |
| chr6_-_119521243 | 10.88 |
ENSMUST00000119369.2
ENSMUST00000178696.8 |
Wnt5b
|
wingless-type MMTV integration site family, member 5B |
| chr11_+_54988866 | 10.84 |
ENSMUST00000000608.8
|
Gm2a
|
GM2 ganglioside activator protein |
| chr12_+_112073261 | 10.29 |
ENSMUST00000223412.2
|
Aspg
|
asparaginase |
| chr6_+_125297596 | 10.04 |
ENSMUST00000176655.8
ENSMUST00000176110.8 |
Scnn1a
|
sodium channel, nonvoltage-gated 1 alpha |
| chr1_-_139487951 | 9.57 |
ENSMUST00000023965.8
|
Cfhr1
|
complement factor H-related 1 |
| chr3_-_90421557 | 9.21 |
ENSMUST00000107340.2
ENSMUST00000060738.9 |
S100a1
|
S100 calcium binding protein A1 |
| chr16_+_13758494 | 9.20 |
ENSMUST00000141971.8
ENSMUST00000124947.8 ENSMUST00000023360.14 ENSMUST00000143697.8 |
Mpv17l
|
Mpv17 transgene, kidney disease mutant-like |
| chr7_-_12732067 | 8.60 |
ENSMUST00000032539.14
ENSMUST00000120903.8 |
Slc27a5
|
solute carrier family 27 (fatty acid transporter), member 5 |
| chr7_-_12731594 | 8.09 |
ENSMUST00000133977.3
|
Slc27a5
|
solute carrier family 27 (fatty acid transporter), member 5 |
| chr4_+_43641262 | 7.80 |
ENSMUST00000123351.8
ENSMUST00000128549.3 |
Npr2
|
natriuretic peptide receptor 2 |
| chr15_+_82439273 | 7.72 |
ENSMUST00000229103.2
ENSMUST00000068861.8 ENSMUST00000229904.2 |
Cyp2d12
|
cytochrome P450, family 2, subfamily d, polypeptide 12 |
| chr3_-_146302343 | 7.22 |
ENSMUST00000029836.9
|
Dnase2b
|
deoxyribonuclease II beta |
| chr6_+_90439596 | 6.96 |
ENSMUST00000203039.3
|
Klf15
|
Kruppel-like factor 15 |
| chr13_-_12476313 | 6.89 |
ENSMUST00000143693.8
ENSMUST00000144283.2 ENSMUST00000099820.10 ENSMUST00000135166.8 |
Lgals8
|
lectin, galactose binding, soluble 8 |
| chr6_+_90439544 | 6.86 |
ENSMUST00000032174.12
|
Klf15
|
Kruppel-like factor 15 |
| chr17_+_25023263 | 6.71 |
ENSMUST00000234372.2
ENSMUST00000024972.7 |
Meiob
|
meiosis specific with OB domains |
| chr11_-_120618052 | 6.44 |
ENSMUST00000106148.10
ENSMUST00000026144.5 |
Dcxr
|
dicarbonyl L-xylulose reductase |
| chr5_+_115604321 | 6.36 |
ENSMUST00000145785.8
ENSMUST00000031495.11 ENSMUST00000112071.8 ENSMUST00000125568.2 |
Pla2g1b
|
phospholipase A2, group IB, pancreas |
| chr2_+_155223728 | 6.17 |
ENSMUST00000043237.14
ENSMUST00000174685.8 |
Trp53inp2
|
transformation related protein 53 inducible nuclear protein 2 |
| chr5_+_9163244 | 6.14 |
ENSMUST00000198935.2
|
Tmem243
|
transmembrane protein 243, mitochondrial |
| chr6_+_54016543 | 5.87 |
ENSMUST00000046856.14
|
Chn2
|
chimerin 2 |
| chr17_-_36207965 | 5.81 |
ENSMUST00000150056.2
ENSMUST00000156817.2 ENSMUST00000146451.8 ENSMUST00000148482.8 |
2310061I04Rik
|
RIKEN cDNA 2310061I04 gene |
| chr2_+_30156733 | 5.41 |
ENSMUST00000113645.8
ENSMUST00000133877.8 ENSMUST00000139719.8 ENSMUST00000113643.8 ENSMUST00000150695.8 |
Phyhd1
|
phytanoyl-CoA dioxygenase domain containing 1 |
| chr7_-_4633186 | 5.38 |
ENSMUST00000205360.2
ENSMUST00000206610.2 |
Tmem86b
|
transmembrane protein 86B |
| chr7_+_27879650 | 5.27 |
ENSMUST00000172467.8
|
Dyrk1b
|
dual-specificity tyrosine-(Y)-phosphorylation regulated kinase 1b |
| chr8_-_71085097 | 4.82 |
ENSMUST00000110103.2
|
Gdf15
|
growth differentiation factor 15 |
| chr7_+_28937859 | 4.59 |
ENSMUST00000108237.2
|
Yif1b
|
Yip1 interacting factor homolog B (S. cerevisiae) |
| chr1_-_131204651 | 4.57 |
ENSMUST00000161764.8
|
Ikbke
|
inhibitor of kappaB kinase epsilon |
| chr2_+_30156523 | 4.55 |
ENSMUST00000091132.13
|
Phyhd1
|
phytanoyl-CoA dioxygenase domain containing 1 |
| chr2_+_155224105 | 4.43 |
ENSMUST00000134218.2
|
Trp53inp2
|
transformation related protein 53 inducible nuclear protein 2 |
| chr6_+_54406588 | 4.41 |
ENSMUST00000132855.8
ENSMUST00000126637.8 |
Wipf3
|
WAS/WASL interacting protein family, member 3 |
| chr11_+_84070678 | 4.37 |
ENSMUST00000136463.9
|
Acaca
|
acetyl-Coenzyme A carboxylase alpha |
| chr9_+_77848556 | 4.36 |
ENSMUST00000134072.2
|
Elovl5
|
ELOVL family member 5, elongation of long chain fatty acids (yeast) |
| chr1_+_57416752 | 4.35 |
ENSMUST00000042734.3
|
1700066M21Rik
|
RIKEN cDNA 1700066M21 gene |
| chr4_-_115875055 | 4.17 |
ENSMUST00000049095.6
|
Faah
|
fatty acid amide hydrolase |
| chr1_+_24717968 | 4.16 |
ENSMUST00000095062.10
|
Lmbrd1
|
LMBR1 domain containing 1 |
| chr11_-_101010715 | 4.11 |
ENSMUST00000017946.6
|
Retreg3
|
reticulophagy regulator family member 3 |
| chr15_+_85716503 | 4.04 |
ENSMUST00000146088.8
|
Ttc38
|
tetratricopeptide repeat domain 38 |
| chr1_+_78635591 | 4.03 |
ENSMUST00000134566.8
ENSMUST00000142704.8 ENSMUST00000053760.12 |
Acsl3
Utp14b
|
acyl-CoA synthetase long-chain family member 3 UTP14B small subunit processome component |
| chr11_-_101010640 | 4.00 |
ENSMUST00000107295.10
|
Retreg3
|
reticulophagy regulator family member 3 |
| chr3_+_90421742 | 3.91 |
ENSMUST00000048138.8
|
S100a13
|
S100 calcium binding protein A13 |
| chr17_-_57023788 | 3.90 |
ENSMUST00000067931.7
|
Vmac
|
vimentin-type intermediate filament associated coiled-coil protein |
| chr8_-_106863423 | 3.83 |
ENSMUST00000146940.2
|
Esrp2
|
epithelial splicing regulatory protein 2 |
| chr8_-_106863521 | 3.77 |
ENSMUST00000115979.9
|
Esrp2
|
epithelial splicing regulatory protein 2 |
| chr11_+_84070593 | 3.69 |
ENSMUST00000137500.9
ENSMUST00000130012.9 |
Acaca
|
acetyl-Coenzyme A carboxylase alpha |
| chr2_-_65068917 | 3.61 |
ENSMUST00000090896.10
ENSMUST00000155082.2 |
Cobll1
|
Cobl-like 1 |
| chr9_-_63306497 | 3.57 |
ENSMUST00000168665.3
|
2300009A05Rik
|
RIKEN cDNA 2300009A05 gene |
| chr11_+_101010764 | 3.46 |
ENSMUST00000043680.9
|
Tubg1
|
tubulin, gamma 1 |
| chr5_+_124466146 | 3.45 |
ENSMUST00000111477.2
ENSMUST00000077376.3 |
2810006K23Rik
|
RIKEN cDNA 2810006K23 gene |
| chr7_-_118304930 | 3.38 |
ENSMUST00000207323.2
ENSMUST00000038791.15 |
Gde1
|
glycerophosphodiester phosphodiesterase 1 |
| chr4_-_63072367 | 3.36 |
ENSMUST00000030041.5
|
Ambp
|
alpha 1 microglobulin/bikunin precursor |
| chr17_+_28491085 | 3.25 |
ENSMUST00000169040.3
|
Ppard
|
peroxisome proliferator activator receptor delta |
| chr1_+_78635542 | 3.24 |
ENSMUST00000035779.15
|
Acsl3
|
acyl-CoA synthetase long-chain family member 3 |
| chr7_+_28937898 | 3.16 |
ENSMUST00000138128.3
ENSMUST00000142519.3 |
Yif1b
|
Yip1 interacting factor homolog B (S. cerevisiae) |
| chr14_-_20133246 | 3.11 |
ENSMUST00000059666.6
|
Saysd1
|
SAYSVFN motif domain containing 1 |
| chr2_-_65068960 | 3.07 |
ENSMUST00000112429.9
ENSMUST00000102726.8 ENSMUST00000112430.8 |
Cobll1
|
Cobl-like 1 |
| chr3_+_62327089 | 3.04 |
ENSMUST00000161057.2
|
Arhgef26
|
Rho guanine nucleotide exchange factor (GEF) 26 |
| chr13_+_102830104 | 2.97 |
ENSMUST00000172138.2
|
Cd180
|
CD180 antigen |
| chr7_-_133378468 | 2.96 |
ENSMUST00000033290.12
|
Dhx32
|
DEAH (Asp-Glu-Ala-His) box polypeptide 32 |
| chr14_+_47069667 | 2.83 |
ENSMUST00000140114.3
ENSMUST00000133989.8 |
Cgrrf1
|
cell growth regulator with ring finger domain 1 |
| chr6_+_124639990 | 2.80 |
ENSMUST00000004381.14
|
Lpcat3
|
lysophosphatidylcholine acyltransferase 3 |
| chr5_+_107479023 | 2.72 |
ENSMUST00000031215.15
ENSMUST00000112677.10 |
Brdt
|
bromodomain, testis-specific |
| chr7_-_19556612 | 2.59 |
ENSMUST00000120537.8
|
Bcl3
|
B cell leukemia/lymphoma 3 |
| chr7_+_28937746 | 2.57 |
ENSMUST00000108238.8
ENSMUST00000032809.10 |
Yif1b
|
Yip1 interacting factor homolog B (S. cerevisiae) |
| chr7_-_78432774 | 2.56 |
ENSMUST00000032841.7
|
Mrpl46
|
mitochondrial ribosomal protein L46 |
| chr10_-_67384898 | 2.54 |
ENSMUST00000075686.7
|
Ado
|
2-aminoethanethiol (cysteamine) dioxygenase |
| chrX_+_10583629 | 2.51 |
ENSMUST00000115524.8
ENSMUST00000008179.7 ENSMUST00000156321.2 |
Mid1ip1
|
Mid1 interacting protein 1 (gastrulation specific G12-like (zebrafish)) |
| chr4_-_119279551 | 2.47 |
ENSMUST00000106316.2
ENSMUST00000030385.13 |
Ppcs
|
phosphopantothenoylcysteine synthetase |
| chr18_-_9619460 | 2.43 |
ENSMUST00000234003.2
ENSMUST00000062769.7 |
Cetn1
|
centrin 1 |
| chr5_-_21850539 | 2.41 |
ENSMUST00000115234.2
|
Fbxl13
|
F-box and leucine-rich repeat protein 13 |
| chr7_+_114367971 | 2.38 |
ENSMUST00000117543.3
ENSMUST00000151464.2 |
Insc
|
INSC spindle orientation adaptor protein |
| chr1_-_14374794 | 2.36 |
ENSMUST00000190337.7
|
Eya1
|
EYA transcriptional coactivator and phosphatase 1 |
| chr4_-_152122891 | 2.26 |
ENSMUST00000030792.2
|
Tas1r1
|
taste receptor, type 1, member 1 |
| chr5_-_21850579 | 2.25 |
ENSMUST00000051358.11
|
Fbxl13
|
F-box and leucine-rich repeat protein 13 |
| chr2_-_160714749 | 2.25 |
ENSMUST00000176141.8
|
Zhx3
|
zinc fingers and homeoboxes 3 |
| chr1_-_14374842 | 2.22 |
ENSMUST00000188857.7
ENSMUST00000185453.7 |
Eya1
|
EYA transcriptional coactivator and phosphatase 1 |
| chr10_-_81436671 | 2.19 |
ENSMUST00000151858.8
ENSMUST00000142948.8 ENSMUST00000072020.9 |
Tle6
|
transducin-like enhancer of split 6 |
| chr1_-_131204422 | 2.19 |
ENSMUST00000159195.2
|
Ikbke
|
inhibitor of kappaB kinase epsilon |
| chr5_+_135038267 | 2.10 |
ENSMUST00000201890.2
ENSMUST00000154469.8 |
Abhd11
|
abhydrolase domain containing 11 |
| chr17_+_49735386 | 2.07 |
ENSMUST00000165390.9
ENSMUST00000024797.16 |
Mocs1
|
molybdenum cofactor synthesis 1 |
| chr7_+_141276575 | 2.07 |
ENSMUST00000185406.8
|
Muc2
|
mucin 2 |
| chrX_-_73689241 | 2.06 |
ENSMUST00000114119.2
|
Pwwp4c
|
PWWP domain containing 4C |
| chr7_+_141988714 | 1.96 |
ENSMUST00000118276.8
ENSMUST00000105976.8 ENSMUST00000097939.9 |
Syt8
|
synaptotagmin VIII |
| chr17_-_56525879 | 1.95 |
ENSMUST00000038794.6
|
Dpp9
|
dipeptidylpeptidase 9 |
| chr9_-_122673080 | 1.88 |
ENSMUST00000203176.3
ENSMUST00000203656.3 ENSMUST00000204619.2 |
Gm35549
|
predicted gene, 35549 |
| chr11_+_93886906 | 1.84 |
ENSMUST00000041956.14
|
Spag9
|
sperm associated antigen 9 |
| chr5_+_27109679 | 1.84 |
ENSMUST00000120555.8
|
Dpp6
|
dipeptidylpeptidase 6 |
| chr7_-_80020830 | 1.84 |
ENSMUST00000205436.2
ENSMUST00000098346.5 |
Man2a2
|
mannosidase 2, alpha 2 |
| chr11_+_95915366 | 1.82 |
ENSMUST00000103157.10
|
Gip
|
gastric inhibitory polypeptide |
| chrX_+_73636285 | 1.81 |
ENSMUST00000216108.2
ENSMUST00000216007.2 |
Olfr1325
|
olfactory receptor 1325 |
| chr17_+_49735413 | 1.81 |
ENSMUST00000173033.8
|
Mocs1
|
molybdenum cofactor synthesis 1 |
| chr15_+_65658874 | 1.80 |
ENSMUST00000015146.16
ENSMUST00000173858.8 ENSMUST00000172756.2 ENSMUST00000174856.7 |
Efr3a
|
EFR3 homolog A |
| chr7_+_49408847 | 1.77 |
ENSMUST00000085272.7
ENSMUST00000207895.2 |
Htatip2
|
HIV-1 Tat interactive protein 2 |
| chr3_+_89153704 | 1.68 |
ENSMUST00000168900.3
|
Krtcap2
|
keratinocyte associated protein 2 |
| chr9_-_35111172 | 1.68 |
ENSMUST00000176021.8
ENSMUST00000176531.8 ENSMUST00000176685.8 ENSMUST00000177129.8 |
Tirap
|
toll-interleukin 1 receptor (TIR) domain-containing adaptor protein |
| chr18_+_89215438 | 1.63 |
ENSMUST00000237110.2
|
Cd226
|
CD226 antigen |
| chr6_+_116185077 | 1.63 |
ENSMUST00000204051.2
|
Washc2
|
WASH complex subunit 2` |
| chr6_-_90201420 | 1.53 |
ENSMUST00000076086.3
|
Vmn1r53
|
vomeronasal 1 receptor 53 |
| chr2_-_86940289 | 1.49 |
ENSMUST00000215828.3
|
Olfr259
|
olfactory receptor 259 |
| chr8_+_14145848 | 1.46 |
ENSMUST00000152652.8
ENSMUST00000133298.8 |
Dlgap2
|
DLG associated protein 2 |
| chr18_+_39439778 | 1.45 |
ENSMUST00000235660.2
|
Arhgap26
|
Rho GTPase activating protein 26 |
| chr16_-_38370535 | 1.45 |
ENSMUST00000036210.7
|
Poglut1
|
protein O-glucosyltransferase 1 |
| chr7_+_78432867 | 1.44 |
ENSMUST00000032840.5
|
Mrps11
|
mitochondrial ribosomal protein S11 |
| chr3_+_89153258 | 1.43 |
ENSMUST00000040888.12
|
Krtcap2
|
keratinocyte associated protein 2 |
| chr9_+_65268304 | 1.42 |
ENSMUST00000147185.3
|
Ubap1l
|
ubiquitin-associated protein 1-like |
| chr17_+_27152276 | 1.40 |
ENSMUST00000237412.2
|
Phf1
|
PHD finger protein 1 |
| chr17_-_80022480 | 1.36 |
ENSMUST00000234361.2
|
Cyp1b1
|
cytochrome P450, family 1, subfamily b, polypeptide 1 |
| chr3_-_51316347 | 1.31 |
ENSMUST00000193279.2
ENSMUST00000038108.12 |
Ndufc1
|
NADH:ubiquinone oxidoreductase subunit C1 |
| chr16_-_17711950 | 1.30 |
ENSMUST00000155943.9
|
Dgcr2
|
DiGeorge syndrome critical region gene 2 |
| chr17_-_80022463 | 1.29 |
ENSMUST00000024894.2
|
Cyp1b1
|
cytochrome P450, family 1, subfamily b, polypeptide 1 |
| chr1_+_6285082 | 1.22 |
ENSMUST00000160062.8
|
Rb1cc1
|
RB1-inducible coiled-coil 1 |
| chr8_-_84963653 | 1.22 |
ENSMUST00000039480.7
|
Zswim4
|
zinc finger SWIM-type containing 4 |
| chr15_+_78761360 | 1.20 |
ENSMUST00000041587.8
|
Gga1
|
golgi associated, gamma adaptin ear containing, ARF binding protein 1 |
| chr13_-_100688949 | 1.19 |
ENSMUST00000159515.2
ENSMUST00000160859.8 ENSMUST00000069756.11 |
Ocln
|
occludin |
| chr16_-_37205302 | 1.19 |
ENSMUST00000114781.8
ENSMUST00000114780.8 |
Stxbp5l
|
syntaxin binding protein 5-like |
| chr1_+_192984278 | 1.18 |
ENSMUST00000016315.16
|
Lamb3
|
laminin, beta 3 |
| chr9_+_106337849 | 1.17 |
ENSMUST00000189099.2
|
Pcbp4
|
poly(rC) binding protein 4 |
| chrX_-_52610946 | 1.16 |
ENSMUST00000123034.3
|
4933416I08Rik
|
RIKEN cDNA 4933416I08 gene |
| chr2_-_157413189 | 1.15 |
ENSMUST00000173378.8
|
Blcap
|
bladder cancer associated protein |
| chr2_-_155676765 | 1.14 |
ENSMUST00000029143.7
ENSMUST00000239423.2 |
Fam83c
|
family with sequence similarity 83, member C |
| chr15_+_88484484 | 1.14 |
ENSMUST00000066949.9
|
Zdhhc25
|
zinc finger, DHHC domain containing 25 |
| chr16_+_17712061 | 1.09 |
ENSMUST00000046937.4
|
Tssk1
|
testis-specific serine kinase 1 |
| chr2_-_32977182 | 1.01 |
ENSMUST00000102810.10
|
Garnl3
|
GTPase activating RANGAP domain-like 3 |
| chr9_+_37119472 | 1.00 |
ENSMUST00000034632.10
|
Tmem218
|
transmembrane protein 218 |
| chr1_-_164285914 | 0.99 |
ENSMUST00000027863.13
|
Atp1b1
|
ATPase, Na+/K+ transporting, beta 1 polypeptide |
| chr2_+_153760311 | 0.99 |
ENSMUST00000109760.2
|
Bpifb3
|
BPI fold containing family B, member 3 |
| chr3_-_137892434 | 0.98 |
ENSMUST00000012186.9
ENSMUST00000199293.2 |
4930579F01Rik
|
RIKEN cDNA 4930579F01 gene |
| chr4_+_120389415 | 0.97 |
ENSMUST00000062990.4
|
Slfnl1
|
schlafen like 1 |
| chr7_-_102537358 | 0.96 |
ENSMUST00000078191.3
|
Olfr569
|
olfactory receptor 569 |
| chr9_+_38278192 | 0.94 |
ENSMUST00000216168.2
|
Olfr250
|
olfactory receptor 250 |
| chr6_+_116184991 | 0.93 |
ENSMUST00000036759.11
ENSMUST00000204476.3 |
Washc2
|
WASH complex subunit 2` |
| chr3_+_55154486 | 0.93 |
ENSMUST00000200348.2
|
Dclk1
|
doublecortin-like kinase 1 |
| chr3_-_89153135 | 0.91 |
ENSMUST00000041022.15
|
Trim46
|
tripartite motif-containing 46 |
| chr10_+_61253751 | 0.91 |
ENSMUST00000049339.7
|
Nodal
|
nodal |
| chrX_-_134985958 | 0.90 |
ENSMUST00000138878.2
ENSMUST00000080929.13 |
Nxf3
|
nuclear RNA export factor 3 |
| chr6_-_69969961 | 0.89 |
ENSMUST00000200160.5
ENSMUST00000103373.3 |
Igkv18-36
|
immunoglobulin kappa chain variable 18-36 |
| chr15_+_76238632 | 0.89 |
ENSMUST00000208833.3
|
Gm35339
|
predicted gene, 35339 |
| chr4_-_123217391 | 0.87 |
ENSMUST00000102640.2
|
Oxct2a
|
3-oxoacid CoA transferase 2A |
| chr2_+_131052283 | 0.87 |
ENSMUST00000110210.8
ENSMUST00000089506.12 ENSMUST00000110208.8 |
Ap5s1
|
adaptor-related protein 5 complex, sigma 1 subunit |
| chr7_-_44828962 | 0.84 |
ENSMUST00000211004.2
ENSMUST00000179443.3 |
Gfy
|
golgi-associated olfactory signaling regulator |
| chr1_+_135980639 | 0.83 |
ENSMUST00000112064.8
|
Cacna1s
|
calcium channel, voltage-dependent, L type, alpha 1S subunit |
| chr7_-_140367737 | 0.81 |
ENSMUST00000211616.2
ENSMUST00000026553.6 |
Syce1
|
synaptonemal complex central element protein 1 |
| chr5_+_31652079 | 0.81 |
ENSMUST00000076949.13
ENSMUST00000202394.4 |
Gpn1
|
GPN-loop GTPase 1 |
| chr14_-_101437750 | 0.80 |
ENSMUST00000187304.2
|
Prr30
|
proline rich 30 |
| chr13_+_23879775 | 0.79 |
ENSMUST00000041052.5
|
H1f6
|
H1.6 linker histone, cluster member |
| chr1_+_58750647 | 0.79 |
ENSMUST00000097722.9
ENSMUST00000114313.8 |
Cflar
|
CASP8 and FADD-like apoptosis regulator |
| chr7_+_37885660 | 0.78 |
ENSMUST00000179503.5
|
1600014C10Rik
|
RIKEN cDNA 1600014C10 gene |
| chr5_-_146521629 | 0.76 |
ENSMUST00000200112.2
ENSMUST00000197431.2 ENSMUST00000197825.2 |
Gpr12
|
G-protein coupled receptor 12 |
| chr14_+_53411782 | 0.74 |
ENSMUST00000197433.5
ENSMUST00000103590.4 |
Trav15n-1
|
T cell receptor alpha variable 15N-1 |
| chr13_+_112454981 | 0.74 |
ENSMUST00000223871.2
|
Ankrd55
|
ankyrin repeat domain 55 |
| chr1_+_66214431 | 0.74 |
ENSMUST00000156636.9
|
Map2
|
microtubule-associated protein 2 |
| chr1_+_135980508 | 0.73 |
ENSMUST00000112068.10
|
Cacna1s
|
calcium channel, voltage-dependent, L type, alpha 1S subunit |
| chr1_+_135980488 | 0.73 |
ENSMUST00000160641.8
|
Cacna1s
|
calcium channel, voltage-dependent, L type, alpha 1S subunit |
| chr1_+_131526977 | 0.72 |
ENSMUST00000027690.7
|
Avpr1b
|
arginine vasopressin receptor 1B |
| chr3_-_151960992 | 0.68 |
ENSMUST00000198750.5
|
Nexn
|
nexilin |
| chr7_+_139913930 | 0.66 |
ENSMUST00000214858.2
|
Olfr527
|
olfactory receptor 527 |
| chr15_-_89294434 | 0.66 |
ENSMUST00000109314.9
|
Syce3
|
synaptonemal complex central element protein 3 |
| chr15_-_98215234 | 0.65 |
ENSMUST00000216901.2
|
Olfr285
|
olfactory receptor 285 |
| chr5_-_146122114 | 0.65 |
ENSMUST00000073721.7
|
1700001J03Rik
|
RIKEN cDNA 1700001J03 gene |
| chr3_-_116217579 | 0.64 |
ENSMUST00000106491.7
ENSMUST00000090464.7 |
Cdc14a
|
CDC14 cell division cycle 14A |
| chr7_-_45375205 | 0.63 |
ENSMUST00000094424.7
|
Spaca4
|
sperm acrosome associated 4 |
| chr16_+_96295011 | 0.63 |
ENSMUST00000233816.2
|
Pcp4
|
Purkinje cell protein 4 |
| chr7_+_44984723 | 0.62 |
ENSMUST00000211327.2
|
Hrc
|
histidine rich calcium binding protein |
| chr6_-_24956296 | 0.61 |
ENSMUST00000127247.4
|
Tmem229a
|
transmembrane protein 229A |
| chr14_+_53279810 | 0.61 |
ENSMUST00000198439.5
ENSMUST00000103605.3 |
Trav8d-2
|
T cell receptor alpha variable 8D-2 |
| chr11_+_73051228 | 0.59 |
ENSMUST00000006104.10
ENSMUST00000135202.8 ENSMUST00000136894.3 |
P2rx5
|
purinergic receptor P2X, ligand-gated ion channel, 5 |
| chr3_-_95148909 | 0.58 |
ENSMUST00000090815.6
ENSMUST00000107197.2 |
Gm128
|
predicted gene 128 |
| chr17_-_56607286 | 0.58 |
ENSMUST00000097303.3
|
Arrdc5
|
arrestin domain containing 5 |
| chr2_+_131052421 | 0.57 |
ENSMUST00000110206.2
|
Ap5s1
|
adaptor-related protein 5 complex, sigma 1 subunit |
| chr16_-_37205277 | 0.56 |
ENSMUST00000114787.8
ENSMUST00000114782.8 ENSMUST00000114775.8 |
Stxbp5l
|
syntaxin binding protein 5-like |
| chr16_+_96006919 | 0.55 |
ENSMUST00000129904.3
|
Sh3bgr
|
SH3-binding domain glutamic acid-rich protein |
| chr5_-_144969564 | 0.55 |
ENSMUST00000071421.6
|
Gm4871
|
predicted gene 4871 |
| chr4_+_40472180 | 0.55 |
ENSMUST00000049655.3
|
Tmem215
|
transmembrane protein 215 |
| chr16_+_16688692 | 0.55 |
ENSMUST00000232547.2
|
Top3b
|
topoisomerase (DNA) III beta |
| chr17_-_34694911 | 0.55 |
ENSMUST00000065841.5
|
Btnl4
|
butyrophilin-like 4 |
| chr6_-_42524521 | 0.54 |
ENSMUST00000217978.2
|
Olfr455
|
olfactory receptor 455 |
| chr3_-_80820835 | 0.53 |
ENSMUST00000107743.8
ENSMUST00000029654.15 |
Glrb
|
glycine receptor, beta subunit |
| chr2_+_131048998 | 0.52 |
ENSMUST00000153097.3
|
Ap5s1
|
adaptor-related protein 5 complex, sigma 1 subunit |
| chr2_-_104679838 | 0.52 |
ENSMUST00000126824.2
|
Prrg4
|
proline rich Gla (G-carboxyglutamic acid) 4 (transmembrane) |
| chr14_+_54923655 | 0.50 |
ENSMUST00000038539.8
ENSMUST00000228027.2 |
1700123O20Rik
|
RIKEN cDNA 1700123O20 gene |
| chr7_+_112553162 | 0.48 |
ENSMUST00000182858.2
|
Rassf10
|
Ras association (RalGDS/AF-6) domain family (N-terminal) member 10 |
| chr7_+_43600038 | 0.47 |
ENSMUST00000072204.5
|
Klk1b8
|
kallikrein 1-related peptidase b8 |
| chr3_-_151960948 | 0.46 |
ENSMUST00000199423.5
ENSMUST00000198460.5 |
Nexn
|
nexilin |
| chr1_+_39026887 | 0.46 |
ENSMUST00000194552.2
|
Pdcl3
|
phosducin-like 3 |
| chr17_-_56607250 | 0.43 |
ENSMUST00000233911.2
|
Arrdc5
|
arrestin domain containing 5 |
| chr1_+_165123358 | 0.41 |
ENSMUST00000178700.8
|
Gpr161
|
G protein-coupled receptor 161 |
| chr2_-_13798843 | 0.40 |
ENSMUST00000003509.10
|
St8sia6
|
ST8 alpha-N-acetyl-neuraminide alpha-2,8-sialyltransferase 6 |
| chr10_-_128505096 | 0.40 |
ENSMUST00000238610.2
ENSMUST00000238712.2 |
Ikzf4
|
IKAROS family zinc finger 4 |
| chr1_+_153528689 | 0.37 |
ENSMUST00000041776.12
|
Rgs8
|
regulator of G-protein signaling 8 |
| chr5_+_32390031 | 0.34 |
ENSMUST00000202220.4
|
Plb1
|
phospholipase B1 |
| chr9_-_119652926 | 0.33 |
ENSMUST00000215718.2
|
Scn11a
|
sodium channel, voltage-gated, type XI, alpha |
| chr2_+_154065657 | 0.32 |
ENSMUST00000045959.8
|
Bpifb5
|
BPI fold containing family B, member 5 |
| chr17_-_37594351 | 0.30 |
ENSMUST00000216328.2
|
Olfr99
|
olfactory receptor 99 |
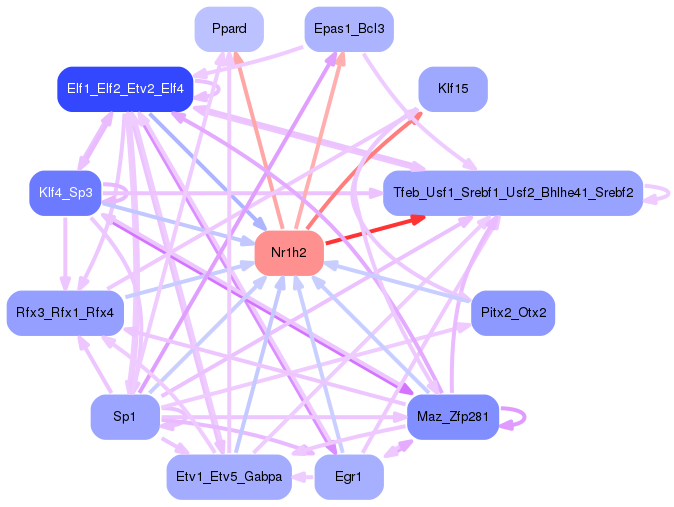
Network of associatons between targets according to the STRING database.

First level regulatory network of Nr1h2
Gene Ontology Analysis
Gene overrepresentation in biological process category:
| Log-likelihood per target | Total log-likelihood | Term | Description |
|---|---|---|---|
| 4.2 | 16.7 | GO:0046951 | ketone body biosynthetic process(GO:0046951) |
| 3.4 | 10.3 | GO:0006530 | asparagine catabolic process(GO:0006530) |
| 2.8 | 24.8 | GO:0046874 | quinolinate metabolic process(GO:0046874) |
| 2.1 | 6.4 | GO:0042732 | D-xylose metabolic process(GO:0042732) |
| 2.1 | 6.4 | GO:0044240 | multicellular organism lipid catabolic process(GO:0044240) |
| 2.0 | 14.3 | GO:0070779 | D-aspartate transport(GO:0070777) D-aspartate import(GO:0070779) |
| 1.8 | 7.3 | GO:0090004 | positive regulation of Golgi to plasma membrane protein transport(GO:0042998) positive regulation of establishment of protein localization to plasma membrane(GO:0090004) regulation of phosphatidylcholine biosynthetic process(GO:2001245) |
| 1.6 | 8.1 | GO:0044268 | multicellular organismal protein metabolic process(GO:0044268) |
| 1.5 | 9.2 | GO:0010730 | negative regulation of hydrogen peroxide biosynthetic process(GO:0010730) |
| 1.5 | 13.4 | GO:0003062 | regulation of heart rate by chemical signal(GO:0003062) |
| 1.4 | 11.4 | GO:0008611 | ether lipid biosynthetic process(GO:0008611) glycerol ether biosynthetic process(GO:0046504) ether biosynthetic process(GO:1901503) |
| 1.4 | 10.8 | GO:0009313 | ganglioside catabolic process(GO:0006689) oligosaccharide catabolic process(GO:0009313) |
| 1.2 | 49.0 | GO:0010866 | regulation of triglyceride biosynthetic process(GO:0010866) |
| 1.1 | 5.4 | GO:0046485 | ether lipid metabolic process(GO:0046485) |
| 1.0 | 4.2 | GO:0038016 | insulin receptor internalization(GO:0038016) |
| 1.0 | 6.9 | GO:0002317 | plasma cell differentiation(GO:0002317) |
| 0.9 | 2.7 | GO:0002930 | trabecular meshwork development(GO:0002930) endothelial cell-cell adhesion(GO:0071603) |
| 0.9 | 2.6 | GO:0045074 | interleukin-10 biosynthetic process(GO:0042091) regulation of interleukin-10 biosynthetic process(GO:0045074) |
| 0.8 | 7.8 | GO:0007168 | receptor guanylyl cyclase signaling pathway(GO:0007168) |
| 0.7 | 6.7 | GO:0007144 | female meiosis I(GO:0007144) |
| 0.7 | 5.5 | GO:0045919 | positive regulation of cytolysis(GO:0045919) |
| 0.6 | 9.2 | GO:1901387 | positive regulation of voltage-gated calcium channel activity(GO:1901387) |
| 0.6 | 13.5 | GO:0046415 | urate metabolic process(GO:0046415) |
| 0.6 | 1.8 | GO:0046021 | regulation of transcription from RNA polymerase II promoter, mitotic(GO:0046021) positive regulation of transcription from RNA polymerase II promoter during mitosis(GO:0046022) |
| 0.6 | 3.5 | GO:0072344 | rescue of stalled ribosome(GO:0072344) |
| 0.6 | 1.7 | GO:0032618 | interleukin-15 production(GO:0032618) |
| 0.6 | 3.9 | GO:0050703 | interleukin-1 alpha secretion(GO:0050703) |
| 0.5 | 3.9 | GO:0006777 | Mo-molybdopterin cofactor biosynthetic process(GO:0006777) Mo-molybdopterin cofactor metabolic process(GO:0019720) |
| 0.4 | 13.8 | GO:0072112 | renal filtration cell differentiation(GO:0061318) glomerular visceral epithelial cell differentiation(GO:0072112) glomerular epithelial cell differentiation(GO:0072311) |
| 0.4 | 4.6 | GO:0072513 | positive regulation of secondary heart field cardioblast proliferation(GO:0072513) |
| 0.4 | 3.2 | GO:0006776 | vitamin A metabolic process(GO:0006776) |
| 0.4 | 1.2 | GO:0061723 | glycophagy(GO:0061723) |
| 0.4 | 2.3 | GO:0050917 | sensory perception of umami taste(GO:0050917) |
| 0.4 | 4.4 | GO:0034625 | fatty acid elongation, saturated fatty acid(GO:0019367) fatty acid elongation, unsaturated fatty acid(GO:0019368) fatty acid elongation, monounsaturated fatty acid(GO:0034625) fatty acid elongation, polyunsaturated fatty acid(GO:0034626) |
| 0.3 | 1.0 | GO:1903281 | positive regulation of calcium:sodium antiporter activity(GO:1903281) |
| 0.3 | 7.2 | GO:0006309 | apoptotic DNA fragmentation(GO:0006309) |
| 0.3 | 0.9 | GO:0048320 | axial mesoderm formation(GO:0048320) |
| 0.3 | 1.8 | GO:0070094 | positive regulation of glucagon secretion(GO:0070094) |
| 0.3 | 2.3 | GO:0002074 | extraocular skeletal muscle development(GO:0002074) |
| 0.3 | 1.4 | GO:0061086 | negative regulation of histone H3-K27 methylation(GO:0061086) |
| 0.3 | 0.8 | GO:0044376 | RNA polymerase II complex import to nucleus(GO:0044376) RNA polymerase III complex localization to nucleus(GO:1990022) |
| 0.3 | 1.8 | GO:0002322 | B cell proliferation involved in immune response(GO:0002322) |
| 0.2 | 1.4 | GO:0018242 | protein O-linked glycosylation via serine(GO:0018242) |
| 0.2 | 3.4 | GO:0018298 | protein-chromophore linkage(GO:0018298) |
| 0.2 | 1.2 | GO:1902163 | negative regulation of DNA damage response, signal transduction by p53 class mediator resulting in transcription of p21 class mediator(GO:1902163) |
| 0.2 | 1.8 | GO:0090074 | negative regulation of protein homodimerization activity(GO:0090074) |
| 0.2 | 2.2 | GO:0060136 | embryonic process involved in female pregnancy(GO:0060136) |
| 0.2 | 0.8 | GO:0014732 | skeletal muscle atrophy(GO:0014732) negative regulation of myoblast fusion(GO:1901740) regulation of hepatocyte apoptotic process(GO:1903943) negative regulation of hepatocyte apoptotic process(GO:1903944) |
| 0.2 | 3.5 | GO:0000212 | meiotic spindle organization(GO:0000212) |
| 0.2 | 0.7 | GO:0001992 | regulation of systemic arterial blood pressure by vasopressin(GO:0001992) |
| 0.2 | 4.7 | GO:0051639 | actin filament network formation(GO:0051639) |
| 0.2 | 0.9 | GO:0046950 | cellular ketone body metabolic process(GO:0046950) |
| 0.2 | 1.8 | GO:0006013 | mannose metabolic process(GO:0006013) |
| 0.2 | 7.6 | GO:0060445 | branching involved in salivary gland morphogenesis(GO:0060445) |
| 0.1 | 4.8 | GO:1901739 | regulation of myoblast fusion(GO:1901739) positive regulation of myoblast fusion(GO:1901741) |
| 0.1 | 2.5 | GO:0015937 | coenzyme A biosynthetic process(GO:0015937) |
| 0.1 | 9.5 | GO:0055078 | sodium ion homeostasis(GO:0055078) |
| 0.1 | 6.8 | GO:0034340 | response to type I interferon(GO:0034340) |
| 0.1 | 3.0 | GO:0001886 | endothelial cell morphogenesis(GO:0001886) |
| 0.1 | 2.7 | GO:0007141 | male meiosis I(GO:0007141) |
| 0.1 | 2.1 | GO:0030277 | maintenance of gastrointestinal epithelium(GO:0030277) |
| 0.1 | 2.5 | GO:0045723 | positive regulation of fatty acid biosynthetic process(GO:0045723) |
| 0.1 | 10.9 | GO:0045600 | positive regulation of fat cell differentiation(GO:0045600) |
| 0.1 | 3.1 | GO:0018195 | peptidyl-arginine modification(GO:0018195) |
| 0.1 | 7.7 | GO:0019369 | arachidonic acid metabolic process(GO:0019369) |
| 0.1 | 3.7 | GO:0034308 | primary alcohol metabolic process(GO:0034308) |
| 0.1 | 1.2 | GO:0070673 | response to interleukin-18(GO:0070673) |
| 0.1 | 10.6 | GO:0000045 | autophagosome assembly(GO:0000045) |
| 0.1 | 5.3 | GO:0060612 | adipose tissue development(GO:0060612) |
| 0.1 | 9.9 | GO:0006888 | ER to Golgi vesicle-mediated transport(GO:0006888) |
| 0.1 | 0.5 | GO:0046116 | queuosine biosynthetic process(GO:0008616) queuosine metabolic process(GO:0046116) |
| 0.1 | 0.5 | GO:0097112 | gamma-aminobutyric acid receptor clustering(GO:0097112) |
| 0.1 | 1.2 | GO:0030262 | apoptotic nuclear changes(GO:0030262) |
| 0.1 | 1.4 | GO:0043162 | ubiquitin-dependent protein catabolic process via the multivesicular body sorting pathway(GO:0043162) |
| 0.1 | 0.8 | GO:0051324 | meiotic prophase I(GO:0007128) prophase(GO:0051324) |
| 0.1 | 0.6 | GO:0051256 | mitotic spindle midzone assembly(GO:0051256) |
| 0.1 | 1.1 | GO:0048739 | cardiac muscle fiber development(GO:0048739) |
| 0.1 | 0.6 | GO:0043416 | regulation of skeletal muscle tissue regeneration(GO:0043416) |
| 0.0 | 1.4 | GO:0000028 | ribosomal small subunit assembly(GO:0000028) |
| 0.0 | 0.3 | GO:0006933 | negative regulation of cell adhesion involved in substrate-bound cell migration(GO:0006933) |
| 0.0 | 0.6 | GO:0016998 | cell wall macromolecule catabolic process(GO:0016998) cell wall macromolecule metabolic process(GO:0044036) cell wall organization or biogenesis(GO:0071554) |
| 0.0 | 0.9 | GO:0016973 | poly(A)+ mRNA export from nucleus(GO:0016973) |
| 0.0 | 2.0 | GO:0007340 | acrosome reaction(GO:0007340) |
| 0.0 | 2.4 | GO:0060487 | lung epithelial cell differentiation(GO:0060487) |
| 0.0 | 0.6 | GO:0033603 | positive regulation of dopamine secretion(GO:0033603) |
| 0.0 | 4.2 | GO:0009062 | fatty acid catabolic process(GO:0009062) |
| 0.0 | 0.3 | GO:0045162 | clustering of voltage-gated sodium channels(GO:0045162) |
| 0.0 | 0.2 | GO:0001575 | globoside metabolic process(GO:0001575) |
| 0.0 | 0.3 | GO:2001205 | negative regulation of osteoclast development(GO:2001205) |
| 0.0 | 0.8 | GO:0097499 | protein localization to nonmotile primary cilium(GO:0097499) |
| 0.0 | 0.7 | GO:0007130 | synaptonemal complex assembly(GO:0007130) |
| 0.0 | 1.8 | GO:1901381 | positive regulation of potassium ion transmembrane transport(GO:1901381) |
| 0.0 | 0.4 | GO:1901621 | negative regulation of smoothened signaling pathway involved in dorsal/ventral neural tube patterning(GO:1901621) |
| 0.0 | 0.4 | GO:0001574 | ganglioside biosynthetic process(GO:0001574) |
| 0.0 | 0.9 | GO:0099612 | protein localization to axon(GO:0099612) |
| 0.0 | 1.3 | GO:0010257 | NADH dehydrogenase complex assembly(GO:0010257) mitochondrial respiratory chain complex I assembly(GO:0032981) mitochondrial respiratory chain complex I biogenesis(GO:0097031) |
| 0.0 | 1.7 | GO:0046676 | negative regulation of insulin secretion(GO:0046676) |
| 0.0 | 0.4 | GO:0060159 | regulation of dopamine receptor signaling pathway(GO:0060159) |
| 0.0 | 2.3 | GO:0045669 | positive regulation of osteoblast differentiation(GO:0045669) |
| 0.0 | 0.8 | GO:0051560 | mitochondrial calcium ion homeostasis(GO:0051560) |
| 0.0 | 1.2 | GO:1901998 | toxin transport(GO:1901998) |
| 0.0 | 0.9 | GO:0021952 | central nervous system projection neuron axonogenesis(GO:0021952) |
| 0.0 | 0.2 | GO:0071712 | ER-associated misfolded protein catabolic process(GO:0071712) |
| 0.0 | 2.0 | GO:0000724 | double-strand break repair via homologous recombination(GO:0000724) recombinational repair(GO:0000725) |
| 0.0 | 8.1 | GO:0010976 | positive regulation of neuron projection development(GO:0010976) |
| 0.0 | 0.6 | GO:0007026 | negative regulation of microtubule depolymerization(GO:0007026) |
| 0.0 | 2.8 | GO:0030308 | negative regulation of cell growth(GO:0030308) |
| 0.0 | 1.3 | GO:0019236 | response to pheromone(GO:0019236) |
Gene overrepresentation in cellular component category:
| Log-likelihood per target | Total log-likelihood | Term | Description |
|---|---|---|---|
| 1.3 | 3.9 | GO:0019008 | molybdopterin synthase complex(GO:0019008) |
| 1.1 | 4.4 | GO:0097447 | dendritic tree(GO:0097447) |
| 1.0 | 11.4 | GO:0042587 | glycogen granule(GO:0042587) |
| 0.5 | 2.6 | GO:0033257 | Bcl3/NF-kappaB2 complex(GO:0033257) |
| 0.4 | 3.5 | GO:0005827 | polar microtubule(GO:0005827) |
| 0.4 | 3.9 | GO:0045098 | type III intermediate filament(GO:0045098) |
| 0.3 | 10.4 | GO:0034706 | sodium channel complex(GO:0034706) |
| 0.3 | 7.8 | GO:0008074 | guanylate cyclase complex, soluble(GO:0008074) |
| 0.3 | 0.9 | GO:0042272 | nuclear RNA export factor complex(GO:0042272) |
| 0.3 | 3.1 | GO:0008250 | oligosaccharyltransferase complex(GO:0008250) |
| 0.2 | 14.3 | GO:0030673 | axolemma(GO:0030673) |
| 0.2 | 0.9 | GO:1990769 | proximal neuron projection(GO:1990769) |
| 0.2 | 9.9 | GO:0030134 | ER to Golgi transport vesicle(GO:0030134) |
| 0.2 | 9.2 | GO:0031430 | M band(GO:0031430) |
| 0.2 | 1.2 | GO:0005610 | laminin-5 complex(GO:0005610) |
| 0.2 | 16.7 | GO:0009925 | basal plasma membrane(GO:0009925) |
| 0.1 | 31.6 | GO:0005777 | peroxisome(GO:0005777) microbody(GO:0042579) |
| 0.1 | 1.5 | GO:0000801 | central element(GO:0000801) |
| 0.1 | 1.2 | GO:1990316 | ATG1/ULK1 kinase complex(GO:1990316) |
| 0.1 | 4.2 | GO:0045334 | clathrin-coated endocytic vesicle(GO:0045334) |
| 0.1 | 10.1 | GO:0005776 | autophagosome(GO:0005776) |
| 0.1 | 1.4 | GO:0000813 | ESCRT I complex(GO:0000813) |
| 0.1 | 1.0 | GO:0005890 | sodium:potassium-exchanging ATPase complex(GO:0005890) |
| 0.1 | 6.0 | GO:0000315 | organellar large ribosomal subunit(GO:0000315) mitochondrial large ribosomal subunit(GO:0005762) |
| 0.1 | 0.8 | GO:0031265 | CD95 death-inducing signaling complex(GO:0031265) |
| 0.1 | 6.4 | GO:0005881 | cytoplasmic microtubule(GO:0005881) |
| 0.1 | 3.2 | GO:0030119 | AP-type membrane coat adaptor complex(GO:0030119) |
| 0.1 | 0.6 | GO:0097442 | CA3 pyramidal cell dendrite(GO:0097442) |
| 0.1 | 2.6 | GO:0030904 | retromer complex(GO:0030904) |
| 0.1 | 0.6 | GO:0005883 | neurofilament(GO:0005883) |
| 0.1 | 1.8 | GO:0001533 | cornified envelope(GO:0001533) |
| 0.0 | 1.4 | GO:0035098 | ESC/E(Z) complex(GO:0035098) |
| 0.0 | 2.4 | GO:0032391 | photoreceptor connecting cilium(GO:0032391) |
| 0.0 | 12.9 | GO:0072562 | blood microparticle(GO:0072562) |
| 0.0 | 0.3 | GO:0008091 | spectrin(GO:0008091) |
| 0.0 | 33.7 | GO:0031966 | mitochondrial membrane(GO:0031966) |
| 0.0 | 1.4 | GO:0005763 | organellar small ribosomal subunit(GO:0000314) mitochondrial small ribosomal subunit(GO:0005763) |
| 0.0 | 1.2 | GO:0016327 | apicolateral plasma membrane(GO:0016327) |
| 0.0 | 2.3 | GO:0005891 | voltage-gated calcium channel complex(GO:0005891) |
| 0.0 | 0.6 | GO:0031229 | integral component of nuclear inner membrane(GO:0005639) intrinsic component of nuclear inner membrane(GO:0031229) |
| 0.0 | 1.4 | GO:0005788 | endoplasmic reticulum lumen(GO:0005788) |
| 0.0 | 1.8 | GO:0030672 | synaptic vesicle membrane(GO:0030672) exocytic vesicle membrane(GO:0099501) |
| 0.0 | 4.6 | GO:0032993 | protein-DNA complex(GO:0032993) |
| 0.0 | 3.9 | GO:0001650 | fibrillar center(GO:0001650) |
| 0.0 | 0.8 | GO:0030173 | integral component of Golgi membrane(GO:0030173) |
| 0.0 | 7.7 | GO:0005578 | proteinaceous extracellular matrix(GO:0005578) |
| 0.0 | 1.8 | GO:0008076 | voltage-gated potassium channel complex(GO:0008076) |
| 0.0 | 0.1 | GO:0000220 | vacuolar proton-transporting V-type ATPase, V0 domain(GO:0000220) |
| 0.0 | 0.4 | GO:0032809 | neuronal cell body membrane(GO:0032809) |
| 0.0 | 14.8 | GO:0005739 | mitochondrion(GO:0005739) |
Gene overrepresentation in molecular function category:
| Log-likelihood per target | Total log-likelihood | Term | Description |
|---|---|---|---|
| 3.8 | 11.4 | GO:0031177 | [acyl-carrier-protein] S-malonyltransferase activity(GO:0004314) oleoyl-[acyl-carrier-protein] hydrolase activity(GO:0004320) myristoyl-[acyl-carrier-protein] hydrolase activity(GO:0016295) palmitoyl-[acyl-carrier-protein] hydrolase activity(GO:0016296) acyl-[acyl-carrier-protein] hydrolase activity(GO:0016297) S-acetyltransferase activity(GO:0016418) S-malonyltransferase activity(GO:0016419) malonyltransferase activity(GO:0016420) phosphopantetheine binding(GO:0031177) |
| 3.4 | 10.3 | GO:0004067 | asparaginase activity(GO:0004067) |
| 2.4 | 14.3 | GO:0015501 | glutamate:sodium symporter activity(GO:0015501) |
| 2.2 | 13.4 | GO:0032810 | sterol response element binding(GO:0032810) |
| 2.2 | 10.8 | GO:0004563 | beta-N-acetylhexosaminidase activity(GO:0004563) |
| 1.6 | 8.1 | GO:0003989 | acetyl-CoA carboxylase activity(GO:0003989) |
| 1.4 | 7.2 | GO:0004531 | deoxyribonuclease II activity(GO:0004531) |
| 1.3 | 7.8 | GO:0016941 | natriuretic peptide receptor activity(GO:0016941) |
| 1.1 | 6.8 | GO:0008384 | IkappaB kinase activity(GO:0008384) |
| 1.1 | 16.7 | GO:0031957 | very long-chain fatty acid-CoA ligase activity(GO:0031957) |
| 1.1 | 3.2 | GO:0016501 | prostacyclin receptor activity(GO:0016501) |
| 1.1 | 24.3 | GO:0019825 | oxygen binding(GO:0019825) |
| 1.0 | 13.5 | GO:0016661 | oxidoreductase activity, acting on other nitrogenous compounds as donors(GO:0016661) |
| 0.8 | 3.4 | GO:0019862 | IgA binding(GO:0019862) |
| 0.8 | 10.0 | GO:0015280 | ligand-gated sodium channel activity(GO:0015280) |
| 0.7 | 6.4 | GO:0047498 | calcium-dependent phospholipase A2 activity(GO:0047498) |
| 0.7 | 3.5 | GO:0004045 | aminoacyl-tRNA hydrolase activity(GO:0004045) |
| 0.7 | 5.4 | GO:0016803 | ether hydrolase activity(GO:0016803) |
| 0.7 | 6.7 | GO:0008310 | single-stranded DNA 3'-5' exodeoxyribonuclease activity(GO:0008310) |
| 0.6 | 1.8 | GO:0004572 | mannosyl-oligosaccharide 1,3-1,6-alpha-mannosidase activity(GO:0004572) |
| 0.6 | 7.3 | GO:0004467 | long-chain fatty acid-CoA ligase activity(GO:0004467) |
| 0.5 | 1.4 | GO:0030158 | protein xylosyltransferase activity(GO:0030158) |
| 0.4 | 3.9 | GO:0050786 | RAGE receptor binding(GO:0050786) |
| 0.4 | 1.7 | GO:0035663 | Toll-like receptor 2 binding(GO:0035663) |
| 0.4 | 9.2 | GO:0044548 | S100 protein binding(GO:0044548) |
| 0.4 | 2.8 | GO:0047184 | 1-acylglycerophosphocholine O-acyltransferase activity(GO:0047184) |
| 0.4 | 4.2 | GO:0031419 | cobalamin binding(GO:0031419) |
| 0.4 | 4.4 | GO:0102337 | fatty acid elongase activity(GO:0009922) 3-oxo-arachidoyl-CoA synthase activity(GO:0102336) 3-oxo-cerotoyl-CoA synthase activity(GO:0102337) 3-oxo-lignoceronyl-CoA synthase activity(GO:0102338) |
| 0.3 | 3.4 | GO:0008889 | glycerophosphodiester phosphodiesterase activity(GO:0008889) |
| 0.3 | 3.1 | GO:0004576 | oligosaccharyl transferase activity(GO:0004576) dolichyl-diphosphooligosaccharide-protein glycotransferase activity(GO:0004579) |
| 0.3 | 0.9 | GO:0070698 | type I activin receptor binding(GO:0070698) |
| 0.3 | 2.4 | GO:0032795 | heterotrimeric G-protein binding(GO:0032795) |
| 0.3 | 2.7 | GO:0070330 | oxidoreductase activity, acting on paired donors, with incorporation or reduction of molecular oxygen, reduced flavin or flavoprotein as one donor, and incorporation of one atom of oxygen(GO:0016712) aromatase activity(GO:0070330) |
| 0.3 | 4.2 | GO:0047372 | acylglycerol lipase activity(GO:0047372) |
| 0.2 | 2.3 | GO:0008527 | taste receptor activity(GO:0008527) |
| 0.2 | 10.9 | GO:0005109 | frizzled binding(GO:0005109) |
| 0.2 | 0.9 | GO:0008260 | 3-oxoacid CoA-transferase activity(GO:0008260) |
| 0.2 | 3.9 | GO:0019215 | intermediate filament binding(GO:0019215) |
| 0.1 | 6.4 | GO:0016655 | oxidoreductase activity, acting on NAD(P)H, quinone or similar compound as acceptor(GO:0016655) |
| 0.1 | 6.7 | GO:0003785 | actin monomer binding(GO:0003785) |
| 0.1 | 2.6 | GO:0010314 | phosphatidylinositol-5-phosphate binding(GO:0010314) |
| 0.1 | 1.2 | GO:0030306 | ADP-ribosylation factor binding(GO:0030306) |
| 0.1 | 1.4 | GO:0070181 | small ribosomal subunit rRNA binding(GO:0070181) |
| 0.1 | 0.3 | GO:0050253 | retinyl-palmitate esterase activity(GO:0050253) |
| 0.1 | 7.7 | GO:0008395 | steroid hydroxylase activity(GO:0008395) |
| 0.1 | 12.5 | GO:0051213 | dioxygenase activity(GO:0051213) |
| 0.1 | 1.8 | GO:0048273 | MAP-kinase scaffold activity(GO:0005078) mitogen-activated protein kinase p38 binding(GO:0048273) |
| 0.1 | 3.9 | GO:0051539 | 4 iron, 4 sulfur cluster binding(GO:0051539) |
| 0.1 | 2.3 | GO:0008331 | high voltage-gated calcium channel activity(GO:0008331) |
| 0.1 | 2.7 | GO:0070577 | lysine-acetylated histone binding(GO:0070577) |
| 0.1 | 1.0 | GO:0005391 | sodium:potassium-exchanging ATPase activity(GO:0005391) |
| 0.1 | 0.7 | GO:0005000 | vasopressin receptor activity(GO:0005000) |
| 0.1 | 12.0 | GO:0043130 | ubiquitin binding(GO:0043130) |
| 0.1 | 0.5 | GO:0016934 | extracellular-glycine-gated ion channel activity(GO:0016933) extracellular-glycine-gated chloride channel activity(GO:0016934) |
| 0.1 | 4.8 | GO:0005160 | transforming growth factor beta receptor binding(GO:0005160) |
| 0.1 | 2.5 | GO:0016881 | acid-amino acid ligase activity(GO:0016881) |
| 0.1 | 0.6 | GO:0035381 | extracellular ATP-gated cation channel activity(GO:0004931) ATP-gated ion channel activity(GO:0035381) |
| 0.1 | 0.6 | GO:0005519 | cytoskeletal regulatory protein binding(GO:0005519) |
| 0.1 | 0.8 | GO:0031210 | phosphatidylcholine binding(GO:0031210) |
| 0.1 | 0.5 | GO:0008479 | queuine tRNA-ribosyltransferase activity(GO:0008479) |
| 0.1 | 0.8 | GO:0097200 | cysteine-type endopeptidase activity involved in execution phase of apoptosis(GO:0097200) |
| 0.0 | 0.6 | GO:0003796 | lysozyme activity(GO:0003796) |
| 0.0 | 7.2 | GO:0005178 | integrin binding(GO:0005178) |
| 0.0 | 59.1 | GO:0042803 | protein homodimerization activity(GO:0042803) |
| 0.0 | 0.2 | GO:0003831 | beta-N-acetylglucosaminylglycopeptide beta-1,4-galactosyltransferase activity(GO:0003831) |
| 0.0 | 1.1 | GO:0019706 | protein-cysteine S-palmitoyltransferase activity(GO:0019706) protein-cysteine S-acyltransferase activity(GO:0019707) |
| 0.0 | 2.0 | GO:0005544 | calcium-dependent phospholipid binding(GO:0005544) |
| 0.0 | 1.9 | GO:0004177 | aminopeptidase activity(GO:0004177) |
| 0.0 | 1.8 | GO:0016620 | oxidoreductase activity, acting on the aldehyde or oxo group of donors, NAD or NADP as acceptor(GO:0016620) |
| 0.0 | 9.7 | GO:0044822 | mRNA binding(GO:0003729) poly(A) RNA binding(GO:0044822) |
| 0.0 | 0.2 | GO:0004169 | dolichyl-phosphate-mannose-protein mannosyltransferase activity(GO:0004169) |
| 0.0 | 1.9 | GO:0004712 | protein serine/threonine/tyrosine kinase activity(GO:0004712) |
| 0.0 | 5.0 | GO:0017124 | SH3 domain binding(GO:0017124) |
| 0.0 | 1.1 | GO:0008307 | structural constituent of muscle(GO:0008307) |
| 0.0 | 1.8 | GO:0015459 | potassium channel regulator activity(GO:0015459) |
| 0.0 | 1.4 | GO:0035064 | methylated histone binding(GO:0035064) |
| 0.0 | 0.2 | GO:0015643 | toxic substance binding(GO:0015643) |
| 0.0 | 2.9 | GO:0004725 | protein tyrosine phosphatase activity(GO:0004725) |
| 0.0 | 1.2 | GO:0032947 | protein complex scaffold(GO:0032947) |
| 0.0 | 1.8 | GO:0005179 | hormone activity(GO:0005179) |
| 0.0 | 2.2 | GO:0030674 | protein binding, bridging(GO:0030674) |
| 0.0 | 1.3 | GO:0016503 | pheromone receptor activity(GO:0016503) |
| 0.0 | 0.3 | GO:0030506 | ankyrin binding(GO:0030506) |
| 0.0 | 0.3 | GO:0005248 | voltage-gated sodium channel activity(GO:0005248) |
Gene overrepresentation in curated gene sets: canonical pathways category:
| Log-likelihood per target | Total log-likelihood | Term | Description |
|---|---|---|---|
| 0.4 | 13.4 | SA CASPASE CASCADE | Apoptosis is mediated by caspases, cysteine proteases arranged in a proteolytic cascade. |
| 0.2 | 11.1 | PID DELTA NP63 PATHWAY | Validated transcriptional targets of deltaNp63 isoforms |
| 0.1 | 0.8 | SA FAS SIGNALING | The TNF-type receptor Fas induces apoptosis on ligand binding. |
| 0.1 | 3.2 | PID PS1 PATHWAY | Presenilin action in Notch and Wnt signaling |
| 0.1 | 1.2 | PID INTEGRIN4 PATHWAY | Alpha6 beta4 integrin-ligand interactions |
| 0.1 | 10.9 | WNT SIGNALING | Genes related to Wnt-mediated signal transduction |
| 0.1 | 2.6 | PID NFKAPPAB ATYPICAL PATHWAY | Atypical NF-kappaB pathway |
| 0.1 | 4.5 | PID TAP63 PATHWAY | Validated transcriptional targets of TAp63 isoforms |
| 0.1 | 5.9 | PID RAC1 REG PATHWAY | Regulation of RAC1 activity |
| 0.1 | 5.7 | PID FCER1 PATHWAY | Fc-epsilon receptor I signaling in mast cells |
| 0.1 | 1.7 | PID TOLL ENDOGENOUS PATHWAY | Endogenous TLR signaling |
| 0.0 | 9.0 | NABA ECM AFFILIATED | Genes encoding proteins affiliated structurally or functionally to extracellular matrix proteins |
| 0.0 | 2.3 | PID PLK1 PATHWAY | PLK1 signaling events |
| 0.0 | 1.5 | PID FAK PATHWAY | Signaling events mediated by focal adhesion kinase |
| 0.0 | 7.5 | NABA SECRETED FACTORS | Genes encoding secreted soluble factors |
| 0.0 | 1.2 | PID TGFBR PATHWAY | TGF-beta receptor signaling |
| 0.0 | 3.4 | NABA ECM REGULATORS | Genes encoding enzymes and their regulators involved in the remodeling of the extracellular matrix |
Gene overrepresentation in curated gene sets: REACTOME pathways category:
| Log-likelihood per target | Total log-likelihood | Term | Description |
|---|---|---|---|
| 1.8 | 24.8 | REACTOME TRYPTOPHAN CATABOLISM | Genes involved in Tryptophan catabolism |
| 1.5 | 16.7 | REACTOME RECYCLING OF BILE ACIDS AND SALTS | Genes involved in Recycling of bile acids and salts |
| 0.8 | 13.9 | REACTOME VITAMIN B5 PANTOTHENATE METABOLISM | Genes involved in Vitamin B5 (pantothenate) metabolism |
| 0.5 | 9.2 | REACTOME ACYL CHAIN REMODELLING OF PS | Genes involved in Acyl chain remodelling of PS |
| 0.5 | 19.7 | REACTOME FATTY ACYL COA BIOSYNTHESIS | Genes involved in Fatty Acyl-CoA Biosynthesis |
| 0.4 | 6.8 | REACTOME TRAF3 DEPENDENT IRF ACTIVATION PATHWAY | Genes involved in TRAF3-dependent IRF activation pathway |
| 0.3 | 13.4 | REACTOME RORA ACTIVATES CIRCADIAN EXPRESSION | Genes involved in RORA Activates Circadian Expression |
| 0.2 | 10.8 | REACTOME GLYCOSPHINGOLIPID METABOLISM | Genes involved in Glycosphingolipid metabolism |
| 0.2 | 3.5 | REACTOME RECRUITMENT OF NUMA TO MITOTIC CENTROSOMES | Genes involved in Recruitment of NuMA to mitotic centrosomes |
| 0.2 | 14.3 | REACTOME AMINO ACID AND OLIGOPEPTIDE SLC TRANSPORTERS | Genes involved in Amino acid and oligopeptide SLC transporters |
| 0.1 | 2.7 | REACTOME ENDOGENOUS STEROLS | Genes involved in Endogenous sterols |
| 0.1 | 2.3 | REACTOME CLASS C 3 METABOTROPIC GLUTAMATE PHEROMONE RECEPTORS | Genes involved in Class C/3 (Metabotropic glutamate/pheromone receptors) |
| 0.1 | 2.1 | REACTOME TERMINATION OF O GLYCAN BIOSYNTHESIS | Genes involved in Termination of O-glycan biosynthesis |
| 0.1 | 1.8 | REACTOME SYNTHESIS SECRETION AND INACTIVATION OF GIP | Genes involved in Synthesis, Secretion, and Inactivation of Glucose-dependent Insulinotropic Polypeptide (GIP) |
| 0.1 | 1.5 | REACTOME APOPTOTIC CLEAVAGE OF CELL ADHESION PROTEINS | Genes involved in Apoptotic cleavage of cell adhesion proteins |
| 0.1 | 3.9 | REACTOME METABOLISM OF VITAMINS AND COFACTORS | Genes involved in Metabolism of vitamins and cofactors |
| 0.0 | 0.8 | REACTOME EXTRINSIC PATHWAY FOR APOPTOSIS | Genes involved in Extrinsic Pathway for Apoptosis |
| 0.0 | 1.0 | REACTOME BASIGIN INTERACTIONS | Genes involved in Basigin interactions |
| 0.0 | 2.3 | REACTOME NCAM1 INTERACTIONS | Genes involved in NCAM1 interactions |
| 0.0 | 0.9 | REACTOME SIGNALING BY NODAL | Genes involved in Signaling by NODAL |
| 0.0 | 0.6 | REACTOME CONVERSION FROM APC C CDC20 TO APC C CDH1 IN LATE ANAPHASE | Genes involved in Conversion from APC/C:Cdc20 to APC/C:Cdh1 in late anaphase |
| 0.0 | 2.9 | REACTOME NUCLEAR RECEPTOR TRANSCRIPTION PATHWAY | Genes involved in Nuclear Receptor transcription pathway |
| 0.0 | 6.4 | REACTOME SIGNALING BY RHO GTPASES | Genes involved in Signaling by Rho GTPases |
| 0.0 | 1.4 | REACTOME PRE NOTCH EXPRESSION AND PROCESSING | Genes involved in Pre-NOTCH Expression and Processing |
| 0.0 | 0.4 | REACTOME N GLYCAN ANTENNAE ELONGATION | Genes involved in N-Glycan antennae elongation |
| 0.0 | 1.3 | REACTOME RESPIRATORY ELECTRON TRANSPORT | Genes involved in Respiratory electron transport |
| 0.0 | 0.5 | REACTOME LIGAND GATED ION CHANNEL TRANSPORT | Genes involved in Ligand-gated ion channel transport |