Project
Inflammatory response time course, HUVEC (Wada, 2009)
Navigation
Downloads
Results for ATF2_ATF1_ATF3
Z-value: 1.87
Motif logo
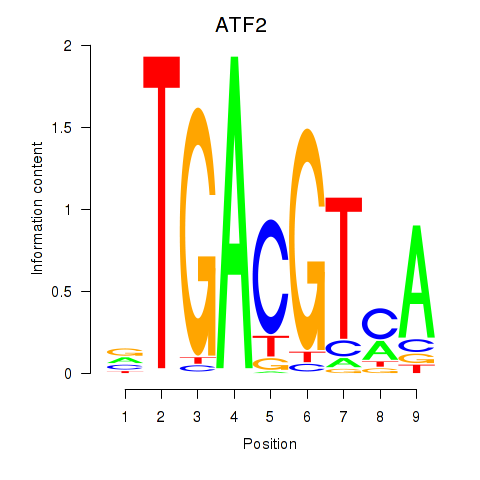
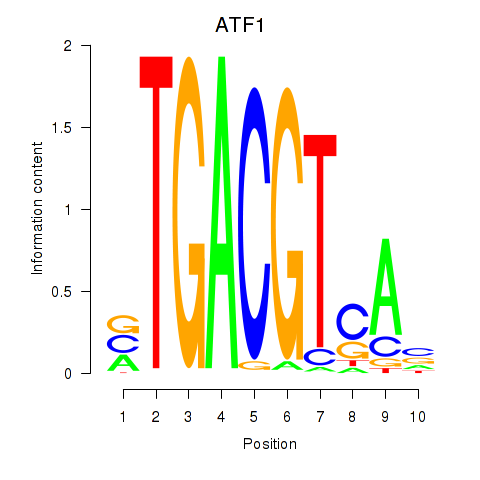
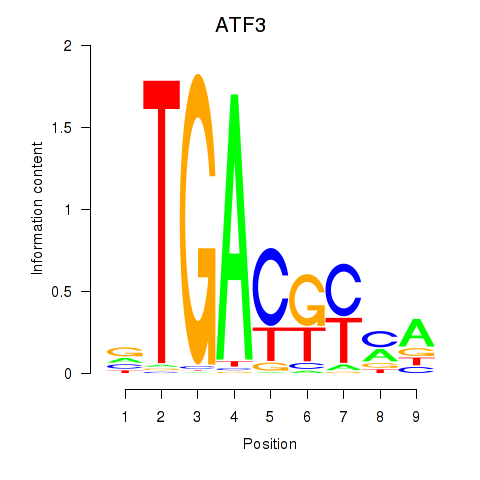
Transcription factors associated with ATF2_ATF1_ATF3
| Gene Symbol | Gene ID | Gene Info |
|---|---|---|
|
ATF2
|
ENSG00000115966.17 | ATF2 |
|
ATF1
|
ENSG00000123268.9 | ATF1 |
|
ATF3
|
ENSG00000162772.17 | ATF3 |
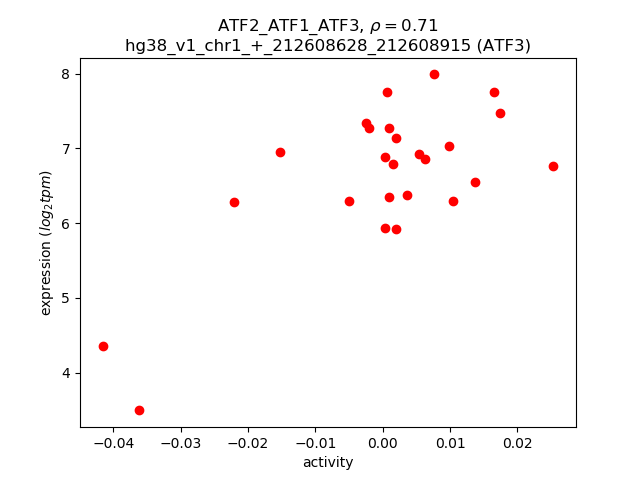
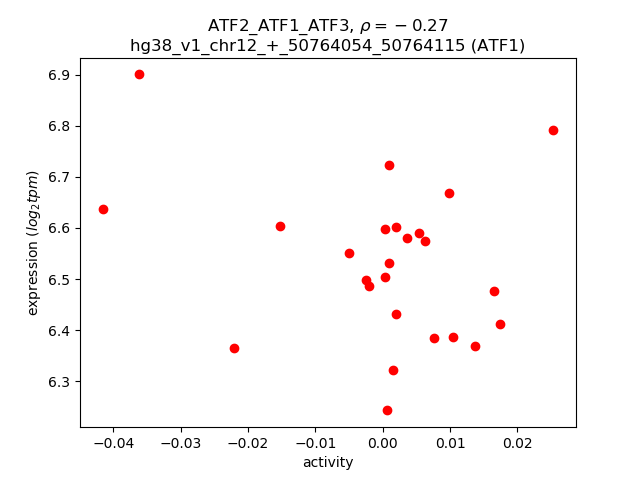
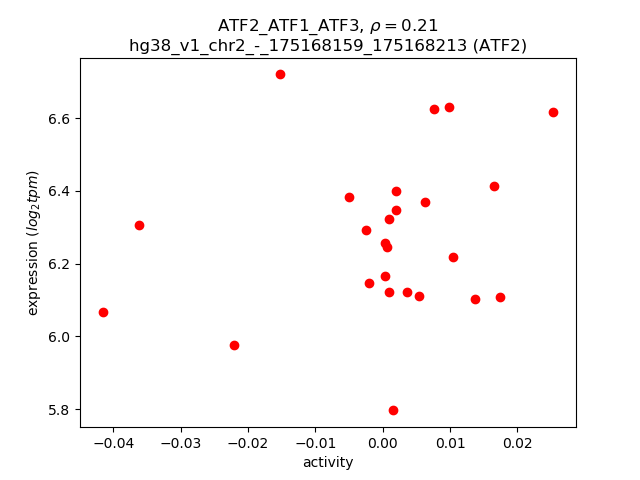
Activity-expression correlation:
| Gene | Promoter | Pearson corr. coef. | P-value | Plot |
|---|---|---|---|---|
| ATF3 | hg38_v1_chr1_+_212608628_212608915 | 0.71 | 6.4e-05 | Click! |
| ATF1 | hg38_v1_chr12_+_50764054_50764115 | -0.27 | 2.0e-01 | Click! |
| ATF2 | hg38_v1_chr2_-_175168159_175168213 | 0.21 | 3.1e-01 | Click! |
Activity profile of ATF2_ATF1_ATF3 motif
Sorted Z-values of ATF2_ATF1_ATF3 motif
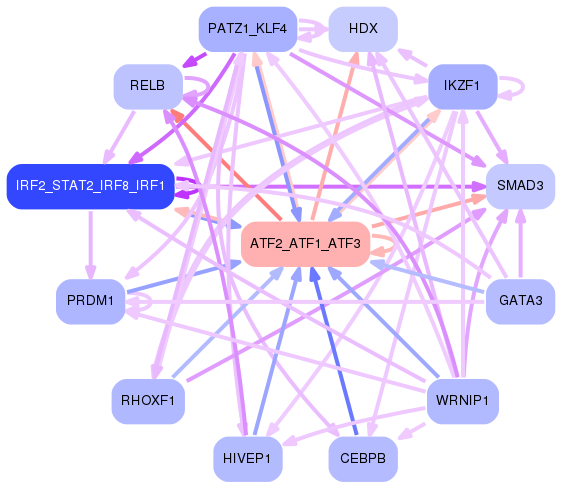
Network of associatons between targets according to the STRING database.

First level regulatory network of ATF2_ATF1_ATF3
Gene Ontology Analysis
Gene overrepresentation in biological process category:
| Log-likelihood per target | Total log-likelihood | Term | Description |
|---|---|---|---|
| 5.8 | 17.5 | GO:0048250 | mitochondrial iron ion transport(GO:0048250) |
| 4.9 | 19.7 | GO:1990108 | protein linear deubiquitination(GO:1990108) |
| 2.9 | 8.7 | GO:0009720 | detection of hormone stimulus(GO:0009720) |
| 2.5 | 9.8 | GO:0000738 | DNA catabolic process, exonucleolytic(GO:0000738) |
| 2.4 | 7.2 | GO:0034148 | regulation of toll-like receptor 5 signaling pathway(GO:0034147) negative regulation of toll-like receptor 5 signaling pathway(GO:0034148) negative regulation of nucleotide-binding oligomerization domain containing 1 signaling pathway(GO:0070429) |
| 1.8 | 7.3 | GO:1902568 | positive regulation of eosinophil degranulation(GO:0043311) positive regulation of eosinophil activation(GO:1902568) |
| 1.5 | 4.4 | GO:1902524 | positive regulation of protein K48-linked ubiquitination(GO:1902524) |
| 1.3 | 3.9 | GO:1902269 | positive regulation of polyamine transmembrane transport(GO:1902269) |
| 1.1 | 4.4 | GO:0070427 | positive regulation of immature T cell proliferation(GO:0033091) nucleotide-binding oligomerization domain containing 1 signaling pathway(GO:0070427) |
| 1.1 | 7.5 | GO:0090074 | negative regulation of protein homodimerization activity(GO:0090074) |
| 1.0 | 3.1 | GO:0045645 | regulation of eosinophil differentiation(GO:0045643) positive regulation of eosinophil differentiation(GO:0045645) |
| 1.0 | 8.2 | GO:0044375 | regulation of peroxisome size(GO:0044375) |
| 1.0 | 3.0 | GO:0051463 | negative regulation of cortisol secretion(GO:0051463) |
| 1.0 | 8.0 | GO:0014916 | regulation of lung blood pressure(GO:0014916) |
| 1.0 | 4.0 | GO:1904744 | positive regulation of telomeric DNA binding(GO:1904744) |
| 1.0 | 3.0 | GO:0046967 | cytosol to ER transport(GO:0046967) |
| 0.9 | 2.7 | GO:0038156 | interleukin-5-mediated signaling pathway(GO:0038043) interleukin-3-mediated signaling pathway(GO:0038156) |
| 0.9 | 5.4 | GO:2000301 | negative regulation of synaptic vesicle exocytosis(GO:2000301) |
| 0.9 | 4.5 | GO:0097368 | establishment of Sertoli cell barrier(GO:0097368) |
| 0.8 | 3.4 | GO:0002541 | activation of plasma proteins involved in acute inflammatory response(GO:0002541) |
| 0.8 | 0.8 | GO:0045053 | protein retention in Golgi apparatus(GO:0045053) |
| 0.8 | 2.3 | GO:0070407 | oxidation-dependent protein catabolic process(GO:0070407) |
| 0.7 | 2.2 | GO:0061394 | regulation of transcription from RNA polymerase II promoter in response to arsenic-containing substance(GO:0061394) |
| 0.7 | 2.2 | GO:0007518 | myoblast fate determination(GO:0007518) |
| 0.7 | 3.0 | GO:0002879 | positive regulation of acute inflammatory response to non-antigenic stimulus(GO:0002879) |
| 0.7 | 4.2 | GO:2000234 | positive regulation of ribosome biogenesis(GO:0090070) positive regulation of rRNA processing(GO:2000234) |
| 0.7 | 2.8 | GO:1904924 | negative regulation of mitophagy in response to mitochondrial depolarization(GO:1904924) |
| 0.7 | 4.1 | GO:1900369 | negative regulation of RNA interference(GO:1900369) |
| 0.6 | 5.7 | GO:2000286 | receptor internalization involved in canonical Wnt signaling pathway(GO:2000286) |
| 0.6 | 4.4 | GO:0007000 | nucleolus organization(GO:0007000) |
| 0.6 | 5.5 | GO:0061052 | negative regulation of cell growth involved in cardiac muscle cell development(GO:0061052) |
| 0.6 | 2.4 | GO:2000681 | negative regulation of rubidium ion transport(GO:2000681) negative regulation of rubidium ion transmembrane transporter activity(GO:2000687) |
| 0.6 | 2.4 | GO:0032730 | positive regulation of interleukin-1 alpha production(GO:0032730) |
| 0.6 | 1.7 | GO:0014028 | notochord formation(GO:0014028) axial mesoderm formation(GO:0048320) negative regulation of lymphangiogenesis(GO:1901491) |
| 0.6 | 1.7 | GO:1904692 | positive regulation of type B pancreatic cell proliferation(GO:1904692) |
| 0.6 | 2.9 | GO:0030035 | microspike assembly(GO:0030035) |
| 0.6 | 3.4 | GO:1903553 | positive regulation of extracellular exosome assembly(GO:1903553) |
| 0.5 | 1.6 | GO:0090176 | microtubule cytoskeleton organization involved in establishment of planar polarity(GO:0090176) |
| 0.5 | 2.7 | GO:0021764 | amygdala development(GO:0021764) |
| 0.5 | 1.6 | GO:1901252 | regulation of intracellular transport of viral material(GO:1901252) negative regulation of intracellular transport of viral material(GO:1901253) |
| 0.5 | 1.0 | GO:1903774 | positive regulation of viral budding via host ESCRT complex(GO:1903774) |
| 0.5 | 1.5 | GO:0090187 | positive regulation of pancreatic juice secretion(GO:0090187) |
| 0.5 | 1.5 | GO:0060459 | subthalamic nucleus development(GO:0021763) prolactin secreting cell differentiation(GO:0060127) left lung development(GO:0060459) left lung morphogenesis(GO:0060460) superior vena cava morphogenesis(GO:0060578) |
| 0.5 | 1.9 | GO:1902963 | regulation of metalloendopeptidase activity involved in amyloid precursor protein catabolic process(GO:1902962) negative regulation of metalloendopeptidase activity involved in amyloid precursor protein catabolic process(GO:1902963) |
| 0.5 | 1.4 | GO:1902724 | negative regulation of hydrogen peroxide biosynthetic process(GO:0010730) positive regulation of skeletal muscle cell proliferation(GO:0014858) positive regulation of skeletal muscle satellite cell proliferation(GO:1902724) positive regulation of growth factor dependent skeletal muscle satellite cell proliferation(GO:1902728) |
| 0.5 | 1.4 | GO:1903537 | meiotic spindle elongation(GO:0051232) meiotic cell cycle process involved in oocyte maturation(GO:1903537) regulation of meiotic cell cycle process involved in oocyte maturation(GO:1903538) |
| 0.5 | 1.8 | GO:1904800 | negative regulation of dendrite extension(GO:1903860) regulation of neuron remodeling(GO:1904799) negative regulation of neuron remodeling(GO:1904800) negative regulation of branching morphogenesis of a nerve(GO:2000173) |
| 0.5 | 4.1 | GO:0038110 | interleukin-2-mediated signaling pathway(GO:0038110) |
| 0.5 | 1.4 | GO:0019287 | isopentenyl diphosphate biosynthetic process, mevalonate pathway(GO:0019287) |
| 0.4 | 2.6 | GO:0000973 | posttranscriptional tethering of RNA polymerase II gene DNA at nuclear periphery(GO:0000973) |
| 0.4 | 10.8 | GO:0002523 | leukocyte migration involved in inflammatory response(GO:0002523) |
| 0.4 | 6.0 | GO:0032688 | negative regulation of interferon-beta production(GO:0032688) |
| 0.4 | 1.3 | GO:0071962 | mitotic sister chromatid cohesion, centromeric(GO:0071962) |
| 0.4 | 1.2 | GO:2000777 | positive regulation of proteasomal ubiquitin-dependent protein catabolic process involved in cellular response to hypoxia(GO:2000777) |
| 0.4 | 5.4 | GO:0019344 | cysteine biosynthetic process(GO:0019344) |
| 0.4 | 0.4 | GO:0003350 | pulmonary myocardium development(GO:0003350) |
| 0.4 | 1.2 | GO:0006117 | acetaldehyde metabolic process(GO:0006117) |
| 0.4 | 1.6 | GO:0052651 | monoacylglycerol metabolic process(GO:0046462) monoacylglycerol catabolic process(GO:0052651) |
| 0.4 | 1.2 | GO:0002528 | regulation of vascular permeability involved in acute inflammatory response(GO:0002528) |
| 0.4 | 1.2 | GO:1903644 | regulation of chaperone-mediated protein folding(GO:1903644) |
| 0.4 | 1.6 | GO:0002268 | follicular dendritic cell differentiation(GO:0002268) |
| 0.4 | 6.5 | GO:0032625 | interleukin-21 production(GO:0032625) interleukin-21 secretion(GO:0072619) |
| 0.4 | 1.5 | GO:1903070 | negative regulation of ER-associated ubiquitin-dependent protein catabolic process(GO:1903070) |
| 0.4 | 2.9 | GO:0009838 | abscission(GO:0009838) |
| 0.4 | 2.2 | GO:0034773 | histone H4-K20 trimethylation(GO:0034773) |
| 0.4 | 2.2 | GO:2001180 | negative regulation of interleukin-10 secretion(GO:2001180) |
| 0.4 | 1.4 | GO:1903898 | negative regulation of PERK-mediated unfolded protein response(GO:1903898) negative regulation of endoplasmic reticulum stress-induced eIF2 alpha phosphorylation(GO:1903912) |
| 0.4 | 1.1 | GO:0019046 | release from viral latency(GO:0019046) |
| 0.3 | 1.0 | GO:1904580 | regulation of intracellular mRNA localization(GO:1904580) positive regulation of intracellular mRNA localization(GO:1904582) |
| 0.3 | 2.4 | GO:2001137 | positive regulation of endocytic recycling(GO:2001137) |
| 0.3 | 4.4 | GO:0046940 | nucleoside monophosphate phosphorylation(GO:0046940) |
| 0.3 | 1.7 | GO:0045204 | MAPK export from nucleus(GO:0045204) |
| 0.3 | 3.7 | GO:0010040 | response to iron(II) ion(GO:0010040) |
| 0.3 | 1.0 | GO:2000097 | regulation of smooth muscle cell-matrix adhesion(GO:2000097) |
| 0.3 | 1.3 | GO:0090086 | negative regulation of protein deubiquitination(GO:0090086) |
| 0.3 | 3.0 | GO:1900242 | regulation of synaptic vesicle endocytosis(GO:1900242) |
| 0.3 | 1.0 | GO:0034471 | endonucleolytic cleavage to generate mature 5'-end of SSU-rRNA from (SSU-rRNA, 5.8S rRNA, LSU-rRNA)(GO:0000472) rRNA 5'-end processing(GO:0000967) ncRNA 5'-end processing(GO:0034471) |
| 0.3 | 1.3 | GO:1901842 | negative regulation of high voltage-gated calcium channel activity(GO:1901842) |
| 0.3 | 1.9 | GO:0008628 | hormone-mediated apoptotic signaling pathway(GO:0008628) |
| 0.3 | 3.5 | GO:0042256 | mature ribosome assembly(GO:0042256) |
| 0.3 | 5.0 | GO:1902237 | positive regulation of endoplasmic reticulum stress-induced intrinsic apoptotic signaling pathway(GO:1902237) |
| 0.3 | 4.7 | GO:0002315 | marginal zone B cell differentiation(GO:0002315) |
| 0.3 | 0.9 | GO:0035574 | histone H4-K20 demethylation(GO:0035574) |
| 0.3 | 4.9 | GO:0021796 | cerebral cortex regionalization(GO:0021796) |
| 0.3 | 1.2 | GO:0043314 | negative regulation of neutrophil degranulation(GO:0043314) |
| 0.3 | 0.9 | GO:0060723 | spongiotrophoblast cell proliferation(GO:0060720) regulation of spongiotrophoblast cell proliferation(GO:0060721) cell proliferation involved in embryonic placenta development(GO:0060722) regulation of cell proliferation involved in embryonic placenta development(GO:0060723) |
| 0.3 | 9.5 | GO:0042730 | fibrinolysis(GO:0042730) |
| 0.3 | 1.2 | GO:0018125 | peptidyl-cysteine methylation(GO:0018125) |
| 0.3 | 7.7 | GO:0051923 | sulfation(GO:0051923) |
| 0.3 | 1.3 | GO:1903527 | positive regulation of membrane tubulation(GO:1903527) |
| 0.3 | 1.6 | GO:0090669 | telomerase RNA stabilization(GO:0090669) |
| 0.3 | 0.8 | GO:0003221 | right ventricular cardiac muscle tissue morphogenesis(GO:0003221) |
| 0.3 | 1.0 | GO:0009298 | GDP-mannose biosynthetic process(GO:0009298) |
| 0.3 | 1.8 | GO:0035616 | histone H2B conserved C-terminal lysine deubiquitination(GO:0035616) |
| 0.3 | 2.1 | GO:1902748 | positive regulation of lens fiber cell differentiation(GO:1902748) |
| 0.3 | 0.5 | GO:1902263 | apoptotic process involved in embryonic digit morphogenesis(GO:1902263) |
| 0.3 | 1.0 | GO:0061034 | olfactory bulb mitral cell layer development(GO:0061034) |
| 0.3 | 0.8 | GO:0070625 | zymogen granule exocytosis(GO:0070625) |
| 0.2 | 3.2 | GO:0030854 | positive regulation of granulocyte differentiation(GO:0030854) |
| 0.2 | 1.7 | GO:0060373 | regulation of ventricular cardiac muscle cell membrane depolarization(GO:0060373) |
| 0.2 | 0.7 | GO:0071898 | regulation of estrogen receptor binding(GO:0071898) negative regulation of estrogen receptor binding(GO:0071899) |
| 0.2 | 1.4 | GO:0033490 | cholesterol biosynthetic process via desmosterol(GO:0033489) cholesterol biosynthetic process via lathosterol(GO:0033490) |
| 0.2 | 5.5 | GO:0034356 | NAD biosynthesis via nicotinamide riboside salvage pathway(GO:0034356) |
| 0.2 | 0.9 | GO:1904640 | response to methionine(GO:1904640) |
| 0.2 | 1.1 | GO:1903826 | arginine transmembrane transport(GO:1903826) |
| 0.2 | 0.9 | GO:0043605 | cellular amide catabolic process(GO:0043605) |
| 0.2 | 0.7 | GO:0001827 | inner cell mass cell fate commitment(GO:0001827) |
| 0.2 | 1.4 | GO:1903378 | positive regulation of oxidative stress-induced neuron intrinsic apoptotic signaling pathway(GO:1903378) |
| 0.2 | 1.8 | GO:1902219 | negative regulation of intrinsic apoptotic signaling pathway in response to osmotic stress(GO:1902219) |
| 0.2 | 0.2 | GO:0018307 | enzyme active site formation(GO:0018307) |
| 0.2 | 2.2 | GO:0061732 | mitochondrial acetyl-CoA biosynthetic process from pyruvate(GO:0061732) |
| 0.2 | 2.2 | GO:0051106 | positive regulation of DNA ligation(GO:0051106) |
| 0.2 | 1.3 | GO:0051012 | microtubule sliding(GO:0051012) |
| 0.2 | 1.7 | GO:1902525 | regulation of protein monoubiquitination(GO:1902525) |
| 0.2 | 1.3 | GO:0060356 | leucine import(GO:0060356) |
| 0.2 | 5.4 | GO:0043162 | ubiquitin-dependent protein catabolic process via the multivesicular body sorting pathway(GO:0043162) |
| 0.2 | 0.8 | GO:0001897 | cytolysis by symbiont of host cells(GO:0001897) cytolysis in other organism involved in symbiotic interaction(GO:0051801) |
| 0.2 | 2.1 | GO:0061734 | parkin-mediated mitophagy in response to mitochondrial depolarization(GO:0061734) |
| 0.2 | 1.0 | GO:0048619 | embryonic hindgut morphogenesis(GO:0048619) |
| 0.2 | 0.6 | GO:1901675 | negative regulation of histone H3-K27 acetylation(GO:1901675) |
| 0.2 | 10.5 | GO:0007214 | gamma-aminobutyric acid signaling pathway(GO:0007214) |
| 0.2 | 4.5 | GO:0046855 | phosphorylated carbohydrate dephosphorylation(GO:0046838) inositol phosphate dephosphorylation(GO:0046855) |
| 0.2 | 1.0 | GO:2000382 | positive regulation of mesoderm development(GO:2000382) |
| 0.2 | 2.6 | GO:0007042 | lysosomal lumen acidification(GO:0007042) |
| 0.2 | 0.2 | GO:1903973 | negative regulation of macrophage colony-stimulating factor signaling pathway(GO:1902227) negative regulation of response to macrophage colony-stimulating factor(GO:1903970) negative regulation of cellular response to macrophage colony-stimulating factor stimulus(GO:1903973) |
| 0.2 | 0.4 | GO:1903722 | regulation of centriole elongation(GO:1903722) |
| 0.2 | 0.6 | GO:0032827 | natural killer cell differentiation involved in immune response(GO:0002325) negative regulation of natural killer cell differentiation(GO:0032824) regulation of natural killer cell differentiation involved in immune response(GO:0032826) negative regulation of natural killer cell differentiation involved in immune response(GO:0032827) |
| 0.2 | 0.6 | GO:1900042 | positive regulation of interleukin-2 secretion(GO:1900042) |
| 0.2 | 0.6 | GO:1903207 | neuron death in response to hydrogen peroxide(GO:0036476) regulation of hydrogen peroxide-induced neuron death(GO:1903207) negative regulation of hydrogen peroxide-induced neuron death(GO:1903208) |
| 0.2 | 2.9 | GO:0033327 | Leydig cell differentiation(GO:0033327) |
| 0.2 | 0.6 | GO:0001983 | regulation of systemic arterial blood pressure by carotid sinus baroreceptor feedback(GO:0001978) baroreceptor response to increased systemic arterial blood pressure(GO:0001983) |
| 0.2 | 0.6 | GO:0000912 | assembly of actomyosin apparatus involved in cytokinesis(GO:0000912) actomyosin contractile ring assembly(GO:0000915) actomyosin contractile ring organization(GO:0044837) |
| 0.2 | 0.9 | GO:1900378 | positive regulation of melanin biosynthetic process(GO:0048023) positive regulation of secondary metabolite biosynthetic process(GO:1900378) |
| 0.2 | 0.8 | GO:0009443 | pyridoxal 5'-phosphate salvage(GO:0009443) |
| 0.2 | 0.7 | GO:0098957 | anterograde axonal transport of mitochondrion(GO:0098957) |
| 0.2 | 0.7 | GO:0006408 | snRNA export from nucleus(GO:0006408) positive regulation of RNA export from nucleus(GO:0046833) |
| 0.2 | 0.4 | GO:0052199 | negative regulation of catalytic activity in other organism involved in symbiotic interaction(GO:0052199) |
| 0.2 | 16.8 | GO:0010803 | regulation of tumor necrosis factor-mediated signaling pathway(GO:0010803) |
| 0.2 | 0.7 | GO:0000451 | rRNA 2'-O-methylation(GO:0000451) |
| 0.2 | 1.1 | GO:0072719 | cellular response to cisplatin(GO:0072719) |
| 0.2 | 2.4 | GO:0032782 | bile acid secretion(GO:0032782) |
| 0.2 | 2.2 | GO:0035845 | photoreceptor cell outer segment organization(GO:0035845) |
| 0.2 | 0.5 | GO:0061386 | closure of optic fissure(GO:0061386) |
| 0.2 | 1.4 | GO:1900748 | positive regulation of vascular endothelial growth factor signaling pathway(GO:1900748) |
| 0.2 | 1.6 | GO:0098779 | mitophagy in response to mitochondrial depolarization(GO:0098779) |
| 0.2 | 0.4 | GO:0010767 | regulation of transcription from RNA polymerase II promoter in response to UV-induced DNA damage(GO:0010767) |
| 0.2 | 2.1 | GO:0032306 | regulation of prostaglandin secretion(GO:0032306) positive regulation of prostaglandin secretion(GO:0032308) |
| 0.2 | 0.5 | GO:0044205 | 'de novo' UMP biosynthetic process(GO:0044205) |
| 0.2 | 2.1 | GO:0008635 | activation of cysteine-type endopeptidase activity involved in apoptotic process by cytochrome c(GO:0008635) |
| 0.2 | 0.9 | GO:0071918 | urea transmembrane transport(GO:0071918) |
| 0.2 | 0.7 | GO:0034184 | positive regulation of maintenance of sister chromatid cohesion(GO:0034093) positive regulation of maintenance of mitotic sister chromatid cohesion(GO:0034184) |
| 0.2 | 0.8 | GO:2000619 | negative regulation of histone H4-K16 acetylation(GO:2000619) |
| 0.2 | 1.9 | GO:0060261 | positive regulation of transcription initiation from RNA polymerase II promoter(GO:0060261) |
| 0.2 | 0.3 | GO:0070945 | neutrophil mediated killing of gram-negative bacterium(GO:0070945) |
| 0.2 | 0.8 | GO:0034421 | post-translational protein acetylation(GO:0034421) |
| 0.2 | 1.0 | GO:0060370 | susceptibility to T cell mediated cytotoxicity(GO:0060370) |
| 0.2 | 0.3 | GO:0090370 | negative regulation of cholesterol efflux(GO:0090370) |
| 0.2 | 0.5 | GO:0002071 | glandular epithelial cell maturation(GO:0002071) |
| 0.2 | 0.8 | GO:2000653 | regulation of DNA demethylation(GO:1901535) negative regulation of DNA demethylation(GO:1901536) regulation of genetic imprinting(GO:2000653) |
| 0.2 | 0.5 | GO:2000118 | regulation of sodium-dependent phosphate transport(GO:2000118) |
| 0.2 | 0.8 | GO:0000965 | mitochondrial RNA 3'-end processing(GO:0000965) |
| 0.2 | 0.5 | GO:1901899 | positive regulation of relaxation of cardiac muscle(GO:1901899) |
| 0.2 | 0.3 | GO:0060903 | positive regulation of meiosis I(GO:0060903) |
| 0.2 | 0.5 | GO:0071336 | submandibular salivary gland formation(GO:0060661) hair follicle cell proliferation(GO:0071335) regulation of hair follicle cell proliferation(GO:0071336) positive regulation of hair follicle cell proliferation(GO:0071338) |
| 0.2 | 0.6 | GO:0090156 | cellular sphingolipid homeostasis(GO:0090156) |
| 0.2 | 4.0 | GO:0032515 | negative regulation of phosphoprotein phosphatase activity(GO:0032515) |
| 0.1 | 1.6 | GO:1900623 | regulation of monocyte aggregation(GO:1900623) positive regulation of monocyte aggregation(GO:1900625) |
| 0.1 | 0.3 | GO:0007406 | negative regulation of neuroblast proliferation(GO:0007406) |
| 0.1 | 1.0 | GO:0060702 | negative regulation of ribonuclease activity(GO:0060701) negative regulation of endoribonuclease activity(GO:0060702) |
| 0.1 | 1.2 | GO:0048539 | bone marrow development(GO:0048539) |
| 0.1 | 2.1 | GO:0071372 | cellular response to follicle-stimulating hormone stimulus(GO:0071372) |
| 0.1 | 7.2 | GO:0051123 | RNA polymerase II transcriptional preinitiation complex assembly(GO:0051123) |
| 0.1 | 0.9 | GO:0006642 | triglyceride mobilization(GO:0006642) |
| 0.1 | 14.7 | GO:0042590 | antigen processing and presentation of exogenous peptide antigen via MHC class I(GO:0042590) |
| 0.1 | 1.0 | GO:0046985 | positive regulation of hemoglobin biosynthetic process(GO:0046985) |
| 0.1 | 0.4 | GO:0090261 | positive regulation of inclusion body assembly(GO:0090261) |
| 0.1 | 0.6 | GO:0060448 | dichotomous subdivision of terminal units involved in lung branching(GO:0060448) |
| 0.1 | 3.5 | GO:0034315 | regulation of Arp2/3 complex-mediated actin nucleation(GO:0034315) |
| 0.1 | 2.3 | GO:0045793 | positive regulation of cell size(GO:0045793) |
| 0.1 | 0.6 | GO:0071442 | positive regulation of histone H3-K14 acetylation(GO:0071442) |
| 0.1 | 0.4 | GO:0072334 | UDP-galactose transport(GO:0015785) UDP-galactose transmembrane transport(GO:0072334) |
| 0.1 | 1.3 | GO:0060574 | columnar/cuboidal epithelial cell maturation(GO:0002069) intestinal epithelial cell maturation(GO:0060574) |
| 0.1 | 1.6 | GO:2001241 | positive regulation of extrinsic apoptotic signaling pathway in absence of ligand(GO:2001241) |
| 0.1 | 0.4 | GO:0060339 | negative regulation of type I interferon-mediated signaling pathway(GO:0060339) |
| 0.1 | 1.5 | GO:0017182 | peptidyl-diphthamide metabolic process(GO:0017182) peptidyl-diphthamide biosynthetic process from peptidyl-histidine(GO:0017183) |
| 0.1 | 2.1 | GO:0071257 | cellular response to electrical stimulus(GO:0071257) |
| 0.1 | 0.3 | GO:0002581 | negative regulation of antigen processing and presentation of peptide or polysaccharide antigen via MHC class II(GO:0002581) |
| 0.1 | 0.5 | GO:0010836 | negative regulation of protein ADP-ribosylation(GO:0010836) |
| 0.1 | 5.4 | GO:0035024 | negative regulation of Rho protein signal transduction(GO:0035024) |
| 0.1 | 0.4 | GO:0002769 | natural killer cell inhibitory signaling pathway(GO:0002769) |
| 0.1 | 0.4 | GO:0030860 | regulation of polarized epithelial cell differentiation(GO:0030860) |
| 0.1 | 3.5 | GO:0060330 | regulation of response to interferon-gamma(GO:0060330) regulation of interferon-gamma-mediated signaling pathway(GO:0060334) |
| 0.1 | 0.6 | GO:0039526 | suppression by virus of host apoptotic process(GO:0019050) modulation by virus of host apoptotic process(GO:0039526) cellular process regulating host cell cycle in response to virus(GO:0060154) |
| 0.1 | 1.6 | GO:1901096 | regulation of autophagosome maturation(GO:1901096) |
| 0.1 | 0.8 | GO:0051581 | negative regulation of neurotransmitter uptake(GO:0051581) regulation of serotonin uptake(GO:0051611) negative regulation of serotonin uptake(GO:0051612) |
| 0.1 | 3.1 | GO:0060972 | left/right pattern formation(GO:0060972) |
| 0.1 | 1.5 | GO:0038092 | nodal signaling pathway(GO:0038092) |
| 0.1 | 2.8 | GO:2000059 | negative regulation of protein ubiquitination involved in ubiquitin-dependent protein catabolic process(GO:2000059) |
| 0.1 | 0.4 | GO:0036245 | cellular response to menadione(GO:0036245) |
| 0.1 | 0.8 | GO:0071104 | response to interleukin-9(GO:0071104) |
| 0.1 | 1.3 | GO:2001288 | positive regulation of caveolin-mediated endocytosis(GO:2001288) |
| 0.1 | 0.7 | GO:0048680 | positive regulation of axon regeneration(GO:0048680) |
| 0.1 | 1.2 | GO:0032020 | ISG15-protein conjugation(GO:0032020) |
| 0.1 | 1.1 | GO:0035865 | cellular response to potassium ion(GO:0035865) |
| 0.1 | 3.1 | GO:0034063 | stress granule assembly(GO:0034063) |
| 0.1 | 1.5 | GO:0000055 | ribosomal large subunit export from nucleus(GO:0000055) |
| 0.1 | 0.8 | GO:2000074 | regulation of type B pancreatic cell development(GO:2000074) |
| 0.1 | 1.1 | GO:1901552 | positive regulation of endothelial cell development(GO:1901552) positive regulation of establishment of endothelial barrier(GO:1903142) |
| 0.1 | 0.1 | GO:0086092 | regulation of the force of heart contraction by cardiac conduction(GO:0086092) |
| 0.1 | 0.5 | GO:0010835 | regulation of protein ADP-ribosylation(GO:0010835) |
| 0.1 | 0.7 | GO:0032911 | negative regulation of transforming growth factor beta1 production(GO:0032911) |
| 0.1 | 3.9 | GO:0032461 | positive regulation of protein oligomerization(GO:0032461) |
| 0.1 | 0.6 | GO:0007343 | egg activation(GO:0007343) |
| 0.1 | 0.5 | GO:2000418 | positive regulation of eosinophil migration(GO:2000418) |
| 0.1 | 1.5 | GO:0010225 | response to UV-C(GO:0010225) |
| 0.1 | 0.4 | GO:0018199 | peptidyl-glutamine modification(GO:0018199) |
| 0.1 | 0.2 | GO:0021524 | visceral motor neuron differentiation(GO:0021524) |
| 0.1 | 0.9 | GO:0016926 | protein desumoylation(GO:0016926) |
| 0.1 | 0.8 | GO:1903337 | positive regulation of vacuolar transport(GO:1903337) positive regulation of early endosome to late endosome transport(GO:2000643) |
| 0.1 | 0.4 | GO:0009183 | purine deoxyribonucleoside diphosphate biosynthetic process(GO:0009183) |
| 0.1 | 1.2 | GO:0048251 | elastic fiber assembly(GO:0048251) |
| 0.1 | 3.0 | GO:0048240 | sperm capacitation(GO:0048240) |
| 0.1 | 0.3 | GO:0070904 | L-ascorbic acid transport(GO:0015882) transepithelial L-ascorbic acid transport(GO:0070904) |
| 0.1 | 1.7 | GO:0051601 | exocyst localization(GO:0051601) |
| 0.1 | 0.6 | GO:0090166 | Golgi disassembly(GO:0090166) |
| 0.1 | 0.5 | GO:2000870 | oocyte growth(GO:0001555) regulation of progesterone secretion(GO:2000870) |
| 0.1 | 0.8 | GO:0045054 | constitutive secretory pathway(GO:0045054) |
| 0.1 | 0.3 | GO:0048560 | establishment of anatomical structure orientation(GO:0048560) |
| 0.1 | 1.1 | GO:0034058 | endosomal vesicle fusion(GO:0034058) |
| 0.1 | 1.9 | GO:0050774 | negative regulation of dendrite morphogenesis(GO:0050774) |
| 0.1 | 4.4 | GO:0034067 | protein localization to Golgi apparatus(GO:0034067) |
| 0.1 | 0.4 | GO:0072086 | specification of loop of Henle identity(GO:0072086) |
| 0.1 | 0.7 | GO:0030174 | regulation of DNA-dependent DNA replication initiation(GO:0030174) |
| 0.1 | 1.9 | GO:0035414 | negative regulation of catenin import into nucleus(GO:0035414) |
| 0.1 | 1.1 | GO:0060149 | negative regulation of posttranscriptional gene silencing(GO:0060149) negative regulation of gene silencing by miRNA(GO:0060965) negative regulation of gene silencing by RNA(GO:0060967) |
| 0.1 | 2.1 | GO:0032486 | Rap protein signal transduction(GO:0032486) |
| 0.1 | 1.1 | GO:1903071 | regulation of ER-associated ubiquitin-dependent protein catabolic process(GO:1903069) positive regulation of ER-associated ubiquitin-dependent protein catabolic process(GO:1903071) |
| 0.1 | 1.5 | GO:0090200 | positive regulation of release of cytochrome c from mitochondria(GO:0090200) |
| 0.1 | 0.3 | GO:1902905 | positive regulation of fibril organization(GO:1902905) |
| 0.1 | 0.2 | GO:0019074 | viral genome packaging(GO:0019072) viral RNA genome packaging(GO:0019074) |
| 0.1 | 0.7 | GO:0060414 | aorta smooth muscle tissue morphogenesis(GO:0060414) |
| 0.1 | 2.1 | GO:0008053 | mitochondrial fusion(GO:0008053) |
| 0.1 | 0.1 | GO:0060031 | Wnt signaling pathway involved in digestive tract morphogenesis(GO:0044333) mediolateral intercalation(GO:0060031) planar cell polarity pathway involved in gastrula mediolateral intercalation(GO:0060775) |
| 0.1 | 0.3 | GO:1901301 | regulation of cargo loading into COPII-coated vesicle(GO:1901301) |
| 0.1 | 0.5 | GO:0035022 | positive regulation of Rac protein signal transduction(GO:0035022) |
| 0.1 | 0.6 | GO:2000503 | positive regulation of natural killer cell chemotaxis(GO:2000503) |
| 0.1 | 0.8 | GO:0061042 | vascular wound healing(GO:0061042) |
| 0.1 | 3.5 | GO:0000462 | maturation of SSU-rRNA from tricistronic rRNA transcript (SSU-rRNA, 5.8S rRNA, LSU-rRNA)(GO:0000462) |
| 0.1 | 0.1 | GO:0061304 | retinal blood vessel morphogenesis(GO:0061304) |
| 0.1 | 0.5 | GO:0089700 | protein kinase D signaling(GO:0089700) |
| 0.1 | 0.6 | GO:0051414 | response to cortisol(GO:0051414) |
| 0.1 | 0.6 | GO:0090666 | scaRNA localization to Cajal body(GO:0090666) |
| 0.1 | 1.0 | GO:0055062 | phosphate ion homeostasis(GO:0055062) trivalent inorganic anion homeostasis(GO:0072506) |
| 0.1 | 0.3 | GO:0061026 | central nervous system morphogenesis(GO:0021551) cardiac muscle tissue regeneration(GO:0061026) |
| 0.1 | 1.6 | GO:0071028 | nuclear RNA surveillance(GO:0071027) nuclear mRNA surveillance(GO:0071028) |
| 0.1 | 1.2 | GO:0034214 | protein hexamerization(GO:0034214) |
| 0.1 | 0.6 | GO:1904896 | ESCRT complex disassembly(GO:1904896) ESCRT III complex disassembly(GO:1904903) |
| 0.1 | 0.8 | GO:0030951 | establishment or maintenance of microtubule cytoskeleton polarity(GO:0030951) |
| 0.1 | 0.3 | GO:0099551 | synaptic signaling via neuropeptide(GO:0099538) trans-synaptic signaling by neuropeptide(GO:0099540) trans-synaptic signaling by neuropeptide, modulating synaptic transmission(GO:0099551) |
| 0.1 | 1.3 | GO:0090344 | negative regulation of cell aging(GO:0090344) |
| 0.1 | 0.2 | GO:0071947 | protein deubiquitination involved in ubiquitin-dependent protein catabolic process(GO:0071947) |
| 0.1 | 9.1 | GO:0070125 | mitochondrial translational elongation(GO:0070125) |
| 0.1 | 0.6 | GO:0006102 | isocitrate metabolic process(GO:0006102) |
| 0.1 | 1.2 | GO:0006089 | lactate metabolic process(GO:0006089) |
| 0.1 | 0.2 | GO:0070898 | RNA polymerase III transcriptional preinitiation complex assembly(GO:0070898) |
| 0.1 | 0.3 | GO:2000863 | positive regulation of estrogen secretion(GO:2000863) positive regulation of estradiol secretion(GO:2000866) |
| 0.1 | 0.5 | GO:0007296 | vitellogenesis(GO:0007296) |
| 0.1 | 0.1 | GO:0070897 | DNA-templated transcriptional preinitiation complex assembly(GO:0070897) |
| 0.1 | 0.5 | GO:0032472 | Golgi calcium ion transport(GO:0032472) |
| 0.1 | 0.5 | GO:0060385 | axonogenesis involved in innervation(GO:0060385) |
| 0.1 | 1.6 | GO:0045821 | positive regulation of nucleotide catabolic process(GO:0030813) positive regulation of glycolytic process(GO:0045821) positive regulation of cofactor metabolic process(GO:0051194) positive regulation of coenzyme metabolic process(GO:0051197) |
| 0.1 | 0.5 | GO:0055129 | L-proline biosynthetic process(GO:0055129) |
| 0.1 | 0.8 | GO:1904153 | negative regulation of protein exit from endoplasmic reticulum(GO:0070862) negative regulation of retrograde protein transport, ER to cytosol(GO:1904153) |
| 0.1 | 1.7 | GO:0030970 | retrograde protein transport, ER to cytosol(GO:0030970) |
| 0.1 | 0.1 | GO:1904781 | positive regulation of protein localization to centrosome(GO:1904781) |
| 0.1 | 0.4 | GO:0006449 | regulation of translational termination(GO:0006449) |
| 0.1 | 1.1 | GO:0045723 | positive regulation of fatty acid biosynthetic process(GO:0045723) |
| 0.1 | 0.2 | GO:0097068 | response to thyroxine(GO:0097068) response to L-phenylalanine derivative(GO:1904386) |
| 0.1 | 6.1 | GO:0030574 | collagen catabolic process(GO:0030574) |
| 0.1 | 2.1 | GO:0090162 | establishment of epithelial cell polarity(GO:0090162) |
| 0.1 | 0.4 | GO:0060754 | positive regulation of mast cell chemotaxis(GO:0060754) |
| 0.1 | 0.9 | GO:0010510 | regulation of acetyl-CoA biosynthetic process from pyruvate(GO:0010510) regulation of acyl-CoA biosynthetic process(GO:0050812) |
| 0.1 | 0.1 | GO:0051708 | intracellular transport of viral protein in host cell(GO:0019060) symbiont intracellular protein transport in host(GO:0030581) intracellular protein transport in other organism involved in symbiotic interaction(GO:0051708) |
| 0.1 | 0.4 | GO:0071475 | cellular hyperosmotic salinity response(GO:0071475) |
| 0.1 | 0.4 | GO:0006050 | mannosamine metabolic process(GO:0006050) N-acetylmannosamine metabolic process(GO:0006051) |
| 0.1 | 0.8 | GO:1902669 | positive regulation of axon guidance(GO:1902669) |
| 0.1 | 0.1 | GO:0045347 | negative regulation of MHC class II biosynthetic process(GO:0045347) |
| 0.1 | 0.5 | GO:0010815 | bradykinin catabolic process(GO:0010815) |
| 0.1 | 0.5 | GO:2000189 | positive regulation of cholesterol homeostasis(GO:2000189) |
| 0.1 | 0.1 | GO:1904616 | regulation of actin filament binding(GO:1904529) regulation of actin binding(GO:1904616) |
| 0.1 | 1.0 | GO:0031272 | regulation of pseudopodium assembly(GO:0031272) |
| 0.1 | 0.5 | GO:0009826 | unidimensional cell growth(GO:0009826) |
| 0.1 | 0.3 | GO:0018094 | protein polyglycylation(GO:0018094) |
| 0.1 | 0.5 | GO:0070861 | regulation of protein exit from endoplasmic reticulum(GO:0070861) |
| 0.1 | 0.6 | GO:1900103 | positive regulation of endoplasmic reticulum unfolded protein response(GO:1900103) |
| 0.1 | 0.2 | GO:0061300 | cerebellum vasculature development(GO:0061300) |
| 0.1 | 0.1 | GO:1900365 | positive regulation of mRNA polyadenylation(GO:1900365) |
| 0.1 | 2.0 | GO:0006379 | mRNA cleavage(GO:0006379) |
| 0.1 | 0.2 | GO:0071486 | cellular response to light intensity(GO:0071484) cellular response to high light intensity(GO:0071486) retinal rod cell apoptotic process(GO:0097473) retinal cell apoptotic process(GO:1990009) |
| 0.1 | 7.6 | GO:0030968 | endoplasmic reticulum unfolded protein response(GO:0030968) |
| 0.1 | 1.0 | GO:0031293 | membrane protein intracellular domain proteolysis(GO:0031293) |
| 0.1 | 0.2 | GO:0038170 | somatostatin receptor signaling pathway(GO:0038169) somatostatin signaling pathway(GO:0038170) |
| 0.1 | 1.8 | GO:0070584 | mitochondrion morphogenesis(GO:0070584) |
| 0.1 | 0.3 | GO:0003164 | His-Purkinje system development(GO:0003164) |
| 0.1 | 0.4 | GO:0035617 | stress granule disassembly(GO:0035617) |
| 0.1 | 0.2 | GO:0035582 | sequestering of BMP in extracellular matrix(GO:0035582) |
| 0.1 | 1.3 | GO:0035589 | G-protein coupled purinergic nucleotide receptor signaling pathway(GO:0035589) |
| 0.1 | 0.5 | GO:0043353 | enucleate erythrocyte differentiation(GO:0043353) |
| 0.1 | 0.5 | GO:0002175 | protein localization to paranode region of axon(GO:0002175) |
| 0.1 | 2.2 | GO:1903146 | regulation of mitophagy(GO:1903146) |
| 0.1 | 0.3 | GO:0045875 | negative regulation of sister chromatid cohesion(GO:0045875) |
| 0.1 | 0.3 | GO:0098528 | skeletal muscle fiber differentiation(GO:0098528) |
| 0.1 | 0.3 | GO:0060770 | negative regulation of epithelial cell proliferation involved in prostate gland development(GO:0060770) |
| 0.1 | 0.4 | GO:0036010 | protein localization to endosome(GO:0036010) |
| 0.1 | 0.3 | GO:0048245 | eosinophil chemotaxis(GO:0048245) |
| 0.1 | 5.6 | GO:0035308 | negative regulation of protein dephosphorylation(GO:0035308) |
| 0.1 | 3.1 | GO:0010501 | RNA secondary structure unwinding(GO:0010501) |
| 0.1 | 0.8 | GO:1904706 | negative regulation of vascular smooth muscle cell proliferation(GO:1904706) |
| 0.1 | 0.2 | GO:0010193 | response to ozone(GO:0010193) |
| 0.1 | 0.2 | GO:1904862 | inhibitory synapse assembly(GO:1904862) |
| 0.1 | 0.5 | GO:0019375 | galactosylceramide biosynthetic process(GO:0006682) galactolipid biosynthetic process(GO:0019375) |
| 0.1 | 1.5 | GO:0010763 | positive regulation of fibroblast migration(GO:0010763) |
| 0.1 | 0.2 | GO:0034085 | establishment of sister chromatid cohesion(GO:0034085) cohesin loading(GO:0071921) regulation of cohesin loading(GO:0071922) |
| 0.1 | 0.9 | GO:0003322 | pancreatic A cell development(GO:0003322) |
| 0.1 | 0.2 | GO:0009236 | cobalamin biosynthetic process(GO:0009236) |
| 0.1 | 0.1 | GO:0045013 | carbon catabolite repression of transcription(GO:0045013) negative regulation of transcription by glucose(GO:0045014) |
| 0.1 | 1.7 | GO:0090503 | RNA phosphodiester bond hydrolysis, exonucleolytic(GO:0090503) |
| 0.1 | 0.1 | GO:0090038 | negative regulation of protein kinase C signaling(GO:0090038) |
| 0.1 | 0.2 | GO:0001732 | formation of cytoplasmic translation initiation complex(GO:0001732) |
| 0.1 | 0.5 | GO:0019532 | oxalate transport(GO:0019532) |
| 0.1 | 1.8 | GO:0006891 | intra-Golgi vesicle-mediated transport(GO:0006891) |
| 0.0 | 0.3 | GO:0061743 | motor learning(GO:0061743) |
| 0.0 | 0.4 | GO:0016560 | protein import into peroxisome matrix, docking(GO:0016560) |
| 0.0 | 0.1 | GO:0070093 | negative regulation of glucagon secretion(GO:0070093) |
| 0.0 | 0.2 | GO:0044861 | protein transport into plasma membrane raft(GO:0044861) |
| 0.0 | 0.3 | GO:0000012 | single strand break repair(GO:0000012) |
| 0.0 | 0.6 | GO:0048733 | sebaceous gland development(GO:0048733) |
| 0.0 | 0.2 | GO:0007056 | spindle assembly involved in female meiosis(GO:0007056) |
| 0.0 | 0.3 | GO:0046349 | UDP-N-acetylglucosamine biosynthetic process(GO:0006048) amino sugar biosynthetic process(GO:0046349) |
| 0.0 | 0.1 | GO:0021526 | medial motor column neuron differentiation(GO:0021526) |
| 0.0 | 0.4 | GO:0031053 | primary miRNA processing(GO:0031053) |
| 0.0 | 1.2 | GO:0010569 | regulation of double-strand break repair via homologous recombination(GO:0010569) |
| 0.0 | 0.2 | GO:0071557 | histone H3-K27 demethylation(GO:0071557) |
| 0.0 | 0.4 | GO:0007023 | post-chaperonin tubulin folding pathway(GO:0007023) |
| 0.0 | 0.6 | GO:0006054 | N-acetylneuraminate metabolic process(GO:0006054) |
| 0.0 | 0.3 | GO:0033353 | S-adenosylmethionine cycle(GO:0033353) |
| 0.0 | 0.2 | GO:0045903 | positive regulation of translational fidelity(GO:0045903) |
| 0.0 | 0.2 | GO:2000371 | regulation of DNA topoisomerase (ATP-hydrolyzing) activity(GO:2000371) positive regulation of DNA topoisomerase (ATP-hydrolyzing) activity(GO:2000373) |
| 0.0 | 0.4 | GO:0046604 | positive regulation of mitotic centrosome separation(GO:0046604) |
| 0.0 | 0.3 | GO:0097475 | motor neuron migration(GO:0097475) |
| 0.0 | 1.1 | GO:0019511 | peptidyl-proline hydroxylation(GO:0019511) |
| 0.0 | 0.7 | GO:0010457 | centriole-centriole cohesion(GO:0010457) |
| 0.0 | 0.2 | GO:0046601 | positive regulation of centriole replication(GO:0046601) |
| 0.0 | 0.2 | GO:0007499 | ectoderm and mesoderm interaction(GO:0007499) |
| 0.0 | 0.4 | GO:1903543 | positive regulation of exosomal secretion(GO:1903543) |
| 0.0 | 0.5 | GO:0017062 | respiratory chain complex III assembly(GO:0017062) mitochondrial respiratory chain complex III assembly(GO:0034551) |
| 0.0 | 0.5 | GO:0008612 | peptidyl-lysine modification to peptidyl-hypusine(GO:0008612) |
| 0.0 | 0.1 | GO:0008588 | release of cytoplasmic sequestered NF-kappaB(GO:0008588) |
| 0.0 | 0.8 | GO:0032516 | positive regulation of phosphoprotein phosphatase activity(GO:0032516) |
| 0.0 | 0.2 | GO:0045872 | regulation of rhodopsin gene expression(GO:0007468) positive regulation of rhodopsin gene expression(GO:0045872) |
| 0.0 | 0.5 | GO:0030033 | microvillus assembly(GO:0030033) |
| 0.0 | 0.1 | GO:0002317 | plasma cell differentiation(GO:0002317) |
| 0.0 | 0.1 | GO:0051901 | positive regulation of mitochondrial depolarization(GO:0051901) |
| 0.0 | 0.5 | GO:0070544 | histone H3-K36 demethylation(GO:0070544) |
| 0.0 | 2.2 | GO:0061621 | NADH regeneration(GO:0006735) canonical glycolysis(GO:0061621) glucose catabolic process to pyruvate(GO:0061718) |
| 0.0 | 0.4 | GO:1903874 | ferrous iron transport(GO:0015684) ferrous iron transmembrane transport(GO:1903874) |
| 0.0 | 0.4 | GO:0045329 | carnitine biosynthetic process(GO:0045329) |
| 0.0 | 0.4 | GO:0033182 | regulation of histone ubiquitination(GO:0033182) |
| 0.0 | 2.9 | GO:0000381 | regulation of alternative mRNA splicing, via spliceosome(GO:0000381) |
| 0.0 | 1.2 | GO:0030488 | tRNA methylation(GO:0030488) |
| 0.0 | 0.1 | GO:0019355 | nicotinamide nucleotide biosynthetic process from aspartate(GO:0019355) 'de novo' NAD biosynthetic process from aspartate(GO:0034628) |
| 0.0 | 0.9 | GO:0042744 | hydrogen peroxide catabolic process(GO:0042744) |
| 0.0 | 0.2 | GO:0006499 | N-terminal protein myristoylation(GO:0006499) |
| 0.0 | 0.4 | GO:1901409 | positive regulation of phosphorylation of RNA polymerase II C-terminal domain(GO:1901409) |
| 0.0 | 0.2 | GO:0042360 | vitamin E metabolic process(GO:0042360) |
| 0.0 | 0.4 | GO:0007252 | I-kappaB phosphorylation(GO:0007252) |
| 0.0 | 0.1 | GO:0016075 | rRNA catabolic process(GO:0016075) |
| 0.0 | 0.1 | GO:0009257 | 10-formyltetrahydrofolate biosynthetic process(GO:0009257) |
| 0.0 | 0.6 | GO:0009162 | deoxyribonucleoside monophosphate metabolic process(GO:0009162) |
| 0.0 | 0.4 | GO:0045651 | positive regulation of macrophage differentiation(GO:0045651) |
| 0.0 | 3.0 | GO:0045071 | negative regulation of viral genome replication(GO:0045071) |
| 0.0 | 0.2 | GO:0048254 | snoRNA localization(GO:0048254) |
| 0.0 | 0.2 | GO:0043666 | regulation of phosphoprotein phosphatase activity(GO:0043666) |
| 0.0 | 0.3 | GO:0039536 | negative regulation of RIG-I signaling pathway(GO:0039536) |
| 0.0 | 0.2 | GO:0090161 | Golgi ribbon formation(GO:0090161) |
| 0.0 | 0.2 | GO:1902410 | mitotic cytokinetic process(GO:1902410) |
| 0.0 | 0.3 | GO:2000197 | regulation of mRNA export from nucleus(GO:0010793) regulation of ribonucleoprotein complex localization(GO:2000197) |
| 0.0 | 0.0 | GO:0002314 | germinal center B cell differentiation(GO:0002314) |
| 0.0 | 0.2 | GO:0006015 | 5-phosphoribose 1-diphosphate biosynthetic process(GO:0006015) 5-phosphoribose 1-diphosphate metabolic process(GO:0046391) |
| 0.0 | 0.2 | GO:1904566 | response to 1-oleoyl-sn-glycerol 3-phosphate(GO:1904565) cellular response to 1-oleoyl-sn-glycerol 3-phosphate(GO:1904566) |
| 0.0 | 0.5 | GO:0071493 | cellular response to UV-B(GO:0071493) |
| 0.0 | 0.2 | GO:1900383 | regulation of synaptic plasticity by receptor localization to synapse(GO:1900383) |
| 0.0 | 0.6 | GO:2000811 | negative regulation of anoikis(GO:2000811) |
| 0.0 | 0.1 | GO:1903575 | cornified envelope assembly(GO:1903575) |
| 0.0 | 0.7 | GO:0071880 | adenylate cyclase-activating adrenergic receptor signaling pathway(GO:0071880) |
| 0.0 | 0.1 | GO:0002005 | angiotensin catabolic process in blood(GO:0002005) multicellular organismal protein catabolic process(GO:0044254) protein digestion(GO:0044256) multicellular organismal macromolecule catabolic process(GO:0044266) |
| 0.0 | 0.2 | GO:0060136 | embryonic process involved in female pregnancy(GO:0060136) |
| 0.0 | 0.2 | GO:0002326 | B cell lineage commitment(GO:0002326) |
| 0.0 | 0.2 | GO:2000143 | negative regulation of DNA-templated transcription, initiation(GO:2000143) |
| 0.0 | 0.4 | GO:0006703 | estrogen biosynthetic process(GO:0006703) |
| 0.0 | 0.2 | GO:0060017 | parathyroid gland development(GO:0060017) |
| 0.0 | 0.4 | GO:1904355 | positive regulation of telomere capping(GO:1904355) |
| 0.0 | 2.8 | GO:0010508 | positive regulation of autophagy(GO:0010508) |
| 0.0 | 0.2 | GO:0008582 | regulation of synaptic growth at neuromuscular junction(GO:0008582) |
| 0.0 | 0.4 | GO:0016998 | cell wall macromolecule catabolic process(GO:0016998) |
| 0.0 | 0.7 | GO:0007567 | parturition(GO:0007567) |
| 0.0 | 0.1 | GO:0001808 | negative regulation of type IV hypersensitivity(GO:0001808) |
| 0.0 | 0.6 | GO:0007614 | short-term memory(GO:0007614) |
| 0.0 | 0.1 | GO:0051941 | regulation of amino acid uptake involved in synaptic transmission(GO:0051941) regulation of glutamate uptake involved in transmission of nerve impulse(GO:0051946) regulation of L-glutamate import(GO:1900920) regulation of calcium:sodium antiporter activity(GO:1903279) |
| 0.0 | 0.1 | GO:0060842 | arterial endothelial cell differentiation(GO:0060842) |
| 0.0 | 0.2 | GO:0045324 | late endosome to vacuole transport(GO:0045324) |
| 0.0 | 0.2 | GO:0006828 | manganese ion transport(GO:0006828) |
| 0.0 | 0.9 | GO:0033344 | cholesterol efflux(GO:0033344) |
| 0.0 | 0.1 | GO:0061739 | protein lipidation involved in autophagosome assembly(GO:0061739) |
| 0.0 | 0.0 | GO:0098735 | positive regulation of the force of heart contraction(GO:0098735) |
| 0.0 | 0.1 | GO:0039656 | modulation by virus of host gene expression(GO:0039656) modification by virus of host mRNA processing(GO:0046778) regulation of polynucleotide adenylyltransferase activity(GO:1904245) positive regulation of polynucleotide adenylyltransferase activity(GO:1904247) |
| 0.0 | 0.5 | GO:0031163 | iron-sulfur cluster assembly(GO:0016226) metallo-sulfur cluster assembly(GO:0031163) |
| 0.0 | 1.6 | GO:0021762 | substantia nigra development(GO:0021762) |
| 0.0 | 0.5 | GO:0030150 | protein import into mitochondrial matrix(GO:0030150) |
| 0.0 | 0.7 | GO:0000185 | activation of MAPKKK activity(GO:0000185) |
| 0.0 | 0.2 | GO:0016344 | meiotic chromosome movement towards spindle pole(GO:0016344) |
| 0.0 | 1.6 | GO:0070936 | protein K48-linked ubiquitination(GO:0070936) |
| 0.0 | 0.5 | GO:0030208 | dermatan sulfate biosynthetic process(GO:0030208) |
| 0.0 | 0.2 | GO:0032914 | positive regulation of transforming growth factor beta1 production(GO:0032914) |
| 0.0 | 0.3 | GO:0045292 | mRNA cis splicing, via spliceosome(GO:0045292) |
| 0.0 | 0.1 | GO:0097201 | negative regulation of transcription from RNA polymerase II promoter in response to stress(GO:0097201) |
| 0.0 | 0.8 | GO:0061099 | negative regulation of protein tyrosine kinase activity(GO:0061099) |
| 0.0 | 1.4 | GO:0006986 | response to unfolded protein(GO:0006986) |
| 0.0 | 1.2 | GO:0035036 | sperm-egg recognition(GO:0035036) |
| 0.0 | 0.5 | GO:1904776 | protein localization to cell cortex(GO:0072697) regulation of protein localization to cell cortex(GO:1904776) positive regulation of protein localization to cell cortex(GO:1904778) |
| 0.0 | 0.6 | GO:0009312 | oligosaccharide biosynthetic process(GO:0009312) |
| 0.0 | 0.0 | GO:0001550 | ovarian cumulus expansion(GO:0001550) fused antrum stage(GO:0048165) |
| 0.0 | 0.4 | GO:0006750 | glutathione biosynthetic process(GO:0006750) |
| 0.0 | 0.1 | GO:0035585 | calcium-mediated signaling using extracellular calcium source(GO:0035585) |
| 0.0 | 0.5 | GO:0030277 | maintenance of gastrointestinal epithelium(GO:0030277) |
| 0.0 | 0.4 | GO:0034384 | high-density lipoprotein particle clearance(GO:0034384) |
| 0.0 | 0.3 | GO:0061179 | negative regulation of insulin secretion involved in cellular response to glucose stimulus(GO:0061179) |
| 0.0 | 0.3 | GO:0035635 | entry of bacterium into host cell(GO:0035635) |
| 0.0 | 1.2 | GO:0060218 | hematopoietic stem cell differentiation(GO:0060218) |
| 0.0 | 0.1 | GO:0046167 | glycerol-3-phosphate biosynthetic process(GO:0046167) |
| 0.0 | 0.1 | GO:0006983 | ER overload response(GO:0006983) |
| 0.0 | 0.5 | GO:0046085 | adenosine metabolic process(GO:0046085) |
| 0.0 | 0.2 | GO:0051481 | negative regulation of cytosolic calcium ion concentration(GO:0051481) |
| 0.0 | 1.7 | GO:0009301 | snRNA transcription(GO:0009301) snRNA transcription from RNA polymerase II promoter(GO:0042795) |
| 0.0 | 0.1 | GO:0036116 | medium-chain fatty-acyl-CoA catabolic process(GO:0036114) long-chain fatty-acyl-CoA catabolic process(GO:0036116) palmitic acid metabolic process(GO:1900533) palmitic acid biosynthetic process(GO:1900535) |
| 0.0 | 0.3 | GO:0014029 | neural crest formation(GO:0014029) |
| 0.0 | 0.2 | GO:0060088 | auditory receptor cell stereocilium organization(GO:0060088) |
| 0.0 | 0.2 | GO:2000785 | regulation of autophagosome assembly(GO:2000785) |
| 0.0 | 0.8 | GO:0034080 | CENP-A containing nucleosome assembly(GO:0034080) CENP-A containing chromatin organization(GO:0061641) |
| 0.0 | 0.5 | GO:0007035 | vacuolar acidification(GO:0007035) |
| 0.0 | 0.2 | GO:0051661 | maintenance of centrosome location(GO:0051661) |
| 0.0 | 0.5 | GO:0016254 | preassembly of GPI anchor in ER membrane(GO:0016254) |
| 0.0 | 0.8 | GO:0000188 | inactivation of MAPK activity(GO:0000188) |
| 0.0 | 0.3 | GO:0015693 | magnesium ion transport(GO:0015693) |
| 0.0 | 0.1 | GO:0043587 | tongue morphogenesis(GO:0043587) |
| 0.0 | 0.1 | GO:0060011 | Sertoli cell proliferation(GO:0060011) |
| 0.0 | 0.2 | GO:0000380 | alternative mRNA splicing, via spliceosome(GO:0000380) |
| 0.0 | 0.1 | GO:0006705 | mineralocorticoid biosynthetic process(GO:0006705) mineralocorticoid metabolic process(GO:0008212) |
| 0.0 | 0.3 | GO:0070934 | CRD-mediated mRNA stabilization(GO:0070934) |
| 0.0 | 1.1 | GO:0000245 | spliceosomal complex assembly(GO:0000245) |
| 0.0 | 0.1 | GO:0031118 | rRNA pseudouridine synthesis(GO:0031118) |
| 0.0 | 0.3 | GO:0098743 | cell aggregation(GO:0098743) |
| 0.0 | 0.8 | GO:0009948 | anterior/posterior axis specification(GO:0009948) |
| 0.0 | 1.1 | GO:0032330 | regulation of chondrocyte differentiation(GO:0032330) |
| 0.0 | 0.4 | GO:0007130 | synaptonemal complex assembly(GO:0007130) |
| 0.0 | 0.2 | GO:0051967 | negative regulation of synaptic transmission, glutamatergic(GO:0051967) |
| 0.0 | 2.4 | GO:0015992 | proton transport(GO:0015992) |
| 0.0 | 0.2 | GO:0006537 | glutamate biosynthetic process(GO:0006537) |
| 0.0 | 0.3 | GO:0033561 | regulation of water loss via skin(GO:0033561) establishment of skin barrier(GO:0061436) |
| 0.0 | 0.2 | GO:0042487 | regulation of odontogenesis of dentin-containing tooth(GO:0042487) |
| 0.0 | 0.2 | GO:0019430 | removal of superoxide radicals(GO:0019430) |
| 0.0 | 0.1 | GO:0071313 | cellular response to caffeine(GO:0071313) |
| 0.0 | 0.3 | GO:0006855 | drug transmembrane transport(GO:0006855) |
| 0.0 | 0.0 | GO:0098905 | regulation of bundle of His cell action potential(GO:0098905) |
| 0.0 | 0.4 | GO:0060325 | face morphogenesis(GO:0060325) |
| 0.0 | 0.7 | GO:0046039 | GTP metabolic process(GO:0046039) |
| 0.0 | 0.4 | GO:0048745 | smooth muscle tissue development(GO:0048745) |
| 0.0 | 0.3 | GO:0010818 | T cell chemotaxis(GO:0010818) |
| 0.0 | 0.3 | GO:0003301 | physiological muscle hypertrophy(GO:0003298) physiological cardiac muscle hypertrophy(GO:0003301) cell growth involved in cardiac muscle cell development(GO:0061049) |
| 0.0 | 0.1 | GO:0007530 | sex determination(GO:0007530) |
| 0.0 | 2.1 | GO:0048706 | embryonic skeletal system development(GO:0048706) |
| 0.0 | 0.2 | GO:0060512 | prostate gland morphogenesis(GO:0060512) |
| 0.0 | 0.1 | GO:0070164 | negative regulation of adiponectin secretion(GO:0070164) |
| 0.0 | 0.1 | GO:0031268 | pseudopodium organization(GO:0031268) |
| 0.0 | 0.0 | GO:0003149 | membranous septum morphogenesis(GO:0003149) |
| 0.0 | 0.8 | GO:0010507 | negative regulation of autophagy(GO:0010507) |
| 0.0 | 0.1 | GO:0099525 | presynaptic dense core granule exocytosis(GO:0099525) |
| 0.0 | 0.4 | GO:0016048 | detection of temperature stimulus(GO:0016048) |
| 0.0 | 0.4 | GO:0090129 | positive regulation of synapse maturation(GO:0090129) |
| 0.0 | 0.1 | GO:0032747 | positive regulation of interleukin-23 production(GO:0032747) |
| 0.0 | 0.1 | GO:0046618 | drug export(GO:0046618) |
| 0.0 | 0.0 | GO:0072076 | nephrogenic mesenchyme development(GO:0072076) pattern specification involved in metanephros development(GO:0072268) |
| 0.0 | 0.1 | GO:0097500 | receptor localization to nonmotile primary cilium(GO:0097500) |
| 0.0 | 1.0 | GO:0042273 | ribosomal large subunit biogenesis(GO:0042273) |
| 0.0 | 0.1 | GO:0060539 | diaphragm development(GO:0060539) |
| 0.0 | 1.2 | GO:0031338 | regulation of vesicle fusion(GO:0031338) |
| 0.0 | 0.1 | GO:0030299 | intestinal cholesterol absorption(GO:0030299) intestinal lipid absorption(GO:0098856) |
| 0.0 | 0.1 | GO:0016973 | poly(A)+ mRNA export from nucleus(GO:0016973) |
| 0.0 | 0.2 | GO:0032026 | response to magnesium ion(GO:0032026) |
| 0.0 | 0.2 | GO:0018026 | peptidyl-lysine monomethylation(GO:0018026) |
| 0.0 | 0.2 | GO:0060765 | regulation of androgen receptor signaling pathway(GO:0060765) |
| 0.0 | 0.1 | GO:0001946 | lymphangiogenesis(GO:0001946) |
| 0.0 | 0.5 | GO:0000083 | regulation of transcription involved in G1/S transition of mitotic cell cycle(GO:0000083) |
| 0.0 | 0.3 | GO:0006337 | nucleosome disassembly(GO:0006337) |
| 0.0 | 0.1 | GO:2000324 | positive regulation of glucocorticoid receptor signaling pathway(GO:2000324) |
| 0.0 | 0.4 | GO:0009303 | rRNA transcription(GO:0009303) |
| 0.0 | 0.1 | GO:0060856 | establishment of blood-brain barrier(GO:0060856) |
| 0.0 | 0.1 | GO:0002726 | positive regulation of T cell cytokine production(GO:0002726) |
| 0.0 | 0.6 | GO:0048791 | calcium ion-regulated exocytosis of neurotransmitter(GO:0048791) |
| 0.0 | 0.1 | GO:0035562 | negative regulation of chromatin binding(GO:0035562) |
| 0.0 | 0.3 | GO:1901687 | glutathione derivative metabolic process(GO:1901685) glutathione derivative biosynthetic process(GO:1901687) |
| 0.0 | 0.1 | GO:0031987 | locomotion involved in locomotory behavior(GO:0031987) |
| 0.0 | 0.0 | GO:0031642 | negative regulation of myelination(GO:0031642) |
| 0.0 | 0.1 | GO:0031022 | nuclear migration along microfilament(GO:0031022) |
| 0.0 | 0.1 | GO:0006189 | 'de novo' IMP biosynthetic process(GO:0006189) |
Gene overrepresentation in cellular component category:
| Log-likelihood per target | Total log-likelihood | Term | Description |
|---|---|---|---|
| 2.3 | 9.0 | GO:0038039 | G-protein coupled receptor heterodimeric complex(GO:0038039) |
| 1.4 | 11.3 | GO:1990111 | spermatoproteasome complex(GO:1990111) |
| 0.8 | 4.8 | GO:0043527 | tRNA methyltransferase complex(GO:0043527) |
| 0.8 | 10.2 | GO:0033256 | I-kappaB/NF-kappaB complex(GO:0033256) |
| 0.7 | 2.2 | GO:1990622 | CHOP-ATF3 complex(GO:1990622) |
| 0.7 | 2.9 | GO:0044393 | microspike(GO:0044393) |
| 0.7 | 2.8 | GO:0097229 | sperm end piece(GO:0097229) |
| 0.7 | 8.0 | GO:0000322 | storage vacuole(GO:0000322) |
| 0.6 | 3.1 | GO:0070381 | endosome to plasma membrane transport vesicle(GO:0070381) |
| 0.6 | 4.1 | GO:0044530 | supraspliceosomal complex(GO:0044530) |
| 0.5 | 4.1 | GO:0097451 | glial limiting end-foot(GO:0097451) |
| 0.5 | 2.5 | GO:0044232 | organelle membrane contact site(GO:0044232) |
| 0.5 | 1.5 | GO:0043159 | acrosomal matrix(GO:0043159) |
| 0.5 | 1.8 | GO:1990423 | RZZ complex(GO:1990423) |
| 0.4 | 3.9 | GO:0071144 | SMAD2-SMAD3 protein complex(GO:0071144) |
| 0.4 | 3.0 | GO:0042825 | TAP complex(GO:0042825) |
| 0.4 | 7.4 | GO:0035631 | CD40 receptor complex(GO:0035631) |
| 0.4 | 6.6 | GO:0000813 | ESCRT I complex(GO:0000813) |
| 0.4 | 4.9 | GO:0033588 | Elongator holoenzyme complex(GO:0033588) |
| 0.4 | 1.1 | GO:0030689 | Noc complex(GO:0030689) |
| 0.4 | 2.6 | GO:0044614 | nuclear pore cytoplasmic filaments(GO:0044614) |
| 0.3 | 21.1 | GO:0097542 | ciliary tip(GO:0097542) |
| 0.3 | 1.4 | GO:1990879 | CST complex(GO:1990879) |
| 0.3 | 1.9 | GO:0020018 | ciliary pocket(GO:0020016) ciliary pocket membrane(GO:0020018) |
| 0.3 | 3.1 | GO:0000220 | vacuolar proton-transporting V-type ATPase, V0 domain(GO:0000220) |
| 0.3 | 1.4 | GO:0045160 | myosin I complex(GO:0045160) |
| 0.3 | 4.0 | GO:0044754 | autolysosome(GO:0044754) |
| 0.3 | 1.1 | GO:0008537 | proteasome activator complex(GO:0008537) |
| 0.3 | 4.6 | GO:0030127 | COPII vesicle coat(GO:0030127) |
| 0.2 | 2.0 | GO:0098559 | cytoplasmic side of early endosome membrane(GO:0098559) |
| 0.2 | 8.2 | GO:0005779 | integral component of peroxisomal membrane(GO:0005779) intrinsic component of peroxisomal membrane(GO:0031231) |
| 0.2 | 1.0 | GO:0030289 | protein phosphatase 4 complex(GO:0030289) |
| 0.2 | 1.4 | GO:0032311 | angiogenin-PRI complex(GO:0032311) |
| 0.2 | 2.4 | GO:0046581 | intercellular canaliculus(GO:0046581) |
| 0.2 | 0.4 | GO:0044094 | host cell nucleus(GO:0042025) host cell nuclear part(GO:0044094) |
| 0.2 | 1.4 | GO:1990037 | Lewy body core(GO:1990037) |
| 0.2 | 1.8 | GO:0032133 | chromosome passenger complex(GO:0032133) |
| 0.2 | 1.3 | GO:0034388 | Pwp2p-containing subcomplex of 90S preribosome(GO:0034388) |
| 0.2 | 1.3 | GO:0035032 | phosphatidylinositol 3-kinase complex, class III(GO:0035032) |
| 0.2 | 0.7 | GO:0005846 | nuclear cap binding complex(GO:0005846) |
| 0.2 | 1.8 | GO:0032541 | cortical endoplasmic reticulum(GO:0032541) |
| 0.2 | 0.5 | GO:0010370 | perinucleolar chromocenter(GO:0010370) |
| 0.2 | 12.2 | GO:0000315 | organellar large ribosomal subunit(GO:0000315) mitochondrial large ribosomal subunit(GO:0005762) |
| 0.2 | 1.5 | GO:0042719 | mitochondrial intermembrane space protein transporter complex(GO:0042719) |
| 0.2 | 0.8 | GO:0034274 | Atg12-Atg5-Atg16 complex(GO:0034274) |
| 0.2 | 5.8 | GO:0071437 | invadopodium(GO:0071437) |
| 0.2 | 13.6 | GO:0015030 | Cajal body(GO:0015030) |
| 0.2 | 0.6 | GO:1990578 | perinuclear endoplasmic reticulum membrane(GO:1990578) |
| 0.2 | 2.1 | GO:0097136 | Bcl-2 family protein complex(GO:0097136) |
| 0.2 | 1.3 | GO:0031415 | NatA complex(GO:0031415) |
| 0.2 | 1.4 | GO:0045252 | oxoglutarate dehydrogenase complex(GO:0045252) |
| 0.2 | 0.5 | GO:0034657 | GID complex(GO:0034657) |
| 0.2 | 0.6 | GO:0032937 | SREBP-SCAP-Insig complex(GO:0032937) |
| 0.2 | 1.8 | GO:0070449 | elongin complex(GO:0070449) |
| 0.1 | 1.6 | GO:0035692 | macrophage migration inhibitory factor receptor complex(GO:0035692) |
| 0.1 | 1.5 | GO:0070187 | telosome(GO:0070187) |
| 0.1 | 1.7 | GO:0005818 | astral microtubule(GO:0000235) aster(GO:0005818) |
| 0.1 | 2.0 | GO:0016461 | unconventional myosin complex(GO:0016461) |
| 0.1 | 0.7 | GO:0035061 | interchromatin granule(GO:0035061) |
| 0.1 | 4.4 | GO:0005719 | nuclear euchromatin(GO:0005719) |
| 0.1 | 0.6 | GO:0035339 | SPOTS complex(GO:0035339) |
| 0.1 | 2.3 | GO:0005868 | cytoplasmic dynein complex(GO:0005868) |
| 0.1 | 0.4 | GO:0033565 | ESCRT-0 complex(GO:0033565) |
| 0.1 | 0.3 | GO:0071006 | U2-type catalytic step 1 spliceosome(GO:0071006) |
| 0.1 | 1.3 | GO:0031595 | nuclear proteasome complex(GO:0031595) |
| 0.1 | 2.0 | GO:0030130 | clathrin coat of trans-Golgi network vesicle(GO:0030130) |
| 0.1 | 1.1 | GO:0061574 | ASAP complex(GO:0061574) |
| 0.1 | 0.7 | GO:0016589 | NURF complex(GO:0016589) |
| 0.1 | 0.4 | GO:0070876 | SOSS complex(GO:0070876) |
| 0.1 | 1.0 | GO:0070765 | gamma-secretase complex(GO:0070765) |
| 0.1 | 5.5 | GO:0005669 | transcription factor TFIID complex(GO:0005669) |
| 0.1 | 1.9 | GO:0000164 | protein phosphatase type 1 complex(GO:0000164) |
| 0.1 | 0.3 | GO:0097629 | extrinsic component of omegasome membrane(GO:0097629) |
| 0.1 | 1.5 | GO:0032433 | filopodium tip(GO:0032433) |
| 0.1 | 0.1 | GO:0060203 | clathrin-sculpted glutamate transport vesicle(GO:0060199) clathrin-sculpted acetylcholine transport vesicle(GO:0060200) clathrin-sculpted acetylcholine transport vesicle membrane(GO:0060201) clathrin-sculpted glutamate transport vesicle membrane(GO:0060203) |
| 0.1 | 0.9 | GO:0034709 | methylosome(GO:0034709) |
| 0.1 | 1.2 | GO:0005869 | dynactin complex(GO:0005869) |
| 0.1 | 0.6 | GO:0097149 | centralspindlin complex(GO:0097149) |
| 0.1 | 1.6 | GO:0001673 | male germ cell nucleus(GO:0001673) |
| 0.1 | 2.8 | GO:0005682 | U5 snRNP(GO:0005682) |
| 0.1 | 3.0 | GO:0030687 | preribosome, large subunit precursor(GO:0030687) |
| 0.1 | 0.9 | GO:0042788 | polysomal ribosome(GO:0042788) |
| 0.1 | 0.3 | GO:0005745 | m-AAA complex(GO:0005745) |
| 0.1 | 0.6 | GO:0032437 | cuticular plate(GO:0032437) |
| 0.1 | 1.4 | GO:0034098 | VCP-NPL4-UFD1 AAA ATPase complex(GO:0034098) |
| 0.1 | 1.5 | GO:0048188 | Set1C/COMPASS complex(GO:0048188) |
| 0.1 | 0.1 | GO:0070044 | synaptobrevin 2-SNAP-25-syntaxin-1a complex(GO:0070044) |
| 0.1 | 0.8 | GO:0043190 | ATP-binding cassette (ABC) transporter complex(GO:0043190) |
| 0.1 | 2.0 | GO:0031229 | integral component of nuclear inner membrane(GO:0005639) intrinsic component of nuclear inner membrane(GO:0031229) |
| 0.1 | 0.4 | GO:0090571 | RNA polymerase II transcription repressor complex(GO:0090571) |
| 0.1 | 1.3 | GO:0090543 | Flemming body(GO:0090543) |
| 0.1 | 1.9 | GO:0035145 | exon-exon junction complex(GO:0035145) |
| 0.1 | 1.0 | GO:0031618 | nuclear pericentric heterochromatin(GO:0031618) |
| 0.1 | 2.7 | GO:0031233 | intrinsic component of external side of plasma membrane(GO:0031233) |
| 0.1 | 0.4 | GO:0035976 | AP1 complex(GO:0035976) |
| 0.1 | 1.1 | GO:0030126 | COPI vesicle coat(GO:0030126) |
| 0.1 | 0.3 | GO:0000839 | Hrd1p ubiquitin ligase ERAD-L complex(GO:0000839) |
| 0.1 | 0.5 | GO:0030688 | preribosome, small subunit precursor(GO:0030688) |
| 0.1 | 0.4 | GO:0097413 | Lewy body(GO:0097413) |
| 0.1 | 0.4 | GO:0043564 | Ku70:Ku80 complex(GO:0043564) |
| 0.1 | 6.0 | GO:0035577 | azurophil granule membrane(GO:0035577) |
| 0.1 | 0.4 | GO:1990452 | Parkin-FBXW7-Cul1 ubiquitin ligase complex(GO:1990452) |
| 0.1 | 0.8 | GO:0032059 | bleb(GO:0032059) |
| 0.1 | 3.7 | GO:0019005 | SCF ubiquitin ligase complex(GO:0019005) |
| 0.1 | 0.3 | GO:0042613 | MHC class II protein complex(GO:0042613) |
| 0.1 | 0.5 | GO:0044218 | other organism cell membrane(GO:0044218) other organism membrane(GO:0044279) |
| 0.1 | 13.9 | GO:0055037 | recycling endosome(GO:0055037) |
| 0.1 | 1.8 | GO:0000145 | exocyst(GO:0000145) |
| 0.1 | 0.7 | GO:0042382 | paraspeckles(GO:0042382) |
| 0.1 | 0.8 | GO:0000137 | Golgi cis cisterna(GO:0000137) |
| 0.1 | 0.7 | GO:0045254 | pyruvate dehydrogenase complex(GO:0045254) |
| 0.1 | 0.9 | GO:0005915 | zonula adherens(GO:0005915) |
| 0.1 | 0.4 | GO:0089701 | U2AF(GO:0089701) |
| 0.1 | 1.7 | GO:0031083 | BLOC-1 complex(GO:0031083) |
| 0.1 | 0.9 | GO:0005686 | U2 snRNP(GO:0005686) |
| 0.1 | 0.4 | GO:0089717 | spanning component of plasma membrane(GO:0044214) spanning component of membrane(GO:0089717) |
| 0.1 | 5.6 | GO:0031463 | Cul3-RING ubiquitin ligase complex(GO:0031463) |
| 0.1 | 0.6 | GO:0000015 | phosphopyruvate hydratase complex(GO:0000015) |
| 0.1 | 0.2 | GO:0002945 | cyclin K-CDK13 complex(GO:0002945) |
| 0.1 | 0.4 | GO:0070436 | Grb2-EGFR complex(GO:0070436) |
| 0.1 | 7.0 | GO:0005901 | caveola(GO:0005901) |
| 0.1 | 0.9 | GO:0005862 | muscle thin filament tropomyosin(GO:0005862) |
| 0.1 | 4.1 | GO:0001772 | immunological synapse(GO:0001772) |
| 0.1 | 0.2 | GO:0000126 | transcription factor TFIIIB complex(GO:0000126) |
| 0.1 | 0.8 | GO:0008385 | IkappaB kinase complex(GO:0008385) |
| 0.1 | 0.2 | GO:1990907 | beta-catenin-TCF complex(GO:1990907) |
| 0.1 | 0.6 | GO:0097208 | alveolar lamellar body(GO:0097208) |
| 0.1 | 3.0 | GO:0008023 | transcription elongation factor complex(GO:0008023) |
| 0.1 | 0.4 | GO:0070847 | core mediator complex(GO:0070847) |
| 0.1 | 2.0 | GO:0031258 | lamellipodium membrane(GO:0031258) |
| 0.1 | 0.2 | GO:0043219 | lateral loop(GO:0043219) |
| 0.1 | 0.6 | GO:0043203 | axon hillock(GO:0043203) |
| 0.1 | 0.2 | GO:0035370 | UBC13-UEV1A complex(GO:0035370) |
| 0.1 | 0.3 | GO:0045240 | dihydrolipoyl dehydrogenase complex(GO:0045240) |
| 0.1 | 0.3 | GO:0030915 | Smc5-Smc6 complex(GO:0030915) |
| 0.1 | 0.7 | GO:0030478 | actin cap(GO:0030478) |
| 0.1 | 7.1 | GO:0016605 | PML body(GO:0016605) |
| 0.0 | 2.9 | GO:0042645 | nucleoid(GO:0009295) mitochondrial nucleoid(GO:0042645) |
| 0.0 | 0.2 | GO:0071942 | XPC complex(GO:0071942) |
| 0.0 | 0.2 | GO:0042720 | mitochondrial inner membrane peptidase complex(GO:0042720) |
| 0.0 | 0.3 | GO:0030868 | smooth endoplasmic reticulum membrane(GO:0030868) smooth endoplasmic reticulum part(GO:0097425) |
| 0.0 | 0.4 | GO:0033269 | internode region of axon(GO:0033269) |
| 0.0 | 4.4 | GO:0099501 | synaptic vesicle membrane(GO:0030672) exocytic vesicle membrane(GO:0099501) |
| 0.0 | 0.3 | GO:0033503 | HULC complex(GO:0033503) |
| 0.0 | 0.6 | GO:0002199 | zona pellucida receptor complex(GO:0002199) |
| 0.0 | 0.5 | GO:0000506 | glycosylphosphatidylinositol-N-acetylglucosaminyltransferase (GPI-GnT) complex(GO:0000506) |
| 0.0 | 0.5 | GO:0042583 | chromaffin granule(GO:0042583) |
| 0.0 | 0.2 | GO:0097169 | AIM2 inflammasome complex(GO:0097169) |
| 0.0 | 0.2 | GO:0002189 | ribose phosphate diphosphokinase complex(GO:0002189) |
| 0.0 | 1.4 | GO:0005640 | nuclear outer membrane(GO:0005640) |
| 0.0 | 0.2 | GO:0000788 | nuclear nucleosome(GO:0000788) |
| 0.0 | 0.6 | GO:0034663 | endoplasmic reticulum chaperone complex(GO:0034663) |
| 0.0 | 0.2 | GO:0044233 | ER-mitochondrion membrane contact site(GO:0044233) |
| 0.0 | 5.0 | GO:0001669 | acrosomal vesicle(GO:0001669) |
| 0.0 | 1.1 | GO:1990124 | messenger ribonucleoprotein complex(GO:1990124) |
| 0.0 | 0.3 | GO:0072687 | meiotic spindle(GO:0072687) |
| 0.0 | 2.8 | GO:0005796 | Golgi lumen(GO:0005796) |
| 0.0 | 1.0 | GO:0031235 | intrinsic component of the cytoplasmic side of the plasma membrane(GO:0031235) |
| 0.0 | 0.1 | GO:0070522 | ERCC4-ERCC1 complex(GO:0070522) |
| 0.0 | 0.4 | GO:0005845 | mRNA cap binding complex(GO:0005845) |
| 0.0 | 1.0 | GO:0031306 | intrinsic component of mitochondrial outer membrane(GO:0031306) |
| 0.0 | 0.4 | GO:0031931 | TORC1 complex(GO:0031931) |
| 0.0 | 0.2 | GO:0035686 | sperm fibrous sheath(GO:0035686) |
| 0.0 | 0.1 | GO:1990425 | ryanodine receptor complex(GO:1990425) |
| 0.0 | 0.2 | GO:0031466 | Cul5-RING ubiquitin ligase complex(GO:0031466) |
| 0.0 | 0.2 | GO:0033179 | proton-transporting V-type ATPase, V0 domain(GO:0033179) |
| 0.0 | 0.1 | GO:0045323 | interleukin-1 receptor complex(GO:0045323) |
| 0.0 | 0.1 | GO:0017102 | methionyl glutamyl tRNA synthetase complex(GO:0017102) |
| 0.0 | 0.4 | GO:0005750 | mitochondrial respiratory chain complex III(GO:0005750) respiratory chain complex III(GO:0045275) |
| 0.0 | 0.4 | GO:0072546 | ER membrane protein complex(GO:0072546) |
| 0.0 | 1.7 | GO:0030173 | integral component of Golgi membrane(GO:0030173) |
| 0.0 | 2.9 | GO:0032588 | trans-Golgi network membrane(GO:0032588) |
| 0.0 | 0.3 | GO:0031045 | dense core granule(GO:0031045) |
| 0.0 | 0.6 | GO:0001518 | voltage-gated sodium channel complex(GO:0001518) |
| 0.0 | 0.5 | GO:0033270 | paranode region of axon(GO:0033270) |
| 0.0 | 0.1 | GO:0070083 | clathrin-sculpted monoamine transport vesicle(GO:0070081) clathrin-sculpted monoamine transport vesicle membrane(GO:0070083) |
| 0.0 | 0.6 | GO:0016580 | Sin3 complex(GO:0016580) |
| 0.0 | 0.1 | GO:0009328 | phenylalanine-tRNA ligase complex(GO:0009328) |
| 0.0 | 0.6 | GO:0097228 | sperm principal piece(GO:0097228) |
| 0.0 | 0.4 | GO:0008278 | cohesin complex(GO:0008278) |
| 0.0 | 0.3 | GO:0008541 | proteasome regulatory particle, lid subcomplex(GO:0008541) |
| 0.0 | 1.0 | GO:1902710 | GABA receptor complex(GO:1902710) GABA-A receptor complex(GO:1902711) |
| 0.0 | 0.1 | GO:0034365 | discoidal high-density lipoprotein particle(GO:0034365) |
| 0.0 | 0.3 | GO:0005955 | calcineurin complex(GO:0005955) |
| 0.0 | 0.5 | GO:0030904 | retromer complex(GO:0030904) |
| 0.0 | 1.0 | GO:0005771 | multivesicular body(GO:0005771) |
| 0.0 | 0.7 | GO:0035371 | microtubule plus-end(GO:0035371) |
| 0.0 | 0.2 | GO:0098536 | deuterosome(GO:0098536) |
| 0.0 | 0.6 | GO:0042629 | mast cell granule(GO:0042629) |
| 0.0 | 1.1 | GO:0000159 | protein phosphatase type 2A complex(GO:0000159) |
| 0.0 | 2.3 | GO:0016363 | nuclear matrix(GO:0016363) |
| 0.0 | 0.3 | GO:0008250 | oligosaccharyltransferase complex(GO:0008250) |
| 0.0 | 0.9 | GO:0030670 | phagocytic vesicle membrane(GO:0030670) |
| 0.0 | 2.8 | GO:0048770 | melanosome(GO:0042470) pigment granule(GO:0048770) |
| 0.0 | 0.2 | GO:0031616 | spindle pole centrosome(GO:0031616) |
| 0.0 | 1.1 | GO:0000307 | cyclin-dependent protein kinase holoenzyme complex(GO:0000307) |
| 0.0 | 0.6 | GO:0031201 | SNARE complex(GO:0031201) |
| 0.0 | 0.9 | GO:0031941 | filamentous actin(GO:0031941) |
| 0.0 | 0.2 | GO:0060091 | kinocilium(GO:0060091) |
| 0.0 | 0.1 | GO:0030934 | anchoring collagen complex(GO:0030934) |
| 0.0 | 0.5 | GO:0005652 | nuclear lamina(GO:0005652) |
| 0.0 | 0.2 | GO:0008091 | spectrin(GO:0008091) |
| 0.0 | 0.2 | GO:0019773 | proteasome core complex, alpha-subunit complex(GO:0019773) |
| 0.0 | 0.3 | GO:0032591 | dendritic spine membrane(GO:0032591) |
| 0.0 | 0.1 | GO:1990635 | proximal dendrite(GO:1990635) |
| 0.0 | 9.5 | GO:0005578 | proteinaceous extracellular matrix(GO:0005578) |
| 0.0 | 0.8 | GO:0005637 | nuclear inner membrane(GO:0005637) |
| 0.0 | 0.1 | GO:0044305 | calyx of Held(GO:0044305) |
| 0.0 | 0.0 | GO:0033185 | dolichol-phosphate-mannose synthase complex(GO:0033185) |
| 0.0 | 1.1 | GO:0014704 | intercalated disc(GO:0014704) |
| 0.0 | 0.3 | GO:0000177 | cytoplasmic exosome (RNase complex)(GO:0000177) |
| 0.0 | 0.4 | GO:0044665 | MLL1/2 complex(GO:0044665) MLL1 complex(GO:0071339) |
| 0.0 | 0.3 | GO:0070937 | CRD-mediated mRNA stability complex(GO:0070937) |
| 0.0 | 0.2 | GO:0071682 | endocytic vesicle lumen(GO:0071682) |
| 0.0 | 0.2 | GO:0097539 | ciliary transition fiber(GO:0097539) |
| 0.0 | 0.9 | GO:1904724 | tertiary granule lumen(GO:1904724) |
| 0.0 | 3.2 | GO:0009898 | cytoplasmic side of plasma membrane(GO:0009898) |
| 0.0 | 5.6 | GO:0016607 | nuclear speck(GO:0016607) |
| 0.0 | 0.3 | GO:0101003 | ficolin-1-rich granule membrane(GO:0101003) |
| 0.0 | 0.2 | GO:0001520 | outer dense fiber(GO:0001520) |
| 0.0 | 0.1 | GO:0098533 | ATPase dependent transmembrane transport complex(GO:0098533) ATPase complex(GO:1904949) |
| 0.0 | 1.0 | GO:0070821 | tertiary granule membrane(GO:0070821) |
Gene overrepresentation in molecular function category:
| Log-likelihood per target | Total log-likelihood | Term | Description |
|---|---|---|---|
| 3.2 | 9.7 | GO:0008859 | exoribonuclease II activity(GO:0008859) |
| 2.2 | 8.7 | GO:0034041 | sterol-transporting ATPase activity(GO:0034041) |
| 1.8 | 9.0 | GO:0004965 | G-protein coupled GABA receptor activity(GO:0004965) |
| 1.5 | 7.3 | GO:0016230 | sphingomyelin phosphodiesterase activator activity(GO:0016230) |
| 1.4 | 27.1 | GO:0061578 | Lys63-specific deubiquitinase activity(GO:0061578) |
| 1.2 | 18.0 | GO:0005381 | iron ion transmembrane transporter activity(GO:0005381) |
| 1.2 | 3.5 | GO:0009383 | rRNA (cytosine-C5-)-methyltransferase activity(GO:0009383) |
| 1.1 | 4.4 | GO:0098770 | FBXO family protein binding(GO:0098770) |
| 1.1 | 5.5 | GO:0047280 | nicotinamide phosphoribosyltransferase activity(GO:0047280) |
| 0.9 | 11.0 | GO:0033691 | sialic acid binding(GO:0033691) |
| 0.9 | 2.7 | GO:0004912 | interleukin-3 receptor activity(GO:0004912) interleukin-5 receptor activity(GO:0004914) |
| 0.9 | 3.6 | GO:0050211 | procollagen galactosyltransferase activity(GO:0050211) |
| 0.9 | 4.4 | GO:0046899 | nucleoside triphosphate adenylate kinase activity(GO:0046899) |
| 0.9 | 2.6 | GO:0005137 | interleukin-5 receptor binding(GO:0005137) |
| 0.8 | 2.5 | GO:0004421 | hydroxymethylglutaryl-CoA synthase activity(GO:0004421) |
| 0.8 | 7.5 | GO:0008597 | calcium-dependent protein serine/threonine phosphatase regulator activity(GO:0008597) |
| 0.8 | 3.2 | GO:0004906 | interferon-gamma receptor activity(GO:0004906) |
| 0.8 | 2.4 | GO:0031731 | CCR6 chemokine receptor binding(GO:0031731) |
| 0.8 | 3.1 | GO:0046933 | proton-transporting ATP synthase activity, rotational mechanism(GO:0046933) |
| 0.8 | 2.3 | GO:0070362 | mitochondrial light strand promoter anti-sense binding(GO:0070361) mitochondrial heavy strand promoter anti-sense binding(GO:0070362) mitochondrial heavy strand promoter sense binding(GO:0070364) |
| 0.7 | 13.0 | GO:0031996 | thioesterase binding(GO:0031996) |
| 0.7 | 2.1 | GO:0060001 | minus-end directed microfilament motor activity(GO:0060001) |
| 0.7 | 6.1 | GO:0031730 | CCR5 chemokine receptor binding(GO:0031730) |
| 0.6 | 3.9 | GO:0031962 | mineralocorticoid receptor binding(GO:0031962) |
| 0.6 | 3.9 | GO:0042978 | ornithine decarboxylase activator activity(GO:0042978) |
| 0.5 | 7.1 | GO:0005078 | MAP-kinase scaffold activity(GO:0005078) |
| 0.5 | 1.5 | GO:0000035 | acyl binding(GO:0000035) |
| 0.5 | 3.4 | GO:0004045 | aminoacyl-tRNA hydrolase activity(GO:0004045) |
| 0.5 | 4.3 | GO:0019238 | cyclohydrolase activity(GO:0019238) |
| 0.5 | 4.1 | GO:0003726 | double-stranded RNA adenosine deaminase activity(GO:0003726) |
| 0.4 | 4.4 | GO:0001042 | RNA polymerase I core binding(GO:0001042) |
| 0.4 | 4.3 | GO:0089720 | caspase binding(GO:0089720) |
| 0.4 | 1.7 | GO:0034353 | RNA pyrophosphohydrolase activity(GO:0034353) |
| 0.4 | 1.3 | GO:0052858 | peptidyl-lysine N-acetyltransferase activity, acting on acetyl phosphate as donor(GO:0052858) |
| 0.4 | 6.6 | GO:0001075 | transcription factor activity, RNA polymerase II core promoter sequence-specific binding involved in preinitiation complex assembly(GO:0001075) |
| 0.4 | 1.6 | GO:0016426 | tRNA (adenine) methyltransferase activity(GO:0016426) |
| 0.4 | 11.5 | GO:0004298 | threonine-type endopeptidase activity(GO:0004298) threonine-type peptidase activity(GO:0070003) |
| 0.4 | 7.7 | GO:0004062 | aryl sulfotransferase activity(GO:0004062) |
| 0.4 | 1.5 | GO:0097677 | STAT family protein binding(GO:0097677) |
| 0.4 | 1.1 | GO:0090541 | MIT domain binding(GO:0090541) |
| 0.4 | 3.0 | GO:0015440 | peptide-transporting ATPase activity(GO:0015440) MHC class Ib protein binding(GO:0023029) TAP2 binding(GO:0046979) |
| 0.4 | 1.5 | GO:0034191 | apolipoprotein A-I receptor binding(GO:0034191) |
| 0.4 | 0.7 | GO:0070039 | rRNA (guanosine-2'-O-)-methyltransferase activity(GO:0070039) |
| 0.4 | 1.1 | GO:0004507 | steroid 11-beta-monooxygenase activity(GO:0004507) corticosterone 18-monooxygenase activity(GO:0047783) |
| 0.4 | 1.1 | GO:0005483 | soluble NSF attachment protein activity(GO:0005483) |
| 0.3 | 1.0 | GO:0034602 | oxoglutarate dehydrogenase (NAD+) activity(GO:0034602) |
| 0.3 | 5.6 | GO:0016423 | tRNA (guanine) methyltransferase activity(GO:0016423) |
| 0.3 | 0.9 | GO:0035575 | histone demethylase activity (H4-K20 specific)(GO:0035575) |
| 0.3 | 5.3 | GO:0036374 | glutathione hydrolase activity(GO:0036374) |
| 0.3 | 10.0 | GO:0031434 | mitogen-activated protein kinase kinase binding(GO:0031434) |
| 0.3 | 4.2 | GO:0032050 | clathrin heavy chain binding(GO:0032050) |
| 0.3 | 0.8 | GO:0008476 | protein-tyrosine sulfotransferase activity(GO:0008476) |
| 0.3 | 1.1 | GO:0004365 | glyceraldehyde-3-phosphate dehydrogenase (NAD+) (phosphorylating) activity(GO:0004365) glyceraldehyde-3-phosphate dehydrogenase (NAD(P)+) (phosphorylating) activity(GO:0043891) |
| 0.3 | 1.9 | GO:0015333 | peptide:proton symporter activity(GO:0015333) proton-dependent peptide secondary active transmembrane transporter activity(GO:0022897) |
| 0.3 | 1.1 | GO:0070139 | ubiquitin-like protein-specific endopeptidase activity(GO:0070137) SUMO-specific endopeptidase activity(GO:0070139) |
| 0.3 | 7.0 | GO:0017049 | GTP-Rho binding(GO:0017049) |
| 0.3 | 2.1 | GO:0044547 | DNA topoisomerase binding(GO:0044547) |
| 0.3 | 2.1 | GO:0034604 | pyruvate dehydrogenase activity(GO:0004738) pyruvate dehydrogenase [NAD(P)+] activity(GO:0034603) pyruvate dehydrogenase (NAD+) activity(GO:0034604) |
| 0.3 | 1.3 | GO:0019912 | cyclin-dependent protein kinase activating kinase activity(GO:0019912) |
| 0.2 | 0.2 | GO:0032427 | GBD domain binding(GO:0032427) |
| 0.2 | 0.9 | GO:0004741 | [pyruvate dehydrogenase (lipoamide)] phosphatase activity(GO:0004741) |
| 0.2 | 2.5 | GO:0008428 | ribonuclease inhibitor activity(GO:0008428) |
| 0.2 | 1.5 | GO:1904288 | BAT3 complex binding(GO:1904288) |
| 0.2 | 1.9 | GO:0004687 | myosin light chain kinase activity(GO:0004687) |
| 0.2 | 0.8 | GO:0002046 | opsin binding(GO:0002046) |
| 0.2 | 1.2 | GO:0004176 | ATP-dependent peptidase activity(GO:0004176) |
| 0.2 | 1.8 | GO:0035174 | histone serine kinase activity(GO:0035174) |
| 0.2 | 0.8 | GO:0008478 | pyridoxal kinase activity(GO:0008478) |
| 0.2 | 2.0 | GO:0004931 | extracellular ATP-gated cation channel activity(GO:0004931) ATP-gated ion channel activity(GO:0035381) |
| 0.2 | 1.1 | GO:0010521 | telomerase inhibitor activity(GO:0010521) |
| 0.2 | 0.4 | GO:0035402 | histone kinase activity (H3-T11 specific)(GO:0035402) |
| 0.2 | 1.2 | GO:0004459 | L-lactate dehydrogenase activity(GO:0004459) |
| 0.2 | 1.0 | GO:0070568 | guanylyltransferase activity(GO:0070568) |
| 0.2 | 4.7 | GO:0043274 | phospholipase binding(GO:0043274) |
| 0.2 | 3.7 | GO:0051400 | BH domain binding(GO:0051400) |
| 0.2 | 1.2 | GO:0035473 | lipase binding(GO:0035473) |
| 0.2 | 0.8 | GO:0061676 | importin-alpha family protein binding(GO:0061676) |
| 0.2 | 0.5 | GO:0004613 | phosphoenolpyruvate carboxykinase activity(GO:0004611) phosphoenolpyruvate carboxykinase (GTP) activity(GO:0004613) |
| 0.2 | 0.8 | GO:0019776 | Atg8 ligase activity(GO:0019776) |
| 0.2 | 2.7 | GO:0008429 | phosphatidylethanolamine binding(GO:0008429) |
| 0.2 | 1.1 | GO:0015181 | arginine transmembrane transporter activity(GO:0015181) |
| 0.2 | 1.1 | GO:0061133 | endopeptidase activator activity(GO:0061133) |
| 0.2 | 1.0 | GO:0004656 | procollagen-proline 4-dioxygenase activity(GO:0004656) |
| 0.2 | 0.5 | GO:0050146 | nucleoside phosphotransferase activity(GO:0050146) |
| 0.2 | 0.5 | GO:0102008 | cytosolic dipeptidase activity(GO:0102008) |
| 0.2 | 1.2 | GO:0071532 | ankyrin repeat binding(GO:0071532) |
| 0.2 | 0.6 | GO:0008745 | N-acetylmuramoyl-L-alanine amidase activity(GO:0008745) |
| 0.1 | 3.5 | GO:0019870 | potassium channel inhibitor activity(GO:0019870) |
| 0.1 | 0.7 | GO:0004882 | androgen receptor activity(GO:0004882) |
| 0.1 | 0.9 | GO:0015204 | urea transmembrane transporter activity(GO:0015204) |
| 0.1 | 0.3 | GO:0004769 | steroid delta-isomerase activity(GO:0004769) |
| 0.1 | 0.9 | GO:0005497 | androgen binding(GO:0005497) |
| 0.1 | 0.8 | GO:0045029 | UDP-activated nucleotide receptor activity(GO:0045029) |
| 0.1 | 0.4 | GO:0005459 | UDP-galactose transmembrane transporter activity(GO:0005459) |
| 0.1 | 1.3 | GO:0036402 | proteasome-activating ATPase activity(GO:0036402) |
| 0.1 | 1.3 | GO:0051880 | G-quadruplex DNA binding(GO:0051880) |
| 0.1 | 0.7 | GO:0003986 | acetyl-CoA hydrolase activity(GO:0003986) |
| 0.1 | 0.4 | GO:0008336 | gamma-butyrobetaine dioxygenase activity(GO:0008336) |
| 0.1 | 0.5 | GO:0016774 | phosphotransferase activity, carboxyl group as acceptor(GO:0016774) |
| 0.1 | 1.8 | GO:0052658 | inositol-1,4,5-trisphosphate 5-phosphatase activity(GO:0052658) |
| 0.1 | 0.9 | GO:0044020 | histone methyltransferase activity (H4-R3 specific)(GO:0044020) |
| 0.1 | 0.4 | GO:0004874 | aryl hydrocarbon receptor activity(GO:0004874) |
| 0.1 | 3.0 | GO:0035497 | cAMP response element binding(GO:0035497) |
| 0.1 | 0.7 | GO:0004720 | protein-lysine 6-oxidase activity(GO:0004720) |
| 0.1 | 1.1 | GO:0086006 | voltage-gated sodium channel activity involved in cardiac muscle cell action potential(GO:0086006) |
| 0.1 | 4.0 | GO:0070273 | phosphatidylinositol-4-phosphate binding(GO:0070273) |
| 0.1 | 0.8 | GO:0070513 | death domain binding(GO:0070513) |
| 0.1 | 0.5 | GO:0047757 | chondroitin-glucuronate 5-epimerase activity(GO:0047757) |
| 0.1 | 0.3 | GO:0033699 | DNA 5'-adenosine monophosphate hydrolase activity(GO:0033699) |
| 0.1 | 0.8 | GO:0005375 | copper ion transmembrane transporter activity(GO:0005375) |
| 0.1 | 0.3 | GO:0000247 | C-8 sterol isomerase activity(GO:0000247) |
| 0.1 | 0.3 | GO:0070890 | L-ascorbate:sodium symporter activity(GO:0008520) L-ascorbic acid transporter activity(GO:0015229) sodium-dependent L-ascorbate transmembrane transporter activity(GO:0070890) |
| 0.1 | 1.0 | GO:0004704 | NF-kappaB-inducing kinase activity(GO:0004704) |
| 0.1 | 0.4 | GO:0031716 | calcitonin receptor binding(GO:0031716) |
| 0.1 | 1.3 | GO:0043996 | histone acetyltransferase activity (H4-K5 specific)(GO:0043995) histone acetyltransferase activity (H4-K8 specific)(GO:0043996) histone acetyltransferase activity (H4-K16 specific)(GO:0046972) |
| 0.1 | 0.4 | GO:0045127 | N-acetylglucosamine kinase activity(GO:0045127) |
| 0.1 | 0.8 | GO:0004468 | lysine N-acetyltransferase activity, acting on acetyl phosphate as donor(GO:0004468) |
| 0.1 | 0.5 | GO:0004167 | dopachrome isomerase activity(GO:0004167) |
| 0.1 | 0.6 | GO:0003835 | beta-galactoside alpha-2,6-sialyltransferase activity(GO:0003835) |
| 0.1 | 0.5 | GO:0033906 | hyaluronoglucuronidase activity(GO:0033906) |
| 0.1 | 1.6 | GO:0043522 | leucine zipper domain binding(GO:0043522) |
| 0.1 | 0.3 | GO:0005260 | channel-conductance-controlling ATPase activity(GO:0005260) |
| 0.1 | 1.5 | GO:0001730 | 2'-5'-oligoadenylate synthetase activity(GO:0001730) |
| 0.1 | 1.9 | GO:0047372 | acylglycerol lipase activity(GO:0047372) |
| 0.1 | 0.5 | GO:0043183 | vascular endothelial growth factor receptor 1 binding(GO:0043183) |
| 0.1 | 1.1 | GO:0000340 | RNA 7-methylguanosine cap binding(GO:0000340) |
| 0.1 | 0.8 | GO:0004340 | glucokinase activity(GO:0004340) hexokinase activity(GO:0004396) fructokinase activity(GO:0008865) mannokinase activity(GO:0019158) |
| 0.1 | 0.5 | GO:0031728 | CCR3 chemokine receptor binding(GO:0031728) |
| 0.1 | 0.3 | GO:0060175 | brain-derived neurotrophic factor-activated receptor activity(GO:0060175) |
| 0.1 | 1.4 | GO:0004000 | adenosine deaminase activity(GO:0004000) |
| 0.1 | 0.6 | GO:0005157 | macrophage colony-stimulating factor receptor binding(GO:0005157) |
| 0.1 | 0.5 | GO:0004839 | ubiquitin activating enzyme activity(GO:0004839) |
| 0.1 | 11.2 | GO:0005518 | collagen binding(GO:0005518) |
| 0.1 | 0.7 | GO:0019237 | centromeric DNA binding(GO:0019237) |
| 0.1 | 1.1 | GO:0005168 | neurotrophin TRKA receptor binding(GO:0005168) |
| 0.1 | 0.2 | GO:0003955 | NAD(P)H dehydrogenase (quinone) activity(GO:0003955) |
| 0.1 | 6.1 | GO:0001105 | RNA polymerase II transcription coactivator activity(GO:0001105) |
| 0.1 | 0.5 | GO:0016004 | phospholipase activator activity(GO:0016004) |
| 0.1 | 0.2 | GO:0098808 | mRNA cap binding(GO:0098808) |
| 0.1 | 2.2 | GO:0031489 | myosin V binding(GO:0031489) |
| 0.1 | 0.8 | GO:0070053 | thrombospondin receptor activity(GO:0070053) |
| 0.1 | 1.4 | GO:0035925 | mRNA 3'-UTR AU-rich region binding(GO:0035925) |
| 0.1 | 0.6 | GO:0005172 | vascular endothelial growth factor receptor binding(GO:0005172) |
| 0.1 | 0.7 | GO:0070181 | small ribosomal subunit rRNA binding(GO:0070181) |
| 0.1 | 21.6 | GO:0004252 | serine-type endopeptidase activity(GO:0004252) |
| 0.1 | 0.3 | GO:0051538 | 3 iron, 4 sulfur cluster binding(GO:0051538) |
| 0.1 | 3.6 | GO:0042162 | telomeric DNA binding(GO:0042162) |
| 0.1 | 0.4 | GO:0008079 | translation release factor activity(GO:0003747) translation termination factor activity(GO:0008079) |
| 0.1 | 0.7 | GO:0005237 | inhibitory extracellular ligand-gated ion channel activity(GO:0005237) |
| 0.1 | 0.3 | GO:0003945 | N-acetyllactosamine synthase activity(GO:0003945) |
| 0.1 | 1.2 | GO:0005432 | calcium:sodium antiporter activity(GO:0005432) |
| 0.1 | 0.3 | GO:0004420 | hydroxymethylglutaryl-CoA reductase (NADPH) activity(GO:0004420) hydroxymethylglutaryl-CoA reductase activity(GO:0042282) |
| 0.1 | 0.3 | GO:0004392 | heme oxygenase (decyclizing) activity(GO:0004392) |
| 0.1 | 0.3 | GO:0070735 | protein-glycine ligase activity(GO:0070735) |
| 0.1 | 0.6 | GO:0060072 | large conductance calcium-activated potassium channel activity(GO:0060072) |
| 0.1 | 2.7 | GO:0008157 | protein phosphatase 1 binding(GO:0008157) |
| 0.1 | 4.9 | GO:0019003 | GDP binding(GO:0019003) |
| 0.1 | 2.2 | GO:0005035 | tumor necrosis factor-activated receptor activity(GO:0005031) death receptor activity(GO:0005035) |
| 0.1 | 0.6 | GO:0004634 | phosphopyruvate hydratase activity(GO:0004634) |
| 0.1 | 1.3 | GO:0008195 | phosphatidate phosphatase activity(GO:0008195) |
| 0.1 | 0.2 | GO:0047389 | glycerophosphocholine phosphodiesterase activity(GO:0047389) |
| 0.1 | 0.3 | GO:0003964 | telomerase activity(GO:0003720) RNA-directed DNA polymerase activity(GO:0003964) |
| 0.1 | 1.3 | GO:0004859 | phospholipase inhibitor activity(GO:0004859) |
| 0.1 | 0.4 | GO:0050816 | phosphothreonine binding(GO:0050816) |
| 0.1 | 0.2 | GO:0001026 | TFIIIB-type transcription factor activity(GO:0001026) TFIIIC-class transcription factor binding(GO:0001156) |
| 0.1 | 3.5 | GO:0042169 | SH2 domain binding(GO:0042169) |
| 0.1 | 3.1 | GO:0015485 | cholesterol binding(GO:0015485) |
| 0.1 | 4.5 | GO:0050681 | androgen receptor binding(GO:0050681) |
| 0.1 | 0.3 | GO:0008321 | Ral guanyl-nucleotide exchange factor activity(GO:0008321) |
| 0.1 | 6.7 | GO:0001618 | virus receptor activity(GO:0001618) |
| 0.1 | 0.4 | GO:0005052 | peroxisome matrix targeting signal-1 binding(GO:0005052) |
| 0.1 | 0.6 | GO:0017034 | Rap guanyl-nucleotide exchange factor activity(GO:0017034) |
| 0.1 | 0.6 | GO:0031821 | G-protein coupled serotonin receptor binding(GO:0031821) |
| 0.1 | 7.2 | GO:0004867 | serine-type endopeptidase inhibitor activity(GO:0004867) |
| 0.1 | 0.3 | GO:0004013 | adenosylhomocysteinase activity(GO:0004013) trialkylsulfonium hydrolase activity(GO:0016802) |
| 0.1 | 1.0 | GO:0052629 | phosphatidylinositol-3,5-bisphosphate 3-phosphatase activity(GO:0052629) |
| 0.1 | 0.6 | GO:0017151 | DEAD/H-box RNA helicase binding(GO:0017151) |
| 0.1 | 0.4 | GO:0001849 | complement component C1q binding(GO:0001849) |
| 0.1 | 0.3 | GO:0004716 | receptor signaling protein tyrosine kinase activity(GO:0004716) |
| 0.1 | 1.0 | GO:0048018 | receptor agonist activity(GO:0048018) |
| 0.1 | 0.8 | GO:0004708 | MAP kinase kinase activity(GO:0004708) |
| 0.1 | 0.5 | GO:0017176 | phosphatidylinositol N-acetylglucosaminyltransferase activity(GO:0017176) |
| 0.1 | 0.8 | GO:0086080 | protein binding involved in heterotypic cell-cell adhesion(GO:0086080) |
| 0.1 | 0.6 | GO:0000339 | RNA cap binding(GO:0000339) |
| 0.1 | 0.2 | GO:0001010 | transcription factor activity, sequence-specific DNA binding transcription factor recruiting(GO:0001010) |
| 0.1 | 1.6 | GO:0043325 | phosphatidylinositol-3,4-bisphosphate binding(GO:0043325) |
| 0.0 | 1.3 | GO:0050321 | tau-protein kinase activity(GO:0050321) |
| 0.0 | 0.9 | GO:0070300 | phosphatidic acid binding(GO:0070300) |
| 0.0 | 0.2 | GO:0004994 | somatostatin receptor activity(GO:0004994) |
| 0.0 | 0.2 | GO:0047676 | arachidonate-CoA ligase activity(GO:0047676) |
| 0.0 | 0.3 | GO:0045134 | uridine-diphosphatase activity(GO:0045134) |
| 0.0 | 0.5 | GO:0051864 | histone demethylase activity (H3-K36 specific)(GO:0051864) |
| 0.0 | 0.2 | GO:0070644 | vitamin D response element binding(GO:0070644) |
| 0.0 | 1.0 | GO:0070566 | adenylyltransferase activity(GO:0070566) |
| 0.0 | 2.5 | GO:0061631 | ubiquitin conjugating enzyme activity(GO:0061631) |
| 0.0 | 0.3 | GO:0016015 | morphogen activity(GO:0016015) |
| 0.0 | 0.2 | GO:0071558 | histone demethylase activity (H3-K27 specific)(GO:0071558) |
| 0.0 | 0.1 | GO:0004937 | alpha1-adrenergic receptor activity(GO:0004937) |
| 0.0 | 0.6 | GO:0015385 | sodium:proton antiporter activity(GO:0015385) |
| 0.0 | 0.3 | GO:0039552 | RIG-I binding(GO:0039552) |
| 0.0 | 3.1 | GO:0008408 | 3'-5' exonuclease activity(GO:0008408) |
| 0.0 | 2.0 | GO:0004003 | ATP-dependent DNA helicase activity(GO:0004003) |
| 0.0 | 1.9 | GO:0030159 | receptor signaling complex scaffold activity(GO:0030159) |
| 0.0 | 1.0 | GO:0097602 | cullin family protein binding(GO:0097602) |
| 0.0 | 0.1 | GO:0004591 | oxoglutarate dehydrogenase (succinyl-transferring) activity(GO:0004591) |
| 0.0 | 3.4 | GO:0048306 | calcium-dependent protein binding(GO:0048306) |
| 0.0 | 1.1 | GO:0030898 | actin-dependent ATPase activity(GO:0030898) |
| 0.0 | 0.4 | GO:0008420 | CTD phosphatase activity(GO:0008420) |
| 0.0 | 2.1 | GO:0017080 | sodium channel regulator activity(GO:0017080) |
| 0.0 | 2.4 | GO:0070412 | R-SMAD binding(GO:0070412) |
| 0.0 | 1.2 | GO:0070064 | proline-rich region binding(GO:0070064) |
| 0.0 | 0.6 | GO:0031701 | angiotensin receptor binding(GO:0031701) type 1 angiotensin receptor binding(GO:0031702) |
| 0.0 | 0.3 | GO:0070569 | uridylyltransferase activity(GO:0070569) |
| 0.0 | 0.7 | GO:0017017 | MAP kinase tyrosine/serine/threonine phosphatase activity(GO:0017017) |
| 0.0 | 0.2 | GO:0046912 | transferase activity, transferring acyl groups, acyl groups converted into alkyl on transfer(GO:0046912) |
| 0.0 | 0.7 | GO:0017166 | vinculin binding(GO:0017166) |
| 0.0 | 1.5 | GO:0030515 | snoRNA binding(GO:0030515) |
| 0.0 | 0.2 | GO:0008426 | protein kinase C inhibitor activity(GO:0008426) |
| 0.0 | 0.2 | GO:0004803 | transposase activity(GO:0004803) |
| 0.0 | 0.4 | GO:0004565 | beta-galactosidase activity(GO:0004565) |
| 0.0 | 0.6 | GO:0004887 | thyroid hormone receptor activity(GO:0004887) |
| 0.0 | 0.5 | GO:0019531 | oxalate transmembrane transporter activity(GO:0019531) |
| 0.0 | 8.5 | GO:0017137 | Rab GTPase binding(GO:0017137) |
| 0.0 | 0.2 | GO:0061649 | ubiquitinated histone binding(GO:0061649) |
| 0.0 | 0.6 | GO:0098641 | cadherin binding involved in cell-cell adhesion(GO:0098641) |
| 0.0 | 0.5 | GO:0001206 | transcriptional repressor activity, RNA polymerase II distal enhancer sequence-specific binding(GO:0001206) |
| 0.0 | 0.5 | GO:0005007 | fibroblast growth factor-activated receptor activity(GO:0005007) |
| 0.0 | 8.7 | GO:0001047 | core promoter binding(GO:0001047) |
| 0.0 | 0.1 | GO:0070984 | SET domain binding(GO:0070984) |
| 0.0 | 0.2 | GO:0030628 | pre-mRNA 3'-splice site binding(GO:0030628) |
| 0.0 | 0.1 | GO:1990948 | ligase inhibitor activity(GO:0055104) ubiquitin ligase inhibitor activity(GO:1990948) |
| 0.0 | 1.2 | GO:0005086 | ARF guanyl-nucleotide exchange factor activity(GO:0005086) |
| 0.0 | 0.9 | GO:0048020 | CCR chemokine receptor binding(GO:0048020) |
| 0.0 | 1.4 | GO:0016628 | oxidoreductase activity, acting on the CH-CH group of donors, NAD or NADP as acceptor(GO:0016628) |
| 0.0 | 0.5 | GO:0016755 | transferase activity, transferring amino-acyl groups(GO:0016755) |
| 0.0 | 0.6 | GO:0008009 | chemokine activity(GO:0008009) |
| 0.0 | 0.1 | GO:0004616 | phosphogluconate dehydrogenase (decarboxylating) activity(GO:0004616) |
| 0.0 | 8.5 | GO:0003729 | mRNA binding(GO:0003729) poly(A) RNA binding(GO:0044822) |
| 0.0 | 0.7 | GO:0005547 | phosphatidylinositol-3,4,5-trisphosphate binding(GO:0005547) |
| 0.0 | 0.5 | GO:0009931 | calcium-dependent protein serine/threonine kinase activity(GO:0009931) |
| 0.0 | 0.5 | GO:0004697 | protein kinase C activity(GO:0004697) |
| 0.0 | 0.3 | GO:0023026 | MHC class II protein complex binding(GO:0023026) |
| 0.0 | 0.9 | GO:0008327 | methyl-CpG binding(GO:0008327) |
| 0.0 | 0.3 | GO:0019136 | deoxynucleoside kinase activity(GO:0019136) |
| 0.0 | 0.1 | GO:0000253 | 3-keto sterol reductase activity(GO:0000253) |
| 0.0 | 0.4 | GO:0003796 | lysozyme activity(GO:0003796) |
| 0.0 | 0.5 | GO:0016502 | purinergic nucleotide receptor activity(GO:0001614) nucleotide receptor activity(GO:0016502) |
| 0.0 | 0.3 | GO:0031698 | beta-2 adrenergic receptor binding(GO:0031698) |
| 0.0 | 0.1 | GO:0015222 | serotonin transmembrane transporter activity(GO:0015222) |
| 0.0 | 0.6 | GO:0005095 | GTPase inhibitor activity(GO:0005095) |
| 0.0 | 0.9 | GO:0001671 | ATPase activator activity(GO:0001671) |
| 0.0 | 0.1 | GO:0016165 | linoleate 13S-lipoxygenase activity(GO:0016165) hepoxilin-epoxide hydrolase activity(GO:0047977) |
| 0.0 | 8.2 | GO:0003924 | GTPase activity(GO:0003924) |
| 0.0 | 0.4 | GO:0030215 | semaphorin receptor binding(GO:0030215) |
| 0.0 | 0.8 | GO:0004709 | MAP kinase kinase kinase activity(GO:0004709) |
| 0.0 | 0.5 | GO:0051787 | misfolded protein binding(GO:0051787) |
| 0.0 | 0.2 | GO:0008467 | [heparan sulfate]-glucosamine 3-sulfotransferase 1 activity(GO:0008467) |
| 0.0 | 0.3 | GO:0004723 | calcium-dependent protein serine/threonine phosphatase activity(GO:0004723) |
| 0.0 | 0.2 | GO:0070679 | inositol 1,4,5 trisphosphate binding(GO:0070679) |
| 0.0 | 0.2 | GO:0030284 | estrogen receptor activity(GO:0030284) |
| 0.0 | 0.1 | GO:0048763 | calcium-induced calcium release activity(GO:0048763) |
| 0.0 | 0.1 | GO:1990932 | 5.8S rRNA binding(GO:1990932) |
| 0.0 | 1.4 | GO:0019894 | kinesin binding(GO:0019894) |
| 0.0 | 2.7 | GO:0004497 | monooxygenase activity(GO:0004497) |
| 0.0 | 0.1 | GO:0050733 | RS domain binding(GO:0050733) |
| 0.0 | 0.1 | GO:0004370 | glycerol kinase activity(GO:0004370) |
| 0.0 | 0.1 | GO:0042030 | ATPase inhibitor activity(GO:0042030) |
| 0.0 | 0.4 | GO:0042800 | histone methyltransferase activity (H3-K4 specific)(GO:0042800) |
| 0.0 | 0.7 | GO:0051879 | Hsp90 protein binding(GO:0051879) |
| 0.0 | 0.1 | GO:0004920 | interleukin-10 receptor activity(GO:0004920) |
| 0.0 | 0.2 | GO:0035251 | UDP-glucosyltransferase activity(GO:0035251) |
| 0.0 | 0.1 | GO:0004800 | thyroxine 5'-deiodinase activity(GO:0004800) |
| 0.0 | 0.4 | GO:0032183 | SUMO binding(GO:0032183) |
| 0.0 | 0.6 | GO:0043014 | alpha-tubulin binding(GO:0043014) |
| 0.0 | 0.6 | GO:0051371 | muscle alpha-actinin binding(GO:0051371) |
| 0.0 | 1.8 | GO:0002039 | p53 binding(GO:0002039) |
| 0.0 | 0.3 | GO:0050291 | sphingosine N-acyltransferase activity(GO:0050291) |
| 0.0 | 0.5 | GO:0005523 | tropomyosin binding(GO:0005523) |
| 0.0 | 0.1 | GO:0000182 | rDNA binding(GO:0000182) |
| 0.0 | 0.1 | GO:0004711 | ribosomal protein S6 kinase activity(GO:0004711) |
| 0.0 | 2.4 | GO:0032182 | ubiquitin-like protein binding(GO:0032182) |
| 0.0 | 1.4 | GO:0004601 | peroxidase activity(GO:0004601) |
| 0.0 | 0.3 | GO:0080025 | phosphatidylinositol-3,5-bisphosphate binding(GO:0080025) |
| 0.0 | 0.2 | GO:0004865 | protein serine/threonine phosphatase inhibitor activity(GO:0004865) |
| 0.0 | 0.1 | GO:0001032 | RNA polymerase III type 3 promoter DNA binding(GO:0001032) |
| 0.0 | 0.1 | GO:0070259 | tyrosyl-DNA phosphodiesterase activity(GO:0070259) |
| 0.0 | 0.6 | GO:0044183 | protein binding involved in protein folding(GO:0044183) |
| 0.0 | 1.4 | GO:0016667 | oxidoreductase activity, acting on a sulfur group of donors(GO:0016667) |
| 0.0 | 0.2 | GO:0035727 | lysophosphatidic acid binding(GO:0035727) |
| 0.0 | 0.1 | GO:0004910 | interleukin-1, Type II, blocking receptor activity(GO:0004910) |
| 0.0 | 0.7 | GO:0030676 | Rac guanyl-nucleotide exchange factor activity(GO:0030676) |
| 0.0 | 1.4 | GO:0051219 | phosphoprotein binding(GO:0051219) |
| 0.0 | 1.0 | GO:0008138 | protein tyrosine/serine/threonine phosphatase activity(GO:0008138) |
| 0.0 | 0.2 | GO:0050700 | CARD domain binding(GO:0050700) |
| 0.0 | 0.2 | GO:0015277 | kainate selective glutamate receptor activity(GO:0015277) |
| 0.0 | 0.2 | GO:0009922 | fatty acid elongase activity(GO:0009922) 3-oxo-arachidoyl-CoA synthase activity(GO:0102336) 3-oxo-cerotoyl-CoA synthase activity(GO:0102337) 3-oxo-lignoceronyl-CoA synthase activity(GO:0102338) |
| 0.0 | 0.4 | GO:0031492 | nucleosomal DNA binding(GO:0031492) |
| 0.0 | 1.3 | GO:0004702 | receptor signaling protein serine/threonine kinase activity(GO:0004702) |
| 0.0 | 0.6 | GO:0071617 | 1-acylglycerol-3-phosphate O-acyltransferase activity(GO:0003841) lysophosphatidic acid acyltransferase activity(GO:0042171) lysophospholipid acyltransferase activity(GO:0071617) |
| 0.0 | 0.5 | GO:0004364 | glutathione transferase activity(GO:0004364) |
| 0.0 | 0.8 | GO:0017112 | Rab guanyl-nucleotide exchange factor activity(GO:0017112) |
| 0.0 | 0.1 | GO:0043024 | ribosomal small subunit binding(GO:0043024) |
| 0.0 | 0.1 | GO:0050833 | pyruvate transmembrane transporter activity(GO:0050833) |
| 0.0 | 0.1 | GO:0004449 | isocitrate dehydrogenase (NAD+) activity(GO:0004449) |
| 0.0 | 0.1 | GO:0070097 | delta-catenin binding(GO:0070097) |
| 0.0 | 0.2 | GO:0004075 | biotin carboxylase activity(GO:0004075) |
| 0.0 | 0.6 | GO:0004864 | protein phosphatase inhibitor activity(GO:0004864) |
| 0.0 | 0.4 | GO:0005092 | GDP-dissociation inhibitor activity(GO:0005092) |
| 0.0 | 0.1 | GO:0004966 | galanin receptor activity(GO:0004966) |
| 0.0 | 0.1 | GO:0036042 | long-chain fatty acyl-CoA binding(GO:0036042) |
| 0.0 | 0.1 | GO:0004303 | estradiol 17-beta-dehydrogenase activity(GO:0004303) |
| 0.0 | 1.4 | GO:0008307 | structural constituent of muscle(GO:0008307) |
| 0.0 | 2.5 | GO:0001078 | transcriptional repressor activity, RNA polymerase II core promoter proximal region sequence-specific binding(GO:0001078) |
| 0.0 | 0.3 | GO:0016918 | retinal binding(GO:0016918) |
| 0.0 | 0.1 | GO:0050694 | galactosylceramide sulfotransferase activity(GO:0001733) galactose 3-O-sulfotransferase activity(GO:0050694) |
| 0.0 | 4.8 | GO:0045296 | cadherin binding(GO:0045296) |
| 0.0 | 0.4 | GO:0001786 | phosphatidylserine binding(GO:0001786) |
| 0.0 | 0.1 | GO:1990050 | phosphatidic acid transporter activity(GO:1990050) |
| 0.0 | 0.1 | GO:0015232 | heme transporter activity(GO:0015232) |
| 0.0 | 0.2 | GO:0070577 | lysine-acetylated histone binding(GO:0070577) |
| 0.0 | 0.1 | GO:0031545 | peptidyl-proline 4-dioxygenase activity(GO:0031545) |
| 0.0 | 0.1 | GO:1990239 | steroid hormone binding(GO:1990239) |
| 0.0 | 0.1 | GO:0009881 | photoreceptor activity(GO:0009881) |
| 0.0 | 0.0 | GO:0004582 | dolichyl-phosphate beta-D-mannosyltransferase activity(GO:0004582) |
| 0.0 | 0.3 | GO:0033038 | bitter taste receptor activity(GO:0033038) |
| 0.0 | 0.0 | GO:0052816 | medium-chain acyl-CoA hydrolase activity(GO:0052815) long-chain acyl-CoA hydrolase activity(GO:0052816) |
| 0.0 | 0.2 | GO:0015501 | glutamate:sodium symporter activity(GO:0015501) |
| 0.0 | 0.1 | GO:1990599 | 3' overhang single-stranded DNA endodeoxyribonuclease activity(GO:1990599) |
| 0.0 | 0.1 | GO:0030742 | GTP-dependent protein binding(GO:0030742) |
| 0.0 | 0.2 | GO:0031491 | nucleosome binding(GO:0031491) |
Gene overrepresentation in curated gene sets: canonical pathways category:
| Log-likelihood per target | Total log-likelihood | Term | Description |
|---|---|---|---|
| 0.7 | 36.6 | PID NFKAPPAB CANONICAL PATHWAY | Canonical NF-kappaB pathway |
| 0.4 | 6.9 | ST INTERFERON GAMMA PATHWAY | Interferon gamma pathway. |
| 0.3 | 8.3 | PID IL5 PATHWAY | IL5-mediated signaling events |
| 0.3 | 14.9 | PID CD40 PATHWAY | CD40/CD40L signaling |
| 0.3 | 1.6 | PID P38 ALPHA BETA PATHWAY | Regulation of p38-alpha and p38-beta |
| 0.3 | 5.4 | PID TCR RAS PATHWAY | Ras signaling in the CD4+ TCR pathway |
| 0.2 | 10.3 | PID INSULIN GLUCOSE PATHWAY | Insulin-mediated glucose transport |
| 0.2 | 7.1 | PID S1P S1P2 PATHWAY | S1P2 pathway |
| 0.2 | 6.0 | PID ARF 3PATHWAY | Arf1 pathway |
| 0.2 | 14.3 | PID TXA2PATHWAY | Thromboxane A2 receptor signaling |
| 0.2 | 1.4 | ST STAT3 PATHWAY | STAT3 Pathway |
| 0.2 | 3.5 | SA TRKA RECEPTOR | The TrkA receptor binds nerve growth factor to activate MAP kinase pathways and promote cell growth. |
| 0.1 | 3.3 | PID IL8 CXCR2 PATHWAY | IL8- and CXCR2-mediated signaling events |
| 0.1 | 18.4 | PID MYC ACTIV PATHWAY | Validated targets of C-MYC transcriptional activation |
| 0.1 | 2.1 | PID EPHA2 FWD PATHWAY | EPHA2 forward signaling |
| 0.1 | 7.3 | PID HES HEY PATHWAY | Notch-mediated HES/HEY network |
| 0.1 | 1.5 | SA G1 AND S PHASES | Cdk2, 4, and 6 bind cyclin D in G1, while cdk2/cyclin E promotes the G1/S transition. |
| 0.1 | 1.3 | PID AURORA A PATHWAY | Aurora A signaling |
| 0.1 | 3.4 | PID AVB3 OPN PATHWAY | Osteopontin-mediated events |
| 0.1 | 3.4 | PID ENDOTHELIN PATHWAY | Endothelins |
| 0.1 | 3.0 | ST GAQ PATHWAY | G alpha q Pathway |
| 0.1 | 4.6 | ST JNK MAPK PATHWAY | JNK MAPK Pathway |
| 0.1 | 1.0 | PID AR NONGENOMIC PATHWAY | Nongenotropic Androgen signaling |
| 0.1 | 5.6 | SIG PIP3 SIGNALING IN CARDIAC MYOCTES | Genes related to PIP3 signaling in cardiac myocytes |
| 0.1 | 1.9 | PID HDAC CLASSIII PATHWAY | Signaling events mediated by HDAC Class III |
| 0.1 | 3.0 | PID AMB2 NEUTROPHILS PATHWAY | amb2 Integrin signaling |
| 0.1 | 2.4 | PID DNA PK PATHWAY | DNA-PK pathway in nonhomologous end joining |
| 0.1 | 2.0 | PID EPHRINB REV PATHWAY | Ephrin B reverse signaling |
| 0.1 | 3.4 | PID FOXO PATHWAY | FoxO family signaling |
| 0.1 | 3.3 | SIG REGULATION OF THE ACTIN CYTOSKELETON BY RHO GTPASES | Genes related to regulation of the actin cytoskeleton |
| 0.1 | 5.9 | PID ARF6 TRAFFICKING PATHWAY | Arf6 trafficking events |
| 0.1 | 1.0 | PID PDGFRA PATHWAY | PDGFR-alpha signaling pathway |
| 0.1 | 0.2 | ST MYOCYTE AD PATHWAY | Myocyte Adrenergic Pathway is a specific case of the generalized Adrenergic Pathway. |
| 0.1 | 4.8 | PID DELTA NP63 PATHWAY | Validated transcriptional targets of deltaNp63 isoforms |
| 0.1 | 2.7 | PID LIS1 PATHWAY | Lissencephaly gene (LIS1) in neuronal migration and development |
| 0.1 | 0.9 | SIG CD40PATHWAYMAP | Genes related to CD40 signaling |
| 0.1 | 5.1 | PID TELOMERASE PATHWAY | Regulation of Telomerase |
| 0.1 | 0.6 | PID CD8 TCR DOWNSTREAM PATHWAY | Downstream signaling in naïve CD8+ T cells |
| 0.1 | 3.3 | PID MTOR 4PATHWAY | mTOR signaling pathway |
| 0.1 | 1.0 | PID SYNDECAN 3 PATHWAY | Syndecan-3-mediated signaling events |
| 0.1 | 3.7 | PID IL12 2PATHWAY | IL12-mediated signaling events |
| 0.0 | 2.3 | PID ECADHERIN STABILIZATION PATHWAY | Stabilization and expansion of the E-cadherin adherens junction |
| 0.0 | 15.1 | NABA ECM REGULATORS | Genes encoding enzymes and their regulators involved in the remodeling of the extracellular matrix |
| 0.0 | 0.4 | PID FRA PATHWAY | Validated transcriptional targets of AP1 family members Fra1 and Fra2 |
| 0.0 | 1.3 | PID SYNDECAN 2 PATHWAY | Syndecan-2-mediated signaling events |
| 0.0 | 0.6 | PID ATM PATHWAY | ATM pathway |
| 0.0 | 0.7 | ST ERK1 ERK2 MAPK PATHWAY | ERK1/ERK2 MAPK Pathway |
| 0.0 | 6.8 | PID P53 DOWNSTREAM PATHWAY | Direct p53 effectors |
| 0.0 | 1.0 | PID FOXM1 PATHWAY | FOXM1 transcription factor network |
| 0.0 | 2.6 | PID CDC42 REG PATHWAY | Regulation of CDC42 activity |
| 0.0 | 1.1 | PID WNT NONCANONICAL PATHWAY | Noncanonical Wnt signaling pathway |
| 0.0 | 1.2 | PID RAC1 REG PATHWAY | Regulation of RAC1 activity |
| 0.0 | 0.1 | PID ARF6 DOWNSTREAM PATHWAY | Arf6 downstream pathway |
| 0.0 | 1.6 | PID TRKR PATHWAY | Neurotrophic factor-mediated Trk receptor signaling |
| 0.0 | 0.4 | ST ADRENERGIC | Adrenergic Pathway |
| 0.0 | 0.4 | SIG PIP3 SIGNALING IN B LYMPHOCYTES | Genes related to PIP3 signaling in B lymphocytes |
| 0.0 | 2.3 | PID BETA CATENIN NUC PATHWAY | Regulation of nuclear beta catenin signaling and target gene transcription |
| 0.0 | 0.5 | PID FGF PATHWAY | FGF signaling pathway |
| 0.0 | 1.3 | PID AR PATHWAY | Coregulation of Androgen receptor activity |
| 0.0 | 1.2 | PID HIF1 TFPATHWAY | HIF-1-alpha transcription factor network |
| 0.0 | 0.9 | PID INTEGRIN3 PATHWAY | Beta3 integrin cell surface interactions |
| 0.0 | 0.8 | NABA BASEMENT MEMBRANES | Genes encoding structural components of basement membranes |
| 0.0 | 0.2 | PID WNT CANONICAL PATHWAY | Canonical Wnt signaling pathway |
| 0.0 | 0.8 | PID ILK PATHWAY | Integrin-linked kinase signaling |
| 0.0 | 0.6 | PID FANCONI PATHWAY | Fanconi anemia pathway |
| 0.0 | 0.8 | PID E2F PATHWAY | E2F transcription factor network |
| 0.0 | 0.6 | NABA COLLAGENS | Genes encoding collagen proteins |
| 0.0 | 0.3 | PID CXCR4 PATHWAY | CXCR4-mediated signaling events |
| 0.0 | 0.3 | PID LYSOPHOSPHOLIPID PATHWAY | LPA receptor mediated events |
| 0.0 | 0.1 | SIG INSULIN RECEPTOR PATHWAY IN CARDIAC MYOCYTES | Genes related to the insulin receptor pathway |
| 0.0 | 0.1 | PID VEGFR1 PATHWAY | VEGFR1 specific signals |
| 0.0 | 1.1 | PID CMYB PATHWAY | C-MYB transcription factor network |
| 0.0 | 0.2 | PID KIT PATHWAY | Signaling events mediated by Stem cell factor receptor (c-Kit) |
| 0.0 | 0.7 | PID CDC42 PATHWAY | CDC42 signaling events |
| 0.0 | 0.3 | PID PI3KCI PATHWAY | Class I PI3K signaling events |
| 0.0 | 0.1 | PID IL27 PATHWAY | IL27-mediated signaling events |
| 0.0 | 0.1 | SIG BCR SIGNALING PATHWAY | Members of the BCR signaling pathway |
Gene overrepresentation in curated gene sets: REACTOME pathways category:
| Log-likelihood per target | Total log-likelihood | Term | Description |
|---|---|---|---|
| 0.7 | 35.8 | REACTOME NOD1 2 SIGNALING PATHWAY | Genes involved in NOD1/2 Signaling Pathway |
| 0.4 | 6.3 | REACTOME MEMBRANE BINDING AND TARGETTING OF GAG PROTEINS | Genes involved in Membrane binding and targetting of GAG proteins |
| 0.4 | 4.9 | REACTOME DSCAM INTERACTIONS | Genes involved in DSCAM interactions |
| 0.4 | 8.6 | REACTOME CLASS C 3 METABOTROPIC GLUTAMATE PHEROMONE RECEPTORS | Genes involved in Class C/3 (Metabotropic glutamate/pheromone receptors) |
| 0.4 | 8.8 | REACTOME HDL MEDIATED LIPID TRANSPORT | Genes involved in HDL-mediated lipid transport |
| 0.3 | 7.9 | REACTOME SPRY REGULATION OF FGF SIGNALING | Genes involved in Spry regulation of FGF signaling |
| 0.3 | 5.5 | REACTOME IL 6 SIGNALING | Genes involved in Interleukin-6 signaling |
| 0.3 | 7.6 | REACTOME ACTIVATION OF BH3 ONLY PROTEINS | Genes involved in Activation of BH3-only proteins |
| 0.3 | 7.7 | REACTOME CYTOSOLIC SULFONATION OF SMALL MOLECULES | Genes involved in Cytosolic sulfonation of small molecules |
| 0.3 | 6.8 | REACTOME PROTEOLYTIC CLEAVAGE OF SNARE COMPLEX PROTEINS | Genes involved in Proteolytic cleavage of SNARE complex proteins |
| 0.3 | 3.5 | REACTOME NEGATIVE REGULATION OF THE PI3K AKT NETWORK | Genes involved in Negative regulation of the PI3K/AKT network |
| 0.2 | 9.7 | REACTOME DEGRADATION OF THE EXTRACELLULAR MATRIX | Genes involved in Degradation of the extracellular matrix |
| 0.2 | 17.3 | REACTOME REGULATION OF ORNITHINE DECARBOXYLASE ODC | Genes involved in Regulation of ornithine decarboxylase (ODC) |
| 0.2 | 3.2 | REACTOME REGULATION OF IFNG SIGNALING | Genes involved in Regulation of IFNG signaling |
| 0.2 | 4.2 | REACTOME TETRAHYDROBIOPTERIN BH4 SYNTHESIS RECYCLING SALVAGE AND REGULATION | Genes involved in Tetrahydrobiopterin (BH4) synthesis, recycling, salvage and regulation |
| 0.2 | 2.0 | REACTOME PACKAGING OF TELOMERE ENDS | Genes involved in Packaging Of Telomere Ends |
| 0.2 | 0.4 | REACTOME MRNA DECAY BY 3 TO 5 EXORIBONUCLEASE | Genes involved in mRNA Decay by 3' to 5' Exoribonuclease |
| 0.2 | 5.2 | REACTOME POST CHAPERONIN TUBULIN FOLDING PATHWAY | Genes involved in Post-chaperonin tubulin folding pathway |
| 0.2 | 3.7 | REACTOME GAP JUNCTION DEGRADATION | Genes involved in Gap junction degradation |
| 0.2 | 3.0 | REACTOME REGULATION OF PYRUVATE DEHYDROGENASE PDH COMPLEX | Genes involved in Regulation of pyruvate dehydrogenase (PDH) complex |
| 0.2 | 1.2 | REACTOME NFKB IS ACTIVATED AND SIGNALS SURVIVAL | Genes involved in NF-kB is activated and signals survival |
| 0.2 | 2.9 | REACTOME ER PHAGOSOME PATHWAY | Genes involved in ER-Phagosome pathway |
| 0.2 | 15.0 | REACTOME INTERFERON ALPHA BETA SIGNALING | Genes involved in Interferon alpha/beta signaling |
| 0.2 | 0.2 | REACTOME APC C CDC20 MEDIATED DEGRADATION OF MITOTIC PROTEINS | Genes involved in APC/C:Cdc20 mediated degradation of mitotic proteins |
| 0.2 | 6.2 | REACTOME CHOLESTEROL BIOSYNTHESIS | Genes involved in Cholesterol biosynthesis |
| 0.1 | 1.0 | REACTOME DESTABILIZATION OF MRNA BY BRF1 | Genes involved in Destabilization of mRNA by Butyrate Response Factor 1 (BRF1) |
| 0.1 | 1.7 | REACTOME AKT PHOSPHORYLATES TARGETS IN THE CYTOSOL | Genes involved in AKT phosphorylates targets in the cytosol |
| 0.1 | 0.1 | REACTOME TRANSPORT OF MATURE MRNA DERIVED FROM AN INTRONLESS TRANSCRIPT | Genes involved in Transport of Mature mRNA Derived from an Intronless Transcript |
| 0.1 | 3.2 | REACTOME INTRINSIC PATHWAY FOR APOPTOSIS | Genes involved in Intrinsic Pathway for Apoptosis |
| 0.1 | 6.2 | REACTOME GLUTATHIONE CONJUGATION | Genes involved in Glutathione conjugation |
| 0.1 | 1.6 | REACTOME ROLE OF DCC IN REGULATING APOPTOSIS | Genes involved in Role of DCC in regulating apoptosis |
| 0.1 | 3.1 | REACTOME PROCESSING OF INTRONLESS PRE MRNAS | Genes involved in Processing of Intronless Pre-mRNAs |
| 0.1 | 2.0 | REACTOME PEPTIDE HORMONE BIOSYNTHESIS | Genes involved in Peptide hormone biosynthesis |
| 0.1 | 6.1 | REACTOME SMAD2 SMAD3 SMAD4 HETEROTRIMER REGULATES TRANSCRIPTION | Genes involved in SMAD2/SMAD3:SMAD4 heterotrimer regulates transcription |
| 0.1 | 0.6 | REACTOME FORMATION OF THE HIV1 EARLY ELONGATION COMPLEX | Genes involved in Formation of the HIV-1 Early Elongation Complex |
| 0.1 | 1.0 | REACTOME REGULATED PROTEOLYSIS OF P75NTR | Genes involved in Regulated proteolysis of p75NTR |
| 0.1 | 5.5 | REACTOME INTERFERON GAMMA SIGNALING | Genes involved in Interferon gamma signaling |
| 0.1 | 3.1 | REACTOME INSULIN RECEPTOR RECYCLING | Genes involved in Insulin receptor recycling |
| 0.1 | 2.8 | REACTOME MRNA 3 END PROCESSING | Genes involved in mRNA 3'-end processing |
| 0.1 | 3.4 | REACTOME IL RECEPTOR SHC SIGNALING | Genes involved in Interleukin receptor SHC signaling |
| 0.1 | 1.4 | REACTOME ABACAVIR TRANSPORT AND METABOLISM | Genes involved in Abacavir transport and metabolism |
| 0.1 | 1.6 | REACTOME TAK1 ACTIVATES NFKB BY PHOSPHORYLATION AND ACTIVATION OF IKKS COMPLEX | Genes involved in TAK1 activates NFkB by phosphorylation and activation of IKKs complex |
| 0.1 | 4.9 | REACTOME RNA POL II TRANSCRIPTION PRE INITIATION AND PROMOTER OPENING | Genes involved in RNA Polymerase II Transcription Pre-Initiation And Promoter Opening |
| 0.1 | 3.4 | REACTOME PERK REGULATED GENE EXPRESSION | Genes involved in PERK regulated gene expression |
| 0.1 | 3.3 | REACTOME FORMATION OF FIBRIN CLOT CLOTTING CASCADE | Genes involved in Formation of Fibrin Clot (Clotting Cascade) |
| 0.1 | 1.2 | REACTOME ENDOGENOUS STEROLS | Genes involved in Endogenous sterols |
| 0.1 | 1.1 | REACTOME PYRUVATE METABOLISM | Genes involved in Pyruvate metabolism |
| 0.1 | 0.7 | REACTOME COPI MEDIATED TRANSPORT | Genes involved in COPI Mediated Transport |
| 0.1 | 1.1 | REACTOME SYNTHESIS OF SUBSTRATES IN N GLYCAN BIOSYTHESIS | Genes involved in Synthesis of substrates in N-glycan biosythesis |
| 0.1 | 4.3 | REACTOME ACTIVATION OF CHAPERONE GENES BY XBP1S | Genes involved in Activation of Chaperone Genes by XBP1(S) |
| 0.1 | 0.6 | REACTOME G PROTEIN ACTIVATION | Genes involved in G-protein activation |
| 0.1 | 1.8 | REACTOME N GLYCAN ANTENNAE ELONGATION IN THE MEDIAL TRANS GOLGI | Genes involved in N-glycan antennae elongation in the medial/trans-Golgi |
| 0.1 | 0.9 | REACTOME SYNTHESIS OF PIPS AT THE LATE ENDOSOME MEMBRANE | Genes involved in Synthesis of PIPs at the late endosome membrane |
| 0.1 | 0.8 | REACTOME GLUCOSE TRANSPORT | Genes involved in Glucose transport |
| 0.1 | 2.6 | REACTOME SMOOTH MUSCLE CONTRACTION | Genes involved in Smooth Muscle Contraction |
| 0.1 | 0.6 | REACTOME SIGNALING BY CONSTITUTIVELY ACTIVE EGFR | Genes involved in Signaling by constitutively active EGFR |
| 0.1 | 0.2 | REACTOME FORMATION OF RNA POL II ELONGATION COMPLEX | Genes involved in Formation of RNA Pol II elongation complex |
| 0.1 | 1.1 | REACTOME REGULATION OF MRNA STABILITY BY PROTEINS THAT BIND AU RICH ELEMENTS | Genes involved in Regulation of mRNA Stability by Proteins that Bind AU-rich Elements |
| 0.1 | 1.0 | REACTOME GRB2 SOS PROVIDES LINKAGE TO MAPK SIGNALING FOR INTERGRINS | Genes involved in GRB2:SOS provides linkage to MAPK signaling for Intergrins |
| 0.0 | 0.7 | REACTOME ARMS MEDIATED ACTIVATION | Genes involved in ARMS-mediated activation |
| 0.0 | 0.4 | REACTOME LATE PHASE OF HIV LIFE CYCLE | Genes involved in Late Phase of HIV Life Cycle |
| 0.0 | 1.2 | REACTOME CITRIC ACID CYCLE TCA CYCLE | Genes involved in Citric acid cycle (TCA cycle) |
| 0.0 | 3.0 | REACTOME CHEMOKINE RECEPTORS BIND CHEMOKINES | Genes involved in Chemokine receptors bind chemokines |
| 0.0 | 0.6 | REACTOME FORMATION OF TUBULIN FOLDING INTERMEDIATES BY CCT TRIC | Genes involved in Formation of tubulin folding intermediates by CCT/TriC |
| 0.0 | 0.4 | REACTOME P53 INDEPENDENT G1 S DNA DAMAGE CHECKPOINT | Genes involved in p53-Independent G1/S DNA damage checkpoint |
| 0.0 | 0.3 | REACTOME APOPTOTIC CLEAVAGE OF CELL ADHESION PROTEINS | Genes involved in Apoptotic cleavage of cell adhesion proteins |
| 0.0 | 0.6 | REACTOME EGFR DOWNREGULATION | Genes involved in EGFR downregulation |
| 0.0 | 4.0 | REACTOME AMINO ACID AND OLIGOPEPTIDE SLC TRANSPORTERS | Genes involved in Amino acid and oligopeptide SLC transporters |
| 0.0 | 1.4 | REACTOME NEPHRIN INTERACTIONS | Genes involved in Nephrin interactions |
| 0.0 | 0.8 | REACTOME MTORC1 MEDIATED SIGNALLING | Genes involved in mTORC1-mediated signalling |
| 0.0 | 0.2 | REACTOME REGULATION OF SIGNALING BY CBL | Genes involved in Regulation of signaling by CBL |
| 0.0 | 1.2 | REACTOME DEADENYLATION OF MRNA | Genes involved in Deadenylation of mRNA |
| 0.0 | 2.3 | REACTOME PRE NOTCH EXPRESSION AND PROCESSING | Genes involved in Pre-NOTCH Expression and Processing |
| 0.0 | 0.6 | REACTOME DEPOSITION OF NEW CENPA CONTAINING NUCLEOSOMES AT THE CENTROMERE | Genes involved in Deposition of New CENPA-containing Nucleosomes at the Centromere |
| 0.0 | 1.1 | REACTOME CIRCADIAN REPRESSION OF EXPRESSION BY REV ERBA | Genes involved in Circadian Repression of Expression by REV-ERBA |
| 0.0 | 0.5 | REACTOME CD28 DEPENDENT VAV1 PATHWAY | Genes involved in CD28 dependent Vav1 pathway |
| 0.0 | 0.1 | REACTOME MRNA CAPPING | Genes involved in mRNA Capping |
| 0.0 | 1.7 | REACTOME GLYCOLYSIS | Genes involved in Glycolysis |
| 0.0 | 1.2 | REACTOME POST TRANSLATIONAL MODIFICATION SYNTHESIS OF GPI ANCHORED PROTEINS | Genes involved in Post-translational modification: synthesis of GPI-anchored proteins |
| 0.0 | 0.7 | REACTOME ACTIVATED NOTCH1 TRANSMITS SIGNAL TO THE NUCLEUS | Genes involved in Activated NOTCH1 Transmits Signal to the Nucleus |
| 0.0 | 0.5 | REACTOME ALPHA LINOLENIC ACID ALA METABOLISM | Genes involved in alpha-linolenic acid (ALA) metabolism |
| 0.0 | 0.2 | REACTOME HOMOLOGOUS RECOMBINATION REPAIR OF REPLICATION INDEPENDENT DOUBLE STRAND BREAKS | Genes involved in Homologous recombination repair of replication-independent double-strand breaks |
| 0.0 | 0.2 | REACTOME G ALPHA1213 SIGNALLING EVENTS | Genes involved in G alpha (12/13) signalling events |
| 0.0 | 1.2 | REACTOME LIGAND GATED ION CHANNEL TRANSPORT | Genes involved in Ligand-gated ion channel transport |
| 0.0 | 6.5 | REACTOME SIGNALING BY RHO GTPASES | Genes involved in Signaling by Rho GTPases |
| 0.0 | 0.9 | REACTOME METAL ION SLC TRANSPORTERS | Genes involved in Metal ion SLC transporters |
| 0.0 | 0.9 | REACTOME SYNTHESIS SECRETION AND INACTIVATION OF GIP | Genes involved in Synthesis, Secretion, and Inactivation of Glucose-dependent Insulinotropic Polypeptide (GIP) |
| 0.0 | 0.7 | REACTOME INTEGRIN CELL SURFACE INTERACTIONS | Genes involved in Integrin cell surface interactions |
| 0.0 | 0.5 | REACTOME ADENYLATE CYCLASE INHIBITORY PATHWAY | Genes involved in Adenylate cyclase inhibitory pathway |
| 0.0 | 0.3 | REACTOME SEROTONIN RECEPTORS | Genes involved in Serotonin receptors |
| 0.0 | 0.5 | REACTOME AMINO ACID SYNTHESIS AND INTERCONVERSION TRANSAMINATION | Genes involved in Amino acid synthesis and interconversion (transamination) |
| 0.0 | 0.5 | REACTOME TERMINATION OF O GLYCAN BIOSYNTHESIS | Genes involved in Termination of O-glycan biosynthesis |
| 0.0 | 0.3 | REACTOME PURINE CATABOLISM | Genes involved in Purine catabolism |
| 0.0 | 0.5 | REACTOME ASSOCIATION OF TRIC CCT WITH TARGET PROTEINS DURING BIOSYNTHESIS | Genes involved in Association of TriC/CCT with target proteins during biosynthesis |
| 0.0 | 0.3 | REACTOME IRON UPTAKE AND TRANSPORT | Genes involved in Iron uptake and transport |
| 0.0 | 0.3 | REACTOME SIGNALING BY FGFR1 FUSION MUTANTS | Genes involved in Signaling by FGFR1 fusion mutants |
| 0.0 | 0.5 | REACTOME PYRIMIDINE METABOLISM | Genes involved in Pyrimidine metabolism |
| 0.0 | 0.3 | REACTOME SHC1 EVENTS IN ERBB4 SIGNALING | Genes involved in SHC1 events in ERBB4 signaling |
| 0.0 | 0.1 | REACTOME DESTABILIZATION OF MRNA BY KSRP | Genes involved in Destabilization of mRNA by KSRP |
| 0.0 | 0.7 | REACTOME ION TRANSPORT BY P TYPE ATPASES | Genes involved in Ion transport by P-type ATPases |
| 0.0 | 0.5 | REACTOME NEGATIVE REGULATORS OF RIG I MDA5 SIGNALING | Genes involved in Negative regulators of RIG-I/MDA5 signaling |
| 0.0 | 0.5 | REACTOME REGULATION OF HYPOXIA INDUCIBLE FACTOR HIF BY OXYGEN | Genes involved in Regulation of Hypoxia-inducible Factor (HIF) by Oxygen |
| 0.0 | 0.2 | REACTOME XENOBIOTICS | Genes involved in Xenobiotics |
| 0.0 | 0.2 | REACTOME KERATAN SULFATE BIOSYNTHESIS | Genes involved in Keratan sulfate biosynthesis |
| 0.0 | 0.9 | REACTOME MHC CLASS II ANTIGEN PRESENTATION | Genes involved in MHC class II antigen presentation |
| 0.0 | 0.1 | REACTOME CYTOSOLIC TRNA AMINOACYLATION | Genes involved in Cytosolic tRNA aminoacylation |