Project
Inflammatory response time course, HUVEC (Wada, 2009)
Navigation
Downloads
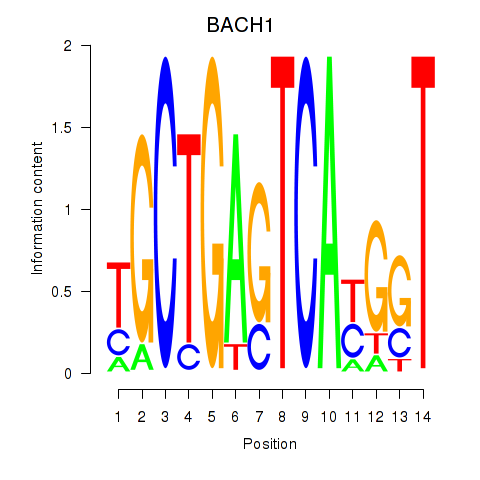
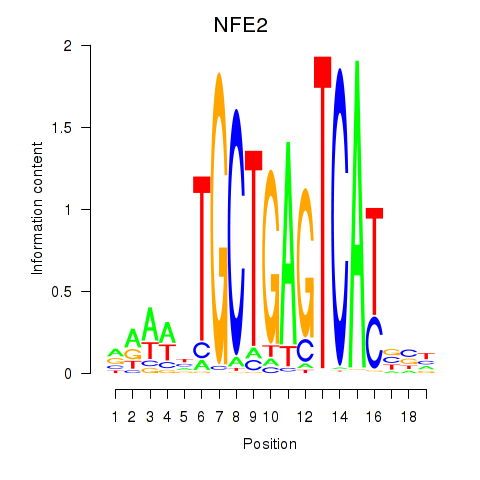
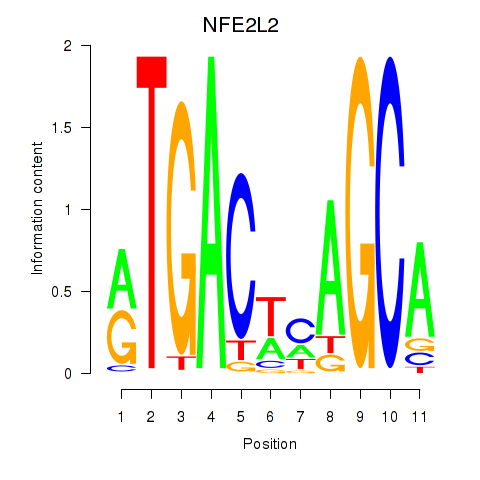
Results for BACH1_NFE2_NFE2L2
Z-value: 1.16
Motif logo
Transcription factors associated with BACH1_NFE2_NFE2L2
| Gene Symbol | Gene ID | Gene Info |
|---|---|---|
|
BACH1
|
ENSG00000156273.16 | BACH1 |
|
NFE2
|
ENSG00000123405.14 | NFE2 |
|
NFE2L2
|
ENSG00000116044.16 | NFE2L2 |
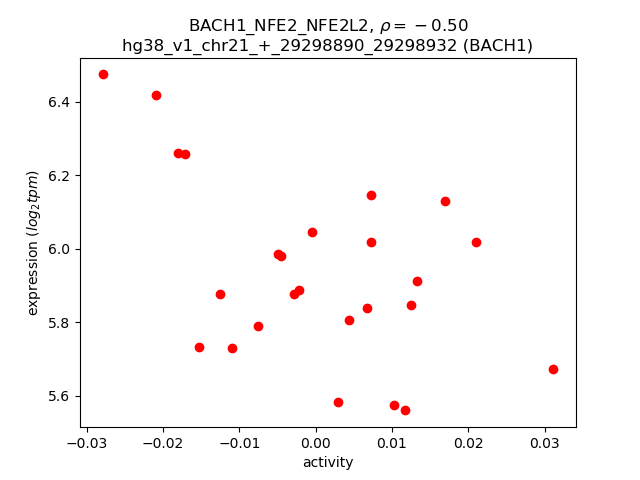
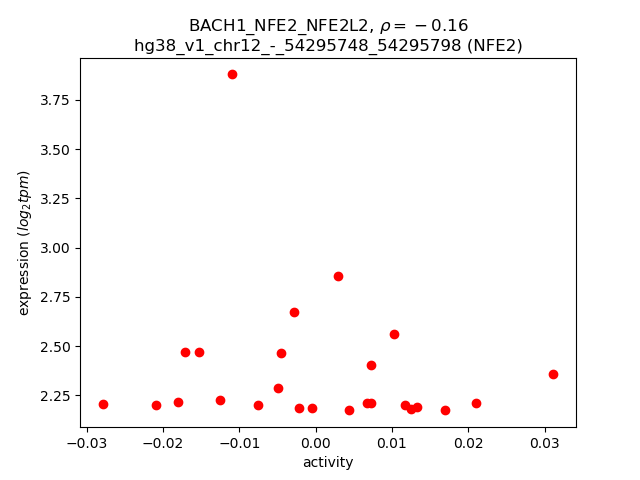
Activity-expression correlation:
| Gene | Promoter | Pearson corr. coef. | P-value | Plot |
|---|---|---|---|---|
| BACH1 | hg38_v1_chr21_+_29298890_29298932, hg38_v1_chr21_+_29299368_29299441 | -0.50 | 1.1e-02 | Click! |
| NFE2L2 | hg38_v1_chr2_-_177392673_177392704 | -0.41 | 4.0e-02 | Click! |
| NFE2 | hg38_v1_chr12_-_54295748_54295798, hg38_v1_chr12_-_54297884_54297941, hg38_v1_chr12_-_54300974_54301021 | -0.16 | 4.5e-01 | Click! |
Activity profile of BACH1_NFE2_NFE2L2 motif
Sorted Z-values of BACH1_NFE2_NFE2L2 motif
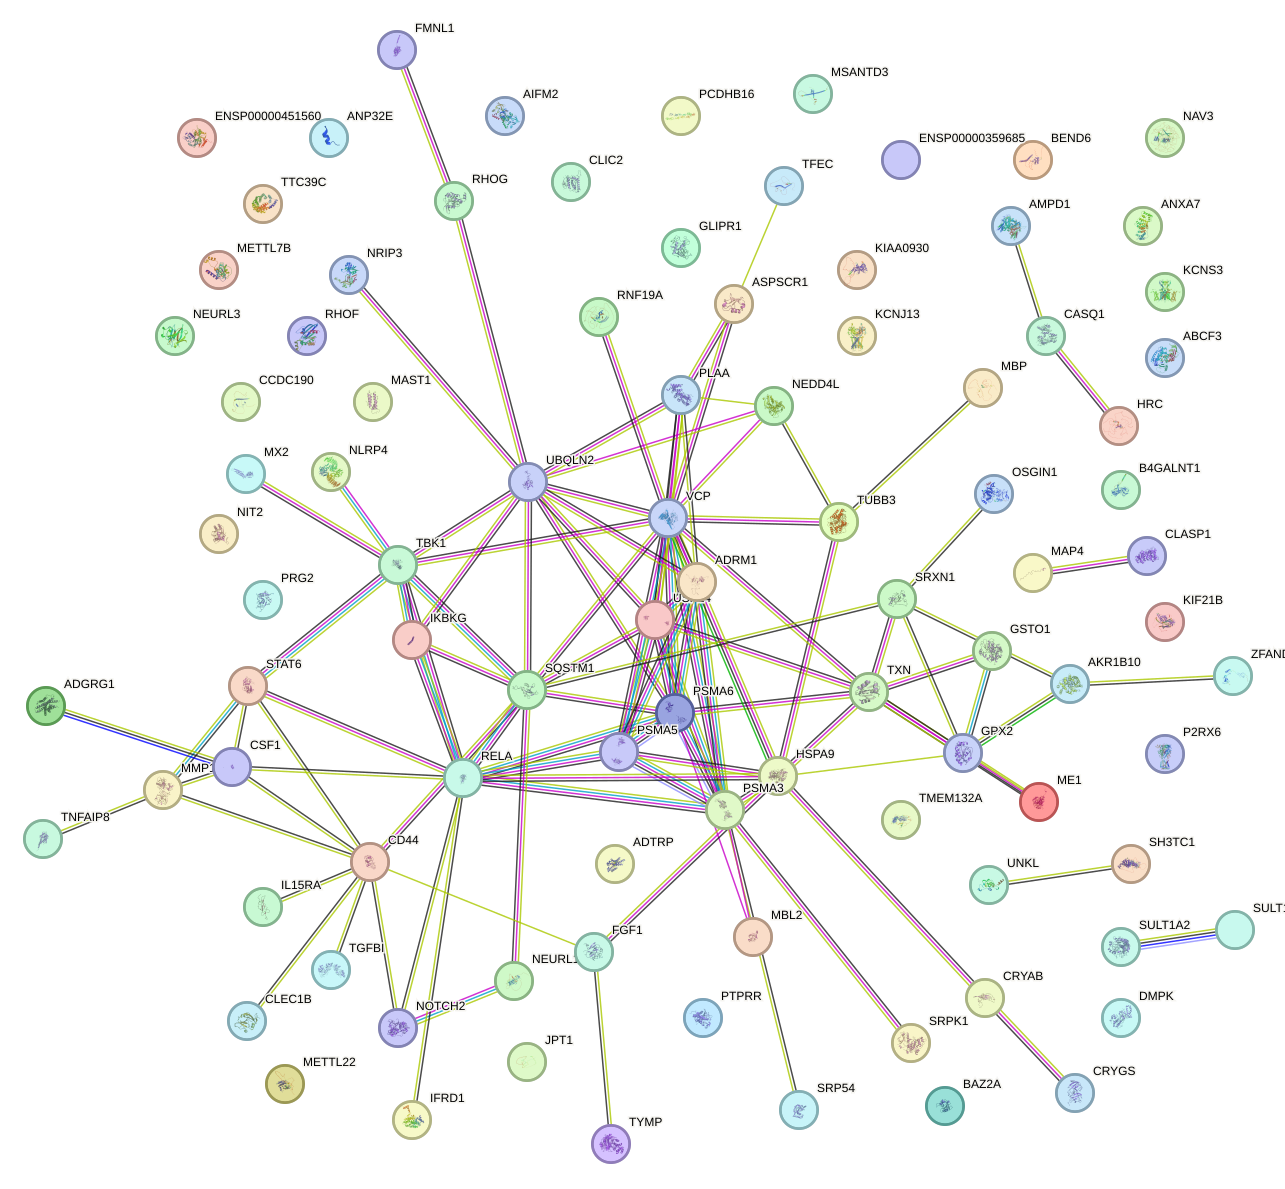
Network of associatons between targets according to the STRING database.
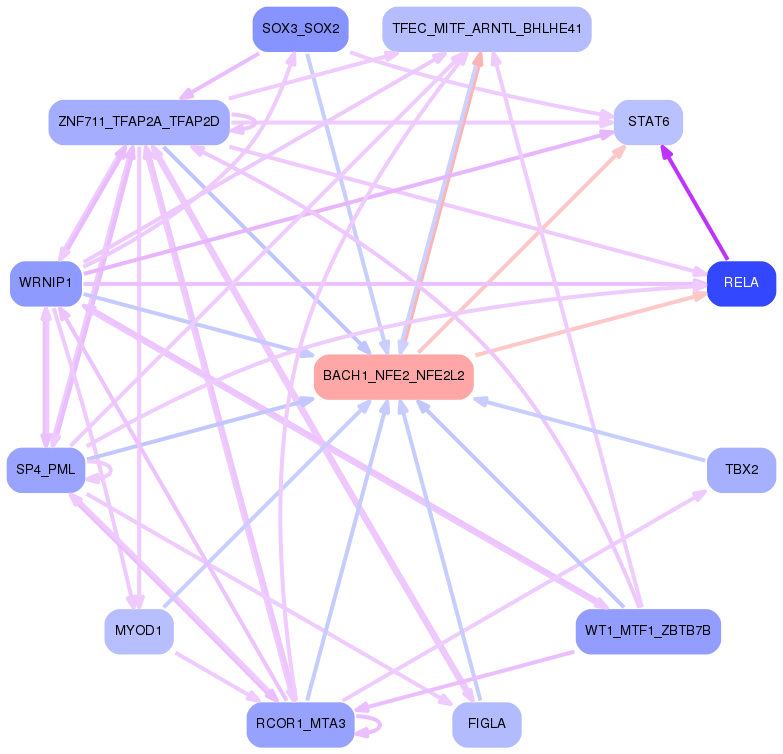
First level regulatory network of BACH1_NFE2_NFE2L2
Gene Ontology Analysis
Gene overrepresentation in biological process category:
| Log-likelihood per target | Total log-likelihood | Term | Description |
|---|---|---|---|
| 0.5 | 1.4 | GO:1901899 | positive regulation of relaxation of cardiac muscle(GO:1901899) |
| 0.4 | 1.1 | GO:0014810 | positive regulation of skeletal muscle contraction by regulation of release of sequestered calcium ion(GO:0014810) |
| 0.4 | 1.1 | GO:0006117 | acetaldehyde metabolic process(GO:0006117) |
| 0.3 | 4.1 | GO:0035092 | sperm chromatin condensation(GO:0035092) |
| 0.3 | 2.2 | GO:1902031 | NADP biosynthetic process(GO:0006741) regulation of NADP metabolic process(GO:1902031) |
| 0.3 | 3.4 | GO:0060315 | negative regulation of ryanodine-sensitive calcium-release channel activity(GO:0060315) |
| 0.3 | 1.0 | GO:1903070 | negative regulation of ER-associated ubiquitin-dependent protein catabolic process(GO:1903070) |
| 0.2 | 3.6 | GO:0035457 | cellular response to interferon-alpha(GO:0035457) |
| 0.2 | 3.9 | GO:0002315 | marginal zone B cell differentiation(GO:0002315) |
| 0.2 | 1.3 | GO:0051012 | microtubule sliding(GO:0051012) |
| 0.2 | 0.6 | GO:0007518 | myoblast fate determination(GO:0007518) |
| 0.2 | 0.8 | GO:0002296 | T-helper 1 cell lineage commitment(GO:0002296) |
| 0.2 | 0.6 | GO:0090176 | microtubule cytoskeleton organization involved in establishment of planar polarity(GO:0090176) |
| 0.2 | 2.8 | GO:0021796 | cerebral cortex regionalization(GO:0021796) |
| 0.2 | 0.5 | GO:1903006 | flavin adenine dinucleotide metabolic process(GO:0072387) regulation of protein K63-linked deubiquitination(GO:1903004) positive regulation of protein K63-linked deubiquitination(GO:1903006) |
| 0.2 | 0.6 | GO:0060611 | positive regulation of odontogenesis of dentin-containing tooth(GO:0042488) mammary gland fat development(GO:0060611) positive regulation of macrophage colony-stimulating factor signaling pathway(GO:1902228) positive regulation of response to macrophage colony-stimulating factor(GO:1903971) positive regulation of cellular response to macrophage colony-stimulating factor stimulus(GO:1903974) positive regulation of microglial cell migration(GO:1904141) |
| 0.1 | 0.4 | GO:0016487 | sesquiterpenoid metabolic process(GO:0006714) sesquiterpenoid catabolic process(GO:0016107) farnesol metabolic process(GO:0016487) farnesol catabolic process(GO:0016488) |
| 0.1 | 0.7 | GO:0044565 | dendritic cell proliferation(GO:0044565) |
| 0.1 | 2.2 | GO:0030388 | fructose 1,6-bisphosphate metabolic process(GO:0030388) |
| 0.1 | 1.3 | GO:0014722 | regulation of skeletal muscle contraction by calcium ion signaling(GO:0014722) |
| 0.1 | 0.5 | GO:0015722 | canalicular bile acid transport(GO:0015722) |
| 0.1 | 2.4 | GO:0003373 | dynamin polymerization involved in membrane fission(GO:0003373) dynamin polymerization involved in mitochondrial fission(GO:0003374) |
| 0.1 | 0.3 | GO:0061394 | regulation of transcription from RNA polymerase II promoter in response to arsenic-containing substance(GO:0061394) |
| 0.1 | 1.6 | GO:0061635 | regulation of protein complex stability(GO:0061635) |
| 0.1 | 0.4 | GO:1904021 | negative regulation of clathrin-mediated endocytosis(GO:1900186) negative regulation of G-protein coupled receptor internalization(GO:1904021) |
| 0.1 | 0.4 | GO:0006617 | SRP-dependent cotranslational protein targeting to membrane, signal sequence recognition(GO:0006617) |
| 0.1 | 1.0 | GO:1902037 | negative regulation of hematopoietic stem cell differentiation(GO:1902037) |
| 0.1 | 0.6 | GO:0098989 | NMDA selective glutamate receptor signaling pathway(GO:0098989) |
| 0.1 | 1.8 | GO:0043248 | proteasome assembly(GO:0043248) |
| 0.1 | 1.0 | GO:0032264 | IMP salvage(GO:0032264) |
| 0.1 | 0.5 | GO:0061152 | trachea submucosa development(GO:0061152) trachea gland development(GO:0061153) |
| 0.1 | 0.7 | GO:0048165 | ovarian cumulus expansion(GO:0001550) fused antrum stage(GO:0048165) negative regulation of chondrocyte proliferation(GO:1902731) |
| 0.1 | 8.9 | GO:0002479 | antigen processing and presentation of exogenous peptide antigen via MHC class I, TAP-dependent(GO:0002479) |
| 0.1 | 0.6 | GO:0030259 | lipid glycosylation(GO:0030259) |
| 0.1 | 0.3 | GO:0045643 | regulation of eosinophil differentiation(GO:0045643) positive regulation of eosinophil differentiation(GO:0045645) |
| 0.1 | 1.1 | GO:1900623 | regulation of monocyte aggregation(GO:1900623) positive regulation of monocyte aggregation(GO:1900625) |
| 0.1 | 0.4 | GO:0046167 | glycerol-3-phosphate biosynthetic process(GO:0046167) |
| 0.1 | 0.4 | GO:2001107 | negative regulation of establishment of T cell polarity(GO:1903904) negative regulation of Rho guanyl-nucleotide exchange factor activity(GO:2001107) |
| 0.1 | 0.5 | GO:1903385 | regulation of homophilic cell adhesion(GO:1903385) |
| 0.1 | 0.4 | GO:0098528 | skeletal muscle fiber differentiation(GO:0098528) |
| 0.1 | 2.1 | GO:0071243 | cellular response to arsenic-containing substance(GO:0071243) |
| 0.1 | 0.7 | GO:0038110 | interleukin-2-mediated signaling pathway(GO:0038110) |
| 0.1 | 0.3 | GO:0045065 | cytotoxic T cell differentiation(GO:0045065) |
| 0.1 | 0.5 | GO:0010992 | ubiquitin homeostasis(GO:0010992) |
| 0.1 | 0.2 | GO:0061114 | hepatocyte cell migration(GO:0002194) otic placode formation(GO:0043049) branching involved in pancreas morphogenesis(GO:0061114) acinar cell differentiation(GO:0090425) positive regulation of forebrain neuron differentiation(GO:2000979) |
| 0.1 | 0.1 | GO:0010847 | regulation of chromatin assembly(GO:0010847) |
| 0.1 | 0.4 | GO:1904209 | regulation of chemokine (C-C motif) ligand 2 secretion(GO:1904207) positive regulation of chemokine (C-C motif) ligand 2 secretion(GO:1904209) |
| 0.1 | 0.3 | GO:1903527 | positive regulation of membrane tubulation(GO:1903527) |
| 0.1 | 3.2 | GO:0032461 | positive regulation of protein oligomerization(GO:0032461) |
| 0.1 | 0.4 | GO:0060356 | leucine import(GO:0060356) |
| 0.1 | 0.3 | GO:1904383 | response to sodium phosphate(GO:1904383) |
| 0.1 | 0.8 | GO:0030091 | protein repair(GO:0030091) |
| 0.1 | 0.2 | GO:1903774 | positive regulation of viral budding via host ESCRT complex(GO:1903774) |
| 0.1 | 2.6 | GO:0030220 | platelet formation(GO:0030220) |
| 0.1 | 0.8 | GO:0007258 | JUN phosphorylation(GO:0007258) |
| 0.1 | 0.6 | GO:0000160 | phosphorelay signal transduction system(GO:0000160) |
| 0.1 | 0.7 | GO:0010668 | ectodermal cell differentiation(GO:0010668) |
| 0.1 | 0.5 | GO:0060681 | branch elongation involved in ureteric bud branching(GO:0060681) |
| 0.0 | 0.2 | GO:2001271 | negative regulation of cysteine-type endopeptidase activity involved in execution phase of apoptosis(GO:2001271) |
| 0.0 | 0.4 | GO:0006528 | asparagine metabolic process(GO:0006528) |
| 0.0 | 0.1 | GO:1902202 | regulation of hepatocyte growth factor receptor signaling pathway(GO:1902202) |
| 0.0 | 0.7 | GO:0038203 | TORC2 signaling(GO:0038203) |
| 0.0 | 0.5 | GO:2001288 | positive regulation of caveolin-mediated endocytosis(GO:2001288) |
| 0.0 | 2.1 | GO:0043486 | histone exchange(GO:0043486) |
| 0.0 | 0.3 | GO:0035897 | proteolysis in other organism(GO:0035897) |
| 0.0 | 0.1 | GO:1903347 | negative regulation of bicellular tight junction assembly(GO:1903347) |
| 0.0 | 0.1 | GO:0033634 | positive regulation of cell-cell adhesion mediated by integrin(GO:0033634) negative regulation of endothelial cell chemotaxis(GO:2001027) |
| 0.0 | 0.3 | GO:0001887 | selenium compound metabolic process(GO:0001887) |
| 0.0 | 0.3 | GO:2000210 | positive regulation of anoikis(GO:2000210) |
| 0.0 | 0.5 | GO:0090136 | epithelial cell-cell adhesion(GO:0090136) |
| 0.0 | 0.5 | GO:0007021 | tubulin complex assembly(GO:0007021) |
| 0.0 | 0.2 | GO:0000270 | peptidoglycan metabolic process(GO:0000270) peptidoglycan catabolic process(GO:0009253) |
| 0.0 | 0.2 | GO:0050893 | sensory processing(GO:0050893) |
| 0.0 | 0.2 | GO:0001920 | negative regulation of receptor recycling(GO:0001920) |
| 0.0 | 0.7 | GO:0043097 | pyrimidine-containing compound salvage(GO:0008655) pyrimidine nucleoside salvage(GO:0043097) |
| 0.0 | 0.5 | GO:0051014 | actin filament severing(GO:0051014) |
| 0.0 | 5.3 | GO:0034605 | cellular response to heat(GO:0034605) |
| 0.0 | 0.1 | GO:0070340 | detection of triacyl bacterial lipopeptide(GO:0042495) detection of bacterial lipopeptide(GO:0070340) |
| 0.0 | 1.0 | GO:0035590 | purinergic nucleotide receptor signaling pathway(GO:0035590) |
| 0.0 | 0.1 | GO:0001983 | regulation of systemic arterial blood pressure by carotid sinus baroreceptor feedback(GO:0001978) baroreceptor response to increased systemic arterial blood pressure(GO:0001983) positive regulation of the force of heart contraction by chemical signal(GO:0003099) |
| 0.0 | 0.4 | GO:0017085 | response to insecticide(GO:0017085) |
| 0.0 | 0.5 | GO:0006068 | ethanol catabolic process(GO:0006068) |
| 0.0 | 0.2 | GO:0018344 | protein geranylgeranylation(GO:0018344) |
| 0.0 | 0.1 | GO:0038163 | thrombopoietin-mediated signaling pathway(GO:0038163) |
| 0.0 | 0.2 | GO:0021937 | cerebellar Purkinje cell-granule cell precursor cell signaling involved in regulation of granule cell precursor cell proliferation(GO:0021937) |
| 0.0 | 0.1 | GO:0009137 | purine nucleoside diphosphate catabolic process(GO:0009137) purine ribonucleoside diphosphate catabolic process(GO:0009181) |
| 0.0 | 0.1 | GO:0070857 | regulation of bile acid biosynthetic process(GO:0070857) |
| 0.0 | 0.3 | GO:0021979 | hypothalamus cell differentiation(GO:0021979) |
| 0.0 | 0.2 | GO:0045329 | carnitine biosynthetic process(GO:0045329) |
| 0.0 | 0.2 | GO:0006346 | methylation-dependent chromatin silencing(GO:0006346) |
| 0.0 | 0.2 | GO:0071361 | cellular response to ethanol(GO:0071361) |
| 0.0 | 0.0 | GO:1902232 | regulation of positive thymic T cell selection(GO:1902232) |
| 0.0 | 16.6 | GO:0019221 | cytokine-mediated signaling pathway(GO:0019221) |
| 0.0 | 0.2 | GO:1902866 | regulation of retina development in camera-type eye(GO:1902866) |
| 0.0 | 0.3 | GO:0048739 | cardiac muscle fiber development(GO:0048739) |
| 0.0 | 0.3 | GO:0000478 | endonucleolytic cleavage involved in rRNA processing(GO:0000478) |
| 0.0 | 0.4 | GO:0031581 | hemidesmosome assembly(GO:0031581) |
| 0.0 | 0.1 | GO:0000055 | ribosomal large subunit export from nucleus(GO:0000055) |
| 0.0 | 0.5 | GO:0009651 | response to salt stress(GO:0009651) |
| 0.0 | 0.0 | GO:0051414 | response to cortisol(GO:0051414) |
| 0.0 | 0.2 | GO:0060050 | positive regulation of protein glycosylation(GO:0060050) |
| 0.0 | 0.2 | GO:0039536 | negative regulation of RIG-I signaling pathway(GO:0039536) |
| 0.0 | 0.1 | GO:0051151 | negative regulation of smooth muscle cell differentiation(GO:0051151) |
| 0.0 | 0.2 | GO:0010838 | positive regulation of keratinocyte proliferation(GO:0010838) |
| 0.0 | 0.1 | GO:0035879 | plasma membrane lactate transport(GO:0035879) |
| 0.0 | 0.3 | GO:1901741 | positive regulation of myoblast fusion(GO:1901741) |
| 0.0 | 0.2 | GO:0051611 | negative regulation of neurotransmitter uptake(GO:0051581) regulation of serotonin uptake(GO:0051611) negative regulation of serotonin uptake(GO:0051612) |
| 0.0 | 0.2 | GO:0070544 | histone H3-K36 demethylation(GO:0070544) |
| 0.0 | 0.4 | GO:0006521 | regulation of cellular amino acid metabolic process(GO:0006521) |
| 0.0 | 6.0 | GO:0032259 | methylation(GO:0032259) |
| 0.0 | 0.6 | GO:0010107 | potassium ion import(GO:0010107) |
| 0.0 | 0.0 | GO:1905167 | positive regulation of lysosomal protein catabolic process(GO:1905167) |
| 0.0 | 0.4 | GO:0050873 | brown fat cell differentiation(GO:0050873) |
| 0.0 | 0.5 | GO:0090004 | positive regulation of establishment of protein localization to plasma membrane(GO:0090004) |
| 0.0 | 0.2 | GO:0032060 | bleb assembly(GO:0032060) |
| 0.0 | 0.1 | GO:0046322 | negative regulation of fatty acid oxidation(GO:0046322) |
| 0.0 | 0.4 | GO:0007158 | neuron cell-cell adhesion(GO:0007158) |
Gene overrepresentation in cellular component category:
| Log-likelihood per target | Total log-likelihood | Term | Description |
|---|---|---|---|
| 0.5 | 1.6 | GO:0044753 | amphisome(GO:0044753) |
| 0.5 | 6.8 | GO:0019773 | proteasome core complex, alpha-subunit complex(GO:0019773) |
| 0.4 | 1.1 | GO:0035525 | NF-kappaB p50/p65 complex(GO:0035525) |
| 0.4 | 2.8 | GO:0097451 | glial limiting end-foot(GO:0097451) |
| 0.2 | 1.9 | GO:0033018 | sarcoplasmic reticulum lumen(GO:0033018) |
| 0.2 | 1.9 | GO:0008541 | proteasome regulatory particle, lid subcomplex(GO:0008541) |
| 0.1 | 0.5 | GO:1990730 | VCP-NSFL1C complex(GO:1990730) |
| 0.1 | 0.3 | GO:1990590 | ATF1-ATF4 transcription factor complex(GO:1990590) |
| 0.1 | 2.1 | GO:0000812 | Swr1 complex(GO:0000812) |
| 0.1 | 0.6 | GO:1990682 | CSF1-CSF1R complex(GO:1990682) |
| 0.1 | 1.1 | GO:0035692 | macrophage migration inhibitory factor receptor complex(GO:0035692) |
| 0.1 | 0.3 | GO:0034515 | proteasome storage granule(GO:0034515) |
| 0.1 | 0.5 | GO:0033553 | rDNA heterochromatin(GO:0033553) |
| 0.1 | 0.9 | GO:0008385 | IkappaB kinase complex(GO:0008385) |
| 0.1 | 0.2 | GO:0005968 | Rab-protein geranylgeranyltransferase complex(GO:0005968) |
| 0.1 | 0.3 | GO:0031074 | nucleocytoplasmic shuttling complex(GO:0031074) |
| 0.1 | 0.5 | GO:0031595 | nuclear proteasome complex(GO:0031595) |
| 0.1 | 28.5 | GO:0031965 | nuclear membrane(GO:0031965) |
| 0.0 | 0.5 | GO:0042584 | chromaffin granule membrane(GO:0042584) |
| 0.0 | 0.7 | GO:1990712 | HFE-transferrin receptor complex(GO:1990712) |
| 0.0 | 0.4 | GO:0033269 | internode region of axon(GO:0033269) |
| 0.0 | 0.3 | GO:0032437 | cuticular plate(GO:0032437) |
| 0.0 | 0.4 | GO:0005838 | proteasome regulatory particle(GO:0005838) |
| 0.0 | 2.7 | GO:0031430 | M band(GO:0031430) |
| 0.0 | 0.4 | GO:0005672 | transcription factor TFIIA complex(GO:0005672) |
| 0.0 | 0.4 | GO:0005786 | signal recognition particle, endoplasmic reticulum targeting(GO:0005786) |
| 0.0 | 0.4 | GO:0060171 | stereocilium membrane(GO:0060171) |
| 0.0 | 2.4 | GO:0000502 | proteasome complex(GO:0000502) |
| 0.0 | 2.4 | GO:0005643 | nuclear pore(GO:0005643) |
| 0.0 | 0.5 | GO:0046581 | intercellular canaliculus(GO:0046581) |
| 0.0 | 3.4 | GO:0034707 | chloride channel complex(GO:0034707) |
| 0.0 | 0.3 | GO:0019907 | cyclin-dependent protein kinase activating kinase holoenzyme complex(GO:0019907) |
| 0.0 | 0.5 | GO:1990907 | beta-catenin-TCF complex(GO:1990907) |
| 0.0 | 0.5 | GO:0032059 | bleb(GO:0032059) |
| 0.0 | 0.7 | GO:0031932 | TORC2 complex(GO:0031932) |
| 0.0 | 0.4 | GO:0030127 | COPII vesicle coat(GO:0030127) |
| 0.0 | 0.1 | GO:0035354 | Toll-like receptor 1-Toll-like receptor 2 protein complex(GO:0035354) |
| 0.0 | 4.1 | GO:0016363 | nuclear matrix(GO:0016363) |
| 0.0 | 0.2 | GO:0070652 | HAUS complex(GO:0070652) |
| 0.0 | 1.0 | GO:0042645 | nucleoid(GO:0009295) mitochondrial nucleoid(GO:0042645) |
| 0.0 | 0.2 | GO:0036157 | outer dynein arm(GO:0036157) |
| 0.0 | 1.4 | GO:0035577 | azurophil granule membrane(GO:0035577) |
| 0.0 | 1.3 | GO:0005876 | spindle microtubule(GO:0005876) |
| 0.0 | 0.1 | GO:1990635 | proximal dendrite(GO:1990635) |
| 0.0 | 1.5 | GO:0005930 | axoneme(GO:0005930) ciliary plasm(GO:0097014) |
| 0.0 | 0.2 | GO:0031095 | platelet dense tubular network membrane(GO:0031095) |
| 0.0 | 0.2 | GO:0034098 | VCP-NPL4-UFD1 AAA ATPase complex(GO:0034098) |
| 0.0 | 0.1 | GO:0005971 | ribonucleoside-diphosphate reductase complex(GO:0005971) |
| 0.0 | 0.4 | GO:0005859 | muscle myosin complex(GO:0005859) |
| 0.0 | 1.2 | GO:0005811 | lipid particle(GO:0005811) |
| 0.0 | 0.2 | GO:0017146 | NMDA selective glutamate receptor complex(GO:0017146) |
| 0.0 | 0.7 | GO:0030173 | integral component of Golgi membrane(GO:0030173) |
| 0.0 | 0.2 | GO:0000813 | ESCRT I complex(GO:0000813) |
| 0.0 | 0.4 | GO:0097228 | sperm principal piece(GO:0097228) |
Gene overrepresentation in molecular function category:
| Log-likelihood per target | Total log-likelihood | Term | Description |
|---|---|---|---|
| 0.4 | 2.2 | GO:0004473 | malate dehydrogenase (decarboxylating) (NAD+) activity(GO:0004471) malate dehydrogenase (decarboxylating) (NADP+) activity(GO:0004473) |
| 0.4 | 1.2 | GO:0016649 | electron-transferring-flavoprotein dehydrogenase activity(GO:0004174) oxidoreductase activity, acting on the CH-NH group of donors, quinone or similar compound as acceptor(GO:0016649) |
| 0.3 | 1.0 | GO:0008192 | RNA guanylyltransferase activity(GO:0008192) |
| 0.2 | 6.8 | GO:0070003 | threonine-type endopeptidase activity(GO:0004298) threonine-type peptidase activity(GO:0070003) |
| 0.2 | 0.7 | GO:0016154 | thymidine phosphorylase activity(GO:0009032) pyrimidine-nucleoside phosphorylase activity(GO:0016154) |
| 0.2 | 2.2 | GO:0004332 | fructose-bisphosphate aldolase activity(GO:0004332) |
| 0.2 | 1.1 | GO:0050610 | glutathione dehydrogenase (ascorbate) activity(GO:0045174) methylarsonate reductase activity(GO:0050610) |
| 0.2 | 1.6 | GO:0038049 | transcription factor activity, ligand-activated RNA polymerase II transcription factor binding(GO:0038049) |
| 0.2 | 1.3 | GO:0071532 | ankyrin repeat binding(GO:0071532) |
| 0.2 | 0.6 | GO:0047685 | amine sulfotransferase activity(GO:0047685) |
| 0.2 | 27.4 | GO:0004896 | cytokine receptor activity(GO:0004896) |
| 0.1 | 0.4 | GO:0045550 | geranylgeranyl reductase activity(GO:0045550) |
| 0.1 | 0.4 | GO:0031780 | corticotropin hormone receptor binding(GO:0031780) type 5 melanocortin receptor binding(GO:0031783) |
| 0.1 | 0.4 | GO:0003955 | NAD(P)H dehydrogenase (quinone) activity(GO:0003955) |
| 0.1 | 3.9 | GO:0004602 | glutathione peroxidase activity(GO:0004602) |
| 0.1 | 1.0 | GO:0047623 | AMP deaminase activity(GO:0003876) adenosine-phosphate deaminase activity(GO:0047623) |
| 0.1 | 0.4 | GO:0015038 | glutathione disulfide oxidoreductase activity(GO:0015038) |
| 0.1 | 0.6 | GO:0005157 | macrophage colony-stimulating factor receptor binding(GO:0005157) |
| 0.1 | 0.5 | GO:0047894 | flavonol 3-sulfotransferase activity(GO:0047894) |
| 0.1 | 0.3 | GO:0005137 | interleukin-5 receptor binding(GO:0005137) |
| 0.1 | 0.4 | GO:0004370 | glycerol kinase activity(GO:0004370) |
| 0.1 | 0.7 | GO:0061133 | endopeptidase activator activity(GO:0061133) |
| 0.1 | 0.5 | GO:0035800 | deubiquitinase activator activity(GO:0035800) |
| 0.1 | 0.7 | GO:0031730 | CCR5 chemokine receptor binding(GO:0031730) |
| 0.1 | 2.5 | GO:0070530 | K63-linked polyubiquitin binding(GO:0070530) |
| 0.1 | 0.8 | GO:0004931 | extracellular ATP-gated cation channel activity(GO:0004931) ATP-gated ion channel activity(GO:0035381) |
| 0.1 | 0.2 | GO:0008336 | gamma-butyrobetaine dioxygenase activity(GO:0008336) |
| 0.1 | 0.8 | GO:0015037 | peptide disulfide oxidoreductase activity(GO:0015037) |
| 0.1 | 0.8 | GO:0004705 | JUN kinase activity(GO:0004705) SAP kinase activity(GO:0016909) |
| 0.1 | 0.6 | GO:0000155 | phosphorelay sensor kinase activity(GO:0000155) |
| 0.1 | 0.5 | GO:0036402 | proteasome-activating ATPase activity(GO:0036402) |
| 0.1 | 0.7 | GO:0005025 | transforming growth factor beta receptor activity, type I(GO:0005025) |
| 0.1 | 0.4 | GO:0030942 | endoplasmic reticulum signal peptide binding(GO:0030942) |
| 0.0 | 0.1 | GO:0005135 | interleukin-3 receptor binding(GO:0005135) |
| 0.0 | 0.3 | GO:0008454 | alpha-1,3-mannosylglycoprotein 4-beta-N-acetylglucosaminyltransferase activity(GO:0008454) |
| 0.0 | 0.2 | GO:0004663 | Rab geranylgeranyltransferase activity(GO:0004663) |
| 0.0 | 1.2 | GO:0005212 | structural constituent of eye lens(GO:0005212) |
| 0.0 | 3.8 | GO:0050840 | extracellular matrix binding(GO:0050840) |
| 0.0 | 0.1 | GO:0003829 | beta-1,3-galactosyl-O-glycosyl-glycoprotein beta-1,6-N-acetylglucosaminyltransferase activity(GO:0003829) |
| 0.0 | 0.5 | GO:0030284 | estrogen receptor activity(GO:0030284) |
| 0.0 | 0.2 | GO:0042835 | BRE binding(GO:0042835) |
| 0.0 | 0.2 | GO:0045029 | UDP-activated nucleotide receptor activity(GO:0045029) |
| 0.0 | 0.5 | GO:0016004 | phospholipase activator activity(GO:0016004) |
| 0.0 | 0.3 | GO:0043533 | inositol 1,3,4,5 tetrakisphosphate binding(GO:0043533) |
| 0.0 | 0.2 | GO:0061649 | ubiquitinated histone binding(GO:0061649) |
| 0.0 | 0.6 | GO:0034452 | dynactin binding(GO:0034452) |
| 0.0 | 0.4 | GO:0019911 | structural constituent of myelin sheath(GO:0019911) |
| 0.0 | 0.1 | GO:0035663 | Toll-like receptor 2 binding(GO:0035663) |
| 0.0 | 0.6 | GO:0001164 | RNA polymerase I regulatory region DNA binding(GO:0001013) RNA polymerase I regulatory region sequence-specific DNA binding(GO:0001163) RNA polymerase I CORE element sequence-specific DNA binding(GO:0001164) |
| 0.0 | 0.5 | GO:0005522 | profilin binding(GO:0005522) |
| 0.0 | 0.1 | GO:0004937 | alpha1-adrenergic receptor activity(GO:0004937) |
| 0.0 | 0.1 | GO:0042289 | MHC class II protein binding(GO:0042289) |
| 0.0 | 0.1 | GO:0035673 | oligopeptide transmembrane transporter activity(GO:0035673) |
| 0.0 | 0.1 | GO:0048248 | CXCR3 chemokine receptor binding(GO:0048248) |
| 0.0 | 0.1 | GO:0036435 | K48-linked polyubiquitin binding(GO:0036435) |
| 0.0 | 0.2 | GO:0043023 | ribosomal large subunit binding(GO:0043023) |
| 0.0 | 0.4 | GO:0005432 | calcium:sodium antiporter activity(GO:0005432) |
| 0.0 | 0.3 | GO:0043522 | leucine zipper domain binding(GO:0043522) |
| 0.0 | 0.5 | GO:0019871 | sodium channel inhibitor activity(GO:0019871) |
| 0.0 | 0.2 | GO:0050692 | DBD domain binding(GO:0050692) |
| 0.0 | 7.6 | GO:0003714 | transcription corepressor activity(GO:0003714) |
| 0.0 | 0.5 | GO:0044548 | S100 protein binding(GO:0044548) |
| 0.0 | 3.0 | GO:0004222 | metalloendopeptidase activity(GO:0004222) |
| 0.0 | 5.6 | GO:0008168 | methyltransferase activity(GO:0008168) |
| 0.0 | 0.7 | GO:0005031 | tumor necrosis factor-activated receptor activity(GO:0005031) death receptor activity(GO:0005035) |
| 0.0 | 0.6 | GO:0070001 | aspartic-type endopeptidase activity(GO:0004190) aspartic-type peptidase activity(GO:0070001) |
| 0.0 | 0.2 | GO:0003810 | protein-glutamine gamma-glutamyltransferase activity(GO:0003810) |
| 0.0 | 0.1 | GO:0001042 | RNA polymerase I core binding(GO:0001042) |
| 0.0 | 0.2 | GO:0051378 | amine binding(GO:0043176) serotonin binding(GO:0051378) |
| 0.0 | 0.1 | GO:0004466 | long-chain-acyl-CoA dehydrogenase activity(GO:0004466) |
| 0.0 | 0.6 | GO:0005242 | inward rectifier potassium channel activity(GO:0005242) |
| 0.0 | 1.3 | GO:0019212 | phosphatase inhibitor activity(GO:0019212) |
| 0.0 | 1.2 | GO:0008138 | protein tyrosine/serine/threonine phosphatase activity(GO:0008138) |
| 0.0 | 0.2 | GO:0003796 | lysozyme activity(GO:0003796) |
| 0.0 | 0.5 | GO:0005001 | transmembrane receptor protein tyrosine phosphatase activity(GO:0005001) transmembrane receptor protein phosphatase activity(GO:0019198) |
| 0.0 | 0.1 | GO:0008553 | hydrogen-exporting ATPase activity, phosphorylative mechanism(GO:0008553) |
| 0.0 | 0.4 | GO:0005251 | delayed rectifier potassium channel activity(GO:0005251) |
| 0.0 | 0.3 | GO:0015125 | bile acid transmembrane transporter activity(GO:0015125) |
| 0.0 | 1.8 | GO:0051117 | ATPase binding(GO:0051117) |
| 0.0 | 0.4 | GO:0017025 | TBP-class protein binding(GO:0017025) |
| 0.0 | 0.6 | GO:0008376 | acetylgalactosaminyltransferase activity(GO:0008376) |
| 0.0 | 0.1 | GO:0004748 | ribonucleoside-diphosphate reductase activity, thioredoxin disulfide as acceptor(GO:0004748) oxidoreductase activity, acting on CH or CH2 groups, disulfide as acceptor(GO:0016728) ribonucleoside-diphosphate reductase activity(GO:0061731) |
| 0.0 | 0.3 | GO:0004708 | MAP kinase kinase activity(GO:0004708) |
| 0.0 | 0.2 | GO:0051864 | histone demethylase activity (H3-K36 specific)(GO:0051864) |
| 0.0 | 0.3 | GO:0008353 | RNA polymerase II carboxy-terminal domain kinase activity(GO:0008353) |
| 0.0 | 0.1 | GO:0008422 | beta-glucosidase activity(GO:0008422) |
| 0.0 | 0.2 | GO:0005068 | transmembrane receptor protein tyrosine kinase adaptor activity(GO:0005068) |
| 0.0 | 0.5 | GO:0031624 | ubiquitin conjugating enzyme binding(GO:0031624) |
| 0.0 | 0.3 | GO:0030506 | ankyrin binding(GO:0030506) |
| 0.0 | 0.2 | GO:0017162 | aryl hydrocarbon receptor binding(GO:0017162) |
| 0.0 | 0.4 | GO:0008198 | ferrous iron binding(GO:0008198) |
Gene overrepresentation in curated gene sets: canonical pathways category:
| Log-likelihood per target | Total log-likelihood | Term | Description |
|---|---|---|---|
| 0.1 | 0.7 | ST IL 13 PATHWAY | Interleukin 13 (IL-13) Pathway |
| 0.1 | 3.5 | PID IL1 PATHWAY | IL1-mediated signaling events |
| 0.0 | 1.8 | SA MMP CYTOKINE CONNECTION | Cytokines can induce activation of matrix metalloproteinases, which degrade extracellular matrix. |
| 0.0 | 2.6 | PID SYNDECAN 1 PATHWAY | Syndecan-1-mediated signaling events |
| 0.0 | 1.1 | PID P38 MKK3 6PATHWAY | p38 MAPK signaling pathway |
| 0.0 | 2.2 | PID CDC42 REG PATHWAY | Regulation of CDC42 activity |
| 0.0 | 1.1 | SIG CD40PATHWAYMAP | Genes related to CD40 signaling |
| 0.0 | 2.0 | PID DELTA NP63 PATHWAY | Validated transcriptional targets of deltaNp63 isoforms |
| 0.0 | 0.3 | SA G2 AND M PHASES | Cdc25 activates the cdc2/cyclin B complex to induce the G2/M transition. |
| 0.0 | 3.6 | PID CMYB PATHWAY | C-MYB transcription factor network |
| 0.0 | 0.7 | SIG IL4RECEPTOR IN B LYPHOCYTES | Genes related to IL4 rceptor signaling in B lymphocytes |
| 0.0 | 2.5 | PID HIF1 TFPATHWAY | HIF-1-alpha transcription factor network |
| 0.0 | 0.3 | PID FRA PATHWAY | Validated transcriptional targets of AP1 family members Fra1 and Fra2 |
| 0.0 | 1.6 | PID NOTCH PATHWAY | Notch signaling pathway |
| 0.0 | 0.8 | PID PRL SIGNALING EVENTS PATHWAY | Signaling events mediated by PRL |
| 0.0 | 0.3 | PID IL5 PATHWAY | IL5-mediated signaling events |
| 0.0 | 0.1 | PID CXCR3 PATHWAY | CXCR3-mediated signaling events |
| 0.0 | 1.0 | PID AURORA B PATHWAY | Aurora B signaling |
| 0.0 | 0.6 | PID REELIN PATHWAY | Reelin signaling pathway |
| 0.0 | 0.3 | PID ARF 3PATHWAY | Arf1 pathway |
| 0.0 | 0.5 | PID INTEGRIN2 PATHWAY | Beta2 integrin cell surface interactions |
| 0.0 | 1.7 | PID BETA CATENIN NUC PATHWAY | Regulation of nuclear beta catenin signaling and target gene transcription |
| 0.0 | 0.7 | PID BMP PATHWAY | BMP receptor signaling |
| 0.0 | 2.7 | NABA ECM AFFILIATED | Genes encoding proteins affiliated structurally or functionally to extracellular matrix proteins |
Gene overrepresentation in curated gene sets: REACTOME pathways category:
| Log-likelihood per target | Total log-likelihood | Term | Description |
|---|---|---|---|
| 0.2 | 2.7 | REACTOME NFKB IS ACTIVATED AND SIGNALS SURVIVAL | Genes involved in NF-kB is activated and signals survival |
| 0.1 | 3.5 | REACTOME REGULATION OF INSULIN LIKE GROWTH FACTOR IGF ACTIVITY BY INSULIN LIKE GROWTH FACTOR BINDING PROTEINS IGFBPS | Genes involved in Regulation of Insulin-like Growth Factor (IGF) Activity by Insulin-like Growth Factor Binding Proteins (IGFBPs) |
| 0.1 | 9.2 | REACTOME CDK MEDIATED PHOSPHORYLATION AND REMOVAL OF CDC6 | Genes involved in CDK-mediated phosphorylation and removal of Cdc6 |
| 0.1 | 1.6 | REACTOME RECEPTOR LIGAND BINDING INITIATES THE SECOND PROTEOLYTIC CLEAVAGE OF NOTCH RECEPTOR | Genes involved in Receptor-ligand binding initiates the second proteolytic cleavage of Notch receptor |
| 0.1 | 0.9 | REACTOME IRAK1 RECRUITS IKK COMPLEX | Genes involved in IRAK1 recruits IKK complex |
| 0.1 | 5.6 | REACTOME INTERFERON ALPHA BETA SIGNALING | Genes involved in Interferon alpha/beta signaling |
| 0.0 | 0.7 | REACTOME ACTIVATION OF IRF3 IRF7 MEDIATED BY TBK1 IKK EPSILON | Genes involved in Activation of IRF3/IRF7 mediated by TBK1/IKK epsilon |
| 0.0 | 1.1 | REACTOME HYALURONAN UPTAKE AND DEGRADATION | Genes involved in Hyaluronan uptake and degradation |
| 0.0 | 1.1 | REACTOME CYTOSOLIC SULFONATION OF SMALL MOLECULES | Genes involved in Cytosolic sulfonation of small molecules |
| 0.0 | 1.0 | REACTOME PURINE SALVAGE | Genes involved in Purine salvage |
| 0.0 | 0.7 | REACTOME PYRIMIDINE CATABOLISM | Genes involved in Pyrimidine catabolism |
| 0.0 | 1.3 | REACTOME CIRCADIAN REPRESSION OF EXPRESSION BY REV ERBA | Genes involved in Circadian Repression of Expression by REV-ERBA |
| 0.0 | 0.4 | REACTOME REGULATION OF ORNITHINE DECARBOXYLASE ODC | Genes involved in Regulation of ornithine decarboxylase (ODC) |
| 0.0 | 2.1 | REACTOME GLYCOLYSIS | Genes involved in Glycolysis |
| 0.0 | 0.8 | REACTOME JNK C JUN KINASES PHOSPHORYLATION AND ACTIVATION MEDIATED BY ACTIVATED HUMAN TAK1 | Genes involved in JNK (c-Jun kinases) phosphorylation and activation mediated by activated human TAK1 |
| 0.0 | 0.3 | REACTOME ACTIVATED TAK1 MEDIATES P38 MAPK ACTIVATION | Genes involved in activated TAK1 mediates p38 MAPK activation |
| 0.0 | 0.5 | REACTOME SIGNALING BY FGFR3 MUTANTS | Genes involved in Signaling by FGFR3 mutants |
| 0.0 | 0.3 | REACTOME ACTIVATION OF CHAPERONE GENES BY ATF6 ALPHA | Genes involved in Activation of Chaperone Genes by ATF6-alpha |
| 0.0 | 0.4 | REACTOME RECYCLING OF BILE ACIDS AND SALTS | Genes involved in Recycling of bile acids and salts |
| 0.0 | 3.4 | REACTOME PPARA ACTIVATES GENE EXPRESSION | Genes involved in PPARA Activates Gene Expression |
| 0.0 | 0.2 | REACTOME ELEVATION OF CYTOSOLIC CA2 LEVELS | Genes involved in Elevation of cytosolic Ca2+ levels |
| 0.0 | 0.4 | REACTOME TAK1 ACTIVATES NFKB BY PHOSPHORYLATION AND ACTIVATION OF IKKS COMPLEX | Genes involved in TAK1 activates NFkB by phosphorylation and activation of IKKs complex |
| 0.0 | 0.8 | REACTOME AMYLOIDS | Genes involved in Amyloids |
| 0.0 | 0.2 | REACTOME MEMBRANE BINDING AND TARGETTING OF GAG PROTEINS | Genes involved in Membrane binding and targetting of GAG proteins |
| 0.0 | 0.5 | REACTOME POST CHAPERONIN TUBULIN FOLDING PATHWAY | Genes involved in Post-chaperonin tubulin folding pathway |
| 0.0 | 1.1 | REACTOME VOLTAGE GATED POTASSIUM CHANNELS | Genes involved in Voltage gated Potassium channels |
| 0.0 | 0.2 | REACTOME SEROTONIN RECEPTORS | Genes involved in Serotonin receptors |
| 0.0 | 0.7 | REACTOME SIGNALING BY BMP | Genes involved in Signaling by BMP |
| 0.0 | 1.0 | REACTOME MITOCHONDRIAL PROTEIN IMPORT | Genes involved in Mitochondrial Protein Import |
| 0.0 | 0.4 | REACTOME CYCLIN A B1 ASSOCIATED EVENTS DURING G2 M TRANSITION | Genes involved in Cyclin A/B1 associated events during G2/M transition |
| 0.0 | 1.2 | REACTOME METABOLISM OF VITAMINS AND COFACTORS | Genes involved in Metabolism of vitamins and cofactors |
| 0.0 | 0.3 | REACTOME N GLYCAN ANTENNAE ELONGATION | Genes involved in N-Glycan antennae elongation |
| 0.0 | 0.3 | REACTOME CASPASE MEDIATED CLEAVAGE OF CYTOSKELETAL PROTEINS | Genes involved in Caspase-mediated cleavage of cytoskeletal proteins |
| 0.0 | 0.4 | REACTOME SEMA4D INDUCED CELL MIGRATION AND GROWTH CONE COLLAPSE | Genes involved in Sema4D induced cell migration and growth-cone collapse |