Project
Inflammatory response time course, HUVEC (Wada, 2009)
Navigation
Downloads
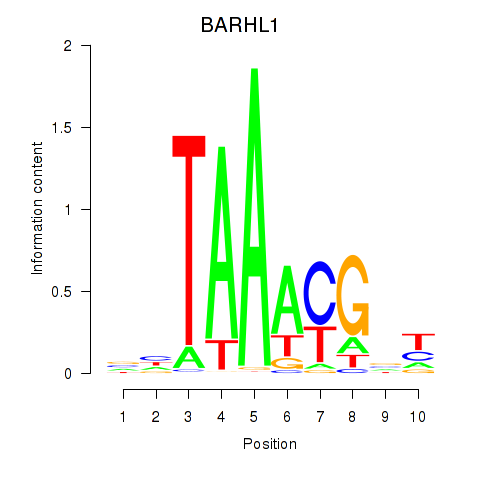
Results for BARHL1
Z-value: 1.64
Motif logo
Transcription factors associated with BARHL1
| Gene Symbol | Gene ID | Gene Info |
|---|---|---|
|
BARHL1
|
ENSG00000125492.10 | BARHL1 |
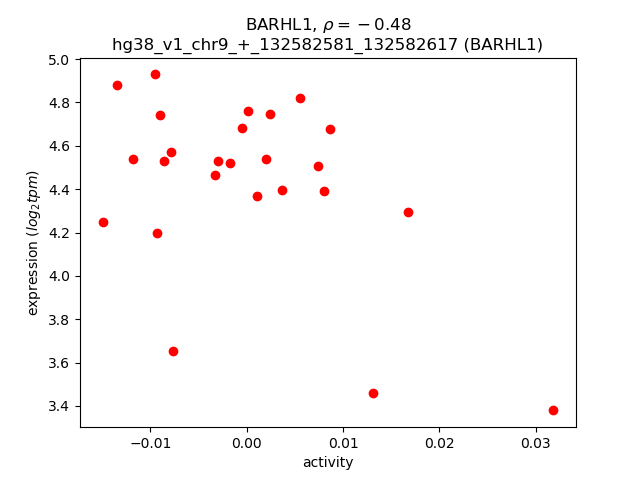
Activity-expression correlation:
| Gene | Promoter | Pearson corr. coef. | P-value | Plot |
|---|---|---|---|---|
| BARHL1 | hg38_v1_chr9_+_132582581_132582617 | -0.48 | 1.4e-02 | Click! |
Activity profile of BARHL1 motif
Sorted Z-values of BARHL1 motif
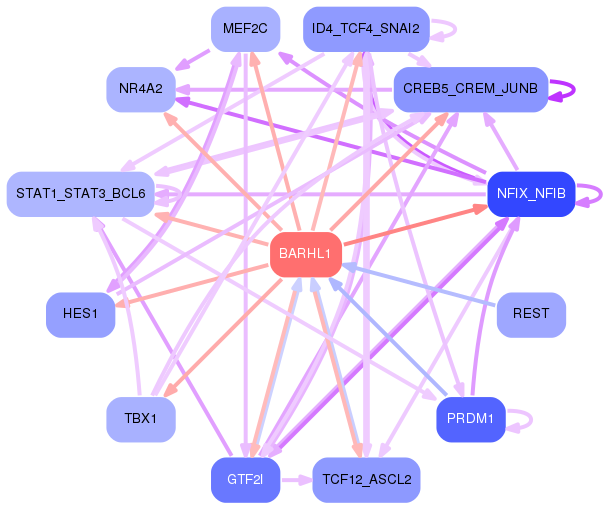
Network of associatons between targets according to the STRING database.

First level regulatory network of BARHL1
Gene Ontology Analysis
Gene overrepresentation in biological process category:
| Log-likelihood per target | Total log-likelihood | Term | Description |
|---|---|---|---|
| 1.2 | 8.4 | GO:0097338 | response to clozapine(GO:0097338) |
| 1.0 | 3.0 | GO:0034183 | negative regulation of maintenance of sister chromatid cohesion(GO:0034092) negative regulation of maintenance of mitotic sister chromatid cohesion(GO:0034183) maintenance of mitotic sister chromatid cohesion, telomeric(GO:0099403) mitotic sister chromatid cohesion, telomeric(GO:0099404) regulation of maintenance of mitotic sister chromatid cohesion, telomeric(GO:1904907) negative regulation of maintenance of mitotic sister chromatid cohesion, telomeric(GO:1904908) |
| 1.0 | 3.0 | GO:0070124 | mitochondrial translational initiation(GO:0070124) |
| 0.9 | 5.6 | GO:0051621 | negative regulation of dopamine uptake involved in synaptic transmission(GO:0051585) norepinephrine uptake(GO:0051620) regulation of norepinephrine uptake(GO:0051621) negative regulation of norepinephrine uptake(GO:0051622) negative regulation of catecholamine uptake involved in synaptic transmission(GO:0051945) regulation of glutathione peroxidase activity(GO:1903282) positive regulation of glutathione peroxidase activity(GO:1903284) positive regulation of hydrogen peroxide catabolic process(GO:1903285) positive regulation of peroxidase activity(GO:2000470) |
| 0.9 | 3.5 | GO:1904428 | negative regulation of tubulin deacetylation(GO:1904428) |
| 0.8 | 4.0 | GO:0043504 | mitochondrial DNA repair(GO:0043504) |
| 0.7 | 0.7 | GO:0046668 | regulation of retinal cell programmed cell death(GO:0046668) |
| 0.7 | 2.6 | GO:1990535 | neuron projection maintenance(GO:1990535) |
| 0.6 | 1.9 | GO:0001868 | regulation of complement activation, lectin pathway(GO:0001868) negative regulation of complement activation, lectin pathway(GO:0001869) |
| 0.6 | 2.5 | GO:0006663 | platelet activating factor biosynthetic process(GO:0006663) |
| 0.6 | 1.8 | GO:0032707 | negative regulation of interleukin-23 production(GO:0032707) |
| 0.6 | 1.8 | GO:1904437 | positive regulation of iron ion transport(GO:0034758) positive regulation of iron ion transmembrane transport(GO:0034761) regulation of iron ion import(GO:1900390) regulation of ferrous iron import into cell(GO:1903989) positive regulation of ferrous iron import into cell(GO:1903991) regulation of ferrous iron binding(GO:1904432) positive regulation of ferrous iron binding(GO:1904434) regulation of transferrin receptor binding(GO:1904435) positive regulation of transferrin receptor binding(GO:1904437) regulation of ferrous iron import across plasma membrane(GO:1904438) positive regulation of ferrous iron import across plasma membrane(GO:1904440) |
| 0.6 | 2.3 | GO:0032474 | otolith morphogenesis(GO:0032474) |
| 0.6 | 3.5 | GO:0010025 | wax biosynthetic process(GO:0010025) wax metabolic process(GO:0010166) |
| 0.6 | 3.4 | GO:0070973 | protein localization to endoplasmic reticulum exit site(GO:0070973) |
| 0.6 | 1.7 | GO:0016487 | sesquiterpenoid metabolic process(GO:0006714) sesquiterpenoid catabolic process(GO:0016107) farnesol metabolic process(GO:0016487) farnesol catabolic process(GO:0016488) regulation of testosterone biosynthetic process(GO:2000224) |
| 0.6 | 1.7 | GO:0009106 | lipoate metabolic process(GO:0009106) |
| 0.6 | 1.7 | GO:0006711 | estrogen catabolic process(GO:0006711) |
| 0.5 | 1.6 | GO:1902809 | regulation of skeletal muscle fiber differentiation(GO:1902809) |
| 0.5 | 1.6 | GO:0035915 | pore formation in membrane of other organism(GO:0035915) |
| 0.5 | 1.6 | GO:0090285 | negative regulation of protein glycosylation in Golgi(GO:0090285) |
| 0.5 | 7.4 | GO:1904321 | response to forskolin(GO:1904321) cellular response to forskolin(GO:1904322) |
| 0.5 | 1.0 | GO:1901979 | regulation of inward rectifier potassium channel activity(GO:1901979) |
| 0.5 | 3.0 | GO:0006196 | AMP catabolic process(GO:0006196) |
| 0.5 | 3.8 | GO:0003138 | primary heart field specification(GO:0003138) sinoatrial valve development(GO:0003172) sinoatrial valve morphogenesis(GO:0003185) |
| 0.5 | 1.4 | GO:0021558 | trochlear nerve development(GO:0021558) negative regulation of auditory receptor cell differentiation(GO:0045608) regulation of timing of neuron differentiation(GO:0060164) negative regulation of pro-B cell differentiation(GO:2000974) |
| 0.5 | 1.4 | GO:0071449 | cellular response to lipid hydroperoxide(GO:0071449) |
| 0.5 | 0.5 | GO:0010726 | positive regulation of hydrogen peroxide metabolic process(GO:0010726) |
| 0.5 | 1.4 | GO:0021986 | epithalamus development(GO:0021538) habenula development(GO:0021986) |
| 0.5 | 0.9 | GO:0014016 | neuroblast differentiation(GO:0014016) |
| 0.4 | 0.4 | GO:0050787 | detoxification of mercury ion(GO:0050787) |
| 0.4 | 4.9 | GO:2000795 | negative regulation of epithelial cell proliferation involved in lung morphogenesis(GO:2000795) |
| 0.4 | 1.7 | GO:0034553 | respiratory chain complex II assembly(GO:0034552) mitochondrial respiratory chain complex II assembly(GO:0034553) mitochondrial respiratory chain complex II biogenesis(GO:0097032) |
| 0.4 | 1.3 | GO:0046725 | negative regulation by virus of viral protein levels in host cell(GO:0046725) negative regulation of metanephric nephron tubule epithelial cell differentiation(GO:0072308) |
| 0.4 | 2.6 | GO:0061518 | macrophage proliferation(GO:0061517) microglial cell proliferation(GO:0061518) |
| 0.4 | 0.9 | GO:0090031 | positive regulation of steroid hormone biosynthetic process(GO:0090031) |
| 0.4 | 1.3 | GO:0071848 | circadian temperature homeostasis(GO:0060086) regulation of fever generation by regulation of prostaglandin secretion(GO:0071810) positive regulation of fever generation by positive regulation of prostaglandin secretion(GO:0071812) positive regulation of ERK1 and ERK2 cascade via TNFSF11-mediated signaling(GO:0071848) regulation of fever generation by prostaglandin secretion(GO:0100009) |
| 0.4 | 1.2 | GO:1902997 | regulation of choline O-acetyltransferase activity(GO:1902769) positive regulation of choline O-acetyltransferase activity(GO:1902771) negative regulation of tau-protein kinase activity(GO:1902948) positive regulation of early endosome to recycling endosome transport(GO:1902955) negative regulation of aspartic-type endopeptidase activity involved in amyloid precursor protein catabolic process(GO:1902960) regulation of neurofibrillary tangle assembly(GO:1902996) negative regulation of neurofibrillary tangle assembly(GO:1902997) negative regulation of aspartic-type peptidase activity(GO:1905246) |
| 0.4 | 1.2 | GO:0009085 | lysine biosynthetic process(GO:0009085) lysine biosynthetic process via aminoadipic acid(GO:0019878) |
| 0.4 | 1.6 | GO:0036269 | swimming behavior(GO:0036269) |
| 0.4 | 2.3 | GO:1903566 | positive regulation of protein localization to cilium(GO:1903566) |
| 0.4 | 3.8 | GO:0098967 | exocytic insertion of neurotransmitter receptor to plasma membrane(GO:0098881) exocytic insertion of neurotransmitter receptor to postsynaptic membrane(GO:0098967) |
| 0.4 | 0.8 | GO:0010645 | regulation of cell communication by chemical coupling(GO:0010645) positive regulation of cell communication by chemical coupling(GO:0010652) |
| 0.4 | 1.1 | GO:1902958 | neuron intrinsic apoptotic signaling pathway in response to hydrogen peroxide(GO:0036482) positive regulation of mitochondrial electron transport, NADH to ubiquinone(GO:1902958) regulation of hydrogen peroxide-induced neuron intrinsic apoptotic signaling pathway(GO:1903383) negative regulation of hydrogen peroxide-induced neuron intrinsic apoptotic signaling pathway(GO:1903384) |
| 0.4 | 1.1 | GO:0098746 | fast, calcium ion-dependent exocytosis of neurotransmitter(GO:0098746) |
| 0.4 | 1.1 | GO:0072709 | cellular response to sorbitol(GO:0072709) |
| 0.4 | 1.5 | GO:0044210 | 'de novo' CTP biosynthetic process(GO:0044210) |
| 0.4 | 3.0 | GO:0002074 | extraocular skeletal muscle development(GO:0002074) |
| 0.4 | 1.1 | GO:0048560 | establishment of anatomical structure orientation(GO:0048560) |
| 0.4 | 1.1 | GO:0036071 | N-glycan fucosylation(GO:0036071) |
| 0.4 | 4.3 | GO:0060352 | cell adhesion molecule production(GO:0060352) |
| 0.4 | 1.1 | GO:0036111 | very long-chain fatty-acyl-CoA metabolic process(GO:0036111) |
| 0.3 | 0.7 | GO:0016095 | polyprenol catabolic process(GO:0016095) |
| 0.3 | 1.0 | GO:0061580 | colon epithelial cell migration(GO:0061580) |
| 0.3 | 1.0 | GO:0050653 | chondroitin sulfate proteoglycan biosynthetic process, polysaccharide chain biosynthetic process(GO:0050653) |
| 0.3 | 13.2 | GO:0061049 | physiological muscle hypertrophy(GO:0003298) physiological cardiac muscle hypertrophy(GO:0003301) cell growth involved in cardiac muscle cell development(GO:0061049) |
| 0.3 | 1.0 | GO:0031550 | positive regulation of brain-derived neurotrophic factor receptor signaling pathway(GO:0031550) |
| 0.3 | 1.7 | GO:0009450 | gamma-aminobutyric acid catabolic process(GO:0009450) |
| 0.3 | 1.3 | GO:0055014 | atrial cardiac muscle cell differentiation(GO:0055011) atrial cardiac muscle cell development(GO:0055014) |
| 0.3 | 1.6 | GO:0048388 | endosomal lumen acidification(GO:0048388) |
| 0.3 | 2.3 | GO:0006269 | DNA replication, synthesis of RNA primer(GO:0006269) |
| 0.3 | 1.0 | GO:1903926 | signal transduction involved in intra-S DNA damage checkpoint(GO:0072428) response to bisphenol A(GO:1903925) cellular response to bisphenol A(GO:1903926) |
| 0.3 | 4.2 | GO:0034285 | response to sucrose(GO:0009744) response to disaccharide(GO:0034285) |
| 0.3 | 1.6 | GO:0070940 | dephosphorylation of RNA polymerase II C-terminal domain(GO:0070940) |
| 0.3 | 1.2 | GO:0061357 | positive regulation of Wnt protein secretion(GO:0061357) |
| 0.3 | 2.8 | GO:0051388 | positive regulation of neurotrophin TRK receptor signaling pathway(GO:0051388) |
| 0.3 | 0.9 | GO:0010607 | negative regulation of cytoplasmic mRNA processing body assembly(GO:0010607) |
| 0.3 | 4.9 | GO:0070914 | UV-damage excision repair(GO:0070914) |
| 0.3 | 1.5 | GO:0090362 | positive regulation of platelet-derived growth factor production(GO:0090362) |
| 0.3 | 1.2 | GO:0006740 | NADPH regeneration(GO:0006740) |
| 0.3 | 0.9 | GO:0033499 | galactose catabolic process via UDP-galactose(GO:0033499) |
| 0.3 | 0.9 | GO:0051877 | pigment granule aggregation in cell center(GO:0051877) |
| 0.3 | 1.7 | GO:0038016 | insulin receptor internalization(GO:0038016) |
| 0.3 | 1.4 | GO:0097211 | response to gonadotropin-releasing hormone(GO:0097210) cellular response to gonadotropin-releasing hormone(GO:0097211) |
| 0.3 | 1.4 | GO:0009082 | branched-chain amino acid biosynthetic process(GO:0009082) leucine biosynthetic process(GO:0009098) valine biosynthetic process(GO:0009099) |
| 0.3 | 2.2 | GO:0032790 | ribosome disassembly(GO:0032790) |
| 0.3 | 0.8 | GO:2000646 | positive regulation of receptor catabolic process(GO:2000646) |
| 0.3 | 3.2 | GO:0015886 | heme transport(GO:0015886) |
| 0.3 | 0.8 | GO:0007231 | osmosensory signaling pathway(GO:0007231) |
| 0.3 | 0.5 | GO:0032765 | positive regulation of mast cell cytokine production(GO:0032765) |
| 0.3 | 6.7 | GO:0071447 | cellular response to hydroperoxide(GO:0071447) |
| 0.3 | 1.0 | GO:0002913 | positive regulation of T cell anergy(GO:0002669) positive regulation of lymphocyte anergy(GO:0002913) |
| 0.3 | 1.8 | GO:0097461 | ferric iron import into cell(GO:0097461) ferric iron import across plasma membrane(GO:0098706) |
| 0.2 | 3.5 | GO:0045919 | positive regulation of cytolysis(GO:0045919) |
| 0.2 | 1.2 | GO:0098904 | regulation of AV node cell action potential(GO:0098904) |
| 0.2 | 0.5 | GO:0018312 | peptidyl-serine ADP-ribosylation(GO:0018312) |
| 0.2 | 1.8 | GO:0071386 | cellular response to corticosterone stimulus(GO:0071386) |
| 0.2 | 0.7 | GO:0033168 | conversion of ds siRNA to ss siRNA involved in RNA interference(GO:0033168) conversion of ds siRNA to ss siRNA(GO:0036404) |
| 0.2 | 0.2 | GO:0035470 | positive regulation of vascular wound healing(GO:0035470) |
| 0.2 | 0.2 | GO:0035720 | intraciliary anterograde transport(GO:0035720) |
| 0.2 | 0.7 | GO:0001300 | chronological cell aging(GO:0001300) |
| 0.2 | 1.1 | GO:1904491 | protein localization to ciliary transition zone(GO:1904491) |
| 0.2 | 2.0 | GO:0007598 | blood coagulation, extrinsic pathway(GO:0007598) |
| 0.2 | 0.7 | GO:0071344 | diphosphate metabolic process(GO:0071344) |
| 0.2 | 0.7 | GO:0019364 | NADP catabolic process(GO:0006742) pyridine nucleotide catabolic process(GO:0019364) |
| 0.2 | 0.9 | GO:0039650 | modulation by virus of host molecular function(GO:0039506) suppression by virus of host molecular function(GO:0039507) suppression by virus of host catalytic activity(GO:0039513) modulation by virus of host catalytic activity(GO:0039516) suppression by virus of host cysteine-type endopeptidase activity involved in apoptotic process(GO:0039650) negative regulation by symbiont of host catalytic activity(GO:0052053) negative regulation by symbiont of host molecular function(GO:0052056) modulation by symbiont of host catalytic activity(GO:0052148) |
| 0.2 | 0.7 | GO:0061182 | negative regulation of chondrocyte development(GO:0061182) |
| 0.2 | 0.6 | GO:0031247 | actin rod assembly(GO:0031247) |
| 0.2 | 0.6 | GO:0036451 | cap mRNA methylation(GO:0036451) |
| 0.2 | 0.2 | GO:1902957 | negative regulation of mitochondrial electron transport, NADH to ubiquinone(GO:1902957) |
| 0.2 | 0.8 | GO:0071418 | cellular response to amine stimulus(GO:0071418) |
| 0.2 | 0.6 | GO:0046603 | negative regulation of mitotic centrosome separation(GO:0046603) |
| 0.2 | 0.2 | GO:0006533 | aspartate catabolic process(GO:0006533) |
| 0.2 | 1.0 | GO:0090212 | negative regulation of establishment of blood-brain barrier(GO:0090212) |
| 0.2 | 0.8 | GO:0034197 | acylglycerol transport(GO:0034196) triglyceride transport(GO:0034197) |
| 0.2 | 1.2 | GO:0008204 | ergosterol biosynthetic process(GO:0006696) ergosterol metabolic process(GO:0008204) |
| 0.2 | 0.6 | GO:0044778 | meiotic DNA integrity checkpoint(GO:0044778) |
| 0.2 | 1.2 | GO:0046092 | deoxycytidine metabolic process(GO:0046092) |
| 0.2 | 2.2 | GO:0021817 | nucleokinesis involved in cell motility in cerebral cortex radial glia guided migration(GO:0021817) nuclear migration along microtubule(GO:0030473) |
| 0.2 | 0.4 | GO:2000583 | regulation of platelet-derived growth factor receptor-alpha signaling pathway(GO:2000583) negative regulation of platelet-derived growth factor receptor-alpha signaling pathway(GO:2000584) |
| 0.2 | 0.6 | GO:0000350 | generation of catalytic spliceosome for second transesterification step(GO:0000350) |
| 0.2 | 1.2 | GO:0010751 | negative regulation of nitric oxide mediated signal transduction(GO:0010751) |
| 0.2 | 1.0 | GO:0090118 | receptor-mediated endocytosis of low-density lipoprotein particle involved in cholesterol transport(GO:0090118) |
| 0.2 | 1.9 | GO:0060005 | vestibular reflex(GO:0060005) |
| 0.2 | 0.4 | GO:0070859 | positive regulation of bile acid biosynthetic process(GO:0070859) positive regulation of bile acid metabolic process(GO:1904253) |
| 0.2 | 0.6 | GO:0090365 | regulation of mRNA modification(GO:0090365) |
| 0.2 | 1.3 | GO:0034128 | negative regulation of MyD88-independent toll-like receptor signaling pathway(GO:0034128) |
| 0.2 | 0.6 | GO:0090675 | intermicrovillar adhesion(GO:0090675) |
| 0.2 | 0.6 | GO:1900169 | regulation of glucocorticoid mediated signaling pathway(GO:1900169) |
| 0.2 | 0.5 | GO:0090234 | regulation of kinetochore assembly(GO:0090234) |
| 0.2 | 4.0 | GO:0006295 | nucleotide-excision repair, DNA incision, 3'-to lesion(GO:0006295) |
| 0.2 | 0.7 | GO:0015766 | disaccharide transport(GO:0015766) sucrose transport(GO:0015770) oligosaccharide transport(GO:0015772) |
| 0.2 | 1.4 | GO:0061302 | smooth muscle cell-matrix adhesion(GO:0061302) |
| 0.2 | 1.4 | GO:0000707 | meiotic DNA recombinase assembly(GO:0000707) |
| 0.2 | 1.6 | GO:0032511 | late endosome to vacuole transport via multivesicular body sorting pathway(GO:0032511) |
| 0.2 | 0.5 | GO:0019303 | D-ribose catabolic process(GO:0019303) |
| 0.2 | 1.0 | GO:0019509 | L-methionine biosynthetic process from methylthioadenosine(GO:0019509) |
| 0.2 | 0.9 | GO:0019075 | virus maturation(GO:0019075) |
| 0.2 | 0.9 | GO:0014886 | transition between slow and fast fiber(GO:0014886) |
| 0.2 | 1.4 | GO:0033132 | negative regulation of glucokinase activity(GO:0033132) negative regulation of hexokinase activity(GO:1903300) |
| 0.2 | 0.7 | GO:0031455 | glycine betaine biosynthetic process from choline(GO:0019285) glycine betaine metabolic process(GO:0031455) glycine betaine biosynthetic process(GO:0031456) |
| 0.2 | 1.7 | GO:0010993 | regulation of ubiquitin homeostasis(GO:0010993) free ubiquitin chain polymerization(GO:0010994) |
| 0.2 | 1.2 | GO:0000255 | allantoin metabolic process(GO:0000255) |
| 0.2 | 0.8 | GO:0035645 | enteric smooth muscle cell differentiation(GO:0035645) |
| 0.2 | 0.5 | GO:0007525 | somatic muscle development(GO:0007525) |
| 0.2 | 0.3 | GO:0002302 | CD8-positive, alpha-beta T cell differentiation involved in immune response(GO:0002302) |
| 0.2 | 0.5 | GO:0000710 | meiotic mismatch repair(GO:0000710) |
| 0.2 | 0.7 | GO:1904977 | lymphatic endothelial cell migration(GO:1904977) |
| 0.2 | 0.5 | GO:0002949 | tRNA threonylcarbamoyladenosine modification(GO:0002949) |
| 0.2 | 1.0 | GO:0050917 | sensory perception of umami taste(GO:0050917) |
| 0.2 | 1.0 | GO:0071460 | cellular response to cell-matrix adhesion(GO:0071460) |
| 0.2 | 3.7 | GO:0033141 | positive regulation of peptidyl-serine phosphorylation of STAT protein(GO:0033141) |
| 0.2 | 0.6 | GO:0030821 | negative regulation of cyclic nucleotide catabolic process(GO:0030806) negative regulation of cAMP catabolic process(GO:0030821) |
| 0.2 | 3.8 | GO:0009812 | flavonoid metabolic process(GO:0009812) |
| 0.2 | 0.9 | GO:0048859 | formation of anatomical boundary(GO:0048859) |
| 0.2 | 2.0 | GO:0072257 | metanephric nephron tubule epithelial cell differentiation(GO:0072257) regulation of metanephric nephron tubule epithelial cell differentiation(GO:0072307) |
| 0.2 | 0.5 | GO:0090526 | regulation of gluconeogenesis involved in cellular glucose homeostasis(GO:0090526) |
| 0.2 | 0.8 | GO:2001106 | regulation of Rho guanyl-nucleotide exchange factor activity(GO:2001106) |
| 0.2 | 2.9 | GO:0034391 | smooth muscle cell apoptotic process(GO:0034390) regulation of smooth muscle cell apoptotic process(GO:0034391) |
| 0.2 | 0.6 | GO:0007113 | endomitotic cell cycle(GO:0007113) |
| 0.2 | 2.0 | GO:0030422 | production of siRNA involved in RNA interference(GO:0030422) |
| 0.2 | 2.1 | GO:0043374 | CD8-positive, alpha-beta T cell differentiation(GO:0043374) |
| 0.1 | 0.9 | GO:0061624 | fructose catabolic process(GO:0006001) fructose catabolic process to hydroxyacetone phosphate and glyceraldehyde-3-phosphate(GO:0061624) |
| 0.1 | 3.4 | GO:0016558 | protein import into peroxisome matrix(GO:0016558) |
| 0.1 | 1.0 | GO:0032803 | regulation of low-density lipoprotein particle receptor catabolic process(GO:0032803) |
| 0.1 | 0.4 | GO:0006780 | uroporphyrinogen III biosynthetic process(GO:0006780) succinyl-CoA pathway(GO:0006781) uroporphyrinogen III metabolic process(GO:0046502) |
| 0.1 | 0.6 | GO:0005986 | sucrose biosynthetic process(GO:0005986) |
| 0.1 | 0.9 | GO:2000676 | positive regulation of type B pancreatic cell apoptotic process(GO:2000676) |
| 0.1 | 0.6 | GO:0009447 | putrescine catabolic process(GO:0009447) |
| 0.1 | 0.6 | GO:0016259 | selenocysteine metabolic process(GO:0016259) |
| 0.1 | 0.4 | GO:0016122 | tetraterpenoid metabolic process(GO:0016108) carotenoid metabolic process(GO:0016116) carotene catabolic process(GO:0016121) xanthophyll metabolic process(GO:0016122) terpene catabolic process(GO:0046247) |
| 0.1 | 1.0 | GO:0006990 | positive regulation of transcription from RNA polymerase II promoter involved in unfolded protein response(GO:0006990) |
| 0.1 | 0.9 | GO:0033274 | response to vitamin B2(GO:0033274) heterochromatin maintenance(GO:0070829) |
| 0.1 | 0.7 | GO:2001181 | positive regulation of interleukin-10 secretion(GO:2001181) |
| 0.1 | 2.4 | GO:0070986 | left/right axis specification(GO:0070986) |
| 0.1 | 0.6 | GO:0043060 | meiotic metaphase I plate congression(GO:0043060) meiotic spindle midzone assembly(GO:0051257) meiotic metaphase plate congression(GO:0051311) |
| 0.1 | 0.3 | GO:0033034 | positive regulation of neutrophil apoptotic process(GO:0033031) positive regulation of myeloid cell apoptotic process(GO:0033034) |
| 0.1 | 0.6 | GO:0071395 | response to jasmonic acid(GO:0009753) cellular response to jasmonic acid stimulus(GO:0071395) |
| 0.1 | 1.5 | GO:0033210 | leptin-mediated signaling pathway(GO:0033210) |
| 0.1 | 0.8 | GO:0052695 | cellular glucuronidation(GO:0052695) |
| 0.1 | 1.9 | GO:0034638 | phosphatidylcholine catabolic process(GO:0034638) |
| 0.1 | 0.9 | GO:1900262 | regulation of DNA-directed DNA polymerase activity(GO:1900262) positive regulation of DNA-directed DNA polymerase activity(GO:1900264) |
| 0.1 | 0.3 | GO:0070885 | negative regulation of calcineurin-NFAT signaling cascade(GO:0070885) |
| 0.1 | 0.8 | GO:0015014 | heparan sulfate proteoglycan biosynthetic process, polysaccharide chain biosynthetic process(GO:0015014) |
| 0.1 | 0.5 | GO:0018032 | protein amidation(GO:0018032) |
| 0.1 | 0.9 | GO:0032383 | regulation of intracellular lipid transport(GO:0032377) regulation of intracellular sterol transport(GO:0032380) regulation of intracellular cholesterol transport(GO:0032383) |
| 0.1 | 2.3 | GO:0006012 | galactose metabolic process(GO:0006012) |
| 0.1 | 0.8 | GO:0030043 | actin filament fragmentation(GO:0030043) |
| 0.1 | 0.4 | GO:0019521 | aldonic acid metabolic process(GO:0019520) D-gluconate metabolic process(GO:0019521) |
| 0.1 | 1.3 | GO:0019064 | fusion of virus membrane with host plasma membrane(GO:0019064) membrane fusion involved in viral entry into host cell(GO:0039663) multi-organism membrane fusion(GO:0044800) |
| 0.1 | 0.8 | GO:2000563 | positive regulation of CD4-positive, alpha-beta T cell proliferation(GO:2000563) |
| 0.1 | 1.0 | GO:0006848 | pyruvate transport(GO:0006848) pyruvate transmembrane transport(GO:1901475) |
| 0.1 | 0.5 | GO:0009405 | pathogenesis(GO:0009405) |
| 0.1 | 1.0 | GO:0048014 | Tie signaling pathway(GO:0048014) |
| 0.1 | 0.3 | GO:2000537 | regulation of cGMP-mediated signaling(GO:0010752) regulation of B cell chemotaxis(GO:2000537) positive regulation of B cell chemotaxis(GO:2000538) |
| 0.1 | 0.4 | GO:0010808 | positive regulation of synaptic vesicle priming(GO:0010808) |
| 0.1 | 0.2 | GO:0050955 | thermoception(GO:0050955) |
| 0.1 | 0.5 | GO:0036216 | response to stem cell factor(GO:0036215) cellular response to stem cell factor stimulus(GO:0036216) Kit signaling pathway(GO:0038109) |
| 0.1 | 0.4 | GO:0036292 | DNA rewinding(GO:0036292) |
| 0.1 | 0.4 | GO:0046005 | positive regulation of circadian sleep/wake cycle, REM sleep(GO:0046005) |
| 0.1 | 0.2 | GO:0002581 | negative regulation of antigen processing and presentation of peptide or polysaccharide antigen via MHC class II(GO:0002581) |
| 0.1 | 0.5 | GO:0046485 | ether lipid metabolic process(GO:0046485) |
| 0.1 | 0.4 | GO:0044878 | mitotic cytokinesis checkpoint(GO:0044878) |
| 0.1 | 0.2 | GO:1902896 | terminal web assembly(GO:1902896) |
| 0.1 | 0.4 | GO:0000964 | mitochondrial RNA 5'-end processing(GO:0000964) |
| 0.1 | 0.4 | GO:0071206 | establishment of protein localization to juxtaparanode region of axon(GO:0071206) |
| 0.1 | 0.4 | GO:0002416 | IgG immunoglobulin transcytosis in epithelial cells mediated by FcRn immunoglobulin receptor(GO:0002416) |
| 0.1 | 0.4 | GO:0048633 | positive regulation of skeletal muscle tissue growth(GO:0048633) |
| 0.1 | 0.6 | GO:0071163 | DNA replication preinitiation complex assembly(GO:0071163) |
| 0.1 | 1.2 | GO:0016255 | attachment of GPI anchor to protein(GO:0016255) |
| 0.1 | 0.3 | GO:1902683 | regulation of receptor localization to synapse(GO:1902683) |
| 0.1 | 0.4 | GO:0097676 | histone H3-K36 dimethylation(GO:0097676) |
| 0.1 | 0.6 | GO:2000504 | positive regulation of blood vessel remodeling(GO:2000504) |
| 0.1 | 0.4 | GO:0021965 | spinal cord ventral commissure morphogenesis(GO:0021965) |
| 0.1 | 0.2 | GO:0006447 | regulation of translational initiation by iron(GO:0006447) |
| 0.1 | 0.6 | GO:0048496 | maintenance of organ identity(GO:0048496) |
| 0.1 | 0.2 | GO:0061428 | negative regulation of transcription from RNA polymerase II promoter in response to hypoxia(GO:0061428) |
| 0.1 | 0.3 | GO:0061508 | dADP phosphorylation(GO:0006174) dGDP phosphorylation(GO:0006186) AMP phosphorylation(GO:0006756) CDP phosphorylation(GO:0061508) dAMP phosphorylation(GO:0061565) CMP phosphorylation(GO:0061566) dCMP phosphorylation(GO:0061567) GDP phosphorylation(GO:0061568) UDP phosphorylation(GO:0061569) dCDP phosphorylation(GO:0061570) TDP phosphorylation(GO:0061571) |
| 0.1 | 0.3 | GO:0010133 | proline catabolic process to glutamate(GO:0010133) |
| 0.1 | 0.9 | GO:1904628 | response to phorbol 13-acetate 12-myristate(GO:1904627) cellular response to phorbol 13-acetate 12-myristate(GO:1904628) |
| 0.1 | 0.4 | GO:0032455 | nerve growth factor processing(GO:0032455) |
| 0.1 | 0.8 | GO:1903027 | regulation of complement activation, classical pathway(GO:0030450) negative regulation of complement activation, classical pathway(GO:0045959) regulation of opsonization(GO:1903027) |
| 0.1 | 0.4 | GO:0002636 | positive regulation of germinal center formation(GO:0002636) |
| 0.1 | 0.6 | GO:0033490 | cholesterol biosynthetic process via desmosterol(GO:0033489) cholesterol biosynthetic process via lathosterol(GO:0033490) |
| 0.1 | 1.2 | GO:0015747 | urate transport(GO:0015747) |
| 0.1 | 0.8 | GO:0051415 | interphase microtubule nucleation by interphase microtubule organizing center(GO:0051415) microtubule nucleation by microtubule organizing center(GO:0051418) |
| 0.1 | 0.6 | GO:0044791 | modulation by host of viral release from host cell(GO:0044789) positive regulation by host of viral release from host cell(GO:0044791) |
| 0.1 | 0.5 | GO:1901529 | positive regulation of anion channel activity(GO:1901529) |
| 0.1 | 0.1 | GO:2000395 | regulation of ubiquitin-dependent endocytosis(GO:2000395) positive regulation of ubiquitin-dependent endocytosis(GO:2000397) |
| 0.1 | 1.1 | GO:0051894 | positive regulation of focal adhesion assembly(GO:0051894) positive regulation of adherens junction organization(GO:1903393) |
| 0.1 | 0.8 | GO:0006105 | succinate metabolic process(GO:0006105) |
| 0.1 | 0.9 | GO:0022027 | interkinetic nuclear migration(GO:0022027) |
| 0.1 | 0.2 | GO:1904844 | response to aldosterone(GO:1904044) response to L-glutamine(GO:1904844) cellular response to L-glutamine(GO:1904845) |
| 0.1 | 0.9 | GO:0017062 | respiratory chain complex III assembly(GO:0017062) mitochondrial respiratory chain complex III assembly(GO:0034551) |
| 0.1 | 1.9 | GO:0033617 | mitochondrial respiratory chain complex IV assembly(GO:0033617) |
| 0.1 | 0.6 | GO:0071051 | polyadenylation-dependent snoRNA 3'-end processing(GO:0071051) |
| 0.1 | 1.0 | GO:0090073 | positive regulation of protein homodimerization activity(GO:0090073) |
| 0.1 | 0.3 | GO:0033591 | response to L-ascorbic acid(GO:0033591) |
| 0.1 | 1.3 | GO:0036089 | cleavage furrow formation(GO:0036089) |
| 0.1 | 0.2 | GO:2000296 | negative regulation of hydrogen peroxide catabolic process(GO:2000296) |
| 0.1 | 0.4 | GO:0031443 | fast-twitch skeletal muscle fiber contraction(GO:0031443) |
| 0.1 | 0.5 | GO:1905065 | positive regulation of vascular smooth muscle cell differentiation(GO:1905065) |
| 0.1 | 0.4 | GO:0097069 | cellular response to thyroxine stimulus(GO:0097069) cellular response to L-phenylalanine derivative(GO:1904387) |
| 0.1 | 0.4 | GO:0023021 | termination of signal transduction(GO:0023021) |
| 0.1 | 0.5 | GO:0000379 | tRNA-type intron splice site recognition and cleavage(GO:0000379) |
| 0.1 | 1.2 | GO:0006564 | L-serine biosynthetic process(GO:0006564) |
| 0.1 | 1.4 | GO:0051044 | positive regulation of membrane protein ectodomain proteolysis(GO:0051044) |
| 0.1 | 0.2 | GO:0019087 | transformation of host cell by virus(GO:0019087) |
| 0.1 | 0.6 | GO:0006627 | protein processing involved in protein targeting to mitochondrion(GO:0006627) |
| 0.1 | 2.7 | GO:0007095 | mitotic G2 DNA damage checkpoint(GO:0007095) |
| 0.1 | 0.3 | GO:0006121 | mitochondrial electron transport, succinate to ubiquinone(GO:0006121) |
| 0.1 | 0.2 | GO:0071373 | cellular response to cocaine(GO:0071314) cellular response to luteinizing hormone stimulus(GO:0071373) |
| 0.1 | 1.2 | GO:0032074 | negative regulation of nuclease activity(GO:0032074) |
| 0.1 | 0.8 | GO:0010886 | positive regulation of cholesterol storage(GO:0010886) |
| 0.1 | 0.3 | GO:0042732 | D-xylose metabolic process(GO:0042732) |
| 0.1 | 1.1 | GO:0033623 | regulation of integrin activation(GO:0033623) |
| 0.1 | 1.7 | GO:0009312 | oligosaccharide biosynthetic process(GO:0009312) |
| 0.1 | 0.4 | GO:0099640 | axo-dendritic protein transport(GO:0099640) |
| 0.1 | 0.4 | GO:0019626 | short-chain fatty acid catabolic process(GO:0019626) |
| 0.1 | 0.4 | GO:0016199 | axon midline choice point recognition(GO:0016199) |
| 0.1 | 0.5 | GO:0071461 | cellular response to redox state(GO:0071461) |
| 0.1 | 1.7 | GO:0040015 | negative regulation of multicellular organism growth(GO:0040015) |
| 0.1 | 0.8 | GO:0031339 | negative regulation of vesicle fusion(GO:0031339) |
| 0.1 | 0.7 | GO:0035093 | spermatogenesis, exchange of chromosomal proteins(GO:0035093) |
| 0.1 | 1.0 | GO:0048251 | elastic fiber assembly(GO:0048251) |
| 0.1 | 0.3 | GO:0030576 | Cajal body organization(GO:0030576) |
| 0.1 | 0.4 | GO:1903998 | regulation of eating behavior(GO:1903998) |
| 0.1 | 0.3 | GO:1903751 | regulation of intrinsic apoptotic signaling pathway in response to hydrogen peroxide(GO:1903750) negative regulation of intrinsic apoptotic signaling pathway in response to hydrogen peroxide(GO:1903751) |
| 0.1 | 1.1 | GO:0051775 | response to redox state(GO:0051775) |
| 0.1 | 3.2 | GO:0001580 | detection of chemical stimulus involved in sensory perception of bitter taste(GO:0001580) |
| 0.1 | 0.4 | GO:0001180 | transcription initiation from RNA polymerase I promoter for nuclear large rRNA transcript(GO:0001180) |
| 0.1 | 0.2 | GO:0018282 | metal incorporation into metallo-sulfur cluster(GO:0018282) iron incorporation into metallo-sulfur cluster(GO:0018283) |
| 0.1 | 0.4 | GO:0090292 | nuclear matrix anchoring at nuclear membrane(GO:0090292) |
| 0.1 | 1.1 | GO:0021942 | radial glia guided migration of Purkinje cell(GO:0021942) |
| 0.1 | 0.2 | GO:0070676 | intralumenal vesicle formation(GO:0070676) negative regulation of early endosome to late endosome transport(GO:2000642) |
| 0.1 | 1.2 | GO:1903608 | protein localization to cytoplasmic stress granule(GO:1903608) |
| 0.1 | 1.2 | GO:0035721 | intraciliary retrograde transport(GO:0035721) |
| 0.1 | 0.2 | GO:0042357 | thiamine diphosphate metabolic process(GO:0042357) |
| 0.1 | 0.2 | GO:0002503 | peptide antigen assembly with MHC class II protein complex(GO:0002503) |
| 0.1 | 0.2 | GO:0035262 | gonad morphogenesis(GO:0035262) |
| 0.1 | 0.5 | GO:1903361 | protein localization to basolateral plasma membrane(GO:1903361) |
| 0.1 | 0.8 | GO:0072663 | protein targeting to peroxisome(GO:0006625) protein localization to peroxisome(GO:0072662) establishment of protein localization to peroxisome(GO:0072663) |
| 0.1 | 0.9 | GO:0007256 | activation of JNKK activity(GO:0007256) |
| 0.1 | 1.2 | GO:1904776 | regulation of protein localization to cell cortex(GO:1904776) positive regulation of protein localization to cell cortex(GO:1904778) |
| 0.1 | 0.3 | GO:0032072 | plasmacytoid dendritic cell activation(GO:0002270) regulation of restriction endodeoxyribonuclease activity(GO:0032072) T-helper 1 cell activation(GO:0035711) |
| 0.1 | 0.7 | GO:0043654 | recognition of apoptotic cell(GO:0043654) |
| 0.1 | 1.7 | GO:0010257 | NADH dehydrogenase complex assembly(GO:0010257) mitochondrial respiratory chain complex I assembly(GO:0032981) mitochondrial respiratory chain complex I biogenesis(GO:0097031) |
| 0.1 | 0.9 | GO:0046007 | negative regulation of activated T cell proliferation(GO:0046007) |
| 0.1 | 0.9 | GO:0070987 | error-free translesion synthesis(GO:0070987) |
| 0.1 | 0.8 | GO:2000353 | positive regulation of endothelial cell apoptotic process(GO:2000353) |
| 0.1 | 0.2 | GO:0002317 | plasma cell differentiation(GO:0002317) |
| 0.1 | 0.2 | GO:2000502 | negative regulation of natural killer cell chemotaxis(GO:2000502) |
| 0.1 | 0.2 | GO:1901420 | cell migration involved in endocardial cushion formation(GO:0003273) negative regulation of response to alcohol(GO:1901420) |
| 0.1 | 1.1 | GO:0042178 | xenobiotic catabolic process(GO:0042178) |
| 0.1 | 0.4 | GO:2000620 | positive regulation of histone H4-K16 acetylation(GO:2000620) |
| 0.1 | 0.7 | GO:0006975 | DNA damage induced protein phosphorylation(GO:0006975) |
| 0.1 | 0.7 | GO:0070475 | rRNA base methylation(GO:0070475) |
| 0.1 | 14.5 | GO:0007156 | homophilic cell adhesion via plasma membrane adhesion molecules(GO:0007156) |
| 0.1 | 0.1 | GO:0072429 | response to intra-S DNA damage checkpoint signaling(GO:0072429) |
| 0.1 | 2.3 | GO:0048268 | clathrin coat assembly(GO:0048268) |
| 0.1 | 0.9 | GO:0090204 | protein localization to nuclear pore(GO:0090204) |
| 0.1 | 0.2 | GO:0060382 | regulation of DNA strand elongation(GO:0060382) |
| 0.1 | 0.6 | GO:0030242 | pexophagy(GO:0030242) |
| 0.1 | 0.2 | GO:0035526 | retrograde transport, plasma membrane to Golgi(GO:0035526) |
| 0.1 | 0.2 | GO:0044861 | protein transport into plasma membrane raft(GO:0044861) |
| 0.1 | 0.3 | GO:2000393 | negative regulation of lamellipodium morphogenesis(GO:2000393) |
| 0.1 | 0.2 | GO:0036233 | glycine import(GO:0036233) |
| 0.1 | 4.1 | GO:0006904 | vesicle docking involved in exocytosis(GO:0006904) |
| 0.1 | 1.3 | GO:0009642 | response to light intensity(GO:0009642) |
| 0.1 | 0.6 | GO:0070236 | negative regulation of activation-induced cell death of T cells(GO:0070236) |
| 0.1 | 0.2 | GO:1900122 | positive regulation of receptor binding(GO:1900122) |
| 0.1 | 1.3 | GO:0035563 | positive regulation of chromatin binding(GO:0035563) |
| 0.1 | 1.1 | GO:0061299 | retina vasculature morphogenesis in camera-type eye(GO:0061299) |
| 0.1 | 0.8 | GO:0034983 | peptidyl-lysine deacetylation(GO:0034983) |
| 0.1 | 8.9 | GO:0022904 | respiratory electron transport chain(GO:0022904) |
| 0.1 | 0.3 | GO:0021678 | third ventricle development(GO:0021678) |
| 0.1 | 2.6 | GO:0030262 | apoptotic nuclear changes(GO:0030262) |
| 0.1 | 0.8 | GO:0034058 | endosomal vesicle fusion(GO:0034058) |
| 0.1 | 0.2 | GO:0021555 | midbrain-hindbrain boundary morphogenesis(GO:0021555) |
| 0.1 | 0.9 | GO:0098909 | regulation of cardiac muscle cell action potential involved in regulation of contraction(GO:0098909) |
| 0.1 | 0.7 | GO:0045793 | positive regulation of cell size(GO:0045793) |
| 0.1 | 0.5 | GO:0016584 | nucleosome positioning(GO:0016584) |
| 0.1 | 1.3 | GO:0090527 | actin filament reorganization(GO:0090527) |
| 0.1 | 0.9 | GO:1900364 | negative regulation of mRNA polyadenylation(GO:1900364) |
| 0.1 | 0.1 | GO:0001796 | type IIa hypersensitivity(GO:0001794) regulation of type IIa hypersensitivity(GO:0001796) type II hypersensitivity(GO:0002445) regulation of type II hypersensitivity(GO:0002892) |
| 0.1 | 0.4 | GO:0010032 | meiotic chromosome condensation(GO:0010032) |
| 0.1 | 0.2 | GO:0006679 | glucosylceramide biosynthetic process(GO:0006679) |
| 0.1 | 0.2 | GO:1902804 | negative regulation of synaptic vesicle transport(GO:1902804) negative regulation of synaptic vesicle exocytosis(GO:2000301) |
| 0.1 | 2.3 | GO:0006505 | GPI anchor metabolic process(GO:0006505) GPI anchor biosynthetic process(GO:0006506) |
| 0.1 | 0.5 | GO:0060054 | positive regulation of epithelial cell proliferation involved in wound healing(GO:0060054) |
| 0.1 | 1.1 | GO:0001778 | plasma membrane repair(GO:0001778) |
| 0.1 | 0.6 | GO:0006600 | creatine metabolic process(GO:0006600) |
| 0.1 | 0.3 | GO:1901350 | cell-cell signaling involved in cell-cell junction organization(GO:1901350) |
| 0.1 | 0.2 | GO:1901143 | insulin catabolic process(GO:1901143) |
| 0.1 | 0.4 | GO:2000825 | positive regulation of androgen receptor activity(GO:2000825) |
| 0.1 | 0.3 | GO:1903786 | mycotoxin catabolic process(GO:0043387) aflatoxin catabolic process(GO:0046223) organic heteropentacyclic compound catabolic process(GO:1901377) regulation of glutathione biosynthetic process(GO:1903786) positive regulation of glutathione biosynthetic process(GO:1903788) |
| 0.1 | 1.6 | GO:0060394 | negative regulation of pathway-restricted SMAD protein phosphorylation(GO:0060394) |
| 0.1 | 0.1 | GO:0046886 | positive regulation of hormone biosynthetic process(GO:0046886) |
| 0.1 | 0.3 | GO:0018243 | protein O-linked glycosylation via threonine(GO:0018243) |
| 0.1 | 0.9 | GO:0033234 | negative regulation of protein sumoylation(GO:0033234) |
| 0.1 | 0.3 | GO:0061107 | seminal vesicle development(GO:0061107) |
| 0.1 | 0.2 | GO:0035927 | RNA import into mitochondrion(GO:0035927) |
| 0.1 | 0.8 | GO:0034244 | negative regulation of transcription elongation from RNA polymerase II promoter(GO:0034244) |
| 0.1 | 0.4 | GO:0015853 | adenine transport(GO:0015853) |
| 0.1 | 2.0 | GO:0045494 | photoreceptor cell maintenance(GO:0045494) |
| 0.1 | 0.2 | GO:1901164 | negative regulation of trophoblast cell migration(GO:1901164) |
| 0.1 | 1.6 | GO:0006349 | regulation of gene expression by genetic imprinting(GO:0006349) |
| 0.1 | 0.2 | GO:0061732 | mitochondrial acetyl-CoA biosynthetic process from pyruvate(GO:0061732) |
| 0.1 | 0.4 | GO:0034499 | late endosome to Golgi transport(GO:0034499) |
| 0.1 | 0.1 | GO:0042776 | mitochondrial ATP synthesis coupled proton transport(GO:0042776) |
| 0.1 | 0.2 | GO:0031622 | positive regulation of fever generation(GO:0031622) |
| 0.1 | 1.3 | GO:0035728 | response to hepatocyte growth factor(GO:0035728) |
| 0.1 | 0.2 | GO:0035552 | oxidative single-stranded DNA demethylation(GO:0035552) |
| 0.1 | 0.2 | GO:0038018 | Wnt receptor catabolic process(GO:0038018) |
| 0.1 | 0.5 | GO:0000722 | telomere maintenance via recombination(GO:0000722) |
| 0.1 | 0.2 | GO:0019287 | isopentenyl diphosphate biosynthetic process, mevalonate pathway(GO:0019287) |
| 0.1 | 0.4 | GO:1990481 | mRNA pseudouridine synthesis(GO:1990481) |
| 0.1 | 0.2 | GO:1903445 | intermembrane transport(GO:0046909) protein transport from ciliary membrane to plasma membrane(GO:1903445) |
| 0.1 | 0.3 | GO:0051643 | endoplasmic reticulum localization(GO:0051643) |
| 0.1 | 1.0 | GO:0017187 | peptidyl-glutamic acid carboxylation(GO:0017187) protein carboxylation(GO:0018214) |
| 0.1 | 0.6 | GO:0051013 | microtubule severing(GO:0051013) |
| 0.1 | 0.2 | GO:1990834 | response to odorant(GO:1990834) |
| 0.1 | 0.5 | GO:0007023 | post-chaperonin tubulin folding pathway(GO:0007023) |
| 0.1 | 0.3 | GO:0019482 | beta-alanine metabolic process(GO:0019482) |
| 0.1 | 0.7 | GO:1902894 | negative regulation of pri-miRNA transcription from RNA polymerase II promoter(GO:1902894) |
| 0.1 | 0.8 | GO:0046951 | ketone body biosynthetic process(GO:0046951) |
| 0.1 | 0.5 | GO:0046836 | glycolipid transport(GO:0046836) |
| 0.1 | 0.3 | GO:0009249 | protein lipoylation(GO:0009249) |
| 0.1 | 0.4 | GO:0006013 | mannose metabolic process(GO:0006013) |
| 0.1 | 1.0 | GO:0097264 | self proteolysis(GO:0097264) |
| 0.1 | 4.3 | GO:0043268 | positive regulation of potassium ion transport(GO:0043268) |
| 0.1 | 0.7 | GO:0044557 | relaxation of smooth muscle(GO:0044557) |
| 0.1 | 0.4 | GO:0045916 | negative regulation of complement activation(GO:0045916) negative regulation of protein activation cascade(GO:2000258) |
| 0.1 | 13.9 | GO:0008360 | regulation of cell shape(GO:0008360) |
| 0.1 | 0.3 | GO:0036378 | calcitriol biosynthetic process from calciol(GO:0036378) |
| 0.1 | 0.1 | GO:0002378 | immunoglobulin biosynthetic process(GO:0002378) |
| 0.1 | 0.2 | GO:0050883 | negative regulation of sodium:proton antiporter activity(GO:0032416) musculoskeletal movement, spinal reflex action(GO:0050883) |
| 0.1 | 0.3 | GO:0097167 | circadian regulation of translation(GO:0097167) |
| 0.1 | 0.2 | GO:0060631 | regulation of meiosis I(GO:0060631) |
| 0.1 | 3.1 | GO:0009250 | glycogen biosynthetic process(GO:0005978) glucan biosynthetic process(GO:0009250) |
| 0.1 | 0.1 | GO:0019348 | dolichol metabolic process(GO:0019348) |
| 0.1 | 0.5 | GO:0017196 | N-terminal peptidyl-methionine acetylation(GO:0017196) |
| 0.1 | 1.8 | GO:0006301 | postreplication repair(GO:0006301) |
| 0.1 | 2.0 | GO:1900740 | regulation of protein insertion into mitochondrial membrane involved in apoptotic signaling pathway(GO:1900739) positive regulation of protein insertion into mitochondrial membrane involved in apoptotic signaling pathway(GO:1900740) |
| 0.1 | 0.4 | GO:0060750 | epithelial cell proliferation involved in mammary gland duct elongation(GO:0060750) |
| 0.1 | 0.2 | GO:1900063 | regulation of peroxisome organization(GO:1900063) |
| 0.0 | 0.2 | GO:0031087 | nuclear-transcribed mRNA catabolic process, deadenylation-independent decay(GO:0031086) deadenylation-independent decapping of nuclear-transcribed mRNA(GO:0031087) |
| 0.0 | 0.2 | GO:0046878 | regulation of saliva secretion(GO:0046877) positive regulation of saliva secretion(GO:0046878) |
| 0.0 | 0.5 | GO:0031297 | replication fork processing(GO:0031297) |
| 0.0 | 0.7 | GO:1904714 | regulation of chaperone-mediated autophagy(GO:1904714) |
| 0.0 | 3.4 | GO:0043392 | negative regulation of DNA binding(GO:0043392) |
| 0.0 | 0.2 | GO:0071922 | establishment of sister chromatid cohesion(GO:0034085) cohesin loading(GO:0071921) regulation of cohesin loading(GO:0071922) |
| 0.0 | 0.1 | GO:2000617 | positive regulation of histone H3-K9 acetylation(GO:2000617) |
| 0.0 | 1.9 | GO:0006298 | mismatch repair(GO:0006298) |
| 0.0 | 0.5 | GO:0031936 | negative regulation of chromatin silencing(GO:0031936) |
| 0.0 | 1.0 | GO:0030497 | fatty acid elongation(GO:0030497) |
| 0.0 | 0.4 | GO:0032594 | protein transport within lipid bilayer(GO:0032594) protein transport into membrane raft(GO:0032596) |
| 0.0 | 0.2 | GO:1902416 | positive regulation of mRNA binding(GO:1902416) positive regulation of RNA binding(GO:1905216) |
| 0.0 | 0.3 | GO:0006662 | glycerol ether metabolic process(GO:0006662) |
| 0.0 | 0.1 | GO:0002337 | B-1a B cell differentiation(GO:0002337) |
| 0.0 | 0.5 | GO:0051103 | DNA ligation involved in DNA repair(GO:0051103) |
| 0.0 | 0.4 | GO:2000774 | positive regulation of cellular senescence(GO:2000774) |
| 0.0 | 0.5 | GO:0042985 | negative regulation of amyloid precursor protein biosynthetic process(GO:0042985) |
| 0.0 | 2.4 | GO:0009060 | aerobic respiration(GO:0009060) |
| 0.0 | 0.4 | GO:0001766 | membrane raft polarization(GO:0001766) membrane raft distribution(GO:0031580) |
| 0.0 | 0.1 | GO:1904717 | excitatory chemical synaptic transmission(GO:0098976) regulation of AMPA glutamate receptor clustering(GO:1904717) positive regulation of AMPA glutamate receptor clustering(GO:1904719) |
| 0.0 | 1.0 | GO:0031114 | negative regulation of microtubule depolymerization(GO:0007026) regulation of microtubule depolymerization(GO:0031114) |
| 0.0 | 0.1 | GO:0006982 | response to lipid hydroperoxide(GO:0006982) |
| 0.0 | 0.1 | GO:0052199 | negative regulation of catalytic activity in other organism involved in symbiotic interaction(GO:0052199) |
| 0.0 | 0.6 | GO:0042448 | progesterone metabolic process(GO:0042448) |
| 0.0 | 0.2 | GO:2000434 | regulation of protein neddylation(GO:2000434) negative regulation of protein neddylation(GO:2000435) |
| 0.0 | 1.2 | GO:0009081 | branched-chain amino acid metabolic process(GO:0009081) |
| 0.0 | 0.3 | GO:0000389 | mRNA 3'-splice site recognition(GO:0000389) |
| 0.0 | 0.2 | GO:2000582 | regulation of ATP-dependent microtubule motor activity, plus-end-directed(GO:2000580) positive regulation of ATP-dependent microtubule motor activity, plus-end-directed(GO:2000582) |
| 0.0 | 0.2 | GO:0030070 | insulin processing(GO:0030070) |
| 0.0 | 0.2 | GO:0010286 | heat acclimation(GO:0010286) cellular heat acclimation(GO:0070370) |
| 0.0 | 0.2 | GO:1900245 | positive regulation of MDA-5 signaling pathway(GO:1900245) |
| 0.0 | 0.3 | GO:0034723 | DNA replication-dependent nucleosome assembly(GO:0006335) DNA replication-dependent nucleosome organization(GO:0034723) |
| 0.0 | 0.1 | GO:0036245 | cellular response to menadione(GO:0036245) |
| 0.0 | 0.1 | GO:2000402 | negative regulation of lymphocyte migration(GO:2000402) |
| 0.0 | 0.3 | GO:0090666 | scaRNA localization to Cajal body(GO:0090666) |
| 0.0 | 2.4 | GO:0000413 | protein peptidyl-prolyl isomerization(GO:0000413) |
| 0.0 | 0.1 | GO:0097051 | establishment of protein localization to endoplasmic reticulum membrane(GO:0097051) |
| 0.0 | 0.5 | GO:1904903 | ESCRT complex disassembly(GO:1904896) ESCRT III complex disassembly(GO:1904903) |
| 0.0 | 1.0 | GO:0030866 | cortical actin cytoskeleton organization(GO:0030866) |
| 0.0 | 0.7 | GO:1901750 | leukotriene D4 metabolic process(GO:1901748) leukotriene D4 biosynthetic process(GO:1901750) |
| 0.0 | 0.3 | GO:0097026 | dendritic cell dendrite assembly(GO:0097026) |
| 0.0 | 4.2 | GO:0006369 | termination of RNA polymerase II transcription(GO:0006369) |
| 0.0 | 0.5 | GO:0048227 | plasma membrane to endosome transport(GO:0048227) |
| 0.0 | 0.1 | GO:0035811 | negative regulation of urine volume(GO:0035811) |
| 0.0 | 0.1 | GO:1990637 | response to prolactin(GO:1990637) |
| 0.0 | 0.6 | GO:1903690 | negative regulation of wound healing, spreading of epidermal cells(GO:1903690) |
| 0.0 | 0.2 | GO:0060474 | positive regulation of sperm motility involved in capacitation(GO:0060474) |
| 0.0 | 0.2 | GO:1900228 | immune response in mucosal-associated lymphoid tissue(GO:0002386) biofilm formation(GO:0042710) single-species biofilm formation(GO:0044010) single-species biofilm formation in or on host organism(GO:0044407) regulation of single-species biofilm formation(GO:1900190) negative regulation of single-species biofilm formation(GO:1900191) regulation of single-species biofilm formation in or on host organism(GO:1900228) negative regulation of single-species biofilm formation in or on host organism(GO:1900229) |
| 0.0 | 0.3 | GO:0072711 | response to hydroxyurea(GO:0072710) cellular response to hydroxyurea(GO:0072711) |
| 0.0 | 0.9 | GO:0046597 | negative regulation of viral entry into host cell(GO:0046597) |
| 0.0 | 1.9 | GO:0034728 | nucleosome organization(GO:0034728) |
| 0.0 | 0.4 | GO:0043129 | surfactant homeostasis(GO:0043129) |
| 0.0 | 0.3 | GO:1904851 | positive regulation of establishment of protein localization to telomere(GO:1904851) |
| 0.0 | 0.2 | GO:0044240 | multicellular organism lipid catabolic process(GO:0044240) |
| 0.0 | 0.2 | GO:0045938 | positive regulation of circadian sleep/wake cycle, sleep(GO:0045938) |
| 0.0 | 0.2 | GO:0038161 | prolactin signaling pathway(GO:0038161) |
| 0.0 | 0.2 | GO:1902172 | keratinocyte apoptotic process(GO:0097283) regulation of keratinocyte apoptotic process(GO:1902172) |
| 0.0 | 0.3 | GO:0050859 | negative regulation of B cell receptor signaling pathway(GO:0050859) |
| 0.0 | 0.7 | GO:0006488 | dolichol-linked oligosaccharide biosynthetic process(GO:0006488) |
| 0.0 | 0.5 | GO:0043983 | histone H4-K12 acetylation(GO:0043983) |
| 0.0 | 0.2 | GO:1902255 | regulation of DNA damage response, signal transduction by p53 class mediator resulting in transcription of p21 class mediator(GO:1902162) positive regulation of DNA damage response, signal transduction by p53 class mediator resulting in transcription of p21 class mediator(GO:1902164) positive regulation of intrinsic apoptotic signaling pathway by p53 class mediator(GO:1902255) |
| 0.0 | 0.8 | GO:0000732 | strand displacement(GO:0000732) |
| 0.0 | 0.5 | GO:0010801 | negative regulation of peptidyl-threonine phosphorylation(GO:0010801) |
| 0.0 | 0.6 | GO:0060294 | cilium movement involved in cell motility(GO:0060294) |
| 0.0 | 0.1 | GO:0048537 | mucosal-associated lymphoid tissue development(GO:0048537) Peyer's patch development(GO:0048541) Peyer's patch morphogenesis(GO:0061146) lymphocyte migration into lymphoid organs(GO:0097021) |
| 0.0 | 0.1 | GO:0051005 | negative regulation of lipoprotein lipase activity(GO:0051005) |
| 0.0 | 0.1 | GO:1901253 | regulation of intracellular transport of viral material(GO:1901252) negative regulation of intracellular transport of viral material(GO:1901253) |
| 0.0 | 0.1 | GO:0035494 | SNARE complex disassembly(GO:0035494) |
| 0.0 | 0.6 | GO:0098779 | mitophagy in response to mitochondrial depolarization(GO:0098779) |
| 0.0 | 0.3 | GO:0006686 | sphingomyelin biosynthetic process(GO:0006686) |
| 0.0 | 0.4 | GO:0006189 | 'de novo' IMP biosynthetic process(GO:0006189) |
| 0.0 | 0.1 | GO:0002921 | negative regulation of humoral immune response(GO:0002921) |
| 0.0 | 1.2 | GO:0007194 | negative regulation of adenylate cyclase activity(GO:0007194) |
| 0.0 | 0.5 | GO:0098719 | sodium ion import(GO:0097369) sodium ion import across plasma membrane(GO:0098719) sodium ion import into cell(GO:1990118) |
| 0.0 | 0.3 | GO:0050882 | voluntary musculoskeletal movement(GO:0050882) |
| 0.0 | 0.1 | GO:0045897 | positive regulation of transcription during mitosis(GO:0045897) |
| 0.0 | 0.3 | GO:0060628 | regulation of ER to Golgi vesicle-mediated transport(GO:0060628) |
| 0.0 | 0.2 | GO:0090649 | response to oxygen-glucose deprivation(GO:0090649) cellular response to oxygen-glucose deprivation(GO:0090650) |
| 0.0 | 0.2 | GO:0042539 | hypotonic salinity response(GO:0042539) cellular hypotonic salinity response(GO:0071477) |
| 0.0 | 0.1 | GO:0035425 | autocrine signaling(GO:0035425) |
| 0.0 | 0.1 | GO:0006581 | acetylcholine catabolic process in synaptic cleft(GO:0001507) acetylcholine catabolic process(GO:0006581) |
| 0.0 | 1.1 | GO:2000114 | regulation of establishment of cell polarity(GO:2000114) |
| 0.0 | 0.2 | GO:1903237 | negative regulation of leukocyte tethering or rolling(GO:1903237) |
| 0.0 | 0.7 | GO:0021756 | striatum development(GO:0021756) |
| 0.0 | 1.3 | GO:0043928 | exonucleolytic nuclear-transcribed mRNA catabolic process involved in deadenylation-dependent decay(GO:0043928) |
| 0.0 | 1.6 | GO:0006910 | phagocytosis, recognition(GO:0006910) |
| 0.0 | 0.3 | GO:0007168 | receptor guanylyl cyclase signaling pathway(GO:0007168) |
| 0.0 | 0.9 | GO:0050667 | homocysteine metabolic process(GO:0050667) |
| 0.0 | 0.1 | GO:0001810 | regulation of type I hypersensitivity(GO:0001810) positive regulation of type I hypersensitivity(GO:0001812) type I hypersensitivity(GO:0016068) |
| 0.0 | 1.4 | GO:0030206 | chondroitin sulfate biosynthetic process(GO:0030206) |
| 0.0 | 0.1 | GO:0045356 | positive regulation of interferon-alpha biosynthetic process(GO:0045356) |
| 0.0 | 0.5 | GO:0006911 | phagocytosis, engulfment(GO:0006911) |
| 0.0 | 0.3 | GO:1901673 | regulation of mitotic spindle assembly(GO:1901673) |
| 0.0 | 0.1 | GO:0043012 | regulation of fusion of sperm to egg plasma membrane(GO:0043012) |
| 0.0 | 0.5 | GO:0043046 | DNA methylation involved in gamete generation(GO:0043046) |
| 0.0 | 1.3 | GO:1901661 | quinone metabolic process(GO:1901661) |
| 0.0 | 0.3 | GO:0060285 | cilium-dependent cell motility(GO:0060285) |
| 0.0 | 0.5 | GO:0038203 | TORC2 signaling(GO:0038203) |
| 0.0 | 0.2 | GO:2000480 | negative regulation of cAMP-dependent protein kinase activity(GO:2000480) |
| 0.0 | 0.1 | GO:0044313 | protein K6-linked deubiquitination(GO:0044313) protein K27-linked deubiquitination(GO:1990167) |
| 0.0 | 0.2 | GO:0048672 | positive regulation of collateral sprouting(GO:0048672) |
| 0.0 | 0.5 | GO:0044030 | regulation of DNA methylation(GO:0044030) |
| 0.0 | 0.2 | GO:0030091 | protein repair(GO:0030091) |
| 0.0 | 0.9 | GO:0006337 | nucleosome disassembly(GO:0006337) |
| 0.0 | 0.4 | GO:0090361 | platelet-derived growth factor production(GO:0090360) regulation of platelet-derived growth factor production(GO:0090361) |
| 0.0 | 0.2 | GO:0000480 | endonucleolytic cleavage in 5'-ETS of tricistronic rRNA transcript (SSU-rRNA, 5.8S rRNA, LSU-rRNA)(GO:0000480) |
| 0.0 | 0.5 | GO:0034975 | protein folding in endoplasmic reticulum(GO:0034975) |
| 0.0 | 0.1 | GO:2000619 | negative regulation of histone H4-K16 acetylation(GO:2000619) |
| 0.0 | 0.2 | GO:0060159 | regulation of dopamine receptor signaling pathway(GO:0060159) |
| 0.0 | 0.3 | GO:0007084 | mitotic nuclear envelope reassembly(GO:0007084) |
| 0.0 | 0.1 | GO:0034721 | histone H3-K4 demethylation, trimethyl-H3-K4-specific(GO:0034721) |
| 0.0 | 0.1 | GO:0009086 | methionine biosynthetic process(GO:0009086) |
| 0.0 | 0.2 | GO:2000348 | regulation of CD40 signaling pathway(GO:2000348) |
| 0.0 | 0.5 | GO:0010226 | response to lithium ion(GO:0010226) |
| 0.0 | 1.1 | GO:0051693 | actin filament capping(GO:0051693) |
| 0.0 | 0.3 | GO:0046520 | sphingoid biosynthetic process(GO:0046520) |
| 0.0 | 0.4 | GO:0051601 | exocyst localization(GO:0051601) |
| 0.0 | 0.6 | GO:0006306 | DNA alkylation(GO:0006305) DNA methylation(GO:0006306) |
| 0.0 | 0.3 | GO:2000586 | regulation of platelet-derived growth factor receptor-beta signaling pathway(GO:2000586) negative regulation of platelet-derived growth factor receptor-beta signaling pathway(GO:2000587) |
| 0.0 | 0.3 | GO:0090160 | Golgi to lysosome transport(GO:0090160) |
| 0.0 | 0.4 | GO:0070307 | lens fiber cell development(GO:0070307) |
| 0.0 | 0.9 | GO:0043968 | histone H2A acetylation(GO:0043968) |
| 0.0 | 2.5 | GO:0006687 | glycosphingolipid metabolic process(GO:0006687) |
| 0.0 | 0.1 | GO:0071372 | cellular response to follicle-stimulating hormone stimulus(GO:0071372) |
| 0.0 | 0.2 | GO:2000304 | positive regulation of sphingolipid biosynthetic process(GO:0090154) positive regulation of ceramide biosynthetic process(GO:2000304) |
| 0.0 | 0.2 | GO:0031111 | negative regulation of microtubule polymerization or depolymerization(GO:0031111) |
| 0.0 | 0.2 | GO:0031119 | tRNA pseudouridine synthesis(GO:0031119) |
| 0.0 | 0.1 | GO:0090168 | Golgi reassembly(GO:0090168) |
| 0.0 | 0.2 | GO:0042997 | negative regulation of Golgi to plasma membrane protein transport(GO:0042997) |
| 0.0 | 0.1 | GO:0060623 | regulation of chromosome condensation(GO:0060623) |
| 0.0 | 0.2 | GO:0048752 | semicircular canal morphogenesis(GO:0048752) |
| 0.0 | 0.2 | GO:0060907 | positive regulation of macrophage cytokine production(GO:0060907) |
| 0.0 | 3.9 | GO:0006338 | chromatin remodeling(GO:0006338) |
| 0.0 | 0.1 | GO:0060244 | negative regulation of cell proliferation involved in contact inhibition(GO:0060244) |
| 0.0 | 0.2 | GO:0097646 | positive regulation of protein kinase A signaling(GO:0010739) calcitonin family receptor signaling pathway(GO:0097646) amylin receptor signaling pathway(GO:0097647) |
| 0.0 | 0.0 | GO:0070433 | negative regulation of nucleotide-binding oligomerization domain containing signaling pathway(GO:0070425) negative regulation of nucleotide-binding oligomerization domain containing 2 signaling pathway(GO:0070433) |
| 0.0 | 0.1 | GO:0071630 | nucleus-associated proteasomal ubiquitin-dependent protein catabolic process(GO:0071630) |
| 0.0 | 0.6 | GO:0000028 | ribosomal small subunit assembly(GO:0000028) |
| 0.0 | 0.1 | GO:0030805 | regulation of cyclic nucleotide catabolic process(GO:0030805) positive regulation of cyclic nucleotide catabolic process(GO:0030807) regulation of cAMP catabolic process(GO:0030820) positive regulation of cAMP catabolic process(GO:0030822) positive regulation of purine nucleotide catabolic process(GO:0033123) |
| 0.0 | 0.7 | GO:0045599 | negative regulation of fat cell differentiation(GO:0045599) |
| 0.0 | 0.1 | GO:0007181 | transforming growth factor beta receptor complex assembly(GO:0007181) |
| 0.0 | 0.2 | GO:0045008 | depyrimidination(GO:0045008) |
| 0.0 | 0.9 | GO:0035735 | intraciliary transport involved in cilium morphogenesis(GO:0035735) |
| 0.0 | 0.2 | GO:0002227 | innate immune response in mucosa(GO:0002227) |
| 0.0 | 0.3 | GO:0006703 | estrogen biosynthetic process(GO:0006703) |
| 0.0 | 0.2 | GO:0033689 | negative regulation of osteoblast proliferation(GO:0033689) |
| 0.0 | 0.4 | GO:0048535 | lymph node development(GO:0048535) |
| 0.0 | 0.3 | GO:0002467 | germinal center formation(GO:0002467) |
| 0.0 | 0.1 | GO:0002098 | tRNA wobble uridine modification(GO:0002098) |
| 0.0 | 0.4 | GO:0033540 | fatty acid beta-oxidation using acyl-CoA oxidase(GO:0033540) |
| 0.0 | 0.3 | GO:0042226 | interleukin-6 biosynthetic process(GO:0042226) |
| 0.0 | 0.1 | GO:0010918 | positive regulation of mitochondrial membrane potential(GO:0010918) |
| 0.0 | 0.1 | GO:0035063 | nuclear speck organization(GO:0035063) |
| 0.0 | 0.2 | GO:0001731 | formation of translation preinitiation complex(GO:0001731) |
| 0.0 | 0.2 | GO:0043306 | positive regulation of mast cell activation(GO:0033005) positive regulation of mast cell activation involved in immune response(GO:0033008) positive regulation of mast cell degranulation(GO:0043306) |
| 0.0 | 0.1 | GO:0006555 | methionine metabolic process(GO:0006555) |
| 0.0 | 0.1 | GO:1990569 | UDP-N-acetylglucosamine transport(GO:0015788) UDP-N-acetylglucosamine transmembrane transport(GO:1990569) |
| 0.0 | 0.4 | GO:0042136 | neurotransmitter biosynthetic process(GO:0042136) |
| 0.0 | 0.1 | GO:0035564 | regulation of kidney size(GO:0035564) regulation of pronephros size(GO:0035565) |
| 0.0 | 0.3 | GO:0006384 | transcription initiation from RNA polymerase III promoter(GO:0006384) |
| 0.0 | 0.1 | GO:0000973 | posttranscriptional tethering of RNA polymerase II gene DNA at nuclear periphery(GO:0000973) |
| 0.0 | 0.2 | GO:0000395 | mRNA 5'-splice site recognition(GO:0000395) |
| 0.0 | 0.7 | GO:0000188 | inactivation of MAPK activity(GO:0000188) |
| 0.0 | 0.1 | GO:0060084 | synaptic transmission involved in micturition(GO:0060084) |
| 0.0 | 0.4 | GO:0035162 | embryonic hemopoiesis(GO:0035162) |
| 0.0 | 0.1 | GO:0018197 | peptidyl-aspartic acid modification(GO:0018197) peptidyl-aspartic acid hydroxylation(GO:0042264) |
| 0.0 | 0.2 | GO:0008298 | intracellular mRNA localization(GO:0008298) |
| 0.0 | 0.5 | GO:0051084 | 'de novo' posttranslational protein folding(GO:0051084) |
| 0.0 | 0.3 | GO:0034315 | regulation of Arp2/3 complex-mediated actin nucleation(GO:0034315) |
| 0.0 | 0.2 | GO:0035608 | protein deglutamylation(GO:0035608) |
| 0.0 | 0.9 | GO:0010633 | negative regulation of epithelial cell migration(GO:0010633) |
| 0.0 | 0.2 | GO:0032534 | regulation of microvillus assembly(GO:0032534) |
| 0.0 | 0.3 | GO:1903054 | negative regulation of extracellular matrix organization(GO:1903054) |
| 0.0 | 0.1 | GO:0090267 | positive regulation of mitotic cell cycle spindle assembly checkpoint(GO:0090267) |
| 0.0 | 0.2 | GO:0018344 | protein geranylgeranylation(GO:0018344) |
| 0.0 | 0.1 | GO:0046598 | positive regulation of viral entry into host cell(GO:0046598) |
| 0.0 | 0.1 | GO:1903679 | regulation of cap-independent translational initiation(GO:1903677) positive regulation of cap-independent translational initiation(GO:1903679) regulation of cytoplasmic translational initiation(GO:1904688) positive regulation of cytoplasmic translational initiation(GO:1904690) |
| 0.0 | 0.1 | GO:0043553 | negative regulation of phosphatidylinositol 3-kinase activity(GO:0043553) |
| 0.0 | 0.1 | GO:0071422 | succinate transport(GO:0015744) succinate transmembrane transport(GO:0071422) |
| 0.0 | 0.4 | GO:0016024 | CDP-diacylglycerol biosynthetic process(GO:0016024) |
| 0.0 | 0.2 | GO:0033087 | negative regulation of immature T cell proliferation(GO:0033087) |
| 0.0 | 0.7 | GO:1903959 | regulation of anion transmembrane transport(GO:1903959) |
| 0.0 | 0.3 | GO:0071787 | endoplasmic reticulum tubular network assembly(GO:0071787) |
| 0.0 | 0.3 | GO:0015693 | magnesium ion transport(GO:0015693) |
| 0.0 | 4.2 | GO:0035023 | regulation of Rho protein signal transduction(GO:0035023) |
| 0.0 | 2.9 | GO:0002576 | platelet degranulation(GO:0002576) |
| 0.0 | 0.1 | GO:0015074 | DNA integration(GO:0015074) |
| 0.0 | 0.1 | GO:0065001 | specification of axis polarity(GO:0065001) |
| 0.0 | 1.1 | GO:0034260 | negative regulation of GTPase activity(GO:0034260) |
| 0.0 | 0.5 | GO:0048873 | homeostasis of number of cells within a tissue(GO:0048873) |
| 0.0 | 0.1 | GO:0097698 | base-excision repair, base-free sugar-phosphate removal(GO:0006286) telomere maintenance via base-excision repair(GO:0097698) |
| 0.0 | 0.2 | GO:0051988 | regulation of attachment of spindle microtubules to kinetochore(GO:0051988) |
| 0.0 | 0.2 | GO:0006824 | cobalt ion transport(GO:0006824) |
| 0.0 | 0.3 | GO:0034199 | activation of protein kinase A activity(GO:0034199) |
| 0.0 | 0.1 | GO:0042268 | regulation of cytolysis(GO:0042268) |
| 0.0 | 0.3 | GO:0071688 | striated muscle myosin thick filament assembly(GO:0071688) |
| 0.0 | 0.1 | GO:0007512 | adult heart development(GO:0007512) |
| 0.0 | 0.1 | GO:0070894 | transposon integration(GO:0070893) regulation of transposon integration(GO:0070894) negative regulation of transposon integration(GO:0070895) |
| 0.0 | 0.1 | GO:1900004 | negative regulation of serine-type endopeptidase activity(GO:1900004) negative regulation of serine-type peptidase activity(GO:1902572) |
| 0.0 | 0.1 | GO:2001140 | regulation of phospholipid transport(GO:2001138) positive regulation of phospholipid transport(GO:2001140) |
| 0.0 | 0.2 | GO:0030916 | otic vesicle formation(GO:0030916) |
| 0.0 | 0.2 | GO:0050713 | negative regulation of interleukin-1 beta secretion(GO:0050713) |
| 0.0 | 0.1 | GO:0015939 | pantothenate metabolic process(GO:0015939) |
| 0.0 | 0.1 | GO:1900864 | mitochondrial tRNA modification(GO:0070900) mitochondrial RNA modification(GO:1900864) |
| 0.0 | 0.1 | GO:0018057 | peptidyl-lysine oxidation(GO:0018057) negative regulation of T-helper 17 cell lineage commitment(GO:2000329) |
| 0.0 | 0.6 | GO:2000779 | regulation of double-strand break repair(GO:2000779) |
| 0.0 | 0.1 | GO:0050712 | negative regulation of interleukin-1 alpha production(GO:0032690) negative regulation of interleukin-1 alpha secretion(GO:0050712) |
| 0.0 | 0.6 | GO:0046473 | phosphatidic acid metabolic process(GO:0046473) |
| 0.0 | 0.4 | GO:0000060 | protein import into nucleus, translocation(GO:0000060) |
| 0.0 | 0.8 | GO:0071277 | cellular response to calcium ion(GO:0071277) |
| 0.0 | 0.1 | GO:2001241 | positive regulation of extrinsic apoptotic signaling pathway in absence of ligand(GO:2001241) |
| 0.0 | 0.1 | GO:0060992 | response to fungicide(GO:0060992) |
| 0.0 | 0.1 | GO:0061739 | protein lipidation involved in autophagosome assembly(GO:0061739) |
| 0.0 | 0.0 | GO:0031393 | negative regulation of prostaglandin biosynthetic process(GO:0031393) |
| 0.0 | 0.1 | GO:0035694 | mitochondrial protein catabolic process(GO:0035694) |
| 0.0 | 0.2 | GO:0031069 | hair follicle morphogenesis(GO:0031069) |
| 0.0 | 2.6 | GO:0031032 | actomyosin structure organization(GO:0031032) |
| 0.0 | 0.3 | GO:0071392 | cellular response to estradiol stimulus(GO:0071392) |
| 0.0 | 0.1 | GO:0030951 | establishment or maintenance of microtubule cytoskeleton polarity(GO:0030951) establishment or maintenance of cytoskeleton polarity(GO:0030952) |
| 0.0 | 0.1 | GO:0034627 | 'de novo' NAD biosynthetic process(GO:0034627) |
| 0.0 | 0.2 | GO:0030261 | chromosome condensation(GO:0030261) |
| 0.0 | 0.2 | GO:0006768 | biotin metabolic process(GO:0006768) |
| 0.0 | 0.0 | GO:0003095 | pressure natriuresis(GO:0003095) |
| 0.0 | 0.6 | GO:0007212 | dopamine receptor signaling pathway(GO:0007212) |
| 0.0 | 0.2 | GO:0001833 | inner cell mass cell proliferation(GO:0001833) |
| 0.0 | 0.1 | GO:0006268 | DNA unwinding involved in DNA replication(GO:0006268) |
| 0.0 | 0.3 | GO:0048662 | negative regulation of smooth muscle cell proliferation(GO:0048662) |
| 0.0 | 0.4 | GO:0048246 | macrophage chemotaxis(GO:0048246) |
| 0.0 | 0.1 | GO:0070681 | glutaminyl-tRNAGln biosynthesis via transamidation(GO:0070681) |
| 0.0 | 0.3 | GO:0006004 | fucose metabolic process(GO:0006004) |
| 0.0 | 2.1 | GO:0000184 | nuclear-transcribed mRNA catabolic process, nonsense-mediated decay(GO:0000184) |
| 0.0 | 0.1 | GO:0044130 | negative regulation of growth of symbiont in host(GO:0044130) negative regulation of growth of symbiont involved in interaction with host(GO:0044146) |
| 0.0 | 0.1 | GO:0001682 | tRNA 5'-leader removal(GO:0001682) |
| 0.0 | 0.2 | GO:0061635 | regulation of protein complex stability(GO:0061635) |
| 0.0 | 0.1 | GO:1901409 | positive regulation of phosphorylation of RNA polymerase II C-terminal domain(GO:1901409) |
| 0.0 | 0.1 | GO:2000483 | negative regulation of interleukin-8 secretion(GO:2000483) |
| 0.0 | 0.0 | GO:0048840 | otolith development(GO:0048840) |
| 0.0 | 0.1 | GO:0043651 | linoleic acid metabolic process(GO:0043651) |
| 0.0 | 0.3 | GO:0008608 | attachment of spindle microtubules to kinetochore(GO:0008608) |
| 0.0 | 0.4 | GO:0007035 | vacuolar acidification(GO:0007035) |
| 0.0 | 0.1 | GO:0045056 | transcytosis(GO:0045056) |
| 0.0 | 0.1 | GO:0001780 | neutrophil homeostasis(GO:0001780) |
| 0.0 | 0.0 | GO:0070966 | nuclear-transcribed mRNA catabolic process, no-go decay(GO:0070966) |
| 0.0 | 0.2 | GO:1901687 | glutathione derivative metabolic process(GO:1901685) glutathione derivative biosynthetic process(GO:1901687) |
| 0.0 | 0.3 | GO:0009065 | glutamine family amino acid catabolic process(GO:0009065) |
| 0.0 | 0.6 | GO:0006383 | transcription from RNA polymerase III promoter(GO:0006383) |
| 0.0 | 0.1 | GO:0046391 | 5-phosphoribose 1-diphosphate biosynthetic process(GO:0006015) 5-phosphoribose 1-diphosphate metabolic process(GO:0046391) |
| 0.0 | 0.1 | GO:2000811 | negative regulation of anoikis(GO:2000811) |
| 0.0 | 0.3 | GO:0031581 | hemidesmosome assembly(GO:0031581) |
| 0.0 | 0.0 | GO:0051902 | negative regulation of mitochondrial depolarization(GO:0051902) negative regulation of membrane depolarization(GO:1904180) |
| 0.0 | 0.1 | GO:0006307 | DNA dealkylation involved in DNA repair(GO:0006307) |
| 0.0 | 0.3 | GO:0007044 | cell-substrate junction assembly(GO:0007044) |
| 0.0 | 0.0 | GO:0071529 | cementum mineralization(GO:0071529) |
Gene overrepresentation in cellular component category:
| Log-likelihood per target | Total log-likelihood | Term | Description |
|---|---|---|---|
| 0.8 | 3.8 | GO:1990796 | photoreceptor cell terminal bouton(GO:1990796) |
| 0.8 | 3.0 | GO:0031933 | telomeric heterochromatin(GO:0031933) |
| 0.6 | 1.8 | GO:0005760 | gamma DNA polymerase complex(GO:0005760) |
| 0.4 | 9.3 | GO:0005952 | cAMP-dependent protein kinase complex(GO:0005952) |
| 0.4 | 3.7 | GO:0046696 | lipopolysaccharide receptor complex(GO:0046696) |
| 0.4 | 3.2 | GO:0000110 | nucleotide-excision repair factor 1 complex(GO:0000110) |
| 0.4 | 1.2 | GO:0070195 | growth hormone receptor complex(GO:0070195) |
| 0.4 | 1.5 | GO:0005899 | insulin receptor complex(GO:0005899) |
| 0.4 | 1.8 | GO:0048476 | Holliday junction resolvase complex(GO:0048476) |
| 0.3 | 1.7 | GO:0033263 | CORVET complex(GO:0033263) |
| 0.3 | 2.0 | GO:0031262 | Ndc80 complex(GO:0031262) |
| 0.3 | 0.9 | GO:1902636 | kinociliary basal body(GO:1902636) |
| 0.3 | 3.5 | GO:0016593 | Cdc73/Paf1 complex(GO:0016593) |
| 0.3 | 3.2 | GO:0070652 | HAUS complex(GO:0070652) |
| 0.3 | 1.4 | GO:0031905 | early endosome lumen(GO:0031905) |
| 0.3 | 1.1 | GO:0032144 | 4-aminobutyrate transaminase complex(GO:0032144) |
| 0.3 | 0.8 | GO:0000814 | ESCRT II complex(GO:0000814) |
| 0.3 | 2.5 | GO:0032389 | MutLalpha complex(GO:0032389) |
| 0.2 | 0.7 | GO:0097058 | CRLF-CLCF1 complex(GO:0097058) |
| 0.2 | 0.7 | GO:0097598 | sperm cytoplasmic droplet(GO:0097598) |
| 0.2 | 0.7 | GO:0033167 | ARC complex(GO:0033167) |
| 0.2 | 0.7 | GO:0072563 | endothelial microparticle(GO:0072563) |
| 0.2 | 9.2 | GO:0031092 | platelet alpha granule membrane(GO:0031092) |
| 0.2 | 1.1 | GO:0060200 | clathrin-sculpted acetylcholine transport vesicle(GO:0060200) clathrin-sculpted acetylcholine transport vesicle membrane(GO:0060201) |
| 0.2 | 0.9 | GO:0044307 | dendritic branch(GO:0044307) |
| 0.2 | 0.6 | GO:0034272 | phosphatidylinositol 3-kinase complex, class III, type I(GO:0034271) phosphatidylinositol 3-kinase complex, class III, type II(GO:0034272) |
| 0.2 | 1.5 | GO:0097165 | nuclear stress granule(GO:0097165) |
| 0.2 | 1.1 | GO:0045281 | mitochondrial respiratory chain complex II, succinate dehydrogenase complex (ubiquinone)(GO:0005749) succinate dehydrogenase complex (ubiquinone)(GO:0045257) respiratory chain complex II(GO:0045273) succinate dehydrogenase complex(GO:0045281) fumarate reductase complex(GO:0045283) |
| 0.2 | 1.2 | GO:0030485 | smooth muscle contractile fiber(GO:0030485) |
| 0.2 | 1.4 | GO:0005658 | alpha DNA polymerase:primase complex(GO:0005658) |
| 0.2 | 7.4 | GO:0071564 | npBAF complex(GO:0071564) |
| 0.2 | 0.8 | GO:0034365 | discoidal high-density lipoprotein particle(GO:0034365) |
| 0.2 | 3.0 | GO:0031209 | SCAR complex(GO:0031209) |
| 0.2 | 1.6 | GO:0005797 | Golgi medial cisterna(GO:0005797) |
| 0.2 | 1.2 | GO:0042765 | GPI-anchor transamidase complex(GO:0042765) |
| 0.2 | 2.1 | GO:0031465 | Cul4B-RING E3 ubiquitin ligase complex(GO:0031465) |
| 0.2 | 4.9 | GO:0044300 | cerebellar mossy fiber(GO:0044300) |
| 0.2 | 0.4 | GO:0055087 | Ski complex(GO:0055087) |
| 0.2 | 1.1 | GO:0005828 | kinetochore microtubule(GO:0005828) |
| 0.2 | 1.2 | GO:0000408 | EKC/KEOPS complex(GO:0000408) |
| 0.2 | 0.8 | GO:0032044 | DSIF complex(GO:0032044) |
| 0.2 | 0.8 | GO:0008275 | gamma-tubulin small complex(GO:0008275) |
| 0.2 | 1.3 | GO:0005663 | DNA replication factor C complex(GO:0005663) |
| 0.2 | 0.5 | GO:1990723 | cytoplasmic periphery of the nuclear pore complex(GO:1990723) |
| 0.2 | 1.7 | GO:0097470 | ribbon synapse(GO:0097470) |
| 0.1 | 2.8 | GO:0005641 | nuclear envelope lumen(GO:0005641) |
| 0.1 | 2.6 | GO:0034992 | microtubule organizing center attachment site(GO:0034992) LINC complex(GO:0034993) |
| 0.1 | 0.6 | GO:0071821 | FANCM-MHF complex(GO:0071821) |
| 0.1 | 0.6 | GO:0042720 | mitochondrial inner membrane peptidase complex(GO:0042720) |
| 0.1 | 1.0 | GO:0030121 | AP-1 adaptor complex(GO:0030121) |
| 0.1 | 0.8 | GO:0002079 | inner acrosomal membrane(GO:0002079) |
| 0.1 | 0.4 | GO:0071148 | TEAD-1-YAP complex(GO:0071148) |
| 0.1 | 1.4 | GO:0005742 | mitochondrial outer membrane translocase complex(GO:0005742) |
| 0.1 | 2.3 | GO:0008091 | spectrin(GO:0008091) |
| 0.1 | 3.1 | GO:0031362 | anchored component of external side of plasma membrane(GO:0031362) |
| 0.1 | 2.7 | GO:0032591 | dendritic spine membrane(GO:0032591) |
| 0.1 | 0.6 | GO:0034991 | nuclear meiotic cohesin complex(GO:0034991) |
| 0.1 | 0.4 | GO:0097543 | ciliary inversin compartment(GO:0097543) |
| 0.1 | 1.0 | GO:0031464 | Cul4A-RING E3 ubiquitin ligase complex(GO:0031464) |
| 0.1 | 0.4 | GO:0005683 | U7 snRNP(GO:0005683) |
| 0.1 | 0.1 | GO:0005712 | chiasma(GO:0005712) |
| 0.1 | 0.5 | GO:1990879 | CST complex(GO:1990879) |
| 0.1 | 0.2 | GO:0070939 | Dsl1p complex(GO:0070939) |
| 0.1 | 7.6 | GO:0031907 | peroxisomal matrix(GO:0005782) microbody lumen(GO:0031907) |
| 0.1 | 1.0 | GO:0071953 | elastic fiber(GO:0071953) |
| 0.1 | 7.0 | GO:0099738 | cell cortex region(GO:0099738) |
| 0.1 | 0.4 | GO:0098592 | cytoplasmic side of apical plasma membrane(GO:0098592) |
| 0.1 | 1.6 | GO:0071203 | WASH complex(GO:0071203) |
| 0.1 | 1.9 | GO:0032426 | stereocilium tip(GO:0032426) |
| 0.1 | 1.3 | GO:0005688 | U6 snRNP(GO:0005688) |
| 0.1 | 0.3 | GO:0030678 | mitochondrial ribonuclease P complex(GO:0030678) |
| 0.1 | 0.3 | GO:0036029 | protein C inhibitor-TMPRSS7 complex(GO:0036024) protein C inhibitor-TMPRSS11E complex(GO:0036025) protein C inhibitor-PLAT complex(GO:0036026) protein C inhibitor-PLAU complex(GO:0036027) protein C inhibitor-thrombin complex(GO:0036028) protein C inhibitor-KLK3 complex(GO:0036029) protein C inhibitor-plasma kallikrein complex(GO:0036030) serine protease inhibitor complex(GO:0097180) protein C inhibitor-coagulation factor V complex(GO:0097181) protein C inhibitor-coagulation factor Xa complex(GO:0097182) protein C inhibitor-coagulation factor XI complex(GO:0097183) |
| 0.1 | 0.4 | GO:0005968 | Rab-protein geranylgeranyltransferase complex(GO:0005968) |
| 0.1 | 1.9 | GO:0042613 | MHC class II protein complex(GO:0042613) |
| 0.1 | 1.8 | GO:0016281 | eukaryotic translation initiation factor 4F complex(GO:0016281) |
| 0.1 | 0.6 | GO:1990357 | terminal web(GO:1990357) |
| 0.1 | 0.5 | GO:0032301 | MutSalpha complex(GO:0032301) |
| 0.1 | 0.3 | GO:0000229 | cytoplasmic chromosome(GO:0000229) |
| 0.1 | 0.4 | GO:0017109 | glutamate-cysteine ligase complex(GO:0017109) |
| 0.1 | 0.7 | GO:0043541 | UDP-N-acetylglucosamine transferase complex(GO:0043541) |
| 0.1 | 0.5 | GO:0032807 | DNA ligase IV complex(GO:0032807) |
| 0.1 | 1.0 | GO:0042105 | alpha-beta T cell receptor complex(GO:0042105) |
| 0.1 | 1.3 | GO:0034464 | BBSome(GO:0034464) |
| 0.1 | 0.5 | GO:0030906 | retromer, cargo-selective complex(GO:0030906) |
| 0.1 | 0.6 | GO:0044214 | spanning component of plasma membrane(GO:0044214) spanning component of membrane(GO:0089717) |
| 0.1 | 0.5 | GO:0000172 | ribonuclease MRP complex(GO:0000172) |
| 0.1 | 0.3 | GO:1990667 | PCSK9-AnxA2 complex(GO:1990667) |
| 0.1 | 0.2 | GO:1990590 | ATF1-ATF4 transcription factor complex(GO:1990590) |
| 0.1 | 1.3 | GO:0097433 | dense body(GO:0097433) |
| 0.1 | 0.3 | GO:0071920 | cleavage body(GO:0071920) |
| 0.1 | 0.3 | GO:0097362 | MCM8-MCM9 complex(GO:0097362) |
| 0.1 | 0.2 | GO:0032302 | MutSbeta complex(GO:0032302) |
| 0.1 | 3.7 | GO:0005720 | nuclear heterochromatin(GO:0005720) |
| 0.1 | 0.5 | GO:0071547 | piP-body(GO:0071547) |
| 0.1 | 0.5 | GO:0000214 | tRNA-intron endonuclease complex(GO:0000214) |
| 0.1 | 1.5 | GO:0032045 | guanyl-nucleotide exchange factor complex(GO:0032045) |
| 0.1 | 0.5 | GO:0036021 | endolysosome lumen(GO:0036021) |
| 0.1 | 1.4 | GO:0031089 | platelet dense granule lumen(GO:0031089) |
| 0.1 | 0.8 | GO:0005853 | eukaryotic translation elongation factor 1 complex(GO:0005853) |
| 0.1 | 0.6 | GO:0030896 | checkpoint clamp complex(GO:0030896) |
| 0.1 | 0.4 | GO:0097013 | phagocytic vesicle lumen(GO:0097013) |
| 0.1 | 0.2 | GO:0034677 | integrin alpha7-beta1 complex(GO:0034677) integrin alpha8-beta1 complex(GO:0034678) |
| 0.1 | 4.7 | GO:0030964 | mitochondrial respiratory chain complex I(GO:0005747) NADH dehydrogenase complex(GO:0030964) respiratory chain complex I(GO:0045271) |
| 0.1 | 4.3 | GO:0031430 | M band(GO:0031430) |
| 0.1 | 1.1 | GO:0000813 | ESCRT I complex(GO:0000813) |
| 0.1 | 1.8 | GO:0031307 | integral component of mitochondrial outer membrane(GO:0031307) |
| 0.1 | 0.5 | GO:0032777 | Piccolo NuA4 histone acetyltransferase complex(GO:0032777) |
| 0.1 | 6.0 | GO:0031463 | Cul3-RING ubiquitin ligase complex(GO:0031463) |
| 0.1 | 1.5 | GO:0032590 | dendrite membrane(GO:0032590) |
| 0.1 | 0.3 | GO:0070876 | SOSS complex(GO:0070876) |
| 0.1 | 1.2 | GO:0005662 | DNA replication factor A complex(GO:0005662) |
| 0.1 | 0.8 | GO:0033588 | Elongator holoenzyme complex(GO:0033588) |
| 0.1 | 1.8 | GO:0030992 | intraciliary transport particle B(GO:0030992) |
| 0.1 | 0.9 | GO:0045240 | dihydrolipoyl dehydrogenase complex(GO:0045240) |
| 0.1 | 0.2 | GO:0001939 | female pronucleus(GO:0001939) |
| 0.1 | 0.4 | GO:0070847 | core mediator complex(GO:0070847) |
| 0.1 | 0.6 | GO:0097504 | Gemini of coiled bodies(GO:0097504) |
| 0.1 | 0.8 | GO:0005916 | fascia adherens(GO:0005916) |
| 0.1 | 0.2 | GO:0070931 | Golgi-associated vesicle lumen(GO:0070931) |
| 0.1 | 1.5 | GO:0000145 | exocyst(GO:0000145) |
| 0.1 | 0.2 | GO:0098647 | collagen type VI trimer(GO:0005589) collagen beaded filament(GO:0098647) |
| 0.1 | 0.8 | GO:0045275 | mitochondrial respiratory chain complex III(GO:0005750) respiratory chain complex III(GO:0045275) |
| 0.1 | 0.6 | GO:0032593 | insulin-responsive compartment(GO:0032593) |
| 0.1 | 0.4 | GO:0000796 | condensin complex(GO:0000796) |
| 0.1 | 0.6 | GO:0001673 | male germ cell nucleus(GO:0001673) |
| 0.1 | 0.5 | GO:0017119 | Golgi transport complex(GO:0017119) |
| 0.1 | 0.3 | GO:0000221 | vacuolar proton-transporting V-type ATPase, V1 domain(GO:0000221) |
| 0.1 | 0.7 | GO:0030990 | intraciliary transport particle(GO:0030990) |
| 0.0 | 2.2 | GO:0005605 | basal lamina(GO:0005605) |
| 0.0 | 1.3 | GO:0035327 | transcriptionally active chromatin(GO:0035327) |
| 0.0 | 11.0 | GO:0030018 | Z disc(GO:0030018) |
| 0.0 | 0.5 | GO:0031233 | intrinsic component of external side of plasma membrane(GO:0031233) |
| 0.0 | 0.2 | GO:0005602 | complement component C1 complex(GO:0005602) |
| 0.0 | 0.1 | GO:0035370 | UBC13-UEV1A complex(GO:0035370) |
| 0.0 | 0.2 | GO:0031838 | haptoglobin-hemoglobin complex(GO:0031838) |
| 0.0 | 1.5 | GO:0005682 | U5 snRNP(GO:0005682) |
| 0.0 | 0.9 | GO:0005689 | U12-type spliceosomal complex(GO:0005689) |
| 0.0 | 2.2 | GO:0008023 | transcription elongation factor complex(GO:0008023) |
| 0.0 | 0.3 | GO:0014731 | spectrin-associated cytoskeleton(GO:0014731) |
| 0.0 | 4.9 | GO:0071013 | catalytic step 2 spliceosome(GO:0071013) |
| 0.0 | 0.8 | GO:0043220 | Schmidt-Lanterman incisure(GO:0043220) |
| 0.0 | 0.6 | GO:0072546 | ER membrane protein complex(GO:0072546) |
| 0.0 | 0.2 | GO:0033553 | rDNA heterochromatin(GO:0033553) |
| 0.0 | 1.1 | GO:0005666 | DNA-directed RNA polymerase III complex(GO:0005666) |
| 0.0 | 0.3 | GO:0071986 | Ragulator complex(GO:0071986) |
| 0.0 | 1.4 | GO:0016581 | NuRD complex(GO:0016581) CHD-type complex(GO:0090545) |
| 0.0 | 0.9 | GO:0005671 | Ada2/Gcn5/Ada3 transcription activator complex(GO:0005671) |
| 0.0 | 0.4 | GO:0032009 | early phagosome(GO:0032009) |
| 0.0 | 0.3 | GO:0005672 | transcription factor TFIIA complex(GO:0005672) |
| 0.0 | 0.3 | GO:0016514 | SWI/SNF complex(GO:0016514) |
| 0.0 | 0.9 | GO:0030057 | desmosome(GO:0030057) |
| 0.0 | 0.5 | GO:0034663 | endoplasmic reticulum chaperone complex(GO:0034663) |
| 0.0 | 0.4 | GO:0000347 | THO complex(GO:0000347) THO complex part of transcription export complex(GO:0000445) |
| 0.0 | 0.1 | GO:0044609 | DBIRD complex(GO:0044609) |
| 0.0 | 7.8 | GO:0030427 | site of polarized growth(GO:0030427) |
| 0.0 | 0.8 | GO:0031932 | TORC2 complex(GO:0031932) |
| 0.0 | 0.3 | GO:0030056 | hemidesmosome(GO:0030056) |
| 0.0 | 0.5 | GO:0043020 | NADPH oxidase complex(GO:0043020) |
| 0.0 | 1.0 | GO:0070469 | respiratory chain(GO:0070469) |
| 0.0 | 0.5 | GO:0031588 | nucleotide-activated protein kinase complex(GO:0031588) |
| 0.0 | 0.5 | GO:0008074 | guanylate cyclase complex, soluble(GO:0008074) |
| 0.0 | 0.4 | GO:0016602 | CCAAT-binding factor complex(GO:0016602) |
| 0.0 | 0.2 | GO:0070554 | synaptobrevin 2-SNAP-25-syntaxin-3-complexin complex(GO:0070554) |
| 0.0 | 4.0 | GO:0005814 | centriole(GO:0005814) |
| 0.0 | 0.4 | GO:0071004 | U2-type prespliceosome(GO:0071004) |
| 0.0 | 0.2 | GO:0098536 | deuterosome(GO:0098536) |
| 0.0 | 0.3 | GO:0061574 | ASAP complex(GO:0061574) |
| 0.0 | 0.2 | GO:0071011 | precatalytic spliceosome(GO:0071011) |
| 0.0 | 0.7 | GO:1902555 | endoribonuclease complex(GO:1902555) |
| 0.0 | 4.7 | GO:0005795 | Golgi stack(GO:0005795) |
| 0.0 | 0.9 | GO:0005763 | organellar small ribosomal subunit(GO:0000314) mitochondrial small ribosomal subunit(GO:0005763) |
| 0.0 | 0.4 | GO:0031674 | I band(GO:0031674) |
| 0.0 | 2.4 | GO:0031093 | platelet alpha granule lumen(GO:0031093) |
| 0.0 | 1.6 | GO:0022627 | cytosolic small ribosomal subunit(GO:0022627) |
| 0.0 | 1.2 | GO:0042571 | immunoglobulin complex, circulating(GO:0042571) |
| 0.0 | 4.0 | GO:0090575 | RNA polymerase II transcription factor complex(GO:0090575) |
| 0.0 | 0.1 | GO:0045298 | tubulin complex(GO:0045298) |
| 0.0 | 0.7 | GO:0042629 | mast cell granule(GO:0042629) |
| 0.0 | 0.5 | GO:0031265 | CD95 death-inducing signaling complex(GO:0031265) |
| 0.0 | 0.1 | GO:0005638 | lamin filament(GO:0005638) |
| 0.0 | 0.4 | GO:0035098 | ESC/E(Z) complex(GO:0035098) |
| 0.0 | 1.6 | GO:0032432 | actin filament bundle(GO:0032432) |
| 0.0 | 0.1 | GO:1990246 | uniplex complex(GO:1990246) |
| 0.0 | 0.2 | GO:0042406 | extrinsic component of endoplasmic reticulum membrane(GO:0042406) |
| 0.0 | 0.4 | GO:0033177 | proton-transporting two-sector ATPase complex, proton-transporting domain(GO:0033177) |
| 0.0 | 0.3 | GO:0000506 | glycosylphosphatidylinositol-N-acetylglucosaminyltransferase (GPI-GnT) complex(GO:0000506) |
| 0.0 | 0.2 | GO:0044352 | pinosome(GO:0044352) macropinosome(GO:0044354) |
| 0.0 | 2.0 | GO:0016459 | myosin complex(GO:0016459) |
| 0.0 | 0.2 | GO:0045254 | pyruvate dehydrogenase complex(GO:0045254) |
| 0.0 | 1.1 | GO:0001917 | photoreceptor inner segment(GO:0001917) |
| 0.0 | 0.6 | GO:0001891 | phagocytic cup(GO:0001891) |
| 0.0 | 0.2 | GO:0031941 | filamentous actin(GO:0031941) |
| 0.0 | 0.1 | GO:0072357 | PTW/PP1 phosphatase complex(GO:0072357) |
| 0.0 | 1.0 | GO:0035097 | histone methyltransferase complex(GO:0035097) |
| 0.0 | 0.7 | GO:0035861 | site of double-strand break(GO:0035861) |
| 0.0 | 1.9 | GO:0022625 | cytosolic large ribosomal subunit(GO:0022625) |
| 0.0 | 0.5 | GO:0030014 | CCR4-NOT complex(GO:0030014) |
| 0.0 | 0.0 | GO:0000835 | ER ubiquitin ligase complex(GO:0000835) Hrd1p ubiquitin ligase complex(GO:0000836) |
| 0.0 | 0.1 | GO:0034274 | Atg12-Atg5-Atg16 complex(GO:0034274) |
| 0.0 | 0.1 | GO:0002177 | manchette(GO:0002177) |
| 0.0 | 0.3 | GO:0005847 | mRNA cleavage and polyadenylation specificity factor complex(GO:0005847) |
| 0.0 | 0.4 | GO:0043034 | costamere(GO:0043034) |
| 0.0 | 7.5 | GO:0016607 | nuclear speck(GO:0016607) |
| 0.0 | 0.1 | GO:0070419 | nonhomologous end joining complex(GO:0070419) |
| 0.0 | 0.1 | GO:0042788 | polysomal ribosome(GO:0042788) |
| 0.0 | 0.1 | GO:0030914 | STAGA complex(GO:0030914) |
| 0.0 | 0.2 | GO:0032391 | photoreceptor connecting cilium(GO:0032391) |
| 0.0 | 0.2 | GO:0036513 | Derlin-1 retrotranslocation complex(GO:0036513) |
| 0.0 | 0.2 | GO:0035267 | NuA4 histone acetyltransferase complex(GO:0035267) H4/H2A histone acetyltransferase complex(GO:0043189) H4 histone acetyltransferase complex(GO:1902562) |
| 0.0 | 0.2 | GO:0008541 | proteasome regulatory particle, lid subcomplex(GO:0008541) |
| 0.0 | 0.1 | GO:0005869 | dynactin complex(GO:0005869) |
| 0.0 | 2.0 | GO:0043202 | lysosomal lumen(GO:0043202) |
| 0.0 | 2.3 | GO:0031901 | early endosome membrane(GO:0031901) |
| 0.0 | 0.2 | GO:0031906 | late endosome lumen(GO:0031906) |
| 0.0 | 2.6 | GO:0031225 | anchored component of membrane(GO:0031225) |
| 0.0 | 0.0 | GO:0097679 | other organism cytoplasm(GO:0097679) |
| 0.0 | 0.2 | GO:0000940 | condensed chromosome outer kinetochore(GO:0000940) |
| 0.0 | 0.1 | GO:0098554 | cytoplasmic side of endoplasmic reticulum membrane(GO:0098554) |
| 0.0 | 0.1 | GO:0030956 | glutamyl-tRNA(Gln) amidotransferase complex(GO:0030956) |
| 0.0 | 0.2 | GO:0046581 | intercellular canaliculus(GO:0046581) |
| 0.0 | 0.2 | GO:0097524 | sperm plasma membrane(GO:0097524) |
| 0.0 | 0.5 | GO:0000123 | histone acetyltransferase complex(GO:0000123) |
| 0.0 | 1.7 | GO:0072562 | blood microparticle(GO:0072562) |
| 0.0 | 0.2 | GO:0097381 | photoreceptor disc membrane(GO:0097381) |
| 0.0 | 0.1 | GO:0000786 | nucleosome(GO:0000786) |
| 0.0 | 0.1 | GO:0033018 | sarcoplasmic reticulum lumen(GO:0033018) |
| 0.0 | 0.1 | GO:0042555 | MCM complex(GO:0042555) |
| 0.0 | 0.3 | GO:0001527 | microfibril(GO:0001527) fibril(GO:0043205) |
| 0.0 | 1.0 | GO:0005796 | Golgi lumen(GO:0005796) |
| 0.0 | 6.8 | GO:0005759 | mitochondrial matrix(GO:0005759) |
| 0.0 | 0.2 | GO:0031528 | microvillus membrane(GO:0031528) |
| 0.0 | 0.0 | GO:0070937 | CRD-mediated mRNA stability complex(GO:0070937) |
| 0.0 | 0.0 | GO:0070765 | gamma-secretase complex(GO:0070765) |
| 0.0 | 0.4 | GO:0016592 | mediator complex(GO:0016592) |
| 0.0 | 0.6 | GO:0032154 | cleavage furrow(GO:0032154) cell surface furrow(GO:0097610) |
| 0.0 | 0.4 | GO:0016591 | DNA-directed RNA polymerase II, holoenzyme(GO:0016591) |
| 0.0 | 0.0 | GO:0005953 | CAAX-protein geranylgeranyltransferase complex(GO:0005953) |
| 0.0 | 0.2 | GO:0030008 | TRAPP complex(GO:0030008) |
| 0.0 | 0.1 | GO:0032541 | cortical endoplasmic reticulum(GO:0032541) |
Gene overrepresentation in molecular function category:
| Log-likelihood per target | Total log-likelihood | Term | Description |
|---|---|---|---|
| 1.5 | 4.4 | GO:0003829 | beta-1,3-galactosyl-O-glycosyl-glycoprotein beta-1,6-N-acetylglucosaminyltransferase activity(GO:0003829) |
| 1.0 | 3.0 | GO:0015616 | DNA translocase activity(GO:0015616) |
| 0.9 | 3.8 | GO:0004948 | calcitonin receptor activity(GO:0004948) |
| 0.9 | 5.6 | GO:0060961 | phospholipase D inhibitor activity(GO:0060961) |
| 0.8 | 2.3 | GO:0033858 | N-acetylgalactosamine kinase activity(GO:0033858) |
| 0.7 | 3.5 | GO:0080019 | fatty-acyl-CoA reductase (alcohol-forming) activity(GO:0080019) |
| 0.6 | 1.9 | GO:0019959 | interleukin-8 binding(GO:0019959) |
| 0.6 | 2.9 | GO:1903135 | cupric ion binding(GO:1903135) |
| 0.6 | 1.7 | GO:0033754 | indoleamine 2,3-dioxygenase activity(GO:0033754) |
| 0.6 | 1.7 | GO:0045550 | geranylgeranyl reductase activity(GO:0045550) delta4-3-oxosteroid 5beta-reductase activity(GO:0047787) |
| 0.6 | 1.7 | GO:0016979 | lipoate-protein ligase activity(GO:0016979) |
| 0.5 | 8.7 | GO:0004691 | cAMP-dependent protein kinase activity(GO:0004691) |
| 0.5 | 2.8 | GO:0048101 | calcium- and calmodulin-regulated 3',5'-cyclic-GMP phosphodiesterase activity(GO:0048101) |
| 0.5 | 2.3 | GO:0003896 | DNA primase activity(GO:0003896) |
| 0.4 | 6.9 | GO:0031821 | G-protein coupled serotonin receptor binding(GO:0031821) |
| 0.4 | 12.7 | GO:0008093 | cytoskeletal adaptor activity(GO:0008093) |
| 0.4 | 1.6 | GO:0072320 | volume-sensitive chloride channel activity(GO:0072320) |
| 0.4 | 1.5 | GO:0004583 | dolichyl-phosphate-glucose-glycolipid alpha-glucosyltransferase activity(GO:0004583) |
| 0.4 | 1.5 | GO:0003883 | CTP synthase activity(GO:0003883) |
| 0.4 | 1.8 | GO:0016890 | site-specific endodeoxyribonuclease activity, specific for altered base(GO:0016890) |
| 0.4 | 1.1 | GO:0046921 | glycoprotein 6-alpha-L-fucosyltransferase activity(GO:0008424) alpha-(1->6)-fucosyltransferase activity(GO:0046921) |
| 0.4 | 1.1 | GO:0044594 | 3alpha,7alpha,12alpha-trihydroxy-5beta-cholest-24-enoyl-CoA hydratase activity(GO:0033989) 17-beta-hydroxysteroid dehydrogenase (NAD+) activity(GO:0044594) |
| 0.3 | 1.7 | GO:0047273 | galactosylgalactosylglucosylceramide beta-D-acetylgalactosaminyltransferase activity(GO:0047273) |
| 0.3 | 1.0 | GO:0005477 | pyruvate secondary active transmembrane transporter activity(GO:0005477) |
| 0.3 | 2.0 | GO:0038062 | protein tyrosine kinase collagen receptor activity(GO:0038062) |
| 0.3 | 1.2 | GO:0047192 | 1-alkylglycerophosphocholine O-acetyltransferase activity(GO:0047192) |
| 0.3 | 0.9 | GO:0070538 | oleic acid binding(GO:0070538) |
| 0.3 | 1.5 | GO:0008240 | tripeptidyl-peptidase activity(GO:0008240) |
| 0.3 | 3.3 | GO:0015232 | heme transporter activity(GO:0015232) |
| 0.3 | 1.8 | GO:0052851 | cupric reductase activity(GO:0008823) ferric-chelate reductase (NADPH) activity(GO:0052851) |
| 0.3 | 1.2 | GO:0070404 | NADH binding(GO:0070404) |
| 0.3 | 1.2 | GO:0008798 | beta-aspartyl-peptidase activity(GO:0008798) |
| 0.3 | 1.1 | GO:0003867 | 4-aminobutyrate transaminase activity(GO:0003867) succinate-semialdehyde dehydrogenase binding(GO:0032145) (S)-3-amino-2-methylpropionate transaminase activity(GO:0047298) |
| 0.3 | 1.4 | GO:0052655 | branched-chain-amino-acid transaminase activity(GO:0004084) L-leucine transaminase activity(GO:0052654) L-valine transaminase activity(GO:0052655) L-isoleucine transaminase activity(GO:0052656) |
| 0.3 | 1.7 | GO:0047894 | flavonol 3-sulfotransferase activity(GO:0047894) |
| 0.3 | 1.1 | GO:0008177 | succinate dehydrogenase (ubiquinone) activity(GO:0008177) |
| 0.3 | 1.0 | GO:0003943 | N-acetylgalactosamine-4-sulfatase activity(GO:0003943) |
| 0.3 | 2.6 | GO:0034235 | GPI anchor binding(GO:0034235) |
| 0.3 | 0.8 | GO:0003858 | 3-hydroxybutyrate dehydrogenase activity(GO:0003858) |
| 0.3 | 0.8 | GO:0017129 | triglyceride binding(GO:0017129) |
| 0.3 | 1.0 | GO:0005169 | neurotrophin TRKB receptor binding(GO:0005169) |
| 0.3 | 0.8 | GO:0051990 | isocitrate dehydrogenase (NADP+) activity(GO:0004450) (R)-2-hydroxyglutarate dehydrogenase activity(GO:0051990) |
| 0.3 | 2.5 | GO:0004321 | fatty-acyl-CoA synthase activity(GO:0004321) |
| 0.2 | 3.9 | GO:0050544 | icosatetraenoic acid binding(GO:0050543) arachidonic acid binding(GO:0050544) |
| 0.2 | 0.7 | GO:0052798 | beta-galactoside alpha-2,3-sialyltransferase activity(GO:0052798) |
| 0.2 | 0.7 | GO:0008746 | NAD(P)+ transhydrogenase activity(GO:0008746) oxidoreductase activity, acting on NAD(P)H, NAD(P) as acceptor(GO:0016652) |
| 0.2 | 1.4 | GO:0004525 | ribonuclease III activity(GO:0004525) double-stranded RNA-specific ribonuclease activity(GO:0032296) |
| 0.2 | 0.7 | GO:0004531 | deoxyribonuclease II activity(GO:0004531) |
| 0.2 | 0.9 | GO:0033265 | acetylcholinesterase activity(GO:0003990) choline binding(GO:0033265) |
| 0.2 | 2.3 | GO:0071253 | connexin binding(GO:0071253) |
| 0.2 | 0.2 | GO:0047718 | indanol dehydrogenase activity(GO:0047718) |
| 0.2 | 0.7 | GO:0008441 | 3'(2'),5'-bisphosphate nucleotidase activity(GO:0008441) |
| 0.2 | 0.7 | GO:0051717 | inositol-1,3,4,5-tetrakisphosphate 3-phosphatase activity(GO:0051717) |
| 0.2 | 3.7 | GO:0005132 | type I interferon receptor binding(GO:0005132) |
| 0.2 | 2.2 | GO:0034481 | chondroitin sulfotransferase activity(GO:0034481) |
| 0.2 | 0.6 | GO:0051377 | mannose-ethanolamine phosphotransferase activity(GO:0051377) |
| 0.2 | 1.7 | GO:0008269 | JAK pathway signal transduction adaptor activity(GO:0008269) |
| 0.2 | 0.6 | GO:0004483 | mRNA (nucleoside-2'-O-)-methyltransferase activity(GO:0004483) |
| 0.2 | 0.6 | GO:0070052 | collagen V binding(GO:0070052) |
| 0.2 | 0.8 | GO:0004852 | uroporphyrinogen-III synthase activity(GO:0004852) |
| 0.2 | 0.8 | GO:0004773 | steryl-sulfatase activity(GO:0004773) |
| 0.2 | 1.2 | GO:0004310 | farnesyl-diphosphate farnesyltransferase activity(GO:0004310) squalene synthase activity(GO:0051996) |
| 0.2 | 1.2 | GO:0004427 | inorganic diphosphatase activity(GO:0004427) |
| 0.2 | 0.6 | GO:0004577 | N-acetylglucosaminyldiphosphodolichol N-acetylglucosaminyltransferase activity(GO:0004577) |
| 0.2 | 0.8 | GO:0070326 | very-low-density lipoprotein particle receptor binding(GO:0070326) |
| 0.2 | 0.6 | GO:0000386 | second spliceosomal transesterification activity(GO:0000386) |
| 0.2 | 3.8 | GO:0003680 | AT DNA binding(GO:0003680) |
| 0.2 | 4.4 | GO:0043422 | protein kinase B binding(GO:0043422) |
| 0.2 | 1.6 | GO:0070892 | lipoteichoic acid receptor activity(GO:0070892) |
| 0.2 | 1.3 | GO:0030267 | hydroxypyruvate reductase activity(GO:0016618) glyoxylate reductase (NADP) activity(GO:0030267) |
| 0.2 | 1.1 | GO:0030348 | syntaxin-3 binding(GO:0030348) |
| 0.2 | 6.4 | GO:0017075 | syntaxin-1 binding(GO:0017075) |
| 0.2 | 1.5 | GO:0015235 | cobalamin transporter activity(GO:0015235) |
| 0.2 | 1.1 | GO:0016019 | peptidoglycan receptor activity(GO:0016019) |
| 0.2 | 0.7 | GO:0047391 | alkylglycerophosphoethanolamine phosphodiesterase activity(GO:0047391) |
| 0.2 | 2.0 | GO:0042731 | PH domain binding(GO:0042731) |
| 0.2 | 1.8 | GO:0008821 | crossover junction endodeoxyribonuclease activity(GO:0008821) |
| 0.2 | 0.7 | GO:0008506 | sucrose:proton symporter activity(GO:0008506) sucrose transmembrane transporter activity(GO:0008515) disaccharide transmembrane transporter activity(GO:0015154) oligosaccharide transmembrane transporter activity(GO:0015157) |
| 0.2 | 0.5 | GO:0090555 | phosphatidylethanolamine-translocating ATPase activity(GO:0090555) |
| 0.2 | 0.7 | GO:0035671 | enone reductase activity(GO:0035671) |
| 0.2 | 3.1 | GO:0030169 | low-density lipoprotein particle binding(GO:0030169) |
| 0.2 | 1.0 | GO:0047237 | glucuronylgalactosylproteoglycan 4-beta-N-acetylgalactosaminyltransferase activity(GO:0047237) glucuronosyl-N-acetylgalactosaminyl-proteoglycan 4-beta-N-acetylgalactosaminyltransferase activity(GO:0047238) |
| 0.2 | 0.3 | GO:0016508 | long-chain-enoyl-CoA hydratase activity(GO:0016508) |
| 0.2 | 0.7 | GO:0005534 | galactose binding(GO:0005534) |
| 0.2 | 1.2 | GO:0004137 | deoxycytidine kinase activity(GO:0004137) thymidine kinase activity(GO:0004797) |
| 0.2 | 1.8 | GO:0032027 | myosin light chain binding(GO:0032027) |
| 0.2 | 3.2 | GO:0043024 | ribosomal small subunit binding(GO:0043024) |
| 0.2 | 0.5 | GO:0044715 | 8-oxo-dGDP phosphatase activity(GO:0044715) |
| 0.2 | 0.5 | GO:0004639 | phosphoribosylaminoimidazole carboxylase activity(GO:0004638) phosphoribosylaminoimidazolesuccinocarboxamide synthase activity(GO:0004639) |
| 0.2 | 1.1 | GO:0102345 | 3-hydroxy-behenoyl-CoA dehydratase activity(GO:0102344) 3-hydroxy-lignoceroyl-CoA dehydratase activity(GO:0102345) |
| 0.2 | 3.3 | GO:0008252 | nucleotidase activity(GO:0008252) 5'-nucleotidase activity(GO:0008253) |
| 0.2 | 1.4 | GO:0019788 | NEDD8 transferase activity(GO:0019788) |
| 0.2 | 2.1 | GO:0008381 | mechanically-gated ion channel activity(GO:0008381) mechanically gated channel activity(GO:0022833) |
| 0.1 | 0.4 | GO:0052856 | NADHX epimerase activity(GO:0052856) NADPHX epimerase activity(GO:0052857) |
| 0.1 | 0.9 | GO:0097199 | cysteine-type endopeptidase activity involved in apoptotic signaling pathway(GO:0097199) |
| 0.1 | 0.6 | GO:0042132 | fructose 1,6-bisphosphate 1-phosphatase activity(GO:0042132) |
| 0.1 | 3.9 | GO:0008527 | taste receptor activity(GO:0008527) |
| 0.1 | 0.7 | GO:0097603 | temperature-gated ion channel activity(GO:0097603) |
| 0.1 | 0.9 | GO:0004489 | methylenetetrahydrofolate reductase (NAD(P)H) activity(GO:0004489) |
| 0.1 | 0.4 | GO:0003923 | GPI-anchor transamidase activity(GO:0003923) |
| 0.1 | 0.6 | GO:0016262 | protein N-acetylglucosaminyltransferase activity(GO:0016262) |
| 0.1 | 2.4 | GO:0008140 | cAMP response element binding protein binding(GO:0008140) |
| 0.1 | 1.3 | GO:0033170 | DNA clamp loader activity(GO:0003689) protein-DNA loading ATPase activity(GO:0033170) |
| 0.1 | 1.5 | GO:0000405 | bubble DNA binding(GO:0000405) |
| 0.1 | 0.8 | GO:0003960 | NADPH:quinone reductase activity(GO:0003960) |
| 0.1 | 0.4 | GO:0090541 | MIT domain binding(GO:0090541) |
| 0.1 | 0.8 | GO:0042328 | heparan sulfate N-acetylglucosaminyltransferase activity(GO:0042328) |
| 0.1 | 0.5 | GO:0004598 | peptidylglycine monooxygenase activity(GO:0004504) peptidylamidoglycolate lyase activity(GO:0004598) |
| 0.1 | 3.3 | GO:0030983 | mismatched DNA binding(GO:0030983) |
| 0.1 | 1.3 | GO:0001162 | RNA polymerase II intronic transcription regulatory region sequence-specific DNA binding(GO:0001162) |
| 0.1 | 0.9 | GO:0043023 | ribosomal large subunit binding(GO:0043023) |
| 0.1 | 0.5 | GO:0047493 | sphingomyelin synthase activity(GO:0033188) ceramide cholinephosphotransferase activity(GO:0047493) |
| 0.1 | 0.4 | GO:0003826 | alpha-ketoacid dehydrogenase activity(GO:0003826) 3-methyl-2-oxobutanoate dehydrogenase (2-methylpropanoyl-transferring) activity(GO:0003863) |
| 0.1 | 1.7 | GO:0004062 | aryl sulfotransferase activity(GO:0004062) |
| 0.1 | 0.7 | GO:0070004 | cysteine-type carboxypeptidase activity(GO:0016807) cysteine-type exopeptidase activity(GO:0070004) |
| 0.1 | 0.5 | GO:0017089 | glycolipid transporter activity(GO:0017089) |
| 0.1 | 0.8 | GO:0004962 | endothelin receptor activity(GO:0004962) |
| 0.1 | 0.4 | GO:0016608 | growth hormone-releasing hormone activity(GO:0016608) |
| 0.1 | 1.2 | GO:0019826 | oxygen sensor activity(GO:0019826) |
| 0.1 | 0.4 | GO:0071209 | U7 snRNA binding(GO:0071209) |
| 0.1 | 3.2 | GO:0050750 | low-density lipoprotein particle receptor binding(GO:0050750) |
| 0.1 | 0.6 | GO:0016434 | rRNA (cytosine) methyltransferase activity(GO:0016434) |
| 0.1 | 0.2 | GO:0047115 | trans-1,2-dihydrobenzene-1,2-diol dehydrogenase activity(GO:0047115) |
| 0.1 | 0.8 | GO:0005497 | androgen binding(GO:0005497) |
| 0.1 | 1.0 | GO:0043426 | MRF binding(GO:0043426) |
| 0.1 | 0.4 | GO:0001069 | regulatory region RNA binding(GO:0001069) |
| 0.1 | 1.3 | GO:0047498 | calcium-dependent phospholipase A2 activity(GO:0047498) |
| 0.1 | 0.4 | GO:0008426 | protein kinase C inhibitor activity(GO:0008426) |
| 0.1 | 0.1 | GO:0047023 | androsterone dehydrogenase activity(GO:0047023) |
| 0.1 | 2.8 | GO:0097493 | structural molecule activity conferring elasticity(GO:0097493) |
| 0.1 | 0.4 | GO:0016524 | latrotoxin receptor activity(GO:0016524) |
| 0.1 | 0.3 | GO:0008431 | vitamin E binding(GO:0008431) |
| 0.1 | 0.3 | GO:0035650 | AP-1 adaptor complex binding(GO:0035650) |
| 0.1 | 0.3 | GO:0034584 | piRNA binding(GO:0034584) |
| 0.1 | 0.7 | GO:0016714 | oxidoreductase activity, acting on paired donors, with incorporation or reduction of molecular oxygen, reduced pteridine as one donor, and incorporation of one atom of oxygen(GO:0016714) |
| 0.1 | 1.7 | GO:0010314 | phosphatidylinositol-5-phosphate binding(GO:0010314) |
| 0.1 | 0.6 | GO:0036033 | mediator complex binding(GO:0036033) |
| 0.1 | 2.0 | GO:0035497 | cAMP response element binding(GO:0035497) |
| 0.1 | 0.7 | GO:0005127 | ciliary neurotrophic factor receptor binding(GO:0005127) |
| 0.1 | 0.5 | GO:0001132 | RNA polymerase II transcription factor activity, TBP-class protein binding, involved in preinitiation complex assembly(GO:0001129) RNA polymerase II transcription factor activity, TBP-class protein binding(GO:0001132) |
| 0.1 | 0.2 | GO:0003918 | DNA topoisomerase type II (ATP-hydrolyzing) activity(GO:0003918) DNA topoisomerase II activity(GO:0061505) |
| 0.1 | 0.4 | GO:0004357 | glutamate-cysteine ligase activity(GO:0004357) |
| 0.1 | 1.2 | GO:0015143 | urate transmembrane transporter activity(GO:0015143) salt transmembrane transporter activity(GO:1901702) |
| 0.1 | 0.8 | GO:0004300 | enoyl-CoA hydratase activity(GO:0004300) |
| 0.1 | 1.1 | GO:0008607 | phosphorylase kinase regulator activity(GO:0008607) |
| 0.1 | 0.4 | GO:0019770 | IgG receptor activity(GO:0019770) |
| 0.1 | 0.3 | GO:0047708 | biotinidase activity(GO:0047708) |
| 0.1 | 2.1 | GO:0019992 | diacylglycerol binding(GO:0019992) |
| 0.1 | 1.4 | GO:0003906 | DNA-(apurinic or apyrimidinic site) lyase activity(GO:0003906) |
| 0.1 | 0.5 | GO:0015189 | L-lysine transmembrane transporter activity(GO:0015189) |
| 0.1 | 0.7 | GO:0016681 | ubiquinol-cytochrome-c reductase activity(GO:0008121) oxidoreductase activity, acting on diphenols and related substances as donors, cytochrome as acceptor(GO:0016681) |
| 0.1 | 0.5 | GO:0004591 | oxoglutarate dehydrogenase (succinyl-transferring) activity(GO:0004591) |
| 0.1 | 1.2 | GO:0032395 | MHC class II receptor activity(GO:0032395) |
| 0.1 | 0.2 | GO:0031071 | cysteine desulfurase activity(GO:0031071) |
| 0.1 | 0.6 | GO:0061665 | SUMO ligase activity(GO:0061665) |
| 0.1 | 2.0 | GO:0005545 | 1-phosphatidylinositol binding(GO:0005545) |
| 0.1 | 0.5 | GO:0008273 | calcium, potassium:sodium antiporter activity(GO:0008273) |
| 0.1 | 1.2 | GO:0000014 | single-stranded DNA endodeoxyribonuclease activity(GO:0000014) |
| 0.1 | 7.2 | GO:0008094 | DNA-dependent ATPase activity(GO:0008094) |
| 0.1 | 0.7 | GO:0046703 | natural killer cell lectin-like receptor binding(GO:0046703) |
| 0.1 | 1.0 | GO:0042608 | T cell receptor binding(GO:0042608) |
| 0.1 | 1.3 | GO:0043295 | glutathione binding(GO:0043295) |
| 0.1 | 0.4 | GO:0004366 | glycerol-3-phosphate O-acyltransferase activity(GO:0004366) |
| 0.1 | 4.3 | GO:0008137 | NADH dehydrogenase (ubiquinone) activity(GO:0008137) NADH dehydrogenase (quinone) activity(GO:0050136) |
| 0.1 | 2.3 | GO:0005001 | transmembrane receptor protein tyrosine phosphatase activity(GO:0005001) transmembrane receptor protein phosphatase activity(GO:0019198) |
| 0.1 | 0.3 | GO:0030622 | U4atac snRNA binding(GO:0030622) |
| 0.1 | 2.0 | GO:0004520 | endodeoxyribonuclease activity(GO:0004520) |
| 0.1 | 0.5 | GO:0009008 | DNA-methyltransferase activity(GO:0009008) |
| 0.1 | 0.3 | GO:0004447 | iodide peroxidase activity(GO:0004447) |
| 0.1 | 0.5 | GO:0051998 | carboxyl-O-methyltransferase activity(GO:0010340) protein carboxyl O-methyltransferase activity(GO:0051998) |
| 0.1 | 0.4 | GO:0038052 | RNA polymerase II transcription factor activity, estrogen-activated sequence-specific DNA binding(GO:0038052) |
| 0.1 | 0.3 | GO:0070643 | vitamin D3 25-hydroxylase activity(GO:0030343) vitamin D 25-hydroxylase activity(GO:0070643) |
| 0.1 | 0.3 | GO:0019834 | phospholipase A2 inhibitor activity(GO:0019834) |
| 0.1 | 0.9 | GO:0070700 | BMP receptor binding(GO:0070700) |
| 0.1 | 0.9 | GO:0004065 | arylsulfatase activity(GO:0004065) |
| 0.1 | 0.8 | GO:0004303 | estradiol 17-beta-dehydrogenase activity(GO:0004303) |
| 0.1 | 0.2 | GO:0031626 | beta-endorphin binding(GO:0031626) |
| 0.1 | 1.0 | GO:0034713 | type I transforming growth factor beta receptor binding(GO:0034713) |
| 0.1 | 1.1 | GO:0017017 | MAP kinase tyrosine/serine/threonine phosphatase activity(GO:0017017) |
| 0.1 | 0.3 | GO:0004775 | succinate-CoA ligase (ADP-forming) activity(GO:0004775) |
| 0.1 | 0.2 | GO:0071074 | eukaryotic initiation factor eIF2 binding(GO:0071074) |
| 0.1 | 0.5 | GO:0004046 | aminoacylase activity(GO:0004046) |
| 0.1 | 0.3 | GO:0016429 | tRNA (adenine-N1-)-methyltransferase activity(GO:0016429) |
| 0.1 | 0.2 | GO:0005173 | stem cell factor receptor binding(GO:0005173) |
| 0.1 | 0.6 | GO:0001042 | RNA polymerase I core binding(GO:0001042) |
| 0.1 | 0.5 | GO:0097100 | supercoiled DNA binding(GO:0097100) |
| 0.1 | 0.4 | GO:0004652 | polynucleotide adenylyltransferase activity(GO:0004652) |
| 0.1 | 0.5 | GO:0003909 | DNA ligase activity(GO:0003909) DNA ligase (ATP) activity(GO:0003910) |
| 0.1 | 0.3 | GO:0004647 | phosphoserine phosphatase activity(GO:0004647) |
| 0.1 | 0.6 | GO:0046790 | virion binding(GO:0046790) |
| 0.1 | 0.9 | GO:0000774 | adenyl-nucleotide exchange factor activity(GO:0000774) |
| 0.1 | 0.2 | GO:0004739 | pyruvate dehydrogenase (acetyl-transferring) activity(GO:0004739) |
| 0.1 | 1.1 | GO:0016018 | cyclosporin A binding(GO:0016018) |
| 0.1 | 0.4 | GO:0000293 | ferric-chelate reductase activity(GO:0000293) |
| 0.1 | 0.2 | GO:0043734 | DNA demethylase activity(GO:0035514) DNA-N1-methyladenine dioxygenase activity(GO:0043734) |
| 0.1 | 1.3 | GO:0008143 | poly(A) binding(GO:0008143) |
| 0.1 | 1.8 | GO:0031492 | nucleosomal DNA binding(GO:0031492) |
| 0.1 | 0.2 | GO:0016503 | pheromone receptor activity(GO:0016503) |
| 0.1 | 1.5 | GO:0017049 | GTP-Rho binding(GO:0017049) |
| 0.1 | 0.3 | GO:0008113 | peptide-methionine (S)-S-oxide reductase activity(GO:0008113) |
| 0.1 | 0.6 | GO:0008568 | microtubule-severing ATPase activity(GO:0008568) |
| 0.1 | 0.2 | GO:0017159 | pantetheine hydrolase activity(GO:0017159) |
| 0.1 | 0.7 | GO:0051011 | microtubule minus-end binding(GO:0051011) |
| 0.1 | 1.2 | GO:0031852 | mu-type opioid receptor binding(GO:0031852) |
| 0.1 | 0.1 | GO:0035402 | histone kinase activity (H3-T11 specific)(GO:0035402) |
| 0.1 | 1.1 | GO:0004862 | cAMP-dependent protein kinase inhibitor activity(GO:0004862) |
| 0.1 | 0.5 | GO:0004176 | ATP-dependent peptidase activity(GO:0004176) |
| 0.1 | 1.5 | GO:0016854 | racemase and epimerase activity(GO:0016854) |
| 0.1 | 0.5 | GO:0003876 | AMP deaminase activity(GO:0003876) adenosine-phosphate deaminase activity(GO:0047623) |
| 0.1 | 0.3 | GO:0061575 | cyclin-dependent protein serine/threonine kinase activator activity(GO:0061575) |
| 0.1 | 0.3 | GO:0070568 | guanylyltransferase activity(GO:0070568) |
| 0.1 | 0.5 | GO:0046974 | histone methyltransferase activity (H3-K9 specific)(GO:0046974) |
| 0.1 | 0.4 | GO:0070290 | N-acylphosphatidylethanolamine-specific phospholipase D activity(GO:0070290) |
| 0.1 | 0.5 | GO:0000213 | tRNA-intron endonuclease activity(GO:0000213) |
| 0.1 | 0.7 | GO:0015266 | protein channel activity(GO:0015266) |
| 0.1 | 0.5 | GO:0005094 | Rho GDP-dissociation inhibitor activity(GO:0005094) |
| 0.1 | 0.4 | GO:0015288 | porin activity(GO:0015288) |
| 0.1 | 0.3 | GO:0005219 | ryanodine-sensitive calcium-release channel activity(GO:0005219) |
| 0.1 | 0.3 | GO:0016230 | sphingomyelin phosphodiesterase activator activity(GO:0016230) |
| 0.1 | 0.4 | GO:0039706 | co-receptor binding(GO:0039706) |
| 0.1 | 0.3 | GO:0035368 | selenocysteine insertion sequence binding(GO:0035368) |
| 0.0 | 0.2 | GO:0004692 | cGMP-dependent protein kinase activity(GO:0004692) |
| 0.0 | 0.4 | GO:0030345 | extracellular matrix structural constituent conferring compression resistance(GO:0030021) structural constituent of tooth enamel(GO:0030345) |
| 0.0 | 0.5 | GO:0016783 | sulfurtransferase activity(GO:0016783) |
| 0.0 | 1.3 | GO:0000993 | RNA polymerase II core binding(GO:0000993) |
| 0.0 | 1.3 | GO:0071949 | FAD binding(GO:0071949) |
| 0.0 | 0.1 | GO:0033677 | DNA/RNA helicase activity(GO:0033677) |
| 0.0 | 0.1 | GO:0004556 | alpha-amylase activity(GO:0004556) |
| 0.0 | 1.1 | GO:0000339 | RNA cap binding(GO:0000339) |
| 0.0 | 2.7 | GO:0003684 | damaged DNA binding(GO:0003684) |
| 0.0 | 1.1 | GO:0001056 | RNA polymerase III activity(GO:0001056) |
| 0.0 | 1.0 | GO:0001083 | transcription factor activity, RNA polymerase II basal transcription factor binding(GO:0001083) |
| 0.0 | 2.0 | GO:0004198 | calcium-dependent cysteine-type endopeptidase activity(GO:0004198) |
| 0.0 | 1.5 | GO:0001972 | retinoic acid binding(GO:0001972) |
| 0.0 | 0.5 | GO:0031995 | insulin-like growth factor II binding(GO:0031995) |
| 0.0 | 0.4 | GO:0099580 | ion antiporter activity involved in regulation of postsynaptic membrane potential(GO:0099580) |
| 0.0 | 1.0 | GO:0008266 | poly(U) RNA binding(GO:0008266) |
| 0.0 | 0.3 | GO:0005499 | vitamin D binding(GO:0005499) |
| 0.0 | 0.5 | GO:0004526 | ribonuclease P activity(GO:0004526) |
| 0.0 | 2.0 | GO:0001103 | RNA polymerase II repressing transcription factor binding(GO:0001103) |
| 0.0 | 0.2 | GO:0019763 | immunoglobulin receptor activity(GO:0019763) |
| 0.0 | 0.9 | GO:0008494 | translation activator activity(GO:0008494) |
| 0.0 | 0.8 | GO:0035925 | mRNA 3'-UTR AU-rich region binding(GO:0035925) |
| 0.0 | 0.8 | GO:0031078 | histone deacetylase activity (H3-K14 specific)(GO:0031078) NAD-dependent histone deacetylase activity (H3-K14 specific)(GO:0032041) |
| 0.0 | 1.2 | GO:0016646 | oxidoreductase activity, acting on the CH-NH group of donors, NAD or NADP as acceptor(GO:0016646) |
| 0.0 | 0.5 | GO:0003720 | telomerase activity(GO:0003720) RNA-directed DNA polymerase activity(GO:0003964) |
| 0.0 | 0.3 | GO:0016929 | SUMO-specific protease activity(GO:0016929) |
| 0.0 | 0.1 | GO:0004874 | aryl hydrocarbon receptor activity(GO:0004874) |
| 0.0 | 0.7 | GO:0036374 | glutathione hydrolase activity(GO:0036374) |
| 0.0 | 1.7 | GO:0017046 | peptide hormone binding(GO:0017046) |
| 0.0 | 0.2 | GO:0017060 | 3-galactosyl-N-acetylglucosaminide 4-alpha-L-fucosyltransferase activity(GO:0017060) |
| 0.0 | 0.3 | GO:0048408 | epidermal growth factor binding(GO:0048408) |
| 0.0 | 1.8 | GO:0003755 | peptidyl-prolyl cis-trans isomerase activity(GO:0003755) |
| 0.0 | 0.2 | GO:0005415 | nucleoside:sodium symporter activity(GO:0005415) |
| 0.0 | 0.3 | GO:0030957 | Tat protein binding(GO:0030957) |
| 0.0 | 0.2 | GO:0004925 | prolactin receptor activity(GO:0004925) |
| 0.0 | 0.3 | GO:0045159 | myosin II binding(GO:0045159) |
| 0.0 | 0.1 | GO:0003954 | NADH dehydrogenase activity(GO:0003954) |
| 0.0 | 0.5 | GO:0050786 | RAGE receptor binding(GO:0050786) |
| 0.0 | 0.3 | GO:0017136 | NAD-dependent histone deacetylase activity(GO:0017136) |
| 0.0 | 0.4 | GO:0008553 | hydrogen-exporting ATPase activity, phosphorylative mechanism(GO:0008553) |
| 0.0 | 0.7 | GO:0009982 | pseudouridine synthase activity(GO:0009982) |
| 0.0 | 0.6 | GO:0004707 | MAP kinase activity(GO:0004707) |
| 0.0 | 0.6 | GO:0005520 | insulin-like growth factor binding(GO:0005520) |
| 0.0 | 0.2 | GO:0004694 | eukaryotic translation initiation factor 2alpha kinase activity(GO:0004694) |
| 0.0 | 0.9 | GO:0046965 | retinoid X receptor binding(GO:0046965) |
| 0.0 | 0.1 | GO:1900750 | oligopeptide binding(GO:1900750) |
| 0.0 | 0.2 | GO:0003998 | acylphosphatase activity(GO:0003998) |
| 0.0 | 0.6 | GO:0032036 | myosin heavy chain binding(GO:0032036) |
| 0.0 | 0.1 | GO:0008511 | sodium:potassium:chloride symporter activity(GO:0008511) |
| 0.0 | 1.2 | GO:0043015 | gamma-tubulin binding(GO:0043015) |
| 0.0 | 0.3 | GO:0017162 | aryl hydrocarbon receptor binding(GO:0017162) |
| 0.0 | 0.8 | GO:0042605 | peptide antigen binding(GO:0042605) |
| 0.0 | 0.5 | GO:0038187 | signaling pattern recognition receptor activity(GO:0008329) pattern recognition receptor activity(GO:0038187) |
| 0.0 | 0.1 | GO:0072345 | NAADP-sensitive calcium-release channel activity(GO:0072345) |
| 0.0 | 0.2 | GO:0005159 | insulin-like growth factor receptor binding(GO:0005159) |
| 0.0 | 1.2 | GO:0004708 | MAP kinase kinase activity(GO:0004708) |
| 0.0 | 0.1 | GO:0019150 | D-ribulokinase activity(GO:0019150) |
| 0.0 | 0.2 | GO:0031802 | type 5 metabotropic glutamate receptor binding(GO:0031802) |
| 0.0 | 0.1 | GO:0004040 | amidase activity(GO:0004040) |
| 0.0 | 0.4 | GO:0016861 | intramolecular oxidoreductase activity, interconverting aldoses and ketoses(GO:0016861) |
| 0.0 | 0.4 | GO:0030274 | LIM domain binding(GO:0030274) |
| 0.0 | 0.4 | GO:0004767 | sphingomyelin phosphodiesterase activity(GO:0004767) |
| 0.0 | 0.4 | GO:0008430 | selenium binding(GO:0008430) |
| 0.0 | 3.2 | GO:0004722 | protein serine/threonine phosphatase activity(GO:0004722) |
| 0.0 | 0.4 | GO:0035612 | AP-2 adaptor complex binding(GO:0035612) |
| 0.0 | 0.5 | GO:0004383 | guanylate cyclase activity(GO:0004383) |
| 0.0 | 1.0 | GO:0001968 | fibronectin binding(GO:0001968) |
| 0.0 | 0.7 | GO:0005095 | GTPase inhibitor activity(GO:0005095) |
| 0.0 | 0.8 | GO:0015035 | protein disulfide oxidoreductase activity(GO:0015035) |
| 0.0 | 1.5 | GO:0005158 | insulin receptor binding(GO:0005158) |
| 0.0 | 0.2 | GO:0019784 | NEDD8-specific protease activity(GO:0019784) |
| 0.0 | 0.1 | GO:0034647 | histone demethylase activity (H3-trimethyl-K4 specific)(GO:0034647) histone demethylase activity (H3-dimethyl-K4 specific)(GO:0034648) |
| 0.0 | 0.1 | GO:0005135 | interleukin-3 receptor binding(GO:0005135) |
| 0.0 | 0.8 | GO:0031491 | nucleosome binding(GO:0031491) |
| 0.0 | 0.3 | GO:0019869 | chloride channel inhibitor activity(GO:0019869) |
| 0.0 | 0.1 | GO:0003956 | NAD(P)+-protein-arginine ADP-ribosyltransferase activity(GO:0003956) |
| 0.0 | 1.0 | GO:0032266 | phosphatidylinositol-3-phosphate binding(GO:0032266) |
| 0.0 | 0.2 | GO:0016778 | diphosphotransferase activity(GO:0016778) |
| 0.0 | 0.1 | GO:0043208 | glycosphingolipid binding(GO:0043208) |
| 0.0 | 0.7 | GO:0008308 | voltage-gated anion channel activity(GO:0008308) |
| 0.0 | 0.7 | GO:0005521 | lamin binding(GO:0005521) |
| 0.0 | 4.5 | GO:0005089 | Rho guanyl-nucleotide exchange factor activity(GO:0005089) |
| 0.0 | 0.3 | GO:0097157 | pre-mRNA intronic binding(GO:0097157) |
| 0.0 | 0.2 | GO:0030144 | alpha-1,6-mannosylglycoprotein 6-beta-N-acetylglucosaminyltransferase activity(GO:0030144) |
| 0.0 | 0.1 | GO:0005078 | MAP-kinase scaffold activity(GO:0005078) |
| 0.0 | 0.5 | GO:0005041 | low-density lipoprotein receptor activity(GO:0005041) |
| 0.0 | 0.4 | GO:0016846 | carbon-sulfur lyase activity(GO:0016846) |
| 0.0 | 0.8 | GO:0003746 | translation elongation factor activity(GO:0003746) |
| 0.0 | 0.2 | GO:0005134 | interleukin-2 receptor binding(GO:0005134) |
| 0.0 | 0.1 | GO:0035673 | oligopeptide transmembrane transporter activity(GO:0035673) |
| 0.0 | 0.3 | GO:0004726 | non-membrane spanning protein tyrosine phosphatase activity(GO:0004726) |
| 0.0 | 0.3 | GO:0016840 | carbon-nitrogen lyase activity(GO:0016840) |
| 0.0 | 0.3 | GO:0031386 | protein tag(GO:0031386) |
| 0.0 | 0.8 | GO:0005388 | calcium-transporting ATPase activity(GO:0005388) |
| 0.0 | 0.4 | GO:0017127 | cholesterol transporter activity(GO:0017127) |
| 0.0 | 0.2 | GO:0036312 | phosphatidylinositol 3-kinase regulatory subunit binding(GO:0036312) |
| 0.0 | 0.4 | GO:0019215 | intermediate filament binding(GO:0019215) |
| 0.0 | 0.3 | GO:0004075 | biotin carboxylase activity(GO:0004075) |
| 0.0 | 1.3 | GO:0034987 | immunoglobulin receptor binding(GO:0034987) |
| 0.0 | 0.5 | GO:0001608 | G-protein coupled nucleotide receptor activity(GO:0001608) G-protein coupled purinergic nucleotide receptor activity(GO:0045028) |
| 0.0 | 0.4 | GO:1904264 | ubiquitin protein ligase activity involved in ERAD pathway(GO:1904264) |
| 0.0 | 0.2 | GO:0004957 | prostaglandin E receptor activity(GO:0004957) |
| 0.0 | 0.2 | GO:0005143 | interleukin-12 receptor binding(GO:0005143) |
| 0.0 | 0.1 | GO:0050253 | retinyl-palmitate esterase activity(GO:0050253) |
| 0.0 | 0.1 | GO:0005462 | UDP-N-acetylglucosamine transmembrane transporter activity(GO:0005462) |
| 0.0 | 0.4 | GO:0016799 | hydrolase activity, hydrolyzing N-glycosyl compounds(GO:0016799) |
| 0.0 | 0.3 | GO:0004972 | NMDA glutamate receptor activity(GO:0004972) |
| 0.0 | 0.1 | GO:0022850 | serotonin-gated cation channel activity(GO:0022850) |
| 0.0 | 0.1 | GO:0004597 | peptide-aspartate beta-dioxygenase activity(GO:0004597) |
| 0.0 | 0.5 | GO:0031683 | G-protein beta/gamma-subunit complex binding(GO:0031683) |
| 0.0 | 0.2 | GO:0001594 | trace-amine receptor activity(GO:0001594) |
| 0.0 | 0.1 | GO:0002060 | purine nucleobase binding(GO:0002060) glycogen phosphorylase activity(GO:0008184) |
| 0.0 | 1.1 | GO:0050699 | WW domain binding(GO:0050699) |
| 0.0 | 0.7 | GO:0008574 | ATP-dependent microtubule motor activity, plus-end-directed(GO:0008574) |
| 0.0 | 0.1 | GO:0015141 | succinate transmembrane transporter activity(GO:0015141) |
| 0.0 | 0.1 | GO:0008267 | poly-glutamine tract binding(GO:0008267) |
| 0.0 | 0.1 | GO:0031849 | olfactory receptor binding(GO:0031849) |
| 0.0 | 0.2 | GO:1990247 | N6-methyladenosine-containing RNA binding(GO:1990247) |
| 0.0 | 0.2 | GO:0004971 | AMPA glutamate receptor activity(GO:0004971) |
| 0.0 | 0.2 | GO:0004128 | cytochrome-b5 reductase activity, acting on NAD(P)H(GO:0004128) |
| 0.0 | 1.5 | GO:0019843 | rRNA binding(GO:0019843) |
| 0.0 | 0.2 | GO:0001591 | dopamine neurotransmitter receptor activity, coupled via Gi/Go(GO:0001591) |
| 0.0 | 0.2 | GO:0070679 | inositol 1,4,5 trisphosphate binding(GO:0070679) |
| 0.0 | 0.2 | GO:0004969 | histamine receptor activity(GO:0004969) |
| 0.0 | 0.1 | GO:0043237 | laminin-1 binding(GO:0043237) |
| 0.0 | 0.1 | GO:0035197 | siRNA binding(GO:0035197) |
| 0.0 | 0.1 | GO:1990050 | phosphatidic acid transporter activity(GO:1990050) |
| 0.0 | 0.1 | GO:0019776 | Atg8 ligase activity(GO:0019776) |
| 0.0 | 0.2 | GO:0015187 | glycine transmembrane transporter activity(GO:0015187) |
| 0.0 | 0.2 | GO:0098599 | palmitoyl-(protein) hydrolase activity(GO:0008474) palmitoyl hydrolase activity(GO:0098599) |
| 0.0 | 0.1 | GO:0004663 | Rab geranylgeranyltransferase activity(GO:0004663) |
| 0.0 | 0.1 | GO:0047179 | platelet-activating factor acetyltransferase activity(GO:0047179) |
| 0.0 | 0.2 | GO:0001135 | transcription factor activity, RNA polymerase II transcription factor recruiting(GO:0001135) |
| 0.0 | 0.5 | GO:0005212 | structural constituent of eye lens(GO:0005212) |
| 0.0 | 0.1 | GO:0032184 | SUMO polymer binding(GO:0032184) |
| 0.0 | 2.2 | GO:0004386 | helicase activity(GO:0004386) |
| 0.0 | 0.1 | GO:0033857 | diphosphoinositol-pentakisphosphate kinase activity(GO:0033857) |
| 0.0 | 0.1 | GO:0004645 | phosphorylase activity(GO:0004645) |
| 0.0 | 0.6 | GO:0004709 | MAP kinase kinase kinase activity(GO:0004709) |
| 0.0 | 0.0 | GO:0030284 | estrogen receptor activity(GO:0030284) |
| 0.0 | 0.3 | GO:0005092 | GDP-dissociation inhibitor activity(GO:0005092) |
| 0.0 | 0.3 | GO:0005049 | nuclear export signal receptor activity(GO:0005049) |
| 0.0 | 1.0 | GO:0008028 | monocarboxylic acid transmembrane transporter activity(GO:0008028) |
| 0.0 | 0.4 | GO:0008191 | metalloendopeptidase inhibitor activity(GO:0008191) |
| 0.0 | 0.1 | GO:0050682 | AF-2 domain binding(GO:0050682) |
| 0.0 | 0.1 | GO:0031419 | cobalamin binding(GO:0031419) |
| 0.0 | 0.1 | GO:0016454 | serine C-palmitoyltransferase activity(GO:0004758) C-palmitoyltransferase activity(GO:0016454) |
| 0.0 | 0.2 | GO:0070273 | phosphatidylinositol-4-phosphate binding(GO:0070273) |
| 0.0 | 0.9 | GO:0004864 | protein phosphatase inhibitor activity(GO:0004864) |
| 0.0 | 0.2 | GO:0015925 | galactosidase activity(GO:0015925) |
| 0.0 | 0.1 | GO:0043047 | single-stranded telomeric DNA binding(GO:0043047) |
| 0.0 | 0.9 | GO:0008307 | structural constituent of muscle(GO:0008307) |
| 0.0 | 0.4 | GO:0008327 | methyl-CpG binding(GO:0008327) |
| 0.0 | 0.1 | GO:0004910 | interleukin-1, Type II, blocking receptor activity(GO:0004910) |
| 0.0 | 0.3 | GO:0010485 | H4 histone acetyltransferase activity(GO:0010485) |
| 0.0 | 0.2 | GO:0051920 | peroxiredoxin activity(GO:0051920) |
| 0.0 | 0.1 | GO:0033300 | dehydroascorbic acid transporter activity(GO:0033300) |
| 0.0 | 0.2 | GO:0008432 | JUN kinase binding(GO:0008432) |
| 0.0 | 0.1 | GO:0061133 | endopeptidase activator activity(GO:0061133) |
| 0.0 | 0.7 | GO:0016303 | 1-phosphatidylinositol-3-kinase activity(GO:0016303) |
| 0.0 | 0.1 | GO:0030292 | protein tyrosine kinase inhibitor activity(GO:0030292) |
| 0.0 | 0.3 | GO:0015095 | magnesium ion transmembrane transporter activity(GO:0015095) |
| 0.0 | 0.1 | GO:0005000 | vasopressin receptor activity(GO:0005000) |
| 0.0 | 0.0 | GO:0031404 | chloride ion binding(GO:0031404) |
| 0.0 | 0.2 | GO:0070016 | armadillo repeat domain binding(GO:0070016) |
| 0.0 | 0.1 | GO:0043522 | leucine zipper domain binding(GO:0043522) |
| 0.0 | 0.1 | GO:0031545 | peptidyl-proline 4-dioxygenase activity(GO:0031545) |
| 0.0 | 0.5 | GO:0001540 | beta-amyloid binding(GO:0001540) |
| 0.0 | 0.6 | GO:0003743 | translation initiation factor activity(GO:0003743) |
| 0.0 | 0.4 | GO:0001784 | phosphotyrosine binding(GO:0001784) |
| 0.0 | 0.0 | GO:0008466 | glycogenin glucosyltransferase activity(GO:0008466) |
Gene overrepresentation in curated gene sets: canonical pathways category:
| Log-likelihood per target | Total log-likelihood | Term | Description |
|---|---|---|---|
| 0.2 | 6.8 | PID S1P S1P4 PATHWAY | S1P4 pathway |
| 0.1 | 7.0 | PID IL3 PATHWAY | IL3-mediated signaling events |
| 0.1 | 6.4 | PID ALPHA SYNUCLEIN PATHWAY | Alpha-synuclein signaling |
| 0.1 | 8.9 | PID AR TF PATHWAY | Regulation of Androgen receptor activity |
| 0.1 | 7.1 | PID P38 ALPHA BETA DOWNSTREAM PATHWAY | Signaling mediated by p38-alpha and p38-beta |
| 0.1 | 5.1 | PID NETRIN PATHWAY | Netrin-mediated signaling events |
| 0.1 | 1.8 | PID ERB GENOMIC PATHWAY | Validated nuclear estrogen receptor beta network |
| 0.1 | 0.3 | PID CD40 PATHWAY | CD40/CD40L signaling |
| 0.1 | 1.1 | ST INTERFERON GAMMA PATHWAY | Interferon gamma pathway. |
| 0.1 | 2.5 | PID ATM PATHWAY | ATM pathway |
| 0.1 | 1.5 | PID IL2 1PATHWAY | IL2-mediated signaling events |
| 0.1 | 1.8 | PID S1P S1P3 PATHWAY | S1P3 pathway |
| 0.1 | 3.6 | PID HIF2PATHWAY | HIF-2-alpha transcription factor network |
| 0.1 | 3.1 | PID GLYPICAN 1PATHWAY | Glypican 1 network |
| 0.1 | 0.6 | ST TUMOR NECROSIS FACTOR PATHWAY | Tumor Necrosis Factor Pathway. |
| 0.1 | 2.5 | PID PI3K PLC TRK PATHWAY | Trk receptor signaling mediated by PI3K and PLC-gamma |
| 0.1 | 3.1 | PID TCR CALCIUM PATHWAY | Calcium signaling in the CD4+ TCR pathway |
| 0.1 | 3.3 | PID FANCONI PATHWAY | Fanconi anemia pathway |
| 0.0 | 2.0 | PID SHP2 PATHWAY | SHP2 signaling |
| 0.0 | 2.8 | PID A6B1 A6B4 INTEGRIN PATHWAY | a6b1 and a6b4 Integrin signaling |
| 0.0 | 2.6 | PID HDAC CLASSII PATHWAY | Signaling events mediated by HDAC Class II |
| 0.0 | 3.5 | PID CD8 TCR PATHWAY | TCR signaling in naïve CD8+ T cells |
| 0.0 | 3.7 | PID E2F PATHWAY | E2F transcription factor network |
| 0.0 | 1.4 | PID TOLL ENDOGENOUS PATHWAY | Endogenous TLR signaling |
| 0.0 | 0.2 | ST TYPE I INTERFERON PATHWAY | Type I Interferon (alpha/beta IFN) Pathway |
| 0.0 | 2.0 | PID PTP1B PATHWAY | Signaling events mediated by PTP1B |
| 0.0 | 0.6 | PID P38 GAMMA DELTA PATHWAY | Signaling mediated by p38-gamma and p38-delta |
| 0.0 | 1.0 | PID FCER1 PATHWAY | Fc-epsilon receptor I signaling in mast cells |
| 0.0 | 1.1 | ST PHOSPHOINOSITIDE 3 KINASE PATHWAY | PI3K Pathway |
| 0.0 | 1.2 | SIG INSULIN RECEPTOR PATHWAY IN CARDIAC MYOCYTES | Genes related to the insulin receptor pathway |
| 0.0 | 0.4 | SA PTEN PATHWAY | PTEN is a tumor suppressor that dephosphorylates the lipid messenger phosphatidylinositol triphosphate. |
| 0.0 | 2.1 | PID P53 REGULATION PATHWAY | p53 pathway |
| 0.0 | 2.3 | PID HNF3A PATHWAY | FOXA1 transcription factor network |
| 0.0 | 0.3 | PID NEPHRIN NEPH1 PATHWAY | Nephrin/Neph1 signaling in the kidney podocyte |
| 0.0 | 1.0 | PID ARF6 PATHWAY | Arf6 signaling events |
| 0.0 | 0.3 | PID FOXO PATHWAY | FoxO family signaling |
| 0.0 | 0.6 | PID INSULIN GLUCOSE PATHWAY | Insulin-mediated glucose transport |
| 0.0 | 0.7 | PID IL6 7 PATHWAY | IL6-mediated signaling events |
| 0.0 | 0.5 | PID HEDGEHOG 2PATHWAY | Signaling events mediated by the Hedgehog family |
| 0.0 | 3.1 | PID AR PATHWAY | Coregulation of Androgen receptor activity |
| 0.0 | 0.7 | PID ALK1 PATHWAY | ALK1 signaling events |
| 0.0 | 0.9 | PID P38 MKK3 6PATHWAY | p38 MAPK signaling pathway |
| 0.0 | 1.0 | PID HEDGEHOG GLI PATHWAY | Hedgehog signaling events mediated by Gli proteins |
| 0.0 | 0.2 | PID IL2 STAT5 PATHWAY | IL2 signaling events mediated by STAT5 |
| 0.0 | 0.5 | ST G ALPHA S PATHWAY | G alpha s Pathway |
| 0.0 | 1.7 | PID ARF6 TRAFFICKING PATHWAY | Arf6 trafficking events |
| 0.0 | 0.4 | PID NECTIN PATHWAY | Nectin adhesion pathway |
| 0.0 | 0.7 | PID RAS PATHWAY | Regulation of Ras family activation |
| 0.0 | 0.5 | PID CERAMIDE PATHWAY | Ceramide signaling pathway |
| 0.0 | 0.4 | PID IL27 PATHWAY | IL27-mediated signaling events |
| 0.0 | 0.3 | PID RET PATHWAY | Signaling events regulated by Ret tyrosine kinase |
| 0.0 | 0.3 | PID HDAC CLASSIII PATHWAY | Signaling events mediated by HDAC Class III |
| 0.0 | 0.1 | PID PDGFRA PATHWAY | PDGFR-alpha signaling pathway |
| 0.0 | 0.6 | PID SYNDECAN 4 PATHWAY | Syndecan-4-mediated signaling events |
| 0.0 | 0.5 | PID FRA PATHWAY | Validated transcriptional targets of AP1 family members Fra1 and Fra2 |
| 0.0 | 0.6 | PID HES HEY PATHWAY | Notch-mediated HES/HEY network |
| 0.0 | 0.1 | PID BARD1 PATHWAY | BARD1 signaling events |
| 0.0 | 0.2 | PID P38 ALPHA BETA PATHWAY | Regulation of p38-alpha and p38-beta |
| 0.0 | 1.0 | PID NOTCH PATHWAY | Notch signaling pathway |
| 0.0 | 0.2 | PID FAS PATHWAY | FAS (CD95) signaling pathway |
| 0.0 | 0.1 | SIG CHEMOTAXIS | Genes related to chemotaxis |
| 0.0 | 0.0 | SA FAS SIGNALING | The TNF-type receptor Fas induces apoptosis on ligand binding. |
| 0.0 | 0.3 | PID DELTA NP63 PATHWAY | Validated transcriptional targets of deltaNp63 isoforms |
Gene overrepresentation in curated gene sets: REACTOME pathways category:
| Log-likelihood per target | Total log-likelihood | Term | Description |
|---|---|---|---|
| 0.4 | 9.4 | REACTOME PKA MEDIATED PHOSPHORYLATION OF CREB | Genes involved in PKA-mediated phosphorylation of CREB |
| 0.3 | 7.1 | REACTOME ADENYLATE CYCLASE INHIBITORY PATHWAY | Genes involved in Adenylate cyclase inhibitory pathway |
| 0.3 | 4.5 | REACTOME ROLE OF DCC IN REGULATING APOPTOSIS | Genes involved in Role of DCC in regulating apoptosis |
| 0.2 | 3.1 | REACTOME IKK COMPLEX RECRUITMENT MEDIATED BY RIP1 | Genes involved in IKK complex recruitment mediated by RIP1 |
| 0.2 | 1.3 | REACTOME BINDING AND ENTRY OF HIV VIRION | Genes involved in Binding and entry of HIV virion |
| 0.2 | 3.3 | REACTOME THE ACTIVATION OF ARYLSULFATASES | Genes involved in The activation of arylsulfatases |
| 0.2 | 4.1 | REACTOME CA DEPENDENT EVENTS | Genes involved in Ca-dependent events |
| 0.2 | 4.1 | REACTOME REGULATION OF COMPLEMENT CASCADE | Genes involved in Regulation of Complement cascade |
| 0.2 | 5.1 | REACTOME BOTULINUM NEUROTOXICITY | Genes involved in Botulinum neurotoxicity |
| 0.2 | 6.1 | REACTOME RNA POL III TRANSCRIPTION TERMINATION | Genes involved in RNA Polymerase III Transcription Termination |
| 0.2 | 0.8 | REACTOME FORMATION OF TRANSCRIPTION COUPLED NER TC NER REPAIR COMPLEX | Genes involved in Formation of transcription-coupled NER (TC-NER) repair complex |
| 0.2 | 4.1 | REACTOME CYTOSOLIC SULFONATION OF SMALL MOLECULES | Genes involved in Cytosolic sulfonation of small molecules |
| 0.2 | 3.0 | REACTOME PURINE CATABOLISM | Genes involved in Purine catabolism |
| 0.2 | 5.2 | REACTOME PEROXISOMAL LIPID METABOLISM | Genes involved in Peroxisomal lipid metabolism |
| 0.1 | 0.7 | REACTOME PD1 SIGNALING | Genes involved in PD-1 signaling |
| 0.1 | 4.1 | REACTOME FORMATION OF INCISION COMPLEX IN GG NER | Genes involved in Formation of incision complex in GG-NER |
| 0.1 | 2.8 | REACTOME ABCA TRANSPORTERS IN LIPID HOMEOSTASIS | Genes involved in ABCA transporters in lipid homeostasis |
| 0.1 | 3.6 | REACTOME LAGGING STRAND SYNTHESIS | Genes involved in Lagging Strand Synthesis |
| 0.1 | 3.1 | REACTOME HDL MEDIATED LIPID TRANSPORT | Genes involved in HDL-mediated lipid transport |
| 0.1 | 6.3 | REACTOME AMYLOIDS | Genes involved in Amyloids |
| 0.1 | 2.5 | REACTOME TRANSLOCATION OF ZAP 70 TO IMMUNOLOGICAL SYNAPSE | Genes involved in Translocation of ZAP-70 to Immunological synapse |
| 0.1 | 1.6 | REACTOME ABACAVIR TRANSPORT AND METABOLISM | Genes involved in Abacavir transport and metabolism |
| 0.1 | 1.6 | REACTOME ACTIVATION OF CHAPERONE GENES BY ATF6 ALPHA | Genes involved in Activation of Chaperone Genes by ATF6-alpha |
| 0.1 | 0.4 | REACTOME DESTABILIZATION OF MRNA BY AUF1 HNRNP D0 | Genes involved in Destabilization of mRNA by AUF1 (hnRNP D0) |
| 0.1 | 1.7 | REACTOME CHYLOMICRON MEDIATED LIPID TRANSPORT | Genes involved in Chylomicron-mediated lipid transport |
| 0.1 | 3.5 | REACTOME REGULATION OF IFNA SIGNALING | Genes involved in Regulation of IFNA signaling |
| 0.1 | 2.9 | REACTOME CASPASE MEDIATED CLEAVAGE OF CYTOSKELETAL PROTEINS | Genes involved in Caspase-mediated cleavage of cytoskeletal proteins |
| 0.1 | 7.6 | REACTOME MYOGENESIS | Genes involved in Myogenesis |
| 0.1 | 2.8 | REACTOME RAP1 SIGNALLING | Genes involved in Rap1 signalling |
| 0.1 | 0.8 | REACTOME FORMATION OF THE HIV1 EARLY ELONGATION COMPLEX | Genes involved in Formation of the HIV-1 Early Elongation Complex |
| 0.1 | 4.7 | REACTOME MRNA 3 END PROCESSING | Genes involved in mRNA 3'-end processing |
| 0.1 | 2.7 | REACTOME GROWTH HORMONE RECEPTOR SIGNALING | Genes involved in Growth hormone receptor signaling |
| 0.1 | 1.3 | REACTOME GAMMA CARBOXYLATION TRANSPORT AND AMINO TERMINAL CLEAVAGE OF PROTEINS | Genes involved in Gamma-carboxylation, transport, and amino-terminal cleavage of proteins |
| 0.1 | 6.5 | REACTOME RESPIRATORY ELECTRON TRANSPORT | Genes involved in Respiratory electron transport |
| 0.1 | 1.5 | REACTOME CLASS C 3 METABOTROPIC GLUTAMATE PHEROMONE RECEPTORS | Genes involved in Class C/3 (Metabotropic glutamate/pheromone receptors) |
| 0.1 | 0.8 | REACTOME SIGNALING BY CONSTITUTIVELY ACTIVE EGFR | Genes involved in Signaling by constitutively active EGFR |
| 0.1 | 1.1 | REACTOME G2 M DNA DAMAGE CHECKPOINT | Genes involved in G2/M DNA damage checkpoint |
| 0.1 | 2.4 | REACTOME CHONDROITIN SULFATE BIOSYNTHESIS | Genes involved in Chondroitin sulfate biosynthesis |
| 0.1 | 2.9 | REACTOME APOPTOTIC CLEAVAGE OF CELLULAR PROTEINS | Genes involved in Apoptotic cleavage of cellular proteins |
| 0.1 | 1.8 | REACTOME SIGNALING BY HIPPO | Genes involved in Signaling by Hippo |
| 0.1 | 1.1 | REACTOME BILE SALT AND ORGANIC ANION SLC TRANSPORTERS | Genes involved in Bile salt and organic anion SLC transporters |
| 0.1 | 1.1 | REACTOME MICRORNA MIRNA BIOGENESIS | Genes involved in MicroRNA (miRNA) Biogenesis |
| 0.1 | 1.4 | REACTOME ACYL CHAIN REMODELLING OF PC | Genes involved in Acyl chain remodelling of PC |
| 0.1 | 1.5 | REACTOME BRANCHED CHAIN AMINO ACID CATABOLISM | Genes involved in Branched-chain amino acid catabolism |
| 0.1 | 1.7 | REACTOME CELL EXTRACELLULAR MATRIX INTERACTIONS | Genes involved in Cell-extracellular matrix interactions |
| 0.0 | 1.9 | REACTOME POST TRANSLATIONAL MODIFICATION SYNTHESIS OF GPI ANCHORED PROTEINS | Genes involved in Post-translational modification: synthesis of GPI-anchored proteins |
| 0.0 | 0.4 | REACTOME REGULATION OF THE FANCONI ANEMIA PATHWAY | Genes involved in Regulation of the Fanconi anemia pathway |
| 0.0 | 0.4 | REACTOME P130CAS LINKAGE TO MAPK SIGNALING FOR INTEGRINS | Genes involved in p130Cas linkage to MAPK signaling for integrins |
| 0.0 | 1.5 | REACTOME SYNTHESIS AND INTERCONVERSION OF NUCLEOTIDE DI AND TRIPHOSPHATES | Genes involved in Synthesis and interconversion of nucleotide di- and triphosphates |
| 0.0 | 1.4 | REACTOME MEIOTIC RECOMBINATION | Genes involved in Meiotic Recombination |
| 0.0 | 1.0 | REACTOME ACTIVATION OF ATR IN RESPONSE TO REPLICATION STRESS | Genes involved in Activation of ATR in response to replication stress |
| 0.0 | 1.6 | REACTOME GABA SYNTHESIS RELEASE REUPTAKE AND DEGRADATION | Genes involved in GABA synthesis, release, reuptake and degradation |
| 0.0 | 0.7 | REACTOME SYNTHESIS OF PIPS AT THE LATE ENDOSOME MEMBRANE | Genes involved in Synthesis of PIPs at the late endosome membrane |
| 0.0 | 0.5 | REACTOME ASSOCIATION OF LICENSING FACTORS WITH THE PRE REPLICATIVE COMPLEX | Genes involved in Association of licensing factors with the pre-replicative complex |
| 0.0 | 0.5 | REACTOME ACTIVATION OF NF KAPPAB IN B CELLS | Genes involved in Activation of NF-kappaB in B Cells |
| 0.0 | 1.2 | REACTOME G1 S SPECIFIC TRANSCRIPTION | Genes involved in G1/S-Specific Transcription |
| 0.0 | 1.7 | REACTOME CHOLESTEROL BIOSYNTHESIS | Genes involved in Cholesterol biosynthesis |
| 0.0 | 0.6 | REACTOME APOPTOSIS INDUCED DNA FRAGMENTATION | Genes involved in Apoptosis induced DNA fragmentation |
| 0.0 | 0.6 | REACTOME METABOLISM OF RNA | Genes involved in Metabolism of RNA |
| 0.0 | 0.9 | REACTOME CITRIC ACID CYCLE TCA CYCLE | Genes involved in Citric acid cycle (TCA cycle) |
| 0.0 | 0.8 | REACTOME GAP JUNCTION DEGRADATION | Genes involved in Gap junction degradation |
| 0.0 | 0.4 | REACTOME REGULATION OF IFNG SIGNALING | Genes involved in Regulation of IFNG signaling |
| 0.0 | 0.7 | REACTOME METABOLISM OF POLYAMINES | Genes involved in Metabolism of polyamines |
| 0.0 | 2.3 | REACTOME REGULATION OF BETA CELL DEVELOPMENT | Genes involved in Regulation of beta-cell development |
| 0.0 | 1.4 | REACTOME DEADENYLATION OF MRNA | Genes involved in Deadenylation of mRNA |
| 0.0 | 0.8 | REACTOME MRNA DECAY BY 5 TO 3 EXORIBONUCLEASE | Genes involved in mRNA Decay by 5' to 3' Exoribonuclease |
| 0.0 | 0.7 | REACTOME P2Y RECEPTORS | Genes involved in P2Y receptors |
| 0.0 | 0.6 | REACTOME EARLY PHASE OF HIV LIFE CYCLE | Genes involved in Early Phase of HIV Life Cycle |
| 0.0 | 0.2 | REACTOME NUCLEOTIDE LIKE PURINERGIC RECEPTORS | Genes involved in Nucleotide-like (purinergic) receptors |
| 0.0 | 2.8 | REACTOME NRAGE SIGNALS DEATH THROUGH JNK | Genes involved in NRAGE signals death through JNK |
| 0.0 | 0.9 | REACTOME CREB PHOSPHORYLATION THROUGH THE ACTIVATION OF CAMKII | Genes involved in CREB phosphorylation through the activation of CaMKII |
| 0.0 | 0.5 | REACTOME SYNTHESIS SECRETION AND DEACYLATION OF GHRELIN | Genes involved in Synthesis, Secretion, and Deacylation of Ghrelin |
| 0.0 | 0.4 | REACTOME NRIF SIGNALS CELL DEATH FROM THE NUCLEUS | Genes involved in NRIF signals cell death from the nucleus |
| 0.0 | 0.3 | REACTOME NEF MEDIATES DOWN MODULATION OF CELL SURFACE RECEPTORS BY RECRUITING THEM TO CLATHRIN ADAPTERS | Genes involved in Nef-mediates down modulation of cell surface receptors by recruiting them to clathrin adapters |
| 0.0 | 0.8 | REACTOME REGULATION OF AMPK ACTIVITY VIA LKB1 | Genes involved in Regulation of AMPK activity via LKB1 |
| 0.0 | 0.2 | REACTOME IL 6 SIGNALING | Genes involved in Interleukin-6 signaling |
| 0.0 | 0.9 | REACTOME REGULATION OF HYPOXIA INDUCIBLE FACTOR HIF BY OXYGEN | Genes involved in Regulation of Hypoxia-inducible Factor (HIF) by Oxygen |
| 0.0 | 0.7 | REACTOME A TETRASACCHARIDE LINKER SEQUENCE IS REQUIRED FOR GAG SYNTHESIS | Genes involved in A tetrasaccharide linker sequence is required for GAG synthesis |
| 0.0 | 0.9 | REACTOME GLUTATHIONE CONJUGATION | Genes involved in Glutathione conjugation |
| 0.0 | 0.7 | REACTOME PRE NOTCH PROCESSING IN GOLGI | Genes involved in Pre-NOTCH Processing in Golgi |
| 0.0 | 0.5 | REACTOME SIGNALING BY SCF KIT | Genes involved in Signaling by SCF-KIT |
| 0.0 | 0.3 | REACTOME PLATELET ADHESION TO EXPOSED COLLAGEN | Genes involved in Platelet Adhesion to exposed collagen |
| 0.0 | 0.3 | REACTOME HORMONE LIGAND BINDING RECEPTORS | Genes involved in Hormone ligand-binding receptors |
| 0.0 | 3.8 | REACTOME PEPTIDE CHAIN ELONGATION | Genes involved in Peptide chain elongation |
| 0.0 | 0.3 | REACTOME ETHANOL OXIDATION | Genes involved in Ethanol oxidation |
| 0.0 | 0.4 | REACTOME MITOCHONDRIAL FATTY ACID BETA OXIDATION | Genes involved in Mitochondrial Fatty Acid Beta-Oxidation |
| 0.0 | 0.4 | REACTOME PURINE RIBONUCLEOSIDE MONOPHOSPHATE BIOSYNTHESIS | Genes involved in Purine ribonucleoside monophosphate biosynthesis |
| 0.0 | 0.4 | REACTOME GLUTAMATE NEUROTRANSMITTER RELEASE CYCLE | Genes involved in Glutamate Neurotransmitter Release Cycle |
| 0.0 | 0.7 | REACTOME DEGRADATION OF THE EXTRACELLULAR MATRIX | Genes involved in Degradation of the extracellular matrix |
| 0.0 | 0.6 | REACTOME DOWNREGULATION OF TGF BETA RECEPTOR SIGNALING | Genes involved in Downregulation of TGF-beta receptor signaling |
| 0.0 | 0.5 | REACTOME REGULATION OF INSULIN LIKE GROWTH FACTOR IGF ACTIVITY BY INSULIN LIKE GROWTH FACTOR BINDING PROTEINS IGFBPS | Genes involved in Regulation of Insulin-like Growth Factor (IGF) Activity by Insulin-like Growth Factor Binding Proteins (IGFBPs) |
| 0.0 | 0.5 | REACTOME RNA POL II TRANSCRIPTION PRE INITIATION AND PROMOTER OPENING | Genes involved in RNA Polymerase II Transcription Pre-Initiation And Promoter Opening |
| 0.0 | 0.3 | REACTOME TRAFFICKING AND PROCESSING OF ENDOSOMAL TLR | Genes involved in Trafficking and processing of endosomal TLR |
| 0.0 | 2.6 | REACTOME TRANSCRIPTIONAL REGULATION OF WHITE ADIPOCYTE DIFFERENTIATION | Genes involved in Transcriptional Regulation of White Adipocyte Differentiation |
| 0.0 | 0.5 | REACTOME PURINE SALVAGE | Genes involved in Purine salvage |
| 0.0 | 0.2 | REACTOME UNBLOCKING OF NMDA RECEPTOR GLUTAMATE BINDING AND ACTIVATION | Genes involved in Unblocking of NMDA receptor, glutamate binding and activation |
| 0.0 | 0.2 | REACTOME HOMOLOGOUS RECOMBINATION REPAIR OF REPLICATION INDEPENDENT DOUBLE STRAND BREAKS | Genes involved in Homologous recombination repair of replication-independent double-strand breaks |
| 0.0 | 0.2 | REACTOME DEPOSITION OF NEW CENPA CONTAINING NUCLEOSOMES AT THE CENTROMERE | Genes involved in Deposition of New CENPA-containing Nucleosomes at the Centromere |
| 0.0 | 1.6 | REACTOME GOLGI ASSOCIATED VESICLE BIOGENESIS | Genes involved in Golgi Associated Vesicle Biogenesis |
| 0.0 | 0.7 | REACTOME SEMA4D INDUCED CELL MIGRATION AND GROWTH CONE COLLAPSE | Genes involved in Sema4D induced cell migration and growth-cone collapse |
| 0.0 | 1.4 | REACTOME NCAM1 INTERACTIONS | Genes involved in NCAM1 interactions |
| 0.0 | 0.2 | REACTOME PROSTANOID LIGAND RECEPTORS | Genes involved in Prostanoid ligand receptors |
| 0.0 | 0.2 | REACTOME G PROTEIN ACTIVATION | Genes involved in G-protein activation |
| 0.0 | 0.1 | REACTOME SEMA4D IN SEMAPHORIN SIGNALING | Genes involved in Sema4D in semaphorin signaling |
| 0.0 | 0.1 | REACTOME CROSS PRESENTATION OF SOLUBLE EXOGENOUS ANTIGENS ENDOSOMES | Genes involved in Cross-presentation of soluble exogenous antigens (endosomes) |
| 0.0 | 1.1 | REACTOME STRIATED MUSCLE CONTRACTION | Genes involved in Striated Muscle Contraction |
| 0.0 | 0.2 | REACTOME EGFR DOWNREGULATION | Genes involved in EGFR downregulation |
| 0.0 | 0.2 | REACTOME CREATION OF C4 AND C2 ACTIVATORS | Genes involved in Creation of C4 and C2 activators |
| 0.0 | 0.6 | REACTOME TRAFFICKING OF AMPA RECEPTORS | Genes involved in Trafficking of AMPA receptors |
| 0.0 | 0.2 | REACTOME REGULATION OF PYRUVATE DEHYDROGENASE PDH COMPLEX | Genes involved in Regulation of pyruvate dehydrogenase (PDH) complex |
| 0.0 | 0.3 | REACTOME NONSENSE MEDIATED DECAY ENHANCED BY THE EXON JUNCTION COMPLEX | Genes involved in Nonsense Mediated Decay Enhanced by the Exon Junction Complex |
| 0.0 | 0.3 | REACTOME PRESYNAPTIC NICOTINIC ACETYLCHOLINE RECEPTORS | Genes involved in Presynaptic nicotinic acetylcholine receptors |
| 0.0 | 0.2 | REACTOME EXTENSION OF TELOMERES | Genes involved in Extension of Telomeres |
| 0.0 | 0.2 | REACTOME SIGNALING BY FGFR1 FUSION MUTANTS | Genes involved in Signaling by FGFR1 fusion mutants |
| 0.0 | 0.1 | REACTOME SYNTHESIS OF BILE ACIDS AND BILE SALTS VIA 24 HYDROXYCHOLESTEROL | Genes involved in Synthesis of bile acids and bile salts via 24-hydroxycholesterol |
| 0.0 | 0.2 | REACTOME RECRUITMENT OF NUMA TO MITOTIC CENTROSOMES | Genes involved in Recruitment of NuMA to mitotic centrosomes |
| 0.0 | 0.2 | REACTOME SIGNALLING TO P38 VIA RIT AND RIN | Genes involved in Signalling to p38 via RIT and RIN |
| 0.0 | 0.2 | REACTOME G0 AND EARLY G1 | Genes involved in G0 and Early G1 |
| 0.0 | 0.2 | REACTOME BASE FREE SUGAR PHOSPHATE REMOVAL VIA THE SINGLE NUCLEOTIDE REPLACEMENT PATHWAY | Genes involved in Base-free sugar-phosphate removal via the single-nucleotide replacement pathway |
| 0.0 | 0.3 | REACTOME ADHERENS JUNCTIONS INTERACTIONS | Genes involved in Adherens junctions interactions |
| 0.0 | 4.5 | REACTOME GENERIC TRANSCRIPTION PATHWAY | Genes involved in Generic Transcription Pathway |