Project
Inflammatory response time course, HUVEC (Wada, 2009)
Navigation
Downloads
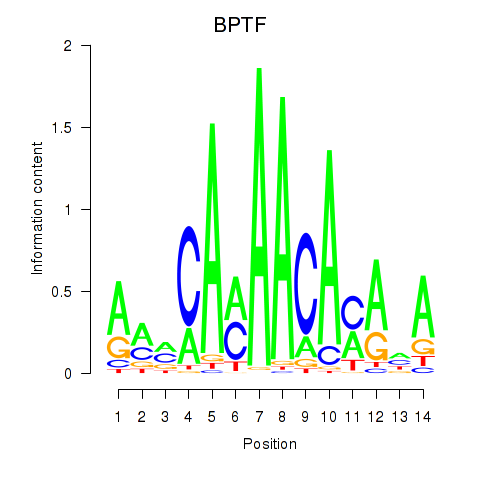
Results for BPTF
Z-value: 1.70
Motif logo
Transcription factors associated with BPTF
| Gene Symbol | Gene ID | Gene Info |
|---|---|---|
|
BPTF
|
ENSG00000171634.18 | BPTF |
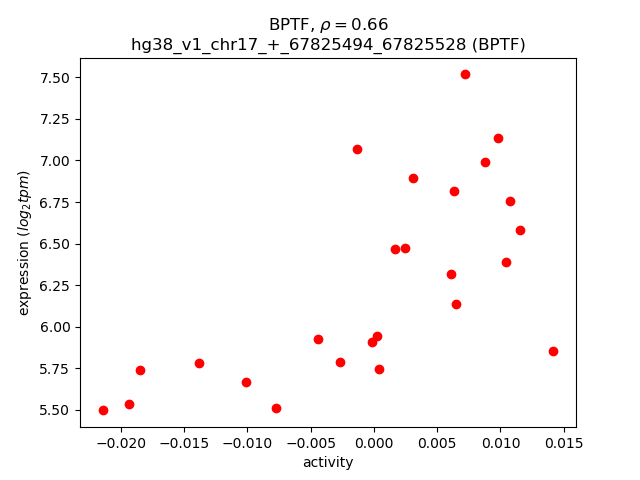
Activity-expression correlation:
| Gene | Promoter | Pearson corr. coef. | P-value | Plot |
|---|---|---|---|---|
| BPTF | hg38_v1_chr17_+_67825494_67825528 | 0.66 | 3.1e-04 | Click! |
Activity profile of BPTF motif
Sorted Z-values of BPTF motif
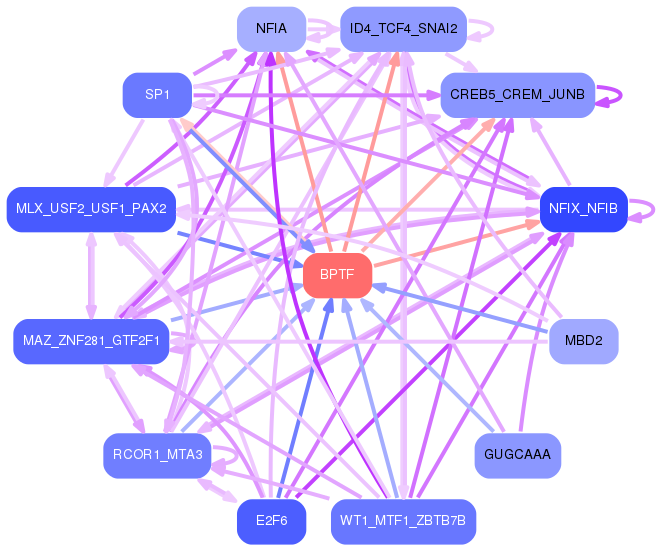
Network of associatons between targets according to the STRING database.

First level regulatory network of BPTF
| Promoter | Score | Transcript | Gene | Gene Info |
|---|---|---|---|---|
| chr4_+_155666718 | 9.46 |
ENST00000621234.4
ENST00000511108.5 |
GUCY1A1
|
guanylate cyclase 1 soluble subunit alpha 1 |
| chr7_-_150632333 | 8.09 |
ENST00000493969.2
ENST00000328902.9 |
GIMAP6
|
GTPase, IMAP family member 6 |
| chr4_-_185956652 | 8.03 |
ENST00000355634.9
|
SORBS2
|
sorbin and SH3 domain containing 2 |
| chr9_+_6215786 | 7.65 |
ENST00000417746.6
ENST00000682010.1 |
IL33
|
interleukin 33 |
| chr4_+_155666963 | 7.21 |
ENST00000455639.6
|
GUCY1A1
|
guanylate cyclase 1 soluble subunit alpha 1 |
| chr4_+_155666827 | 6.11 |
ENST00000511507.5
ENST00000506455.6 |
GUCY1A1
|
guanylate cyclase 1 soluble subunit alpha 1 |
| chr4_+_41612892 | 6.05 |
ENST00000509454.5
ENST00000396595.7 ENST00000381753.8 |
LIMCH1
|
LIM and calponin homology domains 1 |
| chr4_+_41613476 | 4.93 |
ENST00000508466.1
|
LIMCH1
|
LIM and calponin homology domains 1 |
| chr4_-_185775271 | 4.81 |
ENST00000430503.5
ENST00000319454.10 ENST00000450341.5 |
SORBS2
|
sorbin and SH3 domain containing 2 |
| chr4_-_158159657 | 4.71 |
ENST00000590648.5
|
GASK1B
|
golgi associated kinase 1B |
| chr4_+_125314918 | 4.20 |
ENST00000674496.2
ENST00000394329.9 |
FAT4
|
FAT atypical cadherin 4 |
| chr12_+_20368495 | 4.08 |
ENST00000359062.4
|
PDE3A
|
phosphodiesterase 3A |
| chr4_+_41612702 | 3.71 |
ENST00000509277.5
|
LIMCH1
|
LIM and calponin homology domains 1 |
| chr2_-_189580773 | 3.37 |
ENST00000261024.7
|
SLC40A1
|
solute carrier family 40 member 1 |
| chr3_-_149333619 | 3.34 |
ENST00000296059.7
|
TM4SF18
|
transmembrane 4 L six family member 18 |
| chr4_+_155667096 | 3.33 |
ENST00000393832.7
|
GUCY1A1
|
guanylate cyclase 1 soluble subunit alpha 1 |
| chr9_+_2158487 | 3.29 |
ENST00000634706.1
ENST00000634338.1 ENST00000635688.1 ENST00000634435.1 |
SMARCA2
|
SWI/SNF related, matrix associated, actin dependent regulator of chromatin, subfamily a, member 2 |
| chr2_+_172928165 | 3.27 |
ENST00000535187.5
|
RAPGEF4
|
Rap guanine nucleotide exchange factor 4 |
| chr8_+_96584920 | 3.25 |
ENST00000521590.5
|
SDC2
|
syndecan 2 |
| chr20_+_36091409 | 3.23 |
ENST00000202028.9
|
EPB41L1
|
erythrocyte membrane protein band 4.1 like 1 |
| chr1_+_153774210 | 3.15 |
ENST00000271857.6
|
SLC27A3
|
solute carrier family 27 member 3 |
| chr8_-_28083920 | 3.14 |
ENST00000413272.7
|
NUGGC
|
nuclear GTPase, germinal center associated |
| chr16_-_30021288 | 3.06 |
ENST00000574405.5
|
DOC2A
|
double C2 domain alpha |
| chr18_-_55587335 | 3.04 |
ENST00000638154.3
|
TCF4
|
transcription factor 4 |
| chr1_+_61203496 | 3.01 |
ENST00000663597.1
|
NFIA
|
nuclear factor I A |
| chrX_+_71910818 | 2.98 |
ENST00000633930.1
|
NHSL2
|
NHS like 2 |
| chr18_+_44680093 | 2.94 |
ENST00000426838.8
ENST00000677068.1 |
SETBP1
|
SET binding protein 1 |
| chr4_-_185775890 | 2.94 |
ENST00000437304.6
|
SORBS2
|
sorbin and SH3 domain containing 2 |
| chr4_+_41538143 | 2.93 |
ENST00000503057.6
ENST00000511496.5 |
LIMCH1
|
LIM and calponin homology domains 1 |
| chr1_+_84144260 | 2.91 |
ENST00000370685.7
|
PRKACB
|
protein kinase cAMP-activated catalytic subunit beta |
| chr9_+_2157647 | 2.85 |
ENST00000452193.5
ENST00000324954.10 |
SMARCA2
|
SWI/SNF related, matrix associated, actin dependent regulator of chromatin, subfamily a, member 2 |
| chr15_+_66293217 | 2.77 |
ENST00000319194.9
ENST00000525134.6 |
DIS3L
|
DIS3 like exosome 3'-5' exoribonuclease |
| chrX_-_63351308 | 2.75 |
ENST00000374884.3
|
SPIN4
|
spindlin family member 4 |
| chr9_-_131270493 | 2.75 |
ENST00000372269.7
ENST00000464831.1 |
FAM78A
|
family with sequence similarity 78 member A |
| chr2_+_200440649 | 2.74 |
ENST00000366118.2
|
SPATS2L
|
spermatogenesis associated serine rich 2 like |
| chr4_+_26584064 | 2.73 |
ENST00000264866.9
ENST00000505206.5 ENST00000511789.5 |
TBC1D19
|
TBC1 domain family member 19 |
| chr9_+_2158239 | 2.73 |
ENST00000635133.1
ENST00000634931.1 ENST00000423555.6 ENST00000382185.6 ENST00000302401.8 ENST00000382183.6 ENST00000417599.6 ENST00000382186.6 ENST00000635530.1 ENST00000635388.1 |
SMARCA2
|
SWI/SNF related, matrix associated, actin dependent regulator of chromatin, subfamily a, member 2 |
| chr11_-_33869816 | 2.69 |
ENST00000395833.7
|
LMO2
|
LIM domain only 2 |
| chr1_-_44986568 | 2.62 |
ENST00000372183.7
ENST00000360403.7 ENST00000620860.4 |
EIF2B3
|
eukaryotic translation initiation factor 2B subunit gamma |
| chr3_-_149333407 | 2.58 |
ENST00000470080.5
|
TM4SF18
|
transmembrane 4 L six family member 18 |
| chr4_-_89838289 | 2.55 |
ENST00000336904.7
|
SNCA
|
synuclein alpha |
| chr9_-_13279407 | 2.54 |
ENST00000546205.5
|
MPDZ
|
multiple PDZ domain crumbs cell polarity complex component |
| chr9_-_14313642 | 2.53 |
ENST00000637742.1
|
NFIB
|
nuclear factor I B |
| chr2_+_33134620 | 2.50 |
ENST00000402934.5
ENST00000404525.5 ENST00000407925.5 |
LTBP1
|
latent transforming growth factor beta binding protein 1 |
| chr2_+_33134579 | 2.44 |
ENST00000418533.6
|
LTBP1
|
latent transforming growth factor beta binding protein 1 |
| chr2_-_237590660 | 2.41 |
ENST00000409576.1
|
RAB17
|
RAB17, member RAS oncogene family |
| chr7_-_122098831 | 2.30 |
ENST00000681213.1
ENST00000679419.1 |
AASS
|
aminoadipate-semialdehyde synthase |
| chr3_-_122793772 | 2.28 |
ENST00000306103.3
|
HSPBAP1
|
HSPB1 associated protein 1 |
| chr13_+_31846713 | 2.23 |
ENST00000645780.1
|
FRY
|
FRY microtubule binding protein |
| chr17_-_68955332 | 2.23 |
ENST00000269080.6
ENST00000615593.4 ENST00000586539.6 ENST00000430352.6 |
ABCA8
|
ATP binding cassette subfamily A member 8 |
| chr4_-_69760610 | 2.21 |
ENST00000310613.8
|
SULT1B1
|
sulfotransferase family 1B member 1 |
| chr5_+_139648338 | 2.21 |
ENST00000302517.8
|
CXXC5
|
CXXC finger protein 5 |
| chr1_+_60865259 | 2.17 |
ENST00000371191.5
|
NFIA
|
nuclear factor I A |
| chr17_-_445939 | 2.15 |
ENST00000329099.4
|
RFLNB
|
refilin B |
| chr12_-_94650506 | 2.15 |
ENST00000261226.9
|
TMCC3
|
transmembrane and coiled-coil domain family 3 |
| chr2_+_108607140 | 2.13 |
ENST00000410093.5
|
LIMS1
|
LIM zinc finger domain containing 1 |
| chr13_+_31945826 | 2.11 |
ENST00000647500.1
|
FRY
|
FRY microtubule binding protein |
| chr18_-_55422306 | 2.11 |
ENST00000566777.5
ENST00000626584.2 |
TCF4
|
transcription factor 4 |
| chr6_-_73452124 | 2.11 |
ENST00000680833.1
|
CGAS
|
cyclic GMP-AMP synthase |
| chr19_-_12881460 | 2.09 |
ENST00000592506.1
|
DNASE2
|
deoxyribonuclease 2, lysosomal |
| chr17_-_64020566 | 2.07 |
ENST00000578313.5
ENST00000584084.1 ENST00000579687.5 ENST00000578379.5 ENST00000578892.5 ENST00000579788.6 ENST00000412356.5 ENST00000418105.5 |
ICAM2
|
intercellular adhesion molecule 2 |
| chr12_-_5945252 | 2.07 |
ENST00000546188.5
ENST00000682330.1 |
ANO2
|
anoctamin 2 |
| chr12_-_5945216 | 2.04 |
ENST00000650848.1
|
ANO2
|
anoctamin 2 |
| chr6_+_144583198 | 2.03 |
ENST00000367526.8
|
UTRN
|
utrophin |
| chr18_-_25352116 | 2.01 |
ENST00000584787.5
ENST00000538137.6 ENST00000361524.8 |
ZNF521
|
zinc finger protein 521 |
| chr2_-_187448244 | 1.98 |
ENST00000392370.8
ENST00000410068.5 ENST00000447403.5 ENST00000410102.5 |
CALCRL
|
calcitonin receptor like receptor |
| chr18_-_55322215 | 1.98 |
ENST00000457482.7
|
TCF4
|
transcription factor 4 |
| chr6_-_30744537 | 1.95 |
ENST00000259874.6
ENST00000376377.2 |
IER3
|
immediate early response 3 |
| chr10_-_114526804 | 1.94 |
ENST00000369266.7
ENST00000369253.6 |
ABLIM1
|
actin binding LIM protein 1 |
| chr7_+_102912983 | 1.92 |
ENST00000339431.9
ENST00000249377.4 |
LRRC17
|
leucine rich repeat containing 17 |
| chr2_+_201116143 | 1.91 |
ENST00000443227.5
ENST00000309955.8 ENST00000341222.10 ENST00000341582.10 |
CFLAR
|
CASP8 and FADD like apoptosis regulator |
| chr10_+_35195124 | 1.90 |
ENST00000487763.5
ENST00000473940.5 ENST00000488328.5 ENST00000356917.9 |
CREM
|
cAMP responsive element modulator |
| chr8_-_98117110 | 1.89 |
ENST00000520507.5
|
RIDA
|
reactive intermediate imine deaminase A homolog |
| chr9_-_39288138 | 1.87 |
ENST00000297668.10
|
CNTNAP3
|
contactin associated protein family member 3 |
| chr22_-_28712136 | 1.85 |
ENST00000464581.6
|
CHEK2
|
checkpoint kinase 2 |
| chr17_+_19648915 | 1.82 |
ENST00000672567.1
ENST00000672709.1 |
ALDH3A2
|
aldehyde dehydrogenase 3 family member A2 |
| chr9_-_14321948 | 1.79 |
ENST00000635877.1
ENST00000636432.1 ENST00000646622.1 |
NFIB
|
nuclear factor I B |
| chr21_-_26573211 | 1.76 |
ENST00000299340.9
ENST00000652641.2 |
CYYR1
|
cysteine and tyrosine rich 1 |
| chr17_-_64006880 | 1.75 |
ENST00000449662.6
|
ICAM2
|
intercellular adhesion molecule 2 |
| chr5_+_73813518 | 1.74 |
ENST00000296799.8
|
ARHGEF28
|
Rho guanine nucleotide exchange factor 28 |
| chr4_-_88231322 | 1.74 |
ENST00000515655.5
|
ABCG2
|
ATP binding cassette subfamily G member 2 (Junior blood group) |
| chr9_-_14180779 | 1.74 |
ENST00000380924.1
ENST00000543693.5 |
NFIB
|
nuclear factor I B |
| chr18_-_55321640 | 1.73 |
ENST00000637169.2
|
TCF4
|
transcription factor 4 |
| chr15_+_55319202 | 1.73 |
ENST00000164305.10
ENST00000566999.5 ENST00000539642.5 |
PIGB
|
phosphatidylinositol glycan anchor biosynthesis class B |
| chr18_-_55422492 | 1.71 |
ENST00000561992.5
ENST00000630712.2 |
TCF4
|
transcription factor 4 |
| chr10_-_33335074 | 1.70 |
ENST00000432372.6
|
NRP1
|
neuropilin 1 |
| chr18_+_22933819 | 1.70 |
ENST00000399722.6
ENST00000399725.6 ENST00000399721.6 |
RBBP8
|
RB binding protein 8, endonuclease |
| chr9_-_16870702 | 1.69 |
ENST00000380667.6
ENST00000545497.5 ENST00000486514.5 |
BNC2
|
basonuclin 2 |
| chr9_-_14313843 | 1.69 |
ENST00000636063.1
ENST00000380921.3 ENST00000622520.1 ENST00000380959.7 |
NFIB
|
nuclear factor I B |
| chr20_-_17558811 | 1.67 |
ENST00000536626.7
ENST00000377868.6 |
BFSP1
|
beaded filament structural protein 1 |
| chr14_-_54488940 | 1.66 |
ENST00000628554.2
ENST00000358056.8 |
GMFB
|
glia maturation factor beta |
| chr6_-_28336375 | 1.65 |
ENST00000611469.4
ENST00000435857.5 |
ZSCAN31
|
zinc finger and SCAN domain containing 31 |
| chr22_-_28711931 | 1.65 |
ENST00000434810.5
ENST00000456369.5 |
CHEK2
|
checkpoint kinase 2 |
| chr10_-_33334898 | 1.64 |
ENST00000395995.5
|
NRP1
|
neuropilin 1 |
| chr7_-_120858066 | 1.64 |
ENST00000222747.8
|
TSPAN12
|
tetraspanin 12 |
| chr8_-_17722217 | 1.64 |
ENST00000381861.7
|
MTUS1
|
microtubule associated scaffold protein 1 |
| chr14_-_54489003 | 1.63 |
ENST00000554908.5
ENST00000616146.4 |
GMFB
|
glia maturation factor beta |
| chr8_-_92103217 | 1.60 |
ENST00000615601.4
ENST00000523629.5 |
RUNX1T1
|
RUNX1 partner transcriptional co-repressor 1 |
| chr5_+_139648914 | 1.60 |
ENST00000502336.5
ENST00000520967.1 ENST00000511048.1 |
CXXC5
|
CXXC finger protein 5 |
| chr7_+_74658004 | 1.59 |
ENST00000443166.5
|
GTF2I
|
general transcription factor IIi |
| chr8_+_30095400 | 1.57 |
ENST00000321250.13
ENST00000518001.1 ENST00000520682.5 ENST00000442880.6 ENST00000523116.5 |
LEPROTL1
|
leptin receptor overlapping transcript like 1 |
| chr16_-_49856105 | 1.57 |
ENST00000563137.7
|
ZNF423
|
zinc finger protein 423 |
| chr16_-_28539004 | 1.57 |
ENST00000395641.2
|
NUPR1
|
nuclear protein 1, transcriptional regulator |
| chr12_+_56521798 | 1.56 |
ENST00000262031.10
|
RBMS2
|
RNA binding motif single stranded interacting protein 2 |
| chr18_+_44680875 | 1.56 |
ENST00000649279.2
ENST00000677699.1 |
SETBP1
|
SET binding protein 1 |
| chr3_-_27722699 | 1.56 |
ENST00000461503.2
|
EOMES
|
eomesodermin |
| chr8_-_3409528 | 1.56 |
ENST00000335551.11
|
CSMD1
|
CUB and Sushi multiple domains 1 |
| chr8_-_18084925 | 1.55 |
ENST00000637792.1
ENST00000637991.1 ENST00000636537.1 ENST00000636455.1 ENST00000314146.10 ENST00000381733.9 |
ASAH1
|
N-acylsphingosine amidohydrolase 1 |
| chr12_+_10212867 | 1.55 |
ENST00000545047.5
ENST00000266458.10 ENST00000629504.1 ENST00000543602.5 ENST00000545887.1 |
GABARAPL1
|
GABA type A receptor associated protein like 1 |
| chr9_+_2159850 | 1.52 |
ENST00000416751.2
|
SMARCA2
|
SWI/SNF related, matrix associated, actin dependent regulator of chromatin, subfamily a, member 2 |
| chr13_-_19782923 | 1.52 |
ENST00000338910.9
|
PSPC1
|
paraspeckle component 1 |
| chr13_-_19782970 | 1.51 |
ENST00000427943.1
ENST00000619300.4 |
PSPC1
|
paraspeckle component 1 |
| chr9_+_113505256 | 1.51 |
ENST00000374136.5
|
RGS3
|
regulator of G protein signaling 3 |
| chr4_-_89836963 | 1.49 |
ENST00000420646.6
ENST00000673718.1 |
SNCA
|
synuclein alpha |
| chrX_-_2968236 | 1.48 |
ENST00000684117.1
ENST00000672761.1 ENST00000672027.1 ENST00000672606.1 ENST00000673032.1 ENST00000540563.6 |
ARSL
|
arylsulfatase L |
| chr17_+_19648723 | 1.46 |
ENST00000672357.1
ENST00000584332.6 ENST00000176643.11 ENST00000339618.8 ENST00000579855.5 ENST00000671878.1 ENST00000395575.7 |
ALDH3A2
|
aldehyde dehydrogenase 3 family member A2 |
| chr4_+_169660062 | 1.44 |
ENST00000507875.5
ENST00000613795.4 |
CLCN3
|
chloride voltage-gated channel 3 |
| chr20_-_32657362 | 1.44 |
ENST00000360785.6
|
C20orf203
|
chromosome 20 open reading frame 203 |
| chr1_+_43300971 | 1.44 |
ENST00000372476.8
ENST00000538015.1 |
TIE1
|
tyrosine kinase with immunoglobulin like and EGF like domains 1 |
| chr2_+_172860038 | 1.43 |
ENST00000538974.5
ENST00000540783.5 |
RAPGEF4
|
Rap guanine nucleotide exchange factor 4 |
| chr10_+_80408503 | 1.43 |
ENST00000606162.6
|
PRXL2A
|
peroxiredoxin like 2A |
| chr4_+_77158418 | 1.42 |
ENST00000509972.1
|
CCNG2
|
cyclin G2 |
| chr4_+_143381939 | 1.40 |
ENST00000505913.5
|
GAB1
|
GRB2 associated binding protein 1 |
| chr7_+_150737382 | 1.40 |
ENST00000358647.5
|
GIMAP5
|
GTPase, IMAP family member 5 |
| chr19_+_17406099 | 1.38 |
ENST00000634942.2
ENST00000634568.1 ENST00000600514.5 |
BISPR
MVB12A
|
BST2 interferon stimulated positive regulator multivesicular body subunit 12A |
| chr4_-_6070162 | 1.38 |
ENST00000636216.1
ENST00000637373.2 |
ENSG00000284684.1
JAKMIP1
|
novel protein janus kinase and microtubule interacting protein 1 |
| chr18_-_55321986 | 1.36 |
ENST00000570287.6
|
TCF4
|
transcription factor 4 |
| chr19_+_53044730 | 1.36 |
ENST00000601417.3
|
ERVV-2
|
endogenous retrovirus group V member 2, envelope |
| chr14_-_21383989 | 1.35 |
ENST00000216297.7
|
SUPT16H
|
SPT16 homolog, facilitates chromatin remodeling subunit |
| chr7_-_38631356 | 1.35 |
ENST00000356264.7
ENST00000325590.9 |
AMPH
|
amphiphysin |
| chr18_-_55635948 | 1.34 |
ENST00000565124.4
ENST00000398339.5 |
TCF4
|
transcription factor 4 |
| chr2_-_182427014 | 1.34 |
ENST00000409365.5
ENST00000351439.9 |
PDE1A
|
phosphodiesterase 1A |
| chr10_-_33334625 | 1.34 |
ENST00000374875.5
ENST00000374822.8 ENST00000374867.7 |
NRP1
|
neuropilin 1 |
| chr4_-_89837106 | 1.32 |
ENST00000394986.5
ENST00000394991.8 ENST00000506244.5 ENST00000394989.6 ENST00000673902.1 ENST00000674129.1 |
SNCA
|
synuclein alpha |
| chr17_+_68525795 | 1.32 |
ENST00000592800.5
|
PRKAR1A
|
protein kinase cAMP-dependent type I regulatory subunit alpha |
| chr19_-_49036885 | 1.31 |
ENST00000604577.1
ENST00000591656.1 ENST00000301407.8 ENST00000601167.1 |
ENSG00000267335.2
CGB1
|
novel protein chorionic gonadotropin subunit beta 1 |
| chr12_+_50925007 | 1.31 |
ENST00000332160.5
|
METTL7A
|
methyltransferase like 7A |
| chr8_-_98117155 | 1.31 |
ENST00000254878.8
ENST00000521560.1 |
RIDA
|
reactive intermediate imine deaminase A homolog |
| chr19_+_57769646 | 1.31 |
ENST00000391702.3
ENST00000598885.5 ENST00000598183.1 ENST00000599802.1 ENST00000396154.7 ENST00000396150.4 |
ZNF586
|
zinc finger protein 586 |
| chr17_-_64020544 | 1.29 |
ENST00000583366.5
|
ICAM2
|
intercellular adhesion molecule 2 |
| chr12_-_42483604 | 1.29 |
ENST00000640132.1
|
PRICKLE1
|
prickle planar cell polarity protein 1 |
| chr3_+_194136138 | 1.29 |
ENST00000232424.4
|
HES1
|
hes family bHLH transcription factor 1 |
| chr19_+_39406831 | 1.28 |
ENST00000597629.3
ENST00000594442.2 ENST00000594045.2 |
ZFP36
|
ZFP36 ring finger protein |
| chr17_+_19648792 | 1.28 |
ENST00000630662.2
|
ALDH3A2
|
aldehyde dehydrogenase 3 family member A2 |
| chr1_-_145910066 | 1.28 |
ENST00000539363.2
|
ITGA10
|
integrin subunit alpha 10 |
| chr12_-_42589592 | 1.28 |
ENST00000552108.6
ENST00000547113.1 ENST00000640646.1 |
PRICKLE1
|
prickle planar cell polarity protein 1 |
| chr4_-_87391149 | 1.27 |
ENST00000507286.1
ENST00000358290.9 |
HSD17B11
|
hydroxysteroid 17-beta dehydrogenase 11 |
| chr17_+_69502397 | 1.27 |
ENST00000613873.4
ENST00000589647.5 |
MAP2K6
|
mitogen-activated protein kinase kinase 6 |
| chr19_-_35900532 | 1.27 |
ENST00000396901.5
ENST00000641389.2 ENST00000585925.7 |
NFKBID
|
NFKB inhibitor delta |
| chr13_+_102656933 | 1.27 |
ENST00000650757.1
|
TPP2
|
tripeptidyl peptidase 2 |
| chr20_-_5010284 | 1.27 |
ENST00000379333.5
|
SLC23A2
|
solute carrier family 23 member 2 |
| chr3_+_32106612 | 1.26 |
ENST00000282541.10
ENST00000425459.5 ENST00000431009.1 |
GPD1L
|
glycerol-3-phosphate dehydrogenase 1 like |
| chr7_+_80135694 | 1.26 |
ENST00000457358.7
|
GNAI1
|
G protein subunit alpha i1 |
| chr18_-_55588535 | 1.25 |
ENST00000566286.5
ENST00000566279.5 ENST00000626595.2 ENST00000564999.5 ENST00000616053.4 ENST00000356073.8 |
TCF4
|
transcription factor 4 |
| chr18_-_55586092 | 1.25 |
ENST00000563888.6
ENST00000540999.5 ENST00000627685.2 |
TCF4
|
transcription factor 4 |
| chr7_+_74657745 | 1.25 |
ENST00000614986.4
ENST00000620879.4 ENST00000621734.4 |
GTF2I
|
general transcription factor IIi |
| chr5_-_10249876 | 1.24 |
ENST00000511437.6
ENST00000280330.12 ENST00000510047.5 |
ATPSCKMT
|
ATP synthase c subunit lysine N-methyltransferase |
| chr7_+_140404034 | 1.24 |
ENST00000537763.6
|
RAB19
|
RAB19, member RAS oncogene family |
| chr16_+_67570741 | 1.24 |
ENST00000644753.1
ENST00000642819.1 ENST00000645306.1 |
CTCF
|
CCCTC-binding factor |
| chr2_+_172821575 | 1.23 |
ENST00000397087.7
|
RAPGEF4
|
Rap guanine nucleotide exchange factor 4 |
| chr13_-_44437214 | 1.23 |
ENST00000622051.1
|
TSC22D1
|
TSC22 domain family member 1 |
| chr3_+_152300135 | 1.23 |
ENST00000465907.6
ENST00000492948.5 ENST00000485509.5 ENST00000464596.5 |
MBNL1
|
muscleblind like splicing regulator 1 |
| chr17_+_32928126 | 1.23 |
ENST00000579849.6
ENST00000578289.5 ENST00000439138.5 |
TMEM98
|
transmembrane protein 98 |
| chr6_-_132798587 | 1.23 |
ENST00000275227.9
|
SLC18B1
|
solute carrier family 18 member B1 |
| chr22_+_19760714 | 1.23 |
ENST00000649276.2
|
TBX1
|
T-box transcription factor 1 |
| chr19_-_18884219 | 1.23 |
ENST00000596048.1
|
CERS1
|
ceramide synthase 1 |
| chr5_-_111756245 | 1.23 |
ENST00000447165.6
|
NREP
|
neuronal regeneration related protein |
| chr5_+_74715503 | 1.21 |
ENST00000513336.5
|
HEXB
|
hexosaminidase subunit beta |
| chr2_+_48530132 | 1.20 |
ENST00000404752.6
ENST00000406226.1 |
STON1
|
stonin 1 |
| chr11_+_95089804 | 1.20 |
ENST00000278505.5
|
ENDOD1
|
endonuclease domain containing 1 |
| chr1_-_16437190 | 1.20 |
ENST00000540400.1
|
SPATA21
|
spermatogenesis associated 21 |
| chr15_+_96333111 | 1.19 |
ENST00000453270.2
|
NR2F2
|
nuclear receptor subfamily 2 group F member 2 |
| chr12_-_85836372 | 1.19 |
ENST00000361228.5
|
RASSF9
|
Ras association domain family member 9 |
| chrX_-_100636799 | 1.19 |
ENST00000373020.9
|
TSPAN6
|
tetraspanin 6 |
| chr16_-_28538951 | 1.19 |
ENST00000324873.8
|
NUPR1
|
nuclear protein 1, transcriptional regulator |
| chr3_+_141386862 | 1.19 |
ENST00000513258.5
|
ZBTB38
|
zinc finger and BTB domain containing 38 |
| chr2_+_178284907 | 1.18 |
ENST00000409631.5
|
OSBPL6
|
oxysterol binding protein like 6 |
| chr4_+_89901979 | 1.18 |
ENST00000508372.1
|
MMRN1
|
multimerin 1 |
| chr11_-_83034195 | 1.18 |
ENST00000531021.5
|
RAB30
|
RAB30, member RAS oncogene family |
| chr2_-_151261839 | 1.18 |
ENST00000331426.6
|
RBM43
|
RNA binding motif protein 43 |
| chr7_+_74657695 | 1.17 |
ENST00000573035.6
|
GTF2I
|
general transcription factor IIi |
| chr9_-_109013483 | 1.17 |
ENST00000325551.9
ENST00000374593.4 ENST00000374595.8 |
CTNNAL1
|
catenin alpha like 1 |
| chr19_-_4558417 | 1.17 |
ENST00000586965.1
|
SEMA6B
|
semaphorin 6B |
| chr11_+_64230278 | 1.16 |
ENST00000628077.2
ENST00000321685.7 |
DNAJC4
|
DnaJ heat shock protein family (Hsp40) member C4 |
| chr14_+_37197988 | 1.16 |
ENST00000539062.6
|
MIPOL1
|
mirror-image polydactyly 1 |
| chr1_-_145910031 | 1.16 |
ENST00000369304.8
|
ITGA10
|
integrin subunit alpha 10 |
| chr3_-_15797930 | 1.16 |
ENST00000683139.1
|
ANKRD28
|
ankyrin repeat domain 28 |
| chr21_-_38661694 | 1.15 |
ENST00000417133.6
ENST00000398910.5 ENST00000442448.5 ENST00000429727.6 |
ERG
|
ETS transcription factor ERG |
| chr9_+_27109393 | 1.15 |
ENST00000406359.8
|
TEK
|
TEK receptor tyrosine kinase |
| chr1_+_65992389 | 1.15 |
ENST00000423207.6
|
PDE4B
|
phosphodiesterase 4B |
| chr1_-_8817633 | 1.14 |
ENST00000400908.7
|
RERE
|
arginine-glutamic acid dipeptide repeats |
| chr14_+_37197921 | 1.14 |
ENST00000684589.1
ENST00000327441.11 |
MIPOL1
|
mirror-image polydactyly 1 |
| chr11_+_64230534 | 1.14 |
ENST00000355040.8
|
DNAJC4
|
DnaJ heat shock protein family (Hsp40) member C4 |
| chr10_+_95756150 | 1.13 |
ENST00000371205.5
|
ENTPD1
|
ectonucleoside triphosphate diphosphohydrolase 1 |
| chr11_+_62337424 | 1.13 |
ENST00000415229.6
ENST00000301776.9 ENST00000628829.2 ENST00000534571.5 ENST00000526096.2 |
ASRGL1
|
asparaginase and isoaspartyl peptidase 1 |
| chr21_+_44573724 | 1.13 |
ENST00000622352.3
ENST00000400374.4 ENST00000616689.2 |
KRTAP10-4
|
keratin associated protein 10-4 |
| chr14_-_45253161 | 1.12 |
ENST00000451174.1
ENST00000310806.9 |
MIS18BP1
|
MIS18 binding protein 1 |
| chr6_-_36757380 | 1.11 |
ENST00000393189.2
|
CPNE5
|
copine 5 |
| chr6_-_46954922 | 1.11 |
ENST00000265417.7
|
ADGRF5
|
adhesion G protein-coupled receptor F5 |
| chr16_+_8712943 | 1.10 |
ENST00000561870.5
ENST00000396600.6 |
ABAT
|
4-aminobutyrate aminotransferase |
Gene Ontology Analysis
Gene overrepresentation in biological process category:
| Log-likelihood per target | Total log-likelihood | Term | Description |
|---|---|---|---|
| 1.4 | 8.4 | GO:0061518 | macrophage proliferation(GO:0061517) microglial cell proliferation(GO:0061518) |
| 1.2 | 4.8 | GO:1904835 | vestibulocochlear nerve structural organization(GO:0021649) positive regulation of cytokine activity(GO:0060301) ganglion morphogenesis(GO:0061552) VEGF-activated neuropilin signaling pathway involved in axon guidance(GO:1902378) dorsal root ganglion morphogenesis(GO:1904835) otic placode development(GO:1905040) |
| 1.2 | 3.5 | GO:0072428 | signal transduction involved in intra-S DNA damage checkpoint(GO:0072428) response to bisphenol A(GO:1903925) cellular response to bisphenol A(GO:1903926) |
| 1.1 | 4.6 | GO:1903173 | phytol metabolic process(GO:0033306) fatty alcohol metabolic process(GO:1903173) |
| 1.1 | 4.3 | GO:1904428 | negative regulation of tubulin deacetylation(GO:1904428) |
| 1.1 | 3.2 | GO:0034395 | regulation of transcription from RNA polymerase II promoter in response to iron(GO:0034395) |
| 1.1 | 4.2 | GO:0072137 | condensed mesenchymal cell proliferation(GO:0072137) |
| 0.9 | 5.4 | GO:0051585 | negative regulation of dopamine uptake involved in synaptic transmission(GO:0051585) norepinephrine uptake(GO:0051620) regulation of norepinephrine uptake(GO:0051621) negative regulation of norepinephrine uptake(GO:0051622) negative regulation of catecholamine uptake involved in synaptic transmission(GO:0051945) regulation of glutathione peroxidase activity(GO:1903282) positive regulation of glutathione peroxidase activity(GO:1903284) positive regulation of hydrogen peroxide catabolic process(GO:1903285) positive regulation of peroxidase activity(GO:2000470) |
| 0.8 | 4.2 | GO:0051892 | negative regulation of cardioblast differentiation(GO:0051892) regulation of cardiac muscle cell myoblast differentiation(GO:2000690) negative regulation of cardiac muscle cell myoblast differentiation(GO:2000691) |
| 0.8 | 2.4 | GO:0002415 | immunoglobulin transcytosis in epithelial cells mediated by polymeric immunoglobulin receptor(GO:0002415) |
| 0.8 | 4.0 | GO:0014886 | transition between slow and fast fiber(GO:0014886) |
| 0.8 | 2.3 | GO:0009085 | lysine biosynthetic process(GO:0009085) lysine biosynthetic process via aminoadipic acid(GO:0019878) |
| 0.7 | 2.1 | GO:0061182 | negative regulation of chondrocyte development(GO:0061182) |
| 0.7 | 7.7 | GO:2000795 | negative regulation of epithelial cell proliferation involved in lung morphogenesis(GO:2000795) |
| 0.6 | 1.9 | GO:0015938 | coenzyme A catabolic process(GO:0015938) nucleoside bisphosphate catabolic process(GO:0033869) ribonucleoside bisphosphate catabolic process(GO:0034031) purine nucleoside bisphosphate catabolic process(GO:0034034) |
| 0.6 | 4.9 | GO:0035583 | sequestering of TGFbeta in extracellular matrix(GO:0035583) |
| 0.6 | 4.1 | GO:0060282 | positive regulation of oocyte development(GO:0060282) |
| 0.5 | 3.2 | GO:0008218 | bioluminescence(GO:0008218) |
| 0.5 | 1.6 | GO:0002302 | CD8-positive, alpha-beta T cell differentiation involved in immune response(GO:0002302) |
| 0.5 | 1.6 | GO:0010520 | regulation of reciprocal meiotic recombination(GO:0010520) |
| 0.5 | 1.9 | GO:0009956 | radial pattern formation(GO:0009956) |
| 0.5 | 1.4 | GO:0072709 | cellular response to sorbitol(GO:0072709) |
| 0.5 | 1.4 | GO:0046709 | IDP metabolic process(GO:0046707) IDP catabolic process(GO:0046709) |
| 0.4 | 3.6 | GO:0034316 | negative regulation of Arp2/3 complex-mediated actin nucleation(GO:0034316) |
| 0.4 | 1.3 | GO:0045608 | trochlear nerve development(GO:0021558) negative regulation of auditory receptor cell differentiation(GO:0045608) regulation of timing of neuron differentiation(GO:0060164) negative regulation of pro-B cell differentiation(GO:2000974) |
| 0.4 | 1.3 | GO:0070904 | L-ascorbic acid transport(GO:0015882) molecular hydrogen transport(GO:0015993) transepithelial L-ascorbic acid transport(GO:0070904) |
| 0.4 | 1.3 | GO:0090038 | negative regulation of protein kinase C signaling(GO:0090038) |
| 0.4 | 5.8 | GO:2000253 | positive regulation of feeding behavior(GO:2000253) |
| 0.4 | 2.9 | GO:0097338 | response to clozapine(GO:0097338) |
| 0.4 | 1.2 | GO:0072720 | response to dithiothreitol(GO:0072720) |
| 0.4 | 15.8 | GO:0003298 | physiological muscle hypertrophy(GO:0003298) physiological cardiac muscle hypertrophy(GO:0003301) cell growth involved in cardiac muscle cell development(GO:0061049) |
| 0.4 | 1.2 | GO:1902809 | regulation of skeletal muscle fiber differentiation(GO:1902809) |
| 0.4 | 2.3 | GO:0048669 | microglia differentiation(GO:0014004) microglia development(GO:0014005) collateral sprouting in absence of injury(GO:0048669) cellular response to norepinephrine stimulus(GO:0071874) |
| 0.4 | 2.2 | GO:0010025 | wax biosynthetic process(GO:0010025) wax metabolic process(GO:0010166) |
| 0.3 | 1.0 | GO:0045082 | positive regulation of interleukin-10 biosynthetic process(GO:0045082) |
| 0.3 | 1.3 | GO:0021691 | cerebellar Purkinje cell layer maturation(GO:0021691) |
| 0.3 | 2.0 | GO:0032487 | regulation of Rap protein signal transduction(GO:0032487) |
| 0.3 | 1.0 | GO:0035752 | lysosomal lumen pH elevation(GO:0035752) |
| 0.3 | 1.3 | GO:0045085 | negative regulation of interleukin-2 biosynthetic process(GO:0045085) |
| 0.3 | 1.0 | GO:0036292 | DNA rewinding(GO:0036292) |
| 0.3 | 3.4 | GO:1903944 | regulation of hepatocyte apoptotic process(GO:1903943) negative regulation of hepatocyte apoptotic process(GO:1903944) |
| 0.3 | 0.9 | GO:1904907 | negative regulation of maintenance of sister chromatid cohesion(GO:0034092) negative regulation of maintenance of mitotic sister chromatid cohesion(GO:0034183) maintenance of mitotic sister chromatid cohesion, telomeric(GO:0099403) mitotic sister chromatid cohesion, telomeric(GO:0099404) regulation of maintenance of mitotic sister chromatid cohesion, telomeric(GO:1904907) negative regulation of maintenance of mitotic sister chromatid cohesion, telomeric(GO:1904908) |
| 0.3 | 0.9 | GO:0035026 | leading edge cell differentiation(GO:0035026) |
| 0.3 | 1.4 | GO:0035645 | enteric smooth muscle cell differentiation(GO:0035645) |
| 0.3 | 0.8 | GO:1902732 | positive regulation of chondrocyte proliferation(GO:1902732) |
| 0.3 | 0.8 | GO:1904604 | regulation of connective tissue replacement involved in inflammatory response wound healing(GO:1904596) negative regulation of connective tissue replacement involved in inflammatory response wound healing(GO:1904597) regulation of advanced glycation end-product receptor activity(GO:1904603) negative regulation of advanced glycation end-product receptor activity(GO:1904604) negative regulation of connective tissue replacement(GO:1905204) |
| 0.3 | 1.4 | GO:0019075 | virus maturation(GO:0019075) |
| 0.3 | 1.3 | GO:0018243 | protein O-linked glycosylation via threonine(GO:0018243) |
| 0.3 | 1.1 | GO:0014053 | negative regulation of gamma-aminobutyric acid secretion(GO:0014053) aspartate secretion(GO:0061528) regulation of aspartate secretion(GO:1904448) positive regulation of aspartate secretion(GO:1904450) |
| 0.3 | 0.3 | GO:0042939 | glutathione transport(GO:0034635) tripeptide transport(GO:0042939) |
| 0.3 | 1.6 | GO:0050668 | cellular response to phosphate starvation(GO:0016036) positive regulation of sulfur amino acid metabolic process(GO:0031337) positive regulation of homocysteine metabolic process(GO:0050668) |
| 0.3 | 2.6 | GO:0032057 | negative regulation of translational initiation in response to stress(GO:0032057) |
| 0.3 | 1.0 | GO:0002384 | hepatic immune response(GO:0002384) |
| 0.3 | 0.8 | GO:1990926 | short-term synaptic potentiation(GO:1990926) |
| 0.3 | 0.5 | GO:0040009 | regulation of growth rate(GO:0040009) |
| 0.2 | 2.5 | GO:0006689 | ganglioside catabolic process(GO:0006689) |
| 0.2 | 0.7 | GO:0061428 | negative regulation of transcription from RNA polymerase II promoter in response to hypoxia(GO:0061428) |
| 0.2 | 0.7 | GO:0015917 | aminophospholipid transport(GO:0015917) |
| 0.2 | 3.7 | GO:0042908 | xenobiotic transport(GO:0042908) |
| 0.2 | 2.7 | GO:0038124 | toll-like receptor TLR6:TLR2 signaling pathway(GO:0038124) response to diacyl bacterial lipopeptide(GO:0071724) cellular response to diacyl bacterial lipopeptide(GO:0071726) |
| 0.2 | 1.1 | GO:0040030 | regulation of molecular function, epigenetic(GO:0040030) |
| 0.2 | 0.9 | GO:0097360 | chorionic trophoblast cell proliferation(GO:0097360) regulation of chorionic trophoblast cell proliferation(GO:1901382) |
| 0.2 | 1.1 | GO:0070358 | actin polymerization-dependent cell motility(GO:0070358) |
| 0.2 | 0.7 | GO:0060849 | regulation of transcription involved in lymphatic endothelial cell fate commitment(GO:0060849) |
| 0.2 | 1.7 | GO:0048014 | Tie signaling pathway(GO:0048014) |
| 0.2 | 0.6 | GO:0010931 | macrophage tolerance induction(GO:0010931) regulation of macrophage tolerance induction(GO:0010932) positive regulation of macrophage tolerance induction(GO:0010933) |
| 0.2 | 1.3 | GO:0038016 | insulin receptor internalization(GO:0038016) |
| 0.2 | 0.8 | GO:0061357 | positive regulation of Wnt protein secretion(GO:0061357) |
| 0.2 | 0.6 | GO:1902824 | positive regulation of late endosome to lysosome transport(GO:1902824) |
| 0.2 | 0.6 | GO:1903464 | negative regulation of mitotic cell cycle DNA replication(GO:1903464) |
| 0.2 | 2.8 | GO:0046951 | ketone body biosynthetic process(GO:0046951) |
| 0.2 | 0.8 | GO:2000676 | positive regulation of type B pancreatic cell apoptotic process(GO:2000676) |
| 0.2 | 0.8 | GO:0016259 | selenocysteine metabolic process(GO:0016259) |
| 0.2 | 0.6 | GO:2000661 | positive regulation of interleukin-1-mediated signaling pathway(GO:2000661) |
| 0.2 | 1.0 | GO:0008588 | release of cytoplasmic sequestered NF-kappaB(GO:0008588) |
| 0.2 | 1.2 | GO:0003199 | endocardial cushion to mesenchymal transition involved in heart valve formation(GO:0003199) |
| 0.2 | 0.8 | GO:0097112 | gamma-aminobutyric acid receptor clustering(GO:0097112) |
| 0.2 | 0.6 | GO:1904717 | excitatory chemical synaptic transmission(GO:0098976) regulation of AMPA glutamate receptor clustering(GO:1904717) positive regulation of AMPA glutamate receptor clustering(GO:1904719) |
| 0.2 | 1.5 | GO:0010792 | DNA double-strand break processing involved in repair via single-strand annealing(GO:0010792) |
| 0.2 | 1.3 | GO:0006710 | androgen catabolic process(GO:0006710) |
| 0.2 | 3.1 | GO:0070389 | chaperone cofactor-dependent protein refolding(GO:0070389) |
| 0.2 | 1.3 | GO:0070245 | positive regulation of thymocyte apoptotic process(GO:0070245) |
| 0.2 | 0.5 | GO:0000964 | mitochondrial RNA 5'-end processing(GO:0000964) |
| 0.2 | 0.7 | GO:0007386 | compartment pattern specification(GO:0007386) |
| 0.2 | 2.0 | GO:0043129 | surfactant homeostasis(GO:0043129) |
| 0.2 | 1.0 | GO:0032237 | activation of store-operated calcium channel activity(GO:0032237) positive regulation of store-operated calcium channel activity(GO:1901341) |
| 0.2 | 0.7 | GO:1900226 | negative regulation of NLRP3 inflammasome complex assembly(GO:1900226) |
| 0.2 | 0.7 | GO:1903296 | regulation of glutamate secretion, neurotransmission(GO:1903294) positive regulation of glutamate secretion, neurotransmission(GO:1903296) |
| 0.2 | 1.5 | GO:0048539 | bone marrow development(GO:0048539) |
| 0.2 | 0.2 | GO:2000506 | negative regulation of energy homeostasis(GO:2000506) |
| 0.2 | 0.3 | GO:1901421 | positive regulation of response to alcohol(GO:1901421) |
| 0.2 | 0.7 | GO:0050904 | diapedesis(GO:0050904) |
| 0.2 | 3.2 | GO:0070314 | G1 to G0 transition(GO:0070314) |
| 0.2 | 0.8 | GO:0071630 | nucleus-associated proteasomal ubiquitin-dependent protein catabolic process(GO:0071630) |
| 0.2 | 2.5 | GO:0045835 | negative regulation of meiotic nuclear division(GO:0045835) |
| 0.2 | 0.6 | GO:0006542 | glutamine biosynthetic process(GO:0006542) |
| 0.2 | 2.0 | GO:0014877 | response to muscle inactivity involved in regulation of muscle adaptation(GO:0014877) response to denervation involved in regulation of muscle adaptation(GO:0014894) |
| 0.2 | 1.1 | GO:0006269 | DNA replication, synthesis of RNA primer(GO:0006269) |
| 0.2 | 2.9 | GO:0034656 | nucleobase-containing small molecule catabolic process(GO:0034656) |
| 0.1 | 0.6 | GO:2000342 | negative regulation of chemokine (C-X-C motif) ligand 2 production(GO:2000342) |
| 0.1 | 0.4 | GO:1902460 | mesenchymal stem cell proliferation(GO:0097168) regulation of mesenchymal stem cell proliferation(GO:1902460) positive regulation of mesenchymal stem cell proliferation(GO:1902462) |
| 0.1 | 1.9 | GO:0034285 | response to sucrose(GO:0009744) response to disaccharide(GO:0034285) |
| 0.1 | 0.3 | GO:0071930 | negative regulation of transcription involved in G1/S transition of mitotic cell cycle(GO:0071930) |
| 0.1 | 0.4 | GO:0009197 | dUDP biosynthetic process(GO:0006227) dTDP biosynthetic process(GO:0006233) pyrimidine nucleoside diphosphate metabolic process(GO:0009138) pyrimidine nucleoside diphosphate biosynthetic process(GO:0009139) pyrimidine deoxyribonucleoside diphosphate metabolic process(GO:0009196) pyrimidine deoxyribonucleoside diphosphate biosynthetic process(GO:0009197) dTDP metabolic process(GO:0046072) dUDP metabolic process(GO:0046077) |
| 0.1 | 0.4 | GO:0036363 | transforming growth factor beta activation(GO:0036363) regulation of transforming growth factor beta activation(GO:1901388) negative regulation of transforming growth factor beta activation(GO:1901389) |
| 0.1 | 1.3 | GO:0032511 | late endosome to vacuole transport via multivesicular body sorting pathway(GO:0032511) |
| 0.1 | 0.7 | GO:0046121 | deoxyribonucleoside catabolic process(GO:0046121) |
| 0.1 | 0.8 | GO:0001887 | selenium compound metabolic process(GO:0001887) |
| 0.1 | 0.8 | GO:1901529 | positive regulation of anion channel activity(GO:1901529) |
| 0.1 | 0.9 | GO:0070560 | protein secretion by platelet(GO:0070560) |
| 0.1 | 0.7 | GO:0007352 | zygotic specification of dorsal/ventral axis(GO:0007352) |
| 0.1 | 0.7 | GO:0044858 | plasma membrane raft distribution(GO:0044855) plasma membrane raft localization(GO:0044856) plasma membrane raft polarization(GO:0044858) regulation of plasma membrane raft polarization(GO:1903906) |
| 0.1 | 0.5 | GO:0051987 | positive regulation of attachment of spindle microtubules to kinetochore(GO:0051987) |
| 0.1 | 0.9 | GO:0000821 | regulation of arginine metabolic process(GO:0000821) |
| 0.1 | 3.1 | GO:0016254 | preassembly of GPI anchor in ER membrane(GO:0016254) |
| 0.1 | 0.5 | GO:1903756 | regulation of transcription from RNA polymerase II promoter by histone modification(GO:1903756) negative regulation of transcription from RNA polymerase II promoter by histone modification(GO:1903758) |
| 0.1 | 0.8 | GO:0001692 | histamine metabolic process(GO:0001692) |
| 0.1 | 0.3 | GO:0006550 | isoleucine catabolic process(GO:0006550) |
| 0.1 | 4.1 | GO:0072189 | ureter development(GO:0072189) |
| 0.1 | 1.1 | GO:2000286 | receptor internalization involved in canonical Wnt signaling pathway(GO:2000286) |
| 0.1 | 1.1 | GO:0006528 | asparagine metabolic process(GO:0006528) |
| 0.1 | 1.4 | GO:0050713 | negative regulation of interleukin-1 beta secretion(GO:0050713) |
| 0.1 | 0.8 | GO:0006231 | dTMP biosynthetic process(GO:0006231) L-serine catabolic process(GO:0006565) dTMP metabolic process(GO:0046073) |
| 0.1 | 0.7 | GO:0006574 | valine catabolic process(GO:0006574) |
| 0.1 | 0.4 | GO:0006533 | aspartate catabolic process(GO:0006533) |
| 0.1 | 0.9 | GO:0060005 | vestibular reflex(GO:0060005) |
| 0.1 | 0.8 | GO:0006931 | substrate-dependent cell migration, cell attachment to substrate(GO:0006931) |
| 0.1 | 0.5 | GO:0000711 | meiotic DNA repair synthesis(GO:0000711) |
| 0.1 | 1.3 | GO:1904322 | response to forskolin(GO:1904321) cellular response to forskolin(GO:1904322) |
| 0.1 | 1.8 | GO:0039532 | negative regulation of viral-induced cytoplasmic pattern recognition receptor signaling pathway(GO:0039532) |
| 0.1 | 0.5 | GO:1903385 | regulation of homophilic cell adhesion(GO:1903385) |
| 0.1 | 0.4 | GO:0097089 | methyl-branched fatty acid metabolic process(GO:0097089) |
| 0.1 | 0.3 | GO:0032877 | positive regulation of DNA endoreduplication(GO:0032877) |
| 0.1 | 0.6 | GO:1901350 | cell-cell signaling involved in cell-cell junction organization(GO:1901350) |
| 0.1 | 0.3 | GO:0070213 | protein auto-ADP-ribosylation(GO:0070213) |
| 0.1 | 2.2 | GO:2000194 | regulation of female gonad development(GO:2000194) |
| 0.1 | 0.7 | GO:0060754 | positive regulation of mast cell chemotaxis(GO:0060754) |
| 0.1 | 0.3 | GO:0036111 | very long-chain fatty-acyl-CoA metabolic process(GO:0036111) |
| 0.1 | 0.5 | GO:0048388 | endosomal lumen acidification(GO:0048388) |
| 0.1 | 1.4 | GO:0070307 | lens fiber cell development(GO:0070307) |
| 0.1 | 1.1 | GO:2001106 | regulation of Rho guanyl-nucleotide exchange factor activity(GO:2001106) |
| 0.1 | 0.3 | GO:1904117 | response to vasopressin(GO:1904116) cellular response to vasopressin(GO:1904117) |
| 0.1 | 0.6 | GO:0051697 | protein delipidation(GO:0051697) |
| 0.1 | 1.5 | GO:0045919 | positive regulation of cytolysis(GO:0045919) |
| 0.1 | 0.4 | GO:2000255 | negative regulation of male germ cell proliferation(GO:2000255) |
| 0.1 | 0.8 | GO:0002318 | myeloid progenitor cell differentiation(GO:0002318) |
| 0.1 | 0.8 | GO:0046726 | positive regulation by virus of viral protein levels in host cell(GO:0046726) |
| 0.1 | 0.8 | GO:0035845 | photoreceptor cell outer segment organization(GO:0035845) |
| 0.1 | 0.1 | GO:0097084 | vascular smooth muscle cell development(GO:0097084) |
| 0.1 | 0.4 | GO:0001880 | Mullerian duct regression(GO:0001880) |
| 0.1 | 0.7 | GO:0034128 | detection of lipopolysaccharide(GO:0032497) negative regulation of MyD88-independent toll-like receptor signaling pathway(GO:0034128) |
| 0.1 | 1.3 | GO:1903690 | negative regulation of wound healing, spreading of epidermal cells(GO:1903690) |
| 0.1 | 0.9 | GO:0010606 | positive regulation of cytoplasmic mRNA processing body assembly(GO:0010606) |
| 0.1 | 0.7 | GO:0032431 | activation of phospholipase A2 activity(GO:0032431) |
| 0.1 | 2.1 | GO:0043586 | tongue development(GO:0043586) |
| 0.1 | 0.2 | GO:0036518 | chemorepulsion of dopaminergic neuron axon(GO:0036518) |
| 0.1 | 0.6 | GO:0014835 | myoblast differentiation involved in skeletal muscle regeneration(GO:0014835) positive regulation of interleukin-12 secretion(GO:2001184) |
| 0.1 | 0.2 | GO:0048633 | positive regulation of skeletal muscle tissue growth(GO:0048633) |
| 0.1 | 0.4 | GO:0035726 | common myeloid progenitor cell proliferation(GO:0035726) |
| 0.1 | 2.3 | GO:0042789 | mRNA transcription from RNA polymerase II promoter(GO:0042789) |
| 0.1 | 0.3 | GO:0060392 | negative regulation of SMAD protein import into nucleus(GO:0060392) |
| 0.1 | 0.2 | GO:0005989 | lactose metabolic process(GO:0005988) lactose biosynthetic process(GO:0005989) |
| 0.1 | 0.3 | GO:1902617 | response to fluoride(GO:1902617) |
| 0.1 | 0.3 | GO:0035759 | mesangial cell-matrix adhesion(GO:0035759) regulation of dendritic cell dendrite assembly(GO:2000547) |
| 0.1 | 0.5 | GO:0071461 | cellular response to redox state(GO:0071461) |
| 0.1 | 0.3 | GO:0030187 | melatonin metabolic process(GO:0030186) melatonin biosynthetic process(GO:0030187) |
| 0.1 | 1.5 | GO:0001780 | neutrophil homeostasis(GO:0001780) |
| 0.1 | 0.8 | GO:0030242 | pexophagy(GO:0030242) |
| 0.1 | 1.2 | GO:0048368 | lateral mesoderm development(GO:0048368) |
| 0.1 | 0.3 | GO:2000660 | negative regulation of interleukin-1-mediated signaling pathway(GO:2000660) |
| 0.1 | 0.9 | GO:0036444 | calcium ion transmembrane import into mitochondrion(GO:0036444) |
| 0.1 | 0.3 | GO:0018171 | peptidyl-cysteine oxidation(GO:0018171) |
| 0.1 | 0.7 | GO:0048386 | positive regulation of retinoic acid receptor signaling pathway(GO:0048386) |
| 0.1 | 1.2 | GO:0033148 | positive regulation of intracellular estrogen receptor signaling pathway(GO:0033148) |
| 0.1 | 0.6 | GO:0071477 | hypotonic salinity response(GO:0042539) cellular hypotonic salinity response(GO:0071477) |
| 0.1 | 0.6 | GO:0070828 | heterochromatin organization(GO:0070828) |
| 0.1 | 0.3 | GO:0018032 | protein amidation(GO:0018032) |
| 0.1 | 1.0 | GO:0046600 | negative regulation of centriole replication(GO:0046600) |
| 0.1 | 1.7 | GO:0032968 | positive regulation of transcription elongation from RNA polymerase II promoter(GO:0032968) |
| 0.1 | 0.3 | GO:0038155 | interleukin-23-mediated signaling pathway(GO:0038155) |
| 0.1 | 0.2 | GO:0021861 | forebrain radial glial cell differentiation(GO:0021861) |
| 0.1 | 0.2 | GO:0010808 | positive regulation of synaptic vesicle priming(GO:0010808) |
| 0.1 | 0.9 | GO:1903012 | positive regulation of bone development(GO:1903012) |
| 0.1 | 0.2 | GO:0048022 | negative regulation of melanin biosynthetic process(GO:0048022) negative regulation of secondary metabolite biosynthetic process(GO:1900377) |
| 0.1 | 0.5 | GO:0019918 | peptidyl-arginine methylation, to symmetrical-dimethyl arginine(GO:0019918) |
| 0.1 | 2.3 | GO:0002089 | lens morphogenesis in camera-type eye(GO:0002089) |
| 0.1 | 0.6 | GO:0090625 | mRNA cleavage involved in gene silencing by siRNA(GO:0090625) |
| 0.1 | 1.0 | GO:0061088 | regulation of sequestering of zinc ion(GO:0061088) |
| 0.1 | 0.2 | GO:0000710 | meiotic mismatch repair(GO:0000710) |
| 0.1 | 1.2 | GO:0043562 | cellular response to nitrogen starvation(GO:0006995) cellular response to nitrogen levels(GO:0043562) |
| 0.1 | 1.7 | GO:0016075 | rRNA catabolic process(GO:0016075) |
| 0.1 | 1.7 | GO:0016558 | protein import into peroxisome matrix(GO:0016558) |
| 0.1 | 0.2 | GO:0033364 | mast cell secretory granule organization(GO:0033364) |
| 0.1 | 1.2 | GO:0045945 | positive regulation of transcription from RNA polymerase III promoter(GO:0045945) |
| 0.1 | 0.6 | GO:0035609 | C-terminal protein deglutamylation(GO:0035609) |
| 0.1 | 0.4 | GO:1900738 | positive regulation of phospholipase C-activating G-protein coupled receptor signaling pathway(GO:1900738) |
| 0.1 | 0.7 | GO:0010886 | positive regulation of cholesterol storage(GO:0010886) |
| 0.1 | 0.4 | GO:0016480 | negative regulation of transcription from RNA polymerase III promoter(GO:0016480) |
| 0.1 | 0.7 | GO:0032328 | alanine transport(GO:0032328) |
| 0.1 | 1.0 | GO:0048227 | plasma membrane to endosome transport(GO:0048227) |
| 0.1 | 0.9 | GO:0006359 | regulation of transcription from RNA polymerase III promoter(GO:0006359) |
| 0.1 | 2.2 | GO:0042403 | thyroid hormone metabolic process(GO:0042403) |
| 0.1 | 0.2 | GO:1902283 | negative regulation of primary amine oxidase activity(GO:1902283) |
| 0.1 | 0.9 | GO:0032074 | negative regulation of nuclease activity(GO:0032074) |
| 0.1 | 2.1 | GO:0006309 | apoptotic DNA fragmentation(GO:0006309) |
| 0.1 | 0.4 | GO:1901159 | glucuronate catabolic process(GO:0006064) glucuronate catabolic process to xylulose 5-phosphate(GO:0019640) xylulose 5-phosphate metabolic process(GO:0051167) xylulose 5-phosphate biosynthetic process(GO:1901159) |
| 0.1 | 0.6 | GO:0003138 | primary heart field specification(GO:0003138) sinoatrial valve development(GO:0003172) sinoatrial valve morphogenesis(GO:0003185) |
| 0.1 | 0.4 | GO:0090206 | negative regulation of cholesterol biosynthetic process(GO:0045541) negative regulation of cholesterol metabolic process(GO:0090206) |
| 0.1 | 0.2 | GO:1990022 | RNA polymerase II complex import to nucleus(GO:0044376) RNA polymerase III complex localization to nucleus(GO:1990022) |
| 0.1 | 2.5 | GO:0070286 | axonemal dynein complex assembly(GO:0070286) |
| 0.1 | 2.4 | GO:0010842 | retina layer formation(GO:0010842) |
| 0.1 | 1.3 | GO:0009650 | UV protection(GO:0009650) |
| 0.1 | 1.4 | GO:0034356 | NAD biosynthesis via nicotinamide riboside salvage pathway(GO:0034356) |
| 0.1 | 1.5 | GO:0051044 | positive regulation of membrane protein ectodomain proteolysis(GO:0051044) |
| 0.1 | 0.3 | GO:0090362 | positive regulation of platelet-derived growth factor production(GO:0090362) |
| 0.1 | 0.2 | GO:0006788 | heme oxidation(GO:0006788) |
| 0.1 | 0.8 | GO:0032836 | glomerular basement membrane development(GO:0032836) |
| 0.1 | 1.4 | GO:0035518 | histone H2A monoubiquitination(GO:0035518) |
| 0.1 | 1.0 | GO:0000338 | protein deneddylation(GO:0000338) |
| 0.1 | 0.6 | GO:1900825 | regulation of membrane depolarization during cardiac muscle cell action potential(GO:1900825) |
| 0.1 | 0.1 | GO:2000157 | regulation of protein K48-linked deubiquitination(GO:1903093) negative regulation of protein K48-linked deubiquitination(GO:1903094) negative regulation of ubiquitin-specific protease activity(GO:2000157) |
| 0.1 | 0.8 | GO:0046784 | viral mRNA export from host cell nucleus(GO:0046784) |
| 0.1 | 0.8 | GO:0031936 | negative regulation of chromatin silencing(GO:0031936) |
| 0.1 | 0.6 | GO:0006572 | tyrosine catabolic process(GO:0006572) |
| 0.1 | 0.4 | GO:0060160 | negative regulation of dopamine receptor signaling pathway(GO:0060160) |
| 0.1 | 0.2 | GO:1903259 | exon-exon junction complex disassembly(GO:1903259) |
| 0.1 | 0.4 | GO:1902897 | regulation of postsynaptic density protein 95 clustering(GO:1902897) |
| 0.1 | 0.2 | GO:0036091 | positive regulation of transcription from RNA polymerase II promoter in response to oxidative stress(GO:0036091) |
| 0.1 | 0.2 | GO:0045918 | negative regulation of cytolysis(GO:0045918) |
| 0.1 | 1.4 | GO:0035728 | response to hepatocyte growth factor(GO:0035728) |
| 0.1 | 0.2 | GO:0036058 | filtration diaphragm assembly(GO:0036058) slit diaphragm assembly(GO:0036060) |
| 0.1 | 0.4 | GO:0018406 | protein C-linked glycosylation(GO:0018103) peptidyl-tryptophan modification(GO:0018211) protein C-linked glycosylation via tryptophan(GO:0018317) protein C-linked glycosylation via 2'-alpha-mannosyl-L-tryptophan(GO:0018406) |
| 0.1 | 0.2 | GO:0036233 | glycine import(GO:0036233) |
| 0.1 | 0.4 | GO:0090116 | C-5 methylation of cytosine(GO:0090116) |
| 0.1 | 0.7 | GO:0098909 | regulation of cardiac muscle cell action potential involved in regulation of contraction(GO:0098909) |
| 0.1 | 16.0 | GO:0065004 | protein-DNA complex assembly(GO:0065004) |
| 0.1 | 0.4 | GO:0001672 | regulation of chromatin assembly or disassembly(GO:0001672) |
| 0.1 | 0.7 | GO:0045793 | positive regulation of cell size(GO:0045793) |
| 0.1 | 2.4 | GO:0051894 | positive regulation of focal adhesion assembly(GO:0051894) |
| 0.1 | 0.2 | GO:0016095 | polyprenol catabolic process(GO:0016095) |
| 0.1 | 0.3 | GO:0061205 | nose morphogenesis(GO:0043585) alveolar primary septum development(GO:0061143) paramesonephric duct development(GO:0061205) |
| 0.1 | 0.1 | GO:1900108 | negative regulation of nodal signaling pathway(GO:1900108) |
| 0.1 | 0.3 | GO:0019805 | quinolinate biosynthetic process(GO:0019805) |
| 0.1 | 0.3 | GO:0045006 | DNA deamination(GO:0045006) DNA cytosine deamination(GO:0070383) |
| 0.1 | 0.8 | GO:0021796 | cerebral cortex regionalization(GO:0021796) |
| 0.1 | 0.2 | GO:0051039 | histone displacement(GO:0001207) positive regulation of transcription involved in meiotic cell cycle(GO:0051039) |
| 0.1 | 0.1 | GO:0032804 | negative regulation of low-density lipoprotein particle receptor catabolic process(GO:0032804) |
| 0.1 | 2.3 | GO:0000188 | inactivation of MAPK activity(GO:0000188) |
| 0.1 | 0.2 | GO:0043973 | histone H3-K4 acetylation(GO:0043973) |
| 0.1 | 0.3 | GO:0044314 | protein K27-linked ubiquitination(GO:0044314) |
| 0.1 | 1.1 | GO:0051457 | maintenance of protein location in nucleus(GO:0051457) |
| 0.1 | 0.2 | GO:0090611 | ubiquitin-independent protein catabolic process via the multivesicular body sorting pathway(GO:0090611) |
| 0.1 | 0.3 | GO:0090286 | cytoskeletal anchoring at nuclear membrane(GO:0090286) |
| 0.1 | 3.2 | GO:0030866 | cortical actin cytoskeleton organization(GO:0030866) |
| 0.1 | 0.2 | GO:1990918 | meiotic DNA double-strand break processing(GO:0000706) double-strand break repair involved in meiotic recombination(GO:1990918) |
| 0.1 | 0.3 | GO:1903361 | protein localization to basolateral plasma membrane(GO:1903361) |
| 0.1 | 0.6 | GO:0034551 | respiratory chain complex III assembly(GO:0017062) mitochondrial respiratory chain complex III assembly(GO:0034551) mitochondrial respiratory chain complex III biogenesis(GO:0097033) |
| 0.1 | 0.3 | GO:0009438 | methylglyoxal metabolic process(GO:0009438) |
| 0.1 | 0.4 | GO:0002741 | positive regulation of cytokine secretion involved in immune response(GO:0002741) |
| 0.1 | 0.2 | GO:0039506 | modulation by virus of host molecular function(GO:0039506) suppression by virus of host molecular function(GO:0039507) suppression by virus of host catalytic activity(GO:0039513) modulation by virus of host catalytic activity(GO:0039516) suppression by virus of host cysteine-type endopeptidase activity involved in apoptotic process(GO:0039650) negative regulation by symbiont of host catalytic activity(GO:0052053) negative regulation by symbiont of host molecular function(GO:0052056) modulation by symbiont of host catalytic activity(GO:0052148) |
| 0.1 | 0.4 | GO:0015760 | hexose phosphate transport(GO:0015712) glucose-6-phosphate transport(GO:0015760) |
| 0.1 | 0.9 | GO:0034390 | smooth muscle cell apoptotic process(GO:0034390) regulation of smooth muscle cell apoptotic process(GO:0034391) |
| 0.1 | 0.3 | GO:0031498 | nucleosome disassembly(GO:0006337) chromatin disassembly(GO:0031498) |
| 0.1 | 0.4 | GO:1900264 | regulation of DNA-directed DNA polymerase activity(GO:1900262) positive regulation of DNA-directed DNA polymerase activity(GO:1900264) |
| 0.1 | 0.1 | GO:0003357 | noradrenergic neuron differentiation(GO:0003357) |
| 0.1 | 0.3 | GO:0060800 | regulation of cell differentiation involved in embryonic placenta development(GO:0060800) |
| 0.1 | 0.6 | GO:0043555 | regulation of translation in response to stress(GO:0043555) |
| 0.0 | 0.6 | GO:0006346 | methylation-dependent chromatin silencing(GO:0006346) |
| 0.0 | 0.9 | GO:0060285 | cilium-dependent cell motility(GO:0060285) |
| 0.0 | 8.9 | GO:0006338 | chromatin remodeling(GO:0006338) |
| 0.0 | 0.5 | GO:0006703 | estrogen biosynthetic process(GO:0006703) |
| 0.0 | 0.2 | GO:0019074 | viral genome packaging(GO:0019072) viral RNA genome packaging(GO:0019074) |
| 0.0 | 1.0 | GO:0033141 | positive regulation of peptidyl-serine phosphorylation of STAT protein(GO:0033141) |
| 0.0 | 0.4 | GO:0006268 | DNA unwinding involved in DNA replication(GO:0006268) |
| 0.0 | 12.2 | GO:0031032 | actomyosin structure organization(GO:0031032) |
| 0.0 | 0.2 | GO:2000563 | positive regulation of CD4-positive, alpha-beta T cell proliferation(GO:2000563) |
| 0.0 | 0.9 | GO:2000144 | positive regulation of DNA-templated transcription, initiation(GO:2000144) |
| 0.0 | 0.4 | GO:2000601 | positive regulation of Arp2/3 complex-mediated actin nucleation(GO:2000601) |
| 0.0 | 0.6 | GO:0061179 | negative regulation of insulin secretion involved in cellular response to glucose stimulus(GO:0061179) |
| 0.0 | 0.4 | GO:0007168 | receptor guanylyl cyclase signaling pathway(GO:0007168) |
| 0.0 | 0.7 | GO:0010990 | regulation of SMAD protein complex assembly(GO:0010990) negative regulation of SMAD protein complex assembly(GO:0010991) |
| 0.0 | 1.0 | GO:0071447 | cellular response to hydroperoxide(GO:0071447) |
| 0.0 | 0.1 | GO:1904491 | protein localization to ciliary transition zone(GO:1904491) |
| 0.0 | 0.4 | GO:0018230 | peptidyl-L-cysteine S-palmitoylation(GO:0018230) peptidyl-S-diacylglycerol-L-cysteine biosynthetic process from peptidyl-cysteine(GO:0018231) |
| 0.0 | 0.4 | GO:0090481 | pyrimidine nucleotide-sugar transmembrane transport(GO:0090481) |
| 0.0 | 0.1 | GO:0032661 | regulation of interleukin-18 production(GO:0032661) |
| 0.0 | 0.4 | GO:0042074 | cell migration involved in gastrulation(GO:0042074) |
| 0.0 | 0.1 | GO:0001807 | type IV hypersensitivity(GO:0001806) regulation of type IV hypersensitivity(GO:0001807) negative regulation of type IV hypersensitivity(GO:0001808) |
| 0.0 | 0.6 | GO:0015986 | energy coupled proton transport, down electrochemical gradient(GO:0015985) ATP synthesis coupled proton transport(GO:0015986) |
| 0.0 | 0.4 | GO:0006547 | histidine metabolic process(GO:0006547) |
| 0.0 | 1.3 | GO:2000772 | regulation of cellular senescence(GO:2000772) |
| 0.0 | 0.1 | GO:0006538 | glutamate catabolic process(GO:0006538) |
| 0.0 | 0.3 | GO:0006041 | glucosamine metabolic process(GO:0006041) |
| 0.0 | 0.1 | GO:2000653 | regulation of genetic imprinting(GO:2000653) |
| 0.0 | 0.2 | GO:0061763 | multivesicular body-lysosome fusion(GO:0061763) |
| 0.0 | 0.5 | GO:1901407 | regulation of phosphorylation of RNA polymerase II C-terminal domain(GO:1901407) |
| 0.0 | 0.8 | GO:0071157 | negative regulation of cell cycle arrest(GO:0071157) |
| 0.0 | 1.6 | GO:0045599 | negative regulation of fat cell differentiation(GO:0045599) |
| 0.0 | 0.3 | GO:0019060 | intracellular transport of viral protein in host cell(GO:0019060) symbiont intracellular protein transport in host(GO:0030581) intracellular protein transport in other organism involved in symbiotic interaction(GO:0051708) |
| 0.0 | 0.4 | GO:0061588 | calcium activated phospholipid scrambling(GO:0061588) calcium activated phosphatidylcholine scrambling(GO:0061590) calcium activated galactosylceramide scrambling(GO:0061591) |
| 0.0 | 0.3 | GO:0031547 | brain-derived neurotrophic factor receptor signaling pathway(GO:0031547) |
| 0.0 | 0.2 | GO:1902965 | regulation of protein localization to early endosome(GO:1902965) positive regulation of protein localization to early endosome(GO:1902966) |
| 0.0 | 0.2 | GO:1904327 | protein localization to cytosolic proteasome complex(GO:1904327) protein localization to cytosolic proteasome complex involved in ERAD pathway(GO:1904379) |
| 0.0 | 0.3 | GO:0009624 | response to nematode(GO:0009624) |
| 0.0 | 0.5 | GO:0070493 | thrombin receptor signaling pathway(GO:0070493) |
| 0.0 | 0.2 | GO:0010499 | proteasomal ubiquitin-independent protein catabolic process(GO:0010499) |
| 0.0 | 0.5 | GO:0071285 | cellular response to lithium ion(GO:0071285) |
| 0.0 | 0.2 | GO:0009449 | gamma-aminobutyric acid biosynthetic process(GO:0009449) |
| 0.0 | 0.3 | GO:0071651 | positive regulation of chemokine (C-C motif) ligand 5 production(GO:0071651) |
| 0.0 | 0.1 | GO:0072156 | distal tubule morphogenesis(GO:0072156) |
| 0.0 | 2.6 | GO:0048791 | calcium ion-regulated exocytosis of neurotransmitter(GO:0048791) |
| 0.0 | 0.1 | GO:0006556 | S-adenosylmethionine biosynthetic process(GO:0006556) |
| 0.0 | 0.4 | GO:0007023 | post-chaperonin tubulin folding pathway(GO:0007023) |
| 0.0 | 0.9 | GO:1901685 | glutathione derivative metabolic process(GO:1901685) glutathione derivative biosynthetic process(GO:1901687) |
| 0.0 | 0.2 | GO:1901896 | positive regulation of calcium-transporting ATPase activity(GO:1901896) |
| 0.0 | 0.7 | GO:1904294 | positive regulation of ERAD pathway(GO:1904294) |
| 0.0 | 0.3 | GO:0070272 | proton-transporting ATP synthase complex assembly(GO:0043461) proton-transporting ATP synthase complex biogenesis(GO:0070272) |
| 0.0 | 1.0 | GO:0097503 | sialylation(GO:0097503) |
| 0.0 | 0.5 | GO:0035873 | lactate transport(GO:0015727) lactate transmembrane transport(GO:0035873) |
| 0.0 | 0.5 | GO:2000353 | positive regulation of endothelial cell apoptotic process(GO:2000353) |
| 0.0 | 0.9 | GO:0051131 | chaperone-mediated protein complex assembly(GO:0051131) |
| 0.0 | 1.4 | GO:0042133 | neurotransmitter metabolic process(GO:0042133) |
| 0.0 | 0.5 | GO:1902548 | negative regulation of vascular endothelial growth factor signaling pathway(GO:1900747) negative regulation of cellular response to vascular endothelial growth factor stimulus(GO:1902548) |
| 0.0 | 0.5 | GO:0015866 | ADP transport(GO:0015866) |
| 0.0 | 2.2 | GO:0000413 | protein peptidyl-prolyl isomerization(GO:0000413) |
| 0.0 | 0.1 | GO:0034164 | negative regulation of toll-like receptor 9 signaling pathway(GO:0034164) |
| 0.0 | 1.5 | GO:0048384 | retinoic acid receptor signaling pathway(GO:0048384) |
| 0.0 | 0.7 | GO:0042953 | lipoprotein transport(GO:0042953) lipoprotein localization(GO:0044872) |
| 0.0 | 0.1 | GO:1990785 | response to water-immersion restraint stress(GO:1990785) |
| 0.0 | 0.3 | GO:1902894 | negative regulation of pri-miRNA transcription from RNA polymerase II promoter(GO:1902894) |
| 0.0 | 0.6 | GO:1900745 | positive regulation of p38MAPK cascade(GO:1900745) |
| 0.0 | 0.1 | GO:0002752 | cell surface pattern recognition receptor signaling pathway(GO:0002752) |
| 0.0 | 0.4 | GO:0034447 | very-low-density lipoprotein particle clearance(GO:0034447) |
| 0.0 | 0.2 | GO:0045872 | positive regulation of rhodopsin gene expression(GO:0045872) |
| 0.0 | 0.2 | GO:0032466 | negative regulation of cytokinesis(GO:0032466) |
| 0.0 | 0.5 | GO:0033008 | positive regulation of mast cell activation involved in immune response(GO:0033008) positive regulation of mast cell degranulation(GO:0043306) |
| 0.0 | 0.4 | GO:1904936 | cerebral cortex GABAergic interneuron migration(GO:0021853) interneuron migration(GO:1904936) |
| 0.0 | 0.2 | GO:0098735 | positive regulation of the force of heart contraction(GO:0098735) |
| 0.0 | 0.2 | GO:0061739 | protein lipidation involved in autophagosome assembly(GO:0061739) |
| 0.0 | 0.1 | GO:0007343 | egg activation(GO:0007343) |
| 0.0 | 0.1 | GO:1904578 | response to thapsigargin(GO:1904578) cellular response to thapsigargin(GO:1904579) response to hypobaric hypoxia(GO:1990910) |
| 0.0 | 0.1 | GO:0071287 | cellular response to manganese ion(GO:0071287) |
| 0.0 | 0.6 | GO:0001574 | ganglioside biosynthetic process(GO:0001574) |
| 0.0 | 0.3 | GO:0071638 | negative regulation of monocyte chemotactic protein-1 production(GO:0071638) |
| 0.0 | 0.1 | GO:1904562 | phosphatidylinositol 5-phosphate metabolic process(GO:1904562) |
| 0.0 | 0.5 | GO:0060080 | inhibitory postsynaptic potential(GO:0060080) |
| 0.0 | 0.1 | GO:0010360 | negative regulation of anion channel activity(GO:0010360) |
| 0.0 | 1.1 | GO:0006699 | bile acid biosynthetic process(GO:0006699) |
| 0.0 | 0.1 | GO:0098759 | response to interleukin-8(GO:0098758) cellular response to interleukin-8(GO:0098759) |
| 0.0 | 0.3 | GO:0000389 | mRNA 3'-splice site recognition(GO:0000389) |
| 0.0 | 0.4 | GO:0043249 | erythrocyte maturation(GO:0043249) |
| 0.0 | 0.1 | GO:1901842 | negative regulation of high voltage-gated calcium channel activity(GO:1901842) |
| 0.0 | 0.9 | GO:0006743 | ubiquinone metabolic process(GO:0006743) ubiquinone biosynthetic process(GO:0006744) quinone biosynthetic process(GO:1901663) |
| 0.0 | 0.2 | GO:0071802 | negative regulation of podosome assembly(GO:0071802) |
| 0.0 | 0.1 | GO:0032489 | regulation of Cdc42 protein signal transduction(GO:0032489) |
| 0.0 | 0.3 | GO:0031339 | negative regulation of vesicle fusion(GO:0031339) |
| 0.0 | 1.0 | GO:0043928 | exonucleolytic nuclear-transcribed mRNA catabolic process involved in deadenylation-dependent decay(GO:0043928) |
| 0.0 | 0.6 | GO:1901748 | leukotriene D4 metabolic process(GO:1901748) leukotriene D4 biosynthetic process(GO:1901750) |
| 0.0 | 0.2 | GO:0055059 | asymmetric neuroblast division(GO:0055059) |
| 0.0 | 0.6 | GO:0045737 | positive regulation of cyclin-dependent protein serine/threonine kinase activity(GO:0045737) |
| 0.0 | 1.7 | GO:0032760 | positive regulation of tumor necrosis factor production(GO:0032760) |
| 0.0 | 0.1 | GO:0071110 | protein biotinylation(GO:0009305) histone biotinylation(GO:0071110) |
| 0.0 | 0.6 | GO:0034498 | early endosome to Golgi transport(GO:0034498) |
| 0.0 | 0.3 | GO:1900364 | negative regulation of mRNA polyadenylation(GO:1900364) |
| 0.0 | 0.1 | GO:1904977 | lymphatic endothelial cell migration(GO:1904977) |
| 0.0 | 0.5 | GO:0007158 | neuron cell-cell adhesion(GO:0007158) |
| 0.0 | 0.4 | GO:0016191 | synaptic vesicle uncoating(GO:0016191) |
| 0.0 | 0.6 | GO:0034975 | protein folding in endoplasmic reticulum(GO:0034975) |
| 0.0 | 2.2 | GO:0001578 | microtubule bundle formation(GO:0001578) |
| 0.0 | 2.3 | GO:0006635 | fatty acid beta-oxidation(GO:0006635) |
| 0.0 | 0.7 | GO:0019372 | lipoxygenase pathway(GO:0019372) |
| 0.0 | 0.1 | GO:0010255 | hexose mediated signaling(GO:0009757) sugar mediated signaling pathway(GO:0010182) glucose mediated signaling pathway(GO:0010255) |
| 0.0 | 0.2 | GO:1900016 | negative regulation of cytokine production involved in inflammatory response(GO:1900016) |
| 0.0 | 0.3 | GO:0044341 | sodium-dependent phosphate transport(GO:0044341) |
| 0.0 | 0.1 | GO:1990822 | basic amino acid transmembrane transport(GO:1990822) |
| 0.0 | 0.2 | GO:0009249 | protein lipoylation(GO:0009249) |
| 0.0 | 0.2 | GO:0031666 | positive regulation of lipopolysaccharide-mediated signaling pathway(GO:0031666) |
| 0.0 | 0.1 | GO:0021759 | globus pallidus development(GO:0021759) |
| 0.0 | 0.4 | GO:0000729 | DNA double-strand break processing(GO:0000729) |
| 0.0 | 0.5 | GO:0006012 | galactose metabolic process(GO:0006012) |
| 0.0 | 0.1 | GO:0099590 | neurotransmitter receptor internalization(GO:0099590) |
| 0.0 | 0.2 | GO:0043353 | enucleate erythrocyte differentiation(GO:0043353) |
| 0.0 | 0.1 | GO:1902255 | positive regulation of intrinsic apoptotic signaling pathway by p53 class mediator(GO:1902255) |
| 0.0 | 0.3 | GO:0006983 | ER overload response(GO:0006983) |
| 0.0 | 0.2 | GO:0071316 | cellular response to nicotine(GO:0071316) |
| 0.0 | 0.9 | GO:0045022 | early endosome to late endosome transport(GO:0045022) |
| 0.0 | 0.3 | GO:1902035 | positive regulation of hematopoietic stem cell proliferation(GO:1902035) |
| 0.0 | 0.1 | GO:0019836 | cytolysis by symbiont of host cells(GO:0001897) hemolysis by symbiont of host erythrocytes(GO:0019836) hemolysis in other organism(GO:0044179) cytolysis in other organism involved in symbiotic interaction(GO:0051801) hemolysis in other organism involved in symbiotic interaction(GO:0052331) |
| 0.0 | 0.1 | GO:0015862 | uridine transport(GO:0015862) |
| 0.0 | 0.1 | GO:0036166 | phenotypic switching(GO:0036166) regulation of phenotypic switching(GO:1900239) |
| 0.0 | 0.1 | GO:0061056 | somite specification(GO:0001757) sclerotome development(GO:0061056) |
| 0.0 | 0.1 | GO:0043987 | histone H3-S10 phosphorylation(GO:0043987) |
| 0.0 | 0.8 | GO:0045026 | plasma membrane fusion(GO:0045026) |
| 0.0 | 0.4 | GO:0008206 | bile acid metabolic process(GO:0008206) |
| 0.0 | 0.4 | GO:0034587 | piRNA metabolic process(GO:0034587) |
| 0.0 | 0.3 | GO:0090656 | t-circle formation(GO:0090656) |
| 0.0 | 0.6 | GO:0006491 | N-glycan processing(GO:0006491) |
| 0.0 | 0.2 | GO:0051534 | negative regulation of NFAT protein import into nucleus(GO:0051534) |
| 0.0 | 0.3 | GO:0006527 | arginine catabolic process(GO:0006527) |
| 0.0 | 0.3 | GO:0033522 | histone H2A ubiquitination(GO:0033522) |
| 0.0 | 0.2 | GO:0044334 | canonical Wnt signaling pathway involved in positive regulation of epithelial to mesenchymal transition(GO:0044334) |
| 0.0 | 0.3 | GO:0006449 | regulation of translational termination(GO:0006449) |
| 0.0 | 0.8 | GO:1903959 | regulation of anion transmembrane transport(GO:1903959) |
| 0.0 | 0.7 | GO:0097421 | liver regeneration(GO:0097421) |
| 0.0 | 0.1 | GO:2000435 | regulation of protein neddylation(GO:2000434) negative regulation of protein neddylation(GO:2000435) |
| 0.0 | 0.1 | GO:0080154 | regulation of fertilization(GO:0080154) |
| 0.0 | 0.7 | GO:0090129 | positive regulation of synapse maturation(GO:0090129) |
| 0.0 | 0.1 | GO:0043553 | negative regulation of phosphatidylinositol 3-kinase activity(GO:0043553) |
| 0.0 | 0.2 | GO:0010756 | positive regulation of plasminogen activation(GO:0010756) |
| 0.0 | 0.1 | GO:0008343 | adult feeding behavior(GO:0008343) positive regulation of response to food(GO:0032097) positive regulation of appetite(GO:0032100) |
| 0.0 | 0.3 | GO:0006705 | mineralocorticoid biosynthetic process(GO:0006705) mineralocorticoid metabolic process(GO:0008212) |
| 0.0 | 0.2 | GO:0014809 | regulation of skeletal muscle contraction by regulation of release of sequestered calcium ion(GO:0014809) |
| 0.0 | 0.1 | GO:0002933 | lipid hydroxylation(GO:0002933) |
| 0.0 | 0.6 | GO:0060612 | adipose tissue development(GO:0060612) |
| 0.0 | 0.1 | GO:0006127 | glycerophosphate shuttle(GO:0006127) |
| 0.0 | 0.0 | GO:1990253 | cellular response to leucine starvation(GO:1990253) |
| 0.0 | 0.1 | GO:0038193 | thromboxane A2 signaling pathway(GO:0038193) |
| 0.0 | 0.4 | GO:0042744 | hydrogen peroxide catabolic process(GO:0042744) |
| 0.0 | 0.1 | GO:0038060 | nitric oxide-cGMP-mediated signaling pathway(GO:0038060) |
| 0.0 | 0.2 | GO:0009642 | response to light intensity(GO:0009642) |
| 0.0 | 0.2 | GO:0021942 | radial glia guided migration of Purkinje cell(GO:0021942) |
| 0.0 | 0.1 | GO:0072679 | positive regulation of sperm motility involved in capacitation(GO:0060474) thymocyte migration(GO:0072679) |
| 0.0 | 0.0 | GO:0009753 | response to jasmonic acid(GO:0009753) cellular response to jasmonic acid stimulus(GO:0071395) |
| 0.0 | 0.3 | GO:0032802 | low-density lipoprotein particle receptor catabolic process(GO:0032802) |
| 0.0 | 0.2 | GO:1901621 | negative regulation of smoothened signaling pathway involved in dorsal/ventral neural tube patterning(GO:1901621) |
| 0.0 | 0.4 | GO:0071380 | cellular response to prostaglandin E stimulus(GO:0071380) |
| 0.0 | 0.2 | GO:0006610 | ribosomal protein import into nucleus(GO:0006610) |
| 0.0 | 2.8 | GO:0002223 | stimulatory C-type lectin receptor signaling pathway(GO:0002223) |
| 0.0 | 1.3 | GO:0060997 | dendritic spine morphogenesis(GO:0060997) |
| 0.0 | 0.2 | GO:0010801 | negative regulation of peptidyl-threonine phosphorylation(GO:0010801) |
| 0.0 | 0.1 | GO:1903401 | lysine transport(GO:0015819) L-lysine transport(GO:1902022) L-lysine transmembrane transport(GO:1903401) |
| 0.0 | 0.2 | GO:1904714 | regulation of chaperone-mediated autophagy(GO:1904714) |
| 0.0 | 0.8 | GO:0032007 | negative regulation of TOR signaling(GO:0032007) |
| 0.0 | 0.2 | GO:0051231 | mitotic spindle elongation(GO:0000022) spindle elongation(GO:0051231) mitotic spindle midzone assembly(GO:0051256) |
| 0.0 | 0.1 | GO:0046078 | dUMP metabolic process(GO:0046078) |
| 0.0 | 0.3 | GO:0061635 | regulation of protein complex stability(GO:0061635) |
| 0.0 | 0.5 | GO:0009954 | proximal/distal pattern formation(GO:0009954) |
| 0.0 | 0.0 | GO:0060300 | regulation of cytokine activity(GO:0060300) |
| 0.0 | 0.1 | GO:1900535 | medium-chain fatty-acyl-CoA catabolic process(GO:0036114) fatty-acyl-CoA catabolic process(GO:0036115) long-chain fatty-acyl-CoA catabolic process(GO:0036116) palmitic acid metabolic process(GO:1900533) palmitic acid biosynthetic process(GO:1900535) |
| 0.0 | 0.2 | GO:0000244 | spliceosomal tri-snRNP complex assembly(GO:0000244) |
| 0.0 | 1.4 | GO:0006687 | glycosphingolipid metabolic process(GO:0006687) |
| 0.0 | 0.1 | GO:1904058 | positive regulation of sensory perception of pain(GO:1904058) |
| 0.0 | 0.6 | GO:0030513 | positive regulation of BMP signaling pathway(GO:0030513) |
| 0.0 | 0.3 | GO:0035646 | endosome to melanosome transport(GO:0035646) endosome to pigment granule transport(GO:0043485) pigment granule maturation(GO:0048757) |
| 0.0 | 0.2 | GO:1990440 | positive regulation of transcription from RNA polymerase II promoter in response to endoplasmic reticulum stress(GO:1990440) |
| 0.0 | 0.5 | GO:0043114 | regulation of vascular permeability(GO:0043114) |
| 0.0 | 0.4 | GO:0007171 | activation of transmembrane receptor protein tyrosine kinase activity(GO:0007171) |
| 0.0 | 1.4 | GO:0097031 | NADH dehydrogenase complex assembly(GO:0010257) mitochondrial respiratory chain complex I assembly(GO:0032981) mitochondrial respiratory chain complex I biogenesis(GO:0097031) |
| 0.0 | 0.2 | GO:0060992 | response to fungicide(GO:0060992) |
| 0.0 | 0.1 | GO:0002043 | blood vessel endothelial cell proliferation involved in sprouting angiogenesis(GO:0002043) |
| 0.0 | 0.2 | GO:0006122 | mitochondrial electron transport, ubiquinol to cytochrome c(GO:0006122) |
| 0.0 | 0.7 | GO:0006298 | mismatch repair(GO:0006298) |
| 0.0 | 0.1 | GO:1900165 | negative regulation of interleukin-6 secretion(GO:1900165) |
| 0.0 | 1.8 | GO:0017156 | calcium ion regulated exocytosis(GO:0017156) |
| 0.0 | 0.3 | GO:0007289 | spermatid nucleus differentiation(GO:0007289) |
| 0.0 | 0.6 | GO:0034260 | negative regulation of GTPase activity(GO:0034260) |
| 0.0 | 0.2 | GO:0019062 | virion attachment to host cell(GO:0019062) adhesion of symbiont to host cell(GO:0044650) |
| 0.0 | 0.1 | GO:1990416 | cellular response to brain-derived neurotrophic factor stimulus(GO:1990416) |
| 0.0 | 0.1 | GO:0018214 | peptidyl-glutamic acid carboxylation(GO:0017187) protein carboxylation(GO:0018214) |
| 0.0 | 0.4 | GO:0007035 | vacuolar acidification(GO:0007035) |
| 0.0 | 2.3 | GO:0006614 | SRP-dependent cotranslational protein targeting to membrane(GO:0006614) |
| 0.0 | 2.1 | GO:0002576 | platelet degranulation(GO:0002576) |
| 0.0 | 0.2 | GO:1904424 | regulation of GTP binding(GO:1904424) |
| 0.0 | 0.3 | GO:0035635 | entry of bacterium into host cell(GO:0035635) |
| 0.0 | 0.0 | GO:1903567 | negative regulation of protein localization to cilium(GO:1903565) regulation of protein localization to ciliary membrane(GO:1903567) negative regulation of protein localization to ciliary membrane(GO:1903568) |
| 0.0 | 0.9 | GO:0031016 | pancreas development(GO:0031016) |
| 0.0 | 0.1 | GO:0035063 | nuclear speck organization(GO:0035063) |
| 0.0 | 0.2 | GO:1903432 | regulation of TORC1 signaling(GO:1903432) |
| 0.0 | 1.7 | GO:0042752 | regulation of circadian rhythm(GO:0042752) |
| 0.0 | 1.1 | GO:0048207 | vesicle targeting, rough ER to cis-Golgi(GO:0048207) COPII vesicle coating(GO:0048208) |
| 0.0 | 0.1 | GO:1902083 | negative regulation of peptidyl-cysteine S-nitrosylation(GO:1902083) |
| 0.0 | 0.4 | GO:0045601 | regulation of endothelial cell differentiation(GO:0045601) |
| 0.0 | 0.2 | GO:1902751 | positive regulation of cell cycle G2/M phase transition(GO:1902751) |
| 0.0 | 0.5 | GO:0045494 | photoreceptor cell maintenance(GO:0045494) |
| 0.0 | 0.1 | GO:0033604 | negative regulation of catecholamine secretion(GO:0033604) |
| 0.0 | 0.1 | GO:0086043 | bundle of His cell to Purkinje myocyte signaling(GO:0086028) bundle of His cell action potential(GO:0086043) |
| 0.0 | 0.1 | GO:0032790 | ribosome disassembly(GO:0032790) |
| 0.0 | 0.1 | GO:0035435 | phosphate ion transmembrane transport(GO:0035435) |
| 0.0 | 0.5 | GO:0046677 | response to antibiotic(GO:0046677) |
| 0.0 | 0.1 | GO:0033292 | T-tubule organization(GO:0033292) protein localization to M-band(GO:0036309) protein localization to T-tubule(GO:0036371) regulation of SA node cell action potential(GO:0098907) |
| 0.0 | 0.4 | GO:0007194 | negative regulation of adenylate cyclase activity(GO:0007194) |
| 0.0 | 0.1 | GO:1900121 | negative regulation of receptor binding(GO:1900121) |
| 0.0 | 0.5 | GO:0051437 | positive regulation of ubiquitin-protein ligase activity involved in regulation of mitotic cell cycle transition(GO:0051437) |
| 0.0 | 0.3 | GO:1901661 | quinone metabolic process(GO:1901661) |
| 0.0 | 0.7 | GO:0055092 | cholesterol homeostasis(GO:0042632) sterol homeostasis(GO:0055092) |
| 0.0 | 0.3 | GO:0006884 | cell volume homeostasis(GO:0006884) |
| 0.0 | 0.1 | GO:0031119 | tRNA pseudouridine synthesis(GO:0031119) |
| 0.0 | 0.1 | GO:0098957 | anterograde axonal transport of mitochondrion(GO:0098957) |
| 0.0 | 0.0 | GO:0031161 | phosphatidylinositol catabolic process(GO:0031161) |
| 0.0 | 0.3 | GO:0008334 | histone mRNA metabolic process(GO:0008334) |
| 0.0 | 0.1 | GO:0015014 | heparan sulfate proteoglycan biosynthetic process, polysaccharide chain biosynthetic process(GO:0015014) |
| 0.0 | 0.1 | GO:0070508 | sterol import(GO:0035376) cholesterol import(GO:0070508) |
| 0.0 | 0.2 | GO:0032331 | negative regulation of chondrocyte differentiation(GO:0032331) |
| 0.0 | 0.1 | GO:0006030 | chitin metabolic process(GO:0006030) chitin catabolic process(GO:0006032) |
| 0.0 | 0.8 | GO:0030032 | lamellipodium assembly(GO:0030032) |
| 0.0 | 0.1 | GO:1903608 | protein localization to cytoplasmic stress granule(GO:1903608) |
| 0.0 | 0.2 | GO:0031648 | protein destabilization(GO:0031648) |
| 0.0 | 0.0 | GO:1903033 | regulation of microtubule plus-end binding(GO:1903031) positive regulation of microtubule plus-end binding(GO:1903033) positive regulation of microtubule binding(GO:1904528) |
| 0.0 | 0.0 | GO:0008627 | intrinsic apoptotic signaling pathway in response to osmotic stress(GO:0008627) |
| 0.0 | 0.1 | GO:0009313 | oligosaccharide catabolic process(GO:0009313) |
| 0.0 | 0.1 | GO:1904380 | protein demannosylation(GO:0036507) protein alpha-1,2-demannosylation(GO:0036508) endoplasmic reticulum mannose trimming(GO:1904380) |
| 0.0 | 0.1 | GO:0050747 | positive regulation of lipoprotein metabolic process(GO:0050747) |
| 0.0 | 0.2 | GO:0030431 | sleep(GO:0030431) |
| 0.0 | 0.1 | GO:0070050 | neuron cellular homeostasis(GO:0070050) |
| 0.0 | 0.3 | GO:0000460 | maturation of 5.8S rRNA(GO:0000460) |
| 0.0 | 0.5 | GO:0035690 | cellular response to drug(GO:0035690) |
| 0.0 | 1.0 | GO:0042384 | cilium assembly(GO:0042384) |
| 0.0 | 0.2 | GO:0007084 | mitotic nuclear envelope reassembly(GO:0007084) |
Gene overrepresentation in cellular component category:
| Log-likelihood per target | Total log-likelihood | Term | Description |
|---|---|---|---|
| 0.5 | 2.4 | GO:0034680 | integrin alpha10-beta1 complex(GO:0034680) |
| 0.5 | 4.8 | GO:0097443 | sorting endosome(GO:0097443) |
| 0.4 | 1.3 | GO:0034271 | phosphatidylinositol 3-kinase complex, class III, type I(GO:0034271) phosphatidylinositol 3-kinase complex, class III, type II(GO:0034272) |
| 0.4 | 1.5 | GO:0097196 | Shu complex(GO:0097196) |
| 0.4 | 1.8 | GO:0032301 | MutSalpha complex(GO:0032301) |
| 0.3 | 2.6 | GO:0005851 | eukaryotic translation initiation factor 2B complex(GO:0005851) |
| 0.3 | 2.5 | GO:0097442 | CA3 pyramidal cell dendrite(GO:0097442) |
| 0.3 | 1.2 | GO:0071149 | TEAD-2-YAP complex(GO:0071149) |
| 0.3 | 7.7 | GO:0044300 | cerebellar mossy fiber(GO:0044300) |
| 0.3 | 10.1 | GO:0071564 | npBAF complex(GO:0071564) |
| 0.3 | 3.0 | GO:0042382 | paraspeckles(GO:0042382) |
| 0.3 | 1.1 | GO:0032144 | 4-aminobutyrate transaminase complex(GO:0032144) |
| 0.3 | 2.3 | GO:1990761 | growth cone lamellipodium(GO:1990761) |
| 0.2 | 5.2 | GO:0005952 | cAMP-dependent protein kinase complex(GO:0005952) |
| 0.2 | 5.3 | GO:0031254 | uropod(GO:0001931) cell trailing edge(GO:0031254) |
| 0.2 | 1.4 | GO:0009331 | glycerol-3-phosphate dehydrogenase complex(GO:0009331) |
| 0.2 | 0.9 | GO:0000126 | transcription factor TFIIIB complex(GO:0000126) |
| 0.2 | 8.8 | GO:0031092 | platelet alpha granule membrane(GO:0031092) |
| 0.2 | 5.1 | GO:0001527 | microfibril(GO:0001527) fibril(GO:0043205) |
| 0.2 | 6.2 | GO:0030122 | AP-2 adaptor complex(GO:0030122) |
| 0.2 | 1.0 | GO:0005896 | interleukin-6 receptor complex(GO:0005896) |
| 0.2 | 0.9 | GO:0033263 | CORVET complex(GO:0033263) |
| 0.2 | 0.2 | GO:0005943 | phosphatidylinositol 3-kinase complex, class IA(GO:0005943) |
| 0.2 | 0.5 | GO:0030678 | mitochondrial ribonuclease P complex(GO:0030678) |
| 0.2 | 0.7 | GO:0044307 | dendritic branch(GO:0044307) |
| 0.2 | 0.9 | GO:1902560 | GMP reductase complex(GO:1902560) |
| 0.2 | 0.7 | GO:1990876 | cytoplasmic side of nuclear pore(GO:1990876) |
| 0.2 | 1.5 | GO:0046696 | lipopolysaccharide receptor complex(GO:0046696) |
| 0.2 | 3.7 | GO:0043220 | Schmidt-Lanterman incisure(GO:0043220) |
| 0.2 | 1.5 | GO:0031313 | extrinsic component of endosome membrane(GO:0031313) |
| 0.2 | 3.6 | GO:0031265 | CD95 death-inducing signaling complex(GO:0031265) |
| 0.2 | 1.1 | GO:0005658 | alpha DNA polymerase:primase complex(GO:0005658) |
| 0.2 | 5.0 | GO:0000178 | exosome (RNase complex)(GO:0000178) |
| 0.1 | 0.9 | GO:0070022 | transforming growth factor beta receptor homodimeric complex(GO:0070022) |
| 0.1 | 1.8 | GO:0016593 | Cdc73/Paf1 complex(GO:0016593) |
| 0.1 | 0.4 | GO:1990917 | sperm head plasma membrane(GO:1990913) ooplasm(GO:1990917) |
| 0.1 | 0.4 | GO:0033185 | dolichol-phosphate-mannose synthase complex(GO:0033185) |
| 0.1 | 0.9 | GO:1990246 | uniplex complex(GO:1990246) |
| 0.1 | 2.1 | GO:0071203 | WASH complex(GO:0071203) |
| 0.1 | 0.8 | GO:0097013 | phagocytic vesicle lumen(GO:0097013) |
| 0.1 | 0.4 | GO:0097224 | sperm connecting piece(GO:0097224) |
| 0.1 | 0.5 | GO:0033257 | Bcl3/NF-kappaB2 complex(GO:0033257) |
| 0.1 | 0.7 | GO:0048787 | presynaptic active zone membrane(GO:0048787) |
| 0.1 | 0.9 | GO:0070775 | H3 histone acetyltransferase complex(GO:0070775) MOZ/MORF histone acetyltransferase complex(GO:0070776) |
| 0.1 | 0.5 | GO:0070032 | synaptobrevin 2-SNAP-25-syntaxin-1a-complexin I complex(GO:0070032) |
| 0.1 | 0.7 | GO:0000308 | cytoplasmic cyclin-dependent protein kinase holoenzyme complex(GO:0000308) |
| 0.1 | 0.3 | GO:0035189 | Rb-E2F complex(GO:0035189) |
| 0.1 | 0.4 | GO:0031933 | telomeric heterochromatin(GO:0031933) |
| 0.1 | 20.5 | GO:0032993 | protein-DNA complex(GO:0032993) |
| 0.1 | 1.2 | GO:0005785 | signal recognition particle receptor complex(GO:0005785) |
| 0.1 | 0.9 | GO:0036128 | CatSper complex(GO:0036128) |
| 0.1 | 1.4 | GO:0012510 | trans-Golgi network transport vesicle membrane(GO:0012510) |
| 0.1 | 0.6 | GO:0034715 | pICln-Sm protein complex(GO:0034715) |
| 0.1 | 1.1 | GO:0005688 | U6 snRNP(GO:0005688) |
| 0.1 | 0.3 | GO:0033150 | cytoskeletal calyx(GO:0033150) |
| 0.1 | 0.2 | GO:0097679 | other organism cytoplasm(GO:0097679) |
| 0.1 | 0.3 | GO:0072536 | interleukin-23 receptor complex(GO:0072536) |
| 0.1 | 0.2 | GO:0031084 | BLOC-2 complex(GO:0031084) |
| 0.1 | 2.3 | GO:0005779 | integral component of peroxisomal membrane(GO:0005779) intrinsic component of peroxisomal membrane(GO:0031231) |
| 0.1 | 1.3 | GO:0045180 | basal cortex(GO:0045180) |
| 0.1 | 1.2 | GO:0000813 | ESCRT I complex(GO:0000813) |
| 0.1 | 0.8 | GO:0030991 | intraciliary transport particle A(GO:0030991) |
| 0.1 | 0.9 | GO:0033180 | proton-transporting V-type ATPase, V1 domain(GO:0033180) |
| 0.1 | 0.8 | GO:0097418 | neurofibrillary tangle(GO:0097418) |
| 0.1 | 0.8 | GO:0000347 | THO complex(GO:0000347) THO complex part of transcription export complex(GO:0000445) |
| 0.1 | 0.7 | GO:0032389 | MutLalpha complex(GO:0032389) |
| 0.1 | 0.3 | GO:0044308 | axonal spine(GO:0044308) |
| 0.1 | 1.2 | GO:0032426 | stereocilium tip(GO:0032426) |
| 0.1 | 2.5 | GO:0032839 | dendrite cytoplasm(GO:0032839) |
| 0.1 | 0.9 | GO:0030015 | CCR4-NOT core complex(GO:0030015) |
| 0.1 | 0.9 | GO:0000778 | condensed nuclear chromosome kinetochore(GO:0000778) |
| 0.1 | 0.4 | GO:0032311 | angiogenin-PRI complex(GO:0032311) |
| 0.1 | 0.6 | GO:0042406 | extrinsic component of endoplasmic reticulum membrane(GO:0042406) |
| 0.1 | 0.6 | GO:0000220 | vacuolar proton-transporting V-type ATPase, V0 domain(GO:0000220) |
| 0.1 | 1.1 | GO:0042613 | MHC class II protein complex(GO:0042613) |
| 0.1 | 0.7 | GO:0010009 | cytoplasmic side of endosome membrane(GO:0010009) |
| 0.1 | 0.4 | GO:0005663 | DNA replication factor C complex(GO:0005663) |
| 0.1 | 1.2 | GO:0097038 | perinuclear endoplasmic reticulum(GO:0097038) |
| 0.1 | 0.3 | GO:0071012 | catalytic step 1 spliceosome(GO:0071012) |
| 0.1 | 0.3 | GO:0035867 | alphav-beta3 integrin-IGF-1-IGF1R complex(GO:0035867) |
| 0.1 | 10.3 | GO:0005777 | peroxisome(GO:0005777) microbody(GO:0042579) |
| 0.1 | 0.3 | GO:0005854 | nascent polypeptide-associated complex(GO:0005854) |
| 0.1 | 0.2 | GO:0031510 | SUMO activating enzyme complex(GO:0031510) |
| 0.1 | 2.1 | GO:0031527 | filopodium membrane(GO:0031527) |
| 0.1 | 0.7 | GO:0042555 | MCM complex(GO:0042555) |
| 0.1 | 0.5 | GO:0071546 | pi-body(GO:0071546) |
| 0.0 | 0.3 | GO:0005687 | U4 snRNP(GO:0005687) |
| 0.0 | 0.1 | GO:1905103 | integral component of lysosomal membrane(GO:1905103) |
| 0.0 | 15.5 | GO:0030027 | lamellipodium(GO:0030027) |
| 0.0 | 0.6 | GO:0070578 | RISC-loading complex(GO:0070578) |
| 0.0 | 1.1 | GO:0031083 | BLOC-1 complex(GO:0031083) |
| 0.0 | 0.6 | GO:0043219 | lateral loop(GO:0043219) |
| 0.0 | 0.5 | GO:0031465 | Cul4B-RING E3 ubiquitin ligase complex(GO:0031465) |
| 0.0 | 2.8 | GO:0005801 | cis-Golgi network(GO:0005801) |
| 0.0 | 2.4 | GO:0009925 | basal plasma membrane(GO:0009925) |
| 0.0 | 0.3 | GO:0033503 | HULC complex(GO:0033503) |
| 0.0 | 0.5 | GO:0098647 | collagen type VI trimer(GO:0005589) collagen beaded filament(GO:0098647) |
| 0.0 | 0.2 | GO:0017101 | aminoacyl-tRNA synthetase multienzyme complex(GO:0017101) |
| 0.0 | 1.1 | GO:0005614 | interstitial matrix(GO:0005614) |
| 0.0 | 0.1 | GO:0048269 | methionine adenosyltransferase complex(GO:0048269) |
| 0.0 | 0.6 | GO:0014731 | spectrin-associated cytoskeleton(GO:0014731) |
| 0.0 | 6.7 | GO:0030427 | site of polarized growth(GO:0030427) |
| 0.0 | 0.5 | GO:0034464 | BBSome(GO:0034464) |
| 0.0 | 0.2 | GO:0034366 | spherical high-density lipoprotein particle(GO:0034366) |
| 0.0 | 0.5 | GO:0044666 | MLL3/4 complex(GO:0044666) |
| 0.0 | 0.2 | GO:0044305 | calyx of Held(GO:0044305) |
| 0.0 | 0.6 | GO:0008091 | spectrin(GO:0008091) |
| 0.0 | 0.4 | GO:0072546 | ER membrane protein complex(GO:0072546) |
| 0.0 | 0.2 | GO:0070847 | core mediator complex(GO:0070847) |
| 0.0 | 0.8 | GO:0098576 | lumenal side of membrane(GO:0098576) |
| 0.0 | 2.3 | GO:0022627 | cytosolic small ribosomal subunit(GO:0022627) |
| 0.0 | 0.4 | GO:0008385 | IkappaB kinase complex(GO:0008385) |
| 0.0 | 1.1 | GO:0005680 | anaphase-promoting complex(GO:0005680) |
| 0.0 | 0.2 | GO:0097025 | MPP7-DLG1-LIN7 complex(GO:0097025) |
| 0.0 | 0.2 | GO:1990316 | ATG1/ULK1 kinase complex(GO:1990316) |
| 0.0 | 1.2 | GO:0016592 | mediator complex(GO:0016592) |
| 0.0 | 0.1 | GO:0005899 | insulin receptor complex(GO:0005899) |
| 0.0 | 1.0 | GO:0099738 | cell cortex region(GO:0099738) |
| 0.0 | 0.2 | GO:0005967 | mitochondrial pyruvate dehydrogenase complex(GO:0005967) |
| 0.0 | 0.9 | GO:0035145 | exon-exon junction complex(GO:0035145) |
| 0.0 | 0.4 | GO:0002178 | palmitoyltransferase complex(GO:0002178) |
| 0.0 | 0.4 | GO:0001520 | outer dense fiber(GO:0001520) |
| 0.0 | 1.1 | GO:0000159 | protein phosphatase type 2A complex(GO:0000159) |
| 0.0 | 0.2 | GO:0060293 | P granule(GO:0043186) pole plasm(GO:0045495) germ plasm(GO:0060293) |
| 0.0 | 0.3 | GO:0070531 | BRCA1-A complex(GO:0070531) |
| 0.0 | 3.4 | GO:0043202 | lysosomal lumen(GO:0043202) |
| 0.0 | 0.1 | GO:0032044 | DSIF complex(GO:0032044) |
| 0.0 | 0.1 | GO:0005869 | dynactin complex(GO:0005869) |
| 0.0 | 0.2 | GO:0070852 | cell body fiber(GO:0070852) |
| 0.0 | 0.1 | GO:0090571 | RNA polymerase II transcription repressor complex(GO:0090571) |
| 0.0 | 0.3 | GO:0005689 | U12-type spliceosomal complex(GO:0005689) |
| 0.0 | 0.4 | GO:0001741 | XY body(GO:0001741) |
| 0.0 | 2.2 | GO:0030672 | synaptic vesicle membrane(GO:0030672) exocytic vesicle membrane(GO:0099501) |
| 0.0 | 0.1 | GO:0031262 | Ndc80 complex(GO:0031262) |
| 0.0 | 0.3 | GO:0033588 | Elongator holoenzyme complex(GO:0033588) |
| 0.0 | 0.2 | GO:0030891 | VCB complex(GO:0030891) |
| 0.0 | 0.3 | GO:0031588 | nucleotide-activated protein kinase complex(GO:0031588) |
| 0.0 | 6.2 | GO:0016323 | basolateral plasma membrane(GO:0016323) |
| 0.0 | 0.7 | GO:0043034 | costamere(GO:0043034) |
| 0.0 | 0.3 | GO:0030008 | TRAPP complex(GO:0030008) |
| 0.0 | 0.5 | GO:0034362 | low-density lipoprotein particle(GO:0034362) |
| 0.0 | 0.4 | GO:0031235 | intrinsic component of the cytoplasmic side of the plasma membrane(GO:0031235) |
| 0.0 | 0.2 | GO:0042105 | alpha-beta T cell receptor complex(GO:0042105) |
| 0.0 | 0.1 | GO:0098837 | postsynaptic recycling endosome(GO:0098837) |
| 0.0 | 0.7 | GO:0031430 | M band(GO:0031430) |
| 0.0 | 0.4 | GO:0031089 | platelet dense granule lumen(GO:0031089) |
| 0.0 | 0.2 | GO:0005853 | eukaryotic translation elongation factor 1 complex(GO:0005853) |
| 0.0 | 0.1 | GO:0098839 | postsynaptic density membrane(GO:0098839) |
| 0.0 | 0.3 | GO:0005686 | U2 snRNP(GO:0005686) |
| 0.0 | 0.3 | GO:0043240 | Fanconi anaemia nuclear complex(GO:0043240) |
| 0.0 | 0.1 | GO:0005652 | nuclear lamina(GO:0005652) |
| 0.0 | 0.1 | GO:0031905 | early endosome lumen(GO:0031905) |
| 0.0 | 0.0 | GO:0044326 | dendritic spine neck(GO:0044326) |
| 0.0 | 0.0 | GO:0001534 | radial spoke(GO:0001534) |
| 0.0 | 2.3 | GO:0031901 | early endosome membrane(GO:0031901) |
| 0.0 | 0.5 | GO:0030992 | intraciliary transport particle B(GO:0030992) |
| 0.0 | 1.5 | GO:0101003 | ficolin-1-rich granule membrane(GO:0101003) |
| 0.0 | 0.8 | GO:0008023 | transcription elongation factor complex(GO:0008023) |
| 0.0 | 0.2 | GO:0019774 | proteasome core complex, beta-subunit complex(GO:0019774) |
| 0.0 | 0.1 | GO:0033179 | vacuolar proton-transporting V-type ATPase complex(GO:0016471) proton-transporting V-type ATPase, V0 domain(GO:0033179) |
| 0.0 | 0.1 | GO:0072559 | NLRP3 inflammasome complex(GO:0072559) |
| 0.0 | 0.2 | GO:0045275 | mitochondrial respiratory chain complex III(GO:0005750) respiratory chain complex III(GO:0045275) |
| 0.0 | 0.1 | GO:0000506 | glycosylphosphatidylinositol-N-acetylglucosaminyltransferase (GPI-GnT) complex(GO:0000506) |
| 0.0 | 0.6 | GO:0045334 | clathrin-coated endocytic vesicle(GO:0045334) |
| 0.0 | 0.1 | GO:0036157 | outer dynein arm(GO:0036157) |
| 0.0 | 0.1 | GO:0034098 | VCP-NPL4-UFD1 AAA ATPase complex(GO:0034098) |
| 0.0 | 0.4 | GO:0048786 | presynaptic active zone(GO:0048786) |
| 0.0 | 0.1 | GO:0033269 | internode region of axon(GO:0033269) |
| 0.0 | 0.1 | GO:0036056 | filtration diaphragm(GO:0036056) slit diaphragm(GO:0036057) |
| 0.0 | 0.0 | GO:0030981 | cortical microtubule cytoskeleton(GO:0030981) |
| 0.0 | 0.4 | GO:0030687 | preribosome, large subunit precursor(GO:0030687) |
| 0.0 | 0.1 | GO:0036513 | Derlin-1 retrotranslocation complex(GO:0036513) |
| 0.0 | 1.7 | GO:0005882 | intermediate filament(GO:0005882) |
| 0.0 | 1.2 | GO:0043204 | perikaryon(GO:0043204) |
| 0.0 | 0.8 | GO:0031519 | PcG protein complex(GO:0031519) |
| 0.0 | 0.3 | GO:0032809 | neuronal cell body membrane(GO:0032809) cell body membrane(GO:0044298) |
Gene overrepresentation in molecular function category:
| Log-likelihood per target | Total log-likelihood | Term | Description |
|---|---|---|---|
| 1.5 | 4.6 | GO:0046577 | long-chain-alcohol oxidase activity(GO:0046577) |
| 1.4 | 4.1 | GO:0004119 | cGMP-inhibited cyclic-nucleotide phosphodiesterase activity(GO:0004119) |
| 1.0 | 4.9 | GO:0050436 | microfibril binding(GO:0050436) |
| 0.9 | 2.8 | GO:0004531 | deoxyribonuclease II activity(GO:0004531) |
| 0.9 | 2.8 | GO:0003692 | left-handed Z-DNA binding(GO:0003692) |
| 0.9 | 5.4 | GO:0060961 | phospholipase D inhibitor activity(GO:0060961) |
| 0.9 | 18.3 | GO:0001087 | transcription factor activity, sequence-specific DNA binding, RNA polymerase recruiting(GO:0001011) transcription factor activity, TFIIB-class binding(GO:0001087) |
| 0.6 | 4.5 | GO:0038085 | vascular endothelial growth factor binding(GO:0038085) |
| 0.6 | 1.7 | GO:0003858 | 3-hydroxybutyrate dehydrogenase activity(GO:0003858) |
| 0.5 | 1.6 | GO:0008267 | poly-glutamine tract binding(GO:0008267) |
| 0.5 | 2.0 | GO:0032089 | NACHT domain binding(GO:0032089) |
| 0.5 | 1.5 | GO:0008441 | 3'(2'),5'-bisphosphate nucleotidase activity(GO:0008441) |
| 0.5 | 14.8 | GO:0008093 | cytoskeletal adaptor activity(GO:0008093) |
| 0.5 | 2.0 | GO:0004948 | calcitonin receptor activity(GO:0004948) |
| 0.4 | 2.2 | GO:0080019 | fatty-acyl-CoA reductase (alcohol-forming) activity(GO:0080019) |
| 0.4 | 1.3 | GO:0015229 | L-ascorbate:sodium symporter activity(GO:0008520) sodium-dependent multivitamin transmembrane transporter activity(GO:0008523) L-ascorbic acid transporter activity(GO:0015229) sodium-dependent L-ascorbate transmembrane transporter activity(GO:0070890) |
| 0.4 | 3.4 | GO:0015093 | ferrous iron transmembrane transporter activity(GO:0015093) |
| 0.4 | 1.2 | GO:0043035 | chromatin insulator sequence binding(GO:0043035) |
| 0.4 | 1.6 | GO:0001069 | regulatory region RNA binding(GO:0001069) |
| 0.4 | 1.8 | GO:0003986 | acetyl-CoA hydrolase activity(GO:0003986) |
| 0.4 | 1.4 | GO:0072320 | volume-sensitive chloride channel activity(GO:0072320) |
| 0.4 | 1.8 | GO:0032143 | single thymine insertion binding(GO:0032143) |
| 0.4 | 4.6 | GO:0071933 | Arp2/3 complex binding(GO:0071933) |
| 0.3 | 1.4 | GO:0019144 | ADP-sugar diphosphatase activity(GO:0019144) |
| 0.3 | 1.0 | GO:0070119 | ciliary neurotrophic factor binding(GO:0070119) |
| 0.3 | 2.4 | GO:0098639 | collagen binding involved in cell-matrix adhesion(GO:0098639) |
| 0.3 | 0.9 | GO:0015616 | DNA translocase activity(GO:0015616) |
| 0.3 | 1.7 | GO:0004376 | glycolipid mannosyltransferase activity(GO:0004376) |
| 0.3 | 1.1 | GO:0008798 | beta-aspartyl-peptidase activity(GO:0008798) |
| 0.3 | 3.7 | GO:0008559 | xenobiotic-transporting ATPase activity(GO:0008559) |
| 0.3 | 0.8 | GO:1904599 | advanced glycation end-product binding(GO:1904599) |
| 0.3 | 1.1 | GO:0004419 | hydroxymethylglutaryl-CoA lyase activity(GO:0004419) |
| 0.3 | 1.1 | GO:0032145 | 4-aminobutyrate transaminase activity(GO:0003867) succinate-semialdehyde dehydrogenase binding(GO:0032145) (S)-3-amino-2-methylpropionate transaminase activity(GO:0047298) |
| 0.3 | 1.3 | GO:0052795 | exo-alpha-(2->3)-sialidase activity(GO:0052794) exo-alpha-(2->6)-sialidase activity(GO:0052795) exo-alpha-(2->8)-sialidase activity(GO:0052796) |
| 0.3 | 1.3 | GO:0008240 | tripeptidyl-peptidase activity(GO:0008240) |
| 0.3 | 0.8 | GO:0052798 | beta-galactoside alpha-2,3-sialyltransferase activity(GO:0052798) |
| 0.2 | 1.9 | GO:0070892 | lipoteichoic acid receptor activity(GO:0070892) |
| 0.2 | 1.0 | GO:0102007 | lactonohydrolase activity(GO:0046573) acyl-L-homoserine-lactone lactonohydrolase activity(GO:0102007) |
| 0.2 | 0.7 | GO:0003860 | 3-hydroxyisobutyryl-CoA hydrolase activity(GO:0003860) |
| 0.2 | 0.7 | GO:0004492 | methylmalonyl-CoA decarboxylase activity(GO:0004492) |
| 0.2 | 0.9 | GO:0001026 | TFIIIB-type transcription factor activity(GO:0001026) |
| 0.2 | 0.6 | GO:0004556 | alpha-amylase activity(GO:0004556) |
| 0.2 | 0.8 | GO:0070905 | serine binding(GO:0070905) |
| 0.2 | 1.3 | GO:0015235 | cobalamin transporter activity(GO:0015235) |
| 0.2 | 3.2 | GO:0004691 | cAMP-dependent protein kinase activity(GO:0004691) |
| 0.2 | 1.4 | GO:0004962 | endothelin receptor activity(GO:0004962) |
| 0.2 | 1.2 | GO:0004563 | beta-N-acetylhexosaminidase activity(GO:0004563) |
| 0.2 | 1.0 | GO:0019834 | phospholipase A2 inhibitor activity(GO:0019834) |
| 0.2 | 0.8 | GO:0016524 | latrotoxin receptor activity(GO:0016524) |
| 0.2 | 0.9 | GO:0003896 | DNA primase activity(GO:0003896) |
| 0.2 | 0.5 | GO:0047006 | 17-alpha,20-alpha-dihydroxypregn-4-en-3-one dehydrogenase activity(GO:0047006) |
| 0.2 | 1.4 | GO:0017040 | ceramidase activity(GO:0017040) |
| 0.2 | 1.6 | GO:0016206 | catechol O-methyltransferase activity(GO:0016206) |
| 0.2 | 0.9 | GO:0016657 | GMP reductase activity(GO:0003920) oxidoreductase activity, acting on NAD(P)H, nitrogenous group as acceptor(GO:0016657) |
| 0.2 | 0.8 | GO:0032558 | adenyl deoxyribonucleotide binding(GO:0032558) dATP binding(GO:0032564) |
| 0.2 | 1.6 | GO:0004321 | fatty-acyl-CoA synthase activity(GO:0004321) |
| 0.2 | 0.6 | GO:0046933 | proton-transporting ATP synthase activity, rotational mechanism(GO:0046933) |
| 0.2 | 0.6 | GO:0008169 | C-methyltransferase activity(GO:0008169) |
| 0.2 | 0.6 | GO:0016211 | glutamate-ammonia ligase activity(GO:0004356) ammonia ligase activity(GO:0016211) acid-ammonia (or amide) ligase activity(GO:0016880) |
| 0.2 | 0.5 | GO:0005174 | CD40 receptor binding(GO:0005174) |
| 0.2 | 4.4 | GO:0005229 | intracellular calcium activated chloride channel activity(GO:0005229) |
| 0.2 | 3.2 | GO:0016892 | endoribonuclease activity, producing 3'-phosphomonoesters(GO:0016892) |
| 0.2 | 0.6 | GO:0017077 | oxidative phosphorylation uncoupler activity(GO:0017077) |
| 0.1 | 0.7 | GO:0042954 | lipoprotein transporter activity(GO:0042954) |
| 0.1 | 0.3 | GO:0000995 | transcription factor activity, core RNA polymerase III binding(GO:0000995) |
| 0.1 | 0.6 | GO:1904492 | Ac-Asp-Glu binding(GO:1904492) tetrahydrofolyl-poly(glutamate) polymer binding(GO:1904493) |
| 0.1 | 2.9 | GO:0031957 | very long-chain fatty acid-CoA ligase activity(GO:0031957) |
| 0.1 | 0.6 | GO:0004909 | interleukin-1, Type I, activating receptor activity(GO:0004909) |
| 0.1 | 0.4 | GO:0004798 | thymidylate kinase activity(GO:0004798) |
| 0.1 | 0.4 | GO:0004582 | dolichyl-phosphate beta-D-mannosyltransferase activity(GO:0004582) |
| 0.1 | 0.9 | GO:0016019 | peptidoglycan receptor activity(GO:0016019) |
| 0.1 | 1.6 | GO:0004303 | estradiol 17-beta-dehydrogenase activity(GO:0004303) |
| 0.1 | 0.8 | GO:0050659 | N-acetylgalactosamine 4-sulfate 6-O-sulfotransferase activity(GO:0050659) |
| 0.1 | 0.4 | GO:0004958 | prostaglandin F receptor activity(GO:0004958) |
| 0.1 | 1.5 | GO:0000405 | bubble DNA binding(GO:0000405) |
| 0.1 | 1.8 | GO:0030957 | Tat protein binding(GO:0030957) |
| 0.1 | 0.7 | GO:0004882 | androgen receptor activity(GO:0004882) |
| 0.1 | 0.5 | GO:0050510 | N-acetylgalactosaminyl-proteoglycan 3-beta-glucuronosyltransferase activity(GO:0050510) |
| 0.1 | 0.6 | GO:0047288 | monosialoganglioside sialyltransferase activity(GO:0047288) |
| 0.1 | 9.8 | GO:0001105 | RNA polymerase II transcription coactivator activity(GO:0001105) |
| 0.1 | 0.4 | GO:0070052 | collagen V binding(GO:0070052) |
| 0.1 | 0.6 | GO:0004447 | iodide peroxidase activity(GO:0004447) |
| 0.1 | 0.7 | GO:0048101 | calcium- and calmodulin-regulated 3',5'-cyclic-GMP phosphodiesterase activity(GO:0048101) |
| 0.1 | 3.4 | GO:0002162 | dystroglycan binding(GO:0002162) |
| 0.1 | 0.8 | GO:0102345 | 3-hydroxy-behenoyl-CoA dehydratase activity(GO:0102344) 3-hydroxy-lignoceroyl-CoA dehydratase activity(GO:0102345) |
| 0.1 | 7.0 | GO:0030552 | cAMP binding(GO:0030552) |
| 0.1 | 1.4 | GO:0003857 | 3-hydroxyacyl-CoA dehydrogenase activity(GO:0003857) |
| 0.1 | 0.7 | GO:0001875 | lipopolysaccharide receptor activity(GO:0001875) |
| 0.1 | 2.0 | GO:0017166 | vinculin binding(GO:0017166) |
| 0.1 | 1.9 | GO:0008140 | cAMP response element binding protein binding(GO:0008140) |
| 0.1 | 0.3 | GO:0033858 | N-acetylgalactosamine kinase activity(GO:0033858) |
| 0.1 | 0.5 | GO:0016429 | tRNA (adenine-N1-)-methyltransferase activity(GO:0016429) |
| 0.1 | 0.6 | GO:0039552 | RIG-I binding(GO:0039552) |
| 0.1 | 0.8 | GO:0036132 | 13-prostaglandin reductase activity(GO:0036132) 15-oxoprostaglandin 13-oxidase activity(GO:0047522) |
| 0.1 | 1.2 | GO:0050291 | sphingosine N-acyltransferase activity(GO:0050291) |
| 0.1 | 4.6 | GO:0001106 | RNA polymerase II transcription corepressor activity(GO:0001106) |
| 0.1 | 3.3 | GO:0008327 | methyl-CpG binding(GO:0008327) |
| 0.1 | 4.6 | GO:0051019 | mitogen-activated protein kinase binding(GO:0051019) |
| 0.1 | 4.3 | GO:0001191 | transcriptional repressor activity, RNA polymerase II transcription factor binding(GO:0001191) |
| 0.1 | 1.4 | GO:0030215 | semaphorin receptor binding(GO:0030215) |
| 0.1 | 0.5 | GO:0035243 | protein-arginine omega-N symmetric methyltransferase activity(GO:0035243) |
| 0.1 | 0.4 | GO:0001135 | transcription factor activity, RNA polymerase II transcription factor recruiting(GO:0001135) |
| 0.1 | 0.4 | GO:0031750 | D3 dopamine receptor binding(GO:0031750) |
| 0.1 | 0.2 | GO:0017116 | single-stranded DNA-dependent ATP-dependent DNA helicase activity(GO:0017116) |
| 0.1 | 0.3 | GO:0050253 | retinyl-palmitate esterase activity(GO:0050253) |
| 0.1 | 1.5 | GO:0015174 | basic amino acid transmembrane transporter activity(GO:0015174) |
| 0.1 | 0.3 | GO:0000386 | second spliceosomal transesterification activity(GO:0000386) |
| 0.1 | 1.0 | GO:0032052 | bile acid binding(GO:0032052) |
| 0.1 | 1.1 | GO:0001222 | transcription corepressor binding(GO:0001222) |
| 0.1 | 1.2 | GO:0032395 | MHC class II receptor activity(GO:0032395) |
| 0.1 | 0.3 | GO:0004504 | peptidylglycine monooxygenase activity(GO:0004504) peptidylamidoglycolate lyase activity(GO:0004598) |
| 0.1 | 0.2 | GO:0008670 | 2,4-dienoyl-CoA reductase (NADPH) activity(GO:0008670) trans-2-enoyl-CoA reductase (NADPH) activity(GO:0019166) |
| 0.1 | 0.2 | GO:0071209 | U7 snRNA binding(GO:0071209) |
| 0.1 | 0.3 | GO:0042019 | interleukin-23 binding(GO:0042019) interleukin-23 receptor activity(GO:0042020) |
| 0.1 | 0.4 | GO:0016934 | extracellular-glycine-gated ion channel activity(GO:0016933) extracellular-glycine-gated chloride channel activity(GO:0016934) |
| 0.1 | 0.8 | GO:0017169 | CDP-alcohol phosphatidyltransferase activity(GO:0017169) |
| 0.1 | 0.2 | GO:0002094 | polyprenyltransferase activity(GO:0002094) |
| 0.1 | 0.3 | GO:0016428 | tRNA (cytosine-5-)-methyltransferase activity(GO:0016428) |
| 0.1 | 1.1 | GO:0055056 | D-glucose transmembrane transporter activity(GO:0055056) |
| 0.1 | 0.2 | GO:0045145 | single-stranded DNA 5'-3' exodeoxyribonuclease activity(GO:0045145) |
| 0.1 | 3.4 | GO:0000175 | 3'-5'-exoribonuclease activity(GO:0000175) |
| 0.1 | 0.4 | GO:0003886 | DNA (cytosine-5-)-methyltransferase activity(GO:0003886) |
| 0.1 | 0.3 | GO:0005173 | stem cell factor receptor binding(GO:0005173) |
| 0.1 | 0.6 | GO:0008379 | thioredoxin peroxidase activity(GO:0008379) |
| 0.1 | 0.3 | GO:0043273 | CTPase activity(GO:0043273) |
| 0.1 | 0.4 | GO:0004647 | phosphoserine phosphatase activity(GO:0004647) |
| 0.1 | 0.8 | GO:0004115 | 3',5'-cyclic-AMP phosphodiesterase activity(GO:0004115) |
| 0.1 | 0.9 | GO:0008381 | mechanically-gated ion channel activity(GO:0008381) mechanically gated channel activity(GO:0022833) |
| 0.1 | 0.8 | GO:0015279 | store-operated calcium channel activity(GO:0015279) |
| 0.1 | 0.9 | GO:0031821 | G-protein coupled serotonin receptor binding(GO:0031821) |
| 0.1 | 0.5 | GO:0030144 | alpha-1,6-mannosylglycoprotein 6-beta-N-acetylglucosaminyltransferase activity(GO:0030144) |
| 0.1 | 1.6 | GO:0008191 | metalloendopeptidase inhibitor activity(GO:0008191) |
| 0.1 | 0.6 | GO:0019957 | C-C chemokine binding(GO:0019957) |
| 0.1 | 0.3 | GO:0015319 | sodium:inorganic phosphate symporter activity(GO:0015319) |
| 0.1 | 0.2 | GO:0032090 | Pyrin domain binding(GO:0032090) |
| 0.1 | 0.9 | GO:0045159 | myosin II binding(GO:0045159) |
| 0.1 | 0.7 | GO:0004128 | cytochrome-b5 reductase activity, acting on NAD(P)H(GO:0004128) |
| 0.1 | 0.2 | GO:0004711 | ribosomal protein S6 kinase activity(GO:0004711) |
| 0.1 | 1.9 | GO:0004708 | MAP kinase kinase activity(GO:0004708) |
| 0.1 | 0.6 | GO:0001162 | RNA polymerase II intronic transcription regulatory region sequence-specific DNA binding(GO:0001162) |
| 0.1 | 0.7 | GO:0050692 | DBD domain binding(GO:0050692) |
| 0.1 | 0.2 | GO:0005011 | macrophage colony-stimulating factor receptor activity(GO:0005011) |
| 0.1 | 1.7 | GO:0031005 | filamin binding(GO:0031005) |
| 0.1 | 0.3 | GO:0061676 | importin-alpha family protein binding(GO:0061676) |
| 0.1 | 0.4 | GO:0022850 | serotonin-gated cation channel activity(GO:0022850) |
| 0.1 | 0.5 | GO:0003960 | NADPH:quinone reductase activity(GO:0003960) |
| 0.1 | 0.4 | GO:0048408 | epidermal growth factor binding(GO:0048408) |
| 0.1 | 1.1 | GO:1900750 | glutathione binding(GO:0043295) oligopeptide binding(GO:1900750) |
| 0.1 | 0.2 | GO:0005415 | nucleoside:sodium symporter activity(GO:0005415) |
| 0.1 | 0.9 | GO:0043422 | protein kinase B binding(GO:0043422) |
| 0.1 | 1.0 | GO:0005132 | type I interferon receptor binding(GO:0005132) |
| 0.1 | 0.3 | GO:0016972 | thiol oxidase activity(GO:0016972) |
| 0.1 | 2.1 | GO:0017075 | syntaxin-1 binding(GO:0017075) |
| 0.1 | 0.6 | GO:0042731 | PH domain binding(GO:0042731) |
| 0.1 | 1.4 | GO:0005528 | macrolide binding(GO:0005527) FK506 binding(GO:0005528) |
| 0.1 | 2.0 | GO:0001972 | retinoic acid binding(GO:0001972) |
| 0.1 | 2.2 | GO:0005123 | death receptor binding(GO:0005123) |
| 0.1 | 1.3 | GO:0050811 | GABA receptor binding(GO:0050811) |
| 0.1 | 0.8 | GO:0005247 | voltage-gated chloride channel activity(GO:0005247) |
| 0.1 | 0.2 | GO:0052596 | tryptamine:oxygen oxidoreductase (deaminating) activity(GO:0052593) aminoacetone:oxygen oxidoreductase(deaminating) activity(GO:0052594) aliphatic-amine oxidase activity(GO:0052595) phenethylamine:oxygen oxidoreductase (deaminating) activity(GO:0052596) |
| 0.1 | 0.3 | GO:0004905 | type I interferon receptor activity(GO:0004905) |
| 0.1 | 1.5 | GO:0001221 | transcription cofactor binding(GO:0001221) |
| 0.1 | 0.2 | GO:0051377 | mannose-ethanolamine phosphotransferase activity(GO:0051377) |
| 0.1 | 0.3 | GO:0052656 | branched-chain-amino-acid transaminase activity(GO:0004084) L-leucine transaminase activity(GO:0052654) L-valine transaminase activity(GO:0052655) L-isoleucine transaminase activity(GO:0052656) |
| 0.1 | 1.3 | GO:0005112 | Notch binding(GO:0005112) |
| 0.1 | 0.5 | GO:0005094 | Rho GDP-dissociation inhibitor activity(GO:0005094) |
| 0.1 | 1.0 | GO:0003906 | DNA-(apurinic or apyrimidinic site) lyase activity(GO:0003906) |
| 0.0 | 1.2 | GO:0098748 | clathrin adaptor activity(GO:0035615) endocytic adaptor activity(GO:0098748) |
| 0.0 | 0.9 | GO:0097016 | L27 domain binding(GO:0097016) |
| 0.0 | 3.1 | GO:0031491 | nucleosome binding(GO:0031491) |
| 0.0 | 0.7 | GO:0035497 | cAMP response element binding(GO:0035497) |
| 0.0 | 0.7 | GO:0045504 | dynein heavy chain binding(GO:0045504) |
| 0.0 | 1.1 | GO:0051787 | misfolded protein binding(GO:0051787) |
| 0.0 | 2.0 | GO:0004364 | glutathione transferase activity(GO:0004364) |
| 0.0 | 0.7 | GO:0005172 | vascular endothelial growth factor receptor binding(GO:0005172) |
| 0.0 | 0.3 | GO:0030267 | hydroxypyruvate reductase activity(GO:0016618) glyoxylate reductase (NADP) activity(GO:0030267) |
| 0.0 | 1.8 | GO:0001104 | RNA polymerase II transcription cofactor activity(GO:0001104) |
| 0.0 | 0.8 | GO:0005049 | nuclear export signal receptor activity(GO:0005049) |
| 0.0 | 0.1 | GO:0004505 | phenylalanine 4-monooxygenase activity(GO:0004505) |
| 0.0 | 0.2 | GO:0030622 | U4atac snRNA binding(GO:0030622) |
| 0.0 | 0.5 | GO:0008430 | selenium binding(GO:0008430) |
| 0.0 | 0.2 | GO:0016520 | growth hormone-releasing hormone receptor activity(GO:0016520) |
| 0.0 | 0.2 | GO:0004677 | DNA-dependent protein kinase activity(GO:0004677) |
| 0.0 | 0.2 | GO:0004461 | lactose synthase activity(GO:0004461) |
| 0.0 | 0.7 | GO:0034713 | type I transforming growth factor beta receptor binding(GO:0034713) |
| 0.0 | 0.1 | GO:0016639 | oxidoreductase activity, acting on the CH-NH2 group of donors, NAD or NADP as acceptor(GO:0016639) |
| 0.0 | 0.2 | GO:0003865 | 3-oxo-5-alpha-steroid 4-dehydrogenase activity(GO:0003865) steroid dehydrogenase activity, acting on the CH-CH group of donors(GO:0033765) cholestenone 5-alpha-reductase activity(GO:0047751) |
| 0.0 | 0.5 | GO:0015129 | lactate transmembrane transporter activity(GO:0015129) |
| 0.0 | 0.2 | GO:1990460 | leptin receptor binding(GO:1990460) |
| 0.0 | 0.6 | GO:0022820 | potassium:chloride symporter activity(GO:0015379) potassium ion symporter activity(GO:0022820) |
| 0.0 | 0.3 | GO:0016403 | dimethylargininase activity(GO:0016403) |
| 0.0 | 0.7 | GO:0030983 | mismatched DNA binding(GO:0030983) |
| 0.0 | 0.4 | GO:0015165 | pyrimidine nucleotide-sugar transmembrane transporter activity(GO:0015165) |
| 0.0 | 0.2 | GO:0016418 | S-acetyltransferase activity(GO:0016418) |
| 0.0 | 1.2 | GO:0035198 | miRNA binding(GO:0035198) |
| 0.0 | 1.3 | GO:0016646 | oxidoreductase activity, acting on the CH-NH group of donors, NAD or NADP as acceptor(GO:0016646) |
| 0.0 | 0.4 | GO:0030249 | cyclase regulator activity(GO:0010851) guanylate cyclase regulator activity(GO:0030249) |
| 0.0 | 0.3 | GO:0035251 | UDP-glucosyltransferase activity(GO:0035251) |
| 0.0 | 0.2 | GO:0060002 | plus-end directed microfilament motor activity(GO:0060002) |
| 0.0 | 1.3 | GO:0042288 | MHC class I protein binding(GO:0042288) |
| 0.0 | 0.9 | GO:0046961 | ATPase activity, coupled to transmembrane movement of ions, rotational mechanism(GO:0044769) proton-transporting ATPase activity, rotational mechanism(GO:0046961) |
| 0.0 | 0.5 | GO:0000774 | adenyl-nucleotide exchange factor activity(GO:0000774) |
| 0.0 | 0.2 | GO:0008273 | calcium, potassium:sodium antiporter activity(GO:0008273) |
| 0.0 | 0.3 | GO:0019784 | NEDD8-specific protease activity(GO:0019784) |
| 0.0 | 0.6 | GO:0016922 | ligand-dependent nuclear receptor binding(GO:0016922) |
| 0.0 | 2.8 | GO:0005544 | calcium-dependent phospholipid binding(GO:0005544) |
| 0.0 | 0.5 | GO:0015217 | ATP transmembrane transporter activity(GO:0005347) ADP transmembrane transporter activity(GO:0015217) |
| 0.0 | 0.7 | GO:0005537 | mannose binding(GO:0005537) |
| 0.0 | 0.3 | GO:0008172 | S-methyltransferase activity(GO:0008172) |
| 0.0 | 0.2 | GO:0004032 | alditol:NADP+ 1-oxidoreductase activity(GO:0004032) |
| 0.0 | 0.7 | GO:0031852 | mu-type opioid receptor binding(GO:0031852) |
| 0.0 | 0.4 | GO:0032027 | myosin light chain binding(GO:0032027) |
| 0.0 | 0.1 | GO:0019959 | interleukin-8 binding(GO:0019959) |
| 0.0 | 4.8 | GO:0051082 | unfolded protein binding(GO:0051082) |
| 0.0 | 2.4 | GO:0003743 | translation initiation factor activity(GO:0003743) |
| 0.0 | 0.6 | GO:0036374 | glutathione hydrolase activity(GO:0036374) |
| 0.0 | 0.8 | GO:0004012 | phospholipid-translocating ATPase activity(GO:0004012) |
| 0.0 | 0.1 | GO:0004077 | biotin-[acetyl-CoA-carboxylase] ligase activity(GO:0004077) biotin-[methylcrotonoyl-CoA-carboxylase] ligase activity(GO:0004078) biotin-[methylmalonyl-CoA-carboxytransferase] ligase activity(GO:0004079) biotin-[propionyl-CoA-carboxylase (ATP-hydrolyzing)] ligase activity(GO:0004080) biotin-protein ligase activity(GO:0018271) |
| 0.0 | 0.5 | GO:0005068 | transmembrane receptor protein tyrosine kinase adaptor activity(GO:0005068) |
| 0.0 | 1.2 | GO:0015248 | sterol transporter activity(GO:0015248) |
| 0.0 | 0.5 | GO:0005212 | structural constituent of eye lens(GO:0005212) |
| 0.0 | 0.1 | GO:0052591 | sn-glycerol-3-phosphate:ubiquinone oxidoreductase activity(GO:0052590) sn-glycerol-3-phosphate:ubiquinone-8 oxidoreductase activity(GO:0052591) |
| 0.0 | 0.1 | GO:0019150 | D-ribulokinase activity(GO:0019150) |
| 0.0 | 0.1 | GO:0051800 | phosphatidylinositol-3,4-bisphosphate 3-phosphatase activity(GO:0051800) |
| 0.0 | 1.9 | GO:0005044 | scavenger receptor activity(GO:0005044) |
| 0.0 | 0.2 | GO:0003689 | DNA clamp loader activity(GO:0003689) protein-DNA loading ATPase activity(GO:0033170) |
| 0.0 | 1.1 | GO:0043539 | protein serine/threonine kinase activator activity(GO:0043539) |
| 0.0 | 0.1 | GO:0016941 | natriuretic peptide receptor activity(GO:0016941) |
| 0.0 | 0.3 | GO:0016174 | NAD(P)H oxidase activity(GO:0016174) |
| 0.0 | 1.7 | GO:0003678 | DNA helicase activity(GO:0003678) |
| 0.0 | 0.1 | GO:1903135 | cupric ion binding(GO:1903135) |
| 0.0 | 0.3 | GO:0016846 | carbon-sulfur lyase activity(GO:0016846) |
| 0.0 | 0.2 | GO:0099580 | ion antiporter activity involved in regulation of postsynaptic membrane potential(GO:0099580) |
| 0.0 | 0.7 | GO:0042813 | Wnt-activated receptor activity(GO:0042813) |
| 0.0 | 0.5 | GO:0015467 | G-protein activated inward rectifier potassium channel activity(GO:0015467) |
| 0.0 | 0.3 | GO:0001042 | RNA polymerase I core binding(GO:0001042) |
| 0.0 | 0.7 | GO:0003746 | translation elongation factor activity(GO:0003746) |
| 0.0 | 1.2 | GO:0030331 | estrogen receptor binding(GO:0030331) |
| 0.0 | 0.3 | GO:0031681 | G-protein beta-subunit binding(GO:0031681) |
| 0.0 | 0.8 | GO:0048027 | mRNA 5'-UTR binding(GO:0048027) |
| 0.0 | 0.3 | GO:0017070 | U6 snRNA binding(GO:0017070) |
| 0.0 | 0.3 | GO:0019869 | chloride channel inhibitor activity(GO:0019869) |
| 0.0 | 0.5 | GO:0050431 | transforming growth factor beta binding(GO:0050431) |
| 0.0 | 0.5 | GO:0043548 | phosphatidylinositol 3-kinase binding(GO:0043548) |
| 0.0 | 0.8 | GO:0003755 | peptidyl-prolyl cis-trans isomerase activity(GO:0003755) |
| 0.0 | 1.4 | GO:0050699 | WW domain binding(GO:0050699) |
| 0.0 | 0.1 | GO:0061513 | hexose phosphate transmembrane transporter activity(GO:0015119) organophosphate:inorganic phosphate antiporter activity(GO:0015315) hexose-phosphate:inorganic phosphate antiporter activity(GO:0015526) glucose 6-phosphate:inorganic phosphate antiporter activity(GO:0061513) |
| 0.0 | 0.1 | GO:0004035 | alkaline phosphatase activity(GO:0004035) |
| 0.0 | 0.2 | GO:0004873 | asialoglycoprotein receptor activity(GO:0004873) |
| 0.0 | 0.3 | GO:0004568 | chitinase activity(GO:0004568) |
| 0.0 | 0.1 | GO:0051525 | NFAT protein binding(GO:0051525) |
| 0.0 | 2.1 | GO:0004714 | transmembrane receptor protein tyrosine kinase activity(GO:0004714) |
| 0.0 | 0.2 | GO:0016681 | ubiquinol-cytochrome-c reductase activity(GO:0008121) oxidoreductase activity, acting on diphenols and related substances as donors, cytochrome as acceptor(GO:0016681) |
| 0.0 | 2.9 | GO:0004867 | serine-type endopeptidase inhibitor activity(GO:0004867) |
| 0.0 | 0.4 | GO:0016755 | transferase activity, transferring amino-acyl groups(GO:0016755) |
| 0.0 | 0.8 | GO:0043027 | cysteine-type endopeptidase inhibitor activity involved in apoptotic process(GO:0043027) |
| 0.0 | 0.2 | GO:0051021 | GDP-dissociation inhibitor binding(GO:0051021) Rho GDP-dissociation inhibitor binding(GO:0051022) |
| 0.0 | 0.5 | GO:0031432 | titin binding(GO:0031432) |
| 0.0 | 0.1 | GO:0045322 | unmethylated CpG binding(GO:0045322) |
| 0.0 | 0.1 | GO:0004961 | thromboxane receptor activity(GO:0004960) thromboxane A2 receptor activity(GO:0004961) |
| 0.0 | 0.3 | GO:0016861 | intramolecular oxidoreductase activity, interconverting aldoses and ketoses(GO:0016861) |
| 0.0 | 0.8 | GO:0005385 | zinc ion transmembrane transporter activity(GO:0005385) |
| 0.0 | 0.2 | GO:0009374 | biotin binding(GO:0009374) |
| 0.0 | 0.2 | GO:0008079 | translation release factor activity(GO:0003747) translation termination factor activity(GO:0008079) |
| 0.0 | 0.1 | GO:0004614 | phosphoglucomutase activity(GO:0004614) |
| 0.0 | 0.8 | GO:0001784 | phosphotyrosine binding(GO:0001784) |
| 0.0 | 0.4 | GO:0038191 | neuropilin binding(GO:0038191) |
| 0.0 | 0.6 | GO:0034237 | protein kinase A regulatory subunit binding(GO:0034237) |
| 0.0 | 0.3 | GO:0043495 | protein anchor(GO:0043495) |
| 0.0 | 0.8 | GO:0030742 | GTP-dependent protein binding(GO:0030742) |
| 0.0 | 0.2 | GO:0046974 | histone methyltransferase activity (H3-K9 specific)(GO:0046974) |
| 0.0 | 0.4 | GO:0033038 | bitter taste receptor activity(GO:0033038) |
| 0.0 | 0.5 | GO:0070064 | proline-rich region binding(GO:0070064) |
| 0.0 | 0.7 | GO:0000980 | RNA polymerase II distal enhancer sequence-specific DNA binding(GO:0000980) |
| 0.0 | 1.0 | GO:0016303 | 1-phosphatidylinositol-3-kinase activity(GO:0016303) |
| 0.0 | 0.1 | GO:0004046 | aminoacylase activity(GO:0004046) |
| 0.0 | 7.7 | GO:0001077 | transcriptional activator activity, RNA polymerase II core promoter proximal region sequence-specific binding(GO:0001077) |
| 0.0 | 0.0 | GO:0031177 | phosphopantetheine binding(GO:0031177) |
| 0.0 | 0.2 | GO:0030274 | LIM domain binding(GO:0030274) |
| 0.0 | 0.1 | GO:0030492 | hemoglobin binding(GO:0030492) |
| 0.0 | 0.6 | GO:0004198 | calcium-dependent cysteine-type endopeptidase activity(GO:0004198) |
| 0.0 | 0.1 | GO:0080101 | phosphatidyl-N-methylethanolamine N-methyltransferase activity(GO:0000773) phosphatidylethanolamine N-methyltransferase activity(GO:0004608) phosphatidyl-N-dimethylethanolamine N-methyltransferase activity(GO:0080101) |
| 0.0 | 0.5 | GO:0005158 | insulin receptor binding(GO:0005158) |
| 0.0 | 0.3 | GO:0004551 | nucleotide diphosphatase activity(GO:0004551) |
| 0.0 | 0.1 | GO:0045029 | UDP-activated nucleotide receptor activity(GO:0045029) |
| 0.0 | 0.1 | GO:0042328 | heparan sulfate N-acetylglucosaminyltransferase activity(GO:0042328) |
| 0.0 | 0.1 | GO:0044213 | intronic transcription regulatory region sequence-specific DNA binding(GO:0001161) intronic transcription regulatory region DNA binding(GO:0044213) |
| 0.0 | 0.1 | GO:0072345 | NAADP-sensitive calcium-release channel activity(GO:0072345) |
| 0.0 | 0.1 | GO:0016230 | sphingomyelin phosphodiesterase activator activity(GO:0016230) |
| 0.0 | 0.2 | GO:0022851 | GABA-gated chloride ion channel activity(GO:0022851) |
| 0.0 | 0.2 | GO:0015187 | glycine transmembrane transporter activity(GO:0015187) |
| 0.0 | 0.4 | GO:0051059 | NF-kappaB binding(GO:0051059) |
| 0.0 | 0.0 | GO:0003985 | acetyl-CoA C-acetyltransferase activity(GO:0003985) |
| 0.0 | 0.1 | GO:0043208 | glycosphingolipid binding(GO:0043208) |
| 0.0 | 0.1 | GO:0017176 | phosphatidylinositol N-acetylglucosaminyltransferase activity(GO:0017176) |
| 0.0 | 0.1 | GO:0070097 | delta-catenin binding(GO:0070097) |
| 0.0 | 0.3 | GO:0042605 | peptide antigen binding(GO:0042605) |
| 0.0 | 0.4 | GO:0000993 | RNA polymerase II core binding(GO:0000993) |
| 0.0 | 1.6 | GO:0008170 | N-methyltransferase activity(GO:0008170) |
| 0.0 | 0.3 | GO:0004993 | G-protein coupled serotonin receptor activity(GO:0004993) |
| 0.0 | 2.2 | GO:0005089 | Rho guanyl-nucleotide exchange factor activity(GO:0005089) |
| 0.0 | 0.1 | GO:1904264 | ubiquitin protein ligase activity involved in ERAD pathway(GO:1904264) |
| 0.0 | 0.3 | GO:0008499 | UDP-galactose:beta-N-acetylglucosamine beta-1,3-galactosyltransferase activity(GO:0008499) |
| 0.0 | 0.2 | GO:0070016 | armadillo repeat domain binding(GO:0070016) |
| 0.0 | 0.1 | GO:0008454 | alpha-1,3-mannosylglycoprotein 4-beta-N-acetylglucosaminyltransferase activity(GO:0008454) |
| 0.0 | 0.1 | GO:0003720 | telomerase activity(GO:0003720) RNA-directed DNA polymerase activity(GO:0003964) |
| 0.0 | 0.8 | GO:0017112 | Rab guanyl-nucleotide exchange factor activity(GO:0017112) |
| 0.0 | 0.1 | GO:0004126 | cytidine deaminase activity(GO:0004126) |
| 0.0 | 0.1 | GO:0005113 | patched binding(GO:0005113) |
| 0.0 | 0.2 | GO:0047144 | 2-acylglycerol-3-phosphate O-acyltransferase activity(GO:0047144) |
| 0.0 | 0.1 | GO:0031404 | chloride ion binding(GO:0031404) |
| 0.0 | 0.1 | GO:0015265 | urea channel activity(GO:0015265) |
| 0.0 | 0.2 | GO:0004065 | arylsulfatase activity(GO:0004065) |
| 0.0 | 0.1 | GO:0044736 | acid-sensing ion channel activity(GO:0044736) |
| 0.0 | 1.8 | GO:0005200 | structural constituent of cytoskeleton(GO:0005200) |
| 0.0 | 0.1 | GO:0004392 | heme oxygenase (decyclizing) activity(GO:0004392) |
| 0.0 | 0.1 | GO:0008440 | inositol-1,4,5-trisphosphate 3-kinase activity(GO:0008440) |
| 0.0 | 3.5 | GO:0008017 | microtubule binding(GO:0008017) |
| 0.0 | 0.2 | GO:0097602 | cullin family protein binding(GO:0097602) |
| 0.0 | 0.3 | GO:0005095 | GTPase inhibitor activity(GO:0005095) |
| 0.0 | 0.1 | GO:0036042 | long-chain fatty acyl-CoA binding(GO:0036042) |
| 0.0 | 0.3 | GO:0019198 | transmembrane receptor protein tyrosine phosphatase activity(GO:0005001) transmembrane receptor protein phosphatase activity(GO:0019198) |
| 0.0 | 1.3 | GO:0016651 | oxidoreductase activity, acting on NAD(P)H(GO:0016651) |
Gene overrepresentation in curated gene sets: canonical pathways category:
| Log-likelihood per target | Total log-likelihood | Term | Description |
|---|---|---|---|
| 0.3 | 5.4 | PID VEGF VEGFR PATHWAY | VEGF and VEGFR signaling network |
| 0.2 | 12.6 | PID HNF3A PATHWAY | FOXA1 transcription factor network |
| 0.1 | 20.9 | PID AR PATHWAY | Coregulation of Androgen receptor activity |
| 0.1 | 11.0 | PID AR TF PATHWAY | Regulation of Androgen receptor activity |
| 0.1 | 1.6 | ST PAC1 RECEPTOR PATHWAY | PAC1 Receptor Pathway |
| 0.1 | 6.5 | PID ALPHA SYNUCLEIN PATHWAY | Alpha-synuclein signaling |
| 0.1 | 4.7 | PID ATM PATHWAY | ATM pathway |
| 0.1 | 2.6 | SA PTEN PATHWAY | PTEN is a tumor suppressor that dephosphorylates the lipid messenger phosphatidylinositol triphosphate. |
| 0.1 | 8.8 | PID SHP2 PATHWAY | SHP2 signaling |
| 0.1 | 2.9 | PID GMCSF PATHWAY | GMCSF-mediated signaling events |
| 0.1 | 3.1 | PID TRAIL PATHWAY | TRAIL signaling pathway |
| 0.1 | 0.4 | SA CASPASE CASCADE | Apoptosis is mediated by caspases, cysteine proteases arranged in a proteolytic cascade. |
| 0.1 | 2.5 | PID PI3K PLC TRK PATHWAY | Trk receptor signaling mediated by PI3K and PLC-gamma |
| 0.1 | 0.5 | ST TYPE I INTERFERON PATHWAY | Type I Interferon (alpha/beta IFN) Pathway |
| 0.1 | 0.8 | PID NFKAPPAB ATYPICAL PATHWAY | Atypical NF-kappaB pathway |
| 0.1 | 3.4 | PID ERBB1 INTERNALIZATION PATHWAY | Internalization of ErbB1 |
| 0.0 | 1.1 | PID AMB2 NEUTROPHILS PATHWAY | amb2 Integrin signaling |
| 0.0 | 0.4 | ST T CELL SIGNAL TRANSDUCTION | T Cell Signal Transduction |
| 0.0 | 1.4 | PID EPHRINB REV PATHWAY | Ephrin B reverse signaling |
| 0.0 | 2.0 | PID FANCONI PATHWAY | Fanconi anemia pathway |
| 0.0 | 0.3 | PID IL27 PATHWAY | IL27-mediated signaling events |
| 0.0 | 0.3 | PID PI3KCI AKT PATHWAY | Class I PI3K signaling events mediated by Akt |
| 0.0 | 3.4 | PID ILK PATHWAY | Integrin-linked kinase signaling |
| 0.0 | 1.9 | PID HIF2PATHWAY | HIF-2-alpha transcription factor network |
| 0.0 | 1.6 | PID TCR CALCIUM PATHWAY | Calcium signaling in the CD4+ TCR pathway |
| 0.0 | 2.4 | PID LKB1 PATHWAY | LKB1 signaling events |
| 0.0 | 1.7 | PID CD8 TCR DOWNSTREAM PATHWAY | Downstream signaling in naïve CD8+ T cells |
| 0.0 | 1.2 | PID MAPK TRK PATHWAY | Trk receptor signaling mediated by the MAPK pathway |
| 0.0 | 2.4 | PID ARF6 TRAFFICKING PATHWAY | Arf6 trafficking events |
| 0.0 | 1.2 | PID GLYPICAN 1PATHWAY | Glypican 1 network |
| 0.0 | 0.2 | PID WNT SIGNALING PATHWAY | Wnt signaling network |
| 0.0 | 0.2 | PID RANBP2 PATHWAY | Sumoylation by RanBP2 regulates transcriptional repression |
| 0.0 | 1.7 | PID AP1 PATHWAY | AP-1 transcription factor network |
| 0.0 | 0.6 | PID NETRIN PATHWAY | Netrin-mediated signaling events |
| 0.0 | 1.3 | PID INTEGRIN A4B1 PATHWAY | Alpha4 beta1 integrin signaling events |
| 0.0 | 0.4 | PID P38 MK2 PATHWAY | p38 signaling mediated by MAPKAP kinases |
| 0.0 | 0.4 | PID ALK2 PATHWAY | ALK2 signaling events |
| 0.0 | 0.2 | PID THROMBIN PAR1 PATHWAY | PAR1-mediated thrombin signaling events |
| 0.0 | 0.7 | PID P38 MKK3 6PATHWAY | p38 MAPK signaling pathway |
| 0.0 | 0.1 | PID NECTIN PATHWAY | Nectin adhesion pathway |
| 0.0 | 0.3 | PID TOLL ENDOGENOUS PATHWAY | Endogenous TLR signaling |
| 0.0 | 1.3 | PID HNF3B PATHWAY | FOXA2 and FOXA3 transcription factor networks |
| 0.0 | 0.6 | PID NEPHRIN NEPH1 PATHWAY | Nephrin/Neph1 signaling in the kidney podocyte |
| 0.0 | 1.0 | PID INTEGRIN2 PATHWAY | Beta2 integrin cell surface interactions |
| 0.0 | 0.2 | PID IGF1 PATHWAY | IGF1 pathway |
| 0.0 | 0.1 | PID MET PATHWAY | Signaling events mediated by Hepatocyte Growth Factor Receptor (c-Met) |
| 0.0 | 0.3 | PID SMAD2 3PATHWAY | Regulation of cytoplasmic and nuclear SMAD2/3 signaling |
| 0.0 | 0.4 | PID ECADHERIN STABILIZATION PATHWAY | Stabilization and expansion of the E-cadherin adherens junction |
| 0.0 | 0.6 | PID TXA2PATHWAY | Thromboxane A2 receptor signaling |
| 0.0 | 0.7 | PID KIT PATHWAY | Signaling events mediated by Stem cell factor receptor (c-Kit) |
| 0.0 | 0.1 | ST GRANULE CELL SURVIVAL PATHWAY | Granule Cell Survival Pathway is a specific case of more general PAC1 Receptor Pathway. |
| 0.0 | 0.3 | PID ERBB2 ERBB3 PATHWAY | ErbB2/ErbB3 signaling events |
| 0.0 | 0.3 | PID BETA CATENIN DEG PATHWAY | Degradation of beta catenin |
Gene overrepresentation in curated gene sets: REACTOME pathways category:
| Log-likelihood per target | Total log-likelihood | Term | Description |
|---|---|---|---|
| 0.3 | 21.1 | REACTOME MYOGENESIS | Genes involved in Myogenesis |
| 0.3 | 4.8 | REACTOME VEGF LIGAND RECEPTOR INTERACTIONS | Genes involved in VEGF ligand-receptor interactions |
| 0.2 | 8.9 | REACTOME RAP1 SIGNALLING | Genes involved in Rap1 signalling |
| 0.2 | 3.5 | REACTOME G2 M DNA DAMAGE CHECKPOINT | Genes involved in G2/M DNA damage checkpoint |
| 0.2 | 6.4 | REACTOME RNA POL III TRANSCRIPTION TERMINATION | Genes involved in RNA Polymerase III Transcription Termination |
| 0.2 | 7.8 | REACTOME AMYLOIDS | Genes involved in Amyloids |
| 0.1 | 3.2 | REACTOME RIP MEDIATED NFKB ACTIVATION VIA DAI | Genes involved in RIP-mediated NFkB activation via DAI |
| 0.1 | 3.3 | REACTOME SYNTHESIS OF GLYCOSYLPHOSPHATIDYLINOSITOL GPI | Genes involved in Synthesis of glycosylphosphatidylinositol (GPI) |
| 0.1 | 1.5 | REACTOME IKK COMPLEX RECRUITMENT MEDIATED BY RIP1 | Genes involved in IKK complex recruitment mediated by RIP1 |
| 0.1 | 1.7 | REACTOME TIE2 SIGNALING | Genes involved in Tie2 Signaling |
| 0.1 | 1.3 | REACTOME ADENYLATE CYCLASE INHIBITORY PATHWAY | Genes involved in Adenylate cyclase inhibitory pathway |
| 0.1 | 3.4 | REACTOME CELL EXTRACELLULAR MATRIX INTERACTIONS | Genes involved in Cell-extracellular matrix interactions |
| 0.1 | 1.6 | REACTOME ABACAVIR TRANSPORT AND METABOLISM | Genes involved in Abacavir transport and metabolism |
| 0.1 | 0.8 | REACTOME ION CHANNEL TRANSPORT | Genes involved in Ion channel transport |
| 0.1 | 3.4 | REACTOME METAL ION SLC TRANSPORTERS | Genes involved in Metal ion SLC transporters |
| 0.1 | 2.3 | REACTOME PKA MEDIATED PHOSPHORYLATION OF CREB | Genes involved in PKA-mediated phosphorylation of CREB |
| 0.1 | 2.7 | REACTOME EXTRINSIC PATHWAY FOR APOPTOSIS | Genes involved in Extrinsic Pathway for Apoptosis |
| 0.1 | 1.2 | REACTOME KERATAN SULFATE DEGRADATION | Genes involved in Keratan sulfate degradation |
| 0.1 | 3.0 | REACTOME PEROXISOMAL LIPID METABOLISM | Genes involved in Peroxisomal lipid metabolism |
| 0.1 | 1.7 | REACTOME NOREPINEPHRINE NEUROTRANSMITTER RELEASE CYCLE | Genes involved in Norepinephrine Neurotransmitter Release Cycle |
| 0.1 | 1.2 | REACTOME GAP JUNCTION DEGRADATION | Genes involved in Gap junction degradation |
| 0.1 | 2.2 | REACTOME HS GAG DEGRADATION | Genes involved in HS-GAG degradation |
| 0.1 | 1.3 | REACTOME POL SWITCHING | Genes involved in Polymerase switching |
| 0.1 | 0.3 | REACTOME INHIBITION OF REPLICATION INITIATION OF DAMAGED DNA BY RB1 E2F1 | Genes involved in Inhibition of replication initiation of damaged DNA by RB1/E2F1 |
| 0.1 | 1.4 | REACTOME TETRAHYDROBIOPTERIN BH4 SYNTHESIS RECYCLING SALVAGE AND REGULATION | Genes involved in Tetrahydrobiopterin (BH4) synthesis, recycling, salvage and regulation |
| 0.1 | 2.5 | REACTOME DEGRADATION OF THE EXTRACELLULAR MATRIX | Genes involved in Degradation of the extracellular matrix |
| 0.1 | 0.4 | REACTOME REGULATION OF IFNA SIGNALING | Genes involved in Regulation of IFNA signaling |
| 0.1 | 1.0 | REACTOME GLUTAMATE NEUROTRANSMITTER RELEASE CYCLE | Genes involved in Glutamate Neurotransmitter Release Cycle |
| 0.1 | 1.0 | REACTOME MRNA DECAY BY 5 TO 3 EXORIBONUCLEASE | Genes involved in mRNA Decay by 5' to 3' Exoribonuclease |
| 0.1 | 1.8 | REACTOME SIGNALING BY CONSTITUTIVELY ACTIVE EGFR | Genes involved in Signaling by constitutively active EGFR |
| 0.1 | 3.5 | REACTOME GLYCOSPHINGOLIPID METABOLISM | Genes involved in Glycosphingolipid metabolism |
| 0.1 | 1.2 | REACTOME TRANSLOCATION OF ZAP 70 TO IMMUNOLOGICAL SYNAPSE | Genes involved in Translocation of ZAP-70 to Immunological synapse |
| 0.1 | 2.5 | REACTOME LYSOSOME VESICLE BIOGENESIS | Genes involved in Lysosome Vesicle Biogenesis |
| 0.1 | 1.4 | REACTOME DCC MEDIATED ATTRACTIVE SIGNALING | Genes involved in DCC mediated attractive signaling |
| 0.1 | 1.0 | REACTOME ROLE OF DCC IN REGULATING APOPTOSIS | Genes involved in Role of DCC in regulating apoptosis |
| 0.1 | 0.4 | REACTOME NFKB ACTIVATION THROUGH FADD RIP1 PATHWAY MEDIATED BY CASPASE 8 AND10 | Genes involved in NF-kB activation through FADD/RIP-1 pathway mediated by caspase-8 and -10 |
| 0.1 | 1.3 | REACTOME DESTABILIZATION OF MRNA BY TRISTETRAPROLIN TTP | Genes involved in Destabilization of mRNA by Tristetraprolin (TTP) |
| 0.1 | 1.0 | REACTOME GABA SYNTHESIS RELEASE REUPTAKE AND DEGRADATION | Genes involved in GABA synthesis, release, reuptake and degradation |
| 0.1 | 1.6 | REACTOME SIGNALING BY HIPPO | Genes involved in Signaling by Hippo |
| 0.1 | 0.7 | REACTOME EGFR DOWNREGULATION | Genes involved in EGFR downregulation |
| 0.1 | 1.4 | REACTOME SIGNALING BY FGFR1 FUSION MUTANTS | Genes involved in Signaling by FGFR1 fusion mutants |
| 0.1 | 0.7 | REACTOME PECAM1 INTERACTIONS | Genes involved in PECAM1 interactions |
| 0.1 | 0.7 | REACTOME UNBLOCKING OF NMDA RECEPTOR GLUTAMATE BINDING AND ACTIVATION | Genes involved in Unblocking of NMDA receptor, glutamate binding and activation |
| 0.1 | 0.2 | REACTOME ACYL CHAIN REMODELLING OF PS | Genes involved in Acyl chain remodelling of PS |
| 0.1 | 0.9 | REACTOME MITOCHONDRIAL FATTY ACID BETA OXIDATION | Genes involved in Mitochondrial Fatty Acid Beta-Oxidation |
| 0.0 | 1.6 | REACTOME CTLA4 INHIBITORY SIGNALING | Genes involved in CTLA4 inhibitory signaling |
| 0.0 | 1.2 | REACTOME DEPOSITION OF NEW CENPA CONTAINING NUCLEOSOMES AT THE CENTROMERE | Genes involved in Deposition of New CENPA-containing Nucleosomes at the Centromere |
| 0.0 | 1.2 | REACTOME AMINO ACID SYNTHESIS AND INTERCONVERSION TRANSAMINATION | Genes involved in Amino acid synthesis and interconversion (transamination) |
| 0.0 | 0.7 | REACTOME SYNTHESIS OF SUBSTRATES IN N GLYCAN BIOSYTHESIS | Genes involved in Synthesis of substrates in N-glycan biosythesis |
| 0.0 | 1.5 | REACTOME G0 AND EARLY G1 | Genes involved in G0 and Early G1 |
| 0.0 | 1.1 | REACTOME REGULATION OF COMPLEMENT CASCADE | Genes involved in Regulation of Complement cascade |
| 0.0 | 0.7 | REACTOME CA DEPENDENT EVENTS | Genes involved in Ca-dependent events |
| 0.0 | 1.5 | REACTOME FORMATION OF INCISION COMPLEX IN GG NER | Genes involved in Formation of incision complex in GG-NER |
| 0.0 | 0.3 | REACTOME SIGNALING BY SCF KIT | Genes involved in Signaling by SCF-KIT |
| 0.0 | 0.5 | REACTOME IL 6 SIGNALING | Genes involved in Interleukin-6 signaling |
| 0.0 | 0.9 | REACTOME PROTEOLYTIC CLEAVAGE OF SNARE COMPLEX PROTEINS | Genes involved in Proteolytic cleavage of SNARE complex proteins |
| 0.0 | 2.4 | REACTOME TRAFFICKING OF AMPA RECEPTORS | Genes involved in Trafficking of AMPA receptors |
| 0.0 | 1.1 | REACTOME MEIOTIC RECOMBINATION | Genes involved in Meiotic Recombination |
| 0.0 | 0.5 | REACTOME CREB PHOSPHORYLATION THROUGH THE ACTIVATION OF RAS | Genes involved in CREB phosphorylation through the activation of Ras |
| 0.0 | 0.6 | REACTOME UNWINDING OF DNA | Genes involved in Unwinding of DNA |
| 0.0 | 0.5 | REACTOME FANCONI ANEMIA PATHWAY | Genes involved in Fanconi Anemia pathway |
| 0.0 | 0.3 | REACTOME HOMOLOGOUS RECOMBINATION REPAIR OF REPLICATION INDEPENDENT DOUBLE STRAND BREAKS | Genes involved in Homologous recombination repair of replication-independent double-strand breaks |
| 0.0 | 0.3 | REACTOME NEF MEDIATES DOWN MODULATION OF CELL SURFACE RECEPTORS BY RECRUITING THEM TO CLATHRIN ADAPTERS | Genes involved in Nef-mediates down modulation of cell surface receptors by recruiting them to clathrin adapters |
| 0.0 | 1.0 | REACTOME BRANCHED CHAIN AMINO ACID CATABOLISM | Genes involved in Branched-chain amino acid catabolism |
| 0.0 | 0.8 | REACTOME KERATAN SULFATE KERATIN METABOLISM | Genes involved in Keratan sulfate/keratin metabolism |
| 0.0 | 1.3 | REACTOME BASIGIN INTERACTIONS | Genes involved in Basigin interactions |
| 0.0 | 3.6 | REACTOME RESPONSE TO ELEVATED PLATELET CYTOSOLIC CA2 | Genes involved in Response to elevated platelet cytosolic Ca2+ |
| 0.0 | 2.7 | REACTOME INTEGRIN CELL SURFACE INTERACTIONS | Genes involved in Integrin cell surface interactions |
| 0.0 | 1.6 | REACTOME GOLGI ASSOCIATED VESICLE BIOGENESIS | Genes involved in Golgi Associated Vesicle Biogenesis |
| 0.0 | 0.4 | REACTOME SLBP DEPENDENT PROCESSING OF REPLICATION DEPENDENT HISTONE PRE MRNAS | Genes involved in SLBP Dependent Processing of Replication-Dependent Histone Pre-mRNAs |
| 0.0 | 1.2 | REACTOME SEMA4D IN SEMAPHORIN SIGNALING | Genes involved in Sema4D in semaphorin signaling |
| 0.0 | 1.0 | REACTOME CGMP EFFECTS | Genes involved in cGMP effects |
| 0.0 | 0.2 | REACTOME CYTOSOLIC TRNA AMINOACYLATION | Genes involved in Cytosolic tRNA aminoacylation |
| 0.0 | 0.5 | REACTOME SYNTHESIS OF PIPS AT THE LATE ENDOSOME MEMBRANE | Genes involved in Synthesis of PIPs at the late endosome membrane |
| 0.0 | 0.8 | REACTOME GLUTATHIONE CONJUGATION | Genes involved in Glutathione conjugation |
| 0.0 | 1.2 | REACTOME REGULATION OF BETA CELL DEVELOPMENT | Genes involved in Regulation of beta-cell development |
| 0.0 | 0.1 | REACTOME TRAF6 MEDIATED IRF7 ACTIVATION IN TLR7 8 OR 9 SIGNALING | Genes involved in TRAF6 mediated IRF7 activation in TLR7/8 or 9 signaling |
| 0.0 | 1.1 | REACTOME CLEAVAGE OF GROWING TRANSCRIPT IN THE TERMINATION REGION | Genes involved in Cleavage of Growing Transcript in the Termination Region |
| 0.0 | 5.2 | REACTOME TRANSLATION | Genes involved in Translation |
| 0.0 | 0.2 | REACTOME MTORC1 MEDIATED SIGNALLING | Genes involved in mTORC1-mediated signalling |
| 0.0 | 0.1 | REACTOME RNA POL I PROMOTER OPENING | Genes involved in RNA Polymerase I Promoter Opening |
| 0.0 | 0.3 | REACTOME REGULATION OF RHEB GTPASE ACTIVITY BY AMPK | Genes involved in Regulation of Rheb GTPase activity by AMPK |
| 0.0 | 0.4 | REACTOME PROLACTIN RECEPTOR SIGNALING | Genes involved in Prolactin receptor signaling |
| 0.0 | 1.4 | REACTOME METABOLISM OF VITAMINS AND COFACTORS | Genes involved in Metabolism of vitamins and cofactors |
| 0.0 | 0.5 | REACTOME PHOSPHORYLATION OF THE APC C | Genes involved in Phosphorylation of the APC/C |
| 0.0 | 0.2 | REACTOME IONOTROPIC ACTIVITY OF KAINATE RECEPTORS | Genes involved in Ionotropic activity of Kainate Receptors |
| 0.0 | 0.4 | REACTOME REGULATION OF HYPOXIA INDUCIBLE FACTOR HIF BY OXYGEN | Genes involved in Regulation of Hypoxia-inducible Factor (HIF) by Oxygen |
| 0.0 | 0.5 | REACTOME TRAF6 MEDIATED INDUCTION OF NFKB AND MAP KINASES UPON TLR7 8 OR 9 ACTIVATION | Genes involved in TRAF6 mediated induction of NFkB and MAP kinases upon TLR7/8 or 9 activation |
| 0.0 | 0.6 | REACTOME GABA B RECEPTOR ACTIVATION | Genes involved in GABA B receptor activation |
| 0.0 | 0.3 | REACTOME AMINE DERIVED HORMONES | Genes involved in Amine-derived hormones |
| 0.0 | 0.8 | REACTOME ION TRANSPORT BY P TYPE ATPASES | Genes involved in Ion transport by P-type ATPases |
| 0.0 | 0.2 | REACTOME INCRETIN SYNTHESIS SECRETION AND INACTIVATION | Genes involved in Incretin Synthesis, Secretion, and Inactivation |
| 0.0 | 0.4 | REACTOME POST CHAPERONIN TUBULIN FOLDING PATHWAY | Genes involved in Post-chaperonin tubulin folding pathway |
| 0.0 | 0.4 | REACTOME TRAF6 MEDIATED IRF7 ACTIVATION | Genes involved in TRAF6 mediated IRF7 activation |
| 0.0 | 0.4 | REACTOME SYNTHESIS AND INTERCONVERSION OF NUCLEOTIDE DI AND TRIPHOSPHATES | Genes involved in Synthesis and interconversion of nucleotide di- and triphosphates |
| 0.0 | 0.1 | REACTOME ADP SIGNALLING THROUGH P2RY12 | Genes involved in ADP signalling through P2Y purinoceptor 12 |
| 0.0 | 0.1 | REACTOME ANDROGEN BIOSYNTHESIS | Genes involved in Androgen biosynthesis |
| 0.0 | 0.2 | REACTOME CALNEXIN CALRETICULIN CYCLE | Genes involved in Calnexin/calreticulin cycle |
| 0.0 | 0.3 | REACTOME ELONGATION ARREST AND RECOVERY | Genes involved in Elongation arrest and recovery |
| 0.0 | 1.0 | REACTOME RESPIRATORY ELECTRON TRANSPORT ATP SYNTHESIS BY CHEMIOSMOTIC COUPLING AND HEAT PRODUCTION BY UNCOUPLING PROTEINS | Genes involved in Respiratory electron transport, ATP synthesis by chemiosmotic coupling, and heat production by uncoupling proteins. |
| 0.0 | 5.2 | REACTOME GENERIC TRANSCRIPTION PATHWAY | Genes involved in Generic Transcription Pathway |
| 0.0 | 0.1 | REACTOME GAMMA CARBOXYLATION TRANSPORT AND AMINO TERMINAL CLEAVAGE OF PROTEINS | Genes involved in Gamma-carboxylation, transport, and amino-terminal cleavage of proteins |