Project
Inflammatory response time course, HUVEC (Wada, 2009)
Navigation
Downloads
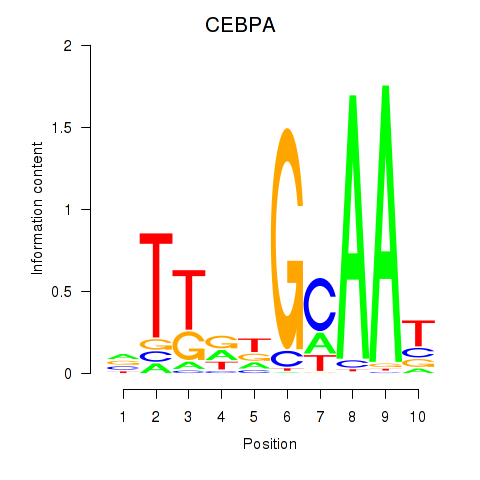
Results for CEBPA
Z-value: 1.57
Motif logo
Transcription factors associated with CEBPA
| Gene Symbol | Gene ID | Gene Info |
|---|---|---|
|
CEBPA
|
ENSG00000245848.3 | CEBPA |
Activity-expression correlation:
| Gene | Promoter | Pearson corr. coef. | P-value | Plot |
|---|---|---|---|---|
| CEBPA | hg38_v1_chr19_-_33302524_33302542 | -0.10 | 6.3e-01 | Click! |
Activity profile of CEBPA motif
Sorted Z-values of CEBPA motif
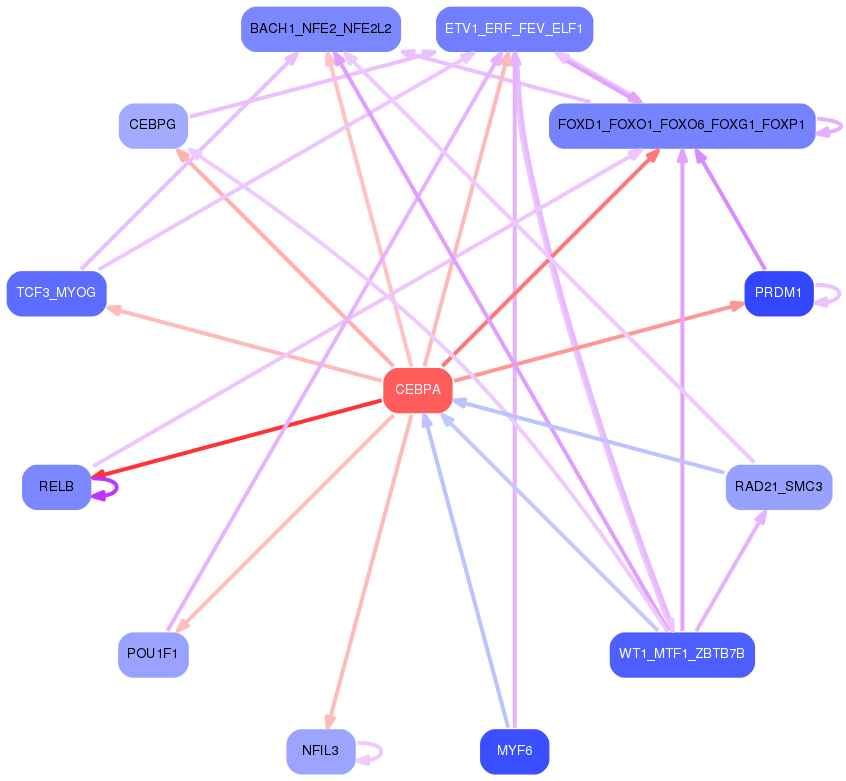
Network of associatons between targets according to the STRING database.

First level regulatory network of CEBPA
Gene Ontology Analysis
Gene overrepresentation in biological process category:
| Log-likelihood per target | Total log-likelihood | Term | Description |
|---|---|---|---|
| 4.1 | 16.2 | GO:0000738 | DNA catabolic process, exonucleolytic(GO:0000738) |
| 2.2 | 6.7 | GO:2000661 | positive regulation of interleukin-1-mediated signaling pathway(GO:2000661) |
| 2.1 | 6.4 | GO:0009720 | detection of hormone stimulus(GO:0009720) |
| 1.7 | 5.2 | GO:2000525 | regulation of T cell costimulation(GO:2000523) positive regulation of T cell costimulation(GO:2000525) |
| 1.7 | 8.5 | GO:0032730 | positive regulation of interleukin-1 alpha production(GO:0032730) |
| 1.6 | 6.2 | GO:2000329 | negative regulation of T-helper 17 cell lineage commitment(GO:2000329) |
| 1.5 | 4.6 | GO:0038156 | interleukin-3-mediated signaling pathway(GO:0038156) |
| 1.4 | 5.5 | GO:1900041 | negative regulation of interleukin-2 secretion(GO:1900041) |
| 1.3 | 9.4 | GO:0022614 | membrane to membrane docking(GO:0022614) |
| 1.2 | 4.8 | GO:2000687 | negative regulation of rubidium ion transport(GO:2000681) negative regulation of rubidium ion transmembrane transporter activity(GO:2000687) |
| 1.0 | 3.9 | GO:0009224 | CMP salvage(GO:0006238) CMP biosynthetic process(GO:0009224) CMP metabolic process(GO:0046035) |
| 0.7 | 6.3 | GO:2000124 | regulation of endocannabinoid signaling pathway(GO:2000124) |
| 0.6 | 2.6 | GO:1902159 | regulation of cyclic nucleotide-gated ion channel activity(GO:1902159) |
| 0.6 | 1.9 | GO:1903487 | regulation of lactation(GO:1903487) |
| 0.6 | 13.0 | GO:1902083 | negative regulation of peptidyl-cysteine S-nitrosylation(GO:1902083) |
| 0.6 | 3.6 | GO:0060370 | susceptibility to T cell mediated cytotoxicity(GO:0060370) |
| 0.6 | 5.2 | GO:0033211 | adiponectin-activated signaling pathway(GO:0033211) response to oleic acid(GO:0034201) |
| 0.6 | 6.2 | GO:2000535 | regulation of entry of bacterium into host cell(GO:2000535) |
| 0.6 | 1.7 | GO:0052027 | modulation of signal transduction in other organism(GO:0044501) modulation by symbiont of host signal transduction pathway(GO:0052027) modulation of signal transduction in other organism involved in symbiotic interaction(GO:0052250) modulation by symbiont of host I-kappaB kinase/NF-kappaB cascade(GO:0085032) |
| 0.5 | 3.8 | GO:0060414 | aorta smooth muscle tissue morphogenesis(GO:0060414) |
| 0.5 | 1.6 | GO:0033082 | regulation of extrathymic T cell differentiation(GO:0033082) sebum secreting cell proliferation(GO:1990654) |
| 0.5 | 1.5 | GO:0051714 | regulation of cytolysis in other organism(GO:0051710) positive regulation of cytolysis in other organism(GO:0051714) |
| 0.4 | 0.9 | GO:0042270 | protection from natural killer cell mediated cytotoxicity(GO:0042270) |
| 0.4 | 6.4 | GO:0051601 | exocyst localization(GO:0051601) |
| 0.4 | 1.2 | GO:1903015 | regulation of exo-alpha-sialidase activity(GO:1903015) |
| 0.4 | 1.5 | GO:0098886 | modification of dendritic spine(GO:0098886) |
| 0.4 | 1.5 | GO:0033634 | positive regulation of cell-cell adhesion mediated by integrin(GO:0033634) |
| 0.4 | 1.4 | GO:0032474 | otolith morphogenesis(GO:0032474) |
| 0.4 | 3.6 | GO:0002480 | antigen processing and presentation of exogenous peptide antigen via MHC class I, TAP-independent(GO:0002480) |
| 0.3 | 1.6 | GO:0015692 | lead ion transport(GO:0015692) |
| 0.3 | 1.6 | GO:0003383 | apical constriction(GO:0003383) |
| 0.3 | 15.3 | GO:0032461 | positive regulation of protein oligomerization(GO:0032461) |
| 0.3 | 0.9 | GO:0051463 | negative regulation of cortisol secretion(GO:0051463) |
| 0.3 | 1.6 | GO:0031627 | telomeric loop formation(GO:0031627) |
| 0.2 | 1.5 | GO:0035624 | receptor transactivation(GO:0035624) |
| 0.2 | 4.7 | GO:0032688 | negative regulation of interferon-beta production(GO:0032688) |
| 0.2 | 1.2 | GO:0019805 | quinolinate biosynthetic process(GO:0019805) |
| 0.2 | 0.7 | GO:0072344 | rescue of stalled ribosome(GO:0072344) |
| 0.2 | 8.5 | GO:0016338 | calcium-independent cell-cell adhesion via plasma membrane cell-adhesion molecules(GO:0016338) |
| 0.2 | 3.0 | GO:1903071 | positive regulation of ER-associated ubiquitin-dependent protein catabolic process(GO:1903071) |
| 0.2 | 0.9 | GO:0050925 | negative regulation of negative chemotaxis(GO:0050925) |
| 0.2 | 0.9 | GO:2000639 | regulation of SREBP signaling pathway(GO:2000638) negative regulation of SREBP signaling pathway(GO:2000639) |
| 0.2 | 4.6 | GO:0008228 | opsonization(GO:0008228) |
| 0.2 | 1.5 | GO:0044245 | polysaccharide digestion(GO:0044245) |
| 0.2 | 1.6 | GO:0031022 | nuclear migration along microfilament(GO:0031022) |
| 0.2 | 0.4 | GO:0038043 | interleukin-5-mediated signaling pathway(GO:0038043) |
| 0.2 | 0.4 | GO:0002588 | positive regulation of antigen processing and presentation of peptide or polysaccharide antigen via MHC class II(GO:0002582) positive regulation of antigen processing and presentation of peptide antigen(GO:0002585) positive regulation of antigen processing and presentation of peptide antigen via MHC class II(GO:0002588) |
| 0.2 | 0.6 | GO:0042231 | interleukin-13 biosynthetic process(GO:0042231) |
| 0.2 | 0.8 | GO:1903575 | cornified envelope assembly(GO:1903575) |
| 0.2 | 0.6 | GO:0060392 | negative regulation of SMAD protein import into nucleus(GO:0060392) |
| 0.2 | 0.5 | GO:0060559 | positive regulation of vitamin metabolic process(GO:0046136) positive regulation of vitamin D biosynthetic process(GO:0060557) positive regulation of calcidiol 1-monooxygenase activity(GO:0060559) |
| 0.2 | 0.7 | GO:1904640 | response to methionine(GO:1904640) |
| 0.2 | 1.9 | GO:0048251 | elastic fiber assembly(GO:0048251) |
| 0.2 | 0.5 | GO:0046110 | xanthine metabolic process(GO:0046110) |
| 0.2 | 2.1 | GO:0006449 | regulation of translational termination(GO:0006449) |
| 0.2 | 0.6 | GO:0019249 | lactate biosynthetic process(GO:0019249) |
| 0.2 | 2.6 | GO:0032625 | interleukin-21 production(GO:0032625) interleukin-21 secretion(GO:0072619) |
| 0.2 | 0.6 | GO:0060133 | somatotropin secreting cell development(GO:0060133) |
| 0.1 | 5.4 | GO:0042730 | fibrinolysis(GO:0042730) |
| 0.1 | 1.9 | GO:0006787 | porphyrin-containing compound catabolic process(GO:0006787) tetrapyrrole catabolic process(GO:0033015) heme catabolic process(GO:0042167) pigment catabolic process(GO:0046149) |
| 0.1 | 1.0 | GO:0032439 | endosome localization(GO:0032439) |
| 0.1 | 0.4 | GO:0090134 | mesendoderm migration(GO:0090133) cell migration involved in mesendoderm migration(GO:0090134) |
| 0.1 | 4.3 | GO:0089711 | L-glutamate transmembrane transport(GO:0089711) |
| 0.1 | 0.4 | GO:0046271 | phenylpropanoid catabolic process(GO:0046271) |
| 0.1 | 0.9 | GO:0006642 | triglyceride mobilization(GO:0006642) |
| 0.1 | 1.7 | GO:0034983 | peptidyl-lysine deacetylation(GO:0034983) |
| 0.1 | 0.9 | GO:0070995 | NADPH oxidation(GO:0070995) |
| 0.1 | 0.9 | GO:0006741 | NADP biosynthetic process(GO:0006741) |
| 0.1 | 4.2 | GO:0048846 | axon extension involved in axon guidance(GO:0048846) neuron projection extension involved in neuron projection guidance(GO:1902284) |
| 0.1 | 0.6 | GO:0071733 | transcriptional activation by promoter-enhancer looping(GO:0071733) gene looping(GO:0090202) dsDNA loop formation(GO:0090579) |
| 0.1 | 1.2 | GO:0010756 | positive regulation of plasminogen activation(GO:0010756) |
| 0.1 | 1.0 | GO:0035897 | proteolysis in other organism(GO:0035897) |
| 0.1 | 0.4 | GO:0072660 | maintenance of protein location in membrane(GO:0072658) maintenance of protein location in plasma membrane(GO:0072660) positive regulation of membrane depolarization during cardiac muscle cell action potential(GO:1900827) |
| 0.1 | 1.1 | GO:0036343 | psychomotor behavior(GO:0036343) |
| 0.1 | 0.4 | GO:1903371 | regulation of endoplasmic reticulum tubular network organization(GO:1903371) |
| 0.1 | 0.8 | GO:1903265 | positive regulation of tumor necrosis factor-mediated signaling pathway(GO:1903265) |
| 0.1 | 0.4 | GO:0090119 | vesicle-mediated cholesterol transport(GO:0090119) |
| 0.1 | 0.6 | GO:0033152 | immunoglobulin V(D)J recombination(GO:0033152) |
| 0.1 | 0.1 | GO:0032687 | negative regulation of interferon-alpha production(GO:0032687) |
| 0.1 | 0.8 | GO:0045329 | carnitine biosynthetic process(GO:0045329) |
| 0.1 | 0.9 | GO:0043353 | enucleate erythrocyte differentiation(GO:0043353) |
| 0.1 | 0.8 | GO:0001865 | NK T cell differentiation(GO:0001865) |
| 0.1 | 0.3 | GO:0003245 | cardiac muscle tissue growth involved in heart morphogenesis(GO:0003245) |
| 0.1 | 0.5 | GO:0019264 | glycine biosynthetic process from serine(GO:0019264) |
| 0.1 | 3.4 | GO:0008053 | mitochondrial fusion(GO:0008053) |
| 0.1 | 0.4 | GO:1903413 | cellular response to bile acid(GO:1903413) |
| 0.1 | 0.7 | GO:0006572 | tyrosine catabolic process(GO:0006572) |
| 0.1 | 1.3 | GO:0018298 | protein-chromophore linkage(GO:0018298) |
| 0.1 | 0.4 | GO:0060332 | positive regulation of response to interferon-gamma(GO:0060332) positive regulation of interferon-gamma-mediated signaling pathway(GO:0060335) |
| 0.1 | 0.5 | GO:0030950 | establishment or maintenance of actin cytoskeleton polarity(GO:0030950) |
| 0.1 | 1.7 | GO:2000675 | negative regulation of type B pancreatic cell apoptotic process(GO:2000675) |
| 0.1 | 0.2 | GO:0003218 | cardiac left ventricle formation(GO:0003218) |
| 0.1 | 0.6 | GO:0006686 | sphingomyelin biosynthetic process(GO:0006686) |
| 0.1 | 0.7 | GO:0010898 | positive regulation of triglyceride catabolic process(GO:0010898) |
| 0.1 | 0.3 | GO:0006420 | arginyl-tRNA aminoacylation(GO:0006420) |
| 0.1 | 0.3 | GO:0045410 | positive regulation of interleukin-6 biosynthetic process(GO:0045410) |
| 0.1 | 0.2 | GO:0090264 | immune complex clearance(GO:0002434) immune complex clearance by monocytes and macrophages(GO:0002436) regulation of immune complex clearance by monocytes and macrophages(GO:0090264) negative regulation of eosinophil activation(GO:1902567) positive regulation of monocyte extravasation(GO:2000439) |
| 0.1 | 0.7 | GO:0042262 | DNA protection(GO:0042262) |
| 0.1 | 0.2 | GO:1904381 | Golgi apparatus mannose trimming(GO:1904381) |
| 0.1 | 1.9 | GO:0030214 | hyaluronan catabolic process(GO:0030214) |
| 0.1 | 0.7 | GO:0030210 | heparin metabolic process(GO:0030202) heparin biosynthetic process(GO:0030210) |
| 0.1 | 0.5 | GO:0048007 | antigen processing and presentation of lipid antigen via MHC class Ib(GO:0048003) antigen processing and presentation, exogenous lipid antigen via MHC class Ib(GO:0048007) |
| 0.1 | 2.0 | GO:0060117 | auditory receptor cell development(GO:0060117) |
| 0.1 | 0.7 | GO:0051873 | killing by host of symbiont cells(GO:0051873) |
| 0.1 | 0.9 | GO:0034656 | nucleobase-containing small molecule catabolic process(GO:0034656) |
| 0.1 | 0.4 | GO:0006824 | cobalt ion transport(GO:0006824) |
| 0.1 | 0.3 | GO:0001971 | negative regulation of activation of membrane attack complex(GO:0001971) |
| 0.1 | 0.3 | GO:0043606 | histidine catabolic process to glutamate and formamide(GO:0019556) histidine catabolic process to glutamate and formate(GO:0019557) formamide metabolic process(GO:0043606) |
| 0.0 | 0.3 | GO:0061589 | calcium activated phosphatidylserine scrambling(GO:0061589) |
| 0.0 | 0.3 | GO:0061042 | vascular wound healing(GO:0061042) |
| 0.0 | 0.3 | GO:0070858 | negative regulation of bile acid biosynthetic process(GO:0070858) negative regulation of bile acid metabolic process(GO:1904252) |
| 0.0 | 0.5 | GO:0031087 | deadenylation-independent decapping of nuclear-transcribed mRNA(GO:0031087) |
| 0.0 | 0.3 | GO:0071105 | response to interleukin-11(GO:0071105) |
| 0.0 | 1.0 | GO:0002087 | regulation of respiratory gaseous exchange by neurological system process(GO:0002087) |
| 0.0 | 0.5 | GO:1902857 | positive regulation of nonmotile primary cilium assembly(GO:1902857) |
| 0.0 | 0.8 | GO:0051988 | regulation of attachment of spindle microtubules to kinetochore(GO:0051988) |
| 0.0 | 1.0 | GO:0043508 | negative regulation of JUN kinase activity(GO:0043508) |
| 0.0 | 1.0 | GO:0019852 | L-ascorbic acid metabolic process(GO:0019852) |
| 0.0 | 0.4 | GO:1903003 | positive regulation of protein deubiquitination(GO:1903003) |
| 0.0 | 0.2 | GO:0000393 | spliceosomal conformational changes to generate catalytic conformation(GO:0000393) |
| 0.0 | 0.9 | GO:1902236 | negative regulation of endoplasmic reticulum stress-induced intrinsic apoptotic signaling pathway(GO:1902236) |
| 0.0 | 0.5 | GO:0015693 | magnesium ion transport(GO:0015693) |
| 0.0 | 0.1 | GO:0002399 | MHC class II protein complex assembly(GO:0002399) |
| 0.0 | 1.3 | GO:0046655 | folic acid metabolic process(GO:0046655) |
| 0.0 | 0.9 | GO:0007250 | activation of NF-kappaB-inducing kinase activity(GO:0007250) |
| 0.0 | 0.4 | GO:0001867 | complement activation, lectin pathway(GO:0001867) |
| 0.0 | 0.7 | GO:0030150 | protein import into mitochondrial matrix(GO:0030150) |
| 0.0 | 0.7 | GO:0046415 | urate metabolic process(GO:0046415) |
| 0.0 | 0.4 | GO:0002291 | T cell activation via T cell receptor contact with antigen bound to MHC molecule on antigen presenting cell(GO:0002291) |
| 0.0 | 0.7 | GO:0030277 | maintenance of gastrointestinal epithelium(GO:0030277) |
| 0.0 | 1.1 | GO:0045332 | phospholipid translocation(GO:0045332) |
| 0.0 | 0.6 | GO:0008212 | mineralocorticoid biosynthetic process(GO:0006705) mineralocorticoid metabolic process(GO:0008212) |
| 0.0 | 0.2 | GO:0035726 | common myeloid progenitor cell proliferation(GO:0035726) |
| 0.0 | 0.1 | GO:0001831 | trophectodermal cellular morphogenesis(GO:0001831) |
| 0.0 | 0.2 | GO:2001184 | positive regulation of interleukin-12 secretion(GO:2001184) |
| 0.0 | 0.2 | GO:0019732 | antifungal humoral response(GO:0019732) |
| 0.0 | 0.4 | GO:0090026 | positive regulation of monocyte chemotaxis(GO:0090026) |
| 0.0 | 0.5 | GO:0031665 | negative regulation of lipopolysaccharide-mediated signaling pathway(GO:0031665) |
| 0.0 | 1.7 | GO:0070979 | protein K11-linked ubiquitination(GO:0070979) |
| 0.0 | 0.3 | GO:0042905 | 9-cis-retinoic acid biosynthetic process(GO:0042904) 9-cis-retinoic acid metabolic process(GO:0042905) |
| 0.0 | 0.7 | GO:0097186 | amelogenesis(GO:0097186) |
| 0.0 | 2.0 | GO:0050918 | positive chemotaxis(GO:0050918) |
| 0.0 | 0.1 | GO:0071947 | protein deubiquitination involved in ubiquitin-dependent protein catabolic process(GO:0071947) |
| 0.0 | 0.3 | GO:0000463 | maturation of LSU-rRNA from tricistronic rRNA transcript (SSU-rRNA, 5.8S rRNA, LSU-rRNA)(GO:0000463) |
| 0.0 | 1.0 | GO:0006337 | nucleosome disassembly(GO:0006337) |
| 0.0 | 0.3 | GO:0071372 | cellular response to follicle-stimulating hormone stimulus(GO:0071372) |
| 0.0 | 0.9 | GO:0060119 | inner ear receptor cell development(GO:0060119) |
| 0.0 | 0.4 | GO:0046185 | aldehyde catabolic process(GO:0046185) |
| 0.0 | 0.9 | GO:1903846 | positive regulation of transforming growth factor beta receptor signaling pathway(GO:0030511) positive regulation of cellular response to transforming growth factor beta stimulus(GO:1903846) |
| 0.0 | 0.8 | GO:0031954 | positive regulation of protein autophosphorylation(GO:0031954) |
| 0.0 | 0.1 | GO:0042851 | L-alanine metabolic process(GO:0042851) L-alanine catabolic process(GO:0042853) |
| 0.0 | 0.3 | GO:0048386 | positive regulation of retinoic acid receptor signaling pathway(GO:0048386) |
| 0.0 | 1.3 | GO:0007274 | neuromuscular synaptic transmission(GO:0007274) |
| 0.0 | 0.6 | GO:0048934 | peripheral nervous system neuron differentiation(GO:0048934) peripheral nervous system neuron development(GO:0048935) |
| 0.0 | 0.7 | GO:0045662 | negative regulation of myoblast differentiation(GO:0045662) |
| 0.0 | 0.2 | GO:0031848 | protection from non-homologous end joining at telomere(GO:0031848) |
| 0.0 | 0.2 | GO:0045950 | regulation of mitotic recombination(GO:0000019) negative regulation of mitotic recombination(GO:0045950) |
| 0.0 | 0.1 | GO:0015742 | alpha-ketoglutarate transport(GO:0015742) |
| 0.0 | 0.1 | GO:0032571 | response to vitamin K(GO:0032571) |
| 0.0 | 3.9 | GO:0002433 | immune response-regulating cell surface receptor signaling pathway involved in phagocytosis(GO:0002433) Fc-gamma receptor signaling pathway involved in phagocytosis(GO:0038096) |
| 0.0 | 0.1 | GO:2000427 | positive regulation of apoptotic cell clearance(GO:2000427) |
| 0.0 | 0.8 | GO:0071353 | cellular response to interleukin-4(GO:0071353) |
| 0.0 | 0.1 | GO:2000767 | positive regulation of cytoplasmic translation(GO:2000767) |
| 0.0 | 0.4 | GO:0019433 | triglyceride catabolic process(GO:0019433) |
| 0.0 | 0.3 | GO:0090110 | cargo loading into COPII-coated vesicle(GO:0090110) |
| 0.0 | 0.1 | GO:0070269 | pyroptosis(GO:0070269) |
| 0.0 | 3.6 | GO:0021987 | cerebral cortex development(GO:0021987) |
| 0.0 | 0.6 | GO:0030195 | negative regulation of blood coagulation(GO:0030195) negative regulation of hemostasis(GO:1900047) |
| 0.0 | 0.1 | GO:0000467 | exonucleolytic trimming involved in rRNA processing(GO:0000459) exonucleolytic trimming to generate mature 3'-end of 5.8S rRNA from tricistronic rRNA transcript (SSU-rRNA, 5.8S rRNA, LSU-rRNA)(GO:0000467) nuclear retention of pre-mRNA at the site of transcription(GO:0071033) CUT catabolic process(GO:0071034) nuclear polyadenylation-dependent tRNA catabolic process(GO:0071038) CUT metabolic process(GO:0071043) |
| 0.0 | 0.1 | GO:0006983 | ER overload response(GO:0006983) |
| 0.0 | 0.2 | GO:0001833 | inner cell mass cell proliferation(GO:0001833) |
| 0.0 | 0.1 | GO:0045347 | negative regulation of MHC class II biosynthetic process(GO:0045347) |
| 0.0 | 0.2 | GO:0060081 | membrane hyperpolarization(GO:0060081) |
| 0.0 | 0.3 | GO:0043691 | reverse cholesterol transport(GO:0043691) |
| 0.0 | 2.3 | GO:0030038 | contractile actin filament bundle assembly(GO:0030038) stress fiber assembly(GO:0043149) |
| 0.0 | 1.0 | GO:0060711 | labyrinthine layer development(GO:0060711) |
| 0.0 | 0.1 | GO:0033353 | S-adenosylmethionine cycle(GO:0033353) |
| 0.0 | 0.2 | GO:2001214 | positive regulation of vasculogenesis(GO:2001214) |
| 0.0 | 0.3 | GO:0090084 | negative regulation of inclusion body assembly(GO:0090084) |
| 0.0 | 0.3 | GO:0010866 | regulation of triglyceride biosynthetic process(GO:0010866) |
| 0.0 | 0.3 | GO:0061436 | establishment of skin barrier(GO:0061436) |
| 0.0 | 0.2 | GO:0051382 | kinetochore assembly(GO:0051382) |
| 0.0 | 0.3 | GO:0034587 | piRNA metabolic process(GO:0034587) |
| 0.0 | 0.9 | GO:0051058 | negative regulation of Ras protein signal transduction(GO:0046580) negative regulation of small GTPase mediated signal transduction(GO:0051058) |
| 0.0 | 0.4 | GO:0006730 | one-carbon metabolic process(GO:0006730) |
| 0.0 | 0.4 | GO:0070423 | nucleotide-binding oligomerization domain containing signaling pathway(GO:0070423) |
| 0.0 | 0.2 | GO:0034501 | protein localization to kinetochore(GO:0034501) |
| 0.0 | 0.3 | GO:0046085 | adenosine metabolic process(GO:0046085) |
| 0.0 | 0.1 | GO:1902715 | regulation of interferon-gamma secretion(GO:1902713) positive regulation of interferon-gamma secretion(GO:1902715) |
| 0.0 | 0.3 | GO:0035518 | histone H2A monoubiquitination(GO:0035518) |
| 0.0 | 0.1 | GO:2001023 | regulation of response to drug(GO:2001023) |
| 0.0 | 0.6 | GO:1903146 | regulation of mitophagy(GO:1903146) |
| 0.0 | 0.3 | GO:0006825 | copper ion transport(GO:0006825) |
| 0.0 | 0.8 | GO:0010501 | RNA secondary structure unwinding(GO:0010501) |
| 0.0 | 0.1 | GO:0043374 | CD8-positive, alpha-beta T cell differentiation(GO:0043374) |
| 0.0 | 0.4 | GO:0030513 | positive regulation of BMP signaling pathway(GO:0030513) |
| 0.0 | 0.1 | GO:0006828 | manganese ion transport(GO:0006828) |
| 0.0 | 0.1 | GO:0043152 | induction of bacterial agglutination(GO:0043152) |
| 0.0 | 0.7 | GO:0009250 | glycogen biosynthetic process(GO:0005978) glucan biosynthetic process(GO:0009250) |
Gene overrepresentation in cellular component category:
| Log-likelihood per target | Total log-likelihood | Term | Description |
|---|---|---|---|
| 3.1 | 9.4 | GO:0071065 | alpha9-beta1 integrin-vascular cell adhesion molecule-1 complex(GO:0071065) |
| 1.0 | 4.1 | GO:0097179 | protease inhibitor complex(GO:0097179) |
| 0.5 | 1.5 | GO:0097444 | spine apparatus(GO:0097444) |
| 0.4 | 4.7 | GO:0033256 | I-kappaB/NF-kappaB complex(GO:0033256) |
| 0.3 | 2.4 | GO:1990037 | Lewy body core(GO:1990037) |
| 0.3 | 1.6 | GO:0070826 | paraferritin complex(GO:0070826) |
| 0.2 | 6.4 | GO:0000145 | exocyst(GO:0000145) |
| 0.2 | 16.8 | GO:0015030 | Cajal body(GO:0015030) |
| 0.2 | 0.9 | GO:0072557 | IPAF inflammasome complex(GO:0072557) |
| 0.2 | 15.2 | GO:0005881 | cytoplasmic microtubule(GO:0005881) |
| 0.2 | 1.8 | GO:0042612 | MHC class I protein complex(GO:0042612) |
| 0.1 | 4.6 | GO:0042101 | T cell receptor complex(GO:0042101) |
| 0.1 | 0.8 | GO:0097149 | centralspindlin complex(GO:0097149) |
| 0.1 | 2.5 | GO:0032433 | filopodium tip(GO:0032433) |
| 0.1 | 0.9 | GO:1990452 | Parkin-FBXW7-Cul1 ubiquitin ligase complex(GO:1990452) |
| 0.1 | 1.6 | GO:0036056 | filtration diaphragm(GO:0036056) slit diaphragm(GO:0036057) |
| 0.1 | 1.1 | GO:0000015 | phosphopyruvate hydratase complex(GO:0000015) |
| 0.1 | 0.5 | GO:0031205 | endoplasmic reticulum Sec complex(GO:0031205) |
| 0.1 | 4.6 | GO:0005640 | nuclear outer membrane(GO:0005640) |
| 0.1 | 0.3 | GO:0030849 | autosome(GO:0030849) |
| 0.1 | 0.3 | GO:0043203 | axon hillock(GO:0043203) |
| 0.1 | 0.6 | GO:0030868 | smooth endoplasmic reticulum membrane(GO:0030868) smooth endoplasmic reticulum part(GO:0097425) |
| 0.1 | 0.8 | GO:0005742 | mitochondrial outer membrane translocase complex(GO:0005742) |
| 0.1 | 0.2 | GO:0071006 | U2-type catalytic step 1 spliceosome(GO:0071006) |
| 0.1 | 0.6 | GO:0097255 | R2TP complex(GO:0097255) |
| 0.1 | 0.5 | GO:0044354 | pinosome(GO:0044352) macropinosome(GO:0044354) |
| 0.1 | 4.3 | GO:0032154 | cleavage furrow(GO:0032154) cell surface furrow(GO:0097610) |
| 0.1 | 0.5 | GO:0070552 | BRISC complex(GO:0070552) |
| 0.0 | 0.2 | GO:0071821 | FANCM-MHF complex(GO:0071821) |
| 0.0 | 4.2 | GO:0035580 | specific granule lumen(GO:0035580) |
| 0.0 | 12.5 | GO:0005741 | mitochondrial outer membrane(GO:0005741) |
| 0.0 | 11.0 | GO:0043296 | apical junction complex(GO:0043296) |
| 0.0 | 3.9 | GO:0035577 | azurophil granule membrane(GO:0035577) |
| 0.0 | 0.5 | GO:0045179 | apical cortex(GO:0045179) |
| 0.0 | 0.8 | GO:0046658 | anchored component of plasma membrane(GO:0046658) |
| 0.0 | 4.1 | GO:0005791 | rough endoplasmic reticulum(GO:0005791) |
| 0.0 | 0.4 | GO:0016012 | sarcoglycan complex(GO:0016012) |
| 0.0 | 0.6 | GO:0017119 | Golgi transport complex(GO:0017119) |
| 0.0 | 0.9 | GO:0031235 | intrinsic component of the cytoplasmic side of the plasma membrane(GO:0031235) |
| 0.0 | 0.7 | GO:0030285 | integral component of synaptic vesicle membrane(GO:0030285) intrinsic component of synaptic vesicle membrane(GO:0098563) |
| 0.0 | 0.2 | GO:0071942 | XPC complex(GO:0071942) |
| 0.0 | 0.4 | GO:0008385 | IkappaB kinase complex(GO:0008385) |
| 0.0 | 5.0 | GO:0055037 | recycling endosome(GO:0055037) |
| 0.0 | 1.8 | GO:0032420 | stereocilium(GO:0032420) |
| 0.0 | 0.3 | GO:0070852 | cell body fiber(GO:0070852) |
| 0.0 | 0.3 | GO:0032585 | multivesicular body membrane(GO:0032585) |
| 0.0 | 0.3 | GO:0005577 | fibrinogen complex(GO:0005577) |
| 0.0 | 3.3 | GO:0005581 | collagen trimer(GO:0005581) |
| 0.0 | 2.9 | GO:0005913 | cell-cell adherens junction(GO:0005913) |
| 0.0 | 0.1 | GO:0097057 | TRAF2-GSTP1 complex(GO:0097057) |
| 0.0 | 0.3 | GO:0031462 | Cul2-RING ubiquitin ligase complex(GO:0031462) |
| 0.0 | 4.7 | GO:0101002 | ficolin-1-rich granule(GO:0101002) ficolin-1-rich granule lumen(GO:1904813) |
| 0.0 | 0.3 | GO:0070775 | H3 histone acetyltransferase complex(GO:0070775) MOZ/MORF histone acetyltransferase complex(GO:0070776) |
| 0.0 | 0.6 | GO:0005666 | DNA-directed RNA polymerase III complex(GO:0005666) |
| 0.0 | 1.2 | GO:0030673 | axolemma(GO:0030673) |
| 0.0 | 1.7 | GO:0010494 | cytoplasmic stress granule(GO:0010494) |
| 0.0 | 0.3 | GO:0061700 | GATOR2 complex(GO:0061700) |
| 0.0 | 0.5 | GO:0031932 | TORC2 complex(GO:0031932) |
| 0.0 | 0.1 | GO:0005827 | polar microtubule(GO:0005827) |
| 0.0 | 0.5 | GO:0032391 | photoreceptor connecting cilium(GO:0032391) |
| 0.0 | 1.7 | GO:0035097 | histone methyltransferase complex(GO:0035097) |
| 0.0 | 7.1 | GO:0005578 | proteinaceous extracellular matrix(GO:0005578) |
| 0.0 | 0.6 | GO:0005669 | transcription factor TFIID complex(GO:0005669) |
| 0.0 | 0.2 | GO:0000940 | condensed chromosome outer kinetochore(GO:0000940) |
| 0.0 | 14.2 | GO:0009986 | cell surface(GO:0009986) |
| 0.0 | 0.4 | GO:0070971 | endoplasmic reticulum exit site(GO:0070971) |
| 0.0 | 0.6 | GO:0045178 | basal part of cell(GO:0045178) |
| 0.0 | 0.4 | GO:0005839 | proteasome core complex(GO:0005839) |
| 0.0 | 1.7 | GO:0031901 | early endosome membrane(GO:0031901) |
| 0.0 | 1.9 | GO:0000784 | nuclear chromosome, telomeric region(GO:0000784) |
| 0.0 | 0.9 | GO:0000315 | organellar large ribosomal subunit(GO:0000315) mitochondrial large ribosomal subunit(GO:0005762) |
| 0.0 | 1.1 | GO:0016234 | inclusion body(GO:0016234) |
| 0.0 | 0.6 | GO:0030173 | integral component of Golgi membrane(GO:0030173) |
| 0.0 | 1.2 | GO:0031902 | late endosome membrane(GO:0031902) |
Gene overrepresentation in molecular function category:
| Log-likelihood per target | Total log-likelihood | Term | Description |
|---|---|---|---|
| 5.4 | 16.2 | GO:0008859 | exoribonuclease II activity(GO:0008859) |
| 1.7 | 6.7 | GO:0004909 | interleukin-1, Type I, activating receptor activity(GO:0004909) |
| 1.6 | 6.4 | GO:0034041 | sterol-transporting ATPase activity(GO:0034041) |
| 1.5 | 4.6 | GO:0004912 | interleukin-3 receptor activity(GO:0004912) |
| 0.9 | 9.4 | GO:0008131 | primary amine oxidase activity(GO:0008131) |
| 0.9 | 2.6 | GO:0031731 | CCR6 chemokine receptor binding(GO:0031731) |
| 0.8 | 4.0 | GO:0005294 | neutral L-amino acid secondary active transmembrane transporter activity(GO:0005294) |
| 0.7 | 4.2 | GO:0004720 | protein-lysine 6-oxidase activity(GO:0004720) |
| 0.5 | 1.9 | GO:0004074 | biliverdin reductase activity(GO:0004074) |
| 0.4 | 3.8 | GO:0004687 | myosin light chain kinase activity(GO:0004687) |
| 0.4 | 6.2 | GO:0045236 | CXCR chemokine receptor binding(GO:0045236) |
| 0.4 | 2.1 | GO:0031544 | peptidyl-proline 3-dioxygenase activity(GO:0031544) |
| 0.4 | 1.5 | GO:0008745 | N-acetylmuramoyl-L-alanine amidase activity(GO:0008745) |
| 0.4 | 1.5 | GO:0033265 | choline binding(GO:0033265) |
| 0.4 | 3.9 | GO:0004849 | uridine kinase activity(GO:0004849) |
| 0.3 | 1.6 | GO:0015639 | cadmium ion transmembrane transporter activity(GO:0015086) cobalt ion transmembrane transporter activity(GO:0015087) lead ion transmembrane transporter activity(GO:0015094) ferrous iron uptake transmembrane transporter activity(GO:0015639) |
| 0.3 | 1.3 | GO:0004487 | methylenetetrahydrofolate dehydrogenase (NAD+) activity(GO:0004487) |
| 0.3 | 6.3 | GO:0047372 | acylglycerol lipase activity(GO:0047372) |
| 0.3 | 4.9 | GO:0050700 | CARD domain binding(GO:0050700) |
| 0.3 | 3.4 | GO:0070053 | thrombospondin receptor activity(GO:0070053) |
| 0.3 | 2.5 | GO:0060002 | plus-end directed microfilament motor activity(GO:0060002) |
| 0.3 | 6.4 | GO:0102391 | decanoate--CoA ligase activity(GO:0102391) |
| 0.3 | 0.8 | GO:0008336 | gamma-butyrobetaine dioxygenase activity(GO:0008336) |
| 0.3 | 1.8 | GO:0015333 | peptide:proton symporter activity(GO:0015333) proton-dependent peptide secondary active transmembrane transporter activity(GO:0022897) |
| 0.2 | 0.7 | GO:0004060 | arylamine N-acetyltransferase activity(GO:0004060) |
| 0.2 | 1.2 | GO:0016822 | hydrolase activity, acting on acid carbon-carbon bonds(GO:0016822) hydrolase activity, acting on acid carbon-carbon bonds, in ketonic substances(GO:0016823) |
| 0.2 | 0.4 | GO:0004914 | interleukin-5 receptor activity(GO:0004914) |
| 0.2 | 3.6 | GO:0051400 | BH domain binding(GO:0051400) |
| 0.2 | 1.7 | GO:0010859 | calcium-dependent cysteine-type endopeptidase inhibitor activity(GO:0010859) |
| 0.2 | 0.5 | GO:0005260 | channel-conductance-controlling ATPase activity(GO:0005260) |
| 0.2 | 1.7 | GO:0035312 | 5'-3' exodeoxyribonuclease activity(GO:0035312) |
| 0.2 | 0.6 | GO:0033188 | sphingomyelin synthase activity(GO:0033188) ceramide cholinephosphotransferase activity(GO:0047493) |
| 0.2 | 0.5 | GO:0004611 | phosphoenolpyruvate carboxykinase activity(GO:0004611) phosphoenolpyruvate carboxykinase (GTP) activity(GO:0004613) |
| 0.1 | 0.6 | GO:0004769 | steroid delta-isomerase activity(GO:0004769) |
| 0.1 | 0.6 | GO:0070644 | vitamin D response element binding(GO:0070644) |
| 0.1 | 0.9 | GO:0004499 | N,N-dimethylaniline monooxygenase activity(GO:0004499) |
| 0.1 | 1.0 | GO:0001849 | complement component C1q binding(GO:0001849) |
| 0.1 | 1.6 | GO:0030280 | structural constituent of epidermis(GO:0030280) |
| 0.1 | 2.1 | GO:1902282 | voltage-gated potassium channel activity involved in ventricular cardiac muscle cell action potential repolarization(GO:1902282) |
| 0.1 | 10.7 | GO:0030374 | ligand-dependent nuclear receptor transcription coactivator activity(GO:0030374) |
| 0.1 | 1.1 | GO:0004634 | phosphopyruvate hydratase activity(GO:0004634) |
| 0.1 | 0.9 | GO:0050816 | phosphothreonine binding(GO:0050816) |
| 0.1 | 0.7 | GO:0004966 | galanin receptor activity(GO:0004966) |
| 0.1 | 0.3 | GO:0004421 | hydroxymethylglutaryl-CoA synthase activity(GO:0004421) |
| 0.1 | 4.8 | GO:0043539 | protein serine/threonine kinase activator activity(GO:0043539) |
| 0.1 | 1.1 | GO:0035251 | UDP-glucosyltransferase activity(GO:0035251) |
| 0.1 | 2.4 | GO:0008510 | sodium:bicarbonate symporter activity(GO:0008510) |
| 0.1 | 0.7 | GO:0015016 | [heparan sulfate]-glucosamine N-sulfotransferase activity(GO:0015016) |
| 0.1 | 8.9 | GO:0032813 | tumor necrosis factor receptor superfamily binding(GO:0032813) |
| 0.1 | 6.0 | GO:0030507 | spectrin binding(GO:0030507) |
| 0.1 | 15.5 | GO:0004222 | metalloendopeptidase activity(GO:0004222) |
| 0.1 | 0.9 | GO:0008046 | axon guidance receptor activity(GO:0008046) |
| 0.1 | 3.1 | GO:0015002 | cytochrome-c oxidase activity(GO:0004129) heme-copper terminal oxidase activity(GO:0015002) oxidoreductase activity, acting on a heme group of donors, oxygen as acceptor(GO:0016676) |
| 0.1 | 0.9 | GO:0005237 | inhibitory extracellular ligand-gated ion channel activity(GO:0005237) |
| 0.1 | 1.7 | GO:0031078 | histone deacetylase activity (H3-K14 specific)(GO:0031078) NAD-dependent histone deacetylase activity (H3-K14 specific)(GO:0032041) |
| 0.1 | 1.2 | GO:0008020 | G-protein coupled photoreceptor activity(GO:0008020) |
| 0.1 | 0.7 | GO:0030614 | oxidoreductase activity, acting on phosphorus or arsenic in donors(GO:0030613) oxidoreductase activity, acting on phosphorus or arsenic in donors, disulfide as acceptor(GO:0030614) |
| 0.1 | 0.5 | GO:0004372 | glycine hydroxymethyltransferase activity(GO:0004372) threonine aldolase activity(GO:0004793) L-allo-threonine aldolase activity(GO:0008732) |
| 0.1 | 0.8 | GO:0015288 | porin activity(GO:0015288) |
| 0.1 | 0.6 | GO:0043141 | ATP-dependent 5'-3' DNA helicase activity(GO:0043141) |
| 0.1 | 0.5 | GO:0043546 | molybdopterin cofactor binding(GO:0043546) |
| 0.1 | 0.4 | GO:0047374 | methylumbelliferyl-acetate deacetylase activity(GO:0047374) |
| 0.1 | 0.3 | GO:0004814 | arginine-tRNA ligase activity(GO:0004814) |
| 0.1 | 0.4 | GO:0004301 | epoxide hydrolase activity(GO:0004301) |
| 0.1 | 0.3 | GO:0019862 | IgA binding(GO:0019862) |
| 0.1 | 0.3 | GO:0008665 | 2'-phosphotransferase activity(GO:0008665) |
| 0.1 | 0.9 | GO:0004726 | non-membrane spanning protein tyrosine phosphatase activity(GO:0004726) |
| 0.1 | 0.3 | GO:0051731 | polynucleotide 5'-hydroxyl-kinase activity(GO:0051731) |
| 0.1 | 2.6 | GO:0003950 | NAD+ ADP-ribosyltransferase activity(GO:0003950) |
| 0.1 | 1.3 | GO:0005041 | low-density lipoprotein receptor activity(GO:0005041) |
| 0.1 | 2.3 | GO:0005540 | hyaluronic acid binding(GO:0005540) |
| 0.1 | 1.0 | GO:0003688 | DNA replication origin binding(GO:0003688) |
| 0.1 | 0.5 | GO:0030884 | lipid antigen binding(GO:0030882) endogenous lipid antigen binding(GO:0030883) exogenous lipid antigen binding(GO:0030884) |
| 0.1 | 2.2 | GO:0008157 | protein phosphatase 1 binding(GO:0008157) |
| 0.0 | 2.0 | GO:0042056 | chemoattractant activity(GO:0042056) |
| 0.0 | 0.9 | GO:0017110 | nucleoside-diphosphatase activity(GO:0017110) |
| 0.0 | 0.5 | GO:0004977 | melanocortin receptor activity(GO:0004977) |
| 0.0 | 0.2 | GO:0043515 | kinetochore binding(GO:0043515) |
| 0.0 | 0.4 | GO:0039706 | co-receptor binding(GO:0039706) |
| 0.0 | 1.9 | GO:0042605 | peptide antigen binding(GO:0042605) |
| 0.0 | 0.9 | GO:0005522 | profilin binding(GO:0005522) |
| 0.0 | 0.3 | GO:0001758 | retinal dehydrogenase activity(GO:0001758) |
| 0.0 | 0.2 | GO:0031727 | CCR2 chemokine receptor binding(GO:0031727) |
| 0.0 | 0.9 | GO:0005149 | interleukin-1 receptor binding(GO:0005149) |
| 0.0 | 0.3 | GO:0016841 | ammonia-lyase activity(GO:0016841) |
| 0.0 | 0.4 | GO:0042975 | peroxisome proliferator activated receptor binding(GO:0042975) |
| 0.0 | 0.4 | GO:0030621 | U4 snRNA binding(GO:0030621) |
| 0.0 | 1.9 | GO:0051019 | mitogen-activated protein kinase binding(GO:0051019) |
| 0.0 | 1.1 | GO:0004012 | phospholipid-translocating ATPase activity(GO:0004012) |
| 0.0 | 7.0 | GO:0000149 | SNARE binding(GO:0000149) |
| 0.0 | 0.2 | GO:0004348 | glucosylceramidase activity(GO:0004348) |
| 0.0 | 1.0 | GO:0004708 | MAP kinase kinase activity(GO:0004708) |
| 0.0 | 0.1 | GO:0015140 | malate transmembrane transporter activity(GO:0015140) |
| 0.0 | 0.3 | GO:0050693 | LBD domain binding(GO:0050693) |
| 0.0 | 0.6 | GO:0004016 | adenylate cyclase activity(GO:0004016) |
| 0.0 | 0.3 | GO:0016724 | ferroxidase activity(GO:0004322) oxidoreductase activity, oxidizing metal ions, oxygen as acceptor(GO:0016724) |
| 0.0 | 0.2 | GO:0008508 | bile acid:sodium symporter activity(GO:0008508) |
| 0.0 | 0.1 | GO:0035731 | S-nitrosoglutathione binding(GO:0035730) dinitrosyl-iron complex binding(GO:0035731) |
| 0.0 | 0.1 | GO:0031208 | POZ domain binding(GO:0031208) |
| 0.0 | 0.7 | GO:0008195 | phosphatidate phosphatase activity(GO:0008195) |
| 0.0 | 0.2 | GO:0035473 | lipase binding(GO:0035473) |
| 0.0 | 1.7 | GO:0061631 | ubiquitin conjugating enzyme activity(GO:0061631) |
| 0.0 | 0.1 | GO:0072345 | NAADP-sensitive calcium-release channel activity(GO:0072345) |
| 0.0 | 2.6 | GO:0050681 | androgen receptor binding(GO:0050681) |
| 0.0 | 1.2 | GO:1990841 | promoter-specific chromatin binding(GO:1990841) |
| 0.0 | 0.9 | GO:0008301 | DNA binding, bending(GO:0008301) |
| 0.0 | 0.2 | GO:0004459 | L-lactate dehydrogenase activity(GO:0004459) |
| 0.0 | 1.0 | GO:0004181 | metallocarboxypeptidase activity(GO:0004181) |
| 0.0 | 1.1 | GO:0008188 | neuropeptide receptor activity(GO:0008188) |
| 0.0 | 0.3 | GO:0038036 | sphingosine-1-phosphate receptor activity(GO:0038036) |
| 0.0 | 0.3 | GO:0032051 | clathrin light chain binding(GO:0032051) |
| 0.0 | 0.2 | GO:0008440 | inositol-1,4,5-trisphosphate 3-kinase activity(GO:0008440) |
| 0.0 | 0.9 | GO:0003951 | NAD+ kinase activity(GO:0003951) |
| 0.0 | 0.4 | GO:0031419 | cobalamin binding(GO:0031419) |
| 0.0 | 0.4 | GO:0004030 | 3-chloroallyl aldehyde dehydrogenase activity(GO:0004028) aldehyde dehydrogenase [NAD(P)+] activity(GO:0004030) |
| 0.0 | 0.6 | GO:0001056 | RNA polymerase III activity(GO:0001056) |
| 0.0 | 0.1 | GO:0047635 | L-alanine:2-oxoglutarate aminotransferase activity(GO:0004021) alanine-oxo-acid transaminase activity(GO:0047635) |
| 0.0 | 0.5 | GO:0015095 | magnesium ion transmembrane transporter activity(GO:0015095) |
| 0.0 | 0.2 | GO:0004571 | mannosyl-oligosaccharide 1,2-alpha-mannosidase activity(GO:0004571) |
| 0.0 | 2.0 | GO:0005546 | phosphatidylinositol-4,5-bisphosphate binding(GO:0005546) |
| 0.0 | 0.3 | GO:0050291 | sphingosine N-acyltransferase activity(GO:0050291) |
| 0.0 | 0.4 | GO:0019957 | C-C chemokine binding(GO:0019957) |
| 0.0 | 0.3 | GO:0050786 | RAGE receptor binding(GO:0050786) |
| 0.0 | 3.1 | GO:0004867 | serine-type endopeptidase inhibitor activity(GO:0004867) |
| 0.0 | 0.6 | GO:0070628 | proteasome binding(GO:0070628) |
| 0.0 | 0.3 | GO:0005161 | platelet-derived growth factor receptor binding(GO:0005161) |
| 0.0 | 2.6 | GO:0001618 | virus receptor activity(GO:0001618) |
| 0.0 | 0.4 | GO:0004089 | carbonate dehydratase activity(GO:0004089) |
| 0.0 | 0.3 | GO:0015501 | glutamate:sodium symporter activity(GO:0015501) |
| 0.0 | 0.3 | GO:0005283 | sodium:amino acid symporter activity(GO:0005283) |
| 0.0 | 5.1 | GO:0061630 | ubiquitin protein ligase activity(GO:0061630) |
| 0.0 | 0.4 | GO:0097602 | cullin family protein binding(GO:0097602) |
| 0.0 | 0.3 | GO:0016500 | protein-hormone receptor activity(GO:0016500) |
| 0.0 | 0.4 | GO:0017160 | Ral GTPase binding(GO:0017160) |
| 0.0 | 0.4 | GO:0005527 | macrolide binding(GO:0005527) FK506 binding(GO:0005528) |
| 0.0 | 1.2 | GO:0008138 | protein tyrosine/serine/threonine phosphatase activity(GO:0008138) |
| 0.0 | 0.1 | GO:0016802 | adenosylhomocysteinase activity(GO:0004013) trialkylsulfonium hydrolase activity(GO:0016802) |
| 0.0 | 0.5 | GO:0005549 | odorant binding(GO:0005549) |
| 0.0 | 0.2 | GO:0019531 | oxalate transmembrane transporter activity(GO:0019531) |
| 0.0 | 0.5 | GO:0000146 | microfilament motor activity(GO:0000146) |
| 0.0 | 0.1 | GO:0023024 | MHC class I protein complex binding(GO:0023024) |
| 0.0 | 0.3 | GO:0008503 | benzodiazepine receptor activity(GO:0008503) |
| 0.0 | 0.9 | GO:0001102 | RNA polymerase II activating transcription factor binding(GO:0001102) |
| 0.0 | 0.1 | GO:0052796 | exo-alpha-(2->3)-sialidase activity(GO:0052794) exo-alpha-(2->6)-sialidase activity(GO:0052795) exo-alpha-(2->8)-sialidase activity(GO:0052796) |
| 0.0 | 1.9 | GO:0005179 | hormone activity(GO:0005179) |
| 0.0 | 0.9 | GO:0005160 | transforming growth factor beta receptor binding(GO:0005160) |
| 0.0 | 1.2 | GO:0004715 | non-membrane spanning protein tyrosine kinase activity(GO:0004715) |
| 0.0 | 2.4 | GO:0004519 | endonuclease activity(GO:0004519) |
| 0.0 | 1.0 | GO:0022839 | ion gated channel activity(GO:0022839) |
| 0.0 | 0.7 | GO:0019213 | deacetylase activity(GO:0019213) |
| 0.0 | 0.1 | GO:0070679 | inositol 1,4,5 trisphosphate binding(GO:0070679) |
| 0.0 | 0.1 | GO:0004024 | alcohol dehydrogenase activity, zinc-dependent(GO:0004024) |
| 0.0 | 0.3 | GO:0070330 | aromatase activity(GO:0070330) |
| 0.0 | 0.1 | GO:0008097 | 5S rRNA binding(GO:0008097) |
Gene overrepresentation in curated gene sets: canonical pathways category:
| Log-likelihood per target | Total log-likelihood | Term | Description |
|---|---|---|---|
| 0.9 | 4.6 | PID IL3 PATHWAY | IL3-mediated signaling events |
| 0.5 | 15.6 | PID ANTHRAX PATHWAY | Cellular roles of Anthrax toxin |
| 0.2 | 14.8 | PID SYNDECAN 1 PATHWAY | Syndecan-1-mediated signaling events |
| 0.2 | 1.0 | ST ADRENERGIC | Adrenergic Pathway |
| 0.2 | 15.8 | PID IL12 2PATHWAY | IL12-mediated signaling events |
| 0.1 | 14.5 | PID ERA GENOMIC PATHWAY | Validated nuclear estrogen receptor alpha network |
| 0.1 | 7.2 | PID INTEGRIN3 PATHWAY | Beta3 integrin cell surface interactions |
| 0.1 | 7.3 | PID AURORA B PATHWAY | Aurora B signaling |
| 0.1 | 1.3 | PID IL5 PATHWAY | IL5-mediated signaling events |
| 0.1 | 4.8 | PID LKB1 PATHWAY | LKB1 signaling events |
| 0.1 | 1.1 | PID P38 MK2 PATHWAY | p38 signaling mediated by MAPKAP kinases |
| 0.1 | 0.6 | PID IL6 7 PATHWAY | IL6-mediated signaling events |
| 0.0 | 2.1 | PID NFKAPPAB CANONICAL PATHWAY | Canonical NF-kappaB pathway |
| 0.0 | 3.4 | PID BCR 5PATHWAY | BCR signaling pathway |
| 0.0 | 18.8 | NABA SECRETED FACTORS | Genes encoding secreted soluble factors |
| 0.0 | 1.1 | PID INSULIN GLUCOSE PATHWAY | Insulin-mediated glucose transport |
| 0.0 | 2.3 | PID NETRIN PATHWAY | Netrin-mediated signaling events |
| 0.0 | 1.4 | PID ERBB4 PATHWAY | ErbB4 signaling events |
| 0.0 | 1.6 | PID HIF2PATHWAY | HIF-2-alpha transcription factor network |
| 0.0 | 1.3 | PID PRL SIGNALING EVENTS PATHWAY | Signaling events mediated by PRL |
| 0.0 | 1.6 | PID PTP1B PATHWAY | Signaling events mediated by PTP1B |
| 0.0 | 1.2 | PID WNT CANONICAL PATHWAY | Canonical Wnt signaling pathway |
| 0.0 | 0.8 | ST B CELL ANTIGEN RECEPTOR | B Cell Antigen Receptor |
| 0.0 | 0.7 | ST GA12 PATHWAY | G alpha 12 Pathway |
| 0.0 | 9.4 | NABA ECM REGULATORS | Genes encoding enzymes and their regulators involved in the remodeling of the extracellular matrix |
| 0.0 | 1.1 | PID FCER1 PATHWAY | Fc-epsilon receptor I signaling in mast cells |
| 0.0 | 0.8 | PID ANGIOPOIETIN RECEPTOR PATHWAY | Angiopoietin receptor Tie2-mediated signaling |
| 0.0 | 0.4 | SA PROGRAMMED CELL DEATH | Programmed cell death, or apoptosis, eliminates damaged or unneeded cells. |
| 0.0 | 0.5 | PID PI3KCI AKT PATHWAY | Class I PI3K signaling events mediated by Akt |
| 0.0 | 0.8 | NABA BASEMENT MEMBRANES | Genes encoding structural components of basement membranes |
| 0.0 | 1.5 | PID HDAC CLASSI PATHWAY | Signaling events mediated by HDAC Class I |
| 0.0 | 0.6 | PID ATF2 PATHWAY | ATF-2 transcription factor network |
| 0.0 | 0.5 | PID PS1 PATHWAY | Presenilin action in Notch and Wnt signaling |
| 0.0 | 1.0 | PID HIF1 TFPATHWAY | HIF-1-alpha transcription factor network |
Gene overrepresentation in curated gene sets: REACTOME pathways category:
| Log-likelihood per target | Total log-likelihood | Term | Description |
|---|---|---|---|
| 0.6 | 14.9 | REACTOME REGULATION OF INSULIN LIKE GROWTH FACTOR IGF ACTIVITY BY INSULIN LIKE GROWTH FACTOR BINDING PROTEINS IGFBPS | Genes involved in Regulation of Insulin-like Growth Factor (IGF) Activity by Insulin-like Growth Factor Binding Proteins (IGFBPs) |
| 0.3 | 3.6 | REACTOME ENDOSOMAL VACUOLAR PATHWAY | Genes involved in Endosomal/Vacuolar pathway |
| 0.3 | 9.3 | REACTOME ACTIVATED AMPK STIMULATES FATTY ACID OXIDATION IN MUSCLE | Genes involved in Activated AMPK stimulates fatty-acid oxidation in muscle |
| 0.2 | 14.8 | REACTOME INTERFERON GAMMA SIGNALING | Genes involved in Interferon gamma signaling |
| 0.2 | 5.0 | REACTOME HDL MEDIATED LIPID TRANSPORT | Genes involved in HDL-mediated lipid transport |
| 0.2 | 8.5 | REACTOME TIGHT JUNCTION INTERACTIONS | Genes involved in Tight junction interactions |
| 0.2 | 3.5 | REACTOME THE NLRP3 INFLAMMASOME | Genes involved in The NLRP3 inflammasome |
| 0.1 | 15.6 | REACTOME INTERFERON ALPHA BETA SIGNALING | Genes involved in Interferon alpha/beta signaling |
| 0.1 | 1.9 | REACTOME HYALURONAN UPTAKE AND DEGRADATION | Genes involved in Hyaluronan uptake and degradation |
| 0.1 | 5.8 | REACTOME EFFECTS OF PIP2 HYDROLYSIS | Genes involved in Effects of PIP2 hydrolysis |
| 0.1 | 3.1 | REACTOME SIGNAL REGULATORY PROTEIN SIRP FAMILY INTERACTIONS | Genes involved in Signal regulatory protein (SIRP) family interactions |
| 0.1 | 5.0 | REACTOME IL RECEPTOR SHC SIGNALING | Genes involved in Interleukin receptor SHC signaling |
| 0.1 | 1.1 | REACTOME ACTIVATED TAK1 MEDIATES P38 MAPK ACTIVATION | Genes involved in activated TAK1 mediates p38 MAPK activation |
| 0.1 | 6.5 | REACTOME IL1 SIGNALING | Genes involved in Interleukin-1 signaling |
| 0.1 | 1.2 | REACTOME TRYPTOPHAN CATABOLISM | Genes involved in Tryptophan catabolism |
| 0.1 | 1.3 | REACTOME OPSINS | Genes involved in Opsins |
| 0.1 | 6.4 | REACTOME CHEMOKINE RECEPTORS BIND CHEMOKINES | Genes involved in Chemokine receptors bind chemokines |
| 0.1 | 1.2 | REACTOME CREATION OF C4 AND C2 ACTIVATORS | Genes involved in Creation of C4 and C2 activators |
| 0.1 | 3.6 | REACTOME PYRIMIDINE METABOLISM | Genes involved in Pyrimidine metabolism |
| 0.1 | 3.8 | REACTOME SMOOTH MUSCLE CONTRACTION | Genes involved in Smooth Muscle Contraction |
| 0.1 | 2.5 | REACTOME ACTIVATION OF GENES BY ATF4 | Genes involved in Activation of Genes by ATF4 |
| 0.1 | 2.7 | REACTOME CELL CELL JUNCTION ORGANIZATION | Genes involved in Cell-cell junction organization |
| 0.1 | 0.7 | REACTOME GRB2 SOS PROVIDES LINKAGE TO MAPK SIGNALING FOR INTERGRINS | Genes involved in GRB2:SOS provides linkage to MAPK signaling for Intergrins |
| 0.0 | 1.8 | REACTOME OXYGEN DEPENDENT PROLINE HYDROXYLATION OF HYPOXIA INDUCIBLE FACTOR ALPHA | Genes involved in Oxygen-dependent Proline Hydroxylation of Hypoxia-inducible Factor Alpha |
| 0.0 | 1.7 | REACTOME YAP1 AND WWTR1 TAZ STIMULATED GENE EXPRESSION | Genes involved in YAP1- and WWTR1 (TAZ)-stimulated gene expression |
| 0.0 | 0.7 | REACTOME TAK1 ACTIVATES NFKB BY PHOSPHORYLATION AND ACTIVATION OF IKKS COMPLEX | Genes involved in TAK1 activates NFkB by phosphorylation and activation of IKKs complex |
| 0.0 | 0.6 | REACTOME ANDROGEN BIOSYNTHESIS | Genes involved in Androgen biosynthesis |
| 0.0 | 1.4 | REACTOME SIGNALING BY EGFR IN CANCER | Genes involved in Signaling by EGFR in Cancer |
| 0.0 | 0.5 | REACTOME PURINE CATABOLISM | Genes involved in Purine catabolism |
| 0.0 | 2.6 | REACTOME NOTCH1 INTRACELLULAR DOMAIN REGULATES TRANSCRIPTION | Genes involved in NOTCH1 Intracellular Domain Regulates Transcription |
| 0.0 | 1.1 | REACTOME METABOLISM OF PORPHYRINS | Genes involved in Metabolism of porphyrins |
| 0.0 | 0.5 | REACTOME ABACAVIR TRANSPORT AND METABOLISM | Genes involved in Abacavir transport and metabolism |
| 0.0 | 0.7 | REACTOME SYNTHESIS OF PE | Genes involved in Synthesis of PE |
| 0.0 | 0.5 | REACTOME REGULATION OF WATER BALANCE BY RENAL AQUAPORINS | Genes involved in Regulation of Water Balance by Renal Aquaporins |
| 0.0 | 2.2 | REACTOME NUCLEAR SIGNALING BY ERBB4 | Genes involved in Nuclear signaling by ERBB4 |
| 0.0 | 0.2 | REACTOME INITIAL TRIGGERING OF COMPLEMENT | Genes involved in Initial triggering of complement |
| 0.0 | 0.8 | REACTOME NOD1 2 SIGNALING PATHWAY | Genes involved in NOD1/2 Signaling Pathway |
| 0.0 | 1.3 | REACTOME SPHINGOLIPID DE NOVO BIOSYNTHESIS | Genes involved in Sphingolipid de novo biosynthesis |
| 0.0 | 1.2 | REACTOME GLUCOSE METABOLISM | Genes involved in Glucose metabolism |
| 0.0 | 0.1 | REACTOME TRANSFERRIN ENDOCYTOSIS AND RECYCLING | Genes involved in Transferrin endocytosis and recycling |
| 0.0 | 2.7 | REACTOME COSTIMULATION BY THE CD28 FAMILY | Genes involved in Costimulation by the CD28 family |
| 0.0 | 2.6 | REACTOME METABOLISM OF VITAMINS AND COFACTORS | Genes involved in Metabolism of vitamins and cofactors |
| 0.0 | 4.4 | REACTOME L1CAM INTERACTIONS | Genes involved in L1CAM interactions |
| 0.0 | 1.6 | REACTOME MEIOTIC SYNAPSIS | Genes involved in Meiotic Synapsis |
| 0.0 | 0.6 | REACTOME RNA POL III CHAIN ELONGATION | Genes involved in RNA Polymerase III Chain Elongation |
| 0.0 | 0.3 | REACTOME VEGF LIGAND RECEPTOR INTERACTIONS | Genes involved in VEGF ligand-receptor interactions |
| 0.0 | 1.1 | REACTOME GLYCOLYSIS | Genes involved in Glycolysis |
| 0.0 | 0.2 | REACTOME PLATELET SENSITIZATION BY LDL | Genes involved in Platelet sensitization by LDL |
| 0.0 | 0.4 | REACTOME REVERSIBLE HYDRATION OF CARBON DIOXIDE | Genes involved in Reversible Hydration of Carbon Dioxide |
| 0.0 | 1.8 | REACTOME IMMUNOREGULATORY INTERACTIONS BETWEEN A LYMPHOID AND A NON LYMPHOID CELL | Genes involved in Immunoregulatory interactions between a Lymphoid and a non-Lymphoid cell |
| 0.0 | 3.7 | REACTOME TRANSPORT OF INORGANIC CATIONS ANIONS AND AMINO ACIDS OLIGOPEPTIDES | Genes involved in Transport of inorganic cations/anions and amino acids/oligopeptides |
| 0.0 | 1.1 | REACTOME ION TRANSPORT BY P TYPE ATPASES | Genes involved in Ion transport by P-type ATPases |
| 0.0 | 0.2 | REACTOME RECYCLING OF BILE ACIDS AND SALTS | Genes involved in Recycling of bile acids and salts |
| 0.0 | 0.4 | REACTOME OTHER SEMAPHORIN INTERACTIONS | Genes involved in Other semaphorin interactions |
| 0.0 | 0.8 | REACTOME SIGNALING BY ROBO RECEPTOR | Genes involved in Signaling by Robo receptor |
| 0.0 | 0.6 | REACTOME TELOMERE MAINTENANCE | Genes involved in Telomere Maintenance |
| 0.0 | 0.3 | REACTOME ANTIGEN PRESENTATION FOLDING ASSEMBLY AND PEPTIDE LOADING OF CLASS I MHC | Genes involved in Antigen Presentation: Folding, assembly and peptide loading of class I MHC |
| 0.0 | 0.5 | REACTOME HS GAG BIOSYNTHESIS | Genes involved in HS-GAG biosynthesis |
| 0.0 | 1.8 | REACTOME PEPTIDE LIGAND BINDING RECEPTORS | Genes involved in Peptide ligand-binding receptors |
| 0.0 | 0.4 | REACTOME SYNTHESIS OF VERY LONG CHAIN FATTY ACYL COAS | Genes involved in Synthesis of very long-chain fatty acyl-CoAs |
| 0.0 | 0.7 | REACTOME MITOCHONDRIAL PROTEIN IMPORT | Genes involved in Mitochondrial Protein Import |
| 0.0 | 2.9 | REACTOME ANTIGEN PROCESSING UBIQUITINATION PROTEASOME DEGRADATION | Genes involved in Antigen processing: Ubiquitination & Proteasome degradation |