|
chr1_+_61081728
Show fit
|
8.44 |
ENST00000371189.8
|
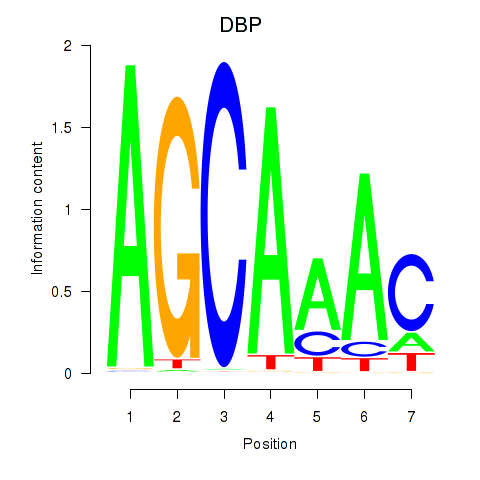
NFIA
|
nuclear factor I A
|
|
chr3_-_52445085
Show fit
|
6.33 |
ENST00000475739.1
ENST00000231721.7
|
SEMA3G
|
semaphorin 3G
|
|
chr4_-_185810894
Show fit
|
5.47 |
ENST00000448662.6
ENST00000439049.5
ENST00000420158.5
ENST00000319471.13
|
SORBS2
|
sorbin and SH3 domain containing 2
|
|
chr1_+_61082398
Show fit
|
5.33 |
ENST00000664149.1
|
NFIA
|
nuclear factor I A
|
|
chr9_+_2158239
Show fit
|
4.35 |
ENST00000635133.1
ENST00000634931.1
ENST00000423555.6
ENST00000382185.6
ENST00000302401.8
ENST00000382183.6
ENST00000417599.6
ENST00000382186.6
ENST00000635530.1
ENST00000635388.1
|
SMARCA2
|
SWI/SNF related, matrix associated, actin dependent regulator of chromatin, subfamily a, member 2
|
|
chr13_+_57631735
Show fit
|
4.33 |
ENST00000377918.8
|
PCDH17
|
protocadherin 17
|
|
chr1_+_61082553
Show fit
|
4.15 |
ENST00000403491.8
ENST00000371187.7
|
NFIA
|
nuclear factor I A
|
|
chr1_+_81800368
Show fit
|
4.01 |
ENST00000674489.1
ENST00000674442.1
ENST00000674419.1
ENST00000674407.1
ENST00000674168.1
ENST00000674307.1
ENST00000674209.1
ENST00000370715.5
ENST00000370713.5
ENST00000319517.10
ENST00000627151.2
ENST00000370717.6
|
ADGRL2
|
adhesion G protein-coupled receptor L2
|
|
chr4_-_16898561
Show fit
|
3.98 |
ENST00000515064.5
ENST00000441778.6
|
LDB2
|
LIM domain binding 2
|
|
chr4_-_16898619
Show fit
|
3.95 |
ENST00000502640.5
ENST00000304523.10
ENST00000506732.1
|
LDB2
|
LIM domain binding 2
|
|
chr14_+_61321571
Show fit
|
3.86 |
ENST00000332981.11
|
PRKCH
|
protein kinase C eta
|
|
chr1_+_113979391
Show fit
|
3.86 |
ENST00000393300.6
ENST00000369551.5
|
OLFML3
|
olfactomedin like 3
|
|
chr1_+_113979460
Show fit
|
3.85 |
ENST00000320334.5
|
OLFML3
|
olfactomedin like 3
|
|
chr9_+_2158487
Show fit
|
3.80 |
ENST00000634706.1
ENST00000634338.1
ENST00000635688.1
ENST00000634435.1
|
SMARCA2
|
SWI/SNF related, matrix associated, actin dependent regulator of chromatin, subfamily a, member 2
|
|
chr1_-_58577244
Show fit
|
3.76 |
ENST00000371225.4
|
TACSTD2
|
tumor associated calcium signal transducer 2
|
|
chr1_+_84144260
Show fit
|
3.63 |
ENST00000370685.7
|
PRKACB
|
protein kinase cAMP-activated catalytic subunit beta
|
|
chr18_+_75210755
Show fit
|
3.58 |
ENST00000322038.5
|
TSHZ1
|
teashirt zinc finger homeobox 1
|
|
chr13_+_31945826
Show fit
|
3.48 |
ENST00000647500.1
|
FRY
|
FRY microtubule binding protein
|
|
chr18_+_75210789
Show fit
|
3.41 |
ENST00000580243.3
|
TSHZ1
|
teashirt zinc finger homeobox 1
|
|
chr3_+_40100007
Show fit
|
3.16 |
ENST00000539167.2
|
MYRIP
|
myosin VIIA and Rab interacting protein
|
|
chr3_+_141386862
Show fit
|
3.14 |
ENST00000513258.5
|
ZBTB38
|
zinc finger and BTB domain containing 38
|
|
chr10_-_62816341
Show fit
|
3.13 |
ENST00000242480.4
ENST00000637191.1
|
EGR2
|
early growth response 2
|
|
chr10_+_35195124
Show fit
|
2.95 |
ENST00000487763.5
ENST00000473940.5
ENST00000488328.5
ENST00000356917.9
|
CREM
|
cAMP responsive element modulator
|
|
chr18_-_25352116
Show fit
|
2.93 |
ENST00000584787.5
ENST00000538137.6
ENST00000361524.8
|
ZNF521
|
zinc finger protein 521
|
|
chr5_-_111756245
Show fit
|
2.80 |
ENST00000447165.6
|
NREP
|
neuronal regeneration related protein
|
|
chr14_-_91946989
Show fit
|
2.73 |
ENST00000556154.5
|
FBLN5
|
fibulin 5
|
|
chr13_+_32031706
Show fit
|
2.54 |
ENST00000542859.6
|
FRY
|
FRY microtubule binding protein
|
|
chrX_-_10833643
Show fit
|
2.24 |
ENST00000380785.5
ENST00000380787.5
|
MID1
|
midline 1
|
|
chr10_-_124093582
Show fit
|
2.24 |
ENST00000462406.1
ENST00000435907.6
|
CHST15
|
carbohydrate sulfotransferase 15
|
|
chr3_-_185821092
Show fit
|
2.04 |
ENST00000421047.3
|
IGF2BP2
|
insulin like growth factor 2 mRNA binding protein 2
|
|
chr7_-_122144231
Show fit
|
2.03 |
ENST00000679511.1
ENST00000417368.7
ENST00000473553.5
|
AASS
|
aminoadipate-semialdehyde synthase
|
|
chr8_-_17676484
Show fit
|
2.01 |
ENST00000634613.1
ENST00000519066.5
|
MTUS1
|
microtubule associated scaffold protein 1
|
|
chr10_-_62816309
Show fit
|
1.92 |
ENST00000411732.3
|
EGR2
|
early growth response 2
|
|
chr5_-_88731827
Show fit
|
1.90 |
ENST00000627170.2
|
MEF2C
|
myocyte enhancer factor 2C
|
|
chr9_+_79572572
Show fit
|
1.90 |
ENST00000435650.5
ENST00000414465.5
ENST00000376537.8
|
TLE4
|
TLE family member 4, transcriptional corepressor
|
|
chr20_-_23086316
Show fit
|
1.87 |
ENST00000246006.5
|
CD93
|
CD93 molecule
|
|
chr9_+_79572715
Show fit
|
1.87 |
ENST00000265284.10
|
TLE4
|
TLE family member 4, transcriptional corepressor
|
|
chrX_-_126552801
Show fit
|
1.85 |
ENST00000371126.3
|
DCAF12L1
|
DDB1 and CUL4 associated factor 12 like 1
|
|
chr21_-_38661694
Show fit
|
1.84 |
ENST00000417133.6
ENST00000398910.5
ENST00000442448.5
ENST00000429727.6
|
ERG
|
ETS transcription factor ERG
|
|
chr3_-_71305986
Show fit
|
1.79 |
ENST00000647614.1
|
FOXP1
|
forkhead box P1
|
|
chr9_-_95509241
Show fit
|
1.77 |
ENST00000331920.11
|
PTCH1
|
patched 1
|
|
chrX_+_150363306
Show fit
|
1.72 |
ENST00000370401.7
ENST00000432680.7
|
MAMLD1
|
mastermind like domain containing 1
|
|
chr21_-_26843063
Show fit
|
1.70 |
ENST00000678221.1
|
ADAMTS1
|
ADAM metallopeptidase with thrombospondin type 1 motif 1
|
|
chrX_+_150363258
Show fit
|
1.69 |
ENST00000683696.1
|
MAMLD1
|
mastermind like domain containing 1
|
|
chr13_-_99016034
Show fit
|
1.66 |
ENST00000448493.7
|
DOCK9
|
dedicator of cytokinesis 9
|
|
chr21_-_26843012
Show fit
|
1.63 |
ENST00000517777.6
|
ADAMTS1
|
ADAM metallopeptidase with thrombospondin type 1 motif 1
|
|
chr4_-_158173004
Show fit
|
1.60 |
ENST00000585682.6
|
GASK1B
|
golgi associated kinase 1B
|
|
chr14_+_24120956
Show fit
|
1.54 |
ENST00000558325.2
|
ENSG00000259371.2
|
novel protein
|
|
chr18_-_55587335
Show fit
|
1.54 |
ENST00000638154.3
|
TCF4
|
transcription factor 4
|
|
chr9_-_81689536
Show fit
|
1.52 |
ENST00000376499.8
|
TLE1
|
TLE family member 1, transcriptional corepressor
|
|
chr20_+_11917859
Show fit
|
1.52 |
ENST00000618296.4
ENST00000378226.7
|
BTBD3
|
BTB domain containing 3
|
|
chr17_+_69502397
Show fit
|
1.49 |
ENST00000613873.4
ENST00000589647.5
|
MAP2K6
|
mitogen-activated protein kinase kinase 6
|
|
chr12_-_57818704
Show fit
|
1.49 |
ENST00000549994.1
|
AVIL
|
advillin
|
|
chr5_-_88877967
Show fit
|
1.45 |
ENST00000508610.5
ENST00000636294.1
|
MEF2C
|
myocyte enhancer factor 2C
|
|
chr16_+_30949054
Show fit
|
1.43 |
ENST00000318663.5
ENST00000566237.1
ENST00000562699.1
|
ORAI3
|
ORAI calcium release-activated calcium modulator 3
|
|
chr4_-_137532452
Show fit
|
1.41 |
ENST00000412923.6
ENST00000511115.5
ENST00000344876.9
ENST00000507846.5
ENST00000510305.5
ENST00000611581.1
|
PCDH18
|
protocadherin 18
|
|
chrX_+_28587411
Show fit
|
1.40 |
ENST00000378993.6
|
IL1RAPL1
|
interleukin 1 receptor accessory protein like 1
|
|
chrX_-_24027186
Show fit
|
1.36 |
ENST00000328046.8
|
KLHL15
|
kelch like family member 15
|
|
chr5_+_73813518
Show fit
|
1.34 |
ENST00000296799.8
|
ARHGEF28
|
Rho guanine nucleotide exchange factor 28
|
|
chr3_+_124094663
Show fit
|
1.27 |
ENST00000460856.5
ENST00000240874.7
|
KALRN
|
kalirin RhoGEF kinase
|
|
chr9_-_13165442
Show fit
|
1.26 |
ENST00000542239.1
ENST00000538841.5
ENST00000433359.6
|
MPDZ
|
multiple PDZ domain crumbs cell polarity complex component
|
|
chr5_+_62578810
Show fit
|
1.25 |
ENST00000334994.6
ENST00000409534.1
|
LRRC70
IPO11
|
leucine rich repeat containing 70
importin 11
|
|
chr11_-_66677748
Show fit
|
1.24 |
ENST00000525754.5
ENST00000531969.5
ENST00000524637.1
ENST00000531036.2
ENST00000310046.9
|
RBM4B
|
RNA binding motif protein 4B
|
|
chr7_-_129952631
Show fit
|
1.21 |
ENST00000473814.6
ENST00000490974.1
|
UBE2H
|
ubiquitin conjugating enzyme E2 H
|
|
chr8_-_29263063
Show fit
|
1.20 |
ENST00000524189.6
|
KIF13B
|
kinesin family member 13B
|
|
chr17_+_60677822
Show fit
|
1.19 |
ENST00000407086.8
ENST00000589222.5
ENST00000626960.2
ENST00000390652.9
|
BCAS3
|
BCAS3 microtubule associated cell migration factor
|
|
chr22_+_37805218
Show fit
|
1.18 |
ENST00000340857.4
|
H1-0
|
H1.0 linker histone
|
|
chr17_+_2337480
Show fit
|
1.17 |
ENST00000268989.8
ENST00000426855.6
|
SGSM2
|
small G protein signaling modulator 2
|
|
chr11_+_121590388
Show fit
|
1.16 |
ENST00000527934.1
|
SORL1
|
sortilin related receptor 1
|
|
chr9_-_122213903
Show fit
|
1.15 |
ENST00000464484.3
|
LHX6
|
LIM homeobox 6
|
|
chr9_-_20382461
Show fit
|
1.14 |
ENST00000380321.5
ENST00000629733.3
|
MLLT3
|
MLLT3 super elongation complex subunit
|
|
chr3_-_149657996
Show fit
|
1.13 |
ENST00000360632.8
ENST00000467467.5
ENST00000460517.1
|
WWTR1
|
WW domain containing transcription regulator 1
|
|
chr3_+_141324208
Show fit
|
1.12 |
ENST00000509842.5
|
ZBTB38
|
zinc finger and BTB domain containing 38
|
|
chr9_-_122213874
Show fit
|
1.11 |
ENST00000482062.1
|
LHX6
|
LIM homeobox 6
|
|
chr1_+_92168915
Show fit
|
1.11 |
ENST00000637221.2
|
BTBD8
|
BTB domain containing 8
|
|
chr6_+_143608170
Show fit
|
1.08 |
ENST00000427704.6
ENST00000305766.10
|
PHACTR2
|
phosphatase and actin regulator 2
|
|
chr1_-_85404494
Show fit
|
1.07 |
ENST00000633113.1
|
DDAH1
|
dimethylarginine dimethylaminohydrolase 1
|
|
chr2_-_215393126
Show fit
|
1.03 |
ENST00000456923.5
|
FN1
|
fibronectin 1
|
|
chr19_+_4909430
Show fit
|
1.02 |
ENST00000620565.4
ENST00000613817.4
ENST00000624301.3
ENST00000650932.1
|
UHRF1
|
ubiquitin like with PHD and ring finger domains 1
|
|
chr1_+_28438104
Show fit
|
1.01 |
ENST00000633167.1
ENST00000373836.4
|
PHACTR4
|
phosphatase and actin regulator 4
|
|
chr4_+_107989880
Show fit
|
1.00 |
ENST00000309522.8
ENST00000403312.6
ENST00000638559.1
ENST00000682373.1
|
HADH
|
hydroxyacyl-CoA dehydrogenase
|
|
chr11_-_19240936
Show fit
|
0.98 |
ENST00000250024.9
|
E2F8
|
E2F transcription factor 8
|
|
chr8_-_6563044
Show fit
|
0.97 |
ENST00000338312.10
|
ANGPT2
|
angiopoietin 2
|
|
chr17_-_48590231
Show fit
|
0.96 |
ENST00000476342.1
ENST00000460160.5
ENST00000498678.6
ENST00000472863.5
|
HOXB3
|
homeobox B3
|
|
chr8_+_67952028
Show fit
|
0.95 |
ENST00000288368.5
|
PREX2
|
phosphatidylinositol-3,4,5-trisphosphate dependent Rac exchange factor 2
|
|
chr11_+_31650024
Show fit
|
0.93 |
ENST00000638317.1
|
ELP4
|
elongator acetyltransferase complex subunit 4
|
|
chr9_+_79571956
Show fit
|
0.90 |
ENST00000376552.8
|
TLE4
|
TLE family member 4, transcriptional corepressor
|
|
chr17_+_75110021
Show fit
|
0.89 |
ENST00000584947.1
|
ARMC7
|
armadillo repeat containing 7
|
|
chr3_+_141387616
Show fit
|
0.89 |
ENST00000509883.5
|
ZBTB38
|
zinc finger and BTB domain containing 38
|
|
chr8_+_42338477
Show fit
|
0.86 |
ENST00000518925.5
ENST00000265421.9
|
POLB
|
DNA polymerase beta
|
|
chr2_+_134254065
Show fit
|
0.85 |
ENST00000281923.4
|
MGAT5
|
alpha-1,6-mannosylglycoprotein 6-beta-N-acetylglucosaminyltransferase
|
|
chr1_+_87331668
Show fit
|
0.83 |
ENST00000370542.1
|
LMO4
|
LIM domain only 4
|
|
chr3_+_124094696
Show fit
|
0.83 |
ENST00000360013.7
ENST00000684186.1
ENST00000684276.1
|
KALRN
|
kalirin RhoGEF kinase
|
|
chr3_+_182793478
Show fit
|
0.82 |
ENST00000493826.1
ENST00000323116.10
|
ATP11B
|
ATPase phospholipid transporting 11B (putative)
|
|
chr11_+_123590939
Show fit
|
0.80 |
ENST00000646146.1
|
GRAMD1B
|
GRAM domain containing 1B
|
|
chr1_+_153728042
Show fit
|
0.79 |
ENST00000318967.7
ENST00000435409.6
|
INTS3
|
integrator complex subunit 3
|
|
chr17_-_48545077
Show fit
|
0.79 |
ENST00000330070.6
|
HOXB2
|
homeobox B2
|
|
chr3_-_114624193
Show fit
|
0.78 |
ENST00000481632.5
|
ZBTB20
|
zinc finger and BTB domain containing 20
|
|
chr8_-_6563238
Show fit
|
0.76 |
ENST00000629816.3
ENST00000523120.2
|
ANGPT2
|
angiopoietin 2
|
|
chr11_+_103109522
Show fit
|
0.76 |
ENST00000334267.11
|
DYNC2H1
|
dynein cytoplasmic 2 heavy chain 1
|
|
chr3_-_114624979
Show fit
|
0.74 |
ENST00000676079.1
|
ZBTB20
|
zinc finger and BTB domain containing 20
|
|
chr2_-_73293538
Show fit
|
0.74 |
ENST00000436467.4
ENST00000545030.1
|
EGR4
|
early growth response 4
|
|
chr3_-_114624921
Show fit
|
0.73 |
ENST00000393785.6
|
ZBTB20
|
zinc finger and BTB domain containing 20
|
|
chr2_+_209653171
Show fit
|
0.72 |
ENST00000447185.5
|
MAP2
|
microtubule associated protein 2
|
|
chr8_-_6563409
Show fit
|
0.72 |
ENST00000325203.9
|
ANGPT2
|
angiopoietin 2
|
|
chr14_+_58298497
Show fit
|
0.72 |
ENST00000348476.7
ENST00000355431.8
ENST00000395168.7
|
ARID4A
|
AT-rich interaction domain 4A
|
|
chr15_+_58410543
Show fit
|
0.70 |
ENST00000356113.10
ENST00000414170.7
|
LIPC
|
lipase C, hepatic type
|
|
chrX_-_126166273
Show fit
|
0.70 |
ENST00000360028.4
|
DCAF12L2
|
DDB1 and CUL4 associated factor 12 like 2
|
|
chr2_-_191847068
Show fit
|
0.69 |
ENST00000304141.5
|
CAVIN2
|
caveolae associated protein 2
|
|
chr10_-_63269057
Show fit
|
0.68 |
ENST00000542921.5
|
JMJD1C
|
jumonji domain containing 1C
|
|
chr5_+_102808057
Show fit
|
0.67 |
ENST00000684043.1
ENST00000682407.1
|
PAM
|
peptidylglycine alpha-amidating monooxygenase
|
|
chr1_+_155078829
Show fit
|
0.67 |
ENST00000368408.4
|
EFNA3
|
ephrin A3
|
|
chr8_-_101790934
Show fit
|
0.67 |
ENST00000523645.5
ENST00000520346.1
ENST00000220931.11
ENST00000522448.5
ENST00000522951.5
ENST00000522252.5
ENST00000519098.5
|
NCALD
|
neurocalcin delta
|
|
chr6_-_31897675
Show fit
|
0.66 |
ENST00000375530.8
ENST00000375537.8
|
EHMT2
|
euchromatic histone lysine methyltransferase 2
|
|
chr8_+_42338454
Show fit
|
0.66 |
ENST00000532157.5
ENST00000520008.5
|
POLB
|
DNA polymerase beta
|
|
chr5_-_141673160
Show fit
|
0.64 |
ENST00000513878.5
|
ARAP3
|
ArfGAP with RhoGAP domain, ankyrin repeat and PH domain 3
|
|
chr17_-_48101087
Show fit
|
0.63 |
ENST00000393408.7
|
CBX1
|
chromobox 1
|
|
chrX_+_130339886
Show fit
|
0.63 |
ENST00000543953.5
ENST00000612248.4
ENST00000424447.5
ENST00000545805.6
|
SLC25A14
|
solute carrier family 25 member 14
|
|
chr5_+_141208697
Show fit
|
0.63 |
ENST00000624949.1
ENST00000622978.1
ENST00000239450.4
|
PCDHB12
|
protocadherin beta 12
|
|
chrX_+_130339941
Show fit
|
0.62 |
ENST00000218197.9
|
SLC25A14
|
solute carrier family 25 member 14
|
|
chr14_-_36582593
Show fit
|
0.62 |
ENST00000258829.6
|
NKX2-8
|
NK2 homeobox 8
|
|
chr12_-_89352395
Show fit
|
0.60 |
ENST00000308385.6
|
DUSP6
|
dual specificity phosphatase 6
|
|
chr3_+_152299570
Show fit
|
0.59 |
ENST00000485910.5
ENST00000463374.5
|
MBNL1
|
muscleblind like splicing regulator 1
|
|
chr17_+_30378903
Show fit
|
0.59 |
ENST00000225719.9
|
CPD
|
carboxypeptidase D
|
|
chr8_+_133113483
Show fit
|
0.58 |
ENST00000521107.1
|
TG
|
thyroglobulin
|
|
chr8_-_53842899
Show fit
|
0.58 |
ENST00000524234.1
ENST00000521275.5
ENST00000396774.6
|
ATP6V1H
|
ATPase H+ transporting V1 subunit H
|
|
chr2_-_163735989
Show fit
|
0.57 |
ENST00000333129.4
ENST00000409634.5
|
FIGN
|
fidgetin, microtubule severing factor
|
|
chr4_+_87608529
Show fit
|
0.57 |
ENST00000651931.1
|
DSPP
|
dentin sialophosphoprotein
|
|
chr17_+_4710622
Show fit
|
0.56 |
ENST00000574954.5
ENST00000269260.7
ENST00000346341.6
ENST00000572457.5
ENST00000381488.10
ENST00000412477.7
ENST00000571428.5
ENST00000575877.5
|
ARRB2
|
arrestin beta 2
|
|
chr6_+_26251607
Show fit
|
0.56 |
ENST00000619466.2
|
H2BC9
|
H2B clustered histone 9
|
|
chr20_+_45306834
Show fit
|
0.56 |
ENST00000343694.8
ENST00000372741.7
ENST00000372743.5
|
RBPJL
|
recombination signal binding protein for immunoglobulin kappa J region like
|
|
chr10_-_125160499
Show fit
|
0.54 |
ENST00000494626.6
ENST00000337195.9
|
CTBP2
|
C-terminal binding protein 2
|
|
chr17_+_28042839
Show fit
|
0.53 |
ENST00000582037.2
|
NLK
|
nemo like kinase
|
|
chr18_-_24311495
Show fit
|
0.52 |
ENST00000357041.8
|
OSBPL1A
|
oxysterol binding protein like 1A
|
|
chrX_+_135520616
Show fit
|
0.50 |
ENST00000370752.4
ENST00000639893.2
|
INTS6L
|
integrator complex subunit 6 like
|
|
chr17_+_28042660
Show fit
|
0.49 |
ENST00000407008.8
|
NLK
|
nemo like kinase
|
|
chr10_-_17129786
Show fit
|
0.48 |
ENST00000377833.10
|
CUBN
|
cubilin
|
|
chr9_+_132978651
Show fit
|
0.48 |
ENST00000636137.1
|
GFI1B
|
growth factor independent 1B transcriptional repressor
|
|
chr19_-_39391029
Show fit
|
0.48 |
ENST00000221265.8
|
PAF1
|
PAF1 homolog, Paf1/RNA polymerase II complex component
|
|
chr1_-_248277976
Show fit
|
0.47 |
ENST00000641220.1
|
OR2T33
|
olfactory receptor family 2 subfamily T member 33
|
|
chr4_+_105552611
Show fit
|
0.47 |
ENST00000265154.6
ENST00000420470.3
|
ARHGEF38
|
Rho guanine nucleotide exchange factor 38
|
|
chrX_-_19799751
Show fit
|
0.47 |
ENST00000379698.8
|
SH3KBP1
|
SH3 domain containing kinase binding protein 1
|
|
chr3_+_100492548
Show fit
|
0.47 |
ENST00000323523.8
ENST00000403410.5
ENST00000449609.1
|
TMEM45A
|
transmembrane protein 45A
|
|
chr2_-_210171402
Show fit
|
0.46 |
ENST00000281772.14
|
KANSL1L
|
KAT8 regulatory NSL complex subunit 1 like
|
|
chr16_-_75248190
Show fit
|
0.46 |
ENST00000542031.6
|
BCAR1
|
BCAR1 scaffold protein, Cas family member
|
|
chr2_+_209580024
Show fit
|
0.46 |
ENST00000392194.5
|
MAP2
|
microtubule associated protein 2
|
|
chr17_-_35868885
Show fit
|
0.45 |
ENST00000604834.6
|
HEATR9
|
HEAT repeat containing 9
|
|
chr12_-_89352487
Show fit
|
0.43 |
ENST00000548755.1
ENST00000279488.8
|
DUSP6
|
dual specificity phosphatase 6
|
|
chr9_-_95516959
Show fit
|
0.42 |
ENST00000437951.6
ENST00000430669.6
ENST00000468211.6
|
PTCH1
|
patched 1
|
|
chr3_-_33659097
Show fit
|
0.42 |
ENST00000461133.8
ENST00000496954.2
|
CLASP2
|
cytoplasmic linker associated protein 2
|
|
chr17_-_35868858
Show fit
|
0.39 |
ENST00000603870.5
ENST00000603218.1
|
HEATR9
|
HEAT repeat containing 9
|
|
chr9_+_128275343
Show fit
|
0.39 |
ENST00000495313.5
ENST00000372898.6
|
SWI5
|
SWI5 homologous recombination repair protein
|
|
chr3_+_152299392
Show fit
|
0.38 |
ENST00000498502.5
ENST00000545754.5
ENST00000357472.7
ENST00000324196.9
|
MBNL1
|
muscleblind like splicing regulator 1
|
|
chr22_-_31346317
Show fit
|
0.38 |
ENST00000266269.10
|
PATZ1
|
POZ/BTB and AT hook containing zinc finger 1
|
|
chr7_-_151248668
Show fit
|
0.37 |
ENST00000262188.13
|
SMARCD3
|
SWI/SNF related, matrix associated, actin dependent regulator of chromatin, subfamily d, member 3
|
|
chr2_+_209579598
Show fit
|
0.37 |
ENST00000445941.5
ENST00000673860.1
|
MAP2
|
microtubule associated protein 2
|
|
chr12_+_32106885
Show fit
|
0.37 |
ENST00000550207.1
|
BICD1
|
BICD cargo adaptor 1
|
|
chr11_-_62646598
Show fit
|
0.36 |
ENST00000648273.1
ENST00000356638.8
ENST00000346178.8
ENST00000534779.5
ENST00000525994.1
ENST00000540933.5
|
GANAB
|
glucosidase II alpha subunit
|
|
chr2_-_110534010
Show fit
|
0.36 |
ENST00000437167.1
|
RGPD6
|
RANBP2 like and GRIP domain containing 6
|
|
chr9_-_108855978
Show fit
|
0.35 |
ENST00000374667.5
|
ACTL7B
|
actin like 7B
|
|
chr12_+_32106762
Show fit
|
0.35 |
ENST00000551848.1
ENST00000652176.1
|
BICD1
|
BICD cargo adaptor 1
|
|
chr9_+_132978687
Show fit
|
0.34 |
ENST00000372122.4
ENST00000372123.5
|
GFI1B
|
growth factor independent 1B transcriptional repressor
|
|
chr17_+_50746534
Show fit
|
0.34 |
ENST00000511974.5
|
LUC7L3
|
LUC7 like 3 pre-mRNA splicing factor
|
|
chr11_-_123061173
Show fit
|
0.33 |
ENST00000526110.5
ENST00000227378.7
|
HSPA8
|
heat shock protein family A (Hsp70) member 8
|
|
chrX_+_41339931
Show fit
|
0.33 |
ENST00000642424.1
|
DDX3X
|
DEAD-box helicase 3 X-linked
|
|
chr19_-_42069496
Show fit
|
0.32 |
ENST00000593562.5
|
GRIK5
|
glutamate ionotropic receptor kainate type subunit 5
|
|
chr5_+_138338256
Show fit
|
0.32 |
ENST00000513056.5
ENST00000239906.10
ENST00000511276.1
|
FAM53C
|
family with sequence similarity 53 member C
|
|
chr10_-_100987433
Show fit
|
0.32 |
ENST00000448244.5
ENST00000370241.7
ENST00000370236.5
ENST00000370234.4
ENST00000299179.9
ENST00000318325.6
ENST00000370242.8
ENST00000342071.5
ENST00000318364.12
ENST00000477279.1
|
MRPL43
|
mitochondrial ribosomal protein L43
|
|
chrX_-_32412220
Show fit
|
0.31 |
ENST00000619831.5
|
DMD
|
dystrophin
|
|
chrX_-_101386166
Show fit
|
0.31 |
ENST00000308731.8
ENST00000372880.5
|
BTK
|
Bruton tyrosine kinase
|
|
chr5_-_135399863
Show fit
|
0.30 |
ENST00000510038.1
ENST00000304332.8
|
MACROH2A1
|
macroH2A.1 histone
|
|
chr4_+_70721953
Show fit
|
0.30 |
ENST00000381006.8
ENST00000226328.8
|
RUFY3
|
RUN and FYVE domain containing 3
|
|
chr8_+_19939246
Show fit
|
0.29 |
ENST00000650287.1
|
LPL
|
lipoprotein lipase
|
|
chr11_-_31810991
Show fit
|
0.29 |
ENST00000640684.1
|
PAX6
|
paired box 6
|
|
chr19_-_39391137
Show fit
|
0.29 |
ENST00000595564.5
|
PAF1
|
PAF1 homolog, Paf1/RNA polymerase II complex component
|
|
chr17_+_2337622
Show fit
|
0.29 |
ENST00000574563.5
|
SGSM2
|
small G protein signaling modulator 2
|
|
chr5_+_32710630
Show fit
|
0.29 |
ENST00000326958.5
|
NPR3
|
natriuretic peptide receptor 3
|
|
chr7_-_117323041
Show fit
|
0.29 |
ENST00000491214.1
ENST00000265441.8
|
WNT2
|
Wnt family member 2
|
|
chr4_+_113292838
Show fit
|
0.28 |
ENST00000672411.1
ENST00000673231.1
|
ANK2
|
ankyrin 2
|
|
chr14_+_75985747
Show fit
|
0.28 |
ENST00000679083.1
ENST00000314067.11
ENST00000238628.10
ENST00000556742.1
|
IFT43
|
intraflagellar transport 43
|
|
chr9_-_98708856
Show fit
|
0.28 |
ENST00000259455.4
|
GABBR2
|
gamma-aminobutyric acid type B receptor subunit 2
|
|
chrX_+_100584928
Show fit
|
0.28 |
ENST00000373031.5
|
TNMD
|
tenomodulin
|
|
chr17_+_44352109
Show fit
|
0.27 |
ENST00000586242.1
|
GRN
|
granulin precursor
|
|
chr1_+_211259932
Show fit
|
0.26 |
ENST00000367005.8
|
RCOR3
|
REST corepressor 3
|
|
chr8_+_26390362
Show fit
|
0.26 |
ENST00000518611.5
|
BNIP3L
|
BCL2 interacting protein 3 like
|
|
chr6_+_44227025
Show fit
|
0.26 |
ENST00000371708.1
|
SLC29A1
|
solute carrier family 29 member 1 (Augustine blood group)
|
|
chr19_+_10655023
Show fit
|
0.26 |
ENST00000590009.5
|
ILF3
|
interleukin enhancer binding factor 3
|
|
chr5_+_177133741
Show fit
|
0.25 |
ENST00000439151.7
|
NSD1
|
nuclear receptor binding SET domain protein 1
|
|
chr9_+_128276222
Show fit
|
0.25 |
ENST00000608796.6
ENST00000419867.7
ENST00000418976.2
|
SWI5
|
SWI5 homologous recombination repair protein
|
|
chr5_+_181040260
Show fit
|
0.25 |
ENST00000515271.1
ENST00000327705.14
|
BTNL9
|
butyrophilin like 9
|
|
chr13_-_41019289
Show fit
|
0.25 |
ENST00000239882.7
|
ELF1
|
E74 like ETS transcription factor 1
|
|
chr17_+_50746614
Show fit
|
0.24 |
ENST00000513969.5
ENST00000503728.1
|
LUC7L3
|
LUC7 like 3 pre-mRNA splicing factor
|
|
chr15_+_48191648
Show fit
|
0.24 |
ENST00000646012.1
ENST00000561127.5
ENST00000647546.1
ENST00000559641.5
ENST00000417307.3
|
SLC12A1
CTXN2
|
solute carrier family 12 member 1
cortexin 2
|
|
chr7_+_100015588
Show fit
|
0.24 |
ENST00000324306.11
ENST00000426572.5
|
ZKSCAN1
|
zinc finger with KRAB and SCAN domains 1
|
|
chr6_+_21593742
Show fit
|
0.24 |
ENST00000244745.4
|
SOX4
|
SRY-box transcription factor 4
|
|
chr10_-_77637633
Show fit
|
0.23 |
ENST00000638223.1
ENST00000639544.1
ENST00000640807.1
ENST00000434208.6
ENST00000626620.3
ENST00000638575.1
ENST00000638759.1
|
KCNMA1
|
potassium calcium-activated channel subfamily M alpha 1
|
|
chr4_+_113292925
Show fit
|
0.23 |
ENST00000673353.1
ENST00000505342.6
ENST00000672915.1
ENST00000509550.5
|
ANK2
|
ankyrin 2
|
|
chr10_+_84452208
Show fit
|
0.23 |
ENST00000480006.1
|
CCSER2
|
coiled-coil serine rich protein 2
|
|
chr1_+_56854764
Show fit
|
0.23 |
ENST00000361249.4
|
C8A
|
complement C8 alpha chain
|
|
chr19_+_39391323
Show fit
|
0.23 |
ENST00000615911.4
ENST00000315588.11
ENST00000594368.5
ENST00000596297.1
|
MED29
|
mediator complex subunit 29
|
