Project
Inflammatory response time course, HUVEC (Wada, 2009)
Navigation
Downloads
Results for DUXA
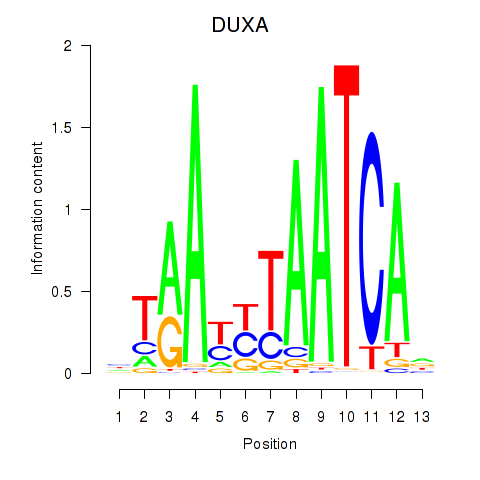
Z-value: 0.89
Motif logo
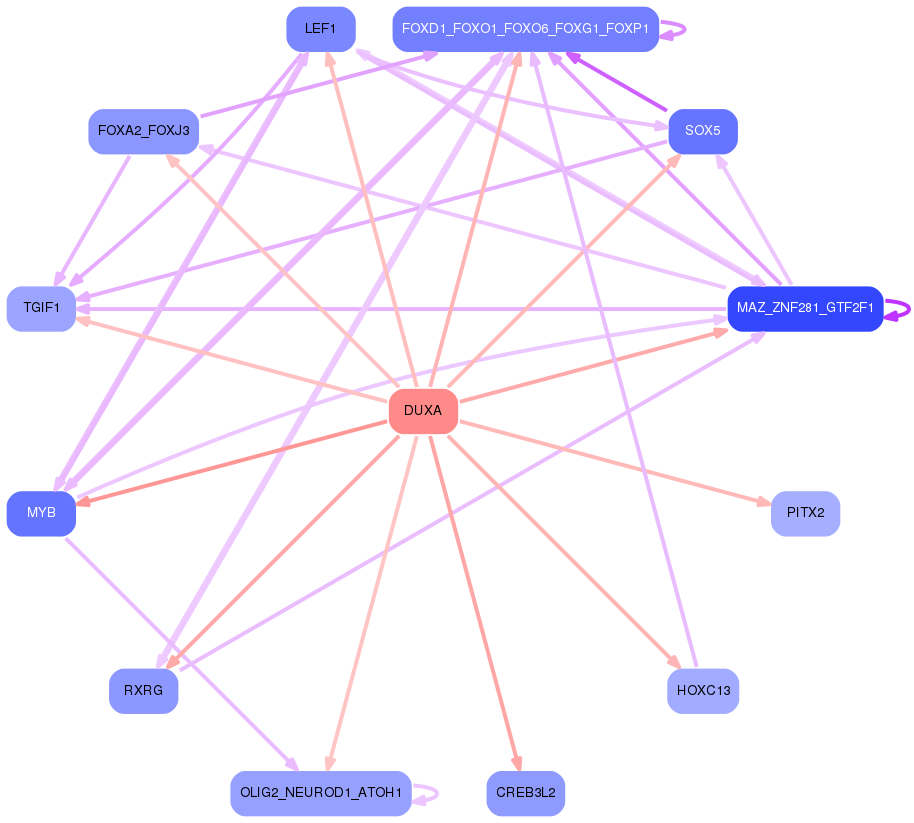
Transcription factors associated with DUXA
| Gene Symbol | Gene ID | Gene Info |
|---|---|---|
|
DUXA
|
ENSG00000258873.3 | DUXA |
Activity profile of DUXA motif
Sorted Z-values of DUXA motif
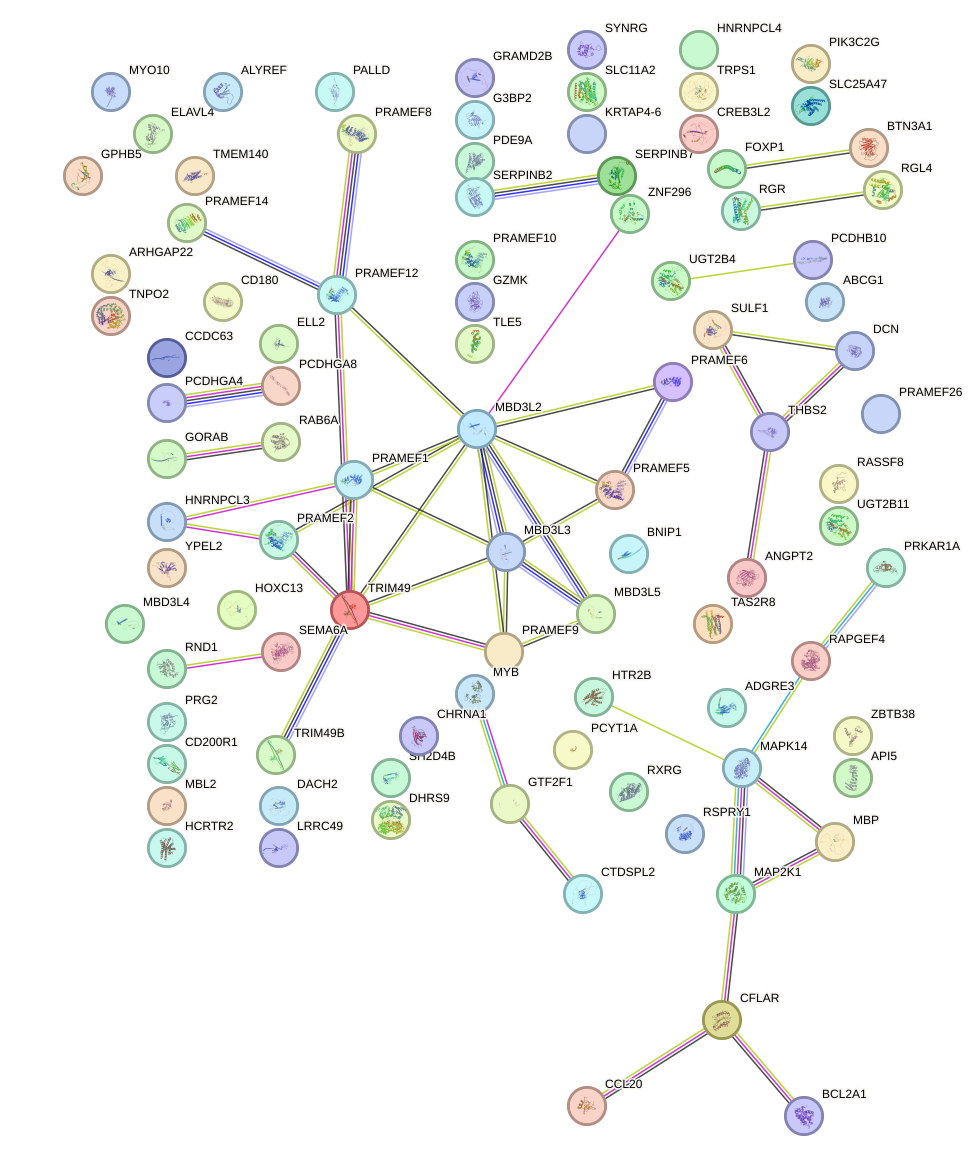
Network of associatons between targets according to the STRING database.
First level regulatory network of DUXA
| Promoter | Score | Transcript | Gene | Gene Info |
|---|---|---|---|---|
| chr2_+_227813834 | 3.84 |
ENST00000358813.5
ENST00000409189.7 |
CCL20
|
C-C motif chemokine ligand 20 |
| chr21_+_42199686 | 2.37 |
ENST00000398457.6
|
ABCG1
|
ATP binding cassette subfamily G member 1 |
| chr12_-_48865863 | 1.92 |
ENST00000309739.6
|
RND1
|
Rho family GTPase 1 |
| chr1_+_12857086 | 1.76 |
ENST00000240189.2
|
PRAMEF2
|
PRAME family member 2 |
| chr2_+_201129318 | 1.51 |
ENST00000417748.1
|
CFLAR
|
CASP8 and FADD like apoptosis regulator |
| chr2_-_224947030 | 1.35 |
ENST00000409592.7
|
DOCK10
|
dedicator of cytokinesis 10 |
| chr1_+_12773738 | 1.21 |
ENST00000357726.5
|
PRAMEF12
|
PRAME family member 12 |
| chr11_-_4288083 | 1.16 |
ENST00000638166.1
|
SSU72P4
|
SSU72 pseudogene 4 |
| chr2_+_201129483 | 1.14 |
ENST00000440180.5
|
CFLAR
|
CASP8 and FADD like apoptosis regulator |
| chr1_+_12791397 | 1.13 |
ENST00000332296.7
|
PRAMEF1
|
PRAME family member 1 |
| chr8_-_6563409 | 1.11 |
ENST00000325203.9
|
ANGPT2
|
angiopoietin 2 |
| chr2_+_161136901 | 1.02 |
ENST00000259075.6
ENST00000432002.5 |
TANK
|
TRAF family member associated NFKB activator |
| chr18_-_77127935 | 0.96 |
ENST00000581878.5
|
MBP
|
myelin basic protein |
| chr5_+_126423122 | 0.95 |
ENST00000515200.5
|
GRAMD2B
|
GRAM domain containing 2B |
| chr5_+_126423363 | 0.94 |
ENST00000285689.8
|
GRAMD2B
|
GRAM domain containing 2B |
| chr5_+_126423176 | 0.94 |
ENST00000542322.5
ENST00000544396.5 |
GRAMD2B
|
GRAM domain containing 2B |
| chr15_+_70936487 | 0.82 |
ENST00000558456.5
ENST00000560158.6 ENST00000558808.5 ENST00000559806.5 ENST00000559069.1 |
LRRC49
|
leucine rich repeat containing 49 |
| chr2_-_174764436 | 0.82 |
ENST00000409323.1
ENST00000261007.9 ENST00000348749.9 ENST00000672640.1 |
CHRNA1
|
cholinergic receptor nicotinic alpha 1 subunit |
| chr1_-_13285154 | 0.82 |
ENST00000357367.6
ENST00000614831.1 |
PRAMEF8
|
PRAME family member 8 |
| chr11_-_4242640 | 0.82 |
ENST00000640805.1
|
SSU72P2
|
SSU72 pseudogene 2 |
| chr11_+_4233288 | 0.80 |
ENST00000639584.1
|
SSU72P5
|
SSU72 pseudogene 5 |
| chr18_+_63887698 | 0.79 |
ENST00000457692.5
ENST00000299502.9 ENST00000413956.5 |
SERPINB2
|
serpin family B member 2 |
| chr15_-_79971164 | 0.79 |
ENST00000335661.6
ENST00000267953.4 ENST00000677151.1 |
BCL2A1
|
BCL2 related protein A1 |
| chr2_+_201129826 | 0.78 |
ENST00000457277.5
|
CFLAR
|
CASP8 and FADD like apoptosis regulator |
| chr6_+_135181323 | 0.76 |
ENST00000367814.8
|
MYB
|
MYB proto-oncogene, transcription factor |
| chr11_-_4339244 | 0.75 |
ENST00000524542.2
|
SSU72P7
|
SSU72 pseudogene 7 |
| chr3_-_196270540 | 0.72 |
ENST00000419333.5
|
PCYT1A
|
phosphate cytidylyltransferase 1, choline, alpha |
| chr5_-_16916400 | 0.72 |
ENST00000513882.5
|
MYO10
|
myosin X |
| chr6_+_55174508 | 0.71 |
ENST00000370862.4
|
HCRTR2
|
hypocretin receptor 2 |
| chr1_-_13201409 | 0.70 |
ENST00000625019.3
|
PRAMEF13
|
PRAME family member 13 |
| chr5_+_141355003 | 0.70 |
ENST00000571252.3
ENST00000612927.1 |
PCDHGA4
|
protocadherin gamma subfamily A, 4 |
| chr6_+_135181268 | 0.68 |
ENST00000341911.10
ENST00000442647.7 ENST00000618728.4 ENST00000316528.12 ENST00000616088.4 |
MYB
|
MYB proto-oncogene, transcription factor |
| chr17_+_59331633 | 0.65 |
ENST00000312655.9
|
YPEL2
|
yippee like 2 |
| chr6_-_169253835 | 0.64 |
ENST00000649844.1
ENST00000617924.6 |
THBS2
|
thrombospondin 2 |
| chr12_-_51028234 | 0.63 |
ENST00000547688.7
ENST00000394904.9 |
SLC11A2
|
solute carrier family 11 member 2 |
| chr2_-_174764407 | 0.63 |
ENST00000409219.5
ENST00000409542.5 |
CHRNA1
|
cholinergic receptor nicotinic alpha 1 subunit |
| chr12_-_91153149 | 0.63 |
ENST00000550758.1
|
DCN
|
decorin |
| chr10_-_48652493 | 0.62 |
ENST00000435790.6
|
ARHGAP22
|
Rho GTPase activating protein 22 |
| chr12_+_25973748 | 0.60 |
ENST00000542865.5
|
RASSF8
|
Ras association domain family member 8 |
| chr15_+_44427793 | 0.60 |
ENST00000558966.5
ENST00000559793.5 ENST00000558968.1 |
CTDSPL2
|
CTD small phosphatase like 2 |
| chr2_-_231125032 | 0.60 |
ENST00000258400.4
|
HTR2B
|
5-hydroxytryptamine receptor 2B |
| chr17_-_41140487 | 0.57 |
ENST00000345847.4
|
KRTAP4-6
|
keratin associated protein 4-6 |
| chr11_+_49028823 | 0.56 |
ENST00000332682.9
|
TRIM49B
|
tripartite motif containing 49B |
| chr16_+_57186281 | 0.56 |
ENST00000564435.5
ENST00000562959.1 ENST00000568505.6 ENST00000394420.9 ENST00000537866.5 |
RSPRY1
|
ring finger and SPRY domain containing 1 |
| chr7_+_135148041 | 0.56 |
ENST00000275767.3
|
TMEM140
|
transmembrane protein 140 |
| chr5_-_116536458 | 0.55 |
ENST00000510263.5
|
SEMA6A
|
semaphorin 6A |
| chr19_-_3061403 | 0.54 |
ENST00000586839.1
|
TLE5
|
TLE family member 5, transcriptional modulator |
| chr6_+_26402237 | 0.54 |
ENST00000476549.6
ENST00000450085.6 ENST00000425234.6 ENST00000427334.5 ENST00000506698.1 ENST00000289361.11 |
BTN3A1
|
butyrophilin subfamily 3 member A1 |
| chr7_-_138002017 | 0.54 |
ENST00000452463.5
ENST00000456390.5 ENST00000330387.11 |
CREB3L2
|
cAMP responsive element binding protein 3 like 2 |
| chr17_+_68525795 | 0.54 |
ENST00000592800.5
|
PRKAR1A
|
protein kinase cAMP-dependent type I regulatory subunit alpha |
| chr5_-_95961830 | 0.53 |
ENST00000513343.1
ENST00000237853.9 |
ELL2
|
elongation factor for RNA polymerase II 2 |
| chr17_+_68515399 | 0.52 |
ENST00000588188.6
|
PRKAR1A
|
protein kinase cAMP-dependent type I regulatory subunit alpha |
| chr1_-_165445220 | 0.50 |
ENST00000619224.1
|
RXRG
|
retinoid X receptor gamma |
| chr11_-_63490532 | 0.50 |
ENST00000538712.1
|
PLAAT5
|
phospholipase A and acyltransferase 5 |
| chr6_-_169250825 | 0.50 |
ENST00000676869.1
ENST00000676760.1 |
THBS2
|
thrombospondin 2 |
| chr3_+_141402322 | 0.49 |
ENST00000510338.5
ENST00000504673.5 |
ZBTB38
|
zinc finger and BTB domain containing 38 |
| chr19_-_7058640 | 0.49 |
ENST00000333843.8
|
MBD3L3
|
methyl-CpG binding domain protein 3 like 3 |
| chr1_-_165445088 | 0.48 |
ENST00000359842.10
|
RXRG
|
retinoid X receptor gamma |
| chr10_+_80537902 | 0.48 |
ENST00000339284.6
ENST00000646907.2 |
SH2D4B
|
SH2 domain containing 4B |
| chr14_+_22147988 | 0.48 |
ENST00000390457.2
|
TRAV27
|
T cell receptor alpha variable 27 |
| chr1_-_12945416 | 0.48 |
ENST00000415464.6
|
PRAMEF6
|
PRAME family member 6 |
| chr8_+_69466617 | 0.48 |
ENST00000525061.5
ENST00000260128.8 ENST00000458141.6 |
SULF1
|
sulfatase 1 |
| chr19_-_12722547 | 0.48 |
ENST00000592287.5
|
TNPO2
|
transportin 2 |
| chr18_+_63777773 | 0.47 |
ENST00000447428.5
ENST00000546027.5 |
SERPINB7
|
serpin family B member 7 |
| chr1_-_12898270 | 0.47 |
ENST00000235347.4
|
PRAMEF10
|
PRAME family member 10 |
| chr8_-_115492221 | 0.47 |
ENST00000518018.1
|
TRPS1
|
transcriptional repressor GATA binding 1 |
| chr15_+_41286011 | 0.47 |
ENST00000661438.1
|
ENSG00000285920.2
|
novel protein |
| chr19_-_6393205 | 0.46 |
ENST00000595047.5
|
GTF2F1
|
general transcription factor IIF subunit 1 |
| chr5_+_55024250 | 0.45 |
ENST00000231009.3
|
GZMK
|
granzyme K |
| chr19_+_7049321 | 0.45 |
ENST00000381393.3
|
MBD3L2
|
methyl-CpG binding domain protein 3 like 2 |
| chr4_-_75724386 | 0.45 |
ENST00000677606.1
ENST00000678798.1 ENST00000677970.1 ENST00000677620.1 ENST00000679281.1 ENST00000677333.1 ENST00000676470.1 ENST00000499709.3 ENST00000511868.6 ENST00000678971.1 ENST00000677265.1 ENST00000677952.1 ENST00000678122.1 ENST00000678100.1 ENST00000678062.1 ENST00000676666.1 |
G3BP2
|
G3BP stress granule assembly factor 2 |
| chr1_+_170532131 | 0.44 |
ENST00000367762.2
ENST00000367763.8 |
GORAB
|
golgin, RAB6 interacting |
| chr17_-_81891562 | 0.43 |
ENST00000505490.3
|
ALYREF
|
Aly/REF export factor |
| chr4_-_75724362 | 0.43 |
ENST00000677583.1
|
G3BP2
|
G3BP stress granule assembly factor 2 |
| chr11_-_48983826 | 0.42 |
ENST00000649162.1
|
TRIM51GP
|
tripartite motif-containing 51G, pseudogene |
| chr2_+_169066994 | 0.42 |
ENST00000357546.6
ENST00000432060.6 |
DHRS9
|
dehydrogenase/reductase 9 |
| chr6_+_26402289 | 0.42 |
ENST00000414912.2
|
BTN3A1
|
butyrophilin subfamily 3 member A1 |
| chr1_+_13068677 | 0.42 |
ENST00000614839.4
|
PRAMEF25
|
PRAME family member 25 |
| chr4_+_168631597 | 0.42 |
ENST00000504519.5
ENST00000512127.5 |
PALLD
|
palladin, cytoskeletal associated protein |
| chr1_+_13303539 | 0.42 |
ENST00000437300.2
|
PRAMEF33
|
PRAME family member 33 |
| chr11_-_89807220 | 0.41 |
ENST00000532501.2
|
TRIM49
|
tripartite motif containing 49 |
| chr21_+_42653734 | 0.41 |
ENST00000335512.8
ENST00000328862.10 ENST00000335440.10 ENST00000380328.6 ENST00000398225.7 ENST00000398227.7 ENST00000398229.7 ENST00000398232.7 ENST00000398234.7 ENST00000398236.7 ENST00000349112.7 ENST00000398224.3 |
PDE9A
|
phosphodiesterase 9A |
| chr11_-_63491130 | 0.41 |
ENST00000540857.6
ENST00000539221.5 ENST00000301790.4 |
PLAAT5
|
phospholipase A and acyltransferase 5 |
| chr5_-_67196791 | 0.41 |
ENST00000256447.5
|
CD180
|
CD180 molecule |
| chr1_+_50103903 | 0.41 |
ENST00000371827.5
|
ELAVL4
|
ELAV like RNA binding protein 4 |
| chr5_+_173144442 | 0.40 |
ENST00000231668.13
ENST00000351486.10 ENST00000352523.10 ENST00000393770.4 |
BNIP1
|
BCL2 interacting protein 1 |
| chr15_+_66453418 | 0.39 |
ENST00000566326.1
|
MAP2K1
|
mitogen-activated protein kinase kinase 1 |
| chr19_-_7040179 | 0.39 |
ENST00000381394.9
|
MBD3L4
|
methyl-CpG binding domain protein 3 like 4 |
| chr12_-_10807286 | 0.38 |
ENST00000240615.3
|
TAS2R8
|
taste 2 receptor member 8 |
| chr11_+_43311963 | 0.38 |
ENST00000534695.5
ENST00000455725.6 ENST00000531273.6 ENST00000420461.6 ENST00000378852.7 ENST00000534600.5 |
API5
|
apoptosis inhibitor 5 |
| chr19_-_45076465 | 0.37 |
ENST00000303809.7
|
ZNF296
|
zinc finger protein 296 |
| chr11_+_4329865 | 0.37 |
ENST00000640302.1
|
SSU72P3
|
SSU72 pseudogene 3 |
| chrX_+_86714623 | 0.36 |
ENST00000484479.1
|
DACH2
|
dachshund family transcription factor 2 |
| chr14_+_100323332 | 0.36 |
ENST00000361529.5
ENST00000557052.1 |
SLC25A47
|
solute carrier family 25 member 47 |
| chr19_-_7021431 | 0.36 |
ENST00000636986.2
ENST00000637800.1 |
MBD3L2B
|
methyl-CpG binding domain protein 3 like 2B |
| chr19_-_14674886 | 0.35 |
ENST00000344373.8
ENST00000595472.1 |
ADGRE3
|
adhesion G protein-coupled receptor E3 |
| chr19_+_7030578 | 0.35 |
ENST00000329753.5
|
MBD3L5
|
methyl-CpG binding domain protein 3 like 5 |
| chr19_-_14674829 | 0.35 |
ENST00000443157.6
ENST00000253673.6 |
ADGRE3
|
adhesion G protein-coupled receptor E3 |
| chr10_+_84230660 | 0.34 |
ENST00000652073.1
|
RGR
|
retinal G protein coupled receptor |
| chr3_-_71360753 | 0.34 |
ENST00000648783.1
|
FOXP1
|
forkhead box P1 |
| chr12_+_53938824 | 0.33 |
ENST00000243056.5
|
HOXC13
|
homeobox C13 |
| chr12_+_110846960 | 0.33 |
ENST00000545036.5
ENST00000308208.10 |
CCDC63
|
coiled-coil domain containing 63 |
| chr7_-_138001794 | 0.33 |
ENST00000616381.4
ENST00000620715.4 |
CREB3L2
|
cAMP responsive element binding protein 3 like 2 |
| chr5_+_141392616 | 0.33 |
ENST00000398604.3
|
PCDHGA8
|
protocadherin gamma subfamily A, 8 |
| chr11_-_73761051 | 0.33 |
ENST00000336083.8
ENST00000536566.5 ENST00000541588.5 ENST00000540771.5 ENST00000310653.10 |
RAB6A
|
RAB6A, member RAS oncogene family |
| chr12_+_18262730 | 0.33 |
ENST00000675017.1
|
PIK3C2G
|
phosphatidylinositol-4-phosphate 3-kinase catalytic subunit type 2 gamma |
| chr1_+_13060769 | 0.32 |
ENST00000617807.3
|
HNRNPCL3
|
heterogeneous nuclear ribonucleoprotein C like 3 |
| chr7_+_142384328 | 0.32 |
ENST00000390361.3
|
TRBV7-3
|
T cell receptor beta variable 7-3 |
| chr14_-_63318933 | 0.31 |
ENST00000621500.2
|
GPHB5
|
glycoprotein hormone subunit beta 5 |
| chr1_+_13070853 | 0.30 |
ENST00000619661.2
|
PRAMEF25
|
PRAME family member 25 |
| chr6_+_36029082 | 0.30 |
ENST00000472333.1
|
MAPK14
|
mitogen-activated protein kinase 14 |
| chr1_+_13254212 | 0.30 |
ENST00000622421.2
|
PRAMEF5
|
PRAME family member 5 |
| chr3_+_127193131 | 0.30 |
ENST00000624688.2
|
C3orf56
|
chromosome 3 open reading frame 56 |
| chr11_-_13496018 | 0.30 |
ENST00000529816.1
|
PTH
|
parathyroid hormone |
| chr5_+_141192330 | 0.30 |
ENST00000239446.6
|
PCDHB10
|
protocadherin beta 10 |
| chr17_-_37542361 | 0.30 |
ENST00000614196.1
|
SYNRG
|
synergin gamma |
| chr4_-_69214743 | 0.29 |
ENST00000446444.2
|
UGT2B11
|
UDP glucuronosyltransferase family 2 member B11 |
| chr2_+_172928165 | 0.29 |
ENST00000535187.5
|
RAPGEF4
|
Rap guanine nucleotide exchange factor 4 |
| chr6_+_29306626 | 0.28 |
ENST00000377160.4
|
OR14J1
|
olfactory receptor family 14 subfamily J member 1 |
| chr19_-_12722350 | 0.28 |
ENST00000356861.9
|
TNPO2
|
transportin 2 |
| chr12_-_6635938 | 0.28 |
ENST00000329858.9
|
LPAR5
|
lysophosphatidic acid receptor 5 |
| chr3_+_160225409 | 0.28 |
ENST00000326474.5
|
C3orf80
|
chromosome 3 open reading frame 80 |
| chr4_-_110641920 | 0.28 |
ENST00000354925.6
ENST00000511990.1 ENST00000613094.4 ENST00000614423.4 ENST00000616641.4 ENST00000511837.5 |
PITX2
|
paired like homeodomain 2 |
| chr19_-_45076504 | 0.28 |
ENST00000622376.1
|
ZNF296
|
zinc finger protein 296 |
| chr5_+_122160168 | 0.27 |
ENST00000509403.6
ENST00000514637.1 |
ENSG00000250803.6
|
novel zinc finger protein |
| chrX_+_1591590 | 0.27 |
ENST00000313871.9
ENST00000381261.8 |
AKAP17A
|
A-kinase anchoring protein 17A |
| chr14_+_67720842 | 0.27 |
ENST00000267502.3
|
RDH12
|
retinol dehydrogenase 12 |
| chr1_-_12947580 | 0.27 |
ENST00000376189.5
|
PRAMEF6
|
PRAME family member 6 |
| chr12_-_23584600 | 0.27 |
ENST00000396007.6
|
SOX5
|
SRY-box transcription factor 5 |
| chr7_-_144264792 | 0.27 |
ENST00000641841.1
|
OR2A7
|
olfactory receptor family 2 subfamily A member 7 |
| chr12_+_110847000 | 0.26 |
ENST00000552694.1
|
CCDC63
|
coiled-coil domain containing 63 |
| chr1_+_224183197 | 0.26 |
ENST00000323699.9
|
DEGS1
|
delta 4-desaturase, sphingolipid 1 |
| chr6_+_31586124 | 0.26 |
ENST00000418507.6
ENST00000376096.5 ENST00000376099.5 ENST00000376110.7 |
LST1
|
leukocyte specific transcript 1 |
| chr17_-_76737321 | 0.26 |
ENST00000359995.10
ENST00000508921.7 ENST00000583836.1 ENST00000358156.6 ENST00000392485.2 |
SRSF2
|
serine and arginine rich splicing factor 2 |
| chr17_+_44957907 | 0.26 |
ENST00000678938.1
|
NMT1
|
N-myristoyltransferase 1 |
| chr11_+_114400030 | 0.25 |
ENST00000540163.5
|
RBM7
|
RNA binding motif protein 7 |
| chr1_+_13171848 | 0.25 |
ENST00000415919.3
|
PRAMEF9
|
PRAME family member 9 |
| chr1_-_13347134 | 0.25 |
ENST00000334600.7
|
PRAMEF14
|
PRAME family member 14 |
| chr7_-_126533850 | 0.25 |
ENST00000444921.3
|
GRM8
|
glutamate metabotropic receptor 8 |
| chr5_-_149944744 | 0.24 |
ENST00000255266.10
ENST00000617647.4 ENST00000613228.1 |
PDE6A
|
phosphodiesterase 6A |
| chr2_+_54115396 | 0.24 |
ENST00000406041.5
|
ACYP2
|
acylphosphatase 2 |
| chr7_+_134646845 | 0.24 |
ENST00000344924.8
|
BPGM
|
bisphosphoglycerate mutase |
| chr11_-_11353241 | 0.24 |
ENST00000528848.3
|
CSNK2A3
|
casein kinase 2 alpha 3 |
| chr8_-_85341705 | 0.24 |
ENST00000517618.5
|
CA1
|
carbonic anhydrase 1 |
| chr5_+_119629552 | 0.24 |
ENST00000613773.4
ENST00000620555.4 ENST00000515256.5 ENST00000509264.1 |
FAM170A
|
family with sequence similarity 170 member A |
| chr12_-_109996216 | 0.24 |
ENST00000551209.5
ENST00000550186.5 |
GIT2
|
GIT ArfGAP 2 |
| chrX_+_54809060 | 0.24 |
ENST00000396224.1
|
MAGED2
|
MAGE family member D2 |
| chr8_-_124565699 | 0.24 |
ENST00000519168.5
|
MTSS1
|
MTSS I-BAR domain containing 1 |
| chr7_+_138076453 | 0.23 |
ENST00000242375.8
ENST00000411726.6 |
AKR1D1
|
aldo-keto reductase family 1 member D1 |
| chr1_-_12848720 | 0.23 |
ENST00000317869.7
|
HNRNPCL1
|
heterogeneous nuclear ribonucleoprotein C like 1 |
| chr6_-_49636832 | 0.23 |
ENST00000371175.10
ENST00000646272.1 ENST00000646939.1 ENST00000618248.3 ENST00000229810.9 ENST00000646963.1 |
RHAG
|
Rh associated glycoprotein |
| chr7_+_134646798 | 0.23 |
ENST00000418040.5
ENST00000393132.2 |
BPGM
|
bisphosphoglycerate mutase |
| chr9_-_92424427 | 0.23 |
ENST00000375550.5
|
OMD
|
osteomodulin |
| chr6_-_27838362 | 0.23 |
ENST00000618958.2
|
H2AC15
|
H2A clustered histone 15 |
| chr1_-_12886201 | 0.23 |
ENST00000235349.6
|
PRAMEF4
|
PRAME family member 4 |
| chr10_+_88664439 | 0.23 |
ENST00000394375.7
ENST00000608620.5 ENST00000238983.9 ENST00000355843.2 |
LIPF
|
lipase F, gastric type |
| chr6_+_63521738 | 0.22 |
ENST00000648894.1
ENST00000639568.2 |
PTP4A1
|
protein tyrosine phosphatase 4A1 |
| chr2_-_212124901 | 0.22 |
ENST00000402597.6
|
ERBB4
|
erb-b2 receptor tyrosine kinase 4 |
| chr15_-_43824675 | 0.22 |
ENST00000267812.4
|
MFAP1
|
microfibril associated protein 1 |
| chr2_-_68871382 | 0.21 |
ENST00000295379.2
|
BMP10
|
bone morphogenetic protein 10 |
| chr2_-_86106121 | 0.21 |
ENST00000409681.1
|
POLR1A
|
RNA polymerase I subunit A |
| chr19_-_3761657 | 0.21 |
ENST00000316757.4
|
APBA3
|
amyloid beta precursor protein binding family A member 3 |
| chr14_-_75660816 | 0.21 |
ENST00000256319.7
|
ERG28
|
ergosterol biosynthesis 28 homolog |
| chr6_-_65707214 | 0.21 |
ENST00000370621.7
ENST00000393380.6 ENST00000503581.6 |
EYS
|
eyes shut homolog |
| chr11_+_55883297 | 0.21 |
ENST00000449290.6
|
TRIM51
|
tripartite motif-containing 51 |
| chr5_+_154858537 | 0.20 |
ENST00000517568.5
ENST00000524105.5 |
CNOT8
|
CCR4-NOT transcription complex subunit 8 |
| chr2_+_54115437 | 0.20 |
ENST00000303536.8
ENST00000394666.7 |
ACYP2
|
acylphosphatase 2 |
| chr17_+_76467597 | 0.20 |
ENST00000392492.8
|
AANAT
|
aralkylamine N-acetyltransferase |
| chr4_+_70195719 | 0.20 |
ENST00000683306.1
|
ODAM
|
odontogenic, ameloblast associated |
| chr5_+_141343818 | 0.20 |
ENST00000619750.1
ENST00000253812.8 |
PCDHGA3
|
protocadherin gamma subfamily A, 3 |
| chr10_+_76318330 | 0.20 |
ENST00000496424.2
|
LRMDA
|
leucine rich melanocyte differentiation associated |
| chr5_+_142770367 | 0.20 |
ENST00000645722.2
ENST00000274498.9 |
ARHGAP26
|
Rho GTPase activating protein 26 |
| chr6_+_31158518 | 0.19 |
ENST00000376255.4
ENST00000376257.8 |
TCF19
|
transcription factor 19 |
| chr3_-_94062881 | 0.19 |
ENST00000619045.1
|
DHFR2
|
dihydrofolate reductase 2 |
| chr6_-_138499487 | 0.19 |
ENST00000343505.9
|
NHSL1
|
NHS like 1 |
| chr4_-_108168919 | 0.19 |
ENST00000265165.6
|
LEF1
|
lymphoid enhancer binding factor 1 |
| chr4_+_69280472 | 0.19 |
ENST00000335568.10
ENST00000511240.1 |
UGT2B28
|
UDP glucuronosyltransferase family 2 member B28 |
| chr10_-_110304894 | 0.19 |
ENST00000369603.10
|
SMNDC1
|
survival motor neuron domain containing 1 |
| chr6_+_26199509 | 0.19 |
ENST00000356530.5
|
H2BC7
|
H2B clustered histone 7 |
| chr11_+_89924064 | 0.19 |
ENST00000623787.3
|
TRIM49D2
|
tripartite motif containing 49D2 |
| chr21_+_46635595 | 0.19 |
ENST00000451211.6
ENST00000458387.6 ENST00000397638.6 ENST00000291705.11 ENST00000397637.5 ENST00000334494.8 ENST00000397628.5 ENST00000355680.8 ENST00000440086.5 |
PRMT2
|
protein arginine methyltransferase 2 |
| chr4_+_94974984 | 0.19 |
ENST00000672698.1
|
BMPR1B
|
bone morphogenetic protein receptor type 1B |
| chr10_-_67665642 | 0.18 |
ENST00000682945.1
ENST00000330298.6 ENST00000682758.1 |
CTNNA3
|
catenin alpha 3 |
| chr20_-_10420737 | 0.18 |
ENST00000649912.1
|
ENSG00000285723.1
|
novel protein |
| chrX_-_72875974 | 0.18 |
ENST00000595412.5
|
DMRTC1
|
DMRT like family C1 |
| chr1_+_13061158 | 0.18 |
ENST00000681473.1
|
HNRNPCL3
|
heterogeneous nuclear ribonucleoprotein C like 3 |
| chr13_+_101489940 | 0.18 |
ENST00000376162.7
|
ITGBL1
|
integrin subunit beta like 1 |
| chr6_+_26365215 | 0.18 |
ENST00000527422.5
ENST00000356386.6 ENST00000396948.5 |
BTN3A2
|
butyrophilin subfamily 3 member A2 |
| chr3_-_112845950 | 0.18 |
ENST00000398214.5
|
CD200R1L
|
CD200 receptor 1 like |
| chr1_-_220046432 | 0.18 |
ENST00000609181.5
ENST00000366923.8 |
EPRS1
|
glutamyl-prolyl-tRNA synthetase 1 |
| chr6_+_12717660 | 0.18 |
ENST00000674637.1
|
PHACTR1
|
phosphatase and actin regulator 1 |
| chr1_-_13165631 | 0.18 |
ENST00000323770.8
|
HNRNPCL4
|
heterogeneous nuclear ribonucleoprotein C like 4 |
| chr16_-_74666839 | 0.18 |
ENST00000576652.1
ENST00000572337.5 ENST00000571750.5 ENST00000572990.5 ENST00000361070.9 |
RFWD3
|
ring finger and WD repeat domain 3 |
| chr9_-_35958154 | 0.17 |
ENST00000341959.2
|
OR2S2
|
olfactory receptor family 2 subfamily S member 2 |
| chr19_-_54159696 | 0.17 |
ENST00000222224.4
|
LENG1
|
leukocyte receptor cluster member 1 |
| chr6_-_136550407 | 0.17 |
ENST00000354570.8
|
MAP7
|
microtubule associated protein 7 |
| chr4_-_108168950 | 0.17 |
ENST00000379951.6
|
LEF1
|
lymphoid enhancer binding factor 1 |
| chr1_-_161021096 | 0.17 |
ENST00000537746.1
ENST00000368026.11 |
F11R
|
F11 receptor |
| chr4_-_8428424 | 0.17 |
ENST00000514423.1
ENST00000503233.5 |
ACOX3
|
acyl-CoA oxidase 3, pristanoyl |
| chr14_+_34993240 | 0.17 |
ENST00000677647.1
|
SRP54
|
signal recognition particle 54 |
Gene Ontology Analysis
Gene overrepresentation in biological process category:
| Log-likelihood per target | Total log-likelihood | Term | Description |
|---|---|---|---|
| 1.3 | 3.8 | GO:0045360 | regulation of interleukin-1 biosynthetic process(GO:0045360) positive regulation of interleukin-1 biosynthetic process(GO:0045362) |
| 0.8 | 2.4 | GO:0009720 | detection of hormone stimulus(GO:0009720) |
| 0.5 | 1.4 | GO:1990922 | regulation of hepatic stellate cell proliferation(GO:1904897) positive regulation of hepatic stellate cell proliferation(GO:1904899) hepatic stellate cell proliferation(GO:1990922) |
| 0.4 | 1.1 | GO:0050928 | negative regulation of positive chemotaxis(GO:0050928) |
| 0.3 | 3.4 | GO:1903943 | regulation of hepatocyte apoptotic process(GO:1903943) negative regulation of hepatocyte apoptotic process(GO:1903944) |
| 0.2 | 1.0 | GO:2000158 | positive regulation of ubiquitin-specific protease activity(GO:2000158) |
| 0.2 | 1.5 | GO:0048630 | skeletal muscle tissue growth(GO:0048630) |
| 0.2 | 1.0 | GO:1904209 | regulation of chemokine (C-C motif) ligand 2 secretion(GO:1904207) positive regulation of chemokine (C-C motif) ligand 2 secretion(GO:1904209) |
| 0.2 | 0.5 | GO:0014846 | esophagus smooth muscle contraction(GO:0014846) |
| 0.1 | 0.6 | GO:0015692 | lead ion transport(GO:0015692) |
| 0.1 | 0.6 | GO:0010513 | positive regulation of phosphatidylinositol biosynthetic process(GO:0010513) |
| 0.1 | 0.7 | GO:0042746 | regulation of circadian sleep/wake cycle, wakefulness(GO:0010840) circadian sleep/wake cycle, wakefulness(GO:0042746) |
| 0.1 | 1.9 | GO:0016322 | neuron remodeling(GO:0016322) |
| 0.1 | 0.5 | GO:0034334 | adherens junction maintenance(GO:0034334) |
| 0.1 | 0.5 | GO:0090362 | positive regulation of platelet-derived growth factor production(GO:0090362) |
| 0.1 | 0.3 | GO:0021763 | subthalamic nucleus development(GO:0021763) prolactin secreting cell differentiation(GO:0060127) superior vena cava morphogenesis(GO:0060578) |
| 0.1 | 1.3 | GO:0002315 | marginal zone B cell differentiation(GO:0002315) |
| 0.1 | 0.3 | GO:0018125 | peptidyl-cysteine methylation(GO:0018125) |
| 0.1 | 0.5 | GO:0043456 | regulation of pentose-phosphate shunt(GO:0043456) |
| 0.1 | 0.2 | GO:0030573 | bile acid catabolic process(GO:0030573) |
| 0.1 | 0.3 | GO:0090290 | positive regulation of osteoclast proliferation(GO:0090290) |
| 0.1 | 0.2 | GO:0061026 | cardiac muscle tissue regeneration(GO:0061026) |
| 0.1 | 0.4 | GO:0061152 | trachea submucosa development(GO:0061152) trachea gland development(GO:0061153) |
| 0.1 | 0.2 | GO:0030187 | melatonin metabolic process(GO:0030186) melatonin biosynthetic process(GO:0030187) |
| 0.1 | 0.3 | GO:0018008 | N-terminal peptidyl-glycine N-myristoylation(GO:0018008) |
| 0.1 | 1.7 | GO:0006346 | methylation-dependent chromatin silencing(GO:0006346) |
| 0.1 | 1.1 | GO:0046007 | negative regulation of activated T cell proliferation(GO:0046007) |
| 0.1 | 0.3 | GO:2001184 | positive regulation of interleukin-12 secretion(GO:2001184) |
| 0.1 | 0.2 | GO:0030035 | microspike assembly(GO:0030035) |
| 0.1 | 0.2 | GO:0015670 | carbon dioxide transport(GO:0015670) |
| 0.1 | 0.4 | GO:0002322 | B cell proliferation involved in immune response(GO:0002322) |
| 0.1 | 0.4 | GO:0090170 | regulation of Golgi inheritance(GO:0090170) |
| 0.1 | 0.5 | GO:0070294 | renal sodium ion absorption(GO:0070294) |
| 0.1 | 0.6 | GO:0006657 | CDP-choline pathway(GO:0006657) |
| 0.1 | 0.4 | GO:1904749 | regulation of protein localization to nucleolus(GO:1904749) |
| 0.0 | 0.9 | GO:0007253 | cytoplasmic sequestering of NF-kappaB(GO:0007253) |
| 0.0 | 0.4 | GO:0042905 | 9-cis-retinoic acid biosynthetic process(GO:0042904) 9-cis-retinoic acid metabolic process(GO:0042905) |
| 0.0 | 1.3 | GO:0072643 | interferon-gamma secretion(GO:0072643) |
| 0.0 | 0.2 | GO:0006617 | SRP-dependent cotranslational protein targeting to membrane, signal sequence recognition(GO:0006617) |
| 0.0 | 0.4 | GO:2000270 | negative regulation of fibroblast apoptotic process(GO:2000270) |
| 0.0 | 0.1 | GO:1904397 | positive regulation of skeletal muscle acetylcholine-gated channel clustering(GO:1904395) negative regulation of neuromuscular junction development(GO:1904397) |
| 0.0 | 0.6 | GO:1900747 | negative regulation of vascular endothelial growth factor signaling pathway(GO:1900747) |
| 0.0 | 0.1 | GO:0033326 | cerebrospinal fluid secretion(GO:0033326) |
| 0.0 | 0.1 | GO:0021530 | spinal cord oligodendrocyte cell differentiation(GO:0021529) spinal cord oligodendrocyte cell fate specification(GO:0021530) |
| 0.0 | 0.3 | GO:0055059 | asymmetric neuroblast division(GO:0055059) |
| 0.0 | 0.2 | GO:0060298 | positive regulation of sarcomere organization(GO:0060298) |
| 0.0 | 0.6 | GO:0036158 | outer dynein arm assembly(GO:0036158) |
| 0.0 | 0.6 | GO:2001224 | positive regulation of neuron migration(GO:2001224) |
| 0.0 | 0.3 | GO:0002155 | regulation of thyroid hormone mediated signaling pathway(GO:0002155) |
| 0.0 | 0.2 | GO:1902731 | ovarian cumulus expansion(GO:0001550) fused antrum stage(GO:0048165) negative regulation of chondrocyte proliferation(GO:1902731) |
| 0.0 | 0.2 | GO:0086073 | bundle of His cell-Purkinje myocyte adhesion involved in cell communication(GO:0086073) |
| 0.0 | 0.3 | GO:0043587 | tongue morphogenesis(GO:0043587) |
| 0.0 | 0.1 | GO:0002074 | extraocular skeletal muscle development(GO:0002074) |
| 0.0 | 0.1 | GO:1990167 | protein K27-linked deubiquitination(GO:1990167) protein K33-linked deubiquitination(GO:1990168) |
| 0.0 | 0.2 | GO:0097475 | motor neuron migration(GO:0097475) |
| 0.0 | 0.1 | GO:0051182 | coenzyme transport(GO:0051182) |
| 0.0 | 0.7 | GO:0046827 | positive regulation of protein export from nucleus(GO:0046827) |
| 0.0 | 0.1 | GO:1904252 | negative regulation of bile acid biosynthetic process(GO:0070858) negative regulation of bile acid metabolic process(GO:1904252) |
| 0.0 | 0.2 | GO:0060054 | positive regulation of epithelial cell proliferation involved in wound healing(GO:0060054) |
| 0.0 | 0.1 | GO:0035610 | protein side chain deglutamylation(GO:0035610) |
| 0.0 | 0.8 | GO:0042730 | fibrinolysis(GO:0042730) |
| 0.0 | 0.1 | GO:1904381 | Golgi apparatus mannose trimming(GO:1904381) |
| 0.0 | 0.4 | GO:1901620 | regulation of smoothened signaling pathway involved in dorsal/ventral neural tube patterning(GO:1901620) |
| 0.0 | 0.1 | GO:1903217 | regulation of protein processing involved in protein targeting to mitochondrion(GO:1903216) negative regulation of protein processing involved in protein targeting to mitochondrion(GO:1903217) |
| 0.0 | 0.1 | GO:0060474 | positive regulation of sperm motility involved in capacitation(GO:0060474) |
| 0.0 | 0.4 | GO:0003334 | keratinocyte development(GO:0003334) |
| 0.0 | 0.2 | GO:0060373 | regulation of ventricular cardiac muscle cell membrane depolarization(GO:0060373) |
| 0.0 | 0.1 | GO:0045218 | zonula adherens maintenance(GO:0045218) |
| 0.0 | 0.3 | GO:0072619 | interleukin-21 production(GO:0032625) interleukin-21 secretion(GO:0072619) |
| 0.0 | 0.2 | GO:0071798 | response to prostaglandin D(GO:0071798) cellular response to prostaglandin D stimulus(GO:0071799) |
| 0.0 | 0.1 | GO:0070172 | positive regulation of tooth mineralization(GO:0070172) |
| 0.0 | 0.1 | GO:0042435 | indole-containing compound biosynthetic process(GO:0042435) indolalkylamine biosynthetic process(GO:0046219) |
| 0.0 | 1.0 | GO:1901522 | positive regulation of transcription from RNA polymerase II promoter involved in cellular response to chemical stimulus(GO:1901522) |
| 0.0 | 0.1 | GO:2000312 | regulation of kainate selective glutamate receptor activity(GO:2000312) |
| 0.0 | 0.7 | GO:0032786 | positive regulation of DNA-templated transcription, elongation(GO:0032786) |
| 0.0 | 0.2 | GO:0006108 | malate metabolic process(GO:0006108) |
| 0.0 | 0.8 | GO:0008053 | mitochondrial fusion(GO:0008053) |
| 0.0 | 0.3 | GO:0018298 | protein-chromophore linkage(GO:0018298) |
| 0.0 | 0.4 | GO:0046069 | cGMP catabolic process(GO:0046069) |
| 0.0 | 0.1 | GO:0048549 | endosome localization(GO:0032439) positive regulation of pinocytosis(GO:0048549) |
| 0.0 | 0.2 | GO:0019919 | peptidyl-arginine methylation, to asymmetrical-dimethyl arginine(GO:0019919) |
| 0.0 | 0.1 | GO:0072526 | pyridine-containing compound catabolic process(GO:0072526) |
| 0.0 | 0.2 | GO:0042340 | keratan sulfate catabolic process(GO:0042340) |
| 0.0 | 0.2 | GO:0007196 | adenylate cyclase-inhibiting G-protein coupled glutamate receptor signaling pathway(GO:0007196) |
| 0.0 | 0.1 | GO:0048050 | post-embryonic eye morphogenesis(GO:0048050) |
| 0.0 | 0.1 | GO:0006982 | response to lipid hydroperoxide(GO:0006982) |
| 0.0 | 0.1 | GO:1902856 | negative regulation of nonmotile primary cilium assembly(GO:1902856) |
| 0.0 | 0.1 | GO:0043605 | cellular amide catabolic process(GO:0043605) |
| 0.0 | 0.4 | GO:0015879 | carnitine transport(GO:0015879) |
| 0.0 | 0.1 | GO:0042264 | peptidyl-aspartic acid hydroxylation(GO:0042264) |
| 0.0 | 0.1 | GO:0034721 | histone H3-K4 demethylation, trimethyl-H3-K4-specific(GO:0034721) |
| 0.0 | 0.1 | GO:0048341 | paraxial mesoderm formation(GO:0048341) |
| 0.0 | 0.4 | GO:0006607 | NLS-bearing protein import into nucleus(GO:0006607) |
| 0.0 | 0.2 | GO:0090557 | establishment of endothelial intestinal barrier(GO:0090557) |
Gene overrepresentation in cellular component category:
| Log-likelihood per target | Total log-likelihood | Term | Description |
|---|---|---|---|
| 0.2 | 0.6 | GO:0005674 | transcription factor TFIIF complex(GO:0005674) |
| 0.2 | 3.4 | GO:0031265 | CD95 death-inducing signaling complex(GO:0031265) |
| 0.1 | 0.6 | GO:0070826 | paraferritin complex(GO:0070826) |
| 0.1 | 1.0 | GO:0033269 | internode region of axon(GO:0033269) |
| 0.1 | 0.3 | GO:0060342 | photoreceptor inner segment membrane(GO:0060342) |
| 0.1 | 0.3 | GO:0070381 | endosome to plasma membrane transport vesicle(GO:0070381) |
| 0.1 | 0.7 | GO:0042587 | glycogen granule(GO:0042587) |
| 0.1 | 0.2 | GO:0035189 | Rb-E2F complex(GO:0035189) |
| 0.1 | 0.3 | GO:0035061 | interchromatin granule(GO:0035061) |
| 0.0 | 1.5 | GO:0005892 | acetylcholine-gated channel complex(GO:0005892) |
| 0.0 | 0.6 | GO:0098647 | collagen type VI trimer(GO:0005589) collagen beaded filament(GO:0098647) |
| 0.0 | 1.1 | GO:0005952 | cAMP-dependent protein kinase complex(GO:0005952) nucleotide-activated protein kinase complex(GO:0031588) |
| 0.0 | 0.3 | GO:0030121 | AP-1 adaptor complex(GO:0030121) |
| 0.0 | 0.7 | GO:0032433 | filopodium tip(GO:0032433) |
| 0.0 | 2.9 | GO:0005881 | cytoplasmic microtubule(GO:0005881) |
| 0.0 | 0.1 | GO:0005863 | striated muscle myosin thick filament(GO:0005863) |
| 0.0 | 0.2 | GO:0000120 | RNA polymerase I transcription factor complex(GO:0000120) |
| 0.0 | 0.4 | GO:1990907 | beta-catenin-TCF complex(GO:1990907) |
| 0.0 | 0.4 | GO:0005736 | DNA-directed RNA polymerase I complex(GO:0005736) |
| 0.0 | 0.2 | GO:0005786 | signal recognition particle, endoplasmic reticulum targeting(GO:0005786) |
| 0.0 | 0.1 | GO:0070436 | Grb2-EGFR complex(GO:0070436) |
| 0.0 | 0.1 | GO:0005947 | mitochondrial alpha-ketoglutarate dehydrogenase complex(GO:0005947) |
| 0.0 | 0.1 | GO:0044352 | pinosome(GO:0044352) macropinosome(GO:0044354) |
| 0.0 | 0.2 | GO:1990712 | HFE-transferrin receptor complex(GO:1990712) |
| 0.0 | 0.2 | GO:0036056 | filtration diaphragm(GO:0036056) slit diaphragm(GO:0036057) |
| 0.0 | 0.3 | GO:0005942 | phosphatidylinositol 3-kinase complex(GO:0005942) |
Gene overrepresentation in molecular function category:
| Log-likelihood per target | Total log-likelihood | Term | Description |
|---|---|---|---|
| 1.3 | 3.8 | GO:0031731 | CCR6 chemokine receptor binding(GO:0031731) |
| 0.6 | 2.4 | GO:0034041 | sterol-transporting ATPase activity(GO:0034041) |
| 0.2 | 1.0 | GO:0004886 | 9-cis retinoic acid receptor activity(GO:0004886) |
| 0.2 | 1.0 | GO:0035800 | deubiquitinase activator activity(GO:0035800) |
| 0.1 | 0.6 | GO:0015087 | cadmium ion transmembrane transporter activity(GO:0015086) cobalt ion transmembrane transporter activity(GO:0015087) lead ion transmembrane transporter activity(GO:0015094) ferrous iron uptake transmembrane transporter activity(GO:0015639) |
| 0.1 | 0.6 | GO:0004105 | choline-phosphate cytidylyltransferase activity(GO:0004105) |
| 0.1 | 1.4 | GO:0001135 | transcription factor activity, RNA polymerase II transcription factor recruiting(GO:0001135) |
| 0.1 | 3.4 | GO:0097200 | cysteine-type endopeptidase activity involved in execution phase of apoptosis(GO:0097200) |
| 0.1 | 0.5 | GO:0004082 | bisphosphoglycerate mutase activity(GO:0004082) phosphoglycerate mutase activity(GO:0004619) 2,3-bisphosphoglycerate-dependent phosphoglycerate mutase activity(GO:0046538) |
| 0.1 | 0.5 | GO:0008449 | N-acetylglucosamine-6-sulfatase activity(GO:0008449) |
| 0.1 | 0.3 | GO:0042284 | sphingolipid delta-4 desaturase activity(GO:0042284) |
| 0.1 | 0.7 | GO:0060002 | plus-end directed microfilament motor activity(GO:0060002) |
| 0.1 | 0.2 | GO:0047787 | delta4-3-oxosteroid 5beta-reductase activity(GO:0047787) |
| 0.1 | 0.3 | GO:0031531 | thyrotropin-releasing hormone receptor binding(GO:0031531) |
| 0.1 | 0.4 | GO:0003998 | acylphosphatase activity(GO:0003998) |
| 0.1 | 0.4 | GO:0015199 | amino-acid betaine transmembrane transporter activity(GO:0015199) carnitine transmembrane transporter activity(GO:0015226) |
| 0.1 | 0.2 | GO:0004060 | arylamine N-acetyltransferase activity(GO:0004060) |
| 0.1 | 0.2 | GO:0004958 | prostaglandin F receptor activity(GO:0004958) |
| 0.1 | 0.3 | GO:0004379 | glycylpeptide N-tetradecanoyltransferase activity(GO:0004379) myristoyltransferase activity(GO:0019107) |
| 0.1 | 0.2 | GO:0033142 | progesterone receptor binding(GO:0033142) |
| 0.1 | 1.0 | GO:0019911 | structural constituent of myelin sheath(GO:0019911) |
| 0.1 | 2.2 | GO:0008327 | methyl-CpG binding(GO:0008327) |
| 0.1 | 1.1 | GO:0008603 | cAMP-dependent protein kinase regulator activity(GO:0008603) |
| 0.1 | 1.5 | GO:0022848 | acetylcholine-gated cation channel activity(GO:0022848) |
| 0.0 | 0.6 | GO:0051378 | amine binding(GO:0043176) serotonin binding(GO:0051378) |
| 0.0 | 0.1 | GO:0015018 | galactosylgalactosylxylosylprotein 3-beta-glucuronosyltransferase activity(GO:0015018) |
| 0.0 | 0.4 | GO:0047035 | testosterone dehydrogenase (NAD+) activity(GO:0047035) |
| 0.0 | 0.6 | GO:0019211 | phosphatase activator activity(GO:0019211) |
| 0.0 | 0.1 | GO:0046848 | hydroxyapatite binding(GO:0046848) |
| 0.0 | 0.8 | GO:0051400 | BH domain binding(GO:0051400) |
| 0.0 | 0.1 | GO:0034353 | RNA pyrophosphohydrolase activity(GO:0034353) |
| 0.0 | 0.1 | GO:0051185 | coenzyme transporter activity(GO:0051185) |
| 0.0 | 0.9 | GO:0035497 | cAMP response element binding(GO:0035497) |
| 0.0 | 0.2 | GO:0016402 | pristanoyl-CoA oxidase activity(GO:0016402) |
| 0.0 | 0.1 | GO:0002060 | purine nucleobase binding(GO:0002060) |
| 0.0 | 0.1 | GO:1904455 | ubiquitin-specific protease activity involved in negative regulation of ERAD pathway(GO:1904455) |
| 0.0 | 0.3 | GO:0035005 | 1-phosphatidylinositol-4-phosphate 3-kinase activity(GO:0035005) |
| 0.0 | 0.1 | GO:0004800 | thyroxine 5'-deiodinase activity(GO:0004800) |
| 0.0 | 0.1 | GO:0035373 | chondroitin sulfate proteoglycan binding(GO:0035373) |
| 0.0 | 0.3 | GO:0051525 | NFAT protein binding(GO:0051525) |
| 0.0 | 0.1 | GO:0004090 | carbonyl reductase (NADPH) activity(GO:0004090) |
| 0.0 | 0.3 | GO:0052650 | NADP-retinol dehydrogenase activity(GO:0052650) |
| 0.0 | 0.3 | GO:0008020 | G-protein coupled photoreceptor activity(GO:0008020) |
| 0.0 | 0.2 | GO:0086083 | cell adhesive protein binding involved in bundle of His cell-Purkinje myocyte communication(GO:0086083) |
| 0.0 | 0.4 | GO:0001075 | transcription factor activity, RNA polymerase II core promoter sequence-specific binding involved in preinitiation complex assembly(GO:0001075) |
| 0.0 | 0.1 | GO:0004146 | dihydrofolate reductase activity(GO:0004146) |
| 0.0 | 0.2 | GO:0030942 | endoplasmic reticulum signal peptide binding(GO:0030942) |
| 0.0 | 0.2 | GO:0016615 | malate dehydrogenase activity(GO:0016615) |
| 0.0 | 0.4 | GO:0001054 | RNA polymerase I activity(GO:0001054) |
| 0.0 | 0.9 | GO:0008188 | neuropeptide receptor activity(GO:0008188) |
| 0.0 | 0.2 | GO:0086006 | voltage-gated sodium channel activity involved in cardiac muscle cell action potential(GO:0086006) |
| 0.0 | 0.1 | GO:0005006 | epidermal growth factor-activated receptor activity(GO:0005006) |
| 0.0 | 0.2 | GO:0030284 | estrogen receptor activity(GO:0030284) |
| 0.0 | 0.9 | GO:0030159 | receptor signaling complex scaffold activity(GO:0030159) |
| 0.0 | 0.1 | GO:0047708 | biotinidase activity(GO:0047708) |
| 0.0 | 0.1 | GO:0004597 | peptide-aspartate beta-dioxygenase activity(GO:0004597) |
| 0.0 | 0.2 | GO:0005025 | transforming growth factor beta receptor activity, type I(GO:0005025) |
| 0.0 | 0.2 | GO:0097371 | MDM2/MDM4 family protein binding(GO:0097371) |
| 0.0 | 4.7 | GO:0004721 | phosphoprotein phosphatase activity(GO:0004721) |
| 0.0 | 0.2 | GO:0004716 | receptor signaling protein tyrosine kinase activity(GO:0004716) |
| 0.0 | 0.5 | GO:0047555 | 3',5'-cyclic-GMP phosphodiesterase activity(GO:0047555) |
| 0.0 | 0.2 | GO:0031433 | telethonin binding(GO:0031433) |
| 0.0 | 0.2 | GO:0032051 | clathrin light chain binding(GO:0032051) |
| 0.0 | 0.1 | GO:0034647 | histone demethylase activity (H3-trimethyl-K4 specific)(GO:0034647) |
| 0.0 | 0.0 | GO:0050119 | N-acetylglucosamine deacetylase activity(GO:0050119) |
| 0.0 | 0.1 | GO:0001665 | alpha-N-acetylgalactosaminide alpha-2,6-sialyltransferase activity(GO:0001665) |
| 0.0 | 0.3 | GO:0031489 | myosin V binding(GO:0031489) |
| 0.0 | 0.1 | GO:0016714 | oxidoreductase activity, acting on paired donors, with incorporation or reduction of molecular oxygen, reduced pteridine as one donor, and incorporation of one atom of oxygen(GO:0016714) |
| 0.0 | 0.4 | GO:0030552 | cAMP binding(GO:0030552) |
| 0.0 | 0.1 | GO:0008430 | selenium binding(GO:0008430) |
Gene overrepresentation in curated gene sets: canonical pathways category:
| Log-likelihood per target | Total log-likelihood | Term | Description |
|---|---|---|---|
| 0.1 | 3.4 | SA FAS SIGNALING | The TNF-type receptor Fas induces apoptosis on ligand binding. |
| 0.0 | 1.8 | PID ERBB2 ERBB3 PATHWAY | ErbB2/ErbB3 signaling events |
| 0.0 | 2.2 | PID INTEGRIN A4B1 PATHWAY | Alpha4 beta1 integrin signaling events |
| 0.0 | 1.3 | PID RETINOIC ACID PATHWAY | Retinoic acid receptors-mediated signaling |
| 0.0 | 1.5 | PID IL2 PI3K PATHWAY | IL2 signaling events mediated by PI3K |
| 0.0 | 0.7 | PID NETRIN PATHWAY | Netrin-mediated signaling events |
| 0.0 | 1.0 | NABA PROTEOGLYCANS | Genes encoding proteoglycans |
| 0.0 | 1.1 | PID ANGIOPOIETIN RECEPTOR PATHWAY | Angiopoietin receptor Tie2-mediated signaling |
| 0.0 | 1.3 | PID CDC42 REG PATHWAY | Regulation of CDC42 activity |
| 0.0 | 0.2 | PID ERBB NETWORK PATHWAY | ErbB receptor signaling network |
| 0.0 | 0.5 | PID RHODOPSIN PATHWAY | Visual signal transduction: Rods |
| 0.0 | 0.8 | PID BCR 5PATHWAY | BCR signaling pathway |
Gene overrepresentation in curated gene sets: REACTOME pathways category:
| Log-likelihood per target | Total log-likelihood | Term | Description |
|---|---|---|---|
| 0.1 | 3.4 | REACTOME EXTRINSIC PATHWAY FOR APOPTOSIS | Genes involved in Extrinsic Pathway for Apoptosis |
| 0.1 | 1.9 | REACTOME SEMA3A PLEXIN REPULSION SIGNALING BY INHIBITING INTEGRIN ADHESION | Genes involved in SEMA3A-Plexin repulsion signaling by inhibiting Integrin adhesion |
| 0.1 | 2.4 | REACTOME ABCA TRANSPORTERS IN LIPID HOMEOSTASIS | Genes involved in ABCA transporters in lipid homeostasis |
| 0.1 | 1.5 | REACTOME PRESYNAPTIC NICOTINIC ACETYLCHOLINE RECEPTORS | Genes involved in Presynaptic nicotinic acetylcholine receptors |
| 0.1 | 3.5 | REACTOME CHEMOKINE RECEPTORS BIND CHEMOKINES | Genes involved in Chemokine receptors bind chemokines |
| 0.0 | 0.6 | REACTOME SEROTONIN RECEPTORS | Genes involved in Serotonin receptors |
| 0.0 | 1.2 | REACTOME TIE2 SIGNALING | Genes involved in Tie2 Signaling |
| 0.0 | 0.4 | REACTOME RAF MAP KINASE CASCADE | Genes involved in RAF/MAP kinase cascade |
| 0.0 | 1.1 | REACTOME PKA MEDIATED PHOSPHORYLATION OF CREB | Genes involved in PKA-mediated phosphorylation of CREB |
| 0.0 | 0.6 | REACTOME VIRAL MESSENGER RNA SYNTHESIS | Genes involved in Viral Messenger RNA Synthesis |
| 0.0 | 0.3 | REACTOME OPSINS | Genes involved in Opsins |
| 0.0 | 1.0 | REACTOME TRAF6 MEDIATED IRF7 ACTIVATION | Genes involved in TRAF6 mediated IRF7 activation |
| 0.0 | 0.6 | REACTOME OTHER SEMAPHORIN INTERACTIONS | Genes involved in Other semaphorin interactions |
| 0.0 | 0.6 | REACTOME CS DS DEGRADATION | Genes involved in CS/DS degradation |
| 0.0 | 0.2 | REACTOME KERATAN SULFATE DEGRADATION | Genes involved in Keratan sulfate degradation |
| 0.0 | 0.5 | REACTOME RNA POL I TRANSCRIPTION TERMINATION | Genes involved in RNA Polymerase I Transcription Termination |
| 0.0 | 0.2 | REACTOME SYNTHESIS OF BILE ACIDS AND BILE SALTS VIA 24 HYDROXYCHOLESTEROL | Genes involved in Synthesis of bile acids and bile salts via 24-hydroxycholesterol |
| 0.0 | 0.6 | REACTOME SYNTHESIS OF PC | Genes involved in Synthesis of PC |
| 0.0 | 2.2 | REACTOME FACTORS INVOLVED IN MEGAKARYOCYTE DEVELOPMENT AND PLATELET PRODUCTION | Genes involved in Factors involved in megakaryocyte development and platelet production |
| 0.0 | 0.2 | REACTOME PROSTANOID LIGAND RECEPTORS | Genes involved in Prostanoid ligand receptors |
| 0.0 | 0.3 | REACTOME DSCAM INTERACTIONS | Genes involved in DSCAM interactions |
| 0.0 | 0.3 | REACTOME SYNTHESIS OF PIPS AT THE GOLGI MEMBRANE | Genes involved in Synthesis of PIPs at the Golgi membrane |
| 0.0 | 0.3 | REACTOME RAP1 SIGNALLING | Genes involved in Rap1 signalling |
| 0.0 | 0.2 | REACTOME CLASS C 3 METABOTROPIC GLUTAMATE PHEROMONE RECEPTORS | Genes involved in Class C/3 (Metabotropic glutamate/pheromone receptors) |
| 0.0 | 0.3 | REACTOME PRE NOTCH PROCESSING IN GOLGI | Genes involved in Pre-NOTCH Processing in Golgi |
| 0.0 | 0.2 | REACTOME SHC1 EVENTS IN ERBB4 SIGNALING | Genes involved in SHC1 events in ERBB4 signaling |
| 0.0 | 0.5 | REACTOME CGMP EFFECTS | Genes involved in cGMP effects |