Project
Inflammatory response time course, HUVEC (Wada, 2009)
Navigation
Downloads
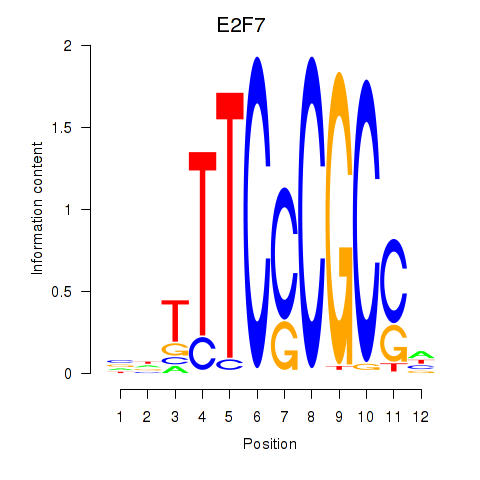
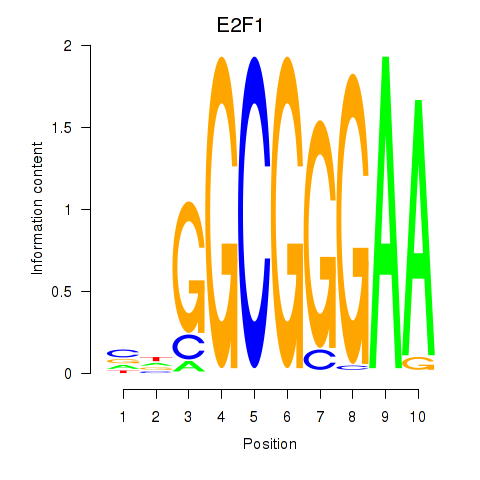
Results for E2F7_E2F1
Z-value: 1.54
Motif logo
Transcription factors associated with E2F7_E2F1
| Gene Symbol | Gene ID | Gene Info |
|---|---|---|
|
E2F7
|
ENSG00000165891.16 | E2F7 |
|
E2F1
|
ENSG00000101412.13 | E2F1 |
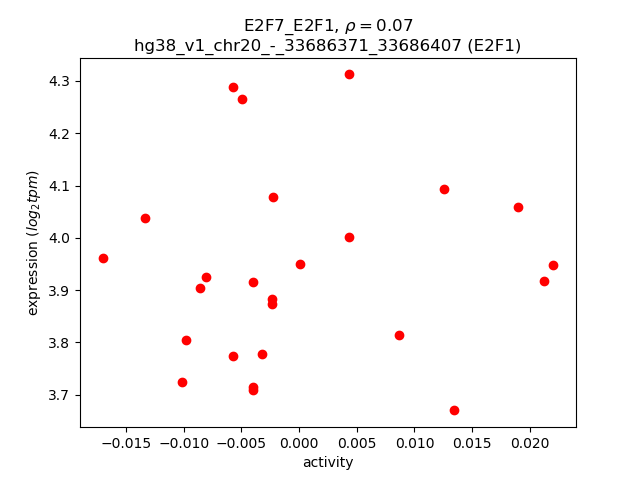
Activity-expression correlation:
| Gene | Promoter | Pearson corr. coef. | P-value | Plot |
|---|---|---|---|---|
| E2F7 | hg38_v1_chr12_-_77065526_77065586 | 0.55 | 4.3e-03 | Click! |
| E2F1 | hg38_v1_chr20_-_33686371_33686407 | 0.07 | 7.4e-01 | Click! |
Activity profile of E2F7_E2F1 motif
Sorted Z-values of E2F7_E2F1 motif
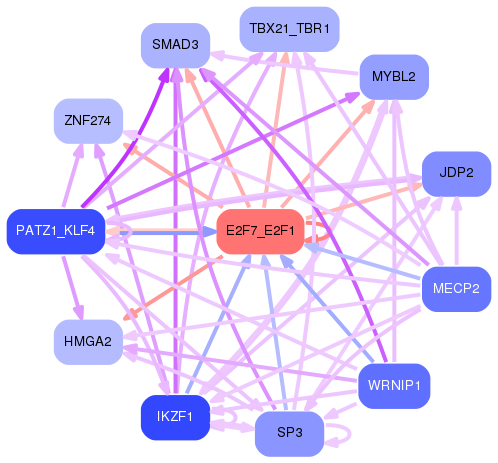
Network of associatons between targets according to the STRING database.

First level regulatory network of E2F7_E2F1
Gene Ontology Analysis
Gene overrepresentation in biological process category:
| Log-likelihood per target | Total log-likelihood | Term | Description |
|---|---|---|---|
| 1.1 | 3.4 | GO:0008615 | pyridoxine metabolic process(GO:0008614) pyridoxine biosynthetic process(GO:0008615) vitamin B6 biosynthetic process(GO:0042819) |
| 0.9 | 2.8 | GO:0032877 | positive regulation of DNA endoreduplication(GO:0032877) |
| 0.8 | 3.9 | GO:2000325 | regulation of ligand-dependent nuclear receptor transcription coactivator activity(GO:2000325) positive regulation of ligand-dependent nuclear receptor transcription coactivator activity(GO:2000327) |
| 0.7 | 2.7 | GO:0003131 | mesodermal-endodermal cell signaling(GO:0003131) programmed DNA elimination(GO:0031049) chromosome breakage(GO:0031052) histone H2A-S139 phosphorylation(GO:0035978) positive regulation of cellular response to X-ray(GO:2000685) |
| 0.6 | 2.5 | GO:0032954 | regulation of cytokinetic process(GO:0032954) regulation of mitotic cytokinetic process(GO:1903436) positive regulation of mitotic cytokinetic process(GO:1903438) positive regulation of mitotic cytokinesis(GO:1903490) |
| 0.6 | 1.9 | GO:0046452 | dihydrofolate metabolic process(GO:0046452) |
| 0.6 | 1.8 | GO:0044830 | modulation by host of viral RNA genome replication(GO:0044830) positive regulation of intracellular transport of viral material(GO:1901254) |
| 0.5 | 1.5 | GO:0043006 | activation of phospholipase A2 activity by calcium-mediated signaling(GO:0043006) |
| 0.4 | 2.1 | GO:0019860 | transformation of host cell by virus(GO:0019087) uracil metabolic process(GO:0019860) |
| 0.4 | 1.3 | GO:1902269 | positive regulation of polyamine transmembrane transport(GO:1902269) |
| 0.4 | 1.3 | GO:1904956 | regulation of midbrain dopaminergic neuron differentiation(GO:1904956) |
| 0.4 | 1.1 | GO:0009720 | detection of hormone stimulus(GO:0009720) |
| 0.4 | 1.4 | GO:1990918 | meiotic DNA double-strand break processing(GO:0000706) double-strand break repair involved in meiotic recombination(GO:1990918) |
| 0.4 | 1.1 | GO:0031508 | pericentric heterochromatin assembly(GO:0031508) |
| 0.4 | 1.4 | GO:1990108 | protein linear deubiquitination(GO:1990108) |
| 0.3 | 2.1 | GO:0035617 | stress granule disassembly(GO:0035617) |
| 0.3 | 0.7 | GO:0002023 | reduction of food intake in response to dietary excess(GO:0002023) |
| 0.3 | 1.3 | GO:0035407 | histone H3-T11 phosphorylation(GO:0035407) |
| 0.3 | 1.3 | GO:1904744 | positive regulation of telomeric DNA binding(GO:1904744) |
| 0.3 | 2.0 | GO:0010032 | meiotic chromosome condensation(GO:0010032) |
| 0.3 | 0.3 | GO:0072757 | cellular response to camptothecin(GO:0072757) |
| 0.3 | 0.9 | GO:0002184 | cytoplasmic translational termination(GO:0002184) |
| 0.3 | 2.5 | GO:0000727 | double-strand break repair via break-induced replication(GO:0000727) |
| 0.3 | 0.6 | GO:1901420 | negative regulation of response to alcohol(GO:1901420) |
| 0.3 | 1.4 | GO:0042986 | positive regulation of amyloid precursor protein biosynthetic process(GO:0042986) |
| 0.3 | 1.7 | GO:0061767 | negative regulation of lung blood pressure(GO:0061767) |
| 0.3 | 0.6 | GO:0014034 | neural crest cell fate commitment(GO:0014034) |
| 0.3 | 1.4 | GO:0072674 | multinuclear osteoclast differentiation(GO:0072674) osteoclast fusion(GO:0072675) |
| 0.2 | 0.7 | GO:1990426 | homologous recombination-dependent replication fork processing(GO:1990426) |
| 0.2 | 1.0 | GO:0048627 | myoblast development(GO:0048627) |
| 0.2 | 2.4 | GO:0070212 | protein poly-ADP-ribosylation(GO:0070212) |
| 0.2 | 1.2 | GO:0001315 | age-dependent response to oxidative stress(GO:0001306) age-dependent response to reactive oxygen species(GO:0001315) regulation of systemic arterial blood pressure by acetylcholine(GO:0003068) vasodilation by acetylcholine involved in regulation of systemic arterial blood pressure(GO:0003069) regulation of systemic arterial blood pressure by neurotransmitter(GO:0003070) age-dependent general metabolic decline(GO:0007571) |
| 0.2 | 0.7 | GO:0021503 | neural fold bending(GO:0021503) |
| 0.2 | 0.7 | GO:0075732 | viral penetration into host nucleus(GO:0075732) multi-organism nuclear import(GO:1902594) |
| 0.2 | 0.9 | GO:0009786 | regulation of asymmetric cell division(GO:0009786) |
| 0.2 | 2.5 | GO:0031119 | tRNA pseudouridine synthesis(GO:0031119) |
| 0.2 | 1.3 | GO:0035105 | sterol regulatory element binding protein import into nucleus(GO:0035105) |
| 0.2 | 0.9 | GO:1900827 | maintenance of protein location in membrane(GO:0072658) maintenance of protein location in plasma membrane(GO:0072660) positive regulation of membrane depolarization during cardiac muscle cell action potential(GO:1900827) |
| 0.2 | 0.7 | GO:1900220 | semaphorin-plexin signaling pathway involved in bone trabecula morphogenesis(GO:1900220) |
| 0.2 | 1.1 | GO:0034421 | post-translational protein acetylation(GO:0034421) |
| 0.2 | 1.5 | GO:0035616 | histone H2B conserved C-terminal lysine deubiquitination(GO:0035616) |
| 0.2 | 2.8 | GO:0006268 | DNA unwinding involved in DNA replication(GO:0006268) |
| 0.2 | 0.6 | GO:1902490 | regulation of sperm capacitation(GO:1902490) |
| 0.2 | 0.6 | GO:0006106 | fumarate metabolic process(GO:0006106) |
| 0.2 | 0.8 | GO:0046946 | hydroxylysine metabolic process(GO:0046946) hydroxylysine biosynthetic process(GO:0046947) |
| 0.2 | 0.5 | GO:0048250 | mitochondrial iron ion transport(GO:0048250) |
| 0.2 | 0.5 | GO:0045082 | interleukin-13 biosynthetic process(GO:0042231) positive regulation of interleukin-10 biosynthetic process(GO:0045082) |
| 0.2 | 0.7 | GO:0036229 | glutamine secretion(GO:0010585) L-glutamine import(GO:0036229) L-glutamine import into cell(GO:1903803) |
| 0.2 | 1.4 | GO:0042483 | negative regulation of odontogenesis(GO:0042483) |
| 0.2 | 2.5 | GO:2001032 | regulation of double-strand break repair via nonhomologous end joining(GO:2001032) |
| 0.2 | 0.9 | GO:0014038 | regulation of Schwann cell differentiation(GO:0014038) |
| 0.2 | 1.4 | GO:0033504 | floor plate development(GO:0033504) |
| 0.2 | 0.9 | GO:0046167 | glycerol-3-phosphate biosynthetic process(GO:0046167) |
| 0.2 | 1.6 | GO:2000124 | regulation of endocannabinoid signaling pathway(GO:2000124) |
| 0.2 | 2.1 | GO:0060700 | regulation of ribonuclease activity(GO:0060700) |
| 0.2 | 0.7 | GO:0035986 | senescence-associated heterochromatin focus assembly(GO:0035986) |
| 0.2 | 0.8 | GO:0072180 | mesonephric duct morphogenesis(GO:0072180) |
| 0.2 | 0.6 | GO:2001247 | positive regulation of phosphatidylcholine biosynthetic process(GO:2001247) |
| 0.2 | 0.8 | GO:0061032 | visceral serous pericardium development(GO:0061032) |
| 0.2 | 0.5 | GO:0090222 | centrosome-templated microtubule nucleation(GO:0090222) |
| 0.2 | 0.6 | GO:0006072 | glycerol-3-phosphate metabolic process(GO:0006072) |
| 0.2 | 0.9 | GO:0060356 | leucine import(GO:0060356) |
| 0.2 | 0.6 | GO:0006169 | adenosine salvage(GO:0006169) dATP biosynthetic process(GO:0006175) |
| 0.2 | 2.0 | GO:2000628 | regulation of miRNA metabolic process(GO:2000628) |
| 0.2 | 0.5 | GO:0072365 | regulation of cellular ketone metabolic process by negative regulation of transcription from RNA polymerase II promoter(GO:0072365) |
| 0.2 | 1.4 | GO:0061669 | spontaneous neurotransmitter secretion(GO:0061669) spontaneous synaptic transmission(GO:0098814) |
| 0.2 | 0.8 | GO:0030035 | microspike assembly(GO:0030035) |
| 0.1 | 1.5 | GO:0061087 | positive regulation of histone H3-K27 methylation(GO:0061087) |
| 0.1 | 0.6 | GO:1904636 | response to ionomycin(GO:1904636) cellular response to ionomycin(GO:1904637) |
| 0.1 | 0.9 | GO:0034124 | regulation of MyD88-dependent toll-like receptor signaling pathway(GO:0034124) |
| 0.1 | 0.6 | GO:0043314 | negative regulation of neutrophil degranulation(GO:0043314) |
| 0.1 | 1.1 | GO:0070164 | negative regulation of adiponectin secretion(GO:0070164) |
| 0.1 | 0.4 | GO:0014810 | positive regulation of skeletal muscle contraction by regulation of release of sequestered calcium ion(GO:0014810) |
| 0.1 | 1.2 | GO:0031848 | protection from non-homologous end joining at telomere(GO:0031848) |
| 0.1 | 0.5 | GO:0072369 | regulation of lipid transport by positive regulation of transcription from RNA polymerase II promoter(GO:0072369) |
| 0.1 | 0.5 | GO:1903936 | cellular response to sodium arsenite(GO:1903936) |
| 0.1 | 1.0 | GO:0006398 | mRNA 3'-end processing by stem-loop binding and cleavage(GO:0006398) |
| 0.1 | 0.5 | GO:2000983 | regulation of ATP citrate synthase activity(GO:2000983) negative regulation of ATP citrate synthase activity(GO:2000984) |
| 0.1 | 0.4 | GO:0008355 | olfactory learning(GO:0008355) |
| 0.1 | 0.4 | GO:1990481 | mRNA pseudouridine synthesis(GO:1990481) |
| 0.1 | 0.4 | GO:0061184 | dermatome development(GO:0061054) regulation of dermatome development(GO:0061183) positive regulation of dermatome development(GO:0061184) |
| 0.1 | 0.5 | GO:0006166 | purine ribonucleoside salvage(GO:0006166) |
| 0.1 | 0.4 | GO:0071163 | DNA replication preinitiation complex assembly(GO:0071163) regulation of DNA replication origin binding(GO:1902595) |
| 0.1 | 1.0 | GO:0016926 | protein desumoylation(GO:0016926) |
| 0.1 | 0.5 | GO:0042631 | cellular response to water deprivation(GO:0042631) |
| 0.1 | 0.6 | GO:0098528 | skeletal muscle fiber differentiation(GO:0098528) |
| 0.1 | 0.4 | GO:1900222 | regulation of cell growth by extracellular stimulus(GO:0001560) negative regulation of beta-amyloid clearance(GO:1900222) positive regulation of cardiac vascular smooth muscle cell differentiation(GO:2000724) |
| 0.1 | 0.7 | GO:0072719 | cellular response to cisplatin(GO:0072719) |
| 0.1 | 0.1 | GO:1903774 | positive regulation of viral budding via host ESCRT complex(GO:1903774) |
| 0.1 | 0.7 | GO:0006287 | base-excision repair, gap-filling(GO:0006287) |
| 0.1 | 0.4 | GO:0071042 | U1 snRNA 3'-end processing(GO:0034473) U5 snRNA 3'-end processing(GO:0034476) nuclear polyadenylation-dependent mRNA catabolic process(GO:0071042) polyadenylation-dependent mRNA catabolic process(GO:0071047) |
| 0.1 | 1.4 | GO:0007076 | mitotic chromosome condensation(GO:0007076) |
| 0.1 | 0.3 | GO:2001038 | regulation of cellular response to drug(GO:2001038) |
| 0.1 | 0.2 | GO:0097116 | gephyrin clustering involved in postsynaptic density assembly(GO:0097116) |
| 0.1 | 0.9 | GO:0035093 | spermatogenesis, exchange of chromosomal proteins(GO:0035093) |
| 0.1 | 4.6 | GO:0031055 | chromatin remodeling at centromere(GO:0031055) |
| 0.1 | 0.3 | GO:0051463 | negative regulation of cortisol secretion(GO:0051463) |
| 0.1 | 0.3 | GO:0010768 | negative regulation of transcription from RNA polymerase II promoter in response to UV-induced DNA damage(GO:0010768) transmission of virus(GO:0019089) dissemination or transmission of symbiont from host(GO:0044007) dissemination or transmission of organism from other organism involved in symbiotic interaction(GO:0051821) |
| 0.1 | 1.8 | GO:0021796 | cerebral cortex regionalization(GO:0021796) |
| 0.1 | 1.1 | GO:0006271 | DNA strand elongation involved in DNA replication(GO:0006271) |
| 0.1 | 0.3 | GO:1902990 | mitotic telomere maintenance via semi-conservative replication(GO:1902990) |
| 0.1 | 1.2 | GO:0031340 | positive regulation of vesicle fusion(GO:0031340) |
| 0.1 | 0.3 | GO:0003420 | regulation of growth plate cartilage chondrocyte proliferation(GO:0003420) histone H3-R2 methylation(GO:0034970) |
| 0.1 | 1.8 | GO:0051103 | DNA ligation involved in DNA repair(GO:0051103) |
| 0.1 | 1.0 | GO:0006189 | 'de novo' IMP biosynthetic process(GO:0006189) |
| 0.1 | 3.0 | GO:0051290 | protein heterotetramerization(GO:0051290) |
| 0.1 | 0.2 | GO:0046601 | positive regulation of centriole replication(GO:0046601) |
| 0.1 | 0.8 | GO:0019236 | response to pheromone(GO:0019236) |
| 0.1 | 0.6 | GO:0035087 | siRNA loading onto RISC involved in RNA interference(GO:0035087) |
| 0.1 | 0.8 | GO:0032218 | riboflavin transport(GO:0032218) |
| 0.1 | 0.8 | GO:0001866 | NK T cell proliferation(GO:0001866) |
| 0.1 | 0.8 | GO:0060267 | positive regulation of respiratory burst(GO:0060267) |
| 0.1 | 0.6 | GO:0071873 | response to norepinephrine(GO:0071873) cellular response to norepinephrine stimulus(GO:0071874) |
| 0.1 | 0.3 | GO:0043686 | co-translational protein modification(GO:0043686) |
| 0.1 | 0.5 | GO:1900245 | positive regulation of MDA-5 signaling pathway(GO:1900245) |
| 0.1 | 1.1 | GO:0085020 | protein K6-linked ubiquitination(GO:0085020) |
| 0.1 | 0.6 | GO:0006065 | UDP-glucuronate biosynthetic process(GO:0006065) |
| 0.1 | 0.2 | GO:1902512 | positive regulation of apoptotic DNA fragmentation(GO:1902512) |
| 0.1 | 0.4 | GO:0070889 | mRNA localization resulting in posttranscriptional regulation of gene expression(GO:0010609) platelet alpha granule organization(GO:0070889) regulation of DNA damage response, signal transduction by p53 class mediator resulting in transcription of p21 class mediator(GO:1902162) positive regulation of DNA damage response, signal transduction by p53 class mediator resulting in transcription of p21 class mediator(GO:1902164) |
| 0.1 | 1.3 | GO:1900112 | regulation of histone H3-K9 trimethylation(GO:1900112) |
| 0.1 | 2.2 | GO:0010569 | regulation of double-strand break repair via homologous recombination(GO:0010569) |
| 0.1 | 0.3 | GO:0061182 | negative regulation of chondrocyte development(GO:0061182) |
| 0.1 | 0.9 | GO:0051388 | positive regulation of neurotrophin TRK receptor signaling pathway(GO:0051388) |
| 0.1 | 0.4 | GO:0043504 | mitochondrial DNA repair(GO:0043504) |
| 0.1 | 0.1 | GO:0021555 | midbrain-hindbrain boundary morphogenesis(GO:0021555) |
| 0.1 | 5.0 | GO:0007080 | mitotic metaphase plate congression(GO:0007080) |
| 0.1 | 0.5 | GO:0032485 | Ral protein signal transduction(GO:0032484) regulation of Ral protein signal transduction(GO:0032485) |
| 0.1 | 1.4 | GO:0060059 | embryonic retina morphogenesis in camera-type eye(GO:0060059) |
| 0.1 | 0.5 | GO:0048254 | snoRNA localization(GO:0048254) |
| 0.1 | 0.8 | GO:1903298 | regulation of hypoxia-induced intrinsic apoptotic signaling pathway(GO:1903297) negative regulation of hypoxia-induced intrinsic apoptotic signaling pathway(GO:1903298) |
| 0.1 | 0.3 | GO:0000103 | sulfate assimilation(GO:0000103) |
| 0.1 | 0.4 | GO:1904924 | negative regulation of mitophagy in response to mitochondrial depolarization(GO:1904924) |
| 0.1 | 1.8 | GO:0048742 | regulation of skeletal muscle fiber development(GO:0048742) |
| 0.1 | 0.3 | GO:0001732 | formation of cytoplasmic translation initiation complex(GO:0001732) |
| 0.1 | 0.2 | GO:0071314 | cellular response to cocaine(GO:0071314) |
| 0.1 | 0.5 | GO:0051708 | intracellular transport of viral protein in host cell(GO:0019060) symbiont intracellular protein transport in host(GO:0030581) intracellular protein transport in other organism involved in symbiotic interaction(GO:0051708) |
| 0.1 | 0.8 | GO:0046125 | thymidine metabolic process(GO:0046104) pyrimidine deoxyribonucleoside metabolic process(GO:0046125) |
| 0.1 | 0.3 | GO:0033024 | mast cell homeostasis(GO:0033023) mast cell apoptotic process(GO:0033024) regulation of mast cell apoptotic process(GO:0033025) mast cell proliferation(GO:0070662) |
| 0.1 | 2.5 | GO:0097150 | neuronal stem cell population maintenance(GO:0097150) |
| 0.1 | 0.7 | GO:0090481 | pyrimidine nucleotide-sugar transmembrane transport(GO:0090481) |
| 0.1 | 1.0 | GO:0034720 | histone H3-K4 demethylation(GO:0034720) |
| 0.1 | 0.5 | GO:0070086 | ubiquitin-dependent endocytosis(GO:0070086) |
| 0.1 | 0.3 | GO:0045875 | negative regulation of sister chromatid cohesion(GO:0045875) |
| 0.1 | 0.6 | GO:0060282 | positive regulation of oocyte development(GO:0060282) |
| 0.1 | 0.3 | GO:0031161 | phosphatidylinositol catabolic process(GO:0031161) |
| 0.1 | 0.3 | GO:1903281 | regulation of the force of heart contraction by cardiac conduction(GO:0086092) positive regulation of calcium:sodium antiporter activity(GO:1903281) |
| 0.1 | 0.2 | GO:0072086 | proximal/distal pattern formation involved in nephron development(GO:0072047) specification of nephron tubule identity(GO:0072081) specification of loop of Henle identity(GO:0072086) |
| 0.1 | 0.2 | GO:0035425 | autocrine signaling(GO:0035425) |
| 0.1 | 0.2 | GO:0006335 | DNA replication-dependent nucleosome assembly(GO:0006335) DNA replication-dependent nucleosome organization(GO:0034723) |
| 0.1 | 0.4 | GO:0060800 | regulation of cell differentiation involved in embryonic placenta development(GO:0060800) |
| 0.1 | 0.6 | GO:0043402 | glucocorticoid mediated signaling pathway(GO:0043402) |
| 0.1 | 0.6 | GO:1905066 | arterial endothelial cell fate commitment(GO:0060844) canonical Wnt signaling pathway involved in cardiac muscle cell fate commitment(GO:0061317) positive regulation of ephrin receptor signaling pathway(GO:1901189) regulation of canonical Wnt signaling pathway involved in cardiac muscle cell fate commitment(GO:1901295) positive regulation of canonical Wnt signaling pathway involved in cardiac muscle cell fate commitment(GO:1901297) regulation of canonical Wnt signaling pathway involved in heart development(GO:1905066) positive regulation of canonical Wnt signaling pathway involved in heart development(GO:1905068) |
| 0.1 | 0.2 | GO:0014707 | branchiomeric skeletal muscle development(GO:0014707) |
| 0.1 | 0.1 | GO:0036388 | pre-replicative complex assembly involved in nuclear cell cycle DNA replication(GO:0006267) pre-replicative complex assembly(GO:0036388) pre-replicative complex assembly involved in cell cycle DNA replication(GO:1902299) |
| 0.1 | 0.2 | GO:0030719 | oocyte construction(GO:0007308) oocyte axis specification(GO:0007309) oocyte anterior/posterior axis specification(GO:0007314) pole plasm assembly(GO:0007315) maternal determination of anterior/posterior axis, embryo(GO:0008358) P granule organization(GO:0030719) |
| 0.1 | 0.4 | GO:0042853 | L-alanine metabolic process(GO:0042851) L-alanine catabolic process(GO:0042853) |
| 0.1 | 1.9 | GO:0006895 | Golgi to endosome transport(GO:0006895) |
| 0.1 | 0.7 | GO:0080009 | mRNA methylation(GO:0080009) |
| 0.1 | 0.2 | GO:1904529 | regulation of actin filament binding(GO:1904529) regulation of actin binding(GO:1904616) |
| 0.1 | 0.2 | GO:1902303 | negative regulation of potassium ion export(GO:1902303) |
| 0.1 | 0.2 | GO:0006543 | glutamine catabolic process(GO:0006543) |
| 0.1 | 0.5 | GO:0089700 | protein kinase D signaling(GO:0089700) |
| 0.1 | 0.5 | GO:0006269 | DNA replication, synthesis of RNA primer(GO:0006269) |
| 0.1 | 0.1 | GO:0021957 | corticospinal tract morphogenesis(GO:0021957) |
| 0.1 | 0.2 | GO:0031860 | telomeric 3' overhang formation(GO:0031860) |
| 0.1 | 0.7 | GO:0061732 | mitochondrial acetyl-CoA biosynthetic process from pyruvate(GO:0061732) |
| 0.1 | 0.5 | GO:0043985 | histone H4-R3 methylation(GO:0043985) |
| 0.1 | 2.3 | GO:0034199 | activation of protein kinase A activity(GO:0034199) |
| 0.1 | 0.6 | GO:0048014 | Tie signaling pathway(GO:0048014) |
| 0.1 | 1.3 | GO:0006896 | Golgi to vacuole transport(GO:0006896) |
| 0.1 | 0.3 | GO:0009298 | GDP-mannose biosynthetic process(GO:0009298) |
| 0.1 | 0.3 | GO:0060040 | retinal bipolar neuron differentiation(GO:0060040) |
| 0.1 | 0.6 | GO:2001206 | positive regulation of osteoclast development(GO:2001206) |
| 0.1 | 1.6 | GO:1900745 | positive regulation of p38MAPK cascade(GO:1900745) |
| 0.1 | 0.3 | GO:0090071 | negative regulation of ribosome biogenesis(GO:0090071) |
| 0.1 | 0.3 | GO:0048749 | compound eye development(GO:0048749) |
| 0.1 | 0.3 | GO:0072061 | inner medullary collecting duct development(GO:0072061) |
| 0.1 | 0.2 | GO:0061163 | endoplasmic reticulum polarization(GO:0061163) actin filament bundle retrograde transport(GO:0061573) actin filament bundle distribution(GO:0070650) |
| 0.1 | 0.6 | GO:0046604 | positive regulation of mitotic centrosome separation(GO:0046604) |
| 0.1 | 0.3 | GO:0030200 | heparan sulfate proteoglycan catabolic process(GO:0030200) |
| 0.1 | 1.9 | GO:0042753 | positive regulation of circadian rhythm(GO:0042753) |
| 0.1 | 0.5 | GO:0048102 | autophagic cell death(GO:0048102) |
| 0.1 | 0.4 | GO:2000418 | positive regulation of eosinophil migration(GO:2000418) |
| 0.1 | 0.5 | GO:1900748 | positive regulation of vascular endothelial growth factor signaling pathway(GO:1900748) |
| 0.1 | 0.3 | GO:0072423 | response to cell cycle checkpoint signaling(GO:0072396) response to DNA integrity checkpoint signaling(GO:0072402) response to DNA damage checkpoint signaling(GO:0072423) |
| 0.1 | 0.9 | GO:0006610 | ribosomal protein import into nucleus(GO:0006610) |
| 0.1 | 0.2 | GO:0021526 | medial motor column neuron differentiation(GO:0021526) |
| 0.1 | 0.3 | GO:0061146 | Peyer's patch morphogenesis(GO:0061146) lymphocyte migration into lymphoid organs(GO:0097021) |
| 0.1 | 0.1 | GO:0060313 | negative regulation of blood vessel remodeling(GO:0060313) |
| 0.1 | 0.3 | GO:0006177 | GMP biosynthetic process(GO:0006177) |
| 0.1 | 1.1 | GO:0031297 | replication fork processing(GO:0031297) |
| 0.1 | 0.3 | GO:0051758 | homologous chromosome movement towards spindle pole involved in homologous chromosome segregation(GO:0051758) |
| 0.1 | 0.6 | GO:0035694 | mitochondrial protein catabolic process(GO:0035694) |
| 0.1 | 0.4 | GO:0006540 | glutamate decarboxylation to succinate(GO:0006540) |
| 0.1 | 0.3 | GO:0010982 | regulation of high-density lipoprotein particle clearance(GO:0010982) |
| 0.1 | 0.7 | GO:0001886 | endothelial cell morphogenesis(GO:0001886) |
| 0.1 | 0.8 | GO:0006336 | DNA replication-independent nucleosome assembly(GO:0006336) |
| 0.1 | 0.1 | GO:0060424 | foregut regionalization(GO:0060423) lung field specification(GO:0060424) lung induction(GO:0060492) |
| 0.1 | 5.5 | GO:2000649 | regulation of sodium ion transmembrane transporter activity(GO:2000649) |
| 0.1 | 0.6 | GO:0007023 | post-chaperonin tubulin folding pathway(GO:0007023) |
| 0.1 | 0.8 | GO:0035871 | protein K11-linked deubiquitination(GO:0035871) |
| 0.1 | 0.1 | GO:0003419 | growth plate cartilage chondrocyte proliferation(GO:0003419) |
| 0.1 | 0.3 | GO:0033512 | L-lysine catabolic process to acetyl-CoA via saccharopine(GO:0033512) |
| 0.1 | 0.5 | GO:0021943 | formation of radial glial scaffolds(GO:0021943) |
| 0.1 | 0.3 | GO:0006620 | posttranslational protein targeting to membrane(GO:0006620) |
| 0.1 | 0.8 | GO:0035385 | Roundabout signaling pathway(GO:0035385) |
| 0.1 | 0.1 | GO:0034140 | negative regulation of toll-like receptor 3 signaling pathway(GO:0034140) |
| 0.1 | 0.6 | GO:0001833 | inner cell mass cell proliferation(GO:0001833) |
| 0.1 | 0.5 | GO:1901098 | positive regulation of autophagosome maturation(GO:1901098) |
| 0.1 | 0.4 | GO:0006290 | pyrimidine dimer repair(GO:0006290) |
| 0.1 | 0.5 | GO:1990416 | cellular response to brain-derived neurotrophic factor stimulus(GO:1990416) |
| 0.1 | 0.5 | GO:0010908 | regulation of heparan sulfate proteoglycan biosynthetic process(GO:0010908) positive regulation of heparan sulfate proteoglycan biosynthetic process(GO:0010909) positive regulation of proteoglycan biosynthetic process(GO:1902730) |
| 0.1 | 0.3 | GO:0034773 | histone H4-K20 trimethylation(GO:0034773) |
| 0.1 | 0.2 | GO:0036269 | swimming behavior(GO:0036269) |
| 0.1 | 1.0 | GO:0006878 | cellular copper ion homeostasis(GO:0006878) |
| 0.1 | 0.3 | GO:0044034 | negative stranded viral RNA replication(GO:0039689) multi-organism biosynthetic process(GO:0044034) |
| 0.1 | 0.3 | GO:0000733 | DNA strand renaturation(GO:0000733) |
| 0.1 | 0.4 | GO:0071267 | amino acid salvage(GO:0043102) L-methionine salvage(GO:0071267) |
| 0.1 | 0.3 | GO:0034334 | adherens junction maintenance(GO:0034334) |
| 0.1 | 0.5 | GO:0010265 | SCF complex assembly(GO:0010265) |
| 0.1 | 0.5 | GO:0098795 | mRNA cleavage involved in gene silencing by miRNA(GO:0035279) mRNA cleavage involved in gene silencing(GO:0098795) |
| 0.1 | 0.2 | GO:1902908 | negative regulation of transforming growth factor beta2 production(GO:0032912) negative regulation of hair follicle maturation(GO:0048817) regulation of melanosome transport(GO:1902908) |
| 0.1 | 0.3 | GO:0051684 | maintenance of Golgi location(GO:0051684) |
| 0.1 | 0.6 | GO:0048251 | elastic fiber assembly(GO:0048251) |
| 0.1 | 0.5 | GO:0045345 | positive regulation of MHC class I biosynthetic process(GO:0045345) |
| 0.1 | 0.6 | GO:0040016 | embryonic cleavage(GO:0040016) |
| 0.1 | 0.4 | GO:0090666 | scaRNA localization to Cajal body(GO:0090666) |
| 0.1 | 0.4 | GO:0002118 | aggressive behavior(GO:0002118) |
| 0.1 | 1.0 | GO:0051660 | establishment of centrosome localization(GO:0051660) |
| 0.1 | 0.4 | GO:0036072 | intramembranous ossification(GO:0001957) direct ossification(GO:0036072) |
| 0.1 | 0.3 | GO:0006546 | glycine catabolic process(GO:0006546) glycine decarboxylation via glycine cleavage system(GO:0019464) |
| 0.1 | 0.5 | GO:1990573 | potassium ion import across plasma membrane(GO:1990573) |
| 0.1 | 0.5 | GO:0001672 | regulation of chromatin assembly or disassembly(GO:0001672) |
| 0.1 | 0.4 | GO:0045113 | regulation of integrin biosynthetic process(GO:0045113) |
| 0.1 | 0.3 | GO:0007089 | traversing start control point of mitotic cell cycle(GO:0007089) |
| 0.1 | 0.7 | GO:1900121 | negative regulation of receptor binding(GO:1900121) |
| 0.1 | 1.0 | GO:0010891 | negative regulation of sequestering of triglyceride(GO:0010891) |
| 0.1 | 0.2 | GO:0003164 | His-Purkinje system development(GO:0003164) |
| 0.1 | 0.3 | GO:0030579 | ubiquitin-dependent SMAD protein catabolic process(GO:0030579) |
| 0.1 | 0.2 | GO:1901355 | response to rapamycin(GO:1901355) |
| 0.0 | 1.7 | GO:0042772 | DNA damage response, signal transduction resulting in transcription(GO:0042772) |
| 0.0 | 0.6 | GO:0042670 | retinal cone cell differentiation(GO:0042670) retinal cone cell development(GO:0046549) |
| 0.0 | 0.1 | GO:0006726 | eye pigment biosynthetic process(GO:0006726) synaptic vesicle recycling via endosome(GO:0036466) eye pigment metabolic process(GO:0042441) pigment metabolic process involved in developmental pigmentation(GO:0043324) pigment metabolic process involved in pigmentation(GO:0043474) |
| 0.0 | 0.4 | GO:0000710 | meiotic mismatch repair(GO:0000710) |
| 0.0 | 0.1 | GO:0030974 | thiamine pyrophosphate transport(GO:0030974) |
| 0.0 | 0.2 | GO:0061152 | trachea submucosa development(GO:0061152) trachea gland development(GO:0061153) |
| 0.0 | 0.4 | GO:0031936 | negative regulation of chromatin silencing(GO:0031936) |
| 0.0 | 1.6 | GO:0006270 | DNA replication initiation(GO:0006270) |
| 0.0 | 0.2 | GO:0010266 | response to vitamin B1(GO:0010266) |
| 0.0 | 0.4 | GO:0072734 | response to staurosporine(GO:0072733) cellular response to staurosporine(GO:0072734) |
| 0.0 | 0.4 | GO:0006741 | NADP biosynthetic process(GO:0006741) |
| 0.0 | 0.2 | GO:0009257 | 10-formyltetrahydrofolate biosynthetic process(GO:0009257) |
| 0.0 | 0.1 | GO:0035281 | pre-miRNA export from nucleus(GO:0035281) |
| 0.0 | 0.2 | GO:0030047 | actin modification(GO:0030047) |
| 0.0 | 0.3 | GO:0060371 | regulation of atrial cardiac muscle cell membrane depolarization(GO:0060371) |
| 0.0 | 0.9 | GO:0060236 | regulation of mitotic spindle organization(GO:0060236) regulation of spindle organization(GO:0090224) |
| 0.0 | 0.3 | GO:0032100 | positive regulation of response to food(GO:0032097) positive regulation of appetite(GO:0032100) |
| 0.0 | 0.1 | GO:0019046 | release from viral latency(GO:0019046) |
| 0.0 | 0.5 | GO:0098535 | de novo centriole assembly(GO:0098535) |
| 0.0 | 0.6 | GO:0001967 | suckling behavior(GO:0001967) |
| 0.0 | 0.2 | GO:0009233 | menaquinone metabolic process(GO:0009233) |
| 0.0 | 0.1 | GO:0071140 | resolution of recombination intermediates(GO:0071139) resolution of mitotic recombination intermediates(GO:0071140) |
| 0.0 | 0.4 | GO:0000395 | mRNA 5'-splice site recognition(GO:0000395) |
| 0.0 | 0.8 | GO:0071803 | positive regulation of podosome assembly(GO:0071803) |
| 0.0 | 0.1 | GO:2000297 | negative regulation of synapse maturation(GO:2000297) |
| 0.0 | 0.3 | GO:0098728 | germ-line stem cell division(GO:0042078) male germ-line stem cell asymmetric division(GO:0048133) germline stem cell asymmetric division(GO:0098728) |
| 0.0 | 0.3 | GO:0072526 | pyridine-containing compound catabolic process(GO:0072526) |
| 0.0 | 0.6 | GO:0071493 | cellular response to UV-B(GO:0071493) |
| 0.0 | 0.2 | GO:0045226 | extracellular polysaccharide biosynthetic process(GO:0045226) extracellular polysaccharide metabolic process(GO:0046379) |
| 0.0 | 0.0 | GO:0071630 | nucleus-associated proteasomal ubiquitin-dependent protein catabolic process(GO:0071630) |
| 0.0 | 0.4 | GO:0032057 | negative regulation of translational initiation in response to stress(GO:0032057) |
| 0.0 | 0.4 | GO:0098967 | exocytic insertion of neurotransmitter receptor to plasma membrane(GO:0098881) exocytic insertion of neurotransmitter receptor to postsynaptic membrane(GO:0098967) |
| 0.0 | 0.7 | GO:0030388 | fructose 1,6-bisphosphate metabolic process(GO:0030388) |
| 0.0 | 0.2 | GO:0035405 | histone-threonine phosphorylation(GO:0035405) |
| 0.0 | 0.4 | GO:0039702 | viral budding via host ESCRT complex(GO:0039702) |
| 0.0 | 0.3 | GO:0070544 | histone H3-K36 demethylation(GO:0070544) |
| 0.0 | 0.8 | GO:0033617 | mitochondrial respiratory chain complex IV assembly(GO:0033617) |
| 0.0 | 1.0 | GO:0050908 | detection of light stimulus involved in visual perception(GO:0050908) detection of light stimulus involved in sensory perception(GO:0050962) |
| 0.0 | 0.5 | GO:0031065 | positive regulation of histone deacetylation(GO:0031065) |
| 0.0 | 0.1 | GO:1903998 | regulation of eating behavior(GO:1903998) |
| 0.0 | 0.1 | GO:0021707 | cerebellar granular layer formation(GO:0021684) cerebellar granule cell differentiation(GO:0021707) |
| 0.0 | 1.5 | GO:0000387 | spliceosomal snRNP assembly(GO:0000387) |
| 0.0 | 0.4 | GO:0043587 | tongue morphogenesis(GO:0043587) |
| 0.0 | 0.5 | GO:0070327 | thyroid hormone transport(GO:0070327) |
| 0.0 | 0.3 | GO:2000480 | negative regulation of cAMP-dependent protein kinase activity(GO:2000480) |
| 0.0 | 0.3 | GO:0060158 | phospholipase C-activating dopamine receptor signaling pathway(GO:0060158) |
| 0.0 | 0.3 | GO:0006216 | cytidine catabolic process(GO:0006216) cytidine deamination(GO:0009972) cytidine metabolic process(GO:0046087) |
| 0.0 | 0.3 | GO:0006880 | intracellular sequestering of iron ion(GO:0006880) sequestering of iron ion(GO:0097577) |
| 0.0 | 0.1 | GO:1900155 | regulation of bone trabecula formation(GO:1900154) negative regulation of bone trabecula formation(GO:1900155) |
| 0.0 | 0.3 | GO:0034214 | protein hexamerization(GO:0034214) |
| 0.0 | 0.2 | GO:0036124 | histone H3-K9 trimethylation(GO:0036124) |
| 0.0 | 4.2 | GO:0051965 | positive regulation of synapse assembly(GO:0051965) |
| 0.0 | 0.4 | GO:0032275 | luteinizing hormone secretion(GO:0032275) |
| 0.0 | 0.1 | GO:2000538 | regulation of cGMP-mediated signaling(GO:0010752) regulation of B cell chemotaxis(GO:2000537) positive regulation of B cell chemotaxis(GO:2000538) |
| 0.0 | 0.3 | GO:0070127 | tRNA aminoacylation for mitochondrial protein translation(GO:0070127) |
| 0.0 | 0.0 | GO:0070898 | RNA polymerase III transcriptional preinitiation complex assembly(GO:0070898) |
| 0.0 | 0.2 | GO:0045900 | negative regulation of translational elongation(GO:0045900) |
| 0.0 | 0.2 | GO:1903630 | regulation of aminoacyl-tRNA ligase activity(GO:1903630) |
| 0.0 | 0.1 | GO:0042137 | sequestering of neurotransmitter(GO:0042137) |
| 0.0 | 0.1 | GO:0070213 | protein auto-ADP-ribosylation(GO:0070213) |
| 0.0 | 0.1 | GO:1901165 | positive regulation of trophoblast cell migration(GO:1901165) |
| 0.0 | 0.5 | GO:0051764 | actin crosslink formation(GO:0051764) |
| 0.0 | 0.3 | GO:0060355 | positive regulation of cell adhesion molecule production(GO:0060355) |
| 0.0 | 0.2 | GO:0035413 | positive regulation of catenin import into nucleus(GO:0035413) |
| 0.0 | 0.2 | GO:2000138 | positive regulation of cell proliferation involved in heart morphogenesis(GO:2000138) |
| 0.0 | 0.2 | GO:0071033 | nuclear retention of pre-mRNA at the site of transcription(GO:0071033) |
| 0.0 | 0.1 | GO:0002143 | tRNA wobble position uridine thiolation(GO:0002143) |
| 0.0 | 0.1 | GO:0006049 | UDP-N-acetylglucosamine catabolic process(GO:0006049) |
| 0.0 | 0.1 | GO:0072177 | mesonephric duct development(GO:0072177) |
| 0.0 | 0.8 | GO:0006744 | ubiquinone biosynthetic process(GO:0006744) quinone biosynthetic process(GO:1901663) |
| 0.0 | 0.3 | GO:0036444 | calcium ion transmembrane import into mitochondrion(GO:0036444) |
| 0.0 | 0.6 | GO:0030150 | protein import into mitochondrial matrix(GO:0030150) |
| 0.0 | 4.2 | GO:1904668 | positive regulation of ubiquitin protein ligase activity(GO:1904668) |
| 0.0 | 0.2 | GO:0080154 | regulation of fertilization(GO:0080154) |
| 0.0 | 0.2 | GO:0070445 | oligodendrocyte progenitor proliferation(GO:0070444) regulation of oligodendrocyte progenitor proliferation(GO:0070445) |
| 0.0 | 0.7 | GO:0051639 | actin filament network formation(GO:0051639) |
| 0.0 | 0.4 | GO:0070934 | CRD-mediated mRNA stabilization(GO:0070934) |
| 0.0 | 0.1 | GO:0061502 | early endosome to recycling endosome transport(GO:0061502) |
| 0.0 | 0.2 | GO:0006265 | DNA topological change(GO:0006265) |
| 0.0 | 0.2 | GO:0014807 | regulation of somitogenesis(GO:0014807) |
| 0.0 | 1.4 | GO:0032467 | positive regulation of cytokinesis(GO:0032467) |
| 0.0 | 0.1 | GO:1903273 | regulation of sodium ion export(GO:1903273) positive regulation of sodium ion export(GO:1903275) regulation of sodium ion export from cell(GO:1903276) positive regulation of sodium ion export from cell(GO:1903278) regulation of potassium ion import(GO:1903286) positive regulation of potassium ion import(GO:1903288) |
| 0.0 | 0.1 | GO:0003160 | endocardium morphogenesis(GO:0003160) |
| 0.0 | 0.1 | GO:0097676 | histone H3-K36 dimethylation(GO:0097676) |
| 0.0 | 0.3 | GO:0034465 | response to carbon monoxide(GO:0034465) |
| 0.0 | 0.2 | GO:2000348 | regulation of CD40 signaling pathway(GO:2000348) |
| 0.0 | 1.0 | GO:0072698 | protein localization to microtubule cytoskeleton(GO:0072698) |
| 0.0 | 0.4 | GO:0035372 | protein localization to microtubule(GO:0035372) |
| 0.0 | 0.4 | GO:0070914 | UV-damage excision repair(GO:0070914) |
| 0.0 | 0.2 | GO:0016560 | protein import into peroxisome matrix, docking(GO:0016560) |
| 0.0 | 0.1 | GO:0048320 | axial mesoderm formation(GO:0048320) |
| 0.0 | 0.3 | GO:0042256 | mature ribosome assembly(GO:0042256) |
| 0.0 | 0.1 | GO:0001978 | regulation of systemic arterial blood pressure by carotid sinus baroreceptor feedback(GO:0001978) baroreceptor response to increased systemic arterial blood pressure(GO:0001983) |
| 0.0 | 1.7 | GO:0090307 | mitotic spindle assembly(GO:0090307) |
| 0.0 | 0.3 | GO:2000270 | negative regulation of fibroblast apoptotic process(GO:2000270) |
| 0.0 | 0.8 | GO:0071108 | protein K48-linked deubiquitination(GO:0071108) |
| 0.0 | 0.1 | GO:1903348 | positive regulation of bicellular tight junction assembly(GO:1903348) |
| 0.0 | 1.4 | GO:0007214 | gamma-aminobutyric acid signaling pathway(GO:0007214) |
| 0.0 | 0.6 | GO:0030322 | stabilization of membrane potential(GO:0030322) |
| 0.0 | 0.1 | GO:0045196 | establishment or maintenance of neuroblast polarity(GO:0045196) establishment of neuroblast polarity(GO:0045200) |
| 0.0 | 0.2 | GO:0035803 | egg coat formation(GO:0035803) |
| 0.0 | 0.9 | GO:1900027 | regulation of ruffle assembly(GO:1900027) |
| 0.0 | 0.1 | GO:0035606 | peptidyl-cysteine S-trans-nitrosylation(GO:0035606) |
| 0.0 | 0.0 | GO:1904430 | negative regulation of t-circle formation(GO:1904430) |
| 0.0 | 0.3 | GO:0060965 | negative regulation of gene silencing by miRNA(GO:0060965) |
| 0.0 | 0.3 | GO:0033015 | porphyrin-containing compound catabolic process(GO:0006787) tetrapyrrole catabolic process(GO:0033015) heme catabolic process(GO:0042167) pigment catabolic process(GO:0046149) |
| 0.0 | 0.2 | GO:0098779 | mitophagy in response to mitochondrial depolarization(GO:0098779) |
| 0.0 | 0.7 | GO:1901881 | positive regulation of protein depolymerization(GO:1901881) |
| 0.0 | 0.4 | GO:0034498 | early endosome to Golgi transport(GO:0034498) |
| 0.0 | 0.1 | GO:0051835 | positive regulation of synapse structural plasticity(GO:0051835) |
| 0.0 | 0.4 | GO:0006516 | glycoprotein catabolic process(GO:0006516) |
| 0.0 | 0.2 | GO:1902961 | positive regulation of aspartic-type endopeptidase activity involved in amyloid precursor protein catabolic process(GO:1902961) regulation of metalloendopeptidase activity involved in amyloid precursor protein catabolic process(GO:1902962) negative regulation of metalloendopeptidase activity involved in amyloid precursor protein catabolic process(GO:1902963) positive regulation of aspartic-type peptidase activity(GO:1905247) |
| 0.0 | 0.1 | GO:0051365 | cellular response to potassium ion starvation(GO:0051365) response to methionine(GO:1904640) |
| 0.0 | 0.5 | GO:0045603 | positive regulation of endothelial cell differentiation(GO:0045603) |
| 0.0 | 1.0 | GO:0090383 | phagosome acidification(GO:0090383) |
| 0.0 | 0.1 | GO:0015722 | canalicular bile acid transport(GO:0015722) |
| 0.0 | 0.5 | GO:0032465 | regulation of cytokinesis(GO:0032465) |
| 0.0 | 1.0 | GO:0032008 | positive regulation of TOR signaling(GO:0032008) |
| 0.0 | 0.1 | GO:0006045 | N-acetylglucosamine biosynthetic process(GO:0006045) glucosamine-containing compound biosynthetic process(GO:1901073) |
| 0.0 | 1.0 | GO:0007205 | protein kinase C-activating G-protein coupled receptor signaling pathway(GO:0007205) |
| 0.0 | 0.1 | GO:1902630 | regulation of membrane hyperpolarization(GO:1902630) |
| 0.0 | 0.4 | GO:1902187 | negative regulation of viral release from host cell(GO:1902187) |
| 0.0 | 0.2 | GO:0042797 | 5S class rRNA transcription from RNA polymerase III type 1 promoter(GO:0042791) tRNA transcription from RNA polymerase III promoter(GO:0042797) |
| 0.0 | 0.3 | GO:0038166 | angiotensin-activated signaling pathway(GO:0038166) |
| 0.0 | 0.2 | GO:0060982 | coronary artery morphogenesis(GO:0060982) |
| 0.0 | 0.2 | GO:0031584 | activation of phospholipase D activity(GO:0031584) |
| 0.0 | 0.1 | GO:0034441 | plasma lipoprotein particle oxidation(GO:0034441) platelet activating factor metabolic process(GO:0046469) |
| 0.0 | 0.3 | GO:0006972 | hyperosmotic response(GO:0006972) |
| 0.0 | 0.2 | GO:0060628 | regulation of ER to Golgi vesicle-mediated transport(GO:0060628) |
| 0.0 | 0.4 | GO:0031293 | membrane protein intracellular domain proteolysis(GO:0031293) |
| 0.0 | 0.3 | GO:0090110 | cargo loading into COPII-coated vesicle(GO:0090110) |
| 0.0 | 0.0 | GO:0033590 | response to cobalamin(GO:0033590) |
| 0.0 | 0.1 | GO:1902902 | negative regulation of autophagosome assembly(GO:1902902) |
| 0.0 | 0.3 | GO:1901838 | positive regulation of transcription of nuclear large rRNA transcript from RNA polymerase I promoter(GO:1901838) |
| 0.0 | 0.2 | GO:0010961 | cellular magnesium ion homeostasis(GO:0010961) |
| 0.0 | 0.1 | GO:0021978 | telencephalon regionalization(GO:0021978) |
| 0.0 | 0.1 | GO:1903070 | negative regulation of ER-associated ubiquitin-dependent protein catabolic process(GO:1903070) |
| 0.0 | 0.1 | GO:1902766 | skeletal muscle satellite cell migration(GO:1902766) |
| 0.0 | 0.1 | GO:0019086 | late viral transcription(GO:0019086) |
| 0.0 | 0.2 | GO:0014877 | response to muscle inactivity involved in regulation of muscle adaptation(GO:0014877) response to denervation involved in regulation of muscle adaptation(GO:0014894) |
| 0.0 | 0.7 | GO:0070306 | lens fiber cell differentiation(GO:0070306) |
| 0.0 | 0.5 | GO:0048745 | smooth muscle tissue development(GO:0048745) |
| 0.0 | 0.4 | GO:0001829 | trophectodermal cell differentiation(GO:0001829) |
| 0.0 | 0.3 | GO:1902572 | negative regulation of serine-type endopeptidase activity(GO:1900004) negative regulation of serine-type peptidase activity(GO:1902572) |
| 0.0 | 0.3 | GO:0000717 | nucleotide-excision repair, DNA duplex unwinding(GO:0000717) |
| 0.0 | 0.1 | GO:0033182 | regulation of histone ubiquitination(GO:0033182) |
| 0.0 | 0.1 | GO:2000210 | positive regulation of anoikis(GO:2000210) |
| 0.0 | 0.1 | GO:0070077 | peptidyl-lysine hydroxylation to 5-hydroxy-L-lysine(GO:0018395) histone arginine demethylation(GO:0070077) histone H3-R2 demethylation(GO:0070078) histone H4-R3 demethylation(GO:0070079) |
| 0.0 | 0.1 | GO:0014050 | negative regulation of glutamate secretion(GO:0014050) |
| 0.0 | 0.1 | GO:0042335 | cuticle development(GO:0042335) |
| 0.0 | 0.1 | GO:2001287 | regulation of caveolin-mediated endocytosis(GO:2001286) negative regulation of caveolin-mediated endocytosis(GO:2001287) |
| 0.0 | 0.1 | GO:0002098 | tRNA wobble uridine modification(GO:0002098) |
| 0.0 | 0.1 | GO:0007343 | egg activation(GO:0007343) |
| 0.0 | 0.2 | GO:1904996 | positive regulation of leukocyte adhesion to vascular endothelial cell(GO:1904996) |
| 0.0 | 0.2 | GO:0002943 | tRNA dihydrouridine synthesis(GO:0002943) |
| 0.0 | 0.1 | GO:0035021 | negative regulation of Rac protein signal transduction(GO:0035021) |
| 0.0 | 0.1 | GO:0003360 | brainstem development(GO:0003360) |
| 0.0 | 0.0 | GO:0001994 | norepinephrine-epinephrine vasoconstriction involved in regulation of systemic arterial blood pressure(GO:0001994) |
| 0.0 | 0.2 | GO:0031022 | nuclear migration along microfilament(GO:0031022) |
| 0.0 | 0.5 | GO:0016254 | preassembly of GPI anchor in ER membrane(GO:0016254) |
| 0.0 | 0.1 | GO:0030263 | apoptotic chromosome condensation(GO:0030263) |
| 0.0 | 0.1 | GO:0007221 | positive regulation of transcription of Notch receptor target(GO:0007221) |
| 0.0 | 0.0 | GO:1904417 | regulation of xenophagy(GO:1904415) positive regulation of xenophagy(GO:1904417) |
| 0.0 | 0.1 | GO:1903748 | negative regulation of establishment of protein localization to mitochondrion(GO:1903748) |
| 0.0 | 0.1 | GO:0036102 | leukotriene catabolic process(GO:0036100) leukotriene B4 catabolic process(GO:0036101) leukotriene B4 metabolic process(GO:0036102) icosanoid catabolic process(GO:1901523) fatty acid derivative catabolic process(GO:1901569) |
| 0.0 | 0.0 | GO:2000393 | negative regulation of lamellipodium morphogenesis(GO:2000393) |
| 0.0 | 0.3 | GO:1902018 | negative regulation of cilium assembly(GO:1902018) |
| 0.0 | 0.3 | GO:1904259 | regulation of basement membrane assembly involved in embryonic body morphogenesis(GO:1904259) positive regulation of basement membrane assembly involved in embryonic body morphogenesis(GO:1904261) basement membrane assembly involved in embryonic body morphogenesis(GO:2001197) |
| 0.0 | 0.2 | GO:0010459 | negative regulation of heart rate(GO:0010459) |
| 0.0 | 0.2 | GO:0000715 | nucleotide-excision repair, DNA damage recognition(GO:0000715) |
| 0.0 | 0.4 | GO:0043011 | myeloid dendritic cell differentiation(GO:0043011) |
| 0.0 | 0.1 | GO:2000374 | regulation of oxygen metabolic process(GO:2000374) |
| 0.0 | 0.1 | GO:0015705 | iodide transport(GO:0015705) |
| 0.0 | 0.5 | GO:0007019 | microtubule depolymerization(GO:0007019) |
| 0.0 | 0.1 | GO:1902498 | regulation of protein autoubiquitination(GO:1902498) positive regulation of protein autoubiquitination(GO:1902499) |
| 0.0 | 0.1 | GO:1905232 | negative regulation of dendrite extension(GO:1903860) regulation of neuron remodeling(GO:1904799) negative regulation of neuron remodeling(GO:1904800) cellular response to L-glutamate(GO:1905232) negative regulation of branching morphogenesis of a nerve(GO:2000173) |
| 0.0 | 0.2 | GO:0090168 | Golgi reassembly(GO:0090168) |
| 0.0 | 0.1 | GO:0070475 | rRNA base methylation(GO:0070475) |
| 0.0 | 0.2 | GO:0075522 | IRES-dependent viral translational initiation(GO:0075522) |
| 0.0 | 0.3 | GO:0046827 | positive regulation of protein export from nucleus(GO:0046827) |
| 0.0 | 0.0 | GO:0006933 | negative regulation of cell adhesion involved in substrate-bound cell migration(GO:0006933) |
| 0.0 | 0.1 | GO:0031017 | exocrine pancreas development(GO:0031017) |
| 0.0 | 0.5 | GO:0043968 | histone H2A acetylation(GO:0043968) |
| 0.0 | 0.3 | GO:0030502 | negative regulation of bone mineralization(GO:0030502) negative regulation of biomineral tissue development(GO:0070168) |
| 0.0 | 0.0 | GO:0072709 | cellular response to sorbitol(GO:0072709) |
| 0.0 | 0.0 | GO:0048631 | regulation of skeletal muscle tissue growth(GO:0048631) |
| 0.0 | 0.3 | GO:0042340 | keratan sulfate catabolic process(GO:0042340) |
| 0.0 | 0.2 | GO:0097178 | ruffle assembly(GO:0097178) |
| 0.0 | 0.3 | GO:0048172 | regulation of short-term neuronal synaptic plasticity(GO:0048172) |
| 0.0 | 0.2 | GO:0010917 | negative regulation of mitochondrial membrane potential(GO:0010917) |
| 0.0 | 0.0 | GO:0044691 | tooth eruption(GO:0044691) |
| 0.0 | 0.1 | GO:0060385 | axonogenesis involved in innervation(GO:0060385) |
| 0.0 | 0.1 | GO:0033058 | directional locomotion(GO:0033058) |
| 0.0 | 0.2 | GO:0051016 | barbed-end actin filament capping(GO:0051016) |
| 0.0 | 0.2 | GO:0019388 | galactose catabolic process(GO:0019388) |
| 0.0 | 0.1 | GO:0097411 | hypoxia-inducible factor-1alpha signaling pathway(GO:0097411) |
| 0.0 | 0.2 | GO:0006670 | sphingosine metabolic process(GO:0006670) |
| 0.0 | 0.3 | GO:0018023 | peptidyl-lysine trimethylation(GO:0018023) |
| 0.0 | 0.1 | GO:0017085 | response to insecticide(GO:0017085) |
| 0.0 | 0.2 | GO:0032836 | glomerular basement membrane development(GO:0032836) |
| 0.0 | 0.2 | GO:0045292 | mRNA cis splicing, via spliceosome(GO:0045292) |
| 0.0 | 0.1 | GO:1990118 | sodium ion import across plasma membrane(GO:0098719) sodium ion import into cell(GO:1990118) |
| 0.0 | 0.5 | GO:0010573 | vascular endothelial growth factor production(GO:0010573) |
| 0.0 | 0.7 | GO:0061418 | regulation of transcription from RNA polymerase II promoter in response to hypoxia(GO:0061418) |
| 0.0 | 0.1 | GO:0007206 | phospholipase C-activating G-protein coupled glutamate receptor signaling pathway(GO:0007206) |
| 0.0 | 0.3 | GO:0032515 | negative regulation of phosphoprotein phosphatase activity(GO:0032515) |
| 0.0 | 0.4 | GO:0033962 | cytoplasmic mRNA processing body assembly(GO:0033962) |
| 0.0 | 0.7 | GO:0006400 | tRNA modification(GO:0006400) |
| 0.0 | 0.7 | GO:0019835 | cytolysis(GO:0019835) |
| 0.0 | 0.1 | GO:0009249 | protein lipoylation(GO:0009249) |
| 0.0 | 0.0 | GO:0010645 | regulation of cell communication by chemical coupling(GO:0010645) positive regulation of cell communication by chemical coupling(GO:0010652) |
| 0.0 | 0.1 | GO:0033133 | positive regulation of glucokinase activity(GO:0033133) positive regulation of hexokinase activity(GO:1903301) |
| 0.0 | 0.1 | GO:0051549 | positive regulation of keratinocyte migration(GO:0051549) |
| 0.0 | 0.1 | GO:0001915 | negative regulation of T cell mediated cytotoxicity(GO:0001915) |
| 0.0 | 0.2 | GO:0016242 | negative regulation of macroautophagy(GO:0016242) |
| 0.0 | 0.1 | GO:0009157 | deoxyribonucleoside monophosphate biosynthetic process(GO:0009157) |
| 0.0 | 0.2 | GO:0051085 | chaperone mediated protein folding requiring cofactor(GO:0051085) |
| 0.0 | 0.1 | GO:1900383 | regulation of synaptic plasticity by receptor localization to synapse(GO:1900383) |
| 0.0 | 0.1 | GO:0070050 | neuron cellular homeostasis(GO:0070050) |
| 0.0 | 0.1 | GO:0033235 | positive regulation of protein sumoylation(GO:0033235) |
| 0.0 | 0.1 | GO:0061088 | regulation of sequestering of zinc ion(GO:0061088) |
| 0.0 | 0.2 | GO:0006048 | UDP-N-acetylglucosamine biosynthetic process(GO:0006048) amino sugar biosynthetic process(GO:0046349) |
| 0.0 | 0.1 | GO:0043922 | negative regulation by host of viral transcription(GO:0043922) |
| 0.0 | 0.3 | GO:0070423 | nucleotide-binding oligomerization domain containing signaling pathway(GO:0070423) |
| 0.0 | 0.8 | GO:0033275 | muscle filament sliding(GO:0030049) actin-myosin filament sliding(GO:0033275) |
| 0.0 | 0.6 | GO:1901385 | regulation of voltage-gated calcium channel activity(GO:1901385) |
| 0.0 | 0.0 | GO:0045643 | regulation of eosinophil differentiation(GO:0045643) positive regulation of eosinophil differentiation(GO:0045645) |
| 0.0 | 0.6 | GO:0007274 | neuromuscular synaptic transmission(GO:0007274) |
| 0.0 | 0.0 | GO:0097501 | stress response to metal ion(GO:0097501) |
| 0.0 | 0.5 | GO:0045214 | sarcomere organization(GO:0045214) |
| 0.0 | 0.1 | GO:1902231 | positive regulation of intrinsic apoptotic signaling pathway in response to DNA damage(GO:1902231) |
| 0.0 | 0.3 | GO:0043666 | regulation of phosphoprotein phosphatase activity(GO:0043666) |
| 0.0 | 0.2 | GO:0021854 | hypothalamus development(GO:0021854) |
| 0.0 | 0.2 | GO:0045723 | positive regulation of fatty acid biosynthetic process(GO:0045723) |
| 0.0 | 0.1 | GO:0006122 | mitochondrial electron transport, ubiquinol to cytochrome c(GO:0006122) |
| 0.0 | 0.1 | GO:0051182 | coenzyme transport(GO:0051182) |
| 0.0 | 0.0 | GO:0021718 | pons maturation(GO:0021586) superior olivary nucleus development(GO:0021718) superior olivary nucleus maturation(GO:0021722) |
| 0.0 | 0.3 | GO:0030208 | chondroitin sulfate catabolic process(GO:0030207) dermatan sulfate biosynthetic process(GO:0030208) |
| 0.0 | 0.1 | GO:0001542 | ovulation from ovarian follicle(GO:0001542) |
| 0.0 | 0.1 | GO:0015693 | magnesium ion transport(GO:0015693) |
| 0.0 | 0.7 | GO:0042255 | ribosome assembly(GO:0042255) |
| 0.0 | 0.1 | GO:0042997 | negative regulation of Golgi to plasma membrane protein transport(GO:0042997) |
| 0.0 | 0.1 | GO:0032911 | negative regulation of transforming growth factor beta1 production(GO:0032911) |
| 0.0 | 0.4 | GO:0032728 | positive regulation of interferon-beta production(GO:0032728) |
| 0.0 | 0.1 | GO:0048793 | pronephros development(GO:0048793) |
| 0.0 | 0.0 | GO:0090027 | negative regulation of monocyte chemotaxis(GO:0090027) |
Gene overrepresentation in cellular component category:
| Log-likelihood per target | Total log-likelihood | Term | Description |
|---|---|---|---|
| 0.6 | 1.8 | GO:1902737 | dendritic filopodium(GO:1902737) |
| 0.4 | 2.1 | GO:0005971 | ribonucleoside-diphosphate reductase complex(GO:0005971) |
| 0.4 | 3.1 | GO:0000796 | condensin complex(GO:0000796) |
| 0.4 | 3.4 | GO:0035985 | senescence-associated heterochromatin focus(GO:0035985) |
| 0.4 | 1.4 | GO:0070435 | Shc-EGFR complex(GO:0070435) |
| 0.3 | 3.6 | GO:0005638 | lamin filament(GO:0005638) |
| 0.3 | 0.9 | GO:0018444 | translation release factor complex(GO:0018444) |
| 0.3 | 1.2 | GO:0038039 | G-protein coupled receptor heterodimeric complex(GO:0038039) |
| 0.3 | 2.3 | GO:1990111 | spermatoproteasome complex(GO:1990111) |
| 0.3 | 1.6 | GO:0097129 | cyclin D2-CDK4 complex(GO:0097129) |
| 0.3 | 1.3 | GO:0031523 | Myb complex(GO:0031523) |
| 0.2 | 0.7 | GO:0033593 | BRCA2-MAGE-D1 complex(GO:0033593) |
| 0.2 | 3.4 | GO:0030015 | CCR4-NOT core complex(GO:0030015) |
| 0.2 | 2.1 | GO:0001739 | sex chromatin(GO:0001739) |
| 0.2 | 0.7 | GO:1990298 | mitotic checkpoint complex(GO:0033597) bub1-bub3 complex(GO:1990298) |
| 0.2 | 0.9 | GO:0097125 | cyclin B1-CDK1 complex(GO:0097125) |
| 0.2 | 0.4 | GO:0097135 | cyclin E2-CDK2 complex(GO:0097135) |
| 0.2 | 3.9 | GO:0090543 | Flemming body(GO:0090543) |
| 0.2 | 1.1 | GO:0071008 | U2-type post-mRNA release spliceosomal complex(GO:0071008) |
| 0.2 | 1.1 | GO:0031436 | BRCA1-BARD1 complex(GO:0031436) |
| 0.2 | 1.6 | GO:0097451 | glial limiting end-foot(GO:0097451) |
| 0.2 | 1.7 | GO:0071144 | SMAD2-SMAD3 protein complex(GO:0071144) |
| 0.2 | 1.2 | GO:0098536 | deuterosome(GO:0098536) |
| 0.2 | 1.0 | GO:0008622 | epsilon DNA polymerase complex(GO:0008622) |
| 0.2 | 0.8 | GO:0071942 | XPC complex(GO:0071942) |
| 0.2 | 2.7 | GO:0008074 | guanylate cyclase complex, soluble(GO:0008074) |
| 0.2 | 0.6 | GO:0000811 | GINS complex(GO:0000811) |
| 0.2 | 1.6 | GO:0000138 | Golgi trans cisterna(GO:0000138) |
| 0.2 | 1.5 | GO:0044194 | cytolytic granule(GO:0044194) |
| 0.1 | 1.8 | GO:0071204 | histone pre-mRNA 3'end processing complex(GO:0071204) |
| 0.1 | 0.6 | GO:0071821 | FANCM-MHF complex(GO:0071821) |
| 0.1 | 1.8 | GO:0070449 | elongin complex(GO:0070449) |
| 0.1 | 0.6 | GO:1990075 | periciliary membrane compartment(GO:1990075) |
| 0.1 | 2.2 | GO:0042555 | MCM complex(GO:0042555) |
| 0.1 | 0.7 | GO:0043625 | delta DNA polymerase complex(GO:0043625) |
| 0.1 | 0.7 | GO:0045293 | MIS complex(GO:0036396) mRNA editing complex(GO:0045293) |
| 0.1 | 0.7 | GO:1990604 | IRE1-TRAF2-ASK1 complex(GO:1990604) |
| 0.1 | 0.4 | GO:0031261 | nuclear pre-replicative complex(GO:0005656) DNA replication preinitiation complex(GO:0031261) pre-replicative complex(GO:0036387) |
| 0.1 | 1.3 | GO:0005664 | origin recognition complex(GO:0000808) nuclear origin of replication recognition complex(GO:0005664) |
| 0.1 | 0.3 | GO:0008278 | cohesin complex(GO:0008278) |
| 0.1 | 1.1 | GO:0001939 | female pronucleus(GO:0001939) male pronucleus(GO:0001940) |
| 0.1 | 0.3 | GO:0070685 | macropinocytic cup(GO:0070685) |
| 0.1 | 0.8 | GO:0000788 | nuclear nucleosome(GO:0000788) |
| 0.1 | 1.3 | GO:0036449 | microtubule minus-end(GO:0036449) |
| 0.1 | 0.9 | GO:0000938 | GARP complex(GO:0000938) |
| 0.1 | 1.0 | GO:0005862 | muscle thin filament tropomyosin(GO:0005862) |
| 0.1 | 0.5 | GO:0001405 | presequence translocase-associated import motor(GO:0001405) |
| 0.1 | 0.5 | GO:0071458 | integral component of cytoplasmic side of endoplasmic reticulum membrane(GO:0071458) |
| 0.1 | 2.0 | GO:0005721 | pericentric heterochromatin(GO:0005721) |
| 0.1 | 0.6 | GO:0034388 | Pwp2p-containing subcomplex of 90S preribosome(GO:0034388) |
| 0.1 | 0.6 | GO:1990452 | Parkin-FBXW7-Cul1 ubiquitin ligase complex(GO:1990452) |
| 0.1 | 0.8 | GO:0000015 | phosphopyruvate hydratase complex(GO:0000015) |
| 0.1 | 0.7 | GO:0000940 | condensed chromosome outer kinetochore(GO:0000940) |
| 0.1 | 0.5 | GO:1990357 | terminal web(GO:1990357) |
| 0.1 | 0.7 | GO:0031428 | box C/D snoRNP complex(GO:0031428) |
| 0.1 | 0.5 | GO:0005658 | alpha DNA polymerase:primase complex(GO:0005658) |
| 0.1 | 0.3 | GO:0002945 | cyclin K-CDK13 complex(GO:0002945) |
| 0.1 | 0.3 | GO:0070288 | intracellular ferritin complex(GO:0008043) ferritin complex(GO:0070288) |
| 0.1 | 0.2 | GO:0043259 | laminin-10 complex(GO:0043259) laminin-11 complex(GO:0043260) |
| 0.1 | 0.2 | GO:0030689 | Noc complex(GO:0030689) |
| 0.1 | 1.4 | GO:0030894 | replisome(GO:0030894) |
| 0.1 | 0.5 | GO:0034715 | pICln-Sm protein complex(GO:0034715) |
| 0.1 | 0.5 | GO:0030121 | AP-1 adaptor complex(GO:0030121) |
| 0.1 | 0.3 | GO:0033186 | CAF-1 complex(GO:0033186) |
| 0.1 | 0.3 | GO:0005960 | glycine cleavage complex(GO:0005960) |
| 0.1 | 1.1 | GO:0032059 | bleb(GO:0032059) |
| 0.1 | 5.2 | GO:0005876 | spindle microtubule(GO:0005876) |
| 0.1 | 0.6 | GO:0002193 | MAML1-RBP-Jkappa- ICN1 complex(GO:0002193) |
| 0.1 | 0.5 | GO:0042406 | extrinsic component of endoplasmic reticulum membrane(GO:0042406) |
| 0.1 | 0.4 | GO:0043527 | tRNA methyltransferase complex(GO:0043527) |
| 0.1 | 1.4 | GO:0036038 | MKS complex(GO:0036038) |
| 0.1 | 0.8 | GO:0005785 | signal recognition particle receptor complex(GO:0005785) |
| 0.1 | 0.4 | GO:0005851 | eukaryotic translation initiation factor 2B complex(GO:0005851) |
| 0.1 | 1.0 | GO:0044613 | nuclear pore central transport channel(GO:0044613) |
| 0.1 | 1.9 | GO:0090545 | NuRD complex(GO:0016581) CHD-type complex(GO:0090545) |
| 0.1 | 0.2 | GO:0098855 | HCN channel complex(GO:0098855) |
| 0.1 | 0.3 | GO:1990246 | uniplex complex(GO:1990246) |
| 0.1 | 0.7 | GO:0045254 | pyruvate dehydrogenase complex(GO:0045254) |
| 0.1 | 0.7 | GO:0031931 | TORC1 complex(GO:0031931) |
| 0.1 | 0.4 | GO:0072589 | box H/ACA scaRNP complex(GO:0072589) box H/ACA telomerase RNP complex(GO:0090661) |
| 0.1 | 0.9 | GO:0097539 | ciliary transition fiber(GO:0097539) |
| 0.1 | 0.8 | GO:0044815 | nucleosome(GO:0000786) DNA packaging complex(GO:0044815) |
| 0.1 | 0.3 | GO:0031262 | Ndc80 complex(GO:0031262) |
| 0.0 | 0.0 | GO:0005712 | chiasma(GO:0005712) |
| 0.0 | 0.6 | GO:0070187 | telosome(GO:0070187) |
| 0.0 | 0.2 | GO:0001652 | granular component(GO:0001652) |
| 0.0 | 0.7 | GO:0033391 | chromatoid body(GO:0033391) |
| 0.0 | 3.6 | GO:0010494 | cytoplasmic stress granule(GO:0010494) |
| 0.0 | 0.3 | GO:0016035 | zeta DNA polymerase complex(GO:0016035) |
| 0.0 | 0.4 | GO:0008282 | ATP-sensitive potassium channel complex(GO:0008282) |
| 0.0 | 0.4 | GO:0061574 | ASAP complex(GO:0061574) |
| 0.0 | 0.3 | GO:0070847 | core mediator complex(GO:0070847) |
| 0.0 | 0.1 | GO:0035370 | UBC13-UEV1A complex(GO:0035370) |
| 0.0 | 0.7 | GO:0035068 | micro-ribonucleoprotein complex(GO:0035068) |
| 0.0 | 0.9 | GO:0097225 | sperm midpiece(GO:0097225) |
| 0.0 | 0.5 | GO:0035102 | PRC1 complex(GO:0035102) |
| 0.0 | 0.4 | GO:0061202 | clathrin-sculpted gamma-aminobutyric acid transport vesicle(GO:0061200) clathrin-sculpted gamma-aminobutyric acid transport vesicle membrane(GO:0061202) |
| 0.0 | 0.2 | GO:0072534 | perineuronal net(GO:0072534) |
| 0.0 | 0.4 | GO:0036128 | CatSper complex(GO:0036128) |
| 0.0 | 1.1 | GO:0043194 | axon initial segment(GO:0043194) |
| 0.0 | 0.2 | GO:0036398 | TCR signalosome(GO:0036398) |
| 0.0 | 0.2 | GO:0033553 | rDNA heterochromatin(GO:0033553) |
| 0.0 | 0.3 | GO:0032021 | NELF complex(GO:0032021) |
| 0.0 | 0.6 | GO:0033179 | proton-transporting V-type ATPase, V0 domain(GO:0033179) |
| 0.0 | 0.4 | GO:0044327 | dendritic spine head(GO:0044327) |
| 0.0 | 0.8 | GO:0030867 | rough endoplasmic reticulum membrane(GO:0030867) |
| 0.0 | 0.3 | GO:0008290 | F-actin capping protein complex(GO:0008290) |
| 0.0 | 0.2 | GO:0070381 | endosome to plasma membrane transport vesicle(GO:0070381) |
| 0.0 | 3.9 | GO:0000779 | condensed chromosome, centromeric region(GO:0000779) |
| 0.0 | 0.2 | GO:0000408 | EKC/KEOPS complex(GO:0000408) |
| 0.0 | 0.3 | GO:0000800 | lateral element(GO:0000800) |
| 0.0 | 0.5 | GO:0030014 | CCR4-NOT complex(GO:0030014) |
| 0.0 | 0.2 | GO:0000801 | central element(GO:0000801) |
| 0.0 | 0.2 | GO:0033276 | transcription factor TFTC complex(GO:0033276) |
| 0.0 | 0.3 | GO:0098984 | neuron to neuron synapse(GO:0098984) |
| 0.0 | 0.3 | GO:0045180 | basal cortex(GO:0045180) |
| 0.0 | 0.3 | GO:0005883 | neurofilament(GO:0005883) |
| 0.0 | 0.2 | GO:0000812 | Swr1 complex(GO:0000812) |
| 0.0 | 0.3 | GO:0008541 | proteasome regulatory particle, lid subcomplex(GO:0008541) |
| 0.0 | 0.2 | GO:0017101 | aminoacyl-tRNA synthetase multienzyme complex(GO:0017101) |
| 0.0 | 1.6 | GO:0046658 | anchored component of plasma membrane(GO:0046658) |
| 0.0 | 0.4 | GO:0045275 | mitochondrial respiratory chain complex III(GO:0005750) respiratory chain complex III(GO:0045275) |
| 0.0 | 0.8 | GO:0046540 | U4/U6 x U5 tri-snRNP complex(GO:0046540) |
| 0.0 | 0.2 | GO:0090571 | RNA polymerase II transcription repressor complex(GO:0090571) |
| 0.0 | 0.9 | GO:0035861 | site of double-strand break(GO:0035861) |
| 0.0 | 1.6 | GO:0002102 | podosome(GO:0002102) |
| 0.0 | 0.3 | GO:0071541 | eukaryotic translation initiation factor 3 complex, eIF3m(GO:0071541) |
| 0.0 | 0.4 | GO:0002199 | zona pellucida receptor complex(GO:0002199) |
| 0.0 | 0.1 | GO:0097452 | GAIT complex(GO:0097452) |
| 0.0 | 2.2 | GO:0072686 | mitotic spindle(GO:0072686) |
| 0.0 | 0.2 | GO:0070775 | H3 histone acetyltransferase complex(GO:0070775) MOZ/MORF histone acetyltransferase complex(GO:0070776) |
| 0.0 | 0.9 | GO:0071782 | endoplasmic reticulum tubular network(GO:0071782) |
| 0.0 | 2.3 | GO:0005637 | nuclear inner membrane(GO:0005637) |
| 0.0 | 0.4 | GO:0030126 | COPI vesicle coat(GO:0030126) |
| 0.0 | 1.0 | GO:0035267 | NuA4 histone acetyltransferase complex(GO:0035267) H4/H2A histone acetyltransferase complex(GO:0043189) H4 histone acetyltransferase complex(GO:1902562) |
| 0.0 | 0.1 | GO:0034455 | t-UTP complex(GO:0034455) |
| 0.0 | 1.5 | GO:0048786 | presynaptic active zone(GO:0048786) |
| 0.0 | 0.1 | GO:0098554 | cytoplasmic side of endoplasmic reticulum membrane(GO:0098554) |
| 0.0 | 0.1 | GO:0071797 | LUBAC complex(GO:0071797) |
| 0.0 | 0.3 | GO:0002116 | semaphorin receptor complex(GO:0002116) |
| 0.0 | 0.5 | GO:0031045 | dense core granule(GO:0031045) |
| 0.0 | 0.6 | GO:0005849 | mRNA cleavage factor complex(GO:0005849) |
| 0.0 | 0.2 | GO:1990130 | Iml1 complex(GO:1990130) |
| 0.0 | 0.2 | GO:0000127 | transcription factor TFIIIC complex(GO:0000127) |
| 0.0 | 0.2 | GO:0061617 | MICOS complex(GO:0061617) |
| 0.0 | 0.6 | GO:0031304 | intrinsic component of mitochondrial inner membrane(GO:0031304) integral component of mitochondrial inner membrane(GO:0031305) |
| 0.0 | 0.4 | GO:0000176 | nuclear exosome (RNase complex)(GO:0000176) |
| 0.0 | 0.4 | GO:0000813 | ESCRT I complex(GO:0000813) |
| 0.0 | 0.2 | GO:0034719 | SMN-Sm protein complex(GO:0034719) |
| 0.0 | 0.1 | GO:0031501 | mannosyltransferase complex(GO:0031501) |
| 0.0 | 0.1 | GO:0036338 | viral envelope(GO:0019031) viral membrane(GO:0036338) |
| 0.0 | 0.4 | GO:0001518 | voltage-gated sodium channel complex(GO:0001518) |
| 0.0 | 0.3 | GO:1990124 | messenger ribonucleoprotein complex(GO:1990124) |
| 0.0 | 0.1 | GO:0005955 | calcineurin complex(GO:0005955) |
| 0.0 | 0.1 | GO:0034677 | integrin alpha7-beta1 complex(GO:0034677) |
| 0.0 | 0.2 | GO:0005682 | U5 snRNP(GO:0005682) |
| 0.0 | 0.4 | GO:0005885 | Arp2/3 protein complex(GO:0005885) |
| 0.0 | 0.1 | GO:0005958 | DNA-dependent protein kinase-DNA ligase 4 complex(GO:0005958) |
| 0.0 | 0.5 | GO:0035145 | exon-exon junction complex(GO:0035145) |
| 0.0 | 0.5 | GO:0005916 | fascia adherens(GO:0005916) |
| 0.0 | 0.3 | GO:0030127 | COPII vesicle coat(GO:0030127) |
| 0.0 | 0.1 | GO:0070695 | FHF complex(GO:0070695) |
| 0.0 | 0.1 | GO:0044609 | DBIRD complex(GO:0044609) |
| 0.0 | 0.2 | GO:0005587 | collagen type IV trimer(GO:0005587) |
| 0.0 | 0.3 | GO:0070822 | Sin3-type complex(GO:0070822) |
| 0.0 | 0.2 | GO:0031465 | Cul4B-RING E3 ubiquitin ligase complex(GO:0031465) |
| 0.0 | 0.5 | GO:0005865 | striated muscle thin filament(GO:0005865) |
| 0.0 | 0.1 | GO:0005713 | recombination nodule(GO:0005713) |
| 0.0 | 0.4 | GO:0090533 | cation-transporting ATPase complex(GO:0090533) |
| 0.0 | 1.2 | GO:0031201 | SNARE complex(GO:0031201) |
| 0.0 | 0.1 | GO:0033011 | perinuclear theca(GO:0033011) |
| 0.0 | 0.8 | GO:0031941 | filamentous actin(GO:0031941) |
| 0.0 | 0.4 | GO:0005666 | DNA-directed RNA polymerase III complex(GO:0005666) |
| 0.0 | 0.0 | GO:0044614 | nuclear pore cytoplasmic filaments(GO:0044614) |
| 0.0 | 0.1 | GO:0032299 | ribonuclease H2 complex(GO:0032299) |
| 0.0 | 1.3 | GO:0000775 | chromosome, centromeric region(GO:0000775) |
| 0.0 | 0.4 | GO:0034045 | pre-autophagosomal structure membrane(GO:0034045) |
| 0.0 | 0.3 | GO:0031089 | platelet dense granule lumen(GO:0031089) |
| 0.0 | 0.4 | GO:0031264 | death-inducing signaling complex(GO:0031264) |
| 0.0 | 0.0 | GO:0097526 | spliceosomal tri-snRNP complex(GO:0097526) |
| 0.0 | 0.2 | GO:0051233 | spindle midzone(GO:0051233) |
| 0.0 | 1.4 | GO:0005811 | lipid particle(GO:0005811) |
| 0.0 | 0.1 | GO:0000124 | SAGA complex(GO:0000124) |
| 0.0 | 0.9 | GO:1903293 | protein serine/threonine phosphatase complex(GO:0008287) phosphatase complex(GO:1903293) |
| 0.0 | 0.3 | GO:0001931 | uropod(GO:0001931) cell trailing edge(GO:0031254) |
| 0.0 | 0.1 | GO:0020003 | symbiont-containing vacuole(GO:0020003) |
| 0.0 | 0.2 | GO:0005641 | nuclear envelope lumen(GO:0005641) |
| 0.0 | 0.4 | GO:0030660 | Golgi-associated vesicle membrane(GO:0030660) |
| 0.0 | 0.1 | GO:1990316 | ATG1/ULK1 kinase complex(GO:1990316) |
| 0.0 | 0.0 | GO:0097504 | Gemini of coiled bodies(GO:0097504) |
| 0.0 | 0.1 | GO:0030934 | anchoring collagen complex(GO:0030934) |
| 0.0 | 0.1 | GO:0000439 | core TFIIH complex(GO:0000439) |
| 0.0 | 0.1 | GO:0005869 | dynactin complex(GO:0005869) |
| 0.0 | 0.2 | GO:0042622 | photoreceptor outer segment membrane(GO:0042622) |
| 0.0 | 0.1 | GO:0002079 | inner acrosomal membrane(GO:0002079) outer acrosomal membrane(GO:0002081) |
| 0.0 | 0.3 | GO:0005669 | transcription factor TFIID complex(GO:0005669) |
| 0.0 | 0.2 | GO:0097346 | INO80-type complex(GO:0097346) |
| 0.0 | 0.7 | GO:0000793 | condensed chromosome(GO:0000793) |
| 0.0 | 0.3 | GO:0005680 | anaphase-promoting complex(GO:0005680) |
| 0.0 | 0.1 | GO:0030688 | preribosome, small subunit precursor(GO:0030688) |
| 0.0 | 0.3 | GO:0071339 | MLL1/2 complex(GO:0044665) MLL1 complex(GO:0071339) |
Gene overrepresentation in molecular function category:
| Log-likelihood per target | Total log-likelihood | Term | Description |
|---|---|---|---|
| 0.7 | 2.2 | GO:0001716 | L-amino-acid oxidase activity(GO:0001716) |
| 0.7 | 2.1 | GO:0008294 | calcium- and calmodulin-responsive adenylate cyclase activity(GO:0008294) |
| 0.7 | 2.7 | GO:0035501 | MH1 domain binding(GO:0035501) |
| 0.7 | 2.0 | GO:0034736 | sterol O-acyltransferase activity(GO:0004772) cholesterol O-acyltransferase activity(GO:0034736) |
| 0.5 | 1.5 | GO:0030305 | heparanase activity(GO:0030305) |
| 0.5 | 1.9 | GO:0004146 | dihydrofolate reductase activity(GO:0004146) |
| 0.4 | 2.1 | GO:0016728 | ribonucleoside-diphosphate reductase activity, thioredoxin disulfide as acceptor(GO:0004748) oxidoreductase activity, acting on CH or CH2 groups, disulfide as acceptor(GO:0016728) ribonucleoside-diphosphate reductase activity(GO:0061731) |
| 0.4 | 1.9 | GO:0043515 | kinetochore binding(GO:0043515) |
| 0.4 | 1.5 | GO:0005006 | epidermal growth factor-activated receptor activity(GO:0005006) |
| 0.4 | 4.1 | GO:1990825 | sequence-specific mRNA binding(GO:1990825) |
| 0.3 | 1.0 | GO:0071207 | histone pre-mRNA stem-loop binding(GO:0071207) |
| 0.3 | 1.3 | GO:0035402 | histone kinase activity (H3-T11 specific)(GO:0035402) |
| 0.3 | 1.3 | GO:0044378 | non-sequence-specific DNA binding, bending(GO:0044378) |
| 0.3 | 1.1 | GO:0034041 | sterol-transporting ATPase activity(GO:0034041) |
| 0.3 | 1.7 | GO:0031962 | mineralocorticoid receptor binding(GO:0031962) |
| 0.3 | 0.8 | GO:0060422 | peptidyl-dipeptidase inhibitor activity(GO:0060422) |
| 0.3 | 0.8 | GO:0004639 | phosphoribosylaminoimidazole carboxylase activity(GO:0004638) phosphoribosylaminoimidazolesuccinocarboxamide synthase activity(GO:0004639) |
| 0.2 | 1.0 | GO:0070139 | ubiquitin-like protein-specific endopeptidase activity(GO:0070137) SUMO-specific endopeptidase activity(GO:0070139) |
| 0.2 | 0.9 | GO:0061628 | H3K27me3 modified histone binding(GO:0061628) |
| 0.2 | 1.1 | GO:0004965 | G-protein coupled GABA receptor activity(GO:0004965) |
| 0.2 | 0.6 | GO:0031696 | alpha-2C adrenergic receptor binding(GO:0031696) |
| 0.2 | 0.8 | GO:0008475 | procollagen-lysine 5-dioxygenase activity(GO:0008475) procollagen glucosyltransferase activity(GO:0033823) |
| 0.2 | 0.8 | GO:0004074 | biliverdin reductase activity(GO:0004074) |
| 0.2 | 0.7 | GO:0051734 | ATP-dependent polydeoxyribonucleotide 5'-hydroxyl-kinase activity(GO:0046404) polydeoxyribonucleotide kinase activity(GO:0051733) ATP-dependent polynucleotide kinase activity(GO:0051734) |
| 0.2 | 1.3 | GO:0042978 | ornithine decarboxylase activator activity(GO:0042978) |
| 0.2 | 1.1 | GO:0009378 | four-way junction helicase activity(GO:0009378) |
| 0.2 | 1.1 | GO:0016807 | cysteine-type carboxypeptidase activity(GO:0016807) cysteine-type exopeptidase activity(GO:0070004) |
| 0.2 | 0.9 | GO:0004370 | glycerol kinase activity(GO:0004370) |
| 0.2 | 0.8 | GO:0003896 | DNA primase activity(GO:0003896) |
| 0.2 | 0.7 | GO:0098808 | mRNA cap binding(GO:0098808) |
| 0.2 | 0.5 | GO:0016154 | thymidine phosphorylase activity(GO:0009032) pyrimidine-nucleoside phosphorylase activity(GO:0016154) |
| 0.2 | 0.2 | GO:0004137 | deoxycytidine kinase activity(GO:0004137) |
| 0.2 | 0.6 | GO:0004001 | adenosine kinase activity(GO:0004001) |
| 0.1 | 2.8 | GO:0009982 | pseudouridine synthase activity(GO:0009982) |
| 0.1 | 1.0 | GO:0034648 | histone demethylase activity (H3-dimethyl-K4 specific)(GO:0034648) |
| 0.1 | 2.1 | GO:0001730 | 2'-5'-oligoadenylate synthetase activity(GO:0001730) |
| 0.1 | 0.9 | GO:0003747 | translation release factor activity(GO:0003747) translation termination factor activity(GO:0008079) |
| 0.1 | 0.4 | GO:0017098 | sulfonylurea receptor binding(GO:0017098) |
| 0.1 | 4.6 | GO:0008483 | transaminase activity(GO:0008483) |
| 0.1 | 0.6 | GO:0038051 | glucocorticoid receptor activity(GO:0004883) glucocorticoid-activated RNA polymerase II transcription factor binding transcription factor activity(GO:0038051) |
| 0.1 | 2.4 | GO:0004861 | cyclin-dependent protein serine/threonine kinase inhibitor activity(GO:0004861) |
| 0.1 | 0.3 | GO:0002060 | purine nucleobase binding(GO:0002060) |
| 0.1 | 1.0 | GO:0004468 | lysine N-acetyltransferase activity, acting on acetyl phosphate as donor(GO:0004468) |
| 0.1 | 1.2 | GO:0016721 | superoxide dismutase activity(GO:0004784) oxidoreductase activity, acting on superoxide radicals as acceptor(GO:0016721) |
| 0.1 | 0.2 | GO:0051575 | 5'-deoxyribose-5-phosphate lyase activity(GO:0051575) |
| 0.1 | 1.5 | GO:0097371 | MDM2/MDM4 family protein binding(GO:0097371) |
| 0.1 | 0.8 | GO:0004797 | thymidine kinase activity(GO:0004797) |
| 0.1 | 0.4 | GO:0034046 | poly(G) binding(GO:0034046) |
| 0.1 | 0.3 | GO:0030337 | DNA polymerase processivity factor activity(GO:0030337) |
| 0.1 | 0.3 | GO:0071208 | histone pre-mRNA DCP binding(GO:0071208) |
| 0.1 | 0.9 | GO:0044547 | DNA topoisomerase binding(GO:0044547) |
| 0.1 | 0.8 | GO:0008853 | exodeoxyribonuclease III activity(GO:0008853) |
| 0.1 | 0.4 | GO:0004739 | pyruvate dehydrogenase (acetyl-transferring) activity(GO:0004739) |
| 0.1 | 0.7 | GO:0010484 | H3 histone acetyltransferase activity(GO:0010484) |
| 0.1 | 1.0 | GO:0043138 | 3'-5' DNA helicase activity(GO:0043138) |
| 0.1 | 0.6 | GO:0004366 | glycerol-3-phosphate O-acyltransferase activity(GO:0004366) |
| 0.1 | 0.8 | GO:0032217 | riboflavin transporter activity(GO:0032217) |
| 0.1 | 0.5 | GO:0008969 | phosphohistidine phosphatase activity(GO:0008969) |
| 0.1 | 0.3 | GO:0086059 | voltage-gated calcium channel activity involved SA node cell action potential(GO:0086059) |
| 0.1 | 0.5 | GO:0016971 | flavin-linked sulfhydryl oxidase activity(GO:0016971) |
| 0.1 | 1.2 | GO:0016176 | superoxide-generating NADPH oxidase activator activity(GO:0016176) |
| 0.1 | 0.6 | GO:0061575 | cyclin-dependent protein serine/threonine kinase activator activity(GO:0061575) |
| 0.1 | 0.6 | GO:0004720 | protein-lysine 6-oxidase activity(GO:0004720) |
| 0.1 | 0.3 | GO:0043139 | 5'-3' DNA helicase activity(GO:0043139) |
| 0.1 | 0.8 | GO:0048495 | Roundabout binding(GO:0048495) |
| 0.1 | 0.5 | GO:0008321 | Ral guanyl-nucleotide exchange factor activity(GO:0008321) |
| 0.1 | 1.0 | GO:0035312 | 5'-3' exodeoxyribonuclease activity(GO:0035312) |
| 0.1 | 0.7 | GO:0015186 | L-glutamine transmembrane transporter activity(GO:0015186) |
| 0.1 | 1.2 | GO:0039706 | co-receptor binding(GO:0039706) |
| 0.1 | 4.1 | GO:0004003 | ATP-dependent DNA helicase activity(GO:0004003) |
| 0.1 | 0.3 | GO:0045322 | unmethylated CpG binding(GO:0045322) |
| 0.1 | 0.4 | GO:0004800 | thyroxine 5'-deiodinase activity(GO:0004800) |
| 0.1 | 0.7 | GO:0000405 | bubble DNA binding(GO:0000405) |
| 0.1 | 0.8 | GO:0004634 | phosphopyruvate hydratase activity(GO:0004634) |
| 0.1 | 0.7 | GO:0003910 | DNA ligase (ATP) activity(GO:0003910) |
| 0.1 | 0.7 | GO:0004645 | phosphorylase activity(GO:0004645) |
| 0.1 | 2.4 | GO:0070003 | threonine-type endopeptidase activity(GO:0004298) threonine-type peptidase activity(GO:0070003) |
| 0.1 | 0.4 | GO:0044729 | hemi-methylated DNA-binding(GO:0044729) |
| 0.1 | 0.4 | GO:0033906 | hyaluronoglucuronidase activity(GO:0033906) |
| 0.1 | 1.6 | GO:0047372 | acylglycerol lipase activity(GO:0047372) |
| 0.1 | 0.5 | GO:0042500 | aspartic endopeptidase activity, intramembrane cleaving(GO:0042500) |
| 0.1 | 0.2 | GO:0005462 | UDP-N-acetylglucosamine transmembrane transporter activity(GO:0005462) |
| 0.1 | 5.5 | GO:0017080 | sodium channel regulator activity(GO:0017080) |
| 0.1 | 1.3 | GO:0032183 | SUMO binding(GO:0032183) |
| 0.1 | 0.4 | GO:0051032 | nucleic acid transmembrane transporter activity(GO:0051032) RNA transmembrane transporter activity(GO:0051033) |
| 0.1 | 2.4 | GO:0070182 | DNA polymerase binding(GO:0070182) |
| 0.1 | 1.2 | GO:0008353 | RNA polymerase II carboxy-terminal domain kinase activity(GO:0008353) |
| 0.1 | 0.4 | GO:0050610 | glutathione dehydrogenase (ascorbate) activity(GO:0045174) methylarsonate reductase activity(GO:0050610) |
| 0.1 | 0.5 | GO:0015165 | pyrimidine nucleotide-sugar transmembrane transporter activity(GO:0015165) |
| 0.1 | 0.3 | GO:0005173 | stem cell factor receptor binding(GO:0005173) |
| 0.1 | 0.1 | GO:0030622 | U4atac snRNA binding(GO:0030622) |
| 0.1 | 0.7 | GO:0004332 | fructose-bisphosphate aldolase activity(GO:0004332) |
| 0.1 | 0.5 | GO:0015349 | thyroid hormone transmembrane transporter activity(GO:0015349) |
| 0.1 | 0.4 | GO:0030346 | protein phosphatase 2B binding(GO:0030346) |
| 0.1 | 0.9 | GO:1990380 | Lys48-specific deubiquitinase activity(GO:1990380) |
| 0.1 | 0.5 | GO:0060002 | plus-end directed microfilament motor activity(GO:0060002) |
| 0.1 | 3.9 | GO:0005154 | epidermal growth factor receptor binding(GO:0005154) |
| 0.1 | 0.7 | GO:0001135 | transcription factor activity, RNA polymerase II transcription factor recruiting(GO:0001135) |
| 0.1 | 0.1 | GO:0051717 | inositol-1,3,4,5-tetrakisphosphate 3-phosphatase activity(GO:0051717) |
| 0.1 | 0.2 | GO:0008401 | retinoic acid 4-hydroxylase activity(GO:0008401) |
| 0.1 | 0.4 | GO:0004430 | 1-phosphatidylinositol 4-kinase activity(GO:0004430) |
| 0.1 | 1.2 | GO:0004143 | diacylglycerol kinase activity(GO:0004143) |
| 0.1 | 0.9 | GO:0030215 | semaphorin receptor binding(GO:0030215) |
| 0.1 | 0.2 | GO:0061769 | ribosylnicotinamide kinase activity(GO:0050262) ribosylnicotinate kinase activity(GO:0061769) |
| 0.1 | 0.7 | GO:0035374 | chondroitin sulfate binding(GO:0035374) |
| 0.1 | 1.9 | GO:0031492 | nucleosomal DNA binding(GO:0031492) |
| 0.1 | 1.5 | GO:0070403 | NAD+ binding(GO:0070403) |
| 0.1 | 0.9 | GO:0005432 | calcium:sodium antiporter activity(GO:0005432) |
| 0.1 | 0.3 | GO:0004999 | vasoactive intestinal polypeptide receptor activity(GO:0004999) |
| 0.1 | 0.3 | GO:0070568 | guanylyltransferase activity(GO:0070568) |
| 0.0 | 0.3 | GO:0034597 | phosphatidylinositol-3,4-bisphosphate 4-phosphatase activity(GO:0016316) inositol-1,3,4-trisphosphate 4-phosphatase activity(GO:0017161) phosphatidylinositol-4,5-bisphosphate 4-phosphatase activity(GO:0034597) inositol-3,4-bisphosphate 4-phosphatase activity(GO:0052828) |
| 0.0 | 0.4 | GO:0061665 | SUMO ligase activity(GO:0061665) |
| 0.0 | 0.1 | GO:0090422 | thiamine pyrophosphate transporter activity(GO:0090422) |
| 0.0 | 0.2 | GO:0070905 | serine binding(GO:0070905) |
| 0.0 | 0.2 | GO:0003953 | NAD+ nucleosidase activity(GO:0003953) |
| 0.0 | 0.2 | GO:0004329 | formate-tetrahydrofolate ligase activity(GO:0004329) methylenetetrahydrofolate dehydrogenase (NAD+) activity(GO:0004487) |
| 0.0 | 0.2 | GO:0000033 | alpha-1,3-mannosyltransferase activity(GO:0000033) |
| 0.0 | 0.1 | GO:0090631 | pre-miRNA transporter activity(GO:0090631) |
| 0.0 | 0.2 | GO:0031826 | type 2A serotonin receptor binding(GO:0031826) |
| 0.0 | 0.5 | GO:0042799 | histone methyltransferase activity (H4-K20 specific)(GO:0042799) |
| 0.0 | 0.2 | GO:0016429 | tRNA (adenine-N1-)-methyltransferase activity(GO:0016429) |
| 0.0 | 1.3 | GO:0003887 | DNA-directed DNA polymerase activity(GO:0003887) |
| 0.0 | 0.2 | GO:0055077 | gap junction hemi-channel activity(GO:0055077) |
| 0.0 | 0.4 | GO:0008297 | single-stranded DNA exodeoxyribonuclease activity(GO:0008297) |
| 0.0 | 0.1 | GO:0004584 | dolichyl-phosphate-mannose-glycolipid alpha-mannosyltransferase activity(GO:0004584) |
| 0.0 | 0.8 | GO:0019215 | intermediate filament binding(GO:0019215) |
| 0.0 | 1.3 | GO:0017056 | structural constituent of nuclear pore(GO:0017056) |
| 0.0 | 1.3 | GO:0008139 | nuclear localization sequence binding(GO:0008139) |
| 0.0 | 0.2 | GO:0035184 | histone threonine kinase activity(GO:0035184) |
| 0.0 | 0.3 | GO:0005499 | vitamin D binding(GO:0005499) |
| 0.0 | 0.2 | GO:0004740 | pyruvate dehydrogenase (acetyl-transferring) kinase activity(GO:0004740) |
| 0.0 | 0.6 | GO:0004383 | guanylate cyclase activity(GO:0004383) |
| 0.0 | 0.2 | GO:0031208 | POZ domain binding(GO:0031208) |
| 0.0 | 0.5 | GO:0003680 | AT DNA binding(GO:0003680) |
| 0.0 | 0.7 | GO:0016538 | cyclin-dependent protein serine/threonine kinase regulator activity(GO:0016538) |
| 0.0 | 0.6 | GO:0000150 | recombinase activity(GO:0000150) |
| 0.0 | 0.3 | GO:0004322 | ferroxidase activity(GO:0004322) oxidoreductase activity, oxidizing metal ions, oxygen as acceptor(GO:0016724) |
| 0.0 | 0.1 | GO:0001156 | TFIIIC-class transcription factor binding(GO:0001156) |
| 0.0 | 0.5 | GO:0005381 | iron ion transmembrane transporter activity(GO:0005381) |
| 0.0 | 0.2 | GO:0034511 | U3 snoRNA binding(GO:0034511) |
| 0.0 | 0.2 | GO:0016774 | phosphotransferase activity, carboxyl group as acceptor(GO:0016774) |
| 0.0 | 0.2 | GO:0003917 | DNA topoisomerase type I activity(GO:0003917) |
| 0.0 | 0.1 | GO:0035605 | peptidyl-cysteine S-nitrosylase activity(GO:0035605) |
| 0.0 | 0.2 | GO:0031752 | D5 dopamine receptor binding(GO:0031752) |
| 0.0 | 0.1 | GO:0003827 | alpha-1,3-mannosylglycoprotein 2-beta-N-acetylglucosaminyltransferase activity(GO:0003827) |
| 0.0 | 0.9 | GO:0045295 | gamma-catenin binding(GO:0045295) |
| 0.0 | 0.2 | GO:0004614 | phosphoglucomutase activity(GO:0004614) |
| 0.0 | 0.5 | GO:0004065 | arylsulfatase activity(GO:0004065) |
| 0.0 | 0.2 | GO:0005222 | intracellular cAMP activated cation channel activity(GO:0005222) |
| 0.0 | 0.4 | GO:0016015 | morphogen activity(GO:0016015) |
| 0.0 | 0.2 | GO:0050501 | hyaluronan synthase activity(GO:0050501) |
| 0.0 | 0.1 | GO:0003963 | RNA-3'-phosphate cyclase activity(GO:0003963) |
| 0.0 | 0.3 | GO:0047134 | protein-disulfide reductase activity(GO:0047134) |
| 0.0 | 0.1 | GO:0016979 | lipoate-protein ligase activity(GO:0016979) |
| 0.0 | 0.7 | GO:0004697 | protein kinase C activity(GO:0004697) |
| 0.0 | 0.1 | GO:0097258 | tocopherol omega-hydroxylase activity(GO:0052870) alpha-tocopherol omega-hydroxylase activity(GO:0052871) 20-hydroxy-leukotriene B4 omega oxidase activity(GO:0097258) 20-aldehyde-leukotriene B4 20-monooxygenase activity(GO:0097259) |
| 0.0 | 0.2 | GO:0004465 | lipoprotein lipase activity(GO:0004465) |
| 0.0 | 0.2 | GO:0008479 | queuine tRNA-ribosyltransferase activity(GO:0008479) |
| 0.0 | 0.2 | GO:0036033 | mediator complex binding(GO:0036033) |
| 0.0 | 1.2 | GO:0008536 | Ran GTPase binding(GO:0008536) |
| 0.0 | 0.1 | GO:0015111 | iodide transmembrane transporter activity(GO:0015111) |
| 0.0 | 0.2 | GO:0070290 | N-acylphosphatidylethanolamine-specific phospholipase D activity(GO:0070290) |
| 0.0 | 0.3 | GO:0060072 | large conductance calcium-activated potassium channel activity(GO:0060072) |
| 0.0 | 0.0 | GO:0071209 | U7 snRNA binding(GO:0071209) |
| 0.0 | 0.2 | GO:0031708 | endothelin B receptor binding(GO:0031708) |
| 0.0 | 0.2 | GO:0005052 | peroxisome matrix targeting signal-1 binding(GO:0005052) |
| 0.0 | 0.3 | GO:0035242 | protein-arginine omega-N asymmetric methyltransferase activity(GO:0035242) |
| 0.0 | 0.5 | GO:0098505 | G-rich strand telomeric DNA binding(GO:0098505) |
| 0.0 | 0.3 | GO:0004969 | histamine receptor activity(GO:0004969) |
| 0.0 | 0.1 | GO:0000386 | second spliceosomal transesterification activity(GO:0000386) |
| 0.0 | 0.2 | GO:0086083 | cell adhesive protein binding involved in bundle of His cell-Purkinje myocyte communication(GO:0086083) |
| 0.0 | 0.2 | GO:0015277 | kainate selective glutamate receptor activity(GO:0015277) |
| 0.0 | 0.2 | GO:0051373 | FATZ binding(GO:0051373) |
| 0.0 | 1.2 | GO:0031624 | ubiquitin conjugating enzyme binding(GO:0031624) |
| 0.0 | 0.1 | GO:0070087 | chromo shadow domain binding(GO:0070087) |
| 0.0 | 0.1 | GO:0047391 | alkylglycerophosphoethanolamine phosphodiesterase activity(GO:0047391) |
| 0.0 | 0.6 | GO:0102391 | decanoate--CoA ligase activity(GO:0102391) |
| 0.0 | 0.2 | GO:0003696 | satellite DNA binding(GO:0003696) |
| 0.0 | 0.2 | GO:0005497 | androgen binding(GO:0005497) |
| 0.0 | 0.1 | GO:0008821 | crossover junction endodeoxyribonuclease activity(GO:0008821) |
| 0.0 | 0.2 | GO:0030345 | extracellular matrix structural constituent conferring compression resistance(GO:0030021) structural constituent of tooth enamel(GO:0030345) |
| 0.0 | 0.2 | GO:0004359 | glutaminase activity(GO:0004359) |
| 0.0 | 0.2 | GO:0001515 | opioid peptide activity(GO:0001515) |
| 0.0 | 0.1 | GO:0004613 | phosphoenolpyruvate carboxykinase activity(GO:0004611) phosphoenolpyruvate carboxykinase (GTP) activity(GO:0004613) |
| 0.0 | 0.1 | GO:0005375 | copper ion transmembrane transporter activity(GO:0005375) |
| 0.0 | 0.4 | GO:0003951 | NAD+ kinase activity(GO:0003951) |
| 0.0 | 0.2 | GO:0050833 | pyruvate transmembrane transporter activity(GO:0050833) |
| 0.0 | 2.0 | GO:0016279 | protein-lysine N-methyltransferase activity(GO:0016279) |
| 0.0 | 0.3 | GO:0004726 | non-membrane spanning protein tyrosine phosphatase activity(GO:0004726) |
| 0.0 | 0.3 | GO:0016888 | endodeoxyribonuclease activity, producing 5'-phosphomonoesters(GO:0016888) |
| 0.0 | 0.2 | GO:0015450 | P-P-bond-hydrolysis-driven protein transmembrane transporter activity(GO:0015450) |
| 0.0 | 2.1 | GO:0050840 | extracellular matrix binding(GO:0050840) |
| 0.0 | 0.3 | GO:0003678 | DNA helicase activity(GO:0003678) |
| 0.0 | 0.2 | GO:0005047 | signal recognition particle binding(GO:0005047) |
| 0.0 | 0.5 | GO:0022841 | potassium ion leak channel activity(GO:0022841) |
| 0.0 | 0.3 | GO:0003993 | acid phosphatase activity(GO:0003993) |
| 0.0 | 0.1 | GO:0008508 | bile acid:sodium symporter activity(GO:0008508) |
| 0.0 | 0.3 | GO:0035198 | miRNA binding(GO:0035198) |
| 0.0 | 1.7 | GO:0004712 | protein serine/threonine/tyrosine kinase activity(GO:0004712) |
| 0.0 | 0.1 | GO:0031716 | calcitonin receptor binding(GO:0031716) |
| 0.0 | 0.1 | GO:0015319 | sodium:inorganic phosphate symporter activity(GO:0015319) |
| 0.0 | 0.1 | GO:0033746 | histone demethylase activity (H3-R2 specific)(GO:0033746) histone demethylase activity (H4-R3 specific)(GO:0033749) |
| 0.0 | 0.1 | GO:0061133 | endopeptidase activator activity(GO:0061133) |
| 0.0 | 0.2 | GO:0043024 | ribosomal small subunit binding(GO:0043024) |
| 0.0 | 0.2 | GO:0004865 | protein serine/threonine phosphatase inhibitor activity(GO:0004865) |
| 0.0 | 1.2 | GO:0035064 | methylated histone binding(GO:0035064) |
| 0.0 | 0.1 | GO:0050253 | retinyl-palmitate esterase activity(GO:0050253) |
| 0.0 | 0.6 | GO:0044769 | ATPase activity, coupled to transmembrane movement of ions, rotational mechanism(GO:0044769) proton-transporting ATPase activity, rotational mechanism(GO:0046961) |
| 0.0 | 0.2 | GO:0017150 | tRNA dihydrouridine synthase activity(GO:0017150) |
| 0.0 | 0.1 | GO:0004176 | ATP-dependent peptidase activity(GO:0004176) |
| 0.0 | 0.8 | GO:0070717 | poly-purine tract binding(GO:0070717) |
| 0.0 | 0.5 | GO:0008510 | sodium:bicarbonate symporter activity(GO:0008510) |
| 0.0 | 0.2 | GO:0043142 | single-stranded DNA-dependent ATPase activity(GO:0043142) |
| 0.0 | 1.5 | GO:0003727 | single-stranded RNA binding(GO:0003727) |
| 0.0 | 1.3 | GO:0001105 | RNA polymerase II transcription coactivator activity(GO:0001105) |
| 0.0 | 0.3 | GO:0042809 | vitamin D receptor binding(GO:0042809) |
| 0.0 | 0.7 | GO:0001784 | phosphotyrosine binding(GO:0001784) |
| 0.0 | 0.5 | GO:0008432 | JUN kinase binding(GO:0008432) |
| 0.0 | 6.8 | GO:0003714 | transcription corepressor activity(GO:0003714) |
| 0.0 | 0.4 | GO:0003950 | NAD+ ADP-ribosyltransferase activity(GO:0003950) |
| 0.0 | 0.3 | GO:0051434 | BH3 domain binding(GO:0051434) |
| 0.0 | 0.9 | GO:0004364 | glutathione transferase activity(GO:0004364) |
| 0.0 | 0.2 | GO:0043995 | histone acetyltransferase activity (H4-K5 specific)(GO:0043995) histone acetyltransferase activity (H4-K8 specific)(GO:0043996) histone acetyltransferase activity (H4-K16 specific)(GO:0046972) |
| 0.0 | 0.7 | GO:0004407 | histone deacetylase activity(GO:0004407) protein deacetylase activity(GO:0033558) |
| 0.0 | 0.2 | GO:0000182 | rDNA binding(GO:0000182) |
| 0.0 | 0.3 | GO:0051864 | histone demethylase activity (H3-K36 specific)(GO:0051864) |
| 0.0 | 0.1 | GO:0016802 | adenosylhomocysteinase activity(GO:0004013) trialkylsulfonium hydrolase activity(GO:0016802) |
| 0.0 | 0.1 | GO:0016868 | intramolecular transferase activity, phosphotransferases(GO:0016868) |
| 0.0 | 1.5 | GO:0002039 | p53 binding(GO:0002039) |
| 0.0 | 0.1 | GO:0015018 | galactosylgalactosylxylosylprotein 3-beta-glucuronosyltransferase activity(GO:0015018) |
| 0.0 | 0.4 | GO:0031005 | filamin binding(GO:0031005) |
| 0.0 | 0.2 | GO:0008607 | phosphorylase kinase regulator activity(GO:0008607) |
| 0.0 | 0.6 | GO:0047555 | 3',5'-cyclic-GMP phosphodiesterase activity(GO:0047555) |
| 0.0 | 0.5 | GO:0031489 | myosin V binding(GO:0031489) |
| 0.0 | 0.1 | GO:0015057 | thrombin receptor activity(GO:0015057) |
| 0.0 | 0.4 | GO:0001056 | RNA polymerase III activity(GO:0001056) |
| 0.0 | 0.2 | GO:0035252 | UDP-xylosyltransferase activity(GO:0035252) xylosyltransferase activity(GO:0042285) |
| 0.0 | 0.6 | GO:0005540 | hyaluronic acid binding(GO:0005540) |
| 0.0 | 0.1 | GO:0051011 | microtubule minus-end binding(GO:0051011) |
| 0.0 | 1.3 | GO:0097110 | scaffold protein binding(GO:0097110) |
| 0.0 | 0.1 | GO:0030144 | alpha-1,6-mannosylglycoprotein 6-beta-N-acetylglucosaminyltransferase activity(GO:0030144) |
| 0.0 | 0.6 | GO:0043015 | gamma-tubulin binding(GO:0043015) |
| 0.0 | 0.1 | GO:0070513 | death domain binding(GO:0070513) |
| 0.0 | 0.2 | GO:0032190 | acrosin binding(GO:0032190) |
| 0.0 | 0.1 | GO:0051185 | coenzyme transporter activity(GO:0051185) |
| 0.0 | 0.8 | GO:0042169 | SH2 domain binding(GO:0042169) |
| 0.0 | 0.1 | GO:0008142 | oxysterol binding(GO:0008142) |
| 0.0 | 0.6 | GO:0003785 | actin monomer binding(GO:0003785) |
| 0.0 | 0.6 | GO:0017091 | AU-rich element binding(GO:0017091) |
| 0.0 | 0.4 | GO:0003746 | translation elongation factor activity(GO:0003746) |
| 0.0 | 0.5 | GO:0042288 | MHC class I protein binding(GO:0042288) |
| 0.0 | 0.2 | GO:0004972 | NMDA glutamate receptor activity(GO:0004972) |
| 0.0 | 0.4 | GO:0050811 | GABA receptor binding(GO:0050811) |
| 0.0 | 0.1 | GO:0042392 | sphingosine-1-phosphate phosphatase activity(GO:0042392) |
| 0.0 | 0.3 | GO:0019841 | retinol binding(GO:0019841) |
| 0.0 | 0.1 | GO:0004523 | RNA-DNA hybrid ribonuclease activity(GO:0004523) |
| 0.0 | 0.3 | GO:0048185 | activin binding(GO:0048185) |
| 0.0 | 0.2 | GO:0008179 | adenylate cyclase binding(GO:0008179) |
| 0.0 | 0.3 | GO:0004862 | cAMP-dependent protein kinase inhibitor activity(GO:0004862) |
| 0.0 | 0.1 | GO:0003828 | alpha-N-acetylneuraminate alpha-2,8-sialyltransferase activity(GO:0003828) |
| 0.0 | 0.0 | GO:0044323 | retinoic acid-responsive element binding(GO:0044323) |
| 0.0 | 0.1 | GO:0003938 | IMP dehydrogenase activity(GO:0003938) |
| 0.0 | 0.6 | GO:0051721 | protein phosphatase 2A binding(GO:0051721) |
| 0.0 | 0.1 | GO:0015386 | potassium:proton antiporter activity(GO:0015386) |
| 0.0 | 1.0 | GO:0003743 | translation initiation factor activity(GO:0003743) |
| 0.0 | 0.1 | GO:0032406 | MutLbeta complex binding(GO:0032406) MutSbeta complex binding(GO:0032408) |
| 0.0 | 0.5 | GO:0043539 | protein serine/threonine kinase activator activity(GO:0043539) |
| 0.0 | 0.5 | GO:0030515 | snoRNA binding(GO:0030515) |
| 0.0 | 0.3 | GO:0004190 | aspartic-type endopeptidase activity(GO:0004190) aspartic-type peptidase activity(GO:0070001) |
| 0.0 | 0.0 | GO:0004937 | alpha1-adrenergic receptor activity(GO:0004937) |
| 0.0 | 0.7 | GO:0030170 | pyridoxal phosphate binding(GO:0030170) |
| 0.0 | 0.4 | GO:0004812 | aminoacyl-tRNA ligase activity(GO:0004812) ligase activity, forming carbon-oxygen bonds(GO:0016875) ligase activity, forming aminoacyl-tRNA and related compounds(GO:0016876) |
| 0.0 | 0.9 | GO:0005245 | voltage-gated calcium channel activity(GO:0005245) |
| 0.0 | 0.1 | GO:0005078 | MAP-kinase scaffold activity(GO:0005078) |
| 0.0 | 0.0 | GO:0001226 | RNA polymerase II transcription corepressor binding(GO:0001226) |
| 0.0 | 0.1 | GO:0016783 | sulfurtransferase activity(GO:0016783) |
| 0.0 | 0.1 | GO:0055131 | C3HC4-type RING finger domain binding(GO:0055131) |
| 0.0 | 0.2 | GO:0032050 | clathrin heavy chain binding(GO:0032050) |
| 0.0 | 0.2 | GO:0005391 | sodium:potassium-exchanging ATPase activity(GO:0005391) |
| 0.0 | 0.2 | GO:0017154 | semaphorin receptor activity(GO:0017154) |
| 0.0 | 0.4 | GO:0070273 | phosphatidylinositol-4-phosphate binding(GO:0070273) |
| 0.0 | 0.4 | GO:0042605 | peptide antigen binding(GO:0042605) |
| 0.0 | 0.1 | GO:0001609 | G-protein coupled adenosine receptor activity(GO:0001609) |
| 0.0 | 0.4 | GO:0015269 | calcium-activated potassium channel activity(GO:0015269) |
| 0.0 | 0.0 | GO:0030628 | pre-mRNA 3'-splice site binding(GO:0030628) |
| 0.0 | 0.1 | GO:0003873 | 6-phosphofructo-2-kinase activity(GO:0003873) |
| 0.0 | 0.2 | GO:0097109 | neuroligin family protein binding(GO:0097109) |
| 0.0 | 0.1 | GO:0016427 | tRNA (cytosine) methyltransferase activity(GO:0016427) |
| 0.0 | 0.8 | GO:0008026 | ATP-dependent helicase activity(GO:0008026) purine NTP-dependent helicase activity(GO:0070035) |
| 0.0 | 0.7 | GO:0051540 | iron-sulfur cluster binding(GO:0051536) metal cluster binding(GO:0051540) |
| 0.0 | 0.3 | GO:0001965 | G-protein alpha-subunit binding(GO:0001965) |
| 0.0 | 1.9 | GO:0044325 | ion channel binding(GO:0044325) |
Gene overrepresentation in curated gene sets: canonical pathways category:
| Log-likelihood per target | Total log-likelihood | Term | Description |
|---|---|---|---|
| 0.2 | 0.4 | PID SMAD2 3PATHWAY | Regulation of cytoplasmic and nuclear SMAD2/3 signaling |
| 0.1 | 2.0 | ST JAK STAT PATHWAY | Jak-STAT Pathway |
| 0.1 | 6.3 | PID FANCONI PATHWAY | Fanconi anemia pathway |
| 0.1 | 2.7 | PID LPA4 PATHWAY | LPA4-mediated signaling events |
| 0.1 | 12.4 | PID E2F PATHWAY | E2F transcription factor network |
| 0.1 | 2.5 | PID ATR PATHWAY | ATR signaling pathway |
| 0.1 | 6.2 | PID TELOMERASE PATHWAY | Regulation of Telomerase |
| 0.1 | 0.1 | ST GA12 PATHWAY | G alpha 12 Pathway |
| 0.1 | 1.3 | PID BARD1 PATHWAY | BARD1 signaling events |
| 0.1 | 0.5 | SA G1 AND S PHASES | Cdk2, 4, and 6 bind cyclin D in G1, while cdk2/cyclin E promotes the G1/S transition. |
| 0.1 | 3.3 | PID AMB2 NEUTROPHILS PATHWAY | amb2 Integrin signaling |
| 0.1 | 4.3 | PID RHOA PATHWAY | RhoA signaling pathway |
| 0.1 | 2.9 | PID AURORA B PATHWAY | Aurora B signaling |
| 0.0 | 3.9 | PID TAP63 PATHWAY | Validated transcriptional targets of TAp63 isoforms |
| 0.0 | 0.6 | PID THROMBIN PAR4 PATHWAY | PAR4-mediated thrombin signaling events |
| 0.0 | 2.8 | PID PS1 PATHWAY | Presenilin action in Notch and Wnt signaling |
| 0.0 | 1.0 | PID INTEGRIN5 PATHWAY | Beta5 beta6 beta7 and beta8 integrin cell surface interactions |
| 0.0 | 1.3 | PID HEDGEHOG 2PATHWAY | Signaling events mediated by the Hedgehog family |
| 0.0 | 1.2 | PID NFKAPPAB CANONICAL PATHWAY | Canonical NF-kappaB pathway |
| 0.0 | 1.5 | PID PI3KCI AKT PATHWAY | Class I PI3K signaling events mediated by Akt |
| 0.0 | 1.7 | PID PLK1 PATHWAY | PLK1 signaling events |
| 0.0 | 0.1 | PID WNT CANONICAL PATHWAY | Canonical Wnt signaling pathway |
| 0.0 | 0.2 | SIG INSULIN RECEPTOR PATHWAY IN CARDIAC MYOCYTES | Genes related to the insulin receptor pathway |
| 0.0 | 1.2 | PID IL12 STAT4 PATHWAY | IL12 signaling mediated by STAT4 |
| 0.0 | 0.4 | PID FOXM1 PATHWAY | FOXM1 transcription factor network |
| 0.0 | 0.7 | PID IL3 PATHWAY | IL3-mediated signaling events |
| 0.0 | 0.6 | PID SMAD2 3NUCLEAR PATHWAY | Regulation of nuclear SMAD2/3 signaling |
| 0.0 | 2.4 | PID RHOA REG PATHWAY | Regulation of RhoA activity |
| 0.0 | 1.7 | PID TRKR PATHWAY | Neurotrophic factor-mediated Trk receptor signaling |
| 0.0 | 1.7 | PID P75 NTR PATHWAY | p75(NTR)-mediated signaling |
| 0.0 | 1.1 | ST G ALPHA I PATHWAY | G alpha i Pathway |
| 0.0 | 1.1 | PID TGFBR PATHWAY | TGF-beta receptor signaling |
| 0.0 | 0.9 | PID ECADHERIN NASCENT AJ PATHWAY | E-cadherin signaling in the nascent adherens junction |
| 0.0 | 0.2 | PID EPHA2 FWD PATHWAY | EPHA2 forward signaling |
| 0.0 | 1.4 | PID CASPASE PATHWAY | Caspase cascade in apoptosis |
| 0.0 | 0.8 | PID HEDGEHOG GLI PATHWAY | Hedgehog signaling events mediated by Gli proteins |
| 0.0 | 0.2 | PID FRA PATHWAY | Validated transcriptional targets of AP1 family members Fra1 and Fra2 |
| 0.0 | 0.3 | PID ATM PATHWAY | ATM pathway |
| 0.0 | 0.6 | PID ANGIOPOIETIN RECEPTOR PATHWAY | Angiopoietin receptor Tie2-mediated signaling |
| 0.0 | 0.0 | SA TRKA RECEPTOR | The TrkA receptor binds nerve growth factor to activate MAP kinase pathways and promote cell growth. |
| 0.0 | 0.1 | SA PTEN PATHWAY | PTEN is a tumor suppressor that dephosphorylates the lipid messenger phosphatidylinositol triphosphate. |
| 0.0 | 0.3 | PID MYC PATHWAY | C-MYC pathway |
| 0.0 | 0.6 | PID HDAC CLASSI PATHWAY | Signaling events mediated by HDAC Class I |
| 0.0 | 0.7 | PID HDAC CLASSII PATHWAY | Signaling events mediated by HDAC Class II |
| 0.0 | 0.7 | PID RB 1PATHWAY | Regulation of retinoblastoma protein |
| 0.0 | 3.8 | NABA ECM REGULATORS | Genes encoding enzymes and their regulators involved in the remodeling of the extracellular matrix |
| 0.0 | 0.5 | PID AJDISS 2PATHWAY | Posttranslational regulation of adherens junction stability and dissassembly |
| 0.0 | 0.2 | PID TCPTP PATHWAY | Signaling events mediated by TCPTP |
Gene overrepresentation in curated gene sets: REACTOME pathways category:
| Log-likelihood per target | Total log-likelihood | Term | Description |
|---|---|---|---|
| 0.2 | 6.5 | REACTOME G1 S SPECIFIC TRANSCRIPTION | Genes involved in G1/S-Specific Transcription |
| 0.2 | 2.9 | REACTOME UNWINDING OF DNA | Genes involved in Unwinding of DNA |
| 0.2 | 2.5 | REACTOME ADENYLATE CYCLASE ACTIVATING PATHWAY | Genes involved in Adenylate cyclase activating pathway |
| 0.2 | 3.6 | REACTOME ACTIVATION OF THE PRE REPLICATIVE COMPLEX | Genes involved in Activation of the pre-replicative complex |
| 0.1 | 0.7 | REACTOME P53 INDEPENDENT G1 S DNA DAMAGE CHECKPOINT | Genes involved in p53-Independent G1/S DNA damage checkpoint |
| 0.1 | 1.5 | REACTOME PACKAGING OF TELOMERE ENDS | Genes involved in Packaging Of Telomere Ends |
| 0.1 | 0.1 | REACTOME NEP NS2 INTERACTS WITH THE CELLULAR EXPORT MACHINERY | Genes involved in NEP/NS2 Interacts with the Cellular Export Machinery |
| 0.1 | 3.3 | REACTOME G0 AND EARLY G1 | Genes involved in G0 and Early G1 |
| 0.1 | 4.5 | REACTOME SIGNALING BY NODAL | Genes involved in Signaling by NODAL |
| 0.1 | 2.8 | REACTOME DEPOSITION OF NEW CENPA CONTAINING NUCLEOSOMES AT THE CENTROMERE | Genes involved in Deposition of New CENPA-containing Nucleosomes at the Centromere |
| 0.1 | 1.8 | REACTOME SLBP DEPENDENT PROCESSING OF REPLICATION DEPENDENT HISTONE PRE MRNAS | Genes involved in SLBP Dependent Processing of Replication-Dependent Histone Pre-mRNAs |
| 0.1 | 1.6 | REACTOME APOPTOSIS INDUCED DNA FRAGMENTATION | Genes involved in Apoptosis induced DNA fragmentation |
| 0.1 | 0.2 | REACTOME SYNTHESIS OF PIPS AT THE LATE ENDOSOME MEMBRANE | Genes involved in Synthesis of PIPs at the late endosome membrane |
| 0.1 | 2.8 | REACTOME AMINO ACID SYNTHESIS AND INTERCONVERSION TRANSAMINATION | Genes involved in Amino acid synthesis and interconversion (transamination) |
| 0.1 | 2.1 | REACTOME HOMOLOGOUS RECOMBINATION REPAIR OF REPLICATION INDEPENDENT DOUBLE STRAND BREAKS | Genes involved in Homologous recombination repair of replication-independent double-strand breaks |
| 0.1 | 2.6 | REACTOME HS GAG DEGRADATION | Genes involved in HS-GAG degradation |
| 0.1 | 0.7 | REACTOME REMOVAL OF THE FLAP INTERMEDIATE FROM THE C STRAND | Genes involved in Removal of the Flap Intermediate from the C-strand |
| 0.1 | 1.3 | REACTOME PURINE RIBONUCLEOSIDE MONOPHOSPHATE BIOSYNTHESIS | Genes involved in Purine ribonucleoside monophosphate biosynthesis |
| 0.1 | 3.1 | REACTOME TRANSPORT OF RIBONUCLEOPROTEINS INTO THE HOST NUCLEUS | Genes involved in Transport of Ribonucleoproteins into the Host Nucleus |
| 0.1 | 1.0 | REACTOME TRAF6 MEDIATED IRF7 ACTIVATION IN TLR7 8 OR 9 SIGNALING | Genes involved in TRAF6 mediated IRF7 activation in TLR7/8 or 9 signaling |
| 0.1 | 2.1 | REACTOME DESTABILIZATION OF MRNA BY KSRP | Genes involved in Destabilization of mRNA by KSRP |
| 0.1 | 0.7 | REACTOME REGULATION OF THE FANCONI ANEMIA PATHWAY | Genes involved in Regulation of the Fanconi anemia pathway |
| 0.1 | 1.5 | REACTOME SHC1 EVENTS IN EGFR SIGNALING | Genes involved in SHC1 events in EGFR signaling |
| 0.1 | 0.2 | REACTOME ADVANCED GLYCOSYLATION ENDPRODUCT RECEPTOR SIGNALING | Genes involved in Advanced glycosylation endproduct receptor signaling |
| 0.1 | 1.3 | REACTOME CLASS C 3 METABOTROPIC GLUTAMATE PHEROMONE RECEPTORS | Genes involved in Class C/3 (Metabotropic glutamate/pheromone receptors) |
| 0.1 | 2.9 | REACTOME BMAL1 CLOCK NPAS2 ACTIVATES CIRCADIAN EXPRESSION | Genes involved in BMAL1:CLOCK/NPAS2 Activates Circadian Expression |
| 0.1 | 0.6 | REACTOME MEMBRANE BINDING AND TARGETTING OF GAG PROTEINS | Genes involved in Membrane binding and targetting of GAG proteins |
| 0.1 | 4.1 | REACTOME REGULATION OF ORNITHINE DECARBOXYLASE ODC | Genes involved in Regulation of ornithine decarboxylase (ODC) |
| 0.1 | 1.4 | REACTOME PURINE SALVAGE | Genes involved in Purine salvage |
| 0.1 | 0.3 | REACTOME IRAK2 MEDIATED ACTIVATION OF TAK1 COMPLEX UPON TLR7 8 OR 9 STIMULATION | Genes involved in IRAK2 mediated activation of TAK1 complex upon TLR7/8 or 9 stimulation |
| 0.1 | 0.5 | REACTOME SCF BETA TRCP MEDIATED DEGRADATION OF EMI1 | Genes involved in SCF-beta-TrCP mediated degradation of Emi1 |
| 0.1 | 2.5 | REACTOME MEIOTIC SYNAPSIS | Genes involved in Meiotic Synapsis |
| 0.1 | 2.5 | REACTOME EFFECTS OF PIP2 HYDROLYSIS | Genes involved in Effects of PIP2 hydrolysis |
| 0.1 | 0.2 | REACTOME THROMBOXANE SIGNALLING THROUGH TP RECEPTOR | Genes involved in Thromboxane signalling through TP receptor |
| 0.1 | 1.2 | REACTOME SYNTHESIS OF PIPS AT THE EARLY ENDOSOME MEMBRANE | Genes involved in Synthesis of PIPs at the early endosome membrane |
| 0.1 | 0.5 | REACTOME DESTABILIZATION OF MRNA BY TRISTETRAPROLIN TTP | Genes involved in Destabilization of mRNA by Tristetraprolin (TTP) |
| 0.0 | 2.3 | REACTOME G1 PHASE | Genes involved in G1 Phase |
| 0.0 | 1.3 | REACTOME FORMATION OF INCISION COMPLEX IN GG NER | Genes involved in Formation of incision complex in GG-NER |
| 0.0 | 0.1 | REACTOME SYNTHESIS SECRETION AND DEACYLATION OF GHRELIN | Genes involved in Synthesis, Secretion, and Deacylation of Ghrelin |
| 0.0 | 1.1 | REACTOME ABCA TRANSPORTERS IN LIPID HOMEOSTASIS | Genes involved in ABCA transporters in lipid homeostasis |
| 0.0 | 0.8 | REACTOME TANDEM PORE DOMAIN POTASSIUM CHANNELS | Genes involved in Tandem pore domain potassium channels |
| 0.0 | 0.2 | REACTOME RECEPTOR LIGAND BINDING INITIATES THE SECOND PROTEOLYTIC CLEAVAGE OF NOTCH RECEPTOR | Genes involved in Receptor-ligand binding initiates the second proteolytic cleavage of Notch receptor |
| 0.0 | 0.6 | REACTOME RAP1 SIGNALLING | Genes involved in Rap1 signalling |
| 0.0 | 0.7 | REACTOME PROCESSING OF CAPPED INTRONLESS PRE MRNA | Genes involved in Processing of Capped Intronless Pre-mRNA |
| 0.0 | 1.5 | REACTOME SEMA4D INDUCED CELL MIGRATION AND GROWTH CONE COLLAPSE | Genes involved in Sema4D induced cell migration and growth-cone collapse |
| 0.0 | 1.0 | REACTOME CLEAVAGE OF GROWING TRANSCRIPT IN THE TERMINATION REGION | Genes involved in Cleavage of Growing Transcript in the Termination Region |
| 0.0 | 1.1 | REACTOME INHIBITION OF THE PROTEOLYTIC ACTIVITY OF APC C REQUIRED FOR THE ONSET OF ANAPHASE BY MITOTIC SPINDLE CHECKPOINT COMPONENTS | Genes involved in Inhibition of the proteolytic activity of APC/C required for the onset of anaphase by mitotic spindle checkpoint components |
| 0.0 | 0.7 | REACTOME MTORC1 MEDIATED SIGNALLING | Genes involved in mTORC1-mediated signalling |
| 0.0 | 2.7 | REACTOME COLLAGEN FORMATION | Genes involved in Collagen formation |
| 0.0 | 0.6 | REACTOME TGF BETA RECEPTOR SIGNALING IN EMT EPITHELIAL TO MESENCHYMAL TRANSITION | Genes involved in TGF-beta receptor signaling in EMT (epithelial to mesenchymal transition) |
| 0.0 | 2.0 | REACTOME AMINO ACID TRANSPORT ACROSS THE PLASMA MEMBRANE | Genes involved in Amino acid transport across the plasma membrane |
| 0.0 | 0.7 | REACTOME NOTCH HLH TRANSCRIPTION PATHWAY | Genes involved in Notch-HLH transcription pathway |
| 0.0 | 1.0 | REACTOME FORMATION OF TUBULIN FOLDING INTERMEDIATES BY CCT TRIC | Genes involved in Formation of tubulin folding intermediates by CCT/TriC |
| 0.0 | 0.5 | REACTOME MRNA DECAY BY 5 TO 3 EXORIBONUCLEASE | Genes involved in mRNA Decay by 5' to 3' Exoribonuclease |
| 0.0 | 0.5 | REACTOME TRANSPORT OF ORGANIC ANIONS | Genes involved in Transport of organic anions |
| 0.0 | 0.5 | REACTOME THE ACTIVATION OF ARYLSULFATASES | Genes involved in The activation of arylsulfatases |
| 0.0 | 0.5 | REACTOME NEF MEDIATED DOWNREGULATION OF MHC CLASS I COMPLEX CELL SURFACE EXPRESSION | Genes involved in Nef mediated downregulation of MHC class I complex cell surface expression |
| 0.0 | 0.4 | REACTOME TELOMERE MAINTENANCE | Genes involved in Telomere Maintenance |
| 0.0 | 0.6 | REACTOME TIE2 SIGNALING | Genes involved in Tie2 Signaling |
| 0.0 | 0.3 | REACTOME TRYPTOPHAN CATABOLISM | Genes involved in Tryptophan catabolism |
| 0.0 | 0.2 | REACTOME ERKS ARE INACTIVATED | Genes involved in ERKs are inactivated |
| 0.0 | 2.3 | REACTOME MITOTIC PROMETAPHASE | Genes involved in Mitotic Prometaphase |
| 0.0 | 0.8 | REACTOME CRMPS IN SEMA3A SIGNALING | Genes involved in CRMPs in Sema3A signaling |
| 0.0 | 0.6 | REACTOME GLUCURONIDATION | Genes involved in Glucuronidation |
| 0.0 | 0.2 | REACTOME SYNTHESIS SECRETION AND INACTIVATION OF GLP1 | Genes involved in Synthesis, Secretion, and Inactivation of Glucagon-like Peptide-1 (GLP-1) |
| 0.0 | 1.6 | REACTOME NEGATIVE REGULATORS OF RIG I MDA5 SIGNALING | Genes involved in Negative regulators of RIG-I/MDA5 signaling |
| 0.0 | 1.4 | REACTOME GLUCONEOGENESIS | Genes involved in Gluconeogenesis |
| 0.0 | 0.2 | REACTOME SIGNALING BY CONSTITUTIVELY ACTIVE EGFR | Genes involved in Signaling by constitutively active EGFR |
| 0.0 | 2.5 | REACTOME INTERFERON ALPHA BETA SIGNALING | Genes involved in Interferon alpha/beta signaling |
| 0.0 | 0.4 | REACTOME METABOLISM OF POLYAMINES | Genes involved in Metabolism of polyamines |
| 0.0 | 0.2 | REACTOME CTNNB1 PHOSPHORYLATION CASCADE | Genes involved in Beta-catenin phosphorylation cascade |
| 0.0 | 2.9 | REACTOME INTEGRIN CELL SURFACE INTERACTIONS | Genes involved in Integrin cell surface interactions |
| 0.0 | 0.4 | REACTOME REGULATION OF KIT SIGNALING | Genes involved in Regulation of KIT signaling |
| 0.0 | 1.3 | REACTOME NCAM1 INTERACTIONS | Genes involved in NCAM1 interactions |
| 0.0 | 0.3 | REACTOME REGULATION OF INSULIN SECRETION BY ACETYLCHOLINE | Genes involved in Regulation of Insulin Secretion by Acetylcholine |
| 0.0 | 0.3 | REACTOME ROLE OF DCC IN REGULATING APOPTOSIS | Genes involved in Role of DCC in regulating apoptosis |
| 0.0 | 0.2 | REACTOME ROLE OF SECOND MESSENGERS IN NETRIN1 SIGNALING | Genes involved in Role of second messengers in netrin-1 signaling |
| 0.0 | 0.2 | REACTOME PRE NOTCH TRANSCRIPTION AND TRANSLATION | Genes involved in Pre-NOTCH Transcription and Translation |
| 0.0 | 0.3 | REACTOME SEROTONIN RECEPTORS | Genes involved in Serotonin receptors |
| 0.0 | 1.3 | REACTOME MITOCHONDRIAL PROTEIN IMPORT | Genes involved in Mitochondrial Protein Import |
| 0.0 | 0.2 | REACTOME CYTOSOLIC TRNA AMINOACYLATION | Genes involved in Cytosolic tRNA aminoacylation |
| 0.0 | 0.3 | REACTOME KERATAN SULFATE DEGRADATION | Genes involved in Keratan sulfate degradation |
| 0.0 | 0.4 | REACTOME AMINE DERIVED HORMONES | Genes involved in Amine-derived hormones |
| 0.0 | 0.5 | REACTOME SYNTHESIS OF GLYCOSYLPHOSPHATIDYLINOSITOL GPI | Genes involved in Synthesis of glycosylphosphatidylinositol (GPI) |
| 0.0 | 0.9 | REACTOME INWARDLY RECTIFYING K CHANNELS | Genes involved in Inwardly rectifying K+ channels |
| 0.0 | 0.3 | REACTOME SYNTHESIS OF SUBSTRATES IN N GLYCAN BIOSYTHESIS | Genes involved in Synthesis of substrates in N-glycan biosythesis |
| 0.0 | 0.2 | REACTOME CITRIC ACID CYCLE TCA CYCLE | Genes involved in Citric acid cycle (TCA cycle) |
| 0.0 | 0.6 | REACTOME PYRIMIDINE METABOLISM | Genes involved in Pyrimidine metabolism |
| 0.0 | 0.6 | REACTOME RNA POL III TRANSCRIPTION INITIATION FROM TYPE 2 PROMOTER | Genes involved in RNA Polymerase III Transcription Initiation From Type 2 Promoter |
| 0.0 | 0.4 | REACTOME HYALURONAN METABOLISM | Genes involved in Hyaluronan metabolism |
| 0.0 | 0.4 | REACTOME ANTIVIRAL MECHANISM BY IFN STIMULATED GENES | Genes involved in Antiviral mechanism by IFN-stimulated genes |
| 0.0 | 0.7 | REACTOME SMOOTH MUSCLE CONTRACTION | Genes involved in Smooth Muscle Contraction |
| 0.0 | 0.3 | REACTOME TRNA AMINOACYLATION | Genes involved in tRNA Aminoacylation |
| 0.0 | 0.3 | REACTOME DESTABILIZATION OF MRNA BY AUF1 HNRNP D0 | Genes involved in Destabilization of mRNA by AUF1 (hnRNP D0) |
| 0.0 | 0.6 | REACTOME ADHERENS JUNCTIONS INTERACTIONS | Genes involved in Adherens junctions interactions |
| 0.0 | 0.2 | REACTOME EGFR DOWNREGULATION | Genes involved in EGFR downregulation |
| 0.0 | 0.2 | REACTOME METABOLISM OF NON CODING RNA | Genes involved in Metabolism of non-coding RNA |
| 0.0 | 0.2 | REACTOME MRNA SPLICING MINOR PATHWAY | Genes involved in mRNA Splicing - Minor Pathway |
| 0.0 | 0.2 | REACTOME CTLA4 INHIBITORY SIGNALING | Genes involved in CTLA4 inhibitory signaling |
| 0.0 | 0.4 | REACTOME METAL ION SLC TRANSPORTERS | Genes involved in Metal ion SLC transporters |
| 0.0 | 0.3 | REACTOME DOWNREGULATION OF SMAD2 3 SMAD4 TRANSCRIPTIONAL ACTIVITY | Genes involved in Downregulation of SMAD2/3:SMAD4 transcriptional activity |
| 0.0 | 0.3 | REACTOME GLUCAGON TYPE LIGAND RECEPTORS | Genes involved in Glucagon-type ligand receptors |
| 0.0 | 0.6 | REACTOME NITRIC OXIDE STIMULATES GUANYLATE CYCLASE | Genes involved in Nitric oxide stimulates guanylate cyclase |
| 0.0 | 0.3 | REACTOME REGULATION OF AMPK ACTIVITY VIA LKB1 | Genes involved in Regulation of AMPK activity via LKB1 |
| 0.0 | 0.2 | REACTOME APOPTOTIC CLEAVAGE OF CELL ADHESION PROTEINS | Genes involved in Apoptotic cleavage of cell adhesion proteins |
| 0.0 | 0.2 | REACTOME OTHER SEMAPHORIN INTERACTIONS | Genes involved in Other semaphorin interactions |
| 0.0 | 0.8 | REACTOME FORMATION OF THE TERNARY COMPLEX AND SUBSEQUENTLY THE 43S COMPLEX | Genes involved in Formation of the ternary complex, and subsequently, the 43S complex |
| 0.0 | 0.3 | REACTOME CYTOSOLIC SULFONATION OF SMALL MOLECULES | Genes involved in Cytosolic sulfonation of small molecules |