Project
Inflammatory response time course, HUVEC (Wada, 2009)
Navigation
Downloads
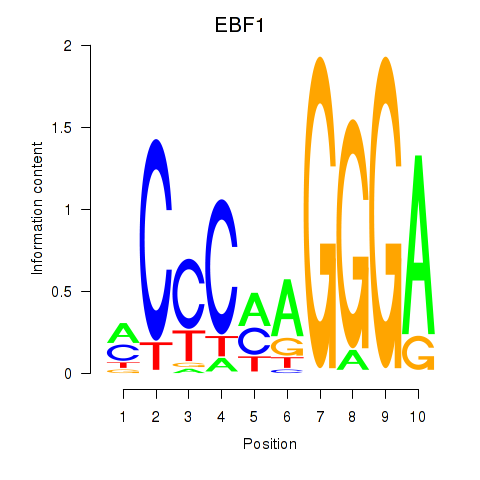
Results for EBF1
Z-value: 1.66
Motif logo
Transcription factors associated with EBF1
| Gene Symbol | Gene ID | Gene Info |
|---|---|---|
|
EBF1
|
ENSG00000164330.17 | EBF1 |
Activity-expression correlation:
| Gene | Promoter | Pearson corr. coef. | P-value | Plot |
|---|---|---|---|---|
| EBF1 | hg38_v1_chr5_-_159099684_159099698, hg38_v1_chr5_-_159099745_159099789 | 0.29 | 1.7e-01 | Click! |
Activity profile of EBF1 motif
Sorted Z-values of EBF1 motif
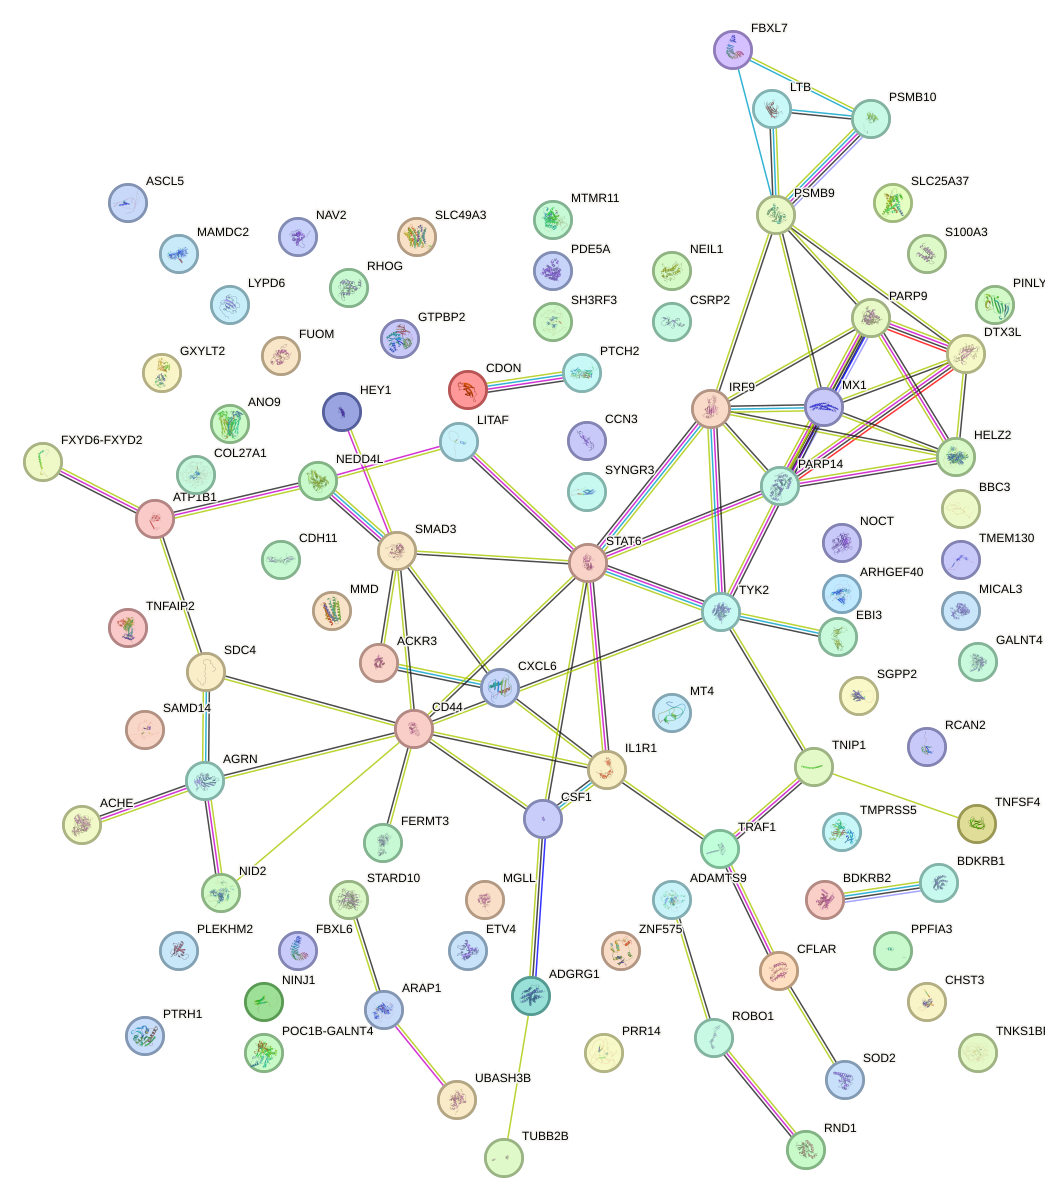
Network of associatons between targets according to the STRING database.
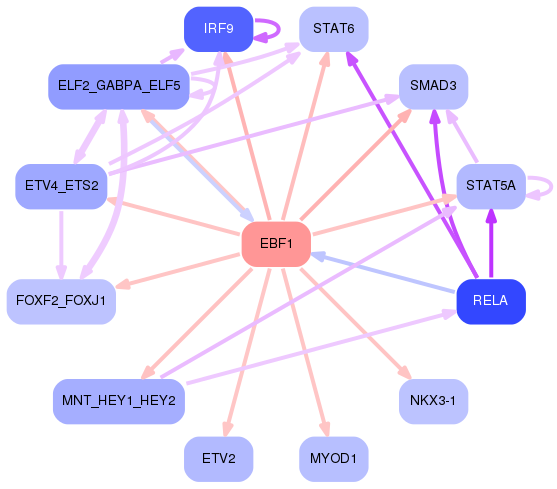
First level regulatory network of EBF1
Gene Ontology Analysis
Gene overrepresentation in biological process category:
| Log-likelihood per target | Total log-likelihood | Term | Description |
|---|---|---|---|
| 3.0 | 9.1 | GO:0048250 | mitochondrial iron ion transport(GO:0048250) |
| 1.6 | 9.7 | GO:0061767 | negative regulation of lung blood pressure(GO:0061767) |
| 1.4 | 12.9 | GO:0045084 | positive regulation of interleukin-12 biosynthetic process(GO:0045084) |
| 1.4 | 5.6 | GO:0060611 | positive regulation of odontogenesis of dentin-containing tooth(GO:0042488) mammary gland fat development(GO:0060611) positive regulation of macrophage colony-stimulating factor signaling pathway(GO:1902228) positive regulation of response to macrophage colony-stimulating factor(GO:1903971) positive regulation of cellular response to macrophage colony-stimulating factor stimulus(GO:1903974) positive regulation of microglial cell migration(GO:1904141) |
| 1.2 | 4.9 | GO:0002296 | T-helper 1 cell lineage commitment(GO:0002296) |
| 1.2 | 3.6 | GO:0036304 | umbilical cord morphogenesis(GO:0036304) umbilical cord development(GO:0061027) |
| 1.2 | 4.6 | GO:0030037 | actin filament reorganization involved in cell cycle(GO:0030037) |
| 1.1 | 2.2 | GO:0014916 | regulation of lung blood pressure(GO:0014916) |
| 1.0 | 2.9 | GO:1903281 | positive regulation of calcium:sodium antiporter activity(GO:1903281) |
| 0.9 | 3.8 | GO:2001226 | negative regulation of chloride transport(GO:2001226) |
| 0.9 | 4.7 | GO:0003069 | age-dependent response to oxidative stress(GO:0001306) age-dependent response to reactive oxygen species(GO:0001315) regulation of systemic arterial blood pressure by acetylcholine(GO:0003068) vasodilation by acetylcholine involved in regulation of systemic arterial blood pressure(GO:0003069) regulation of systemic arterial blood pressure by neurotransmitter(GO:0003070) age-dependent general metabolic decline(GO:0007571) |
| 0.8 | 3.2 | GO:0021823 | cerebral cortex tangential migration using cell-cell interactions(GO:0021823) postnatal olfactory bulb interneuron migration(GO:0021827) chemorepulsion involved in postnatal olfactory bulb interneuron migration(GO:0021836) |
| 0.8 | 3.8 | GO:1904398 | positive regulation of neuromuscular junction development(GO:1904398) |
| 0.7 | 2.2 | GO:0032223 | negative regulation of synaptic transmission, cholinergic(GO:0032223) neurotransmitter receptor biosynthetic process(GO:0045212) |
| 0.6 | 2.6 | GO:0002215 | defense response to nematode(GO:0002215) |
| 0.6 | 3.2 | GO:1903527 | positive regulation of membrane tubulation(GO:1903527) |
| 0.6 | 3.7 | GO:0003431 | growth plate cartilage chondrocyte development(GO:0003431) |
| 0.6 | 1.8 | GO:1901899 | positive regulation of relaxation of cardiac muscle(GO:1901899) |
| 0.6 | 2.3 | GO:0033590 | response to cobalamin(GO:0033590) |
| 0.6 | 1.7 | GO:2000661 | positive regulation of interleukin-1-mediated signaling pathway(GO:2000661) |
| 0.6 | 1.7 | GO:0007518 | myoblast fate determination(GO:0007518) |
| 0.5 | 1.6 | GO:0085032 | modulation of signal transduction in other organism(GO:0044501) modulation by symbiont of host signal transduction pathway(GO:0052027) modulation of signal transduction in other organism involved in symbiotic interaction(GO:0052250) modulation by symbiont of host I-kappaB kinase/NF-kappaB cascade(GO:0085032) |
| 0.5 | 1.5 | GO:0003420 | regulation of growth plate cartilage chondrocyte proliferation(GO:0003420) |
| 0.5 | 0.5 | GO:0002408 | myeloid dendritic cell chemotaxis(GO:0002408) |
| 0.5 | 5.4 | GO:1903943 | regulation of hepatocyte apoptotic process(GO:1903943) negative regulation of hepatocyte apoptotic process(GO:1903944) |
| 0.5 | 4.2 | GO:2000124 | regulation of endocannabinoid signaling pathway(GO:2000124) |
| 0.5 | 3.7 | GO:0032218 | riboflavin transport(GO:0032218) |
| 0.4 | 1.3 | GO:0008065 | establishment of blood-nerve barrier(GO:0008065) |
| 0.4 | 1.3 | GO:0016185 | synaptic vesicle budding from presynaptic endocytic zone membrane(GO:0016185) |
| 0.4 | 5.2 | GO:2001288 | positive regulation of caveolin-mediated endocytosis(GO:2001288) |
| 0.4 | 2.5 | GO:0043456 | regulation of pentose-phosphate shunt(GO:0043456) |
| 0.4 | 1.3 | GO:1903526 | negative regulation of membrane tubulation(GO:1903526) |
| 0.4 | 2.4 | GO:0060370 | susceptibility to T cell mediated cytotoxicity(GO:0060370) |
| 0.4 | 1.6 | GO:1905224 | clathrin-coated pit assembly(GO:1905224) |
| 0.4 | 3.1 | GO:0031444 | slow-twitch skeletal muscle fiber contraction(GO:0031444) |
| 0.4 | 1.1 | GO:1903969 | regulation of interleukin-4-mediated signaling pathway(GO:1902214) regulation of macrophage colony-stimulating factor signaling pathway(GO:1902226) negative regulation of macrophage colony-stimulating factor signaling pathway(GO:1902227) regulation of positive thymic T cell selection(GO:1902232) regulation of response to macrophage colony-stimulating factor(GO:1903969) negative regulation of response to macrophage colony-stimulating factor(GO:1903970) regulation of cellular response to macrophage colony-stimulating factor stimulus(GO:1903972) negative regulation of cellular response to macrophage colony-stimulating factor stimulus(GO:1903973) |
| 0.4 | 6.4 | GO:0045078 | positive regulation of interferon-gamma biosynthetic process(GO:0045078) |
| 0.4 | 1.1 | GO:0038043 | interleukin-5-mediated signaling pathway(GO:0038043) interleukin-3-mediated signaling pathway(GO:0038156) |
| 0.4 | 2.2 | GO:0003025 | regulation of systemic arterial blood pressure by baroreceptor feedback(GO:0003025) vagus nerve development(GO:0021564) |
| 0.4 | 4.4 | GO:0032782 | bile acid secretion(GO:0032782) |
| 0.4 | 1.1 | GO:0051040 | regulation of calcium-independent cell-cell adhesion(GO:0051040) corticotropin hormone secreting cell differentiation(GO:0060128) |
| 0.4 | 1.1 | GO:2000755 | regulation of phospholipid scramblase activity(GO:1900161) positive regulation of phospholipid scramblase activity(GO:1900163) regulation of glucosylceramide catabolic process(GO:2000752) positive regulation of glucosylceramide catabolic process(GO:2000753) regulation of sphingomyelin catabolic process(GO:2000754) positive regulation of sphingomyelin catabolic process(GO:2000755) |
| 0.3 | 1.3 | GO:1902568 | positive regulation of eosinophil degranulation(GO:0043311) positive regulation of eosinophil activation(GO:1902568) |
| 0.3 | 1.9 | GO:1904274 | tricellular tight junction assembly(GO:1904274) |
| 0.3 | 3.9 | GO:1900623 | regulation of monocyte aggregation(GO:1900623) positive regulation of monocyte aggregation(GO:1900625) |
| 0.3 | 1.2 | GO:0010585 | glutamine secretion(GO:0010585) L-glutamine import(GO:0036229) L-glutamine import into cell(GO:1903803) |
| 0.3 | 3.5 | GO:0055118 | negative regulation of cardiac muscle contraction(GO:0055118) |
| 0.3 | 0.3 | GO:0042271 | susceptibility to natural killer cell mediated cytotoxicity(GO:0042271) |
| 0.3 | 1.2 | GO:1990834 | response to odorant(GO:1990834) |
| 0.3 | 4.3 | GO:0003373 | dynamin polymerization involved in membrane fission(GO:0003373) dynamin polymerization involved in mitochondrial fission(GO:0003374) |
| 0.3 | 1.7 | GO:0042637 | catagen(GO:0042637) regulation of catagen(GO:0051794) |
| 0.3 | 2.0 | GO:0001712 | ectoderm formation(GO:0001705) ectodermal cell fate commitment(GO:0001712) |
| 0.3 | 1.4 | GO:0035935 | androgen secretion(GO:0035935) regulation of androgen secretion(GO:2000834) positive regulation of androgen secretion(GO:2000836) |
| 0.3 | 7.2 | GO:0071294 | cellular response to zinc ion(GO:0071294) |
| 0.3 | 1.7 | GO:0010732 | protein glutathionylation(GO:0010731) regulation of protein glutathionylation(GO:0010732) negative regulation of protein glutathionylation(GO:0010734) |
| 0.3 | 5.0 | GO:0016322 | neuron remodeling(GO:0016322) |
| 0.3 | 1.1 | GO:0006238 | CMP salvage(GO:0006238) CMP biosynthetic process(GO:0009224) CMP metabolic process(GO:0046035) |
| 0.3 | 1.6 | GO:0032468 | Golgi calcium ion homeostasis(GO:0032468) |
| 0.3 | 2.7 | GO:0070212 | protein poly-ADP-ribosylation(GO:0070212) |
| 0.3 | 9.6 | GO:0090023 | positive regulation of neutrophil chemotaxis(GO:0090023) |
| 0.3 | 0.8 | GO:0061184 | positive regulation of dermatome development(GO:0061184) |
| 0.3 | 3.8 | GO:0070257 | positive regulation of mucus secretion(GO:0070257) |
| 0.3 | 2.9 | GO:0009957 | epidermal cell fate specification(GO:0009957) |
| 0.3 | 1.8 | GO:0016344 | meiotic chromosome movement towards spindle pole(GO:0016344) |
| 0.3 | 0.8 | GO:0051232 | meiotic spindle elongation(GO:0051232) meiotic cell cycle process involved in oocyte maturation(GO:1903537) regulation of meiotic cell cycle process involved in oocyte maturation(GO:1903538) |
| 0.3 | 1.1 | GO:1901842 | negative regulation of high voltage-gated calcium channel activity(GO:1901842) |
| 0.3 | 1.3 | GO:0042360 | vitamin E metabolic process(GO:0042360) |
| 0.3 | 1.6 | GO:1903553 | positive regulation of extracellular exosome assembly(GO:1903553) |
| 0.3 | 0.8 | GO:0014724 | regulation of twitch skeletal muscle contraction(GO:0014724) regulation of fast-twitch skeletal muscle fiber contraction(GO:0031446) positive regulation of fast-twitch skeletal muscle fiber contraction(GO:0031448) |
| 0.2 | 0.5 | GO:1902031 | regulation of NADP metabolic process(GO:1902031) |
| 0.2 | 0.7 | GO:0051946 | regulation of amino acid uptake involved in synaptic transmission(GO:0051941) regulation of glutamate uptake involved in transmission of nerve impulse(GO:0051946) regulation of L-glutamate import(GO:1900920) |
| 0.2 | 3.9 | GO:0021796 | cerebral cortex regionalization(GO:0021796) |
| 0.2 | 1.2 | GO:0035106 | operant conditioning(GO:0035106) |
| 0.2 | 3.8 | GO:0045636 | positive regulation of melanocyte differentiation(GO:0045636) |
| 0.2 | 2.1 | GO:1902219 | negative regulation of intrinsic apoptotic signaling pathway in response to osmotic stress(GO:1902219) |
| 0.2 | 0.5 | GO:0006258 | UDP-glucose catabolic process(GO:0006258) |
| 0.2 | 0.7 | GO:1901165 | positive regulation of trophoblast cell migration(GO:1901165) |
| 0.2 | 0.7 | GO:0060665 | regulation of branching involved in salivary gland morphogenesis by mesenchymal-epithelial signaling(GO:0060665) |
| 0.2 | 1.6 | GO:0021957 | corticospinal tract morphogenesis(GO:0021957) |
| 0.2 | 0.9 | GO:1904640 | response to methionine(GO:1904640) |
| 0.2 | 1.4 | GO:2000158 | positive regulation of ubiquitin-specific protease activity(GO:2000158) |
| 0.2 | 0.2 | GO:0072076 | nephrogenic mesenchyme development(GO:0072076) |
| 0.2 | 0.7 | GO:0050717 | positive regulation of interleukin-1 alpha secretion(GO:0050717) |
| 0.2 | 0.9 | GO:0009443 | pyridoxal 5'-phosphate salvage(GO:0009443) |
| 0.2 | 1.1 | GO:0044027 | hypermethylation of CpG island(GO:0044027) |
| 0.2 | 0.4 | GO:1904170 | regulation of bleb assembly(GO:1904170) positive regulation of bleb assembly(GO:1904172) |
| 0.2 | 1.1 | GO:0030538 | embryonic genitalia morphogenesis(GO:0030538) |
| 0.2 | 1.0 | GO:0007406 | negative regulation of neuroblast proliferation(GO:0007406) |
| 0.2 | 1.4 | GO:0000255 | allantoin metabolic process(GO:0000255) |
| 0.2 | 2.7 | GO:0039692 | single stranded viral RNA replication via double stranded DNA intermediate(GO:0039692) |
| 0.2 | 1.4 | GO:0033504 | floor plate development(GO:0033504) |
| 0.2 | 1.4 | GO:0006154 | adenosine catabolic process(GO:0006154) inosine biosynthetic process(GO:0046103) |
| 0.2 | 0.8 | GO:0042450 | arginine biosynthetic process via ornithine(GO:0042450) |
| 0.2 | 0.8 | GO:0032747 | positive regulation of interleukin-23 production(GO:0032747) |
| 0.2 | 0.6 | GO:0042137 | sequestering of neurotransmitter(GO:0042137) |
| 0.2 | 1.0 | GO:0030035 | microspike assembly(GO:0030035) |
| 0.2 | 1.0 | GO:0072674 | multinuclear osteoclast differentiation(GO:0072674) osteoclast fusion(GO:0072675) |
| 0.2 | 1.2 | GO:2000382 | positive regulation of mesoderm development(GO:2000382) |
| 0.2 | 0.6 | GO:0002339 | B cell selection(GO:0002339) positive regulation of apoptotic DNA fragmentation(GO:1902512) |
| 0.2 | 4.1 | GO:0015812 | gamma-aminobutyric acid transport(GO:0015812) |
| 0.2 | 1.5 | GO:0042483 | negative regulation of odontogenesis(GO:0042483) |
| 0.2 | 0.6 | GO:1901877 | regulation of calcium ion binding(GO:1901876) negative regulation of calcium ion binding(GO:1901877) |
| 0.2 | 0.9 | GO:1904862 | inhibitory synapse assembly(GO:1904862) |
| 0.2 | 0.6 | GO:1901253 | negative regulation of intracellular transport of viral material(GO:1901253) |
| 0.2 | 0.7 | GO:1903936 | cellular response to sodium arsenite(GO:1903936) |
| 0.2 | 0.9 | GO:1902766 | skeletal muscle satellite cell migration(GO:1902766) |
| 0.2 | 1.1 | GO:1903385 | regulation of homophilic cell adhesion(GO:1903385) |
| 0.2 | 0.6 | GO:0035498 | carnosine metabolic process(GO:0035498) |
| 0.2 | 1.5 | GO:0034773 | histone H4-K20 trimethylation(GO:0034773) |
| 0.2 | 0.9 | GO:0090402 | oncogene-induced cell senescence(GO:0090402) |
| 0.2 | 0.5 | GO:0002378 | immunoglobulin biosynthetic process(GO:0002378) |
| 0.2 | 0.7 | GO:0090107 | regulation of high-density lipoprotein particle assembly(GO:0090107) |
| 0.2 | 0.5 | GO:0042631 | cellular response to water deprivation(GO:0042631) |
| 0.2 | 0.2 | GO:0003186 | tricuspid valve morphogenesis(GO:0003186) |
| 0.2 | 0.5 | GO:0071224 | positive regulation of antigen processing and presentation of peptide or polysaccharide antigen via MHC class II(GO:0002582) positive regulation of antigen processing and presentation of peptide antigen(GO:0002585) positive regulation of antigen processing and presentation of peptide antigen via MHC class II(GO:0002588) cellular response to peptidoglycan(GO:0071224) |
| 0.2 | 2.5 | GO:0098914 | membrane repolarization during atrial cardiac muscle cell action potential(GO:0098914) |
| 0.2 | 0.7 | GO:0009236 | cobalamin biosynthetic process(GO:0009236) |
| 0.2 | 1.2 | GO:2000254 | regulation of male germ cell proliferation(GO:2000254) |
| 0.2 | 1.6 | GO:0002051 | osteoblast fate commitment(GO:0002051) |
| 0.2 | 0.7 | GO:0045065 | cytotoxic T cell differentiation(GO:0045065) |
| 0.2 | 0.8 | GO:1903826 | arginine transmembrane transport(GO:1903826) |
| 0.2 | 0.5 | GO:1900126 | negative regulation of hyaluronan biosynthetic process(GO:1900126) |
| 0.2 | 0.5 | GO:0000103 | sulfate assimilation(GO:0000103) |
| 0.2 | 2.0 | GO:0010172 | embryonic body morphogenesis(GO:0010172) |
| 0.2 | 1.3 | GO:1900748 | positive regulation of vascular endothelial growth factor signaling pathway(GO:1900748) |
| 0.2 | 0.8 | GO:0010836 | negative regulation of protein ADP-ribosylation(GO:0010836) |
| 0.2 | 0.6 | GO:0046947 | hydroxylysine metabolic process(GO:0046946) hydroxylysine biosynthetic process(GO:0046947) |
| 0.2 | 0.5 | GO:0097473 | cellular response to light intensity(GO:0071484) cellular response to high light intensity(GO:0071486) retinal rod cell apoptotic process(GO:0097473) retinal cell apoptotic process(GO:1990009) |
| 0.2 | 0.5 | GO:1902310 | positive regulation of peptidyl-serine dephosphorylation(GO:1902310) |
| 0.2 | 3.7 | GO:0097186 | amelogenesis(GO:0097186) |
| 0.2 | 0.9 | GO:0002225 | positive regulation of antimicrobial peptide production(GO:0002225) positive regulation of antibacterial peptide production(GO:0002803) |
| 0.2 | 1.1 | GO:0045007 | depurination(GO:0045007) |
| 0.2 | 0.6 | GO:0072660 | maintenance of protein location in membrane(GO:0072658) maintenance of protein location in plasma membrane(GO:0072660) positive regulation of membrane depolarization during cardiac muscle cell action potential(GO:1900827) |
| 0.2 | 2.5 | GO:0051601 | exocyst localization(GO:0051601) |
| 0.2 | 0.9 | GO:0031438 | negative regulation of mRNA cleavage(GO:0031438) negative regulation of mRNA endonucleolytic cleavage involved in unfolded protein response(GO:1904721) |
| 0.2 | 1.4 | GO:0042699 | follicle-stimulating hormone signaling pathway(GO:0042699) |
| 0.2 | 1.1 | GO:0090074 | negative regulation of protein homodimerization activity(GO:0090074) |
| 0.2 | 3.2 | GO:0048172 | regulation of short-term neuronal synaptic plasticity(GO:0048172) |
| 0.2 | 1.4 | GO:0010265 | SCF complex assembly(GO:0010265) |
| 0.2 | 2.9 | GO:0060180 | female mating behavior(GO:0060180) |
| 0.2 | 1.2 | GO:1903300 | negative regulation of glucokinase activity(GO:0033132) negative regulation of hexokinase activity(GO:1903300) |
| 0.1 | 0.6 | GO:0003383 | apical constriction(GO:0003383) |
| 0.1 | 0.4 | GO:0048213 | Golgi vesicle prefusion complex stabilization(GO:0048213) |
| 0.1 | 1.0 | GO:0030174 | regulation of DNA-dependent DNA replication initiation(GO:0030174) |
| 0.1 | 1.6 | GO:0031119 | tRNA pseudouridine synthesis(GO:0031119) |
| 0.1 | 0.4 | GO:0035565 | regulation of pronephros size(GO:0035565) |
| 0.1 | 1.3 | GO:0002175 | protein localization to paranode region of axon(GO:0002175) |
| 0.1 | 0.3 | GO:2000793 | cell proliferation involved in heart valve development(GO:2000793) |
| 0.1 | 1.3 | GO:0060574 | intestinal epithelial cell maturation(GO:0060574) |
| 0.1 | 0.1 | GO:0010286 | heat acclimation(GO:0010286) cellular heat acclimation(GO:0070370) |
| 0.1 | 1.9 | GO:0010571 | positive regulation of nuclear cell cycle DNA replication(GO:0010571) |
| 0.1 | 0.9 | GO:0070778 | L-aspartate transport(GO:0070778) L-aspartate transmembrane transport(GO:0089712) |
| 0.1 | 1.0 | GO:0048318 | axial mesoderm development(GO:0048318) |
| 0.1 | 0.6 | GO:0044210 | 'de novo' CTP biosynthetic process(GO:0044210) |
| 0.1 | 1.4 | GO:2000823 | regulation of androgen receptor activity(GO:2000823) |
| 0.1 | 0.3 | GO:1900619 | acetylcholine metabolic process(GO:0008291) acetate ester metabolic process(GO:1900619) |
| 0.1 | 0.4 | GO:0070676 | intralumenal vesicle formation(GO:0070676) |
| 0.1 | 0.5 | GO:0010902 | positive regulation of very-low-density lipoprotein particle remodeling(GO:0010902) |
| 0.1 | 0.4 | GO:0030974 | thiamine pyrophosphate transport(GO:0030974) |
| 0.1 | 0.7 | GO:1901097 | negative regulation of autophagosome maturation(GO:1901097) |
| 0.1 | 0.8 | GO:0090022 | regulation of neutrophil chemotaxis(GO:0090022) |
| 0.1 | 1.1 | GO:0006682 | galactosylceramide biosynthetic process(GO:0006682) galactolipid biosynthetic process(GO:0019375) |
| 0.1 | 0.1 | GO:0061346 | non-canonical Wnt signaling pathway involved in heart development(GO:0061341) planar cell polarity pathway involved in heart morphogenesis(GO:0061346) |
| 0.1 | 0.8 | GO:0061762 | CAMKK-AMPK signaling cascade(GO:0061762) |
| 0.1 | 0.4 | GO:0014859 | negative regulation of skeletal muscle cell proliferation(GO:0014859) negative regulation of skeletal muscle satellite cell proliferation(GO:1902723) |
| 0.1 | 0.6 | GO:0032962 | positive regulation of inositol trisphosphate biosynthetic process(GO:0032962) |
| 0.1 | 1.3 | GO:0030210 | heparin metabolic process(GO:0030202) heparin biosynthetic process(GO:0030210) |
| 0.1 | 0.1 | GO:0002752 | cell surface pattern recognition receptor signaling pathway(GO:0002752) |
| 0.1 | 1.0 | GO:0072734 | response to staurosporine(GO:0072733) cellular response to staurosporine(GO:0072734) |
| 0.1 | 0.6 | GO:2001295 | malonyl-CoA biosynthetic process(GO:2001295) |
| 0.1 | 0.7 | GO:0071442 | positive regulation of histone H3-K14 acetylation(GO:0071442) |
| 0.1 | 1.6 | GO:1902669 | positive regulation of axon guidance(GO:1902669) |
| 0.1 | 0.7 | GO:1902731 | negative regulation of chondrocyte proliferation(GO:1902731) |
| 0.1 | 0.5 | GO:0090258 | negative regulation of mitochondrial fission(GO:0090258) |
| 0.1 | 0.4 | GO:1990086 | lens fiber cell apoptotic process(GO:1990086) |
| 0.1 | 1.9 | GO:0016540 | protein autoprocessing(GO:0016540) |
| 0.1 | 0.4 | GO:1904692 | positive regulation of type B pancreatic cell proliferation(GO:1904692) |
| 0.1 | 3.0 | GO:0006068 | ethanol catabolic process(GO:0006068) |
| 0.1 | 0.5 | GO:0003409 | optic vesicle morphogenesis(GO:0003404) optic cup structural organization(GO:0003409) |
| 0.1 | 1.2 | GO:0045542 | positive regulation of cholesterol biosynthetic process(GO:0045542) |
| 0.1 | 0.9 | GO:0036438 | maintenance of lens transparency(GO:0036438) |
| 0.1 | 0.8 | GO:1903147 | negative regulation of macromitophagy(GO:1901525) negative regulation of mitophagy(GO:1903147) |
| 0.1 | 0.3 | GO:0006532 | fumarate metabolic process(GO:0006106) aspartate biosynthetic process(GO:0006532) |
| 0.1 | 0.2 | GO:1903551 | regulation of extracellular exosome assembly(GO:1903551) |
| 0.1 | 4.2 | GO:0042347 | negative regulation of NF-kappaB import into nucleus(GO:0042347) |
| 0.1 | 1.9 | GO:0007196 | adenylate cyclase-inhibiting G-protein coupled glutamate receptor signaling pathway(GO:0007196) |
| 0.1 | 0.3 | GO:0010513 | positive regulation of phosphatidylinositol biosynthetic process(GO:0010513) |
| 0.1 | 0.9 | GO:0032287 | peripheral nervous system myelin maintenance(GO:0032287) |
| 0.1 | 1.0 | GO:1990573 | potassium ion import across plasma membrane(GO:1990573) |
| 0.1 | 0.5 | GO:1903251 | multi-ciliated epithelial cell differentiation(GO:1903251) |
| 0.1 | 0.9 | GO:0055129 | L-proline biosynthetic process(GO:0055129) |
| 0.1 | 0.4 | GO:2000297 | negative regulation of synapse maturation(GO:2000297) |
| 0.1 | 12.3 | GO:0002479 | antigen processing and presentation of exogenous peptide antigen via MHC class I, TAP-dependent(GO:0002479) |
| 0.1 | 0.3 | GO:1990481 | mRNA pseudouridine synthesis(GO:1990481) |
| 0.1 | 0.4 | GO:1904569 | regulation of selenocysteine incorporation(GO:1904569) |
| 0.1 | 0.2 | GO:0045875 | negative regulation of sister chromatid cohesion(GO:0045875) |
| 0.1 | 0.7 | GO:0060481 | lobar bronchus epithelium development(GO:0060481) |
| 0.1 | 4.8 | GO:0071711 | basement membrane organization(GO:0071711) |
| 0.1 | 0.3 | GO:1902728 | positive regulation of skeletal muscle satellite cell proliferation(GO:1902724) positive regulation of growth factor dependent skeletal muscle satellite cell proliferation(GO:1902728) |
| 0.1 | 0.1 | GO:0021784 | postganglionic parasympathetic fiber development(GO:0021784) |
| 0.1 | 0.6 | GO:0019264 | glycine biosynthetic process from serine(GO:0019264) |
| 0.1 | 0.6 | GO:1903301 | fructose 2,6-bisphosphate metabolic process(GO:0006003) positive regulation of hexokinase activity(GO:1903301) |
| 0.1 | 0.3 | GO:0032289 | central nervous system myelin formation(GO:0032289) |
| 0.1 | 1.6 | GO:0021694 | cerebellar Purkinje cell layer formation(GO:0021694) cerebellar Purkinje cell differentiation(GO:0021702) |
| 0.1 | 0.2 | GO:0021623 | oculomotor nerve morphogenesis(GO:0021622) oculomotor nerve formation(GO:0021623) |
| 0.1 | 0.2 | GO:0003419 | growth plate cartilage chondrocyte proliferation(GO:0003419) |
| 0.1 | 1.3 | GO:0060088 | auditory receptor cell stereocilium organization(GO:0060088) |
| 0.1 | 1.5 | GO:0000290 | deadenylation-dependent decapping of nuclear-transcribed mRNA(GO:0000290) |
| 0.1 | 0.3 | GO:0032808 | lacrimal gland development(GO:0032808) |
| 0.1 | 0.9 | GO:0060136 | embryonic process involved in female pregnancy(GO:0060136) |
| 0.1 | 0.8 | GO:0016560 | protein import into peroxisome matrix, docking(GO:0016560) |
| 0.1 | 0.3 | GO:0009386 | translational attenuation(GO:0009386) |
| 0.1 | 0.4 | GO:0014734 | skeletal muscle hypertrophy(GO:0014734) |
| 0.1 | 0.8 | GO:0090166 | Golgi disassembly(GO:0090166) |
| 0.1 | 0.6 | GO:0038042 | dimeric G-protein coupled receptor signaling pathway(GO:0038042) calcitonin family receptor signaling pathway(GO:0097646) amylin receptor signaling pathway(GO:0097647) |
| 0.1 | 0.8 | GO:0070995 | NADPH oxidation(GO:0070995) |
| 0.1 | 0.4 | GO:0033634 | positive regulation of cell-cell adhesion mediated by integrin(GO:0033634) |
| 0.1 | 0.2 | GO:0032304 | negative regulation of icosanoid secretion(GO:0032304) |
| 0.1 | 0.2 | GO:0043465 | fermentation(GO:0006113) regulation of fermentation(GO:0043465) regulation of NAD metabolic process(GO:1902688) |
| 0.1 | 0.8 | GO:0035469 | determination of pancreatic left/right asymmetry(GO:0035469) |
| 0.1 | 1.2 | GO:0060033 | anatomical structure regression(GO:0060033) |
| 0.1 | 0.9 | GO:0061484 | hematopoietic stem cell homeostasis(GO:0061484) |
| 0.1 | 2.7 | GO:0071420 | cellular response to histamine(GO:0071420) |
| 0.1 | 0.8 | GO:0042791 | 5S class rRNA transcription from RNA polymerase III type 1 promoter(GO:0042791) tRNA transcription from RNA polymerase III promoter(GO:0042797) |
| 0.1 | 0.4 | GO:2000983 | regulation of ATP citrate synthase activity(GO:2000983) negative regulation of ATP citrate synthase activity(GO:2000984) |
| 0.1 | 0.7 | GO:0060478 | acrosomal vesicle exocytosis(GO:0060478) |
| 0.1 | 0.3 | GO:0021898 | regulation of transcription from RNA polymerase II promoter involved in forebrain neuron fate commitment(GO:0021882) cerebral cortex GABAergic interneuron fate commitment(GO:0021893) commitment of multipotent stem cells to neuronal lineage in forebrain(GO:0021898) positive regulation of neural retina development(GO:0061075) positive regulation of retina development in camera-type eye(GO:1902868) positive regulation of amacrine cell differentiation(GO:1902871) |
| 0.1 | 0.6 | GO:0032000 | positive regulation of fatty acid beta-oxidation(GO:0032000) |
| 0.1 | 0.5 | GO:0046167 | glycerol-3-phosphate biosynthetic process(GO:0046167) |
| 0.1 | 0.4 | GO:0034344 | type III interferon production(GO:0034343) regulation of type III interferon production(GO:0034344) |
| 0.1 | 1.0 | GO:0032020 | ISG15-protein conjugation(GO:0032020) |
| 0.1 | 0.4 | GO:0061073 | ciliary body morphogenesis(GO:0061073) |
| 0.1 | 0.4 | GO:0032581 | ER-dependent peroxisome organization(GO:0032581) |
| 0.1 | 0.5 | GO:0007056 | spindle assembly involved in female meiosis(GO:0007056) |
| 0.1 | 0.5 | GO:0000965 | mitochondrial RNA 3'-end processing(GO:0000965) |
| 0.1 | 0.7 | GO:2000324 | positive regulation of glucocorticoid receptor signaling pathway(GO:2000324) |
| 0.1 | 0.5 | GO:0006931 | substrate-dependent cell migration, cell attachment to substrate(GO:0006931) |
| 0.1 | 0.7 | GO:0002943 | tRNA dihydrouridine synthesis(GO:0002943) |
| 0.1 | 0.6 | GO:0060988 | lipid tube assembly(GO:0060988) |
| 0.1 | 0.3 | GO:1902896 | terminal web assembly(GO:1902896) |
| 0.1 | 0.2 | GO:2000395 | regulation of ubiquitin-dependent endocytosis(GO:2000395) positive regulation of ubiquitin-dependent endocytosis(GO:2000397) |
| 0.1 | 0.4 | GO:0070327 | thyroid hormone transport(GO:0070327) |
| 0.1 | 0.5 | GO:0010989 | negative regulation of low-density lipoprotein particle clearance(GO:0010989) |
| 0.1 | 0.8 | GO:0043129 | surfactant homeostasis(GO:0043129) |
| 0.1 | 0.9 | GO:0071963 | establishment or maintenance of cell polarity regulating cell shape(GO:0071963) |
| 0.1 | 4.4 | GO:1901998 | toxin transport(GO:1901998) |
| 0.1 | 0.3 | GO:0009644 | response to high light intensity(GO:0009644) |
| 0.1 | 2.5 | GO:0006471 | protein ADP-ribosylation(GO:0006471) |
| 0.1 | 0.3 | GO:0014810 | positive regulation of skeletal muscle contraction by regulation of release of sequestered calcium ion(GO:0014810) |
| 0.1 | 0.2 | GO:1903238 | positive regulation of leukocyte tethering or rolling(GO:1903238) |
| 0.1 | 0.3 | GO:2000418 | positive regulation of eosinophil migration(GO:2000418) |
| 0.1 | 0.5 | GO:0006050 | mannosamine metabolic process(GO:0006050) N-acetylmannosamine metabolic process(GO:0006051) |
| 0.1 | 0.3 | GO:0017198 | N-terminal peptidyl-serine acetylation(GO:0017198) N-terminal peptidyl-glutamic acid acetylation(GO:0018002) peptidyl-serine acetylation(GO:0030920) |
| 0.1 | 0.5 | GO:0045218 | zonula adherens maintenance(GO:0045218) |
| 0.1 | 2.5 | GO:0044458 | motile cilium assembly(GO:0044458) |
| 0.1 | 0.2 | GO:0060369 | positive regulation of Fc receptor mediated stimulatory signaling pathway(GO:0060369) |
| 0.1 | 0.7 | GO:0072592 | oxygen metabolic process(GO:0072592) |
| 0.1 | 0.6 | GO:0048304 | positive regulation of isotype switching to IgG isotypes(GO:0048304) |
| 0.1 | 0.5 | GO:0034227 | tRNA thio-modification(GO:0034227) |
| 0.1 | 1.4 | GO:2000178 | negative regulation of neural precursor cell proliferation(GO:2000178) |
| 0.1 | 1.1 | GO:1900017 | positive regulation of cytokine production involved in inflammatory response(GO:1900017) |
| 0.1 | 1.4 | GO:0038003 | opioid receptor signaling pathway(GO:0038003) |
| 0.1 | 1.2 | GO:0048387 | negative regulation of retinoic acid receptor signaling pathway(GO:0048387) |
| 0.1 | 0.2 | GO:0034154 | toll-like receptor 7 signaling pathway(GO:0034154) |
| 0.1 | 0.3 | GO:0060708 | spongiotrophoblast differentiation(GO:0060708) |
| 0.1 | 0.2 | GO:0018963 | phthalate metabolic process(GO:0018963) |
| 0.1 | 0.3 | GO:0043366 | beta selection(GO:0043366) |
| 0.1 | 0.6 | GO:0001554 | luteolysis(GO:0001554) |
| 0.1 | 0.2 | GO:0090080 | positive regulation of MAPKKK cascade by fibroblast growth factor receptor signaling pathway(GO:0090080) |
| 0.1 | 0.2 | GO:0046586 | regulation of calcium-dependent cell-cell adhesion(GO:0046586) |
| 0.1 | 1.2 | GO:0006670 | sphingosine metabolic process(GO:0006670) |
| 0.1 | 1.2 | GO:2000291 | regulation of myoblast proliferation(GO:2000291) |
| 0.1 | 0.2 | GO:1904158 | axonemal central apparatus assembly(GO:1904158) |
| 0.1 | 2.9 | GO:0018146 | keratan sulfate biosynthetic process(GO:0018146) |
| 0.1 | 1.0 | GO:0030050 | vesicle transport along actin filament(GO:0030050) |
| 0.1 | 0.3 | GO:0051464 | positive regulation of cortisol secretion(GO:0051464) |
| 0.1 | 0.6 | GO:2000628 | regulation of miRNA metabolic process(GO:2000628) |
| 0.1 | 1.2 | GO:1901741 | positive regulation of myoblast fusion(GO:1901741) |
| 0.1 | 1.7 | GO:0017121 | phospholipid scrambling(GO:0017121) |
| 0.1 | 0.1 | GO:1903659 | regulation of complement-dependent cytotoxicity(GO:1903659) |
| 0.1 | 2.2 | GO:0090162 | establishment of epithelial cell polarity(GO:0090162) |
| 0.1 | 0.9 | GO:0006957 | complement activation, alternative pathway(GO:0006957) |
| 0.1 | 2.4 | GO:0031498 | chromatin disassembly(GO:0031498) |
| 0.1 | 1.1 | GO:0036315 | cellular response to sterol(GO:0036315) |
| 0.1 | 0.5 | GO:1904306 | regulation of gastro-intestinal system smooth muscle contraction(GO:1904304) positive regulation of gastro-intestinal system smooth muscle contraction(GO:1904306) |
| 0.1 | 0.5 | GO:0043587 | tongue morphogenesis(GO:0043587) |
| 0.1 | 0.4 | GO:0008218 | bioluminescence(GO:0008218) |
| 0.1 | 2.4 | GO:0031954 | positive regulation of protein autophosphorylation(GO:0031954) |
| 0.1 | 0.8 | GO:0090336 | positive regulation of brown fat cell differentiation(GO:0090336) |
| 0.1 | 0.8 | GO:2000427 | positive regulation of apoptotic cell clearance(GO:2000427) |
| 0.1 | 0.2 | GO:0046108 | uridine metabolic process(GO:0046108) |
| 0.1 | 1.3 | GO:0090331 | negative regulation of platelet aggregation(GO:0090331) |
| 0.1 | 0.2 | GO:0034729 | histone H3-K79 methylation(GO:0034729) |
| 0.1 | 3.3 | GO:0016601 | Rac protein signal transduction(GO:0016601) |
| 0.1 | 0.8 | GO:0007256 | activation of JNKK activity(GO:0007256) |
| 0.1 | 0.3 | GO:0060040 | retinal bipolar neuron differentiation(GO:0060040) |
| 0.1 | 1.5 | GO:0032780 | negative regulation of ATPase activity(GO:0032780) |
| 0.1 | 0.7 | GO:0021633 | optic nerve structural organization(GO:0021633) |
| 0.1 | 0.6 | GO:1901552 | positive regulation of endothelial cell development(GO:1901552) positive regulation of establishment of endothelial barrier(GO:1903142) |
| 0.1 | 0.5 | GO:0072502 | cellular phosphate ion homeostasis(GO:0030643) cellular trivalent inorganic anion homeostasis(GO:0072502) |
| 0.1 | 0.2 | GO:0034402 | recruitment of 3'-end processing factors to RNA polymerase II holoenzyme complex(GO:0034402) |
| 0.1 | 0.2 | GO:0003050 | regulation of systemic arterial blood pressure by atrial natriuretic peptide(GO:0003050) |
| 0.1 | 2.1 | GO:0000185 | activation of MAPKKK activity(GO:0000185) |
| 0.1 | 0.3 | GO:0046208 | spermine catabolic process(GO:0046208) |
| 0.1 | 0.2 | GO:0001923 | B-1 B cell differentiation(GO:0001923) B-1a B cell differentiation(GO:0002337) |
| 0.1 | 0.6 | GO:0097500 | receptor localization to nonmotile primary cilium(GO:0097500) |
| 0.1 | 0.3 | GO:0090156 | negative regulation of sphingolipid biosynthetic process(GO:0090155) cellular sphingolipid homeostasis(GO:0090156) negative regulation of ceramide biosynthetic process(GO:1900060) |
| 0.1 | 0.3 | GO:0061107 | seminal vesicle development(GO:0061107) |
| 0.1 | 1.0 | GO:0048742 | regulation of skeletal muscle fiber development(GO:0048742) |
| 0.1 | 0.1 | GO:1903371 | regulation of endoplasmic reticulum tubular network organization(GO:1903371) |
| 0.1 | 0.5 | GO:0021891 | olfactory bulb interneuron development(GO:0021891) |
| 0.1 | 0.2 | GO:1990022 | RNA polymerase II complex import to nucleus(GO:0044376) RNA polymerase III complex localization to nucleus(GO:1990022) |
| 0.1 | 0.2 | GO:0051410 | detoxification of nitrogen compound(GO:0051410) cellular detoxification of nitrogen compound(GO:0070458) |
| 0.1 | 0.1 | GO:0018916 | nitrobenzene metabolic process(GO:0018916) |
| 0.1 | 0.3 | GO:0071043 | CUT catabolic process(GO:0071034) CUT metabolic process(GO:0071043) |
| 0.1 | 0.2 | GO:0048867 | stem cell fate determination(GO:0048867) |
| 0.1 | 0.5 | GO:0016191 | synaptic vesicle uncoating(GO:0016191) |
| 0.1 | 0.1 | GO:0034392 | negative regulation of smooth muscle cell apoptotic process(GO:0034392) |
| 0.1 | 0.3 | GO:0034224 | cellular response to zinc ion starvation(GO:0034224) |
| 0.1 | 0.7 | GO:0086024 | adrenergic receptor signaling pathway involved in positive regulation of heart rate(GO:0086024) |
| 0.1 | 0.3 | GO:0080154 | regulation of fertilization(GO:0080154) |
| 0.1 | 0.1 | GO:0090427 | activation of meiosis(GO:0090427) |
| 0.1 | 0.8 | GO:1900029 | positive regulation of ruffle assembly(GO:1900029) |
| 0.1 | 0.5 | GO:0072553 | terminal button organization(GO:0072553) |
| 0.1 | 0.8 | GO:0019344 | cysteine biosynthetic process(GO:0019344) |
| 0.1 | 1.1 | GO:0030277 | maintenance of gastrointestinal epithelium(GO:0030277) |
| 0.1 | 0.6 | GO:0002911 | lymphocyte anergy(GO:0002249) regulation of T cell anergy(GO:0002667) T cell anergy(GO:0002870) regulation of lymphocyte anergy(GO:0002911) |
| 0.1 | 0.1 | GO:0001994 | norepinephrine-epinephrine vasoconstriction involved in regulation of systemic arterial blood pressure(GO:0001994) |
| 0.1 | 0.4 | GO:0071830 | chylomicron remnant clearance(GO:0034382) triglyceride-rich lipoprotein particle clearance(GO:0071830) |
| 0.1 | 0.4 | GO:0033632 | regulation of cell-cell adhesion mediated by integrin(GO:0033632) |
| 0.1 | 0.7 | GO:0030854 | positive regulation of granulocyte differentiation(GO:0030854) |
| 0.1 | 0.8 | GO:0002726 | positive regulation of T cell cytokine production(GO:0002726) |
| 0.1 | 3.6 | GO:0043486 | histone exchange(GO:0043486) |
| 0.1 | 0.3 | GO:0030644 | cellular chloride ion homeostasis(GO:0030644) |
| 0.1 | 0.1 | GO:0042998 | positive regulation of Golgi to plasma membrane protein transport(GO:0042998) |
| 0.1 | 0.3 | GO:0050747 | positive regulation of lipoprotein metabolic process(GO:0050747) |
| 0.1 | 0.3 | GO:0044571 | [2Fe-2S] cluster assembly(GO:0044571) |
| 0.1 | 0.1 | GO:0070093 | negative regulation of glucagon secretion(GO:0070093) |
| 0.1 | 0.8 | GO:0006700 | C21-steroid hormone biosynthetic process(GO:0006700) |
| 0.1 | 0.8 | GO:0035457 | cellular response to interferon-alpha(GO:0035457) |
| 0.1 | 0.2 | GO:0033037 | polysaccharide localization(GO:0033037) |
| 0.1 | 0.2 | GO:0051549 | positive regulation of keratinocyte migration(GO:0051549) |
| 0.1 | 1.9 | GO:0046475 | glycerophospholipid catabolic process(GO:0046475) |
| 0.1 | 1.1 | GO:0031581 | hemidesmosome assembly(GO:0031581) |
| 0.1 | 0.1 | GO:1902309 | regulation of peptidyl-serine dephosphorylation(GO:1902308) negative regulation of peptidyl-serine dephosphorylation(GO:1902309) |
| 0.1 | 0.2 | GO:0048875 | chemical homeostasis within a tissue(GO:0048875) |
| 0.1 | 0.5 | GO:0075525 | viral translational termination-reinitiation(GO:0075525) |
| 0.1 | 0.5 | GO:0030951 | establishment or maintenance of microtubule cytoskeleton polarity(GO:0030951) |
| 0.1 | 0.2 | GO:1902630 | regulation of membrane hyperpolarization(GO:1902630) |
| 0.1 | 0.4 | GO:1902866 | regulation of retina development in camera-type eye(GO:1902866) |
| 0.1 | 0.2 | GO:0060743 | epithelial cell maturation involved in prostate gland development(GO:0060743) |
| 0.1 | 0.2 | GO:0060022 | hard palate development(GO:0060022) |
| 0.1 | 0.7 | GO:2000543 | positive regulation of gastrulation(GO:2000543) |
| 0.1 | 0.5 | GO:0051280 | negative regulation of release of sequestered calcium ion into cytosol(GO:0051280) negative regulation of ryanodine-sensitive calcium-release channel activity(GO:0060315) |
| 0.1 | 0.2 | GO:0018199 | peptidyl-glutamine modification(GO:0018199) |
| 0.1 | 0.2 | GO:0071626 | mastication(GO:0071626) learned vocalization behavior(GO:0098583) |
| 0.1 | 0.6 | GO:0046415 | urate metabolic process(GO:0046415) |
| 0.1 | 0.3 | GO:1903265 | positive regulation of tumor necrosis factor-mediated signaling pathway(GO:1903265) |
| 0.1 | 0.1 | GO:0090666 | scaRNA localization to Cajal body(GO:0090666) |
| 0.1 | 0.8 | GO:0015810 | aspartate transport(GO:0015810) |
| 0.1 | 0.3 | GO:0014043 | negative regulation of neuron maturation(GO:0014043) |
| 0.1 | 0.2 | GO:1902162 | mRNA localization resulting in posttranscriptional regulation of gene expression(GO:0010609) platelet alpha granule organization(GO:0070889) regulation of DNA damage response, signal transduction by p53 class mediator resulting in transcription of p21 class mediator(GO:1902162) positive regulation of DNA damage response, signal transduction by p53 class mediator resulting in transcription of p21 class mediator(GO:1902164) |
| 0.1 | 0.4 | GO:0010481 | epidermal cell division(GO:0010481) regulation of epidermal cell division(GO:0010482) |
| 0.1 | 0.6 | GO:0071847 | TNFSF11-mediated signaling pathway(GO:0071847) |
| 0.1 | 0.2 | GO:0032900 | negative regulation of neurotrophin production(GO:0032900) |
| 0.1 | 0.4 | GO:0006398 | mRNA 3'-end processing by stem-loop binding and cleavage(GO:0006398) |
| 0.1 | 0.6 | GO:1900025 | negative regulation of substrate adhesion-dependent cell spreading(GO:1900025) |
| 0.1 | 0.2 | GO:0051005 | negative regulation of lipoprotein lipase activity(GO:0051005) |
| 0.1 | 0.2 | GO:1900738 | positive regulation of phospholipase C-activating G-protein coupled receptor signaling pathway(GO:1900738) |
| 0.1 | 0.3 | GO:1900118 | negative regulation of execution phase of apoptosis(GO:1900118) |
| 0.1 | 0.8 | GO:0001787 | natural killer cell proliferation(GO:0001787) |
| 0.1 | 0.5 | GO:0043951 | negative regulation of cAMP-mediated signaling(GO:0043951) |
| 0.1 | 0.3 | GO:0003065 | positive regulation of heart rate by epinephrine(GO:0003065) |
| 0.1 | 0.3 | GO:0035881 | amacrine cell differentiation(GO:0035881) |
| 0.1 | 0.2 | GO:0045876 | positive regulation of sister chromatid cohesion(GO:0045876) |
| 0.1 | 0.5 | GO:0089711 | L-glutamate transmembrane transport(GO:0089711) |
| 0.1 | 0.4 | GO:0015712 | hexose phosphate transport(GO:0015712) glucose-6-phosphate transport(GO:0015760) |
| 0.1 | 0.1 | GO:0071603 | endothelial cell-cell adhesion(GO:0071603) |
| 0.1 | 0.6 | GO:2000615 | histone H3-K9 acetylation(GO:0043970) regulation of histone H3-K9 acetylation(GO:2000615) |
| 0.1 | 2.8 | GO:0021762 | substantia nigra development(GO:0021762) |
| 0.1 | 1.1 | GO:0043508 | negative regulation of JUN kinase activity(GO:0043508) |
| 0.1 | 0.2 | GO:1900111 | spermatid nucleus elongation(GO:0007290) positive regulation of histone H3-K9 dimethylation(GO:1900111) |
| 0.1 | 2.5 | GO:0019835 | cytolysis(GO:0019835) |
| 0.1 | 1.1 | GO:0051764 | actin crosslink formation(GO:0051764) |
| 0.1 | 0.7 | GO:0002523 | leukocyte migration involved in inflammatory response(GO:0002523) |
| 0.1 | 0.5 | GO:0021684 | cerebellar granular layer formation(GO:0021684) cerebellar granule cell differentiation(GO:0021707) |
| 0.1 | 0.6 | GO:0006307 | DNA dealkylation involved in DNA repair(GO:0006307) |
| 0.1 | 0.3 | GO:0002074 | extraocular skeletal muscle development(GO:0002074) |
| 0.1 | 0.7 | GO:0036158 | outer dynein arm assembly(GO:0036158) |
| 0.0 | 0.1 | GO:0003095 | pressure natriuresis(GO:0003095) |
| 0.0 | 0.6 | GO:0048298 | positive regulation of isotype switching to IgA isotypes(GO:0048298) |
| 0.0 | 0.1 | GO:0010760 | negative regulation of macrophage chemotaxis(GO:0010760) |
| 0.0 | 0.2 | GO:0000189 | MAPK import into nucleus(GO:0000189) |
| 0.0 | 0.8 | GO:0007250 | activation of NF-kappaB-inducing kinase activity(GO:0007250) |
| 0.0 | 0.1 | GO:1900378 | positive regulation of melanin biosynthetic process(GO:0048023) positive regulation of secondary metabolite biosynthetic process(GO:1900378) |
| 0.0 | 0.6 | GO:0006268 | DNA unwinding involved in DNA replication(GO:0006268) |
| 0.0 | 0.1 | GO:1904252 | negative regulation of bile acid biosynthetic process(GO:0070858) negative regulation of bile acid metabolic process(GO:1904252) |
| 0.0 | 0.6 | GO:0019532 | oxalate transport(GO:0019532) |
| 0.0 | 0.4 | GO:0031118 | rRNA pseudouridine synthesis(GO:0031118) |
| 0.0 | 0.3 | GO:0044130 | negative regulation of growth of symbiont in host(GO:0044130) |
| 0.0 | 0.2 | GO:1904751 | positive regulation of protein localization to nucleolus(GO:1904751) |
| 0.0 | 0.3 | GO:0071394 | cellular response to testosterone stimulus(GO:0071394) |
| 0.0 | 1.4 | GO:0090200 | positive regulation of release of cytochrome c from mitochondria(GO:0090200) |
| 0.0 | 0.6 | GO:0033327 | Leydig cell differentiation(GO:0033327) |
| 0.0 | 0.3 | GO:0019060 | intracellular transport of viral protein in host cell(GO:0019060) symbiont intracellular protein transport in host(GO:0030581) intracellular protein transport in other organism involved in symbiotic interaction(GO:0051708) |
| 0.0 | 0.1 | GO:0097252 | oligodendrocyte apoptotic process(GO:0097252) negative regulation of interleukin-10 secretion(GO:2001180) |
| 0.0 | 0.2 | GO:0061092 | regulation of phospholipid translocation(GO:0061091) positive regulation of phospholipid translocation(GO:0061092) |
| 0.0 | 0.1 | GO:0044725 | chromatin reprogramming in the zygote(GO:0044725) |
| 0.0 | 0.1 | GO:0072709 | cellular response to sorbitol(GO:0072709) |
| 0.0 | 0.2 | GO:0048105 | establishment of body hair or bristle planar orientation(GO:0048104) establishment of body hair planar orientation(GO:0048105) |
| 0.0 | 0.4 | GO:0061669 | spontaneous neurotransmitter secretion(GO:0061669) spontaneous synaptic transmission(GO:0098814) |
| 0.0 | 0.4 | GO:1903012 | positive regulation of bone development(GO:1903012) |
| 0.0 | 0.4 | GO:0007207 | phospholipase C-activating G-protein coupled acetylcholine receptor signaling pathway(GO:0007207) |
| 0.0 | 0.4 | GO:0099639 | neurotransmitter receptor transport, endosome to postsynaptic membrane(GO:0098887) neurotransmitter receptor transport, endosome to plasma membrane(GO:0099639) |
| 0.0 | 0.5 | GO:0034058 | endosomal vesicle fusion(GO:0034058) |
| 0.0 | 0.4 | GO:1902525 | regulation of protein monoubiquitination(GO:1902525) |
| 0.0 | 0.7 | GO:0032703 | negative regulation of interleukin-2 production(GO:0032703) |
| 0.0 | 0.2 | GO:0006177 | GMP biosynthetic process(GO:0006177) |
| 0.0 | 2.9 | GO:0010803 | regulation of tumor necrosis factor-mediated signaling pathway(GO:0010803) |
| 0.0 | 1.6 | GO:0035338 | long-chain fatty-acyl-CoA biosynthetic process(GO:0035338) |
| 0.0 | 1.6 | GO:0043252 | sodium-independent organic anion transport(GO:0043252) |
| 0.0 | 0.6 | GO:0006705 | mineralocorticoid biosynthetic process(GO:0006705) mineralocorticoid metabolic process(GO:0008212) |
| 0.0 | 4.6 | GO:0060337 | type I interferon signaling pathway(GO:0060337) cellular response to type I interferon(GO:0071357) |
| 0.0 | 0.3 | GO:0061181 | regulation of chondrocyte development(GO:0061181) |
| 0.0 | 0.2 | GO:0009436 | glyoxylate catabolic process(GO:0009436) |
| 0.0 | 1.5 | GO:1902230 | negative regulation of intrinsic apoptotic signaling pathway in response to DNA damage(GO:1902230) |
| 0.0 | 0.1 | GO:0002019 | regulation of renal output by angiotensin(GO:0002019) |
| 0.0 | 0.1 | GO:0003218 | cardiac left ventricle formation(GO:0003218) |
| 0.0 | 0.2 | GO:1904021 | negative regulation of G-protein coupled receptor internalization(GO:1904021) |
| 0.0 | 0.1 | GO:1901069 | guanosine-containing compound catabolic process(GO:1901069) |
| 0.0 | 0.4 | GO:1900119 | positive regulation of execution phase of apoptosis(GO:1900119) |
| 0.0 | 0.3 | GO:0060576 | intestinal epithelial cell development(GO:0060576) |
| 0.0 | 0.1 | GO:0021936 | regulation of cerebellar granule cell precursor proliferation(GO:0021936) positive regulation of cerebellar granule cell precursor proliferation(GO:0021940) |
| 0.0 | 1.2 | GO:0000768 | syncytium formation by plasma membrane fusion(GO:0000768) |
| 0.0 | 0.6 | GO:0060445 | branching involved in salivary gland morphogenesis(GO:0060445) |
| 0.0 | 0.7 | GO:0021511 | spinal cord patterning(GO:0021511) |
| 0.0 | 0.1 | GO:0036414 | protein citrullination(GO:0018101) histone citrullination(GO:0036414) |
| 0.0 | 0.5 | GO:0032463 | negative regulation of protein homooligomerization(GO:0032463) |
| 0.0 | 0.4 | GO:0035435 | phosphate ion transmembrane transport(GO:0035435) |
| 0.0 | 0.5 | GO:0060155 | platelet dense granule organization(GO:0060155) |
| 0.0 | 0.2 | GO:0070269 | pyroptosis(GO:0070269) |
| 0.0 | 2.0 | GO:0061418 | regulation of transcription from RNA polymerase II promoter in response to hypoxia(GO:0061418) |
| 0.0 | 0.6 | GO:0032625 | interleukin-21 production(GO:0032625) macrophage colony-stimulating factor production(GO:0036301) interleukin-21 secretion(GO:0072619) regulation of macrophage colony-stimulating factor production(GO:1901256) |
| 0.0 | 0.3 | GO:0097267 | omega-hydroxylase P450 pathway(GO:0097267) |
| 0.0 | 0.3 | GO:0015811 | L-cystine transport(GO:0015811) |
| 0.0 | 1.3 | GO:0050832 | defense response to fungus(GO:0050832) |
| 0.0 | 1.4 | GO:1903146 | regulation of mitophagy(GO:1903146) |
| 0.0 | 0.3 | GO:0097011 | cellular response to granulocyte macrophage colony-stimulating factor stimulus(GO:0097011) response to granulocyte macrophage colony-stimulating factor(GO:0097012) |
| 0.0 | 0.3 | GO:1900112 | regulation of histone H3-K9 trimethylation(GO:1900112) |
| 0.0 | 0.1 | GO:1903438 | regulation of cytokinetic process(GO:0032954) regulation of mitotic cytokinetic process(GO:1903436) positive regulation of mitotic cytokinetic process(GO:1903438) positive regulation of mitotic cytokinesis(GO:1903490) |
| 0.0 | 0.4 | GO:0060856 | establishment of blood-brain barrier(GO:0060856) |
| 0.0 | 0.6 | GO:0030388 | fructose 1,6-bisphosphate metabolic process(GO:0030388) |
| 0.0 | 0.4 | GO:0031848 | protection from non-homologous end joining at telomere(GO:0031848) |
| 0.0 | 0.3 | GO:0046618 | drug export(GO:0046618) |
| 0.0 | 0.6 | GO:0019511 | peptidyl-proline hydroxylation(GO:0019511) |
| 0.0 | 0.2 | GO:0010814 | neuropeptide catabolic process(GO:0010813) substance P catabolic process(GO:0010814) calcitonin catabolic process(GO:0010816) endothelin maturation(GO:0034959) |
| 0.0 | 0.1 | GO:0001915 | negative regulation of T cell mediated cytotoxicity(GO:0001915) |
| 0.0 | 0.3 | GO:0045329 | carnitine biosynthetic process(GO:0045329) |
| 0.0 | 0.8 | GO:0030322 | stabilization of membrane potential(GO:0030322) |
| 0.0 | 0.3 | GO:1904350 | regulation of protein catabolic process in the vacuole(GO:1904350) positive regulation of protein catabolic process in the vacuole(GO:1904352) |
| 0.0 | 0.1 | GO:1903593 | histamine production involved in inflammatory response(GO:0002349) histamine secretion involved in inflammatory response(GO:0002441) histamine secretion by mast cell(GO:0002553) regulation of histamine secretion by mast cell(GO:1903593) |
| 0.0 | 0.6 | GO:0042136 | neurotransmitter biosynthetic process(GO:0042136) |
| 0.0 | 0.1 | GO:0090527 | actin filament reorganization(GO:0090527) |
| 0.0 | 0.1 | GO:0070105 | positive regulation of interleukin-6-mediated signaling pathway(GO:0070105) |
| 0.0 | 1.6 | GO:0070884 | regulation of calcineurin-NFAT signaling cascade(GO:0070884) |
| 0.0 | 0.6 | GO:0045745 | positive regulation of G-protein coupled receptor protein signaling pathway(GO:0045745) |
| 0.0 | 0.3 | GO:1900121 | negative regulation of receptor binding(GO:1900121) |
| 0.0 | 0.1 | GO:0031133 | regulation of axon diameter(GO:0031133) |
| 0.0 | 0.6 | GO:0006610 | ribosomal protein import into nucleus(GO:0006610) |
| 0.0 | 0.5 | GO:0010460 | positive regulation of heart rate(GO:0010460) |
| 0.0 | 0.2 | GO:0086073 | bundle of His cell-Purkinje myocyte adhesion involved in cell communication(GO:0086073) |
| 0.0 | 0.2 | GO:2000193 | positive regulation of fatty acid transport(GO:2000193) |
| 0.0 | 0.4 | GO:0071578 | zinc II ion transmembrane import(GO:0071578) |
| 0.0 | 0.2 | GO:0003352 | regulation of cilium movement(GO:0003352) |
| 0.0 | 0.1 | GO:0021794 | thalamus development(GO:0021794) |
| 0.0 | 0.0 | GO:1904058 | positive regulation of sensory perception of pain(GO:1904058) |
| 0.0 | 0.1 | GO:0071896 | protein localization to adherens junction(GO:0071896) |
| 0.0 | 0.6 | GO:0051823 | regulation of synapse structural plasticity(GO:0051823) |
| 0.0 | 0.1 | GO:0038171 | cannabinoid signaling pathway(GO:0038171) |
| 0.0 | 0.1 | GO:0034125 | regulation of MyD88-dependent toll-like receptor signaling pathway(GO:0034124) negative regulation of MyD88-dependent toll-like receptor signaling pathway(GO:0034125) |
| 0.0 | 0.3 | GO:0071763 | nuclear membrane organization(GO:0071763) |
| 0.0 | 0.2 | GO:0000492 | box C/D snoRNP assembly(GO:0000492) |
| 0.0 | 0.3 | GO:0035542 | regulation of SNARE complex assembly(GO:0035542) |
| 0.0 | 0.1 | GO:0018106 | peptidyl-histidine phosphorylation(GO:0018106) |
| 0.0 | 1.2 | GO:0090383 | phagosome acidification(GO:0090383) |
| 0.0 | 0.6 | GO:0001829 | trophectodermal cell differentiation(GO:0001829) |
| 0.0 | 0.2 | GO:0061052 | negative regulation of cell growth involved in cardiac muscle cell development(GO:0061052) |
| 0.0 | 0.6 | GO:0097264 | self proteolysis(GO:0097264) |
| 0.0 | 0.1 | GO:0032957 | inositol trisphosphate metabolic process(GO:0032957) |
| 0.0 | 0.4 | GO:0007213 | G-protein coupled acetylcholine receptor signaling pathway(GO:0007213) |
| 0.0 | 0.5 | GO:0042249 | establishment of planar polarity of embryonic epithelium(GO:0042249) |
| 0.0 | 0.1 | GO:0051029 | rRNA transport(GO:0051029) |
| 0.0 | 0.4 | GO:0035095 | behavioral response to nicotine(GO:0035095) |
| 0.0 | 0.7 | GO:0006750 | glutathione biosynthetic process(GO:0006750) |
| 0.0 | 0.1 | GO:0097167 | circadian regulation of translation(GO:0097167) |
| 0.0 | 1.4 | GO:0045600 | positive regulation of fat cell differentiation(GO:0045600) |
| 0.0 | 0.4 | GO:0035845 | photoreceptor cell outer segment organization(GO:0035845) |
| 0.0 | 0.2 | GO:0098743 | cell aggregation(GO:0098743) |
| 0.0 | 0.1 | GO:0045110 | intermediate filament bundle assembly(GO:0045110) |
| 0.0 | 0.2 | GO:0006531 | aspartate metabolic process(GO:0006531) |
| 0.0 | 2.1 | GO:0030204 | chondroitin sulfate metabolic process(GO:0030204) |
| 0.0 | 0.3 | GO:0061732 | mitochondrial acetyl-CoA biosynthetic process from pyruvate(GO:0061732) |
| 0.0 | 0.0 | GO:0031585 | regulation of inositol 1,4,5-trisphosphate-sensitive calcium-release channel activity(GO:0031585) positive regulation of inositol 1,4,5-trisphosphate-sensitive calcium-release channel activity(GO:0031587) |
| 0.0 | 0.1 | GO:0038060 | nitric oxide-cGMP-mediated signaling pathway(GO:0038060) |
| 0.0 | 1.1 | GO:2000272 | negative regulation of receptor activity(GO:2000272) |
| 0.0 | 1.1 | GO:0048791 | calcium ion-regulated exocytosis of neurotransmitter(GO:0048791) |
| 0.0 | 1.1 | GO:0071391 | cellular response to estrogen stimulus(GO:0071391) |
| 0.0 | 0.4 | GO:0090557 | establishment of endothelial intestinal barrier(GO:0090557) |
| 0.0 | 0.4 | GO:0015693 | magnesium ion transport(GO:0015693) |
| 0.0 | 0.2 | GO:0051725 | protein de-ADP-ribosylation(GO:0051725) |
| 0.0 | 0.9 | GO:0030488 | tRNA methylation(GO:0030488) |
| 0.0 | 0.1 | GO:0071205 | protein localization to juxtaparanode region of axon(GO:0071205) |
| 0.0 | 3.2 | GO:0090630 | activation of GTPase activity(GO:0090630) |
| 0.0 | 0.1 | GO:0002501 | peptide antigen assembly with MHC protein complex(GO:0002501) |
| 0.0 | 0.1 | GO:0042560 | folic acid-containing compound catabolic process(GO:0009397) pteridine-containing compound catabolic process(GO:0042560) |
| 0.0 | 0.6 | GO:0007064 | mitotic sister chromatid cohesion(GO:0007064) |
| 0.0 | 0.0 | GO:0010536 | positive regulation of activation of Janus kinase activity(GO:0010536) |
| 0.0 | 0.5 | GO:0042992 | negative regulation of transcription factor import into nucleus(GO:0042992) |
| 0.0 | 0.2 | GO:0051194 | positive regulation of cofactor metabolic process(GO:0051194) positive regulation of coenzyme metabolic process(GO:0051197) |
| 0.0 | 0.3 | GO:0032515 | negative regulation of phosphoprotein phosphatase activity(GO:0032515) |
| 0.0 | 1.3 | GO:0007157 | heterophilic cell-cell adhesion via plasma membrane cell adhesion molecules(GO:0007157) |
| 0.0 | 0.2 | GO:0070127 | tRNA aminoacylation for mitochondrial protein translation(GO:0070127) |
| 0.0 | 0.2 | GO:0045039 | protein import into mitochondrial inner membrane(GO:0045039) |
| 0.0 | 0.3 | GO:0021854 | hypothalamus development(GO:0021854) |
| 0.0 | 1.3 | GO:0016266 | O-glycan processing(GO:0016266) |
| 0.0 | 0.7 | GO:0030201 | heparan sulfate proteoglycan metabolic process(GO:0030201) |
| 0.0 | 0.1 | GO:0033033 | negative regulation of myeloid cell apoptotic process(GO:0033033) |
| 0.0 | 0.7 | GO:0070306 | lens fiber cell differentiation(GO:0070306) |
| 0.0 | 0.5 | GO:0070498 | interleukin-1-mediated signaling pathway(GO:0070498) |
| 0.0 | 0.6 | GO:1901099 | negative regulation of signal transduction in absence of ligand(GO:1901099) negative regulation of extrinsic apoptotic signaling pathway in absence of ligand(GO:2001240) |
| 0.0 | 0.2 | GO:0006741 | NADP biosynthetic process(GO:0006741) |
| 0.0 | 0.1 | GO:0001865 | NK T cell differentiation(GO:0001865) |
| 0.0 | 0.5 | GO:0000028 | ribosomal small subunit assembly(GO:0000028) |
| 0.0 | 0.2 | GO:0051798 | positive regulation of hair cycle(GO:0042635) positive regulation of hair follicle development(GO:0051798) |
| 0.0 | 0.3 | GO:0006776 | vitamin A metabolic process(GO:0006776) |
| 0.0 | 1.4 | GO:0002220 | innate immune response activating cell surface receptor signaling pathway(GO:0002220) stimulatory C-type lectin receptor signaling pathway(GO:0002223) |
| 0.0 | 0.4 | GO:0090026 | positive regulation of monocyte chemotaxis(GO:0090026) |
| 0.0 | 0.1 | GO:0015891 | iron chelate transport(GO:0015688) siderophore transport(GO:0015891) |
| 0.0 | 0.1 | GO:0051182 | coenzyme transport(GO:0051182) |
| 0.0 | 1.8 | GO:0001895 | retina homeostasis(GO:0001895) |
| 0.0 | 0.3 | GO:0001833 | inner cell mass cell proliferation(GO:0001833) |
| 0.0 | 0.1 | GO:1904578 | response to thapsigargin(GO:1904578) cellular response to thapsigargin(GO:1904579) response to hypobaric hypoxia(GO:1990910) |
| 0.0 | 0.6 | GO:0043968 | histone H2A acetylation(GO:0043968) |
| 0.0 | 0.2 | GO:0019236 | response to pheromone(GO:0019236) |
| 0.0 | 0.5 | GO:0003351 | epithelial cilium movement(GO:0003351) |
| 0.0 | 0.2 | GO:0002024 | diet induced thermogenesis(GO:0002024) |
| 0.0 | 0.3 | GO:2000622 | regulation of nuclear-transcribed mRNA catabolic process, nonsense-mediated decay(GO:2000622) negative regulation of nuclear-transcribed mRNA catabolic process, nonsense-mediated decay(GO:2000623) |
| 0.0 | 0.4 | GO:1903963 | arachidonic acid secretion(GO:0050482) arachidonate transport(GO:1903963) |
| 0.0 | 0.3 | GO:0051131 | chaperone-mediated protein complex assembly(GO:0051131) |
| 0.0 | 0.2 | GO:0002084 | protein depalmitoylation(GO:0002084) |
| 0.0 | 0.0 | GO:0060392 | negative regulation of SMAD protein import into nucleus(GO:0060392) |
| 0.0 | 0.2 | GO:0071361 | cellular response to ethanol(GO:0071361) |
| 0.0 | 0.3 | GO:0070934 | CRD-mediated mRNA stabilization(GO:0070934) |
| 0.0 | 0.2 | GO:2000311 | regulation of alpha-amino-3-hydroxy-5-methyl-4-isoxazole propionate selective glutamate receptor activity(GO:2000311) |
| 0.0 | 0.2 | GO:1904798 | regulation of core promoter binding(GO:1904796) positive regulation of core promoter binding(GO:1904798) |
| 0.0 | 0.1 | GO:0031914 | negative regulation of synaptic plasticity(GO:0031914) |
| 0.0 | 0.3 | GO:0010603 | regulation of cytoplasmic mRNA processing body assembly(GO:0010603) |
| 0.0 | 0.3 | GO:0046784 | viral mRNA export from host cell nucleus(GO:0046784) |
| 0.0 | 0.3 | GO:1901407 | regulation of phosphorylation of RNA polymerase II C-terminal domain(GO:1901407) |
| 0.0 | 0.1 | GO:0021860 | pyramidal neuron development(GO:0021860) |
| 0.0 | 0.1 | GO:0018016 | N-terminal protein amino acid methylation(GO:0006480) N-terminal peptidyl-alanine methylation(GO:0018011) N-terminal peptidyl-alanine trimethylation(GO:0018012) N-terminal peptidyl-glycine methylation(GO:0018013) N-terminal peptidyl-proline dimethylation(GO:0018016) peptidyl-alanine modification(GO:0018194) N-terminal peptidyl-proline methylation(GO:0035568) N-terminal peptidyl-serine methylation(GO:0035570) N-terminal peptidyl-serine dimethylation(GO:0035572) N-terminal peptidyl-serine trimethylation(GO:0035573) |
| 0.0 | 0.3 | GO:0007258 | JUN phosphorylation(GO:0007258) |
| 0.0 | 0.2 | GO:0048714 | positive regulation of oligodendrocyte differentiation(GO:0048714) |
| 0.0 | 0.2 | GO:0046465 | dolichyl diphosphate biosynthetic process(GO:0006489) dolichyl diphosphate metabolic process(GO:0046465) |
| 0.0 | 0.2 | GO:0006857 | oligopeptide transport(GO:0006857) |
| 0.0 | 0.1 | GO:0032439 | endosome localization(GO:0032439) |
| 0.0 | 0.1 | GO:0044789 | modulation by host of viral release from host cell(GO:0044789) positive regulation by host of viral release from host cell(GO:0044791) |
| 0.0 | 0.2 | GO:0010891 | negative regulation of sequestering of triglyceride(GO:0010891) |
| 0.0 | 0.4 | GO:0021772 | olfactory bulb development(GO:0021772) |
| 0.0 | 0.1 | GO:0006049 | UDP-N-acetylglucosamine catabolic process(GO:0006049) |
| 0.0 | 0.3 | GO:0018023 | peptidyl-lysine trimethylation(GO:0018023) |
| 0.0 | 0.5 | GO:0071435 | potassium ion export(GO:0071435) |
| 0.0 | 0.1 | GO:0097319 | fructose transport(GO:0015755) fructose import(GO:0032445) carbohydrate import into cell(GO:0097319) carbohydrate import across plasma membrane(GO:0098704) fructose import across plasma membrane(GO:1990539) |
| 0.0 | 0.4 | GO:0048026 | positive regulation of mRNA splicing, via spliceosome(GO:0048026) |
| 0.0 | 0.2 | GO:0090042 | tubulin deacetylation(GO:0090042) regulation of tubulin deacetylation(GO:0090043) |
| 0.0 | 0.1 | GO:0019086 | late viral transcription(GO:0019086) |
| 0.0 | 0.3 | GO:0090036 | regulation of protein kinase C signaling(GO:0090036) |
| 0.0 | 0.1 | GO:0042346 | positive regulation of NF-kappaB import into nucleus(GO:0042346) |
| 0.0 | 0.2 | GO:0070197 | telomere tethering at nuclear periphery(GO:0034398) meiotic telomere tethering at nuclear periphery(GO:0044821) meiotic attachment of telomere to nuclear envelope(GO:0070197) chromosome attachment to the nuclear envelope(GO:0097240) |
| 0.0 | 0.2 | GO:0023019 | signal transduction involved in regulation of gene expression(GO:0023019) |
| 0.0 | 0.2 | GO:0042048 | olfactory behavior(GO:0042048) |
| 0.0 | 0.3 | GO:0043485 | endosome to melanosome transport(GO:0035646) endosome to pigment granule transport(GO:0043485) pigment granule maturation(GO:0048757) |
| 0.0 | 0.4 | GO:1903859 | regulation of dendrite extension(GO:1903859) positive regulation of dendrite extension(GO:1903861) |
| 0.0 | 0.1 | GO:0007016 | cytoskeletal anchoring at plasma membrane(GO:0007016) |
| 0.0 | 1.0 | GO:0045921 | positive regulation of exocytosis(GO:0045921) |
| 0.0 | 0.2 | GO:1903204 | negative regulation of oxidative stress-induced neuron death(GO:1903204) |
| 0.0 | 0.6 | GO:0030318 | melanocyte differentiation(GO:0030318) |
| 0.0 | 0.1 | GO:0051014 | actin filament severing(GO:0051014) |
| 0.0 | 0.1 | GO:0034465 | response to carbon monoxide(GO:0034465) |
| 0.0 | 0.1 | GO:0032471 | negative regulation of endoplasmic reticulum calcium ion concentration(GO:0032471) |
| 0.0 | 0.4 | GO:0006744 | ubiquinone biosynthetic process(GO:0006744) quinone biosynthetic process(GO:1901663) |
| 0.0 | 0.3 | GO:0032060 | bleb assembly(GO:0032060) |
| 0.0 | 0.2 | GO:0046855 | phosphorylated carbohydrate dephosphorylation(GO:0046838) inositol phosphate dephosphorylation(GO:0046855) |
| 0.0 | 0.4 | GO:0010738 | regulation of protein kinase A signaling(GO:0010738) |
| 0.0 | 0.1 | GO:0050882 | voluntary musculoskeletal movement(GO:0050882) |
| 0.0 | 1.3 | GO:0010923 | negative regulation of phosphatase activity(GO:0010923) |
| 0.0 | 0.2 | GO:0033539 | fatty acid beta-oxidation using acyl-CoA dehydrogenase(GO:0033539) |
| 0.0 | 0.3 | GO:0060292 | long term synaptic depression(GO:0060292) |
| 0.0 | 0.2 | GO:0048490 | anterograde synaptic vesicle transport(GO:0048490) synaptic vesicle cytoskeletal transport(GO:0099514) synaptic vesicle transport along microtubule(GO:0099517) |
| 0.0 | 0.9 | GO:0042255 | ribosome assembly(GO:0042255) |
| 0.0 | 0.2 | GO:0030150 | protein import into mitochondrial matrix(GO:0030150) |
| 0.0 | 0.1 | GO:0043578 | nuclear matrix organization(GO:0043578) nuclear matrix anchoring at nuclear membrane(GO:0090292) |
| 0.0 | 0.1 | GO:0005981 | regulation of glycogen catabolic process(GO:0005981) |
| 0.0 | 0.7 | GO:0070527 | platelet aggregation(GO:0070527) |
| 0.0 | 0.4 | GO:0008631 | intrinsic apoptotic signaling pathway in response to oxidative stress(GO:0008631) |
| 0.0 | 0.6 | GO:0017004 | cytochrome complex assembly(GO:0017004) |
| 0.0 | 0.1 | GO:0038161 | prolactin signaling pathway(GO:0038161) |
| 0.0 | 0.2 | GO:0008089 | anterograde axonal transport(GO:0008089) |
| 0.0 | 0.3 | GO:0015671 | oxygen transport(GO:0015671) |
| 0.0 | 0.3 | GO:0051788 | response to misfolded protein(GO:0051788) cellular response to misfolded protein(GO:0071218) |
| 0.0 | 0.1 | GO:0043923 | positive regulation by host of viral transcription(GO:0043923) |
| 0.0 | 0.2 | GO:0033689 | negative regulation of osteoblast proliferation(GO:0033689) |
| 0.0 | 0.3 | GO:0051497 | negative regulation of stress fiber assembly(GO:0051497) |
| 0.0 | 0.5 | GO:0051568 | histone H3-K4 methylation(GO:0051568) |
| 0.0 | 0.0 | GO:0051195 | negative regulation of nucleotide catabolic process(GO:0030812) negative regulation of glycolytic process(GO:0045820) negative regulation of cofactor metabolic process(GO:0051195) negative regulation of coenzyme metabolic process(GO:0051198) |
| 0.0 | 0.1 | GO:0007000 | nucleolus organization(GO:0007000) |
| 0.0 | 0.1 | GO:0031086 | nuclear-transcribed mRNA catabolic process, deadenylation-independent decay(GO:0031086) deadenylation-independent decapping of nuclear-transcribed mRNA(GO:0031087) |
| 0.0 | 0.0 | GO:0072344 | rescue of stalled ribosome(GO:0072344) |
| 0.0 | 0.4 | GO:0007214 | gamma-aminobutyric acid signaling pathway(GO:0007214) |
| 0.0 | 0.5 | GO:0038128 | ERBB2 signaling pathway(GO:0038128) |
| 0.0 | 0.5 | GO:0051489 | regulation of filopodium assembly(GO:0051489) |
| 0.0 | 0.4 | GO:0050434 | positive regulation of viral transcription(GO:0050434) |
| 0.0 | 0.1 | GO:1900535 | medium-chain fatty-acyl-CoA catabolic process(GO:0036114) long-chain fatty-acyl-CoA catabolic process(GO:0036116) palmitic acid metabolic process(GO:1900533) palmitic acid biosynthetic process(GO:1900535) |
| 0.0 | 0.1 | GO:0006537 | glutamate biosynthetic process(GO:0006537) glutamine catabolic process(GO:0006543) |
| 0.0 | 0.1 | GO:0051964 | negative regulation of synapse assembly(GO:0051964) |
| 0.0 | 0.0 | GO:0006714 | sesquiterpenoid metabolic process(GO:0006714) polyprenol catabolic process(GO:0016095) sesquiterpenoid catabolic process(GO:0016107) farnesol metabolic process(GO:0016487) farnesol catabolic process(GO:0016488) |
| 0.0 | 0.2 | GO:0031167 | rRNA methylation(GO:0031167) |
| 0.0 | 0.0 | GO:0045079 | negative regulation of chemokine biosynthetic process(GO:0045079) |
| 0.0 | 0.1 | GO:0090625 | mRNA cleavage involved in gene silencing by siRNA(GO:0090625) |
| 0.0 | 0.8 | GO:0030042 | actin filament depolymerization(GO:0030042) |
| 0.0 | 0.8 | GO:0046854 | phosphatidylinositol phosphorylation(GO:0046854) |
| 0.0 | 0.0 | GO:0095500 | acetylcholine receptor signaling pathway(GO:0095500) postsynaptic signal transduction(GO:0098926) signal transduction involved in cellular response to ammonium ion(GO:1903831) response to acetylcholine(GO:1905144) cellular response to acetylcholine(GO:1905145) |
| 0.0 | 0.2 | GO:1900037 | regulation of cellular response to hypoxia(GO:1900037) |
| 0.0 | 0.1 | GO:0072718 | response to cisplatin(GO:0072718) |
| 0.0 | 0.2 | GO:0044342 | type B pancreatic cell proliferation(GO:0044342) |
| 0.0 | 0.1 | GO:0006651 | diacylglycerol biosynthetic process(GO:0006651) |
| 0.0 | 0.2 | GO:0061756 | leukocyte tethering or rolling(GO:0050901) leukocyte adhesion to vascular endothelial cell(GO:0061756) |
| 0.0 | 0.4 | GO:0051646 | mitochondrion localization(GO:0051646) |
| 0.0 | 0.2 | GO:0034587 | piRNA metabolic process(GO:0034587) |
| 0.0 | 0.8 | GO:0030574 | collagen catabolic process(GO:0030574) |
| 0.0 | 0.1 | GO:2000678 | negative regulation of transcription regulatory region DNA binding(GO:2000678) |
| 0.0 | 0.1 | GO:0018094 | protein polyglycylation(GO:0018094) |
| 0.0 | 0.1 | GO:0038166 | angiotensin-activated signaling pathway(GO:0038166) |
| 0.0 | 0.1 | GO:0002568 | somatic diversification of T cell receptor genes(GO:0002568) somatic recombination of T cell receptor gene segments(GO:0002681) T cell receptor V(D)J recombination(GO:0033153) |
| 0.0 | 0.1 | GO:0035873 | lactate transport(GO:0015727) lactate transmembrane transport(GO:0035873) |
| 0.0 | 0.2 | GO:0043304 | regulation of mast cell activation involved in immune response(GO:0033006) regulation of mast cell degranulation(GO:0043304) |
| 0.0 | 0.4 | GO:0043550 | regulation of lipid kinase activity(GO:0043550) |
Gene overrepresentation in cellular component category:
| Log-likelihood per target | Total log-likelihood | Term | Description |
|---|---|---|---|
| 1.3 | 10.4 | GO:1990111 | spermatoproteasome complex(GO:1990111) |
| 1.1 | 9.7 | GO:0071144 | SMAD2-SMAD3 protein complex(GO:0071144) |
| 0.9 | 5.6 | GO:1990682 | CSF1-CSF1R complex(GO:1990682) |
| 0.7 | 2.9 | GO:1990742 | microvesicle(GO:1990742) |
| 0.6 | 4.5 | GO:0098559 | cytoplasmic side of early endosome membrane(GO:0098559) |
| 0.5 | 2.6 | GO:0032044 | DSIF complex(GO:0032044) |
| 0.4 | 3.5 | GO:0097451 | glial limiting end-foot(GO:0097451) |
| 0.3 | 5.1 | GO:0046581 | intercellular canaliculus(GO:0046581) |
| 0.3 | 3.7 | GO:0035692 | macrophage migration inhibitory factor receptor complex(GO:0035692) |
| 0.3 | 0.9 | GO:0043259 | laminin-10 complex(GO:0043259) |
| 0.3 | 0.6 | GO:0005899 | insulin receptor complex(GO:0005899) |
| 0.3 | 0.8 | GO:0010370 | perinucleolar chromocenter(GO:0010370) |
| 0.3 | 1.3 | GO:0045160 | myosin I complex(GO:0045160) |
| 0.3 | 1.3 | GO:0070557 | PCNA-p21 complex(GO:0070557) |
| 0.2 | 1.0 | GO:0097179 | protease inhibitor complex(GO:0097179) |
| 0.2 | 5.4 | GO:0031265 | CD95 death-inducing signaling complex(GO:0031265) |
| 0.2 | 3.4 | GO:0005583 | fibrillar collagen trimer(GO:0005583) banded collagen fibril(GO:0098643) |
| 0.2 | 5.0 | GO:0005890 | sodium:potassium-exchanging ATPase complex(GO:0005890) |
| 0.2 | 0.7 | GO:0044753 | amphisome(GO:0044753) |
| 0.2 | 0.9 | GO:0033596 | TSC1-TSC2 complex(GO:0033596) |
| 0.2 | 4.4 | GO:0000812 | Swr1 complex(GO:0000812) |
| 0.2 | 2.5 | GO:0033018 | sarcoplasmic reticulum lumen(GO:0033018) |
| 0.2 | 0.7 | GO:0034753 | nuclear aryl hydrocarbon receptor complex(GO:0034753) |
| 0.2 | 0.9 | GO:0008537 | proteasome activator complex(GO:0008537) |
| 0.2 | 1.0 | GO:0044301 | climbing fiber(GO:0044301) |
| 0.2 | 1.9 | GO:0061689 | tricellular tight junction(GO:0061689) |
| 0.2 | 0.6 | GO:0060203 | clathrin-sculpted glutamate transport vesicle(GO:0060199) clathrin-sculpted glutamate transport vesicle membrane(GO:0060203) |
| 0.2 | 0.6 | GO:0060987 | lipid tube(GO:0060987) |
| 0.2 | 1.3 | GO:0043219 | lateral loop(GO:0043219) |
| 0.2 | 0.6 | GO:0031084 | BLOC-2 complex(GO:0031084) |
| 0.2 | 0.7 | GO:0005863 | striated muscle myosin thick filament(GO:0005863) |
| 0.2 | 1.2 | GO:0005826 | actomyosin contractile ring(GO:0005826) |
| 0.2 | 0.8 | GO:1990031 | pinceau fiber(GO:1990031) |
| 0.2 | 3.2 | GO:0005861 | troponin complex(GO:0005861) |
| 0.2 | 1.3 | GO:0035032 | phosphatidylinositol 3-kinase complex, class III(GO:0035032) |
| 0.2 | 1.1 | GO:0090533 | cation-transporting ATPase complex(GO:0090533) |
| 0.2 | 0.6 | GO:1990730 | VCP-NSFL1C complex(GO:1990730) |
| 0.1 | 2.7 | GO:0035631 | CD40 receptor complex(GO:0035631) |
| 0.1 | 0.7 | GO:0016013 | syntrophin complex(GO:0016013) |
| 0.1 | 0.3 | GO:0032444 | activin responsive factor complex(GO:0032444) |
| 0.1 | 0.6 | GO:0097229 | sperm end piece(GO:0097229) |
| 0.1 | 0.6 | GO:0031515 | tRNA (m1A) methyltransferase complex(GO:0031515) |
| 0.1 | 1.0 | GO:0097209 | epidermal lamellar body(GO:0097209) |
| 0.1 | 0.8 | GO:0005587 | collagen type IV trimer(GO:0005587) |
| 0.1 | 2.1 | GO:0033010 | paranodal junction(GO:0033010) |
| 0.1 | 0.5 | GO:0000811 | GINS complex(GO:0000811) |
| 0.1 | 1.1 | GO:0002193 | MAML1-RBP-Jkappa- ICN1 complex(GO:0002193) |
| 0.1 | 0.4 | GO:0098855 | HCN channel complex(GO:0098855) |
| 0.1 | 1.0 | GO:0035976 | AP1 complex(GO:0035976) |
| 0.1 | 4.9 | GO:0005605 | basal lamina(GO:0005605) |
| 0.1 | 1.6 | GO:0044292 | dendrite terminus(GO:0044292) |
| 0.1 | 2.4 | GO:0005885 | Arp2/3 protein complex(GO:0005885) |
| 0.1 | 0.3 | GO:0016938 | kinesin I complex(GO:0016938) |
| 0.1 | 0.4 | GO:0034669 | integrin alpha4-beta7 complex(GO:0034669) |
| 0.1 | 0.7 | GO:0060171 | stereocilium membrane(GO:0060171) |
| 0.1 | 0.7 | GO:0042584 | chromaffin granule membrane(GO:0042584) |
| 0.1 | 0.3 | GO:0060187 | cell pole(GO:0060187) |
| 0.1 | 0.8 | GO:0000127 | transcription factor TFIIIC complex(GO:0000127) |
| 0.1 | 0.9 | GO:0035985 | senescence-associated heterochromatin focus(GO:0035985) |
| 0.1 | 2.1 | GO:0032433 | filopodium tip(GO:0032433) |
| 0.1 | 0.7 | GO:0000788 | nuclear nucleosome(GO:0000788) |
| 0.1 | 2.4 | GO:0030056 | hemidesmosome(GO:0030056) |
| 0.1 | 1.2 | GO:0097486 | multivesicular body lumen(GO:0097486) |
| 0.1 | 3.9 | GO:0071565 | nBAF complex(GO:0071565) |
| 0.1 | 0.9 | GO:0005787 | signal peptidase complex(GO:0005787) |
| 0.1 | 0.5 | GO:0042272 | nuclear RNA export factor complex(GO:0042272) |
| 0.1 | 2.6 | GO:0031143 | pseudopodium(GO:0031143) |
| 0.1 | 0.8 | GO:0072487 | MSL complex(GO:0072487) |
| 0.1 | 0.3 | GO:0019815 | B cell receptor complex(GO:0019815) |
| 0.1 | 2.4 | GO:0000145 | exocyst(GO:0000145) |
| 0.1 | 2.3 | GO:0005614 | interstitial matrix(GO:0005614) |
| 0.1 | 0.9 | GO:1990712 | HFE-transferrin receptor complex(GO:1990712) |
| 0.1 | 1.2 | GO:0033391 | chromatoid body(GO:0033391) |
| 0.1 | 0.2 | GO:0005745 | m-AAA complex(GO:0005745) |
| 0.1 | 0.5 | GO:0030934 | anchoring collagen complex(GO:0030934) |
| 0.1 | 0.6 | GO:1903439 | calcitonin family receptor complex(GO:1903439) amylin receptor complex(GO:1903440) |
| 0.1 | 0.8 | GO:0016589 | NURF complex(GO:0016589) |
| 0.1 | 0.2 | GO:0033565 | ESCRT-0 complex(GO:0033565) |
| 0.1 | 2.2 | GO:0030014 | CCR4-NOT complex(GO:0030014) |
| 0.1 | 0.8 | GO:0042612 | MHC class I protein complex(GO:0042612) |
| 0.1 | 0.4 | GO:0032584 | growth cone membrane(GO:0032584) |
| 0.1 | 0.7 | GO:0032010 | phagolysosome(GO:0032010) |
| 0.1 | 0.5 | GO:0097425 | smooth endoplasmic reticulum membrane(GO:0030868) smooth endoplasmic reticulum part(GO:0097425) |
| 0.1 | 0.3 | GO:0045323 | interleukin-1 receptor complex(GO:0045323) |
| 0.1 | 4.5 | GO:0005771 | multivesicular body(GO:0005771) |
| 0.1 | 0.5 | GO:0005658 | alpha DNA polymerase:primase complex(GO:0005658) |
| 0.1 | 0.6 | GO:0034688 | integrin alphaM-beta2 complex(GO:0034688) |
| 0.1 | 0.5 | GO:0045298 | tubulin complex(GO:0045298) |
| 0.1 | 2.7 | GO:1902711 | GABA-A receptor complex(GO:1902711) |
| 0.1 | 0.6 | GO:0030893 | meiotic cohesin complex(GO:0030893) |
| 0.1 | 1.3 | GO:0060077 | inhibitory synapse(GO:0060077) |
| 0.1 | 1.5 | GO:0071004 | U2-type prespliceosome(GO:0071004) |
| 0.1 | 0.2 | GO:1990298 | mitotic checkpoint complex(GO:0033597) bub1-bub3 complex(GO:1990298) |
| 0.1 | 1.0 | GO:0048188 | Set1C/COMPASS complex(GO:0048188) |
| 0.1 | 1.3 | GO:0005671 | Ada2/Gcn5/Ada3 transcription activator complex(GO:0005671) |
| 0.1 | 0.3 | GO:0033263 | CORVET complex(GO:0033263) |
| 0.1 | 0.3 | GO:0005726 | perichromatin fibrils(GO:0005726) |
| 0.1 | 0.5 | GO:0044194 | cytolytic granule(GO:0044194) |
| 0.1 | 3.5 | GO:0002102 | podosome(GO:0002102) |
| 0.1 | 1.0 | GO:0032426 | stereocilium tip(GO:0032426) |
| 0.1 | 0.2 | GO:0071821 | FANCM-MHF complex(GO:0071821) |
| 0.1 | 0.6 | GO:0044352 | pinosome(GO:0044352) macropinosome(GO:0044354) |
| 0.1 | 0.3 | GO:0035339 | SPOTS complex(GO:0035339) |
| 0.1 | 0.4 | GO:1990635 | proximal dendrite(GO:1990635) |
| 0.1 | 0.5 | GO:0005577 | fibrinogen complex(GO:0005577) |
| 0.1 | 0.5 | GO:0036157 | outer dynein arm(GO:0036157) |
| 0.1 | 0.2 | GO:0032279 | asymmetric synapse(GO:0032279) |
| 0.0 | 0.4 | GO:0098845 | postsynaptic endosome(GO:0098845) |
| 0.0 | 0.5 | GO:0097512 | cardiac myofibril(GO:0097512) |
| 0.0 | 0.4 | GO:0072687 | meiotic spindle(GO:0072687) |
| 0.0 | 0.3 | GO:0072589 | box H/ACA scaRNP complex(GO:0072589) box H/ACA telomerase RNP complex(GO:0090661) |
| 0.0 | 0.5 | GO:0008385 | IkappaB kinase complex(GO:0008385) |
| 0.0 | 1.1 | GO:0031011 | Ino80 complex(GO:0031011) DNA helicase complex(GO:0033202) |
| 0.0 | 0.1 | GO:0097629 | extrinsic component of omegasome membrane(GO:0097629) |
| 0.0 | 1.1 | GO:0046930 | pore complex(GO:0046930) |
| 0.0 | 0.2 | GO:0031933 | telomeric heterochromatin(GO:0031933) |
| 0.0 | 0.2 | GO:0005744 | mitochondrial inner membrane presequence translocase complex(GO:0005744) |
| 0.0 | 0.8 | GO:0097038 | perinuclear endoplasmic reticulum(GO:0097038) |
| 0.0 | 0.6 | GO:0034464 | BBSome(GO:0034464) |
| 0.0 | 0.2 | GO:0008278 | cohesin complex(GO:0008278) |
| 0.0 | 0.4 | GO:0070552 | BRISC complex(GO:0070552) |
| 0.0 | 0.7 | GO:0034045 | pre-autophagosomal structure membrane(GO:0034045) |
| 0.0 | 0.3 | GO:0033165 | interphotoreceptor matrix(GO:0033165) |
| 0.0 | 0.6 | GO:0031254 | uropod(GO:0001931) cell trailing edge(GO:0031254) |
| 0.0 | 0.1 | GO:0042627 | chylomicron(GO:0042627) |
| 0.0 | 1.1 | GO:0044453 | nuclear membrane part(GO:0044453) |
| 0.0 | 0.2 | GO:0071546 | pi-body(GO:0071546) |
| 0.0 | 0.3 | GO:0032280 | symmetric synapse(GO:0032280) |
| 0.0 | 0.1 | GO:0032116 | SMC loading complex(GO:0032116) |
| 0.0 | 5.7 | GO:0005913 | cell-cell adherens junction(GO:0005913) |
| 0.0 | 0.5 | GO:0042555 | MCM complex(GO:0042555) |
| 0.0 | 0.2 | GO:0097169 | AIM2 inflammasome complex(GO:0097169) |
| 0.0 | 0.4 | GO:0097550 | transcriptional preinitiation complex(GO:0097550) |
| 0.0 | 0.4 | GO:0005664 | origin recognition complex(GO:0000808) nuclear origin of replication recognition complex(GO:0005664) |
| 0.0 | 0.5 | GO:0005869 | dynactin complex(GO:0005869) |
| 0.0 | 0.7 | GO:0044224 | juxtaparanode region of axon(GO:0044224) |
| 0.0 | 0.1 | GO:0034515 | proteasome storage granule(GO:0034515) |
| 0.0 | 0.5 | GO:0030126 | COPI vesicle coat(GO:0030126) |
| 0.0 | 0.2 | GO:0031302 | intrinsic component of endosome membrane(GO:0031302) |
| 0.0 | 0.1 | GO:0070044 | synaptobrevin 2-SNAP-25-syntaxin-1a complex(GO:0070044) |
| 0.0 | 3.7 | GO:0032580 | Golgi cisterna membrane(GO:0032580) |
| 0.0 | 3.1 | GO:0030670 | phagocytic vesicle membrane(GO:0030670) |
| 0.0 | 0.6 | GO:0000164 | protein phosphatase type 1 complex(GO:0000164) |
| 0.0 | 0.5 | GO:0005883 | neurofilament(GO:0005883) |
| 0.0 | 0.1 | GO:0097441 | basilar dendrite(GO:0097441) |
| 0.0 | 1.5 | GO:0001917 | photoreceptor inner segment(GO:0001917) |
| 0.0 | 0.8 | GO:0000780 | condensed nuclear chromosome, centromeric region(GO:0000780) |
| 0.0 | 0.1 | GO:0070435 | Shc-EGFR complex(GO:0070435) |
| 0.0 | 0.5 | GO:0031045 | dense core granule(GO:0031045) |
| 0.0 | 0.8 | GO:0031528 | microvillus membrane(GO:0031528) |
| 0.0 | 0.2 | GO:0001405 | presequence translocase-associated import motor(GO:0001405) |
| 0.0 | 0.4 | GO:0005862 | muscle thin filament tropomyosin(GO:0005862) |
| 0.0 | 0.5 | GO:0001520 | outer dense fiber(GO:0001520) |
| 0.0 | 1.0 | GO:0030867 | rough endoplasmic reticulum membrane(GO:0030867) |
| 0.0 | 0.2 | GO:0000801 | central element(GO:0000801) |
| 0.0 | 1.0 | GO:0031304 | intrinsic component of mitochondrial inner membrane(GO:0031304) integral component of mitochondrial inner membrane(GO:0031305) |
| 0.0 | 0.5 | GO:0005833 | hemoglobin complex(GO:0005833) |
| 0.0 | 0.3 | GO:0045254 | pyruvate dehydrogenase complex(GO:0045254) |
| 0.0 | 0.2 | GO:0031417 | NatC complex(GO:0031417) |
| 0.0 | 1.2 | GO:0048786 | presynaptic active zone(GO:0048786) |
| 0.0 | 0.1 | GO:0042587 | glycogen granule(GO:0042587) |
| 0.0 | 0.3 | GO:0000445 | THO complex(GO:0000347) THO complex part of transcription export complex(GO:0000445) |
| 0.0 | 3.4 | GO:0035578 | azurophil granule lumen(GO:0035578) |
| 0.0 | 0.3 | GO:0031931 | TORC1 complex(GO:0031931) |
| 0.0 | 0.5 | GO:0030877 | beta-catenin destruction complex(GO:0030877) |
| 0.0 | 0.2 | GO:0036021 | endolysosome lumen(GO:0036021) |
| 0.0 | 2.9 | GO:0036064 | ciliary basal body(GO:0036064) |
| 0.0 | 0.4 | GO:0097539 | ciliary transition fiber(GO:0097539) |
| 0.0 | 0.6 | GO:0033268 | node of Ranvier(GO:0033268) |
| 0.0 | 0.1 | GO:0031262 | Ndc80 complex(GO:0031262) |
| 0.0 | 0.1 | GO:0031523 | Myb complex(GO:0031523) |
| 0.0 | 0.8 | GO:0032420 | stereocilium(GO:0032420) |
| 0.0 | 0.5 | GO:0035371 | microtubule plus-end(GO:0035371) |
| 0.0 | 0.1 | GO:0031232 | extrinsic component of external side of plasma membrane(GO:0031232) |
| 0.0 | 0.3 | GO:0005853 | eukaryotic translation elongation factor 1 complex(GO:0005853) |
| 0.0 | 9.3 | GO:0019898 | extrinsic component of membrane(GO:0019898) |
| 0.0 | 1.8 | GO:0005604 | basement membrane(GO:0005604) |
| 0.0 | 0.1 | GO:0035841 | new growing cell tip(GO:0035841) |
| 0.0 | 0.3 | GO:0005955 | calcineurin complex(GO:0005955) |
| 0.0 | 0.2 | GO:0070852 | cell body fiber(GO:0070852) |
| 0.0 | 4.1 | GO:0031225 | anchored component of membrane(GO:0031225) |
| 0.0 | 0.4 | GO:0005684 | U2-type spliceosomal complex(GO:0005684) |
| 0.0 | 0.3 | GO:0017119 | Golgi transport complex(GO:0017119) |
| 0.0 | 0.1 | GO:0030663 | COPI-coated vesicle membrane(GO:0030663) |
| 0.0 | 0.9 | GO:0030673 | axolemma(GO:0030673) |
| 0.0 | 0.4 | GO:0005719 | nuclear euchromatin(GO:0005719) |
| 0.0 | 0.7 | GO:0030687 | preribosome, large subunit precursor(GO:0030687) |
| 0.0 | 0.9 | GO:0000159 | protein phosphatase type 2A complex(GO:0000159) |
| 0.0 | 2.0 | GO:0034704 | calcium channel complex(GO:0034704) |
| 0.0 | 0.1 | GO:0045179 | apical cortex(GO:0045179) |
| 0.0 | 0.1 | GO:0005960 | glycine cleavage complex(GO:0005960) |
| 0.0 | 0.3 | GO:1903293 | protein serine/threonine phosphatase complex(GO:0008287) phosphatase complex(GO:1903293) |
| 0.0 | 0.5 | GO:0005852 | eukaryotic translation initiation factor 3 complex(GO:0005852) |
| 0.0 | 0.6 | GO:0031941 | filamentous actin(GO:0031941) |
| 0.0 | 0.2 | GO:0043240 | Fanconi anaemia nuclear complex(GO:0043240) |
| 0.0 | 0.1 | GO:0001940 | male pronucleus(GO:0001940) |
| 0.0 | 0.6 | GO:0005763 | organellar small ribosomal subunit(GO:0000314) mitochondrial small ribosomal subunit(GO:0005763) |
| 0.0 | 0.3 | GO:0070937 | CRD-mediated mRNA stability complex(GO:0070937) |
| 0.0 | 0.5 | GO:0005790 | smooth endoplasmic reticulum(GO:0005790) |
| 0.0 | 0.1 | GO:0005685 | U1 snRNP(GO:0005685) |
| 0.0 | 0.6 | GO:0032281 | AMPA glutamate receptor complex(GO:0032281) |
| 0.0 | 0.4 | GO:0005665 | DNA-directed RNA polymerase II, core complex(GO:0005665) |
| 0.0 | 0.4 | GO:0031083 | BLOC-1 complex(GO:0031083) |
| 0.0 | 1.2 | GO:0045095 | keratin filament(GO:0045095) |
| 0.0 | 0.3 | GO:0097381 | photoreceptor disc membrane(GO:0097381) |
| 0.0 | 0.7 | GO:0034364 | high-density lipoprotein particle(GO:0034364) |
| 0.0 | 1.1 | GO:0035577 | azurophil granule membrane(GO:0035577) |
| 0.0 | 0.2 | GO:0033180 | proton-transporting V-type ATPase, V1 domain(GO:0033180) |
| 0.0 | 0.0 | GO:0032002 | interleukin-28 receptor complex(GO:0032002) |
| 0.0 | 0.5 | GO:0001750 | photoreceptor outer segment(GO:0001750) |
| 0.0 | 0.1 | GO:0032059 | bleb(GO:0032059) |
| 0.0 | 0.1 | GO:0000835 | ER ubiquitin ligase complex(GO:0000835) Hrd1p ubiquitin ligase complex(GO:0000836) |
| 0.0 | 0.1 | GO:0097123 | cyclin A1-CDK2 complex(GO:0097123) |
| 0.0 | 0.2 | GO:0030123 | AP-3 adaptor complex(GO:0030123) |
| 0.0 | 0.3 | GO:0035869 | ciliary transition zone(GO:0035869) |
| 0.0 | 0.2 | GO:0008328 | ionotropic glutamate receptor complex(GO:0008328) neurotransmitter receptor complex(GO:0098878) |
| 0.0 | 1.0 | GO:0000794 | condensed nuclear chromosome(GO:0000794) |
| 0.0 | 0.2 | GO:0030140 | trans-Golgi network transport vesicle(GO:0030140) |
| 0.0 | 0.2 | GO:0070776 | H3 histone acetyltransferase complex(GO:0070775) MOZ/MORF histone acetyltransferase complex(GO:0070776) |
| 0.0 | 0.1 | GO:1990023 | mitotic spindle midzone(GO:1990023) |
| 0.0 | 0.9 | GO:0030118 | clathrin coat(GO:0030118) |
| 0.0 | 2.2 | GO:0090575 | RNA polymerase II transcription factor complex(GO:0090575) |
| 0.0 | 0.1 | GO:0031010 | ISWI-type complex(GO:0031010) |
| 0.0 | 0.3 | GO:0002080 | acrosomal membrane(GO:0002080) |
| 0.0 | 0.6 | GO:0031594 | neuromuscular junction(GO:0031594) |
| 0.0 | 0.7 | GO:0030864 | cortical actin cytoskeleton(GO:0030864) |
| 0.0 | 0.4 | GO:0043034 | costamere(GO:0043034) |
| 0.0 | 0.1 | GO:0032807 | DNA ligase IV complex(GO:0032807) |
| 0.0 | 0.5 | GO:0005902 | microvillus(GO:0005902) |
Gene overrepresentation in molecular function category:
| Log-likelihood per target | Total log-likelihood | Term | Description |
|---|---|---|---|
| 1.6 | 9.7 | GO:0031962 | mineralocorticoid receptor binding(GO:0031962) |
| 1.5 | 4.5 | GO:0030550 | acetylcholine receptor inhibitor activity(GO:0030550) |
| 1.0 | 4.1 | GO:0035939 | microsatellite binding(GO:0035939) |
| 1.0 | 3.9 | GO:0003953 | NAD+ nucleosidase activity(GO:0003953) |
| 0.8 | 5.6 | GO:0005157 | macrophage colony-stimulating factor receptor binding(GO:0005157) |
| 0.6 | 9.1 | GO:0005381 | iron ion transmembrane transporter activity(GO:0005381) |
| 0.6 | 1.7 | GO:0001641 | group II metabotropic glutamate receptor activity(GO:0001641) |
| 0.6 | 3.9 | GO:0001517 | N-acetylglucosamine 6-O-sulfotransferase activity(GO:0001517) |
| 0.5 | 2.2 | GO:0004909 | interleukin-1, Type I, activating receptor activity(GO:0004909) |
| 0.5 | 1.1 | GO:0035373 | chondroitin sulfate proteoglycan binding(GO:0035373) |
| 0.5 | 1.5 | GO:0061629 | RNA polymerase II sequence-specific DNA binding transcription factor binding(GO:0061629) |
| 0.5 | 7.5 | GO:0045236 | CXCR chemokine receptor binding(GO:0045236) |
| 0.5 | 1.9 | GO:0052836 | inositol 5-diphosphate pentakisphosphate 5-kinase activity(GO:0052836) inositol diphosphate tetrakisphosphate kinase activity(GO:0052839) |
| 0.5 | 3.8 | GO:0005332 | gamma-aminobutyric acid:sodium symporter activity(GO:0005332) |
| 0.5 | 4.7 | GO:0016721 | superoxide dismutase activity(GO:0004784) oxidoreductase activity, acting on superoxide radicals as acceptor(GO:0016721) |
| 0.5 | 1.4 | GO:0031896 | V2 vasopressin receptor binding(GO:0031896) |
| 0.5 | 3.7 | GO:0032217 | riboflavin transporter activity(GO:0032217) |
| 0.4 | 1.7 | GO:0070095 | fructose-6-phosphate binding(GO:0070095) |
| 0.4 | 5.2 | GO:0035374 | chondroitin sulfate binding(GO:0035374) |
| 0.4 | 8.4 | GO:0031701 | angiotensin receptor binding(GO:0031701) type 1 angiotensin receptor binding(GO:0031702) |
| 0.4 | 1.5 | GO:0051765 | inositol tetrakisphosphate kinase activity(GO:0051765) |
| 0.4 | 1.1 | GO:0004912 | interleukin-3 receptor activity(GO:0004912) interleukin-5 receptor activity(GO:0004914) |
| 0.4 | 1.9 | GO:0046538 | bisphosphoglycerate mutase activity(GO:0004082) phosphoglycerate mutase activity(GO:0004619) 2,3-bisphosphoglycerate-dependent phosphoglycerate mutase activity(GO:0046538) |
| 0.4 | 1.9 | GO:0031749 | D2 dopamine receptor binding(GO:0031749) |
| 0.4 | 18.8 | GO:0005164 | tumor necrosis factor receptor binding(GO:0005164) |
| 0.4 | 1.8 | GO:0097108 | smoothened binding(GO:0005119) hedgehog family protein binding(GO:0097108) |
| 0.4 | 1.5 | GO:0002046 | opsin binding(GO:0002046) |
| 0.3 | 10.0 | GO:0004298 | threonine-type endopeptidase activity(GO:0004298) threonine-type peptidase activity(GO:0070003) |
| 0.3 | 3.1 | GO:0008597 | calcium-dependent protein serine/threonine phosphatase regulator activity(GO:0008597) |
| 0.3 | 1.0 | GO:0070984 | SET domain binding(GO:0070984) |
| 0.3 | 2.4 | GO:0086089 | voltage-gated potassium channel activity involved in atrial cardiac muscle cell action potential repolarization(GO:0086089) |
| 0.3 | 0.6 | GO:0033823 | procollagen-lysine 5-dioxygenase activity(GO:0008475) procollagen glucosyltransferase activity(GO:0033823) |
| 0.3 | 2.3 | GO:0071532 | ankyrin repeat binding(GO:0071532) |
| 0.3 | 1.1 | GO:0097677 | STAT family protein binding(GO:0097677) |
| 0.3 | 7.6 | GO:0097200 | cysteine-type endopeptidase activity involved in execution phase of apoptosis(GO:0097200) |
| 0.3 | 1.4 | GO:0004882 | androgen receptor activity(GO:0004882) |
| 0.3 | 3.6 | GO:0031014 | troponin T binding(GO:0031014) |
| 0.3 | 1.1 | GO:0032408 | MutLbeta complex binding(GO:0032406) MutSbeta complex binding(GO:0032408) |
| 0.3 | 0.8 | GO:0008900 | hydrogen:potassium-exchanging ATPase activity(GO:0008900) |
| 0.3 | 0.8 | GO:0030158 | protein xylosyltransferase activity(GO:0030158) |
| 0.3 | 0.8 | GO:0004056 | argininosuccinate lyase activity(GO:0004056) |
| 0.3 | 1.3 | GO:0016230 | sphingomyelin phosphodiesterase activator activity(GO:0016230) |
| 0.3 | 1.3 | GO:0019912 | cyclin-dependent protein kinase activating kinase activity(GO:0019912) |
| 0.3 | 0.8 | GO:0016497 | substance K receptor activity(GO:0016497) |
| 0.2 | 1.2 | GO:0004473 | malate dehydrogenase (decarboxylating) (NAD+) activity(GO:0004471) malate dehydrogenase (decarboxylating) (NADP+) activity(GO:0004473) |
| 0.2 | 1.5 | GO:0047894 | flavonol 3-sulfotransferase activity(GO:0047894) |
| 0.2 | 2.2 | GO:0019238 | cyclohydrolase activity(GO:0019238) |
| 0.2 | 1.4 | GO:0042392 | sphingosine-1-phosphate phosphatase activity(GO:0042392) |
| 0.2 | 0.9 | GO:0050211 | procollagen galactosyltransferase activity(GO:0050211) |
| 0.2 | 5.1 | GO:0017128 | phospholipid scramblase activity(GO:0017128) |
| 0.2 | 0.9 | GO:0003839 | gamma-glutamylcyclotransferase activity(GO:0003839) |
| 0.2 | 1.4 | GO:0035800 | deubiquitinase activator activity(GO:0035800) |
| 0.2 | 9.4 | GO:0003950 | NAD+ ADP-ribosyltransferase activity(GO:0003950) |
| 0.2 | 0.4 | GO:0004995 | tachykinin receptor activity(GO:0004995) |
| 0.2 | 2.2 | GO:0031685 | adenosine receptor binding(GO:0031685) |
| 0.2 | 0.9 | GO:0008478 | pyridoxal kinase activity(GO:0008478) |
| 0.2 | 5.1 | GO:0019870 | potassium channel inhibitor activity(GO:0019870) |
| 0.2 | 0.7 | GO:0034416 | bisphosphoglycerate phosphatase activity(GO:0034416) |
| 0.2 | 4.3 | GO:0047372 | acylglycerol lipase activity(GO:0047372) |
| 0.2 | 1.5 | GO:0004045 | aminoacyl-tRNA hydrolase activity(GO:0004045) |
| 0.2 | 0.6 | GO:0004613 | phosphoenolpyruvate carboxykinase activity(GO:0004611) phosphoenolpyruvate carboxykinase (GTP) activity(GO:0004613) |
| 0.2 | 0.6 | GO:0030156 | benzodiazepine receptor binding(GO:0030156) |
| 0.2 | 1.2 | GO:0042285 | UDP-xylosyltransferase activity(GO:0035252) xylosyltransferase activity(GO:0042285) |
| 0.2 | 0.6 | GO:0045131 | pre-mRNA branch point binding(GO:0045131) |
| 0.2 | 1.1 | GO:0042806 | fucose binding(GO:0042806) |
| 0.2 | 0.9 | GO:0005094 | Rho GDP-dissociation inhibitor activity(GO:0005094) |
| 0.2 | 2.6 | GO:0008556 | sodium:potassium-exchanging ATPase activity(GO:0005391) potassium-transporting ATPase activity(GO:0008556) |
| 0.2 | 1.3 | GO:0015016 | [heparan sulfate]-glucosamine N-sulfotransferase activity(GO:0015016) |
| 0.2 | 2.2 | GO:0038132 | neuregulin binding(GO:0038132) |
| 0.2 | 1.1 | GO:0004656 | procollagen-proline 4-dioxygenase activity(GO:0004656) |
| 0.2 | 0.9 | GO:0015183 | L-aspartate transmembrane transporter activity(GO:0015183) |
| 0.2 | 1.2 | GO:0008467 | [heparan sulfate]-glucosamine 3-sulfotransferase 1 activity(GO:0008467) |
| 0.2 | 1.2 | GO:0008454 | alpha-1,3-mannosylglycoprotein 4-beta-N-acetylglucosaminyltransferase activity(GO:0008454) |
| 0.2 | 2.0 | GO:0016176 | superoxide-generating NADPH oxidase activator activity(GO:0016176) |
| 0.2 | 0.8 | GO:0016708 | nitric oxide dioxygenase activity(GO:0008941) oxidoreductase activity, acting on paired donors, with incorporation or reduction of molecular oxygen, NAD(P)H as one donor, and incorporation of two atoms of oxygen into one donor(GO:0016708) |
| 0.2 | 1.1 | GO:0008142 | oxysterol binding(GO:0008142) |
| 0.2 | 1.3 | GO:0051373 | FATZ binding(GO:0051373) |
| 0.2 | 0.8 | GO:0004706 | JUN kinase kinase kinase activity(GO:0004706) |
| 0.2 | 1.4 | GO:0043237 | laminin-1 binding(GO:0043237) Roundabout binding(GO:0048495) |
| 0.2 | 0.6 | GO:0004948 | calcitonin receptor activity(GO:0004948) |
| 0.2 | 0.6 | GO:0004102 | choline O-acetyltransferase activity(GO:0004102) |
| 0.2 | 0.6 | GO:0031531 | thyrotropin-releasing hormone receptor binding(GO:0031531) |
| 0.2 | 0.6 | GO:0047685 | amine sulfotransferase activity(GO:0047685) |
| 0.1 | 3.7 | GO:0042043 | neurexin family protein binding(GO:0042043) |
| 0.1 | 1.6 | GO:0019958 | C-X-C chemokine binding(GO:0019958) |
| 0.1 | 1.5 | GO:0005237 | inhibitory extracellular ligand-gated ion channel activity(GO:0005237) |
| 0.1 | 1.2 | GO:0015186 | L-glutamine transmembrane transporter activity(GO:0015186) |
| 0.1 | 0.7 | GO:0005222 | intracellular cAMP activated cation channel activity(GO:0005222) |
| 0.1 | 0.6 | GO:0003883 | CTP synthase activity(GO:0003883) |
| 0.1 | 0.7 | GO:0004052 | arachidonate 12-lipoxygenase activity(GO:0004052) |
| 0.1 | 0.4 | GO:0102008 | cytosolic dipeptidase activity(GO:0102008) |
| 0.1 | 0.4 | GO:0008969 | phosphohistidine phosphatase activity(GO:0008969) |
| 0.1 | 0.9 | GO:0060698 | endoribonuclease inhibitor activity(GO:0060698) |
| 0.1 | 0.4 | GO:0090422 | thiamine pyrophosphate transporter activity(GO:0090422) |
| 0.1 | 0.4 | GO:0005026 | transforming growth factor beta receptor activity, type II(GO:0005026) |
| 0.1 | 1.4 | GO:0051525 | NFAT protein binding(GO:0051525) |
| 0.1 | 1.4 | GO:0017034 | Rap guanyl-nucleotide exchange factor activity(GO:0017034) |
| 0.1 | 1.5 | GO:0070053 | thrombospondin receptor activity(GO:0070053) |
| 0.1 | 0.9 | GO:0004735 | pyrroline-5-carboxylate reductase activity(GO:0004735) |
| 0.1 | 0.5 | GO:0004769 | steroid delta-isomerase activity(GO:0004769) |
| 0.1 | 0.5 | GO:0045127 | N-acetylglucosamine kinase activity(GO:0045127) |
| 0.1 | 0.6 | GO:0003989 | acetyl-CoA carboxylase activity(GO:0003989) |
| 0.1 | 2.3 | GO:0004089 | carbonate dehydratase activity(GO:0004089) |
| 0.1 | 1.1 | GO:0004849 | uridine kinase activity(GO:0004849) |
| 0.1 | 0.7 | GO:0005497 | androgen binding(GO:0005497) |
| 0.1 | 0.5 | GO:0099609 | microtubule lateral binding(GO:0099609) |
| 0.1 | 0.8 | GO:0005052 | peroxisome matrix targeting signal-1 binding(GO:0005052) |
| 0.1 | 0.4 | GO:0050309 | glucose-6-phosphatase activity(GO:0004346) sugar-terminal-phosphatase activity(GO:0050309) |
| 0.1 | 0.7 | GO:0034186 | apolipoprotein A-I binding(GO:0034186) |
| 0.1 | 0.8 | GO:0015181 | arginine transmembrane transporter activity(GO:0015181) |
| 0.1 | 0.6 | GO:0070051 | fibrinogen binding(GO:0070051) |
| 0.1 | 2.0 | GO:0019864 | IgG binding(GO:0019864) |
| 0.1 | 0.3 | GO:0004069 | L-aspartate:2-oxoglutarate aminotransferase activity(GO:0004069) L-phenylalanine:2-oxoglutarate aminotransferase activity(GO:0080130) |
| 0.1 | 4.5 | GO:0005540 | hyaluronic acid binding(GO:0005540) |
| 0.1 | 0.6 | GO:0015319 | sodium:inorganic phosphate symporter activity(GO:0015319) |
| 0.1 | 0.3 | GO:0047223 | beta-1,3-galactosyl-O-glycosyl-glycoprotein beta-1,3-N-acetylglucosaminyltransferase activity(GO:0047223) |
| 0.1 | 0.7 | GO:0060230 | lipoprotein lipase activator activity(GO:0060230) |
| 0.1 | 0.6 | GO:0016429 | tRNA (adenine-N1-)-methyltransferase activity(GO:0016429) |
| 0.1 | 0.3 | GO:0008336 | gamma-butyrobetaine dioxygenase activity(GO:0008336) |
| 0.1 | 0.9 | GO:0061133 | endopeptidase activator activity(GO:0061133) |
| 0.1 | 0.4 | GO:0047757 | chondroitin-glucuronate 5-epimerase activity(GO:0047757) |
| 0.1 | 1.1 | GO:0004117 | calmodulin-dependent cyclic-nucleotide phosphodiesterase activity(GO:0004117) |
| 0.1 | 0.6 | GO:0004372 | glycine hydroxymethyltransferase activity(GO:0004372) threonine aldolase activity(GO:0004793) L-allo-threonine aldolase activity(GO:0008732) |
| 0.1 | 0.8 | GO:0008109 | N-acetyllactosaminide beta-1,6-N-acetylglucosaminyltransferase activity(GO:0008109) |
| 0.1 | 0.9 | GO:0030346 | protein phosphatase 2B binding(GO:0030346) |
| 0.1 | 1.0 | GO:0003831 | beta-N-acetylglucosaminylglycopeptide beta-1,4-galactosyltransferase activity(GO:0003831) |
| 0.1 | 3.4 | GO:0030553 | cGMP binding(GO:0030553) |
| 0.1 | 0.5 | GO:0015321 | sodium-dependent phosphate transmembrane transporter activity(GO:0015321) |
| 0.1 | 3.2 | GO:0005388 | calcium-transporting ATPase activity(GO:0005388) |
| 0.1 | 0.6 | GO:0004966 | galanin receptor activity(GO:0004966) |
| 0.1 | 0.3 | GO:0004967 | glucagon receptor activity(GO:0004967) |
| 0.1 | 1.6 | GO:0019211 | phosphatase activator activity(GO:0019211) |
| 0.1 | 1.5 | GO:0042975 | peroxisome proliferator activated receptor binding(GO:0042975) |
| 0.1 | 0.6 | GO:0004127 | cytidylate kinase activity(GO:0004127) |
| 0.1 | 0.4 | GO:0004667 | prostaglandin-D synthase activity(GO:0004667) |
| 0.1 | 0.3 | GO:0004608 | phosphatidyl-N-methylethanolamine N-methyltransferase activity(GO:0000773) phosphatidylethanolamine N-methyltransferase activity(GO:0004608) phosphatidyl-N-dimethylethanolamine N-methyltransferase activity(GO:0080101) |
| 0.1 | 0.3 | GO:0033842 | N-acetyl-beta-glucosaminyl-glycoprotein 4-beta-N-acetylgalactosaminyltransferase activity(GO:0033842) |
| 0.1 | 0.3 | GO:0050571 | 1,5-anhydro-D-fructose reductase activity(GO:0050571) |
| 0.1 | 0.4 | GO:0005436 | sodium:phosphate symporter activity(GO:0005436) |
| 0.1 | 0.2 | GO:0098640 | integrin binding involved in cell-matrix adhesion(GO:0098640) |
| 0.1 | 0.5 | GO:0004370 | glycerol kinase activity(GO:0004370) |
| 0.1 | 0.5 | GO:0047288 | monosialoganglioside sialyltransferase activity(GO:0047288) |
| 0.1 | 5.0 | GO:0050699 | WW domain binding(GO:0050699) |
| 0.1 | 0.9 | GO:0016015 | morphogen activity(GO:0016015) |
| 0.1 | 1.8 | GO:0009982 | pseudouridine synthase activity(GO:0009982) |
| 0.1 | 0.4 | GO:0016639 | oxidoreductase activity, acting on the CH-NH2 group of donors, NAD or NADP as acceptor(GO:0016639) |
| 0.1 | 2.2 | GO:0102391 | decanoate--CoA ligase activity(GO:0102391) |
| 0.1 | 0.5 | GO:0017018 | myosin phosphatase activity(GO:0017018) |
| 0.1 | 0.7 | GO:0017150 | tRNA dihydrouridine synthase activity(GO:0017150) |
| 0.1 | 0.3 | GO:0033265 | choline binding(GO:0033265) |
| 0.1 | 5.1 | GO:0017080 | sodium channel regulator activity(GO:0017080) |
| 0.1 | 0.9 | GO:0043533 | inositol 1,3,4,5 tetrakisphosphate binding(GO:0043533) |
| 0.1 | 0.3 | GO:0052901 | polyamine oxidase activity(GO:0046592) spermine:oxygen oxidoreductase (spermidine-forming) activity(GO:0052901) |
| 0.1 | 0.3 | GO:0005111 | type 2 fibroblast growth factor receptor binding(GO:0005111) |
| 0.1 | 0.3 | GO:0004739 | pyruvate dehydrogenase (acetyl-transferring) activity(GO:0004739) |
| 0.1 | 1.4 | GO:0004985 | opioid receptor activity(GO:0004985) |
| 0.1 | 1.3 | GO:0008061 | chitin binding(GO:0008061) |
| 0.1 | 0.3 | GO:1990190 | peptide-glutamate-N-acetyltransferase activity(GO:1990190) |
| 0.1 | 5.9 | GO:0019212 | phosphatase inhibitor activity(GO:0019212) |
| 0.1 | 2.4 | GO:0032794 | GTPase activating protein binding(GO:0032794) |
| 0.1 | 0.6 | GO:0070891 | lipoteichoic acid binding(GO:0070891) |
| 0.1 | 0.6 | GO:0015198 | oligopeptide transporter activity(GO:0015198) peptide:proton symporter activity(GO:0015333) proton-dependent peptide secondary active transmembrane transporter activity(GO:0022897) |
| 0.1 | 0.5 | GO:0019003 | GDP binding(GO:0019003) |
| 0.1 | 1.7 | GO:0015101 | organic cation transmembrane transporter activity(GO:0015101) |
| 0.1 | 0.3 | GO:0050510 | N-acetylgalactosaminyl-proteoglycan 3-beta-glucuronosyltransferase activity(GO:0050510) |
| 0.1 | 1.2 | GO:0005068 | transmembrane receptor protein tyrosine kinase adaptor activity(GO:0005068) |
| 0.1 | 0.6 | GO:0001025 | RNA polymerase III transcription factor binding(GO:0001025) |
| 0.1 | 1.7 | GO:0008349 | MAP kinase kinase kinase kinase activity(GO:0008349) |
| 0.1 | 0.4 | GO:0004809 | tRNA (guanine-N2-)-methyltransferase activity(GO:0004809) |
| 0.1 | 0.2 | GO:0004850 | uridine phosphorylase activity(GO:0004850) |
| 0.1 | 0.3 | GO:0003990 | acetylcholinesterase activity(GO:0003990) |
| 0.1 | 2.2 | GO:0004622 | lysophospholipase activity(GO:0004622) |
| 0.1 | 0.2 | GO:0042289 | MHC class II protein binding(GO:0042289) |
| 0.1 | 0.4 | GO:0018479 | benzaldehyde dehydrogenase (NAD+) activity(GO:0018479) |
| 0.1 | 0.3 | GO:0004905 | type I interferon receptor activity(GO:0004905) |
| 0.1 | 0.9 | GO:0030247 | pattern binding(GO:0001871) polysaccharide binding(GO:0030247) |
| 0.1 | 0.7 | GO:0035242 | protein-arginine omega-N asymmetric methyltransferase activity(GO:0035242) |
| 0.1 | 8.2 | GO:0000979 | RNA polymerase II core promoter sequence-specific DNA binding(GO:0000979) |
| 0.1 | 1.2 | GO:0044548 | S100 protein binding(GO:0044548) |
| 0.1 | 0.3 | GO:0031728 | CCR3 chemokine receptor binding(GO:0031728) |
| 0.1 | 0.7 | GO:0042799 | histone methyltransferase activity (H4-K20 specific)(GO:0042799) |
| 0.1 | 4.5 | GO:0019208 | phosphatase regulator activity(GO:0019208) |
| 0.1 | 0.4 | GO:0030197 | extracellular matrix constituent, lubricant activity(GO:0030197) |
| 0.1 | 0.4 | GO:0042835 | BRE binding(GO:0042835) |
| 0.1 | 0.7 | GO:0004028 | 3-chloroallyl aldehyde dehydrogenase activity(GO:0004028) aldehyde dehydrogenase [NAD(P)+] activity(GO:0004030) |
| 0.1 | 0.5 | GO:0019237 | centromeric DNA binding(GO:0019237) |
| 0.1 | 0.4 | GO:0035662 | Toll-like receptor 4 binding(GO:0035662) |
| 0.1 | 0.3 | GO:0031683 | G-protein beta/gamma-subunit complex binding(GO:0031683) |
| 0.1 | 0.2 | GO:0004307 | diacylglycerol cholinephosphotransferase activity(GO:0004142) ethanolaminephosphotransferase activity(GO:0004307) |
| 0.1 | 1.2 | GO:0005314 | high-affinity glutamate transmembrane transporter activity(GO:0005314) |
| 0.1 | 0.3 | GO:0004965 | G-protein coupled GABA receptor activity(GO:0004965) |
| 0.1 | 0.4 | GO:0016530 | metallochaperone activity(GO:0016530) |
| 0.1 | 0.3 | GO:0032027 | myosin light chain binding(GO:0032027) |
| 0.1 | 0.2 | GO:0004382 | guanosine-diphosphatase activity(GO:0004382) |
| 0.1 | 0.6 | GO:0015288 | porin activity(GO:0015288) |
| 0.1 | 0.7 | GO:0031698 | beta-2 adrenergic receptor binding(GO:0031698) |
| 0.1 | 0.3 | GO:0050436 | microfibril binding(GO:0050436) |
| 0.1 | 0.3 | GO:0005220 | inositol 1,4,5-trisphosphate-sensitive calcium-release channel activity(GO:0005220) |
| 0.1 | 0.7 | GO:0005078 | MAP-kinase scaffold activity(GO:0005078) |
| 0.1 | 2.0 | GO:0005031 | tumor necrosis factor-activated receptor activity(GO:0005031) death receptor activity(GO:0005035) |
| 0.1 | 0.5 | GO:0019960 | C-X3-C chemokine binding(GO:0019960) |
| 0.1 | 0.9 | GO:0015926 | glucosidase activity(GO:0015926) |
| 0.1 | 0.3 | GO:0035614 | snRNA stem-loop binding(GO:0035614) |
| 0.1 | 1.7 | GO:0098641 | cadherin binding involved in cell-cell adhesion(GO:0098641) |
| 0.1 | 0.2 | GO:0003938 | IMP dehydrogenase activity(GO:0003938) |
| 0.1 | 0.6 | GO:0004332 | fructose-bisphosphate aldolase activity(GO:0004332) |
| 0.1 | 0.5 | GO:0060002 | plus-end directed microfilament motor activity(GO:0060002) |
| 0.1 | 0.8 | GO:0001730 | 2'-5'-oligoadenylate synthetase activity(GO:0001730) |
| 0.1 | 0.6 | GO:0004931 | extracellular ATP-gated cation channel activity(GO:0004931) ATP-gated ion channel activity(GO:0035381) |
| 0.1 | 0.3 | GO:0017108 | 5'-flap endonuclease activity(GO:0017108) |
| 0.1 | 1.2 | GO:0030275 | LRR domain binding(GO:0030275) |
| 0.1 | 1.2 | GO:0043495 | protein anchor(GO:0043495) |
| 0.1 | 3.3 | GO:0005044 | scavenger receptor activity(GO:0005044) |
| 0.1 | 0.3 | GO:0015184 | L-cystine transmembrane transporter activity(GO:0015184) |
| 0.1 | 0.8 | GO:0003688 | DNA replication origin binding(GO:0003688) |
| 0.1 | 1.7 | GO:0001848 | complement binding(GO:0001848) |
| 0.0 | 0.8 | GO:0019841 | retinol binding(GO:0019841) |
| 0.0 | 1.3 | GO:0070064 | proline-rich region binding(GO:0070064) |
| 0.0 | 0.3 | GO:0086083 | cell adhesive protein binding involved in bundle of His cell-Purkinje myocyte communication(GO:0086083) |
| 0.0 | 0.3 | GO:0043199 | sulfate binding(GO:0043199) |
| 0.0 | 0.6 | GO:0003836 | beta-galactoside (CMP) alpha-2,3-sialyltransferase activity(GO:0003836) |
| 0.0 | 0.4 | GO:0004024 | alcohol dehydrogenase activity, zinc-dependent(GO:0004024) |
| 0.0 | 0.2 | GO:0000179 | rRNA (adenine-N6,N6-)-dimethyltransferase activity(GO:0000179) |
| 0.0 | 2.9 | GO:0042169 | SH2 domain binding(GO:0042169) |
| 0.0 | 4.4 | GO:0005201 | extracellular matrix structural constituent(GO:0005201) |
| 0.0 | 0.1 | GO:0004618 | phosphoglycerate kinase activity(GO:0004618) |
| 0.0 | 0.2 | GO:0008426 | protein kinase C inhibitor activity(GO:0008426) |
| 0.0 | 20.1 | GO:0003924 | GTPase activity(GO:0003924) |
| 0.0 | 1.2 | GO:0004385 | guanylate kinase activity(GO:0004385) |
| 0.0 | 0.2 | GO:0004341 | gluconolactonase activity(GO:0004341) |
| 0.0 | 1.0 | GO:0052629 | phosphatidylinositol-3,5-bisphosphate 3-phosphatase activity(GO:0052629) |
| 0.0 | 1.1 | GO:0046965 | retinoid X receptor binding(GO:0046965) |
| 0.0 | 4.0 | GO:0004402 | histone acetyltransferase activity(GO:0004402) |
| 0.0 | 0.9 | GO:0043560 | insulin receptor substrate binding(GO:0043560) |
| 0.0 | 6.1 | GO:0004896 | cytokine receptor activity(GO:0004896) |
| 0.0 | 0.6 | GO:0051434 | BH3 domain binding(GO:0051434) |
| 0.0 | 1.4 | GO:0005251 | delayed rectifier potassium channel activity(GO:0005251) |
| 0.0 | 0.2 | GO:1902444 | riboflavin binding(GO:1902444) |
| 0.0 | 0.6 | GO:0019103 | pyrimidine nucleotide binding(GO:0019103) |
| 0.0 | 0.9 | GO:0035925 | mRNA 3'-UTR AU-rich region binding(GO:0035925) |
| 0.0 | 0.2 | GO:0008889 | glycerophosphodiester phosphodiesterase activity(GO:0008889) |
| 0.0 | 1.2 | GO:0070006 | metalloaminopeptidase activity(GO:0070006) |
| 0.0 | 0.3 | GO:0015307 | drug:proton antiporter activity(GO:0015307) |
| 0.0 | 0.5 | GO:0043138 | 3'-5' DNA helicase activity(GO:0043138) |
| 0.0 | 0.3 | GO:0030628 | pre-mRNA 3'-splice site binding(GO:0030628) |
| 0.0 | 0.1 | GO:0086059 | voltage-gated calcium channel activity involved SA node cell action potential(GO:0086059) |
| 0.0 | 0.4 | GO:0001733 | galactosylceramide sulfotransferase activity(GO:0001733) galactose 3-O-sulfotransferase activity(GO:0050694) |
| 0.0 | 0.3 | GO:0047429 | nucleoside-triphosphate diphosphatase activity(GO:0047429) |
| 0.0 | 0.1 | GO:0004937 | alpha1-adrenergic receptor activity(GO:0004937) |
| 0.0 | 0.6 | GO:0005522 | profilin binding(GO:0005522) |
| 0.0 | 0.7 | GO:0032183 | SUMO binding(GO:0032183) |
| 0.0 | 0.5 | GO:0031628 | opioid receptor binding(GO:0031628) |
| 0.0 | 2.0 | GO:0017112 | Rab guanyl-nucleotide exchange factor activity(GO:0017112) |
| 0.0 | 0.3 | GO:0016907 | G-protein coupled acetylcholine receptor activity(GO:0016907) |
| 0.0 | 0.3 | GO:0030160 | GKAP/Homer scaffold activity(GO:0030160) |
| 0.0 | 0.4 | GO:0000182 | rDNA binding(GO:0000182) |
| 0.0 | 0.4 | GO:0035613 | RNA stem-loop binding(GO:0035613) |
| 0.0 | 0.1 | GO:0036505 | prosaposin receptor activity(GO:0036505) |
| 0.0 | 0.9 | GO:0005092 | GDP-dissociation inhibitor activity(GO:0005092) |
| 0.0 | 0.2 | GO:0033765 | 3-oxo-5-alpha-steroid 4-dehydrogenase activity(GO:0003865) steroid dehydrogenase activity, acting on the CH-CH group of donors(GO:0033765) cholestenone 5-alpha-reductase activity(GO:0047751) |
| 0.0 | 0.4 | GO:0008429 | phosphatidylethanolamine binding(GO:0008429) |
| 0.0 | 0.2 | GO:1990254 | keratin filament binding(GO:1990254) |
| 0.0 | 0.4 | GO:0022833 | mechanically-gated ion channel activity(GO:0008381) mechanically gated channel activity(GO:0022833) |
| 0.0 | 6.6 | GO:0001047 | core promoter binding(GO:0001047) |
| 0.0 | 1.0 | GO:0005212 | structural constituent of eye lens(GO:0005212) |
| 0.0 | 3.5 | GO:0051117 | ATPase binding(GO:0051117) |
| 0.0 | 5.7 | GO:0004222 | metalloendopeptidase activity(GO:0004222) |
| 0.0 | 0.3 | GO:0047498 | calcium-dependent phospholipase A2 activity(GO:0047498) |
| 0.0 | 0.9 | GO:0022840 | leak channel activity(GO:0022840) narrow pore channel activity(GO:0022842) |
| 0.0 | 0.1 | GO:0030272 | 5-formyltetrahydrofolate cyclo-ligase activity(GO:0030272) |
| 0.0 | 0.2 | GO:0004140 | dephospho-CoA kinase activity(GO:0004140) |
| 0.0 | 1.0 | GO:0005001 | transmembrane receptor protein tyrosine phosphatase activity(GO:0005001) transmembrane receptor protein phosphatase activity(GO:0019198) |
| 0.0 | 0.3 | GO:0086008 | voltage-gated potassium channel activity involved in cardiac muscle cell action potential repolarization(GO:0086008) |
| 0.0 | 0.6 | GO:0032036 | myosin heavy chain binding(GO:0032036) |
| 0.0 | 0.1 | GO:0034988 | Fc-gamma receptor I complex binding(GO:0034988) |
| 0.0 | 0.7 | GO:0070016 | armadillo repeat domain binding(GO:0070016) |
| 0.0 | 0.4 | GO:0098632 | protein binding involved in cell-cell adhesion(GO:0098632) |
| 0.0 | 0.6 | GO:0016846 | carbon-sulfur lyase activity(GO:0016846) |
| 0.0 | 0.1 | GO:0004796 | thromboxane-A synthase activity(GO:0004796) 12-hydroxyheptadecatrienoic acid synthase activity(GO:0036134) |
| 0.0 | 0.1 | GO:0004949 | cannabinoid receptor activity(GO:0004949) |
| 0.0 | 0.3 | GO:0032190 | acrosin binding(GO:0032190) |
| 0.0 | 1.3 | GO:0004033 | aldo-keto reductase (NADP) activity(GO:0004033) |
| 0.0 | 0.3 | GO:1904929 | coreceptor activity involved in Wnt signaling pathway, planar cell polarity pathway(GO:1904929) |
| 0.0 | 0.6 | GO:0015377 | cation:chloride symporter activity(GO:0015377) |
| 0.0 | 3.1 | GO:0001618 | virus receptor activity(GO:0001618) |
| 0.0 | 0.3 | GO:0032050 | clathrin heavy chain binding(GO:0032050) |
| 0.0 | 1.7 | GO:0061631 | ubiquitin conjugating enzyme activity(GO:0061631) |
| 0.0 | 6.3 | GO:0004386 | helicase activity(GO:0004386) |
| 0.0 | 0.1 | GO:0098988 | adenylate cyclase inhibiting G-protein coupled glutamate receptor activity(GO:0001640) G-protein coupled glutamate receptor activity(GO:0098988) |
| 0.0 | 0.1 | GO:0004507 | steroid 11-beta-monooxygenase activity(GO:0004507) corticosterone 18-monooxygenase activity(GO:0047783) |
| 0.0 | 0.7 | GO:0005112 | Notch binding(GO:0005112) |
| 0.0 | 0.3 | GO:0042609 | CD4 receptor binding(GO:0042609) |
| 0.0 | 0.1 | GO:0005046 | KDEL sequence binding(GO:0005046) |
| 0.0 | 0.1 | GO:0061752 | telomeric repeat-containing RNA binding(GO:0061752) |
| 0.0 | 0.4 | GO:0022851 | GABA-gated chloride ion channel activity(GO:0022851) |
| 0.0 | 0.1 | GO:0071207 | histone pre-mRNA stem-loop binding(GO:0071207) |
| 0.0 | 0.2 | GO:0015057 | thrombin receptor activity(GO:0015057) |
| 0.0 | 0.1 | GO:0004609 | phosphatidylserine decarboxylase activity(GO:0004609) |
| 0.0 | 0.6 | GO:0005520 | insulin-like growth factor binding(GO:0005520) |
| 0.0 | 1.0 | GO:0008331 | high voltage-gated calcium channel activity(GO:0008331) |
| 0.0 | 6.4 | GO:0017137 | Rab GTPase binding(GO:0017137) |
| 0.0 | 0.3 | GO:0010853 | cyclase activator activity(GO:0010853) guanylate cyclase activator activity(GO:0030250) |
| 0.0 | 0.1 | GO:0004668 | protein-arginine deiminase activity(GO:0004668) |
| 0.0 | 0.8 | GO:0016917 | GABA-A receptor activity(GO:0004890) GABA receptor activity(GO:0016917) |
| 0.0 | 0.6 | GO:0017160 | Ral GTPase binding(GO:0017160) |
| 0.0 | 0.5 | GO:0005344 | oxygen transporter activity(GO:0005344) |
| 0.0 | 0.8 | GO:0005245 | voltage-gated calcium channel activity(GO:0005245) |
| 0.0 | 0.2 | GO:0050659 | N-acetylgalactosamine 4-sulfate 6-O-sulfotransferase activity(GO:0050659) |
| 0.0 | 0.2 | GO:0016832 | aldehyde-lyase activity(GO:0016832) |
| 0.0 | 0.9 | GO:0004708 | MAP kinase kinase activity(GO:0004708) |
| 0.0 | 0.1 | GO:0034353 | RNA pyrophosphohydrolase activity(GO:0034353) |
| 0.0 | 0.6 | GO:0004143 | diacylglycerol kinase activity(GO:0004143) |
| 0.0 | 0.2 | GO:0045174 | glutathione dehydrogenase (ascorbate) activity(GO:0045174) methylarsonate reductase activity(GO:0050610) |
| 0.0 | 0.8 | GO:0004435 | phosphatidylinositol phospholipase C activity(GO:0004435) |
| 0.0 | 0.1 | GO:0044715 | 8-oxo-dGDP phosphatase activity(GO:0044715) |
| 0.0 | 0.2 | GO:0004128 | cytochrome-b5 reductase activity, acting on NAD(P)H(GO:0004128) |
| 0.0 | 0.7 | GO:0071889 | 14-3-3 protein binding(GO:0071889) |
| 0.0 | 0.6 | GO:0042800 | histone methyltransferase activity (H3-K4 specific)(GO:0042800) |
| 0.0 | 0.7 | GO:1990841 | promoter-specific chromatin binding(GO:1990841) |
| 0.0 | 0.4 | GO:0001055 | RNA polymerase II activity(GO:0001055) |
| 0.0 | 1.3 | GO:0070063 | RNA polymerase binding(GO:0070063) |
| 0.0 | 0.1 | GO:0044736 | acid-sensing ion channel activity(GO:0044736) |
| 0.0 | 0.2 | GO:0019784 | NEDD8-specific protease activity(GO:0019784) |
| 0.0 | 0.2 | GO:0070740 | tubulin-glutamic acid ligase activity(GO:0070740) |
| 0.0 | 0.4 | GO:0000983 | transcription factor activity, RNA polymerase II core promoter sequence-specific(GO:0000983) |
| 0.0 | 0.2 | GO:0098821 | BMP receptor activity(GO:0098821) |
| 0.0 | 0.1 | GO:0044378 | non-sequence-specific DNA binding, bending(GO:0044378) |
| 0.0 | 0.2 | GO:0008525 | phosphatidylcholine transporter activity(GO:0008525) |
| 0.0 | 0.6 | GO:0017147 | Wnt-protein binding(GO:0017147) |
| 0.0 | 3.6 | GO:0019902 | phosphatase binding(GO:0019902) |
| 0.0 | 0.3 | GO:0030280 | structural constituent of epidermis(GO:0030280) |
| 0.0 | 0.5 | GO:0050321 | tau-protein kinase activity(GO:0050321) |
| 0.0 | 0.1 | GO:0032393 | MHC class I receptor activity(GO:0032393) |
| 0.0 | 0.9 | GO:0031624 | ubiquitin conjugating enzyme binding(GO:0031624) |
| 0.0 | 0.1 | GO:0008321 | Ral guanyl-nucleotide exchange factor activity(GO:0008321) |
| 0.0 | 0.3 | GO:0042288 | MHC class I protein binding(GO:0042288) |
| 0.0 | 0.1 | GO:0097371 | MDM2/MDM4 family protein binding(GO:0097371) |
| 0.0 | 0.7 | GO:0030332 | cyclin binding(GO:0030332) |
| 0.0 | 0.6 | GO:0034237 | protein kinase A regulatory subunit binding(GO:0034237) |
| 0.0 | 0.1 | GO:0071885 | N-terminal protein N-methyltransferase activity(GO:0071885) |
| 0.0 | 0.4 | GO:0001968 | fibronectin binding(GO:0001968) |
| 0.0 | 0.2 | GO:0050700 | CARD domain binding(GO:0050700) |
| 0.0 | 1.0 | GO:0008536 | Ran GTPase binding(GO:0008536) |
| 0.0 | 0.0 | GO:0034191 | apolipoprotein A-I receptor binding(GO:0034191) |
| 0.0 | 0.1 | GO:0003827 | alpha-1,3-mannosylglycoprotein 2-beta-N-acetylglucosaminyltransferase activity(GO:0003827) |
| 0.0 | 0.2 | GO:0032051 | clathrin light chain binding(GO:0032051) |
| 0.0 | 0.1 | GO:0031781 | melanocortin receptor binding(GO:0031779) type 3 melanocortin receptor binding(GO:0031781) type 4 melanocortin receptor binding(GO:0031782) |
| 0.0 | 0.1 | GO:0005353 | fructose transmembrane transporter activity(GO:0005353) |
| 0.0 | 1.1 | GO:0002039 | p53 binding(GO:0002039) |
| 0.0 | 0.1 | GO:0004980 | melanocyte-stimulating hormone receptor activity(GO:0004980) |
| 0.0 | 0.4 | GO:0015095 | magnesium ion transmembrane transporter activity(GO:0015095) |
| 0.0 | 0.5 | GO:0048020 | CCR chemokine receptor binding(GO:0048020) |
| 0.0 | 0.2 | GO:0004062 | aryl sulfotransferase activity(GO:0004062) |
| 0.0 | 0.6 | GO:0004693 | cyclin-dependent protein serine/threonine kinase activity(GO:0004693) |
| 0.0 | 0.3 | GO:0036374 | glutathione hydrolase activity(GO:0036374) |
| 0.0 | 0.5 | GO:0005549 | odorant binding(GO:0005549) |
| 0.0 | 0.3 | GO:0008179 | adenylate cyclase binding(GO:0008179) |
| 0.0 | 0.3 | GO:0005123 | death receptor binding(GO:0005123) |
| 0.0 | 0.8 | GO:0004715 | non-membrane spanning protein tyrosine kinase activity(GO:0004715) |
| 0.0 | 0.2 | GO:0001206 | transcriptional repressor activity, RNA polymerase II distal enhancer sequence-specific binding(GO:0001206) |
| 0.0 | 0.1 | GO:0019828 | aspartic-type endopeptidase inhibitor activity(GO:0019828) |
| 0.0 | 0.1 | GO:0005025 | transforming growth factor beta receptor activity, type I(GO:0005025) |
| 0.0 | 0.1 | GO:0044547 | DNA topoisomerase binding(GO:0044547) |
| 0.0 | 0.3 | GO:0043295 | glutathione binding(GO:0043295) |
| 0.0 | 0.1 | GO:0004673 | protein histidine kinase activity(GO:0004673) |
| 0.0 | 0.1 | GO:0060072 | large conductance calcium-activated potassium channel activity(GO:0060072) |
| 0.0 | 0.3 | GO:0005247 | voltage-gated chloride channel activity(GO:0005247) |
| 0.0 | 0.7 | GO:0000049 | tRNA binding(GO:0000049) |
| 0.0 | 0.1 | GO:0004972 | NMDA glutamate receptor activity(GO:0004972) |
| 0.0 | 0.1 | GO:0003910 | DNA ligase (ATP) activity(GO:0003910) |
| 0.0 | 0.4 | GO:0030676 | Rac guanyl-nucleotide exchange factor activity(GO:0030676) |
| 0.0 | 0.2 | GO:0023026 | MHC class II protein complex binding(GO:0023026) |
| 0.0 | 0.1 | GO:0004359 | glutaminase activity(GO:0004359) |
| 0.0 | 0.2 | GO:0005432 | calcium:sodium antiporter activity(GO:0005432) |
| 0.0 | 0.2 | GO:0000774 | adenyl-nucleotide exchange factor activity(GO:0000774) |
| 0.0 | 0.1 | GO:0017060 | 3-galactosyl-N-acetylglucosaminide 4-alpha-L-fucosyltransferase activity(GO:0017060) |
| 0.0 | 1.3 | GO:0017048 | Rho GTPase binding(GO:0017048) |
| 0.0 | 0.1 | GO:0015129 | lactate transmembrane transporter activity(GO:0015129) |
| 0.0 | 0.1 | GO:0070735 | protein-glycine ligase activity(GO:0070735) |
| 0.0 | 0.1 | GO:0001665 | alpha-N-acetylgalactosaminide alpha-2,6-sialyltransferase activity(GO:0001665) |
| 0.0 | 0.0 | GO:0050146 | nucleoside phosphotransferase activity(GO:0050146) |
Gene overrepresentation in curated gene sets: canonical pathways category:
| Log-likelihood per target | Total log-likelihood | Term | Description |
|---|---|---|---|
| 0.4 | 2.2 | PID INTEGRIN4 PATHWAY | Alpha6 beta4 integrin-ligand interactions |
| 0.4 | 5.3 | ST TYPE I INTERFERON PATHWAY | Type I Interferon (alpha/beta IFN) Pathway |
| 0.3 | 0.3 | SA TRKA RECEPTOR | The TrkA receptor binds nerve growth factor to activate MAP kinase pathways and promote cell growth. |
| 0.3 | 8.7 | SA MMP CYTOKINE CONNECTION | Cytokines can induce activation of matrix metalloproteinases, which degrade extracellular matrix. |
| 0.2 | 7.9 | PID IL27 PATHWAY | IL27-mediated signaling events |
| 0.2 | 7.7 | PID SMAD2 3PATHWAY | Regulation of cytoplasmic and nuclear SMAD2/3 signaling |
| 0.2 | 5.6 | SA FAS SIGNALING | The TNF-type receptor Fas induces apoptosis on ligand binding. |
| 0.2 | 7.8 | SIG IL4RECEPTOR IN B LYPHOCYTES | Genes related to IL4 rceptor signaling in B lymphocytes |
| 0.2 | 0.3 | ST INTERLEUKIN 4 PATHWAY | Interleukin 4 (IL-4) Pathway |
| 0.2 | 9.7 | NABA BASEMENT MEMBRANES | Genes encoding structural components of basement membranes |
| 0.1 | 3.4 | PID ANTHRAX PATHWAY | Cellular roles of Anthrax toxin |
| 0.1 | 6.0 | PID IL8 CXCR2 PATHWAY | IL8- and CXCR2-mediated signaling events |
| 0.1 | 3.4 | PID HEDGEHOG 2PATHWAY | Signaling events mediated by the Hedgehog family |
| 0.1 | 5.1 | PID NECTIN PATHWAY | Nectin adhesion pathway |
| 0.1 | 1.2 | PID IL5 PATHWAY | IL5-mediated signaling events |
| 0.1 | 4.2 | NABA COLLAGENS | Genes encoding collagen proteins |
| 0.1 | 8.2 | PID TAP63 PATHWAY | Validated transcriptional targets of TAp63 isoforms |
| 0.1 | 2.1 | PID ECADHERIN KERATINOCYTE PATHWAY | E-cadherin signaling in keratinocytes |
| 0.1 | 2.1 | PID IL23 PATHWAY | IL23-mediated signaling events |
| 0.1 | 8.3 | PID TRKR PATHWAY | Neurotrophic factor-mediated Trk receptor signaling |
| 0.1 | 1.9 | PID FAS PATHWAY | FAS (CD95) signaling pathway |
| 0.1 | 3.9 | PID HIV NEF PATHWAY | HIV-1 Nef: Negative effector of Fas and TNF-alpha |
| 0.1 | 3.0 | PID IL1 PATHWAY | IL1-mediated signaling events |
| 0.1 | 2.7 | PID CD40 PATHWAY | CD40/CD40L signaling |
| 0.1 | 1.6 | PID INSULIN GLUCOSE PATHWAY | Insulin-mediated glucose transport |
| 0.1 | 1.2 | ST GRANULE CELL SURVIVAL PATHWAY | Granule Cell Survival Pathway is a specific case of more general PAC1 Receptor Pathway. |
| 0.1 | 0.9 | SA REG CASCADE OF CYCLIN EXPR | Expression of cyclins regulates progression through the cell cycle by activating cyclin-dependent kinases. |
| 0.1 | 4.8 | PID ATF2 PATHWAY | ATF-2 transcription factor network |
| 0.1 | 8.9 | PID PDGFRB PATHWAY | PDGFR-beta signaling pathway |
| 0.1 | 3.9 | PID DELTA NP63 PATHWAY | Validated transcriptional targets of deltaNp63 isoforms |
| 0.1 | 1.9 | PID INTEGRIN3 PATHWAY | Beta3 integrin cell surface interactions |
| 0.1 | 0.4 | PID FRA PATHWAY | Validated transcriptional targets of AP1 family members Fra1 and Fra2 |
| 0.1 | 1.3 | PID CXCR4 PATHWAY | CXCR4-mediated signaling events |
| 0.1 | 3.7 | PID HES HEY PATHWAY | Notch-mediated HES/HEY network |
| 0.1 | 2.0 | ST G ALPHA I PATHWAY | G alpha i Pathway |
| 0.1 | 1.3 | PID MYC PATHWAY | C-MYC pathway |
| 0.1 | 3.4 | PID LKB1 PATHWAY | LKB1 signaling events |
| 0.1 | 1.5 | PID PRL SIGNALING EVENTS PATHWAY | Signaling events mediated by PRL |
| 0.1 | 20.5 | NABA SECRETED FACTORS | Genes encoding secreted soluble factors |
| 0.1 | 0.8 | ST DIFFERENTIATION PATHWAY IN PC12 CELLS | Differentiation Pathway in PC12 Cells; this is a specific case of PAC1 Receptor Pathway. |
| 0.0 | 0.6 | PID INTEGRIN5 PATHWAY | Beta5 beta6 beta7 and beta8 integrin cell surface interactions |
| 0.0 | 2.3 | PID INTEGRIN2 PATHWAY | Beta2 integrin cell surface interactions |
| 0.0 | 0.3 | PID NFAT 3PATHWAY | Role of Calcineurin-dependent NFAT signaling in lymphocytes |
| 0.0 | 1.1 | PID PI3KCI PATHWAY | Class I PI3K signaling events |
| 0.0 | 2.6 | PID FOXO PATHWAY | FoxO family signaling |
| 0.0 | 1.8 | PID TCR CALCIUM PATHWAY | Calcium signaling in the CD4+ TCR pathway |
| 0.0 | 0.9 | PID HIF1A PATHWAY | Hypoxic and oxygen homeostasis regulation of HIF-1-alpha |
| 0.0 | 0.4 | SIG PIP3 SIGNALING IN B LYMPHOCYTES | Genes related to PIP3 signaling in B lymphocytes |
| 0.0 | 0.7 | ST TUMOR NECROSIS FACTOR PATHWAY | Tumor Necrosis Factor Pathway. |
| 0.0 | 0.6 | PID KIT PATHWAY | Signaling events mediated by Stem cell factor receptor (c-Kit) |
| 0.0 | 1.1 | PID WNT NONCANONICAL PATHWAY | Noncanonical Wnt signaling pathway |
| 0.0 | 0.9 | PID ARF 3PATHWAY | Arf1 pathway |
| 0.0 | 1.3 | PID RHOA PATHWAY | RhoA signaling pathway |
| 0.0 | 0.6 | PID CIRCADIAN PATHWAY | Circadian rhythm pathway |
| 0.0 | 1.0 | PID IL4 2PATHWAY | IL4-mediated signaling events |
| 0.0 | 0.3 | SA CASPASE CASCADE | Apoptosis is mediated by caspases, cysteine proteases arranged in a proteolytic cascade. |
| 0.0 | 0.6 | PID FANCONI PATHWAY | Fanconi anemia pathway |
| 0.0 | 0.5 | PID AR NONGENOMIC PATHWAY | Nongenotropic Androgen signaling |
| 0.0 | 0.3 | PID BETA CATENIN DEG PATHWAY | Degradation of beta catenin |
| 0.0 | 0.7 | PID FAK PATHWAY | Signaling events mediated by focal adhesion kinase |
| 0.0 | 0.9 | PID AURORA A PATHWAY | Aurora A signaling |
| 0.0 | 1.2 | PID ERBB1 DOWNSTREAM PATHWAY | ErbB1 downstream signaling |
| 0.0 | 0.3 | PID A6B1 A6B4 INTEGRIN PATHWAY | a6b1 and a6b4 Integrin signaling |
| 0.0 | 0.3 | PID GLYPICAN 1PATHWAY | Glypican 1 network |
| 0.0 | 1.1 | PID ARF6 TRAFFICKING PATHWAY | Arf6 trafficking events |
| 0.0 | 1.6 | PID MYC REPRESS PATHWAY | Validated targets of C-MYC transcriptional repression |
| 0.0 | 0.6 | PID ATR PATHWAY | ATR signaling pathway |
| 0.0 | 1.5 | PID TELOMERASE PATHWAY | Regulation of Telomerase |
| 0.0 | 0.0 | PID ALK2 PATHWAY | ALK2 signaling events |
| 0.0 | 0.5 | PID ECADHERIN NASCENT AJ PATHWAY | E-cadherin signaling in the nascent adherens junction |
| 0.0 | 0.3 | ST FAS SIGNALING PATHWAY | Fas Signaling Pathway |
| 0.0 | 0.7 | PID AR TF PATHWAY | Regulation of Androgen receptor activity |
| 0.0 | 1.7 | PID P53 DOWNSTREAM PATHWAY | Direct p53 effectors |
| 0.0 | 0.9 | PID HIF1 TFPATHWAY | HIF-1-alpha transcription factor network |
| 0.0 | 0.6 | PID HNF3B PATHWAY | FOXA2 and FOXA3 transcription factor networks |
| 0.0 | 1.1 | PID RHOA REG PATHWAY | Regulation of RhoA activity |
| 0.0 | 0.5 | PID REG GR PATHWAY | Glucocorticoid receptor regulatory network |
| 0.0 | 0.3 | PID NFAT TFPATHWAY | Calcineurin-regulated NFAT-dependent transcription in lymphocytes |
Gene overrepresentation in curated gene sets: REACTOME pathways category:
| Log-likelihood per target | Total log-likelihood | Term | Description |
|---|---|---|---|
| 0.7 | 0.7 | REACTOME BOTULINUM NEUROTOXICITY | Genes involved in Botulinum neurotoxicity |
| 0.4 | 14.5 | REACTOME SIGNALING BY NODAL | Genes involved in Signaling by NODAL |
| 0.3 | 0.3 | REACTOME TRANSLOCATION OF ZAP 70 TO IMMUNOLOGICAL SYNAPSE | Genes involved in Translocation of ZAP-70 to Immunological synapse |
| 0.3 | 0.3 | REACTOME ERK MAPK TARGETS | Genes involved in ERK/MAPK targets |
| 0.2 | 4.6 | REACTOME SEMA3A PLEXIN REPULSION SIGNALING BY INHIBITING INTEGRIN ADHESION | Genes involved in SEMA3A-Plexin repulsion signaling by inhibiting Integrin adhesion |
| 0.2 | 5.0 | REACTOME HYALURONAN UPTAKE AND DEGRADATION | Genes involved in Hyaluronan uptake and degradation |
| 0.2 | 2.7 | REACTOME CRMPS IN SEMA3A SIGNALING | Genes involved in CRMPs in Sema3A signaling |
| 0.2 | 5.4 | REACTOME EXTRINSIC PATHWAY FOR APOPTOSIS | Genes involved in Extrinsic Pathway for Apoptosis |
| 0.2 | 6.7 | REACTOME HS GAG BIOSYNTHESIS | Genes involved in HS-GAG biosynthesis |
| 0.1 | 10.0 | REACTOME CDK MEDIATED PHOSPHORYLATION AND REMOVAL OF CDC6 | Genes involved in CDK-mediated phosphorylation and removal of Cdc6 |
| 0.1 | 2.3 | REACTOME REVERSIBLE HYDRATION OF CARBON DIOXIDE | Genes involved in Reversible Hydration of Carbon Dioxide |
| 0.1 | 4.9 | REACTOME HORMONE SENSITIVE LIPASE HSL MEDIATED TRIACYLGLYCEROL HYDROLYSIS | Genes involved in Hormone-sensitive lipase (HSL)-mediated triacylglycerol hydrolysis |
| 0.1 | 2.9 | REACTOME ACTIVATION OF RAC | Genes involved in Activation of Rac |
| 0.1 | 1.3 | REACTOME P75NTR RECRUITS SIGNALLING COMPLEXES | Genes involved in p75NTR recruits signalling complexes |
| 0.1 | 8.2 | REACTOME CHEMOKINE RECEPTORS BIND CHEMOKINES | Genes involved in Chemokine receptors bind chemokines |
| 0.1 | 2.1 | REACTOME IL 7 SIGNALING | Genes involved in Interleukin-7 signaling |
| 0.1 | 2.9 | REACTOME AKT PHOSPHORYLATES TARGETS IN THE CYTOSOL | Genes involved in AKT phosphorylates targets in the cytosol |
| 0.1 | 4.8 | REACTOME SEMA4D INDUCED CELL MIGRATION AND GROWTH CONE COLLAPSE | Genes involved in Sema4D induced cell migration and growth-cone collapse |
| 0.1 | 3.2 | REACTOME POST CHAPERONIN TUBULIN FOLDING PATHWAY | Genes involved in Post-chaperonin tubulin folding pathway |
| 0.1 | 12.2 | REACTOME INTERFERON ALPHA BETA SIGNALING | Genes involved in Interferon alpha/beta signaling |
| 0.1 | 2.8 | REACTOME RETROGRADE NEUROTROPHIN SIGNALLING | Genes involved in Retrograde neurotrophin signalling |
| 0.1 | 4.8 | REACTOME ADHERENS JUNCTIONS INTERACTIONS | Genes involved in Adherens junctions interactions |
| 0.1 | 1.0 | REACTOME NFKB ACTIVATION THROUGH FADD RIP1 PATHWAY MEDIATED BY CASPASE 8 AND10 | Genes involved in NF-kB activation through FADD/RIP-1 pathway mediated by caspase-8 and -10 |
| 0.1 | 2.8 | REACTOME CYTOSOLIC SULFONATION OF SMALL MOLECULES | Genes involved in Cytosolic sulfonation of small molecules |
| 0.1 | 0.6 | REACTOME SOS MEDIATED SIGNALLING | Genes involved in SOS-mediated signalling |
| 0.1 | 1.7 | REACTOME SYNTHESIS OF PIPS AT THE LATE ENDOSOME MEMBRANE | Genes involved in Synthesis of PIPs at the late endosome membrane |
| 0.1 | 3.1 | REACTOME NA CL DEPENDENT NEUROTRANSMITTER TRANSPORTERS | Genes involved in Na+/Cl- dependent neurotransmitter transporters |
| 0.1 | 3.0 | REACTOME ABORTIVE ELONGATION OF HIV1 TRANSCRIPT IN THE ABSENCE OF TAT | Genes involved in Abortive elongation of HIV-1 transcript in the absence of Tat |
| 0.1 | 1.9 | REACTOME ARMS MEDIATED ACTIVATION | Genes involved in ARMS-mediated activation |
| 0.1 | 1.0 | REACTOME TRAF6 MEDIATED IRF7 ACTIVATION | Genes involved in TRAF6 mediated IRF7 activation |
| 0.1 | 0.9 | REACTOME APOBEC3G MEDIATED RESISTANCE TO HIV1 INFECTION | Genes involved in APOBEC3G mediated resistance to HIV-1 infection |
| 0.1 | 1.6 | REACTOME CHONDROITIN SULFATE BIOSYNTHESIS | Genes involved in Chondroitin sulfate biosynthesis |
| 0.1 | 0.5 | REACTOME AMINE COMPOUND SLC TRANSPORTERS | Genes involved in Amine compound SLC transporters |
| 0.1 | 0.4 | REACTOME ADP SIGNALLING THROUGH P2RY1 | Genes involved in ADP signalling through P2Y purinoceptor 1 |
| 0.1 | 4.9 | REACTOME ION TRANSPORT BY P TYPE ATPASES | Genes involved in Ion transport by P-type ATPases |
| 0.1 | 1.3 | REACTOME INHIBITION OF REPLICATION INITIATION OF DAMAGED DNA BY RB1 E2F1 | Genes involved in Inhibition of replication initiation of damaged DNA by RB1/E2F1 |
| 0.1 | 0.8 | REACTOME PACKAGING OF TELOMERE ENDS | Genes involved in Packaging Of Telomere Ends |
| 0.1 | 2.3 | REACTOME KERATAN SULFATE BIOSYNTHESIS | Genes involved in Keratan sulfate biosynthesis |
| 0.1 | 0.4 | REACTOME SLBP DEPENDENT PROCESSING OF REPLICATION DEPENDENT HISTONE PRE MRNAS | Genes involved in SLBP Dependent Processing of Replication-Dependent Histone Pre-mRNAs |
| 0.1 | 6.7 | REACTOME IMMUNOREGULATORY INTERACTIONS BETWEEN A LYMPHOID AND A NON LYMPHOID CELL | Genes involved in Immunoregulatory interactions between a Lymphoid and a non-Lymphoid cell |
| 0.1 | 1.5 | REACTOME HDL MEDIATED LIPID TRANSPORT | Genes involved in HDL-mediated lipid transport |
| 0.1 | 1.7 | REACTOME A TETRASACCHARIDE LINKER SEQUENCE IS REQUIRED FOR GAG SYNTHESIS | Genes involved in A tetrasaccharide linker sequence is required for GAG synthesis |
| 0.1 | 2.0 | REACTOME ACTIVATED NOTCH1 TRANSMITS SIGNAL TO THE NUCLEUS | Genes involved in Activated NOTCH1 Transmits Signal to the Nucleus |
| 0.1 | 4.8 | REACTOME COLLAGEN FORMATION | Genes involved in Collagen formation |
| 0.1 | 2.3 | REACTOME DEADENYLATION OF MRNA | Genes involved in Deadenylation of mRNA |
| 0.1 | 5.1 | REACTOME NOTCH1 INTRACELLULAR DOMAIN REGULATES TRANSCRIPTION | Genes involved in NOTCH1 Intracellular Domain Regulates Transcription |
| 0.1 | 2.1 | REACTOME SYNTHESIS OF PC | Genes involved in Synthesis of PC |
| 0.1 | 1.2 | REACTOME DARPP 32 EVENTS | Genes involved in DARPP-32 events |
| 0.1 | 1.2 | REACTOME ACTIVATION OF BH3 ONLY PROTEINS | Genes involved in Activation of BH3-only proteins |
| 0.1 | 0.6 | REACTOME PEPTIDE HORMONE BIOSYNTHESIS | Genes involved in Peptide hormone biosynthesis |
| 0.1 | 0.9 | REACTOME TRANSPORT OF ORGANIC ANIONS | Genes involved in Transport of organic anions |
| 0.1 | 0.9 | REACTOME N GLYCAN TRIMMING IN THE ER AND CALNEXIN CALRETICULIN CYCLE | Genes involved in N-glycan trimming in the ER and Calnexin/Calreticulin cycle |
| 0.1 | 0.7 | REACTOME REGULATION OF KIT SIGNALING | Genes involved in Regulation of KIT signaling |
| 0.0 | 1.1 | REACTOME CLASS C 3 METABOTROPIC GLUTAMATE PHEROMONE RECEPTORS | Genes involved in Class C/3 (Metabotropic glutamate/pheromone receptors) |
| 0.0 | 0.5 | REACTOME TGF BETA RECEPTOR SIGNALING ACTIVATES SMADS | Genes involved in TGF-beta receptor signaling activates SMADs |
| 0.0 | 1.1 | REACTOME INTRINSIC PATHWAY FOR APOPTOSIS | Genes involved in Intrinsic Pathway for Apoptosis |
| 0.0 | 1.0 | REACTOME OTHER SEMAPHORIN INTERACTIONS | Genes involved in Other semaphorin interactions |
| 0.0 | 0.8 | REACTOME TANDEM PORE DOMAIN POTASSIUM CHANNELS | Genes involved in Tandem pore domain potassium channels |
| 0.0 | 0.7 | REACTOME ABACAVIR TRANSPORT AND METABOLISM | Genes involved in Abacavir transport and metabolism |
| 0.0 | 0.7 | REACTOME ANDROGEN BIOSYNTHESIS | Genes involved in Androgen biosynthesis |
| 0.0 | 1.2 | REACTOME IL RECEPTOR SHC SIGNALING | Genes involved in Interleukin receptor SHC signaling |
| 0.0 | 1.5 | REACTOME SYNTHESIS OF VERY LONG CHAIN FATTY ACYL COAS | Genes involved in Synthesis of very long-chain fatty acyl-CoAs |
| 0.0 | 1.2 | REACTOME BETA DEFENSINS | Genes involved in Beta defensins |
| 0.0 | 2.9 | REACTOME VOLTAGE GATED POTASSIUM CHANNELS | Genes involved in Voltage gated Potassium channels |
| 0.0 | 0.7 | REACTOME APOPTOTIC CLEAVAGE OF CELL ADHESION PROTEINS | Genes involved in Apoptotic cleavage of cell adhesion proteins |
| 0.0 | 1.7 | REACTOME GLUTATHIONE CONJUGATION | Genes involved in Glutathione conjugation |
| 0.0 | 1.6 | REACTOME IL1 SIGNALING | Genes involved in Interleukin-1 signaling |
| 0.0 | 1.0 | REACTOME ZINC TRANSPORTERS | Genes involved in Zinc transporters |
| 0.0 | 0.4 | REACTOME JNK C JUN KINASES PHOSPHORYLATION AND ACTIVATION MEDIATED BY ACTIVATED HUMAN TAK1 | Genes involved in JNK (c-Jun kinases) phosphorylation and activation mediated by activated human TAK1 |
| 0.0 | 0.6 | REACTOME UNWINDING OF DNA | Genes involved in Unwinding of DNA |
| 0.0 | 0.6 | REACTOME N GLYCAN ANTENNAE ELONGATION | Genes involved in N-Glycan antennae elongation |
| 0.0 | 0.6 | REACTOME PURINE CATABOLISM | Genes involved in Purine catabolism |
| 0.0 | 0.7 | REACTOME SIGNALING BY BMP | Genes involved in Signaling by BMP |
| 0.0 | 0.8 | REACTOME FGFR1 LIGAND BINDING AND ACTIVATION | Genes involved in FGFR1 ligand binding and activation |
| 0.0 | 0.9 | REACTOME MRNA SPLICING MINOR PATHWAY | Genes involved in mRNA Splicing - Minor Pathway |
| 0.0 | 0.4 | REACTOME DEFENSINS | Genes involved in Defensins |
| 0.0 | 1.1 | REACTOME OXYGEN DEPENDENT PROLINE HYDROXYLATION OF HYPOXIA INDUCIBLE FACTOR ALPHA | Genes involved in Oxygen-dependent Proline Hydroxylation of Hypoxia-inducible Factor Alpha |
| 0.0 | 0.5 | REACTOME TGF BETA RECEPTOR SIGNALING IN EMT EPITHELIAL TO MESENCHYMAL TRANSITION | Genes involved in TGF-beta receptor signaling in EMT (epithelial to mesenchymal transition) |
| 0.0 | 0.3 | REACTOME ERKS ARE INACTIVATED | Genes involved in ERKs are inactivated |
| 0.0 | 0.4 | REACTOME PHOSPHORYLATION OF CD3 AND TCR ZETA CHAINS | Genes involved in Phosphorylation of CD3 and TCR zeta chains |
| 0.0 | 0.9 | REACTOME G0 AND EARLY G1 | Genes involved in G0 and Early G1 |
| 0.0 | 0.3 | REACTOME CDC6 ASSOCIATION WITH THE ORC ORIGIN COMPLEX | Genes involved in CDC6 association with the ORC:origin complex |
| 0.0 | 1.3 | REACTOME GLUCOSE TRANSPORT | Genes involved in Glucose transport |
| 0.0 | 1.4 | REACTOME GLYCOLYSIS | Genes involved in Glycolysis |
| 0.0 | 0.3 | REACTOME EARLY PHASE OF HIV LIFE CYCLE | Genes involved in Early Phase of HIV Life Cycle |
| 0.0 | 0.8 | REACTOME AMINO ACID SYNTHESIS AND INTERCONVERSION TRANSAMINATION | Genes involved in Amino acid synthesis and interconversion (transamination) |
| 0.0 | 0.4 | REACTOME RECRUITMENT OF NUMA TO MITOTIC CENTROSOMES | Genes involved in Recruitment of NuMA to mitotic centrosomes |
| 0.0 | 0.3 | REACTOME ETHANOL OXIDATION | Genes involved in Ethanol oxidation |
| 0.0 | 1.1 | REACTOME INTERFERON GAMMA SIGNALING | Genes involved in Interferon gamma signaling |
| 0.0 | 0.9 | REACTOME SYNTHESIS SECRETION AND INACTIVATION OF GLP1 | Genes involved in Synthesis, Secretion, and Inactivation of Glucagon-like Peptide-1 (GLP-1) |
| 0.0 | 1.1 | REACTOME ION CHANNEL TRANSPORT | Genes involved in Ion channel transport |
| 0.0 | 0.1 | REACTOME G ALPHA1213 SIGNALLING EVENTS | Genes involved in G alpha (12/13) signalling events |
| 0.0 | 1.4 | REACTOME STRIATED MUSCLE CONTRACTION | Genes involved in Striated Muscle Contraction |
| 0.0 | 0.4 | REACTOME BASE FREE SUGAR PHOSPHATE REMOVAL VIA THE SINGLE NUCLEOTIDE REPLACEMENT PATHWAY | Genes involved in Base-free sugar-phosphate removal via the single-nucleotide replacement pathway |
| 0.0 | 0.2 | REACTOME ROLE OF SECOND MESSENGERS IN NETRIN1 SIGNALING | Genes involved in Role of second messengers in netrin-1 signaling |
| 0.0 | 0.4 | REACTOME PLATELET CALCIUM HOMEOSTASIS | Genes involved in Platelet calcium homeostasis |
| 0.0 | 0.4 | REACTOME SHC1 EVENTS IN ERBB4 SIGNALING | Genes involved in SHC1 events in ERBB4 signaling |
| 0.0 | 0.2 | REACTOME REGULATION OF SIGNALING BY CBL | Genes involved in Regulation of signaling by CBL |
| 0.0 | 0.5 | REACTOME PROTEOLYTIC CLEAVAGE OF SNARE COMPLEX PROTEINS | Genes involved in Proteolytic cleavage of SNARE complex proteins |
| 0.0 | 0.3 | REACTOME SIGNALING BY NOTCH | Genes involved in Signaling by NOTCH |
| 0.0 | 0.2 | REACTOME MEMBRANE BINDING AND TARGETTING OF GAG PROTEINS | Genes involved in Membrane binding and targetting of GAG proteins |
| 0.0 | 0.4 | REACTOME FACILITATIVE NA INDEPENDENT GLUCOSE TRANSPORTERS | Genes involved in Facilitative Na+-independent glucose transporters |
| 0.0 | 0.2 | REACTOME SEMA3A PAK DEPENDENT AXON REPULSION | Genes involved in Sema3A PAK dependent Axon repulsion |
| 0.0 | 0.3 | REACTOME INHIBITION OF VOLTAGE GATED CA2 CHANNELS VIA GBETA GAMMA SUBUNITS | Genes involved in Inhibition of voltage gated Ca2+ channels via Gbeta/gamma subunits |
| 0.0 | 2.5 | REACTOME PEPTIDE LIGAND BINDING RECEPTORS | Genes involved in Peptide ligand-binding receptors |
| 0.0 | 0.5 | REACTOME INSULIN RECEPTOR RECYCLING | Genes involved in Insulin receptor recycling |
| 0.0 | 0.4 | REACTOME ACYL CHAIN REMODELLING OF PG | Genes involved in Acyl chain remodelling of PG |
| 0.0 | 0.2 | REACTOME ACTIVATION OF THE AP1 FAMILY OF TRANSCRIPTION FACTORS | Genes involved in Activation of the AP-1 family of transcription factors |
| 0.0 | 0.3 | REACTOME INFLAMMASOMES | Genes involved in Inflammasomes |
| 0.0 | 0.3 | REACTOME BILE SALT AND ORGANIC ANION SLC TRANSPORTERS | Genes involved in Bile salt and organic anion SLC transporters |
| 0.0 | 1.3 | REACTOME GOLGI ASSOCIATED VESICLE BIOGENESIS | Genes involved in Golgi Associated Vesicle Biogenesis |
| 0.0 | 0.2 | REACTOME RAP1 SIGNALLING | Genes involved in Rap1 signalling |
| 0.0 | 0.5 | REACTOME ANTIGEN PROCESSING CROSS PRESENTATION | Genes involved in Antigen processing-Cross presentation |
| 0.0 | 0.1 | REACTOME ACTIVATED TAK1 MEDIATES P38 MAPK ACTIVATION | Genes involved in activated TAK1 mediates p38 MAPK activation |
| 0.0 | 0.3 | REACTOME XENOBIOTICS | Genes involved in Xenobiotics |
| 0.0 | 0.2 | REACTOME PURINE RIBONUCLEOSIDE MONOPHOSPHATE BIOSYNTHESIS | Genes involved in Purine ribonucleoside monophosphate biosynthesis |
| 0.0 | 0.4 | REACTOME COSTIMULATION BY THE CD28 FAMILY | Genes involved in Costimulation by the CD28 family |
| 0.0 | 0.2 | REACTOME SYNTHESIS OF PIPS AT THE GOLGI MEMBRANE | Genes involved in Synthesis of PIPs at the Golgi membrane |
| 0.0 | 0.3 | REACTOME TERMINATION OF O GLYCAN BIOSYNTHESIS | Genes involved in Termination of O-glycan biosynthesis |
| 0.0 | 0.2 | REACTOME EGFR DOWNREGULATION | Genes involved in EGFR downregulation |
| 0.0 | 0.0 | REACTOME DSCAM INTERACTIONS | Genes involved in DSCAM interactions |
| 0.0 | 0.3 | REACTOME INITIAL TRIGGERING OF COMPLEMENT | Genes involved in Initial triggering of complement |
| 0.0 | 0.2 | REACTOME REGULATION OF PYRUVATE DEHYDROGENASE PDH COMPLEX | Genes involved in Regulation of pyruvate dehydrogenase (PDH) complex |
| 0.0 | 0.2 | REACTOME SHC MEDIATED CASCADE | Genes involved in SHC-mediated cascade |
| 0.0 | 0.2 | REACTOME ANTIGEN PRESENTATION FOLDING ASSEMBLY AND PEPTIDE LOADING OF CLASS I MHC | Genes involved in Antigen Presentation: Folding, assembly and peptide loading of class I MHC |
| 0.0 | 0.6 | REACTOME MYOGENESIS | Genes involved in Myogenesis |
| 0.0 | 0.1 | REACTOME PLATELET SENSITIZATION BY LDL | Genes involved in Platelet sensitization by LDL |
| 0.0 | 0.2 | REACTOME SEROTONIN RECEPTORS | Genes involved in Serotonin receptors |
| 0.0 | 1.3 | REACTOME L1CAM INTERACTIONS | Genes involved in L1CAM interactions |
| 0.0 | 0.2 | REACTOME VITAMIN B5 PANTOTHENATE METABOLISM | Genes involved in Vitamin B5 (pantothenate) metabolism |
| 0.0 | 0.2 | REACTOME REGULATION OF BETA CELL DEVELOPMENT | Genes involved in Regulation of beta-cell development |