Project
Inflammatory response time course, HUVEC (Wada, 2009)
Navigation
Downloads
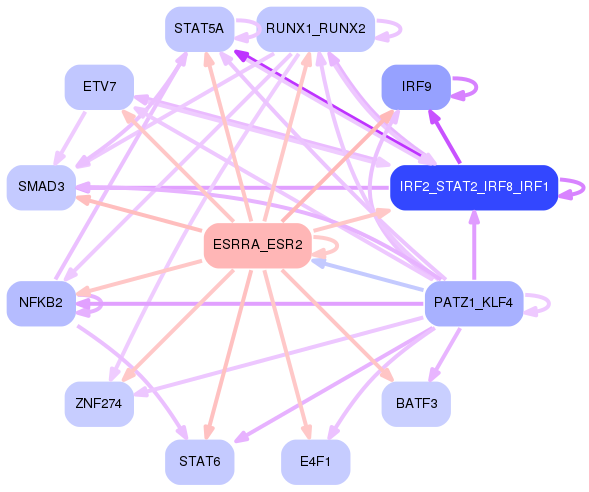
Results for ESRRA_ESR2
Z-value: 1.55
Motif logo
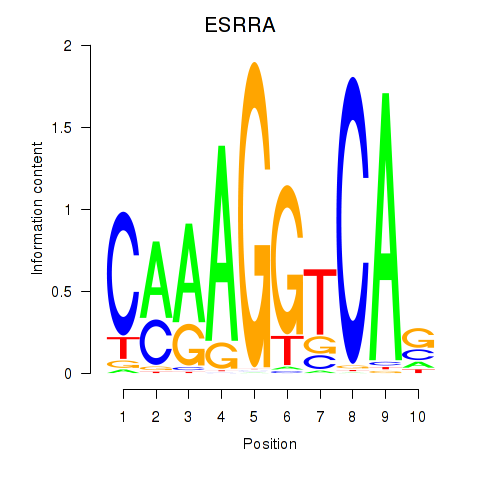
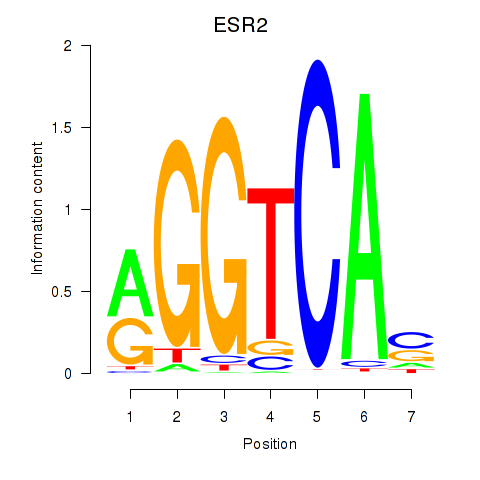
Transcription factors associated with ESRRA_ESR2
| Gene Symbol | Gene ID | Gene Info |
|---|---|---|
|
ESRRA
|
ENSG00000173153.17 | ESRRA |
|
ESR2
|
ENSG00000140009.19 | ESR2 |
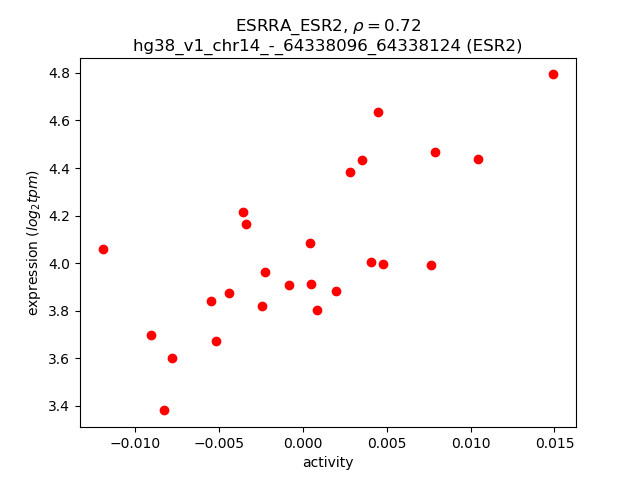
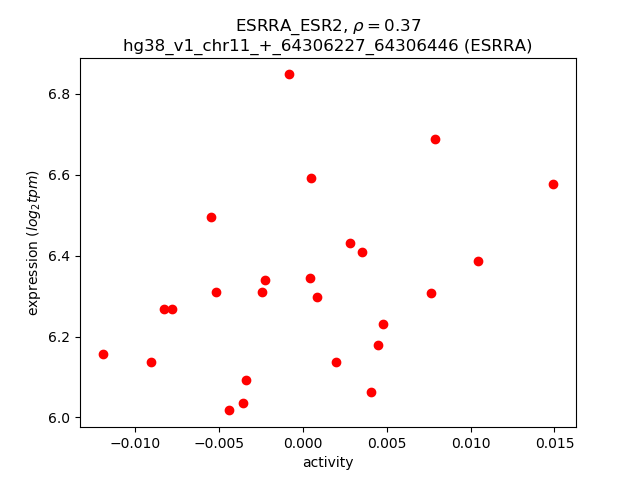
Activity-expression correlation:
| Gene | Promoter | Pearson corr. coef. | P-value | Plot |
|---|---|---|---|---|
| ESR2 | hg38_v1_chr14_-_64338096_64338124 | 0.72 | 4.2e-05 | Click! |
| ESRRA | hg38_v1_chr11_+_64306227_64306446 | 0.37 | 7.0e-02 | Click! |
Activity profile of ESRRA_ESR2 motif
Sorted Z-values of ESRRA_ESR2 motif
Network of associatons between targets according to the STRING database.

First level regulatory network of ESRRA_ESR2
| Promoter | Score | Transcript | Gene | Gene Info |
|---|---|---|---|---|
| chr19_+_10086787 | 5.65 |
ENST00000590378.5
ENST00000397881.7 |
SHFL
|
shiftless antiviral inhibitor of ribosomal frameshifting |
| chr9_-_120914549 | 5.14 |
ENST00000546084.5
|
TRAF1
|
TNF receptor associated factor 1 |
| chr2_+_227813834 | 5.12 |
ENST00000358813.5
ENST00000409189.7 |
CCL20
|
C-C motif chemokine ligand 20 |
| chr12_+_112978386 | 4.78 |
ENST00000342315.8
|
OAS2
|
2'-5'-oligoadenylate synthetase 2 |
| chr14_+_24161257 | 4.64 |
ENST00000396864.8
ENST00000557894.5 ENST00000559284.5 ENST00000560275.5 |
IRF9
|
interferon regulatory factor 9 |
| chr1_-_205321737 | 4.62 |
ENST00000367157.6
|
NUAK2
|
NUAK family kinase 2 |
| chr4_-_687325 | 4.57 |
ENST00000503156.5
|
SLC49A3
|
solute carrier family 49 member 3 |
| chr10_-_48604952 | 4.51 |
ENST00000417912.6
|
ARHGAP22
|
Rho GTPase activating protein 22 |
| chr11_-_60952559 | 4.47 |
ENST00000538739.2
|
SLC15A3
|
solute carrier family 15 member 3 |
| chr14_+_103121457 | 4.39 |
ENST00000333007.8
|
TNFAIP2
|
TNF alpha induced protein 2 |
| chr5_+_132073782 | 4.34 |
ENST00000296871.4
|
CSF2
|
colony stimulating factor 2 |
| chr10_-_48524236 | 4.26 |
ENST00000374170.5
|
ARHGAP22
|
Rho GTPase activating protein 22 |
| chr19_+_10086305 | 3.90 |
ENST00000253110.16
ENST00000591813.5 |
SHFL
|
shiftless antiviral inhibitor of ribosomal frameshifting |
| chr6_-_159693262 | 3.65 |
ENST00000337404.8
|
SOD2
|
superoxide dismutase 2 |
| chr17_-_35880350 | 3.47 |
ENST00000605140.6
ENST00000651122.1 ENST00000603197.6 |
CCL5
|
C-C motif chemokine ligand 5 |
| chr6_+_31587002 | 3.39 |
ENST00000376090.6
|
LST1
|
leukocyte specific transcript 1 |
| chr6_-_159693228 | 3.33 |
ENST00000367054.6
ENST00000367055.8 ENST00000538183.7 ENST00000444946.6 ENST00000452684.2 |
SOD2
|
superoxide dismutase 2 |
| chr15_+_67166019 | 3.29 |
ENST00000537194.6
|
SMAD3
|
SMAD family member 3 |
| chr10_-_48652493 | 3.24 |
ENST00000435790.6
|
ARHGAP22
|
Rho GTPase activating protein 22 |
| chr8_+_144095054 | 3.15 |
ENST00000318911.5
|
CYC1
|
cytochrome c1 |
| chr17_+_79034185 | 3.07 |
ENST00000581774.5
|
C1QTNF1
|
C1q and TNF related 1 |
| chr1_-_184974477 | 3.06 |
ENST00000367511.4
|
NIBAN1
|
niban apoptosis regulator 1 |
| chr11_-_72785932 | 3.03 |
ENST00000539138.1
ENST00000542989.5 |
STARD10
|
StAR related lipid transfer domain containing 10 |
| chr12_+_112978504 | 3.01 |
ENST00000392583.7
|
OAS2
|
2'-5'-oligoadenylate synthetase 2 |
| chr6_+_31587185 | 3.00 |
ENST00000376092.7
ENST00000376086.7 ENST00000303757.12 ENST00000376093.6 |
LST1
|
leukocyte specific transcript 1 |
| chr21_+_42513834 | 2.88 |
ENST00000352133.3
|
SLC37A1
|
solute carrier family 37 member 1 |
| chr20_+_54475584 | 2.82 |
ENST00000262593.10
|
DOK5
|
docking protein 5 |
| chr19_+_10271093 | 2.79 |
ENST00000423829.2
ENST00000588645.1 ENST00000264832.8 |
ICAM1
|
intercellular adhesion molecule 1 |
| chr1_-_40862354 | 2.79 |
ENST00000372638.4
|
CITED4
|
Cbp/p300 interacting transactivator with Glu/Asp rich carboxy-terminal domain 4 |
| chr11_-_4393650 | 2.79 |
ENST00000254436.8
|
TRIM21
|
tripartite motif containing 21 |
| chr10_-_5977589 | 2.76 |
ENST00000620345.4
ENST00000397251.7 ENST00000397248.6 ENST00000622442.4 ENST00000620865.4 |
IL15RA
|
interleukin 15 receptor subunit alpha |
| chr5_-_151087131 | 2.72 |
ENST00000315050.11
ENST00000523338.5 ENST00000522100.5 |
TNIP1
|
TNFAIP3 interacting protein 1 |
| chr6_-_159727324 | 2.69 |
ENST00000401980.3
ENST00000545162.5 |
SOD2
|
superoxide dismutase 2 |
| chr10_-_5977492 | 2.69 |
ENST00000530685.5
ENST00000397255.7 ENST00000379971.5 ENST00000528354.5 ENST00000397250.6 ENST00000429135.2 |
IL15RA
|
interleukin 15 receptor subunit alpha |
| chr10_-_5977535 | 2.67 |
ENST00000379977.8
|
IL15RA
|
interleukin 15 receptor subunit alpha |
| chr12_-_57129001 | 2.65 |
ENST00000556155.5
|
STAT6
|
signal transducer and activator of transcription 6 |
| chr3_-_127722562 | 2.63 |
ENST00000487473.5
ENST00000484451.1 |
MGLL
|
monoglyceride lipase |
| chr1_-_111200633 | 2.63 |
ENST00000357640.9
|
DENND2D
|
DENN domain containing 2D |
| chr16_-_67936808 | 2.63 |
ENST00000358514.9
|
PSMB10
|
proteasome 20S subunit beta 10 |
| chr22_+_20774092 | 2.60 |
ENST00000215727.10
|
SERPIND1
|
serpin family D member 1 |
| chr7_-_105679089 | 2.56 |
ENST00000477775.5
|
ATXN7L1
|
ataxin 7 like 1 |
| chr6_+_31948956 | 2.55 |
ENST00000483004.1
|
CFB
|
complement factor B |
| chr9_-_120926752 | 2.55 |
ENST00000373887.8
|
TRAF1
|
TNF receptor associated factor 1 |
| chr10_-_78029487 | 2.54 |
ENST00000372371.8
|
POLR3A
|
RNA polymerase III subunit A |
| chr20_+_54475647 | 2.53 |
ENST00000395939.5
|
DOK5
|
docking protein 5 |
| chr1_-_7940825 | 2.50 |
ENST00000377507.8
|
TNFRSF9
|
TNF receptor superfamily member 9 |
| chr1_-_153549120 | 2.49 |
ENST00000368712.1
|
S100A3
|
S100 calcium binding protein A3 |
| chr10_-_48605032 | 2.47 |
ENST00000249601.9
|
ARHGAP22
|
Rho GTPase activating protein 22 |
| chr3_-_122564232 | 2.45 |
ENST00000471785.5
ENST00000466126.1 |
PARP9
|
poly(ADP-ribose) polymerase family member 9 |
| chr12_-_89524734 | 2.44 |
ENST00000529983.3
|
GALNT4
|
polypeptide N-acetylgalactosaminyltransferase 4 |
| chr1_-_153549238 | 2.44 |
ENST00000368713.8
|
S100A3
|
S100 calcium binding protein A3 |
| chr17_+_43006740 | 2.43 |
ENST00000438323.2
ENST00000415816.7 |
IFI35
|
interferon induced protein 35 |
| chr21_+_42219111 | 2.39 |
ENST00000450121.5
ENST00000361802.6 |
ABCG1
|
ATP binding cassette subfamily G member 1 |
| chr15_+_67138001 | 2.38 |
ENST00000439724.7
|
SMAD3
|
SMAD family member 3 |
| chr21_-_44240840 | 2.37 |
ENST00000344330.8
ENST00000407780.7 ENST00000400379.7 ENST00000400377.3 |
ICOSLG
|
inducible T cell costimulator ligand |
| chr11_-_441964 | 2.36 |
ENST00000332826.7
|
ANO9
|
anoctamin 9 |
| chr16_+_57620077 | 2.36 |
ENST00000567835.5
ENST00000569372.5 ENST00000563548.5 ENST00000562003.5 |
ADGRG1
|
adhesion G protein-coupled receptor G1 |
| chr3_-_127736329 | 2.36 |
ENST00000398101.7
|
MGLL
|
monoglyceride lipase |
| chr16_+_57619942 | 2.34 |
ENST00000568908.5
ENST00000568909.5 ENST00000566778.5 ENST00000561988.5 |
ADGRG1
|
adhesion G protein-coupled receptor G1 |
| chr21_+_42219123 | 2.32 |
ENST00000398449.8
|
ABCG1
|
ATP binding cassette subfamily G member 1 |
| chr10_+_89332484 | 2.31 |
ENST00000371811.4
ENST00000680037.1 ENST00000679583.1 ENST00000679897.1 |
IFIT3
|
interferon induced protein with tetratricopeptide repeats 3 |
| chr4_+_141636923 | 2.30 |
ENST00000529613.5
|
IL15
|
interleukin 15 |
| chr16_+_3065380 | 2.28 |
ENST00000551122.5
ENST00000548807.5 ENST00000528163.6 |
IL32
|
interleukin 32 |
| chr19_+_18173804 | 2.27 |
ENST00000407280.4
|
IFI30
|
IFI30 lysosomal thiol reductase |
| chr22_-_41285868 | 2.27 |
ENST00000422838.1
ENST00000405486.5 |
RANGAP1
|
Ran GTPase activating protein 1 |
| chr6_+_31587268 | 2.25 |
ENST00000396101.7
ENST00000490742.5 |
LST1
|
leukocyte specific transcript 1 |
| chr2_+_126656128 | 2.23 |
ENST00000259254.9
ENST00000409836.3 ENST00000356887.12 |
GYPC
|
glycophorin C (Gerbich blood group) |
| chr19_+_676385 | 2.20 |
ENST00000166139.9
|
FSTL3
|
follistatin like 3 |
| chr2_+_74529923 | 2.19 |
ENST00000258080.8
ENST00000352222.7 |
HTRA2
|
HtrA serine peptidase 2 |
| chr11_-_102798148 | 2.18 |
ENST00000315274.7
|
MMP1
|
matrix metallopeptidase 1 |
| chr16_+_57372465 | 2.18 |
ENST00000563383.1
|
CX3CL1
|
C-X3-C motif chemokine ligand 1 |
| chr9_-_133479075 | 2.17 |
ENST00000414172.1
ENST00000371897.8 ENST00000371899.9 |
SLC2A6
|
solute carrier family 2 member 6 |
| chr15_+_67125707 | 2.17 |
ENST00000540846.6
|
SMAD3
|
SMAD family member 3 |
| chr10_-_119536533 | 2.15 |
ENST00000392865.5
|
RGS10
|
regulator of G protein signaling 10 |
| chr6_+_31587049 | 2.15 |
ENST00000376089.6
ENST00000396112.6 |
LST1
|
leukocyte specific transcript 1 |
| chr9_+_70043840 | 2.12 |
ENST00000377182.5
|
MAMDC2
|
MAM domain containing 2 |
| chr3_+_122564327 | 2.11 |
ENST00000296161.9
ENST00000383661.3 |
DTX3L
|
deltex E3 ubiquitin ligase 3L |
| chr22_-_50526337 | 2.09 |
ENST00000651490.1
ENST00000543927.6 |
TYMP
SCO2
|
thymidine phosphorylase synthesis of cytochrome C oxidase 2 |
| chr15_-_64046322 | 2.07 |
ENST00000457488.5
ENST00000612884.4 |
DAPK2
|
death associated protein kinase 2 |
| chr12_+_55681647 | 2.06 |
ENST00000614691.1
|
METTL7B
|
methyltransferase like 7B |
| chr5_+_114362043 | 2.03 |
ENST00000673685.1
|
KCNN2
|
potassium calcium-activated channel subfamily N member 2 |
| chr4_+_95051671 | 1.98 |
ENST00000440890.7
|
BMPR1B
|
bone morphogenetic protein receptor type 1B |
| chr5_-_151093566 | 1.97 |
ENST00000521001.1
|
TNIP1
|
TNFAIP3 interacting protein 1 |
| chr14_-_52069228 | 1.96 |
ENST00000617139.4
|
NID2
|
nidogen 2 |
| chr1_+_169106681 | 1.95 |
ENST00000367815.9
|
ATP1B1
|
ATPase Na+/K+ transporting subunit beta 1 |
| chr20_-_63572455 | 1.95 |
ENST00000467148.1
|
HELZ2
|
helicase with zinc finger 2 |
| chr6_-_159726871 | 1.94 |
ENST00000535561.5
|
SOD2
|
superoxide dismutase 2 |
| chr1_-_89065200 | 1.94 |
ENST00000370473.5
|
GBP1
|
guanylate binding protein 1 |
| chr19_-_41627051 | 1.91 |
ENST00000221954.6
ENST00000600925.1 |
CEACAM4
|
CEA cell adhesion molecule 4 |
| chr2_-_201698040 | 1.91 |
ENST00000396886.7
ENST00000409143.5 |
MPP4
|
membrane palmitoylated protein 4 |
| chr6_-_31357171 | 1.90 |
ENST00000412585.7
ENST00000434333.1 |
HLA-B
|
major histocompatibility complex, class I, B |
| chr15_+_88638947 | 1.90 |
ENST00000559876.2
|
ISG20
|
interferon stimulated exonuclease gene 20 |
| chr20_+_63738270 | 1.89 |
ENST00000467211.1
|
ENSG00000273047.1
|
novel transcript, LIME1-SLC2A4RG readthrough |
| chr6_+_32844789 | 1.85 |
ENST00000414474.5
|
PSMB9
|
proteasome 20S subunit beta 9 |
| chr3_-_122564577 | 1.85 |
ENST00000477522.6
ENST00000360356.6 |
PARP9
|
poly(ADP-ribose) polymerase family member 9 |
| chr3_-_122564253 | 1.84 |
ENST00000492382.5
ENST00000682323.1 ENST00000462315.5 |
PARP9
|
poly(ADP-ribose) polymerase family member 9 |
| chr14_-_52069039 | 1.81 |
ENST00000216286.10
|
NID2
|
nidogen 2 |
| chr11_+_102317450 | 1.80 |
ENST00000615299.4
ENST00000527309.2 ENST00000526421.6 ENST00000263464.9 |
BIRC3
|
baculoviral IAP repeat containing 3 |
| chr12_+_124295085 | 1.78 |
ENST00000546355.4
|
RFLNA
|
refilin A |
| chr17_+_6756035 | 1.77 |
ENST00000361842.8
ENST00000574907.5 |
XAF1
|
XIAP associated factor 1 |
| chr17_-_20467535 | 1.76 |
ENST00000324290.5
ENST00000423676.8 |
LGALS9B
|
galectin 9B |
| chr19_-_55149193 | 1.75 |
ENST00000587758.5
ENST00000588981.6 ENST00000356783.9 ENST00000291901.12 ENST00000588426.5 ENST00000536926.5 ENST00000588147.5 |
TNNT1
|
troponin T1, slow skeletal type |
| chr19_-_10380558 | 1.75 |
ENST00000524462.5
ENST00000525621.6 ENST00000531836.5 |
TYK2
|
tyrosine kinase 2 |
| chr1_-_1214146 | 1.75 |
ENST00000379236.4
|
TNFRSF4
|
TNF receptor superfamily member 4 |
| chr7_-_81770122 | 1.74 |
ENST00000423064.7
|
HGF
|
hepatocyte growth factor |
| chr16_+_3065610 | 1.74 |
ENST00000530890.5
ENST00000444393.7 ENST00000533097.6 ENST00000008180.13 ENST00000396890.6 ENST00000525228.5 ENST00000525643.7 ENST00000548652.5 ENST00000525377.6 ENST00000530538.6 ENST00000549213.5 ENST00000552936.5 ENST00000548476.5 ENST00000552664.5 ENST00000552356.5 ENST00000551513.5 ENST00000382213.7 ENST00000548246.1 |
IL32
|
interleukin 32 |
| chr4_+_141636611 | 1.74 |
ENST00000514653.5
|
IL15
|
interleukin 15 |
| chr20_+_59676661 | 1.73 |
ENST00000355648.8
|
PHACTR3
|
phosphatase and actin regulator 3 |
| chr4_+_88378842 | 1.72 |
ENST00000264346.12
|
HERC6
|
HECT and RLD domain containing E3 ubiquitin protein ligase family member 6 |
| chr19_+_43576800 | 1.71 |
ENST00000612042.4
|
PINLYP
|
phospholipase A2 inhibitor and LY6/PLAUR domain containing |
| chr22_+_30425743 | 1.71 |
ENST00000266263.10
ENST00000355143.8 ENST00000407550.3 |
MTFP1
|
mitochondrial fission process 1 |
| chr15_+_67128103 | 1.71 |
ENST00000558894.5
|
SMAD3
|
SMAD family member 3 |
| chr11_+_102317492 | 1.71 |
ENST00000673846.1
|
BIRC3
|
baculoviral IAP repeat containing 3 |
| chr6_+_31586835 | 1.71 |
ENST00000211921.11
|
LST1
|
leukocyte specific transcript 1 |
| chr16_+_3065297 | 1.70 |
ENST00000325568.9
|
IL32
|
interleukin 32 |
| chr16_+_66604782 | 1.70 |
ENST00000565003.5
|
CMTM3
|
CKLF like MARVEL transmembrane domain containing 3 |
| chr2_+_74530018 | 1.70 |
ENST00000437202.1
|
HTRA2
|
HtrA serine peptidase 2 |
| chr3_+_53168687 | 1.70 |
ENST00000650940.1
ENST00000654719.1 |
PRKCD
|
protein kinase C delta |
| chr2_+_218568865 | 1.70 |
ENST00000295701.9
|
CNOT9
|
CCR4-NOT transcription complex subunit 9 |
| chr4_+_99574812 | 1.68 |
ENST00000422897.6
ENST00000265517.10 |
MTTP
|
microsomal triglyceride transfer protein |
| chr19_-_54360949 | 1.67 |
ENST00000622064.1
|
LAIR1
|
leukocyte associated immunoglobulin like receptor 1 |
| chr16_+_56651885 | 1.67 |
ENST00000334346.3
ENST00000562399.1 |
MT1B
|
metallothionein 1B |
| chr10_+_79347460 | 1.67 |
ENST00000225174.8
|
PPIF
|
peptidylprolyl isomerase F |
| chr20_+_59577463 | 1.66 |
ENST00000359926.7
|
PHACTR3
|
phosphatase and actin regulator 3 |
| chr22_+_36913620 | 1.65 |
ENST00000403662.8
ENST00000262825.9 |
CSF2RB
|
colony stimulating factor 2 receptor subunit beta |
| chr6_+_4706133 | 1.65 |
ENST00000328908.9
|
CDYL
|
chromodomain Y like |
| chr21_-_36542600 | 1.65 |
ENST00000399136.5
|
CLDN14
|
claudin 14 |
| chr12_-_76878985 | 1.65 |
ENST00000547435.1
ENST00000552330.5 ENST00000311083.10 ENST00000546966.5 |
CSRP2
|
cysteine and glycine rich protein 2 |
| chr2_-_225042433 | 1.64 |
ENST00000258390.12
|
DOCK10
|
dedicator of cytokinesis 10 |
| chr11_-_60952067 | 1.63 |
ENST00000681275.1
|
SLC15A3
|
solute carrier family 15 member 3 |
| chr6_-_138107412 | 1.62 |
ENST00000421351.4
|
PERP
|
p53 apoptosis effector related to PMP22 |
| chr10_+_70815889 | 1.62 |
ENST00000373202.8
|
SGPL1
|
sphingosine-1-phosphate lyase 1 |
| chr12_+_55681711 | 1.62 |
ENST00000394252.4
|
METTL7B
|
methyltransferase like 7B |
| chr1_-_212699817 | 1.62 |
ENST00000243440.2
|
BATF3
|
basic leucine zipper ATF-like transcription factor 3 |
| chr21_+_25639251 | 1.61 |
ENST00000480456.6
|
JAM2
|
junctional adhesion molecule 2 |
| chr11_+_71998892 | 1.61 |
ENST00000393705.8
ENST00000393703.9 ENST00000337131.9 ENST00000620017.4 ENST00000531053.5 ENST00000404792.5 |
IL18BP
|
interleukin 18 binding protein |
| chr21_+_25639272 | 1.60 |
ENST00000400532.5
ENST00000312957.9 |
JAM2
|
junctional adhesion molecule 2 |
| chr4_+_94757921 | 1.60 |
ENST00000515059.6
|
BMPR1B
|
bone morphogenetic protein receptor type 1B |
| chr21_+_42499600 | 1.58 |
ENST00000398341.7
|
SLC37A1
|
solute carrier family 37 member 1 |
| chr3_-_165196369 | 1.57 |
ENST00000475390.2
|
SLITRK3
|
SLIT and NTRK like family member 3 |
| chr1_-_209652329 | 1.57 |
ENST00000367030.7
ENST00000356082.9 |
LAMB3
|
laminin subunit beta 3 |
| chr1_+_100719734 | 1.57 |
ENST00000370119.8
ENST00000294728.7 ENST00000347652.6 ENST00000370115.1 |
VCAM1
|
vascular cell adhesion molecule 1 |
| chr4_-_7434895 | 1.57 |
ENST00000319098.7
|
PSAPL1
|
prosaposin like 1 |
| chr19_+_12838437 | 1.56 |
ENST00000251472.9
|
MAST1
|
microtubule associated serine/threonine kinase 1 |
| chr9_-_136944725 | 1.56 |
ENST00000325285.8
|
FBXW5
|
F-box and WD repeat domain containing 5 |
| chr19_+_14072754 | 1.56 |
ENST00000587086.2
|
MISP3
|
MISP family member 3 |
| chr2_-_201697993 | 1.56 |
ENST00000428900.6
|
MPP4
|
membrane palmitoylated protein 4 |
| chr8_-_63038788 | 1.54 |
ENST00000518113.2
ENST00000260118.7 ENST00000677482.1 |
GGH
|
gamma-glutamyl hydrolase |
| chr18_+_58149314 | 1.54 |
ENST00000435432.6
ENST00000357895.9 ENST00000586263.5 |
NEDD4L
|
NEDD4 like E3 ubiquitin protein ligase |
| chr16_+_56669807 | 1.53 |
ENST00000332374.5
|
MT1H
|
metallothionein 1H |
| chr10_+_113679159 | 1.51 |
ENST00000621345.4
ENST00000429617.5 ENST00000369331.8 |
CASP7
|
caspase 7 |
| chr3_+_10164883 | 1.50 |
ENST00000256458.5
|
IRAK2
|
interleukin 1 receptor associated kinase 2 |
| chr6_+_32854179 | 1.50 |
ENST00000374859.3
|
PSMB9
|
proteasome 20S subunit beta 9 |
| chr1_+_27879638 | 1.50 |
ENST00000456990.1
|
THEMIS2
|
thymocyte selection associated family member 2 |
| chr19_+_10252206 | 1.49 |
ENST00000253099.11
ENST00000393733.6 ENST00000588502.5 |
MRPL4
|
mitochondrial ribosomal protein L4 |
| chr14_+_103123452 | 1.49 |
ENST00000558056.1
ENST00000560869.6 |
TNFAIP2
|
TNF alpha induced protein 2 |
| chr2_-_230225628 | 1.49 |
ENST00000540870.5
|
SP110
|
SP110 nuclear body protein |
| chr19_+_489140 | 1.48 |
ENST00000587541.5
|
MADCAM1
|
mucosal vascular addressin cell adhesion molecule 1 |
| chr17_+_42289213 | 1.48 |
ENST00000677301.1
|
STAT5A
|
signal transducer and activator of transcription 5A |
| chr1_-_110607816 | 1.48 |
ENST00000485317.6
|
KCNA2
|
potassium voltage-gated channel subfamily A member 2 |
| chr16_+_56657999 | 1.48 |
ENST00000568475.1
|
MT1F
|
metallothionein 1F |
| chr16_+_56657924 | 1.47 |
ENST00000334350.7
|
MT1F
|
metallothionein 1F |
| chr7_-_77416300 | 1.47 |
ENST00000257626.12
|
GSAP
|
gamma-secretase activating protein |
| chr10_+_79347491 | 1.47 |
ENST00000448165.1
|
PPIF
|
peptidylprolyl isomerase F |
| chr3_-_127598204 | 1.46 |
ENST00000462228.1
ENST00000490643.5 ENST00000648957.1 |
TPRA1
|
transmembrane protein adipocyte associated 1 |
| chr17_+_18476737 | 1.45 |
ENST00000581545.5
ENST00000582333.5 ENST00000328114.11 ENST00000583322.5 ENST00000584941.5 |
LGALS9C
|
galectin 9C |
| chr17_-_47851155 | 1.45 |
ENST00000536300.2
|
SP6
|
Sp6 transcription factor |
| chr15_+_88639009 | 1.45 |
ENST00000306072.10
|
ISG20
|
interferon stimulated exonuclease gene 20 |
| chr11_+_102317542 | 1.45 |
ENST00000532808.5
|
BIRC3
|
baculoviral IAP repeat containing 3 |
| chr12_+_121132869 | 1.45 |
ENST00000328963.10
|
P2RX7
|
purinergic receptor P2X 7 |
| chr12_-_108857568 | 1.45 |
ENST00000326495.10
ENST00000551165.5 |
SSH1
|
slingshot protein phosphatase 1 |
| chr12_-_89525444 | 1.44 |
ENST00000549035.1
ENST00000393179.8 |
POC1B
|
POC1 centriolar protein B |
| chr5_+_136058849 | 1.44 |
ENST00000508076.5
|
TGFBI
|
transforming growth factor beta induced |
| chr17_-_2711633 | 1.43 |
ENST00000435359.5
|
CLUH
|
clustered mitochondria homolog |
| chr16_+_3065348 | 1.43 |
ENST00000529699.5
ENST00000526464.6 ENST00000440815.7 ENST00000529550.5 |
IL32
|
interleukin 32 |
| chr10_+_13100075 | 1.43 |
ENST00000378747.8
ENST00000378757.6 ENST00000378752.7 ENST00000378748.7 |
OPTN
|
optineurin |
| chr11_+_71999603 | 1.42 |
ENST00000260049.9
|
IL18BP
|
interleukin 18 binding protein |
| chr14_+_21057822 | 1.42 |
ENST00000308227.2
|
RNASE8
|
ribonuclease A family member 8 |
| chr11_+_20022550 | 1.41 |
ENST00000533917.5
|
NAV2
|
neuron navigator 2 |
| chr6_-_31582415 | 1.41 |
ENST00000429299.3
ENST00000446745.2 |
LTB
|
lymphotoxin beta |
| chr1_+_1033987 | 1.40 |
ENST00000651234.1
ENST00000652369.1 |
AGRN
|
agrin |
| chr18_-_46072244 | 1.40 |
ENST00000589328.5
ENST00000409746.5 |
PSTPIP2
|
proline-serine-threonine phosphatase interacting protein 2 |
| chr16_+_1989949 | 1.39 |
ENST00000248121.7
ENST00000618464.1 |
SYNGR3
|
synaptogyrin 3 |
| chr11_-_19202004 | 1.38 |
ENST00000648719.1
|
CSRP3
|
cysteine and glycine rich protein 3 |
| chr17_-_1187294 | 1.37 |
ENST00000544583.6
|
ABR
|
ABR activator of RhoGEF and GTPase |
| chr17_+_79022908 | 1.36 |
ENST00000354124.7
ENST00000580454.5 |
C1QTNF1
|
C1q and TNF related 1 |
| chr16_+_56669832 | 1.36 |
ENST00000569155.1
|
MT1H
|
metallothionein 1H |
| chr16_-_50681328 | 1.36 |
ENST00000300590.7
|
SNX20
|
sorting nexin 20 |
| chr12_+_101877571 | 1.36 |
ENST00000258534.13
|
DRAM1
|
DNA damage regulated autophagy modulator 1 |
| chr19_-_10333512 | 1.36 |
ENST00000617231.5
ENST00000611074.4 ENST00000615032.4 |
RAVER1
|
ribonucleoprotein, PTB binding 1 |
| chr11_+_64206663 | 1.36 |
ENST00000544997.5
ENST00000345728.10 ENST00000279227.9 |
FERMT3
|
fermitin family member 3 |
| chr11_+_313391 | 1.35 |
ENST00000680802.1
ENST00000528780.5 ENST00000681761.1 ENST00000681821.1 ENST00000328221.5 |
IFITM1
|
interferon induced transmembrane protein 1 |
| chr2_+_74206384 | 1.35 |
ENST00000678623.1
ENST00000678731.1 |
MTHFD2
|
methylenetetrahydrofolate dehydrogenase (NADP+ dependent) 2, methenyltetrahydrofolate cyclohydrolase |
| chr5_+_114056017 | 1.35 |
ENST00000512097.9
|
KCNN2
|
potassium calcium-activated channel subfamily N member 2 |
| chr17_+_28335571 | 1.34 |
ENST00000544907.6
|
TNFAIP1
|
TNF alpha induced protein 1 |
| chr1_+_1001002 | 1.34 |
ENST00000624697.4
ENST00000624652.1 |
ISG15
|
ISG15 ubiquitin like modifier |
| chr1_-_169734064 | 1.34 |
ENST00000333360.12
|
SELE
|
selectin E |
| chr5_+_129904458 | 1.34 |
ENST00000305031.5
|
CHSY3
|
chondroitin sulfate synthase 3 |
| chr5_-_132227472 | 1.33 |
ENST00000428369.6
|
P4HA2
|
prolyl 4-hydroxylase subunit alpha 2 |
| chr7_-_108240049 | 1.33 |
ENST00000379022.8
|
NRCAM
|
neuronal cell adhesion molecule |
Gene Ontology Analysis
Gene overrepresentation in biological process category:
| Log-likelihood per target | Total log-likelihood | Term | Description |
|---|---|---|---|
| 2.3 | 11.6 | GO:0003069 | age-dependent response to oxidative stress(GO:0001306) age-dependent response to reactive oxygen species(GO:0001315) regulation of systemic arterial blood pressure by acetylcholine(GO:0003068) vasodilation by acetylcholine involved in regulation of systemic arterial blood pressure(GO:0003069) regulation of systemic arterial blood pressure by neurotransmitter(GO:0003070) age-dependent general metabolic decline(GO:0007571) |
| 1.9 | 5.7 | GO:0009720 | detection of hormone stimulus(GO:0009720) |
| 1.9 | 5.6 | GO:0085032 | modulation of signal transduction in other organism(GO:0044501) modulation by symbiont of host signal transduction pathway(GO:0052027) modulation of signal transduction in other organism involved in symbiotic interaction(GO:0052250) modulation by symbiont of host I-kappaB kinase/NF-kappaB cascade(GO:0085032) |
| 1.7 | 10.4 | GO:0061767 | negative regulation of lung blood pressure(GO:0061767) |
| 1.7 | 5.1 | GO:0045362 | regulation of interleukin-1 biosynthetic process(GO:0045360) positive regulation of interleukin-1 biosynthetic process(GO:0045362) |
| 1.3 | 4.0 | GO:0045062 | extrathymic T cell selection(GO:0045062) |
| 1.3 | 5.2 | GO:1904924 | negative regulation of mitophagy in response to mitochondrial depolarization(GO:1904924) |
| 1.2 | 3.5 | GO:0038156 | interleukin-3-mediated signaling pathway(GO:0038156) |
| 1.1 | 4.6 | GO:0002296 | T-helper 1 cell lineage commitment(GO:0002296) |
| 1.1 | 4.5 | GO:0033634 | positive regulation of cell-cell adhesion mediated by integrin(GO:0033634) |
| 1.1 | 3.3 | GO:0070902 | mitochondrial tRNA pseudouridine synthesis(GO:0070902) |
| 1.0 | 3.1 | GO:2000276 | negative regulation of oxidative phosphorylation uncoupler activity(GO:2000276) |
| 1.0 | 5.1 | GO:0032747 | positive regulation of interleukin-23 production(GO:0032747) |
| 1.0 | 11.6 | GO:0018377 | protein myristoylation(GO:0018377) |
| 0.9 | 2.7 | GO:0050717 | positive regulation of interleukin-1 alpha secretion(GO:0050717) |
| 0.9 | 2.7 | GO:0045084 | positive regulation of interleukin-12 biosynthetic process(GO:0045084) |
| 0.9 | 6.2 | GO:2000857 | positive regulation of mineralocorticoid secretion(GO:2000857) positive regulation of aldosterone secretion(GO:2000860) |
| 0.9 | 2.6 | GO:0051040 | regulation of calcium-independent cell-cell adhesion(GO:0051040) |
| 0.8 | 3.3 | GO:0000738 | DNA catabolic process, exonucleolytic(GO:0000738) |
| 0.8 | 2.5 | GO:0046967 | cytosol to ER transport(GO:0046967) |
| 0.8 | 2.4 | GO:1900161 | regulation of phospholipid scramblase activity(GO:1900161) positive regulation of phospholipid scramblase activity(GO:1900163) regulation of glucosylceramide catabolic process(GO:2000752) positive regulation of glucosylceramide catabolic process(GO:2000753) regulation of sphingomyelin catabolic process(GO:2000754) positive regulation of sphingomyelin catabolic process(GO:2000755) |
| 0.8 | 2.3 | GO:1903281 | positive regulation of calcium:sodium antiporter activity(GO:1903281) |
| 0.7 | 3.0 | GO:1904116 | response to vasopressin(GO:1904116) cellular response to vasopressin(GO:1904117) |
| 0.7 | 3.0 | GO:2001226 | negative regulation of chloride transport(GO:2001226) |
| 0.7 | 2.9 | GO:0046035 | CMP salvage(GO:0006238) CMP biosynthetic process(GO:0009224) CMP metabolic process(GO:0046035) |
| 0.7 | 2.7 | GO:1900041 | negative regulation of interleukin-2 secretion(GO:1900041) |
| 0.7 | 0.7 | GO:0009139 | dUDP biosynthetic process(GO:0006227) dTDP biosynthetic process(GO:0006233) pyrimidine nucleoside diphosphate biosynthetic process(GO:0009139) pyrimidine deoxyribonucleoside diphosphate metabolic process(GO:0009196) pyrimidine deoxyribonucleoside diphosphate biosynthetic process(GO:0009197) dTDP metabolic process(GO:0046072) dUDP metabolic process(GO:0046077) |
| 0.7 | 3.4 | GO:2000325 | regulation of ligand-dependent nuclear receptor transcription coactivator activity(GO:2000325) positive regulation of ligand-dependent nuclear receptor transcription coactivator activity(GO:2000327) |
| 0.7 | 2.7 | GO:0090086 | negative regulation of protein deubiquitination(GO:0090086) |
| 0.7 | 2.7 | GO:2001247 | positive regulation of phosphatidylcholine biosynthetic process(GO:2001247) |
| 0.7 | 6.6 | GO:0070212 | protein poly-ADP-ribosylation(GO:0070212) |
| 0.7 | 2.0 | GO:0046521 | sphingoid catabolic process(GO:0046521) |
| 0.7 | 4.6 | GO:0001550 | ovarian cumulus expansion(GO:0001550) fused antrum stage(GO:0048165) |
| 0.6 | 4.5 | GO:0022614 | membrane to membrane docking(GO:0022614) |
| 0.6 | 2.5 | GO:0032581 | ER-dependent peroxisome organization(GO:0032581) |
| 0.6 | 2.5 | GO:0045626 | negative regulation of T-helper 1 cell differentiation(GO:0045626) |
| 0.6 | 3.0 | GO:0042776 | mitochondrial ATP synthesis coupled proton transport(GO:0042776) |
| 0.6 | 1.8 | GO:0038195 | urokinase plasminogen activator signaling pathway(GO:0038195) |
| 0.6 | 1.7 | GO:0006742 | NADP catabolic process(GO:0006742) pyridine nucleotide catabolic process(GO:0019364) |
| 0.6 | 4.7 | GO:0031444 | slow-twitch skeletal muscle fiber contraction(GO:0031444) |
| 0.6 | 1.7 | GO:0061182 | negative regulation of chondrocyte development(GO:0061182) |
| 0.6 | 4.0 | GO:0033590 | response to cobalamin(GO:0033590) |
| 0.6 | 4.5 | GO:0015712 | hexose phosphate transport(GO:0015712) glucose-6-phosphate transport(GO:0015760) |
| 0.5 | 1.1 | GO:0002537 | nitric oxide production involved in inflammatory response(GO:0002537) |
| 0.5 | 2.2 | GO:0070981 | L-asparagine biosynthetic process(GO:0070981) L-asparagine metabolic process(GO:0070982) |
| 0.5 | 7.0 | GO:0046449 | creatinine metabolic process(GO:0046449) |
| 0.5 | 1.6 | GO:0071676 | negative regulation of mononuclear cell migration(GO:0071676) |
| 0.5 | 2.7 | GO:0001555 | oocyte growth(GO:0001555) |
| 0.5 | 2.1 | GO:0043314 | negative regulation of neutrophil degranulation(GO:0043314) |
| 0.5 | 1.5 | GO:0034147 | regulation of toll-like receptor 5 signaling pathway(GO:0034147) negative regulation of toll-like receptor 5 signaling pathway(GO:0034148) negative regulation of nucleotide-binding oligomerization domain containing 1 signaling pathway(GO:0070429) |
| 0.5 | 1.5 | GO:1903644 | regulation of chaperone-mediated protein folding(GO:1903644) |
| 0.5 | 1.5 | GO:2000097 | regulation of smooth muscle cell-matrix adhesion(GO:2000097) |
| 0.5 | 1.9 | GO:0046900 | tetrahydrofolylpolyglutamate metabolic process(GO:0046900) |
| 0.5 | 4.9 | GO:0002480 | antigen processing and presentation of exogenous peptide antigen via MHC class I, TAP-independent(GO:0002480) |
| 0.5 | 2.9 | GO:0071105 | response to interleukin-11(GO:0071105) |
| 0.5 | 2.4 | GO:2000418 | positive regulation of eosinophil migration(GO:2000418) |
| 0.5 | 1.4 | GO:0016185 | synaptic vesicle budding from presynaptic endocytic zone membrane(GO:0016185) |
| 0.5 | 0.5 | GO:0051946 | regulation of amino acid uptake involved in synaptic transmission(GO:0051941) regulation of glutamate uptake involved in transmission of nerve impulse(GO:0051946) regulation of L-glutamate import(GO:1900920) |
| 0.5 | 2.8 | GO:0010732 | protein glutathionylation(GO:0010731) regulation of protein glutathionylation(GO:0010732) negative regulation of protein glutathionylation(GO:0010734) |
| 0.5 | 1.4 | GO:1901492 | positive regulation of lymphangiogenesis(GO:1901492) |
| 0.5 | 1.4 | GO:0006391 | transcription initiation from mitochondrial promoter(GO:0006391) |
| 0.4 | 11.6 | GO:0071294 | cellular response to zinc ion(GO:0071294) |
| 0.4 | 1.8 | GO:1902568 | positive regulation of eosinophil degranulation(GO:0043311) positive regulation of eosinophil activation(GO:1902568) |
| 0.4 | 3.1 | GO:2000324 | positive regulation of glucocorticoid receptor signaling pathway(GO:2000324) |
| 0.4 | 1.7 | GO:1905224 | clathrin-coated pit assembly(GO:1905224) |
| 0.4 | 0.4 | GO:0045077 | negative regulation of interferon-gamma biosynthetic process(GO:0045077) negative regulation of B cell differentiation(GO:0045578) |
| 0.4 | 3.3 | GO:0072733 | response to staurosporine(GO:0072733) cellular response to staurosporine(GO:0072734) |
| 0.4 | 5.7 | GO:0070424 | regulation of nucleotide-binding oligomerization domain containing signaling pathway(GO:0070424) |
| 0.4 | 1.6 | GO:0010902 | positive regulation of very-low-density lipoprotein particle remodeling(GO:0010902) |
| 0.4 | 1.2 | GO:0035498 | carnosine metabolic process(GO:0035498) |
| 0.4 | 1.2 | GO:1901899 | positive regulation of relaxation of cardiac muscle(GO:1901899) |
| 0.4 | 4.8 | GO:2001288 | positive regulation of caveolin-mediated endocytosis(GO:2001288) |
| 0.4 | 5.6 | GO:0098914 | membrane repolarization during atrial cardiac muscle cell action potential(GO:0098914) |
| 0.4 | 3.1 | GO:0036337 | Fas signaling pathway(GO:0036337) |
| 0.4 | 4.9 | GO:0036155 | acylglycerol acyl-chain remodeling(GO:0036155) |
| 0.4 | 6.0 | GO:0021796 | cerebral cortex regionalization(GO:0021796) |
| 0.4 | 6.7 | GO:0051386 | regulation of neurotrophin TRK receptor signaling pathway(GO:0051386) |
| 0.4 | 1.5 | GO:0009443 | pyridoxal 5'-phosphate salvage(GO:0009443) |
| 0.4 | 1.5 | GO:0070889 | platelet alpha granule organization(GO:0070889) |
| 0.4 | 0.7 | GO:0032831 | regulation of CD4-positive, CD25-positive, alpha-beta regulatory T cell differentiation(GO:0032829) positive regulation of CD4-positive, CD25-positive, alpha-beta regulatory T cell differentiation(GO:0032831) |
| 0.4 | 2.2 | GO:1903588 | negative regulation of blood vessel endothelial cell proliferation involved in sprouting angiogenesis(GO:1903588) |
| 0.4 | 2.2 | GO:0035995 | detection of muscle stretch(GO:0035995) |
| 0.4 | 1.8 | GO:0009608 | response to symbiont(GO:0009608) response to symbiotic bacterium(GO:0009609) |
| 0.3 | 0.7 | GO:0014916 | regulation of lung blood pressure(GO:0014916) |
| 0.3 | 1.7 | GO:0046167 | glycerol-3-phosphate biosynthetic process(GO:0046167) |
| 0.3 | 1.0 | GO:1901857 | positive regulation of cellular respiration(GO:1901857) |
| 0.3 | 1.0 | GO:1903570 | regulation of protein kinase D signaling(GO:1903570) positive regulation of protein kinase D signaling(GO:1903572) |
| 0.3 | 1.0 | GO:0061394 | regulation of transcription from RNA polymerase II promoter in response to arsenic-containing substance(GO:0061394) |
| 0.3 | 1.0 | GO:1904158 | axonemal central apparatus assembly(GO:1904158) |
| 0.3 | 5.3 | GO:0051601 | exocyst localization(GO:0051601) |
| 0.3 | 1.3 | GO:0060448 | dichotomous subdivision of terminal units involved in lung branching(GO:0060448) |
| 0.3 | 1.0 | GO:0006498 | N-terminal protein lipidation(GO:0006498) |
| 0.3 | 1.0 | GO:0042357 | thiamine diphosphate metabolic process(GO:0042357) |
| 0.3 | 1.0 | GO:0002339 | B cell selection(GO:0002339) |
| 0.3 | 1.3 | GO:0035407 | histone H3-T11 phosphorylation(GO:0035407) |
| 0.3 | 3.9 | GO:0035360 | positive regulation of peroxisome proliferator activated receptor signaling pathway(GO:0035360) |
| 0.3 | 1.6 | GO:0060332 | positive regulation of response to interferon-gamma(GO:0060332) positive regulation of interferon-gamma-mediated signaling pathway(GO:0060335) |
| 0.3 | 2.3 | GO:0030259 | lipid glycosylation(GO:0030259) |
| 0.3 | 0.3 | GO:0002439 | chronic inflammatory response to antigenic stimulus(GO:0002439) |
| 0.3 | 1.3 | GO:0042631 | cellular response to water deprivation(GO:0042631) |
| 0.3 | 1.0 | GO:1903721 | regulation of I-kappaB phosphorylation(GO:1903719) positive regulation of I-kappaB phosphorylation(GO:1903721) |
| 0.3 | 4.1 | GO:1900623 | regulation of monocyte aggregation(GO:1900623) positive regulation of monocyte aggregation(GO:1900625) |
| 0.3 | 0.6 | GO:0048371 | lateral mesodermal cell differentiation(GO:0048371) |
| 0.3 | 1.9 | GO:0043456 | regulation of pentose-phosphate shunt(GO:0043456) |
| 0.3 | 1.8 | GO:0060356 | leucine import(GO:0060356) |
| 0.3 | 0.6 | GO:1901253 | negative regulation of intracellular transport of viral material(GO:1901253) |
| 0.3 | 1.5 | GO:0046208 | spermine catabolic process(GO:0046208) |
| 0.3 | 0.9 | GO:2000374 | regulation of oxygen metabolic process(GO:2000374) |
| 0.3 | 0.9 | GO:1903826 | arginine transmembrane transport(GO:1903826) |
| 0.3 | 1.2 | GO:0039534 | negative regulation of MDA-5 signaling pathway(GO:0039534) |
| 0.3 | 0.9 | GO:0048250 | mitochondrial iron ion transport(GO:0048250) |
| 0.3 | 1.2 | GO:0048104 | establishment of body hair or bristle planar orientation(GO:0048104) establishment of body hair planar orientation(GO:0048105) |
| 0.3 | 0.9 | GO:0006579 | amino-acid betaine catabolic process(GO:0006579) |
| 0.3 | 1.2 | GO:2000297 | negative regulation of synapse maturation(GO:2000297) |
| 0.3 | 1.8 | GO:0003025 | regulation of systemic arterial blood pressure by baroreceptor feedback(GO:0003025) |
| 0.3 | 3.0 | GO:0021633 | optic nerve structural organization(GO:0021633) |
| 0.3 | 3.8 | GO:0070327 | thyroid hormone transport(GO:0070327) |
| 0.3 | 0.6 | GO:0002215 | defense response to nematode(GO:0002215) |
| 0.3 | 1.2 | GO:0035359 | negative regulation of peroxisome proliferator activated receptor signaling pathway(GO:0035359) |
| 0.3 | 0.3 | GO:0043366 | beta selection(GO:0043366) |
| 0.3 | 1.2 | GO:1903070 | negative regulation of ER-associated ubiquitin-dependent protein catabolic process(GO:1903070) |
| 0.3 | 1.5 | GO:0072656 | maintenance of protein location in mitochondrion(GO:0072656) |
| 0.3 | 1.8 | GO:0008218 | bioluminescence(GO:0008218) |
| 0.3 | 0.3 | GO:0009726 | detection of endogenous stimulus(GO:0009726) |
| 0.3 | 2.0 | GO:0060665 | regulation of branching involved in salivary gland morphogenesis by mesenchymal-epithelial signaling(GO:0060665) |
| 0.3 | 1.1 | GO:0002268 | follicular dendritic cell differentiation(GO:0002268) |
| 0.3 | 1.1 | GO:0009436 | glyoxylate catabolic process(GO:0009436) |
| 0.3 | 1.4 | GO:0030035 | microspike assembly(GO:0030035) |
| 0.3 | 1.4 | GO:0043128 | regulation of 1-phosphatidylinositol 4-kinase activity(GO:0043126) positive regulation of 1-phosphatidylinositol 4-kinase activity(GO:0043128) |
| 0.3 | 1.1 | GO:0010585 | glutamine secretion(GO:0010585) L-glutamine import(GO:0036229) L-glutamine import into cell(GO:1903803) |
| 0.3 | 1.4 | GO:0043932 | ossification involved in bone remodeling(GO:0043932) |
| 0.3 | 5.6 | GO:0030150 | protein import into mitochondrial matrix(GO:0030150) |
| 0.3 | 1.7 | GO:0061762 | CAMKK-AMPK signaling cascade(GO:0061762) |
| 0.3 | 0.3 | GO:0098971 | anterograde dendritic transport of neurotransmitter receptor complex(GO:0098971) |
| 0.3 | 0.6 | GO:1902523 | activation of MAPK activity involved in innate immune response(GO:0035419) positive regulation of protein K63-linked ubiquitination(GO:1902523) |
| 0.3 | 0.8 | GO:0000103 | sulfate assimilation(GO:0000103) |
| 0.3 | 2.9 | GO:0036376 | sodium ion export from cell(GO:0036376) |
| 0.3 | 0.8 | GO:0030037 | actin filament reorganization involved in cell cycle(GO:0030037) |
| 0.3 | 1.1 | GO:1904640 | response to methionine(GO:1904640) |
| 0.3 | 2.6 | GO:0061734 | parkin-mediated mitophagy in response to mitochondrial depolarization(GO:0061734) |
| 0.3 | 0.5 | GO:0030886 | negative regulation of myeloid dendritic cell activation(GO:0030886) |
| 0.3 | 0.8 | GO:2000661 | positive regulation of interleukin-1-mediated signaling pathway(GO:2000661) |
| 0.3 | 0.8 | GO:2000502 | negative regulation of natural killer cell chemotaxis(GO:2000502) |
| 0.3 | 0.8 | GO:0006147 | guanine catabolic process(GO:0006147) |
| 0.3 | 0.8 | GO:0048867 | stem cell fate determination(GO:0048867) |
| 0.3 | 1.3 | GO:0033512 | L-lysine catabolic process to acetyl-CoA via saccharopine(GO:0033512) |
| 0.3 | 0.8 | GO:1903862 | positive regulation of oxidative phosphorylation(GO:1903862) |
| 0.3 | 3.6 | GO:0070257 | positive regulation of mucus secretion(GO:0070257) |
| 0.3 | 0.8 | GO:1902214 | regulation of interleukin-4-mediated signaling pathway(GO:1902214) |
| 0.2 | 0.7 | GO:0003363 | lamellipodium assembly involved in ameboidal cell migration(GO:0003363) |
| 0.2 | 1.2 | GO:1904398 | positive regulation of neuromuscular junction development(GO:1904398) |
| 0.2 | 0.7 | GO:0001545 | primary ovarian follicle growth(GO:0001545) |
| 0.2 | 0.2 | GO:0060031 | mediolateral intercalation(GO:0060031) planar cell polarity pathway involved in gastrula mediolateral intercalation(GO:0060775) |
| 0.2 | 1.5 | GO:0098989 | NMDA selective glutamate receptor signaling pathway(GO:0098989) |
| 0.2 | 0.7 | GO:0042323 | negative regulation of circadian sleep/wake cycle, non-REM sleep(GO:0042323) negative regulation of mucus secretion(GO:0070256) |
| 0.2 | 0.7 | GO:0098976 | excitatory chemical synaptic transmission(GO:0098976) regulation of AMPA glutamate receptor clustering(GO:1904717) positive regulation of AMPA glutamate receptor clustering(GO:1904719) |
| 0.2 | 0.7 | GO:0070407 | oxidation-dependent protein catabolic process(GO:0070407) |
| 0.2 | 0.7 | GO:1903537 | meiotic spindle elongation(GO:0051232) meiotic cell cycle process involved in oocyte maturation(GO:1903537) regulation of meiotic cell cycle process involved in oocyte maturation(GO:1903538) |
| 0.2 | 0.2 | GO:0072209 | metanephric mesangial cell differentiation(GO:0072209) metanephric glomerular mesangial cell differentiation(GO:0072254) |
| 0.2 | 0.7 | GO:0061163 | endoplasmic reticulum polarization(GO:0061163) actin filament bundle retrograde transport(GO:0061573) actin filament bundle distribution(GO:0070650) |
| 0.2 | 1.0 | GO:0051970 | negative regulation of transmission of nerve impulse(GO:0051970) |
| 0.2 | 0.5 | GO:2000382 | positive regulation of mesoderm development(GO:2000382) |
| 0.2 | 1.4 | GO:0071351 | interleukin-18-mediated signaling pathway(GO:0035655) cellular response to interleukin-18(GO:0071351) |
| 0.2 | 2.1 | GO:0033211 | adiponectin-activated signaling pathway(GO:0033211) |
| 0.2 | 0.2 | GO:0036466 | synaptic vesicle recycling via endosome(GO:0036466) |
| 0.2 | 2.3 | GO:0043951 | negative regulation of cAMP-mediated signaling(GO:0043951) |
| 0.2 | 2.8 | GO:0002934 | desmosome organization(GO:0002934) |
| 0.2 | 0.9 | GO:0050823 | peptide stabilization(GO:0050822) peptide antigen stabilization(GO:0050823) |
| 0.2 | 2.1 | GO:2001206 | positive regulation of osteoclast development(GO:2001206) |
| 0.2 | 1.6 | GO:0060282 | positive regulation of oocyte development(GO:0060282) |
| 0.2 | 0.7 | GO:0014707 | branchiomeric skeletal muscle development(GO:0014707) |
| 0.2 | 1.6 | GO:0072592 | oxygen metabolic process(GO:0072592) |
| 0.2 | 4.7 | GO:0006957 | complement activation, alternative pathway(GO:0006957) |
| 0.2 | 1.1 | GO:0071934 | thiamine transmembrane transport(GO:0071934) |
| 0.2 | 1.1 | GO:0038163 | thrombopoietin-mediated signaling pathway(GO:0038163) |
| 0.2 | 0.9 | GO:0046947 | hydroxylysine metabolic process(GO:0046946) hydroxylysine biosynthetic process(GO:0046947) |
| 0.2 | 0.9 | GO:1902228 | positive regulation of odontogenesis of dentin-containing tooth(GO:0042488) mammary gland fat development(GO:0060611) positive regulation of macrophage colony-stimulating factor signaling pathway(GO:1902228) positive regulation of response to macrophage colony-stimulating factor(GO:1903971) positive regulation of cellular response to macrophage colony-stimulating factor stimulus(GO:1903974) positive regulation of microglial cell migration(GO:1904141) |
| 0.2 | 3.7 | GO:0098712 | L-glutamate import across plasma membrane(GO:0098712) |
| 0.2 | 0.7 | GO:0003050 | regulation of systemic arterial blood pressure by atrial natriuretic peptide(GO:0003050) |
| 0.2 | 2.4 | GO:0098795 | mRNA cleavage involved in gene silencing by miRNA(GO:0035279) mRNA cleavage involved in gene silencing(GO:0098795) |
| 0.2 | 2.2 | GO:0086024 | adrenergic receptor signaling pathway involved in positive regulation of heart rate(GO:0086024) |
| 0.2 | 0.6 | GO:0034395 | regulation of transcription from RNA polymerase II promoter in response to iron(GO:0034395) |
| 0.2 | 0.6 | GO:0035281 | pre-miRNA export from nucleus(GO:0035281) |
| 0.2 | 1.3 | GO:2001180 | negative regulation of interleukin-10 secretion(GO:2001180) |
| 0.2 | 1.7 | GO:0010961 | cellular magnesium ion homeostasis(GO:0010961) |
| 0.2 | 1.9 | GO:0045039 | protein import into mitochondrial inner membrane(GO:0045039) |
| 0.2 | 1.1 | GO:1990573 | potassium ion import across plasma membrane(GO:1990573) |
| 0.2 | 0.9 | GO:0060528 | secretory columnal luminar epithelial cell differentiation involved in prostate glandular acinus development(GO:0060528) |
| 0.2 | 0.6 | GO:0071962 | mitotic sister chromatid cohesion, centromeric(GO:0071962) |
| 0.2 | 0.4 | GO:0034371 | chylomicron remodeling(GO:0034371) |
| 0.2 | 0.6 | GO:0014034 | neural crest cell fate commitment(GO:0014034) |
| 0.2 | 0.8 | GO:0048205 | COPI-coated vesicle budding(GO:0035964) Golgi transport vesicle coating(GO:0048200) COPI coating of Golgi vesicle(GO:0048205) |
| 0.2 | 1.7 | GO:0070164 | negative regulation of adiponectin secretion(GO:0070164) |
| 0.2 | 1.0 | GO:0042360 | vitamin E metabolic process(GO:0042360) |
| 0.2 | 0.4 | GO:0021623 | oculomotor nerve morphogenesis(GO:0021622) oculomotor nerve formation(GO:0021623) |
| 0.2 | 0.6 | GO:2001271 | negative regulation of cysteine-type endopeptidase activity involved in execution phase of apoptosis(GO:2001271) |
| 0.2 | 0.4 | GO:0036269 | swimming behavior(GO:0036269) |
| 0.2 | 0.8 | GO:0071816 | tail-anchored membrane protein insertion into ER membrane(GO:0071816) |
| 0.2 | 0.6 | GO:1904862 | inhibitory synapse assembly(GO:1904862) |
| 0.2 | 0.6 | GO:2001274 | negative regulation of glucose import in response to insulin stimulus(GO:2001274) |
| 0.2 | 1.2 | GO:0019255 | glucose 1-phosphate metabolic process(GO:0019255) |
| 0.2 | 0.6 | GO:1900193 | regulation of oocyte maturation(GO:1900193) negative regulation of oocyte maturation(GO:1900194) |
| 0.2 | 1.4 | GO:0070995 | NADPH oxidation(GO:0070995) |
| 0.2 | 0.8 | GO:0002483 | antigen processing and presentation of endogenous peptide antigen(GO:0002483) |
| 0.2 | 0.4 | GO:0072338 | cellular lactam metabolic process(GO:0072338) |
| 0.2 | 0.8 | GO:0071442 | positive regulation of histone H3-K14 acetylation(GO:0071442) |
| 0.2 | 0.2 | GO:0002277 | myeloid dendritic cell activation involved in immune response(GO:0002277) |
| 0.2 | 0.6 | GO:0035565 | regulation of pronephros size(GO:0035565) |
| 0.2 | 1.0 | GO:0061760 | antifungal innate immune response(GO:0061760) |
| 0.2 | 0.8 | GO:0000454 | snoRNA guided rRNA pseudouridine synthesis(GO:0000454) |
| 0.2 | 1.7 | GO:0060574 | intestinal epithelial cell maturation(GO:0060574) |
| 0.2 | 0.8 | GO:2000110 | negative regulation of macrophage apoptotic process(GO:2000110) |
| 0.2 | 0.9 | GO:0034421 | post-translational protein acetylation(GO:0034421) |
| 0.2 | 2.6 | GO:0040016 | embryonic cleavage(GO:0040016) |
| 0.2 | 0.6 | GO:0009051 | pentose-phosphate shunt, oxidative branch(GO:0009051) |
| 0.2 | 0.4 | GO:0043465 | fermentation(GO:0006113) regulation of fermentation(GO:0043465) |
| 0.2 | 4.7 | GO:0048311 | mitochondrion distribution(GO:0048311) |
| 0.2 | 0.7 | GO:1904588 | cellular response to glycoprotein(GO:1904588) cellular response to thyrotropin-releasing hormone(GO:1905229) |
| 0.2 | 0.4 | GO:1904529 | regulation of actin filament binding(GO:1904529) regulation of actin binding(GO:1904616) |
| 0.2 | 0.4 | GO:0002361 | CD4-positive, CD25-positive, alpha-beta regulatory T cell differentiation(GO:0002361) |
| 0.2 | 0.4 | GO:0003343 | proepicardium development(GO:0003342) septum transversum development(GO:0003343) |
| 0.2 | 1.5 | GO:0035469 | determination of pancreatic left/right asymmetry(GO:0035469) |
| 0.2 | 0.9 | GO:0010836 | negative regulation of protein ADP-ribosylation(GO:0010836) |
| 0.2 | 1.1 | GO:0097052 | L-kynurenine metabolic process(GO:0097052) |
| 0.2 | 1.3 | GO:0002933 | lipid hydroxylation(GO:0002933) |
| 0.2 | 0.5 | GO:2000359 | regulation of binding of sperm to zona pellucida(GO:2000359) |
| 0.2 | 0.5 | GO:0090526 | regulation of gluconeogenesis involved in cellular glucose homeostasis(GO:0090526) |
| 0.2 | 0.5 | GO:1902908 | regulation of melanosome transport(GO:1902908) |
| 0.2 | 0.7 | GO:0042450 | arginine biosynthetic process via ornithine(GO:0042450) |
| 0.2 | 1.1 | GO:0015822 | ornithine transport(GO:0015822) |
| 0.2 | 1.6 | GO:2001199 | negative regulation of dendritic cell differentiation(GO:2001199) |
| 0.2 | 0.5 | GO:1901355 | response to rapamycin(GO:1901355) |
| 0.2 | 0.7 | GO:0097498 | endothelial tube lumen extension(GO:0097498) |
| 0.2 | 0.4 | GO:0045715 | negative regulation of low-density lipoprotein particle receptor biosynthetic process(GO:0045715) |
| 0.2 | 1.1 | GO:1900748 | positive regulation of vascular endothelial growth factor signaling pathway(GO:1900748) |
| 0.2 | 1.6 | GO:0080009 | mRNA methylation(GO:0080009) |
| 0.2 | 0.7 | GO:0097045 | phosphatidylserine exposure on blood platelet(GO:0097045) |
| 0.2 | 0.5 | GO:0060168 | regulation of adenosine receptor signaling pathway(GO:0060167) positive regulation of adenosine receptor signaling pathway(GO:0060168) |
| 0.2 | 4.8 | GO:0031581 | hemidesmosome assembly(GO:0031581) |
| 0.2 | 4.8 | GO:0050901 | leukocyte tethering or rolling(GO:0050901) |
| 0.2 | 5.2 | GO:0008535 | respiratory chain complex IV assembly(GO:0008535) |
| 0.2 | 0.9 | GO:0010989 | negative regulation of low-density lipoprotein particle clearance(GO:0010989) |
| 0.2 | 0.9 | GO:0099624 | atrial cardiac muscle cell membrane repolarization(GO:0099624) |
| 0.2 | 1.7 | GO:0070234 | positive regulation of T cell apoptotic process(GO:0070234) |
| 0.2 | 1.5 | GO:0007182 | common-partner SMAD protein phosphorylation(GO:0007182) |
| 0.2 | 2.2 | GO:0001553 | luteinization(GO:0001553) |
| 0.2 | 1.3 | GO:0002254 | kinin cascade(GO:0002254) plasma kallikrein-kinin cascade(GO:0002353) |
| 0.2 | 22.1 | GO:0034340 | response to type I interferon(GO:0034340) |
| 0.2 | 0.3 | GO:0071104 | response to interleukin-9(GO:0071104) |
| 0.2 | 0.5 | GO:0000472 | endonucleolytic cleavage to generate mature 5'-end of SSU-rRNA from (SSU-rRNA, 5.8S rRNA, LSU-rRNA)(GO:0000472) rRNA 5'-end processing(GO:0000967) ncRNA 5'-end processing(GO:0034471) |
| 0.2 | 0.8 | GO:0000480 | endonucleolytic cleavage in 5'-ETS of tricistronic rRNA transcript (SSU-rRNA, 5.8S rRNA, LSU-rRNA)(GO:0000480) |
| 0.2 | 0.5 | GO:0070625 | zymogen granule exocytosis(GO:0070625) |
| 0.2 | 1.0 | GO:0035105 | sterol regulatory element binding protein import into nucleus(GO:0035105) |
| 0.2 | 1.5 | GO:1901552 | positive regulation of endothelial cell development(GO:1901552) positive regulation of establishment of endothelial barrier(GO:1903142) |
| 0.2 | 2.1 | GO:0046940 | nucleoside monophosphate phosphorylation(GO:0046940) |
| 0.2 | 0.8 | GO:0043606 | histidine catabolic process to glutamate and formamide(GO:0019556) histidine catabolic process to glutamate and formate(GO:0019557) formamide metabolic process(GO:0043606) |
| 0.2 | 1.8 | GO:0016553 | base conversion or substitution editing(GO:0016553) |
| 0.2 | 1.5 | GO:0006335 | DNA replication-dependent nucleosome assembly(GO:0006335) DNA replication-dependent nucleosome organization(GO:0034723) |
| 0.2 | 0.3 | GO:0002541 | activation of plasma proteins involved in acute inflammatory response(GO:0002541) activation of blood coagulation via clotting cascade(GO:0002543) |
| 0.2 | 1.0 | GO:0016078 | tRNA catabolic process(GO:0016078) |
| 0.2 | 0.5 | GO:0019046 | release from viral latency(GO:0019046) |
| 0.2 | 0.5 | GO:0086097 | phospholipase C-activating angiotensin-activated signaling pathway(GO:0086097) |
| 0.2 | 0.5 | GO:0045212 | negative regulation of synaptic transmission, cholinergic(GO:0032223) neurotransmitter receptor biosynthetic process(GO:0045212) |
| 0.2 | 0.5 | GO:0008614 | pyridoxine metabolic process(GO:0008614) pyridoxine biosynthetic process(GO:0008615) vitamin B6 biosynthetic process(GO:0042819) |
| 0.2 | 0.6 | GO:0044210 | 'de novo' CTP biosynthetic process(GO:0044210) |
| 0.2 | 1.1 | GO:0071321 | cellular response to cGMP(GO:0071321) |
| 0.2 | 0.8 | GO:0046885 | regulation of hormone biosynthetic process(GO:0046885) |
| 0.2 | 1.3 | GO:0034378 | chylomicron assembly(GO:0034378) |
| 0.2 | 0.5 | GO:0014724 | regulation of twitch skeletal muscle contraction(GO:0014724) regulation of fast-twitch skeletal muscle fiber contraction(GO:0031446) positive regulation of fast-twitch skeletal muscle fiber contraction(GO:0031448) |
| 0.2 | 0.6 | GO:0009257 | 10-formyltetrahydrofolate biosynthetic process(GO:0009257) |
| 0.2 | 0.8 | GO:0010513 | positive regulation of phosphatidylinositol biosynthetic process(GO:0010513) |
| 0.2 | 0.5 | GO:0070904 | L-ascorbic acid transport(GO:0015882) transepithelial L-ascorbic acid transport(GO:0070904) |
| 0.2 | 1.0 | GO:0032468 | Golgi calcium ion homeostasis(GO:0032468) |
| 0.2 | 0.2 | GO:0033602 | negative regulation of dopamine secretion(GO:0033602) |
| 0.2 | 0.5 | GO:0018201 | peptidyl-glycine modification(GO:0018201) |
| 0.2 | 1.8 | GO:0048102 | autophagic cell death(GO:0048102) |
| 0.2 | 0.8 | GO:0097039 | protein linear polyubiquitination(GO:0097039) |
| 0.2 | 0.5 | GO:0042946 | glucoside transport(GO:0042946) |
| 0.2 | 1.9 | GO:0051024 | positive regulation of immunoglobulin secretion(GO:0051024) |
| 0.2 | 0.3 | GO:0052031 | induction by symbiont of host defense response(GO:0044416) induction of host immune response by virus(GO:0046730) active induction of host immune response by virus(GO:0046732) modulation by symbiont of host defense response(GO:0052031) induction by organism of defense response of other organism involved in symbiotic interaction(GO:0052251) modulation by organism of defense response of other organism involved in symbiotic interaction(GO:0052255) positive regulation by symbiont of host defense response(GO:0052509) positive regulation by organism of defense response of other organism involved in symbiotic interaction(GO:0052510) modulation by organism of immune response of other organism involved in symbiotic interaction(GO:0052552) modulation by symbiont of host immune response(GO:0052553) modulation by virus of host immune response(GO:0075528) |
| 0.2 | 1.9 | GO:0038166 | angiotensin-activated signaling pathway(GO:0038166) |
| 0.2 | 1.4 | GO:0046598 | positive regulation of viral entry into host cell(GO:0046598) |
| 0.2 | 0.3 | GO:0002876 | positive regulation of chronic inflammatory response to antigenic stimulus(GO:0002876) |
| 0.2 | 0.9 | GO:2000152 | regulation of ubiquitin-specific protease activity(GO:2000152) positive regulation of ubiquitin-specific protease activity(GO:2000158) |
| 0.2 | 0.5 | GO:0032827 | natural killer cell differentiation involved in immune response(GO:0002325) negative regulation of natural killer cell differentiation(GO:0032824) regulation of natural killer cell differentiation involved in immune response(GO:0032826) negative regulation of natural killer cell differentiation involved in immune response(GO:0032827) |
| 0.2 | 3.5 | GO:0051923 | sulfation(GO:0051923) |
| 0.2 | 0.6 | GO:0035803 | egg coat formation(GO:0035803) |
| 0.2 | 0.5 | GO:0090370 | negative regulation of cholesterol efflux(GO:0090370) |
| 0.2 | 0.5 | GO:0061027 | umbilical cord morphogenesis(GO:0036304) umbilical cord development(GO:0061027) |
| 0.2 | 0.2 | GO:0000255 | allantoin metabolic process(GO:0000255) |
| 0.2 | 0.8 | GO:0042986 | positive regulation of amyloid precursor protein biosynthetic process(GO:0042986) |
| 0.2 | 0.2 | GO:1903487 | regulation of lactation(GO:1903487) |
| 0.2 | 1.7 | GO:0043152 | induction of bacterial agglutination(GO:0043152) |
| 0.2 | 1.5 | GO:0051918 | negative regulation of fibrinolysis(GO:0051918) |
| 0.2 | 4.1 | GO:0042481 | regulation of odontogenesis(GO:0042481) |
| 0.2 | 0.5 | GO:0007174 | epidermal growth factor catabolic process(GO:0007174) |
| 0.1 | 0.3 | GO:0070093 | negative regulation of glucagon secretion(GO:0070093) |
| 0.1 | 0.9 | GO:0090074 | negative regulation of protein homodimerization activity(GO:0090074) |
| 0.1 | 0.7 | GO:0002351 | serotonin production involved in inflammatory response(GO:0002351) serotonin secretion involved in inflammatory response(GO:0002442) serotonin secretion by platelet(GO:0002554) |
| 0.1 | 0.6 | GO:1900827 | maintenance of protein location in membrane(GO:0072658) maintenance of protein location in plasma membrane(GO:0072660) positive regulation of membrane depolarization during cardiac muscle cell action potential(GO:1900827) |
| 0.1 | 0.6 | GO:0032972 | regulation of muscle filament sliding speed(GO:0032972) |
| 0.1 | 0.6 | GO:2000681 | negative regulation of rubidium ion transport(GO:2000681) negative regulation of rubidium ion transmembrane transporter activity(GO:2000687) |
| 0.1 | 0.4 | GO:1902310 | positive regulation of peptidyl-serine dephosphorylation(GO:1902310) |
| 0.1 | 0.4 | GO:0070487 | monocyte aggregation(GO:0070487) |
| 0.1 | 0.9 | GO:0048291 | isotype switching to IgG isotypes(GO:0048291) |
| 0.1 | 0.3 | GO:0021524 | visceral motor neuron differentiation(GO:0021524) |
| 0.1 | 0.4 | GO:0035054 | embryonic heart tube anterior/posterior pattern specification(GO:0035054) |
| 0.1 | 0.7 | GO:0097398 | response to interleukin-17(GO:0097396) cellular response to interleukin-17(GO:0097398) |
| 0.1 | 0.3 | GO:0036462 | TRAIL-activated apoptotic signaling pathway(GO:0036462) |
| 0.1 | 0.6 | GO:0045402 | interleukin-4 biosynthetic process(GO:0042097) regulation of interleukin-4 biosynthetic process(GO:0045402) |
| 0.1 | 0.9 | GO:0010898 | positive regulation of triglyceride catabolic process(GO:0010898) |
| 0.1 | 1.3 | GO:0045836 | positive regulation of meiotic nuclear division(GO:0045836) |
| 0.1 | 0.1 | GO:2000182 | regulation of progesterone biosynthetic process(GO:2000182) |
| 0.1 | 0.6 | GO:0060414 | aorta smooth muscle tissue morphogenesis(GO:0060414) |
| 0.1 | 9.2 | GO:0010803 | regulation of tumor necrosis factor-mediated signaling pathway(GO:0010803) |
| 0.1 | 0.4 | GO:0009750 | response to fructose(GO:0009750) |
| 0.1 | 0.6 | GO:2001268 | negative regulation of cysteine-type endopeptidase activity involved in apoptotic signaling pathway(GO:2001268) |
| 0.1 | 1.3 | GO:0097500 | receptor localization to nonmotile primary cilium(GO:0097500) |
| 0.1 | 1.3 | GO:0002578 | negative regulation of antigen processing and presentation(GO:0002578) |
| 0.1 | 0.4 | GO:0070431 | nucleotide-binding oligomerization domain containing 2 signaling pathway(GO:0070431) |
| 0.1 | 1.1 | GO:0035799 | ureter maturation(GO:0035799) |
| 0.1 | 0.4 | GO:0045780 | positive regulation of bone resorption(GO:0045780) positive regulation of bone remodeling(GO:0046852) |
| 0.1 | 0.3 | GO:0097325 | melanocyte proliferation(GO:0097325) |
| 0.1 | 0.4 | GO:0002408 | myeloid dendritic cell chemotaxis(GO:0002408) |
| 0.1 | 0.3 | GO:0048769 | sarcomerogenesis(GO:0048769) |
| 0.1 | 0.3 | GO:0097212 | lysosomal membrane organization(GO:0097212) |
| 0.1 | 0.3 | GO:0045875 | negative regulation of sister chromatid cohesion(GO:0045875) |
| 0.1 | 1.2 | GO:0002175 | protein localization to paranode region of axon(GO:0002175) |
| 0.1 | 1.8 | GO:2000271 | positive regulation of fibroblast apoptotic process(GO:2000271) |
| 0.1 | 0.5 | GO:0048843 | negative regulation of axon extension involved in axon guidance(GO:0048843) |
| 0.1 | 1.1 | GO:0044375 | regulation of peroxisome size(GO:0044375) |
| 0.1 | 2.4 | GO:0034497 | protein localization to pre-autophagosomal structure(GO:0034497) |
| 0.1 | 1.5 | GO:0009957 | epidermal cell fate specification(GO:0009957) |
| 0.1 | 3.2 | GO:0045161 | neuronal ion channel clustering(GO:0045161) |
| 0.1 | 2.3 | GO:1900364 | negative regulation of mRNA polyadenylation(GO:1900364) |
| 0.1 | 1.5 | GO:1900017 | positive regulation of cytokine production involved in inflammatory response(GO:1900017) |
| 0.1 | 0.1 | GO:0001831 | trophectodermal cellular morphogenesis(GO:0001831) |
| 0.1 | 0.4 | GO:0014810 | positive regulation of skeletal muscle contraction by regulation of release of sequestered calcium ion(GO:0014810) |
| 0.1 | 0.5 | GO:0051754 | meiotic sister chromatid cohesion, centromeric(GO:0051754) |
| 0.1 | 0.5 | GO:2000314 | regulation of neural crest formation(GO:0090299) negative regulation of neural crest formation(GO:0090301) negative regulation of fibroblast growth factor receptor signaling pathway involved in neural plate anterior/posterior pattern formation(GO:2000314) |
| 0.1 | 1.3 | GO:0045657 | positive regulation of monocyte differentiation(GO:0045657) |
| 0.1 | 0.1 | GO:0090170 | regulation of Golgi inheritance(GO:0090170) |
| 0.1 | 0.8 | GO:0070376 | regulation of ERK5 cascade(GO:0070376) |
| 0.1 | 1.2 | GO:0034141 | positive regulation of toll-like receptor 3 signaling pathway(GO:0034141) |
| 0.1 | 0.3 | GO:1901668 | regulation of superoxide dismutase activity(GO:1901668) |
| 0.1 | 0.5 | GO:1903755 | regulation of SUMO transferase activity(GO:1903182) positive regulation of SUMO transferase activity(GO:1903755) |
| 0.1 | 0.1 | GO:0030581 | intracellular transport of viral protein in host cell(GO:0019060) symbiont intracellular protein transport in host(GO:0030581) intracellular protein transport in other organism involved in symbiotic interaction(GO:0051708) |
| 0.1 | 1.9 | GO:0006700 | C21-steroid hormone biosynthetic process(GO:0006700) |
| 0.1 | 2.9 | GO:0007213 | G-protein coupled acetylcholine receptor signaling pathway(GO:0007213) |
| 0.1 | 0.4 | GO:1903949 | positive regulation of atrial cardiac muscle cell action potential(GO:1903949) |
| 0.1 | 0.9 | GO:0021683 | cerebellar granular layer morphogenesis(GO:0021683) |
| 0.1 | 3.1 | GO:0019511 | peptidyl-proline hydroxylation(GO:0019511) |
| 0.1 | 0.4 | GO:1990927 | short-term synaptic potentiation(GO:1990926) calcium ion regulated lysosome exocytosis(GO:1990927) |
| 0.1 | 0.8 | GO:0060595 | fibroblast growth factor receptor signaling pathway involved in negative regulation of apoptotic process in bone marrow(GO:0035602) fibroblast growth factor receptor signaling pathway involved in hemopoiesis(GO:0035603) fibroblast growth factor receptor signaling pathway involved in positive regulation of cell proliferation in bone marrow(GO:0035604) fibroblast growth factor receptor signaling pathway involved in orbitofrontal cortex development(GO:0035607) squamous basal epithelial stem cell differentiation involved in prostate gland acinus development(GO:0060529) fibroblast growth factor receptor signaling pathway involved in mammary gland specification(GO:0060595) mammary gland bud formation(GO:0060615) branch elongation involved in salivary gland morphogenesis(GO:0060667) mesenchymal cell differentiation involved in lung development(GO:0060915) |
| 0.1 | 1.0 | GO:0043248 | proteasome assembly(GO:0043248) |
| 0.1 | 11.8 | GO:0050672 | negative regulation of mononuclear cell proliferation(GO:0032945) negative regulation of lymphocyte proliferation(GO:0050672) |
| 0.1 | 0.1 | GO:0002468 | dendritic cell antigen processing and presentation(GO:0002468) |
| 0.1 | 0.3 | GO:0002281 | macrophage activation involved in immune response(GO:0002281) |
| 0.1 | 0.5 | GO:0048880 | sensory system development(GO:0048880) |
| 0.1 | 0.1 | GO:0072061 | inner medullary collecting duct development(GO:0072061) |
| 0.1 | 0.4 | GO:0003218 | cardiac left ventricle formation(GO:0003218) |
| 0.1 | 0.4 | GO:0060459 | subthalamic nucleus development(GO:0021763) deltoid tuberosity development(GO:0035993) prolactin secreting cell differentiation(GO:0060127) left lung development(GO:0060459) left lung morphogenesis(GO:0060460) pulmonary vein morphogenesis(GO:0060577) superior vena cava morphogenesis(GO:0060578) |
| 0.1 | 1.1 | GO:1902219 | negative regulation of intrinsic apoptotic signaling pathway in response to osmotic stress(GO:1902219) |
| 0.1 | 1.1 | GO:0015840 | urea transport(GO:0015840) |
| 0.1 | 0.4 | GO:0071344 | diphosphate metabolic process(GO:0071344) |
| 0.1 | 2.5 | GO:0015812 | gamma-aminobutyric acid transport(GO:0015812) |
| 0.1 | 0.7 | GO:0042699 | follicle-stimulating hormone signaling pathway(GO:0042699) |
| 0.1 | 0.5 | GO:0035544 | negative regulation of SNARE complex assembly(GO:0035544) |
| 0.1 | 0.4 | GO:0002071 | glandular epithelial cell maturation(GO:0002071) |
| 0.1 | 0.5 | GO:0006049 | UDP-N-acetylglucosamine catabolic process(GO:0006049) |
| 0.1 | 1.5 | GO:0038129 | ERBB3 signaling pathway(GO:0038129) |
| 0.1 | 0.6 | GO:0071799 | response to prostaglandin D(GO:0071798) cellular response to prostaglandin D stimulus(GO:0071799) |
| 0.1 | 0.5 | GO:1901842 | negative regulation of high voltage-gated calcium channel activity(GO:1901842) |
| 0.1 | 0.1 | GO:0060024 | rhythmic synaptic transmission(GO:0060024) |
| 0.1 | 0.2 | GO:1902031 | regulation of NADP metabolic process(GO:1902031) |
| 0.1 | 1.4 | GO:0070423 | nucleotide-binding oligomerization domain containing signaling pathway(GO:0070423) |
| 0.1 | 0.8 | GO:0030432 | peristalsis(GO:0030432) |
| 0.1 | 0.4 | GO:1903576 | response to L-arginine(GO:1903576) |
| 0.1 | 2.3 | GO:0018298 | protein-chromophore linkage(GO:0018298) |
| 0.1 | 13.1 | GO:0031146 | SCF-dependent proteasomal ubiquitin-dependent protein catabolic process(GO:0031146) |
| 0.1 | 2.0 | GO:1901256 | interleukin-21 production(GO:0032625) macrophage colony-stimulating factor production(GO:0036301) interleukin-21 secretion(GO:0072619) regulation of macrophage colony-stimulating factor production(GO:1901256) |
| 0.1 | 0.4 | GO:1902868 | regulation of transcription from RNA polymerase II promoter involved in forebrain neuron fate commitment(GO:0021882) cerebral cortex GABAergic interneuron fate commitment(GO:0021893) positive regulation of neural retina development(GO:0061075) positive regulation of retina development in camera-type eye(GO:1902868) positive regulation of amacrine cell differentiation(GO:1902871) |
| 0.1 | 0.8 | GO:1901098 | positive regulation of autophagosome maturation(GO:1901098) |
| 0.1 | 0.6 | GO:0032703 | negative regulation of interleukin-2 production(GO:0032703) |
| 0.1 | 2.0 | GO:0046069 | cGMP catabolic process(GO:0046069) |
| 0.1 | 0.6 | GO:0043988 | histone H3-S28 phosphorylation(GO:0043988) |
| 0.1 | 0.1 | GO:2000501 | regulation of natural killer cell chemotaxis(GO:2000501) |
| 0.1 | 0.4 | GO:0072344 | rescue of stalled ribosome(GO:0072344) |
| 0.1 | 0.4 | GO:0035048 | splicing factor protein import into nucleus(GO:0035048) |
| 0.1 | 0.8 | GO:1901509 | regulation of endothelial tube morphogenesis(GO:1901509) |
| 0.1 | 0.3 | GO:0044771 | meiotic cell cycle phase transition(GO:0044771) regulation of meiotic cell cycle phase transition(GO:1901993) negative regulation of meiotic cell cycle phase transition(GO:1901994) |
| 0.1 | 1.6 | GO:2000809 | positive regulation of synaptic vesicle clustering(GO:2000809) |
| 0.1 | 0.7 | GO:0060370 | susceptibility to T cell mediated cytotoxicity(GO:0060370) |
| 0.1 | 0.2 | GO:0072076 | nephrogenic mesenchyme development(GO:0072076) |
| 0.1 | 0.1 | GO:0009441 | glycolate metabolic process(GO:0009441) |
| 0.1 | 0.5 | GO:0060391 | positive regulation of SMAD protein import into nucleus(GO:0060391) |
| 0.1 | 0.1 | GO:0046108 | uridine metabolic process(GO:0046108) |
| 0.1 | 0.3 | GO:0003430 | growth plate cartilage chondrocyte growth(GO:0003430) |
| 0.1 | 0.3 | GO:0045897 | positive regulation of transcription during mitosis(GO:0045897) |
| 0.1 | 1.3 | GO:0032926 | negative regulation of activin receptor signaling pathway(GO:0032926) |
| 0.1 | 0.6 | GO:0048254 | snoRNA localization(GO:0048254) |
| 0.1 | 0.4 | GO:2000866 | positive regulation of estrogen secretion(GO:2000863) positive regulation of estradiol secretion(GO:2000866) |
| 0.1 | 0.3 | GO:1904808 | regulation of protein oxidation(GO:1904806) positive regulation of protein oxidation(GO:1904808) |
| 0.1 | 0.5 | GO:0015742 | alpha-ketoglutarate transport(GO:0015742) |
| 0.1 | 1.4 | GO:1902083 | negative regulation of peptidyl-cysteine S-nitrosylation(GO:1902083) |
| 0.1 | 0.3 | GO:0045917 | positive regulation of complement activation(GO:0045917) positive regulation of protein activation cascade(GO:2000259) |
| 0.1 | 0.1 | GO:1903774 | positive regulation of viral budding via host ESCRT complex(GO:1903774) |
| 0.1 | 0.8 | GO:0031118 | rRNA pseudouridine synthesis(GO:0031118) |
| 0.1 | 0.2 | GO:0071639 | positive regulation of monocyte chemotactic protein-1 production(GO:0071639) |
| 0.1 | 0.2 | GO:0035932 | mineralocorticoid secretion(GO:0035931) aldosterone secretion(GO:0035932) regulation of mineralocorticoid secretion(GO:2000855) regulation of aldosterone secretion(GO:2000858) |
| 0.1 | 1.5 | GO:0071361 | cellular response to ethanol(GO:0071361) |
| 0.1 | 2.2 | GO:1900745 | positive regulation of p38MAPK cascade(GO:1900745) |
| 0.1 | 0.3 | GO:0021526 | medial motor column neuron differentiation(GO:0021526) |
| 0.1 | 0.3 | GO:0019755 | one-carbon compound transport(GO:0019755) |
| 0.1 | 1.2 | GO:0001976 | neurological system process involved in regulation of systemic arterial blood pressure(GO:0001976) |
| 0.1 | 0.6 | GO:0045218 | zonula adherens maintenance(GO:0045218) |
| 0.1 | 0.3 | GO:0007518 | myoblast fate determination(GO:0007518) |
| 0.1 | 0.4 | GO:0060478 | acrosomal vesicle exocytosis(GO:0060478) |
| 0.1 | 0.2 | GO:0045588 | positive regulation of gamma-delta T cell differentiation(GO:0045588) |
| 0.1 | 0.3 | GO:0098917 | retrograde trans-synaptic signaling(GO:0098917) |
| 0.1 | 0.5 | GO:1903936 | cellular response to sodium arsenite(GO:1903936) |
| 0.1 | 0.2 | GO:1903232 | melanosome assembly(GO:1903232) |
| 0.1 | 0.5 | GO:0043328 | protein targeting to vacuole involved in ubiquitin-dependent protein catabolic process via the multivesicular body sorting pathway(GO:0043328) |
| 0.1 | 0.6 | GO:0030240 | skeletal muscle thin filament assembly(GO:0030240) |
| 0.1 | 1.1 | GO:0034058 | endosomal vesicle fusion(GO:0034058) |
| 0.1 | 6.7 | GO:0015701 | bicarbonate transport(GO:0015701) |
| 0.1 | 0.2 | GO:0046586 | regulation of calcium-dependent cell-cell adhesion(GO:0046586) |
| 0.1 | 0.6 | GO:0031627 | telomeric loop formation(GO:0031627) |
| 0.1 | 2.1 | GO:0006228 | UTP biosynthetic process(GO:0006228) |
| 0.1 | 1.9 | GO:0006704 | glucocorticoid biosynthetic process(GO:0006704) |
| 0.1 | 0.5 | GO:0044339 | canonical Wnt signaling pathway involved in osteoblast differentiation(GO:0044339) |
| 0.1 | 0.7 | GO:0048318 | axial mesoderm development(GO:0048318) |
| 0.1 | 0.1 | GO:1900222 | negative regulation of beta-amyloid clearance(GO:1900222) |
| 0.1 | 0.1 | GO:0036090 | cleavage furrow ingression(GO:0036090) |
| 0.1 | 4.0 | GO:1904659 | hexose transmembrane transport(GO:0035428) glucose transmembrane transport(GO:1904659) |
| 0.1 | 0.9 | GO:0015986 | energy coupled proton transport, down electrochemical gradient(GO:0015985) ATP synthesis coupled proton transport(GO:0015986) |
| 0.1 | 0.4 | GO:0007206 | phospholipase C-activating G-protein coupled glutamate receptor signaling pathway(GO:0007206) |
| 0.1 | 0.4 | GO:0018199 | peptidyl-glutamine modification(GO:0018199) |
| 0.1 | 0.1 | GO:0014858 | positive regulation of skeletal muscle cell proliferation(GO:0014858) |
| 0.1 | 0.2 | GO:0045759 | negative regulation of action potential(GO:0045759) |
| 0.1 | 0.2 | GO:1990668 | vesicle fusion with endoplasmic reticulum-Golgi intermediate compartment (ERGIC) membrane(GO:1990668) |
| 0.1 | 0.2 | GO:0090091 | positive regulation of extracellular matrix disassembly(GO:0090091) |
| 0.1 | 2.2 | GO:0048935 | peripheral nervous system neuron differentiation(GO:0048934) peripheral nervous system neuron development(GO:0048935) |
| 0.1 | 0.6 | GO:0072719 | cellular response to cisplatin(GO:0072719) |
| 0.1 | 0.4 | GO:0071231 | cellular response to folic acid(GO:0071231) |
| 0.1 | 0.2 | GO:0006883 | cellular sodium ion homeostasis(GO:0006883) |
| 0.1 | 2.6 | GO:0035590 | purinergic nucleotide receptor signaling pathway(GO:0035590) |
| 0.1 | 0.7 | GO:0030174 | regulation of DNA-dependent DNA replication initiation(GO:0030174) |
| 0.1 | 0.3 | GO:0086073 | bundle of His cell-Purkinje myocyte adhesion involved in cell communication(GO:0086073) |
| 0.1 | 2.2 | GO:0006004 | fucose metabolic process(GO:0006004) |
| 0.1 | 1.2 | GO:2000643 | positive regulation of early endosome to late endosome transport(GO:2000643) |
| 0.1 | 1.1 | GO:1900112 | regulation of histone H3-K9 trimethylation(GO:1900112) |
| 0.1 | 0.8 | GO:0031584 | activation of phospholipase D activity(GO:0031584) |
| 0.1 | 0.5 | GO:0061668 | mitochondrial ribosome assembly(GO:0061668) |
| 0.1 | 0.5 | GO:0045872 | positive regulation of rhodopsin gene expression(GO:0045872) |
| 0.1 | 0.3 | GO:1901876 | regulation of calcium ion binding(GO:1901876) negative regulation of calcium ion binding(GO:1901877) |
| 0.1 | 0.1 | GO:2000118 | regulation of sodium-dependent phosphate transport(GO:2000118) |
| 0.1 | 0.5 | GO:1902766 | skeletal muscle satellite cell migration(GO:1902766) |
| 0.1 | 0.5 | GO:0097011 | cellular response to granulocyte macrophage colony-stimulating factor stimulus(GO:0097011) response to granulocyte macrophage colony-stimulating factor(GO:0097012) |
| 0.1 | 0.4 | GO:0033353 | S-adenosylmethionine cycle(GO:0033353) |
| 0.1 | 1.0 | GO:0032264 | IMP salvage(GO:0032264) |
| 0.1 | 4.0 | GO:1903146 | regulation of mitophagy(GO:1903146) |
| 0.1 | 0.4 | GO:0060022 | hard palate development(GO:0060022) |
| 0.1 | 0.6 | GO:0055089 | fatty acid homeostasis(GO:0055089) |
| 0.1 | 0.2 | GO:0001692 | histamine metabolic process(GO:0001692) |
| 0.1 | 0.5 | GO:1903301 | positive regulation of glucokinase activity(GO:0033133) positive regulation of hexokinase activity(GO:1903301) |
| 0.1 | 0.2 | GO:0002331 | pre-B cell allelic exclusion(GO:0002331) |
| 0.1 | 0.3 | GO:1904354 | negative regulation of telomere capping(GO:1904354) |
| 0.1 | 0.3 | GO:1901073 | N-acetylglucosamine biosynthetic process(GO:0006045) glucosamine-containing compound biosynthetic process(GO:1901073) |
| 0.1 | 0.3 | GO:0003344 | pericardium morphogenesis(GO:0003344) |
| 0.1 | 0.2 | GO:0060661 | submandibular salivary gland formation(GO:0060661) hair follicle cell proliferation(GO:0071335) regulation of hair follicle cell proliferation(GO:0071336) positive regulation of hair follicle cell proliferation(GO:0071338) |
| 0.1 | 0.7 | GO:0055129 | L-proline biosynthetic process(GO:0055129) |
| 0.1 | 3.8 | GO:0042088 | T-helper 1 type immune response(GO:0042088) |
| 0.1 | 0.2 | GO:0071224 | cellular response to peptidoglycan(GO:0071224) |
| 0.1 | 2.0 | GO:0030322 | stabilization of membrane potential(GO:0030322) |
| 0.1 | 0.8 | GO:0010667 | negative regulation of cardiac muscle cell apoptotic process(GO:0010667) |
| 0.1 | 0.3 | GO:0060309 | elastin catabolic process(GO:0060309) |
| 0.1 | 0.5 | GO:1903630 | regulation of aminoacyl-tRNA ligase activity(GO:1903630) |
| 0.1 | 0.2 | GO:0071500 | cellular response to nitrosative stress(GO:0071500) |
| 0.1 | 1.3 | GO:0071402 | cellular response to lipoprotein particle stimulus(GO:0071402) |
| 0.1 | 0.5 | GO:1904565 | response to 1-oleoyl-sn-glycerol 3-phosphate(GO:1904565) cellular response to 1-oleoyl-sn-glycerol 3-phosphate(GO:1904566) |
| 0.1 | 1.7 | GO:0014819 | regulation of skeletal muscle contraction(GO:0014819) |
| 0.1 | 0.9 | GO:0010571 | positive regulation of nuclear cell cycle DNA replication(GO:0010571) |
| 0.1 | 0.6 | GO:0071421 | manganese ion transmembrane transport(GO:0071421) |
| 0.1 | 0.4 | GO:0030538 | embryonic genitalia morphogenesis(GO:0030538) |
| 0.1 | 1.5 | GO:0071578 | zinc II ion transmembrane import(GO:0071578) |
| 0.1 | 0.3 | GO:0016094 | polyprenol biosynthetic process(GO:0016094) |
| 0.1 | 0.4 | GO:0007016 | cytoskeletal anchoring at plasma membrane(GO:0007016) |
| 0.1 | 0.3 | GO:0034635 | glutathione transport(GO:0034635) tripeptide transport(GO:0042939) |
| 0.1 | 0.4 | GO:0039526 | suppression by virus of host apoptotic process(GO:0019050) modulation by virus of host apoptotic process(GO:0039526) cellular process regulating host cell cycle in response to virus(GO:0060154) |
| 0.1 | 0.3 | GO:1904328 | regulation of myofibroblast contraction(GO:1904328) myofibroblast contraction(GO:1990764) |
| 0.1 | 1.2 | GO:0016576 | histone dephosphorylation(GO:0016576) |
| 0.1 | 0.7 | GO:0006880 | intracellular sequestering of iron ion(GO:0006880) sequestering of iron ion(GO:0097577) |
| 0.1 | 0.1 | GO:1902524 | positive regulation of protein K48-linked ubiquitination(GO:1902524) |
| 0.1 | 0.7 | GO:0001554 | luteolysis(GO:0001554) |
| 0.1 | 0.4 | GO:1904098 | regulation of protein O-linked glycosylation(GO:1904098) positive regulation of protein O-linked glycosylation(GO:1904100) |
| 0.1 | 0.3 | GO:0072429 | response to intra-S DNA damage checkpoint signaling(GO:0072429) |
| 0.1 | 0.4 | GO:0008295 | spermidine biosynthetic process(GO:0008295) |
| 0.1 | 0.1 | GO:0007468 | regulation of rhodopsin gene expression(GO:0007468) |
| 0.1 | 1.4 | GO:0042730 | fibrinolysis(GO:0042730) |
| 0.1 | 0.2 | GO:0050859 | negative regulation of B cell receptor signaling pathway(GO:0050859) |
| 0.1 | 0.4 | GO:0034343 | type III interferon production(GO:0034343) regulation of type III interferon production(GO:0034344) |
| 0.1 | 0.5 | GO:0046322 | negative regulation of fatty acid oxidation(GO:0046322) |
| 0.1 | 0.3 | GO:2000403 | positive regulation of lymphocyte migration(GO:2000403) |
| 0.1 | 0.2 | GO:1900619 | acetylcholine metabolic process(GO:0008291) acetate ester metabolic process(GO:1900619) |
| 0.1 | 1.5 | GO:0030277 | maintenance of gastrointestinal epithelium(GO:0030277) |
| 0.1 | 0.2 | GO:0098780 | response to mitochondrial depolarisation(GO:0098780) |
| 0.1 | 0.7 | GO:0007621 | negative regulation of female receptivity(GO:0007621) |
| 0.1 | 0.3 | GO:0032474 | otolith morphogenesis(GO:0032474) |
| 0.1 | 0.9 | GO:1903944 | negative regulation of myoblast fusion(GO:1901740) regulation of hepatocyte apoptotic process(GO:1903943) negative regulation of hepatocyte apoptotic process(GO:1903944) |
| 0.1 | 0.1 | GO:0089718 | amino acid import across plasma membrane(GO:0089718) |
| 0.1 | 0.3 | GO:0032930 | positive regulation of superoxide anion generation(GO:0032930) |
| 0.1 | 0.6 | GO:0000492 | box C/D snoRNP assembly(GO:0000492) |
| 0.1 | 0.6 | GO:0035616 | histone H2B conserved C-terminal lysine deubiquitination(GO:0035616) |
| 0.1 | 1.1 | GO:0035095 | behavioral response to nicotine(GO:0035095) |
| 0.1 | 0.6 | GO:0061154 | endothelial tube morphogenesis(GO:0061154) |
| 0.1 | 0.3 | GO:0044828 | negative regulation by host of viral genome replication(GO:0044828) |
| 0.1 | 1.2 | GO:0089711 | L-glutamate transmembrane transport(GO:0089711) |
| 0.1 | 1.3 | GO:0032515 | negative regulation of phosphoprotein phosphatase activity(GO:0032515) |
| 0.1 | 0.1 | GO:1903969 | regulation of macrophage colony-stimulating factor signaling pathway(GO:1902226) negative regulation of macrophage colony-stimulating factor signaling pathway(GO:1902227) regulation of response to macrophage colony-stimulating factor(GO:1903969) negative regulation of response to macrophage colony-stimulating factor(GO:1903970) regulation of cellular response to macrophage colony-stimulating factor stimulus(GO:1903972) negative regulation of cellular response to macrophage colony-stimulating factor stimulus(GO:1903973) microglial cell migration(GO:1904124) regulation of microglial cell migration(GO:1904139) |
| 0.1 | 0.2 | GO:0048073 | regulation of eye pigmentation(GO:0048073) |
| 0.1 | 0.3 | GO:0060235 | lens induction in camera-type eye(GO:0060235) |
| 0.1 | 0.7 | GO:0072386 | plus-end-directed organelle transport along microtubule(GO:0072386) |
| 0.1 | 1.1 | GO:0043320 | natural killer cell degranulation(GO:0043320) |
| 0.1 | 0.3 | GO:0031642 | negative regulation of myelination(GO:0031642) |
| 0.1 | 0.3 | GO:0000451 | rRNA 2'-O-methylation(GO:0000451) |
| 0.1 | 0.8 | GO:0035524 | proline transmembrane transport(GO:0035524) |
| 0.1 | 0.1 | GO:1904393 | regulation of skeletal muscle acetylcholine-gated channel clustering(GO:1904393) negative regulation of neuromuscular junction development(GO:1904397) |
| 0.1 | 0.1 | GO:1901017 | negative regulation of potassium ion transmembrane transporter activity(GO:1901017) |
| 0.1 | 0.6 | GO:0060020 | Bergmann glial cell differentiation(GO:0060020) |
| 0.1 | 0.7 | GO:2001171 | positive regulation of ATP biosynthetic process(GO:2001171) |
| 0.1 | 0.2 | GO:0009386 | translational attenuation(GO:0009386) |
| 0.1 | 0.2 | GO:0070634 | transepithelial ammonium transport(GO:0070634) |
| 0.1 | 0.2 | GO:0061589 | calcium activated phosphatidylserine scrambling(GO:0061589) |
| 0.1 | 0.3 | GO:0051490 | negative regulation of filopodium assembly(GO:0051490) |
| 0.1 | 0.6 | GO:1901558 | response to metformin(GO:1901558) negative regulation of pancreatic stellate cell proliferation(GO:2000230) |
| 0.1 | 1.3 | GO:0090361 | platelet-derived growth factor production(GO:0090360) regulation of platelet-derived growth factor production(GO:0090361) |
| 0.1 | 0.2 | GO:2000053 | regulation of Wnt signaling pathway involved in dorsal/ventral axis specification(GO:2000053) |
| 0.1 | 0.2 | GO:0006054 | N-acetylneuraminate metabolic process(GO:0006054) |
| 0.1 | 0.2 | GO:0034971 | histone H3-R17 methylation(GO:0034971) |
| 0.1 | 0.2 | GO:1990418 | response to insulin-like growth factor stimulus(GO:1990418) |
| 0.1 | 0.3 | GO:0090095 | regulation of metanephric cap mesenchymal cell proliferation(GO:0090095) positive regulation of metanephric cap mesenchymal cell proliferation(GO:0090096) |
| 0.1 | 0.2 | GO:0001579 | medium-chain fatty acid transport(GO:0001579) |
| 0.1 | 0.5 | GO:0033504 | floor plate development(GO:0033504) |
| 0.1 | 0.2 | GO:0034239 | macrophage fusion(GO:0034238) regulation of macrophage fusion(GO:0034239) positive regulation of macrophage fusion(GO:0034241) |
| 0.1 | 0.2 | GO:0006828 | manganese ion transport(GO:0006828) |
| 0.1 | 0.3 | GO:0099558 | maintenance of synapse structure(GO:0099558) |
| 0.1 | 0.6 | GO:0018344 | protein geranylgeranylation(GO:0018344) |
| 0.1 | 0.6 | GO:0098735 | positive regulation of the force of heart contraction(GO:0098735) |
| 0.1 | 0.8 | GO:0000212 | meiotic spindle organization(GO:0000212) |
| 0.1 | 0.1 | GO:0032425 | positive regulation of mismatch repair(GO:0032425) |
| 0.1 | 0.6 | GO:0046604 | positive regulation of mitotic centrosome separation(GO:0046604) |
| 0.1 | 0.1 | GO:0000491 | small nucleolar ribonucleoprotein complex assembly(GO:0000491) |
| 0.1 | 1.3 | GO:0006972 | hyperosmotic response(GO:0006972) |
| 0.1 | 0.1 | GO:0045054 | constitutive secretory pathway(GO:0045054) |
| 0.1 | 0.3 | GO:0050960 | detection of temperature stimulus involved in thermoception(GO:0050960) response to capsazepine(GO:1901594) |
| 0.1 | 1.0 | GO:0060742 | epithelial cell differentiation involved in prostate gland development(GO:0060742) |
| 0.1 | 0.8 | GO:0006107 | oxaloacetate metabolic process(GO:0006107) |
| 0.1 | 0.2 | GO:2000616 | negative regulation of histone H3-K9 acetylation(GO:2000616) |
| 0.1 | 0.3 | GO:0060040 | retinal bipolar neuron differentiation(GO:0060040) |
| 0.1 | 0.3 | GO:0002337 | B-1a B cell differentiation(GO:0002337) |
| 0.1 | 0.2 | GO:1901165 | positive regulation of trophoblast cell migration(GO:1901165) |
| 0.1 | 0.4 | GO:0048743 | positive regulation of skeletal muscle fiber development(GO:0048743) |
| 0.1 | 0.9 | GO:0070544 | histone H3-K36 demethylation(GO:0070544) |
| 0.1 | 0.3 | GO:0009298 | GDP-mannose biosynthetic process(GO:0009298) |
| 0.1 | 1.1 | GO:0000338 | protein deneddylation(GO:0000338) |
| 0.1 | 0.6 | GO:0007506 | gonadal mesoderm development(GO:0007506) |
| 0.1 | 0.5 | GO:0046015 | regulation of transcription by glucose(GO:0046015) |
| 0.1 | 0.1 | GO:1900186 | negative regulation of clathrin-mediated endocytosis(GO:1900186) |
| 0.1 | 0.1 | GO:0042998 | positive regulation of Golgi to plasma membrane protein transport(GO:0042998) |
| 0.1 | 6.7 | GO:0006890 | retrograde vesicle-mediated transport, Golgi to ER(GO:0006890) |
| 0.1 | 0.3 | GO:0019418 | sulfide oxidation(GO:0019418) sulfide oxidation, using sulfide:quinone oxidoreductase(GO:0070221) |
| 0.1 | 0.2 | GO:0045041 | protein import into mitochondrial intermembrane space(GO:0045041) |
| 0.1 | 0.2 | GO:0032971 | regulation of muscle filament sliding(GO:0032971) |
| 0.1 | 0.8 | GO:1904706 | negative regulation of vascular smooth muscle cell proliferation(GO:1904706) |
| 0.1 | 0.6 | GO:0070863 | positive regulation of protein exit from endoplasmic reticulum(GO:0070863) |
| 0.1 | 0.2 | GO:0071287 | cellular response to manganese ion(GO:0071287) |
| 0.1 | 0.7 | GO:0000466 | maturation of 5.8S rRNA from tricistronic rRNA transcript (SSU-rRNA, 5.8S rRNA, LSU-rRNA)(GO:0000466) |
| 0.1 | 0.2 | GO:0007343 | egg activation(GO:0007343) |
| 0.1 | 0.6 | GO:0002943 | tRNA dihydrouridine synthesis(GO:0002943) |
| 0.1 | 0.6 | GO:0019375 | galactosylceramide biosynthetic process(GO:0006682) galactolipid biosynthetic process(GO:0019375) |
| 0.1 | 0.3 | GO:0035521 | monoubiquitinated histone deubiquitination(GO:0035521) monoubiquitinated histone H2A deubiquitination(GO:0035522) |
| 0.1 | 0.1 | GO:0044026 | DNA hypermethylation(GO:0044026) |
| 0.1 | 1.0 | GO:1902284 | axon extension involved in axon guidance(GO:0048846) neuron projection extension involved in neuron projection guidance(GO:1902284) |
| 0.1 | 0.8 | GO:1900029 | positive regulation of ruffle assembly(GO:1900029) |
| 0.1 | 0.2 | GO:0080154 | regulation of fertilization(GO:0080154) |
| 0.1 | 0.2 | GO:0070970 | interleukin-2 secretion(GO:0070970) |
| 0.1 | 1.9 | GO:0032211 | negative regulation of telomere maintenance via telomerase(GO:0032211) |
| 0.1 | 0.1 | GO:0097034 | mitochondrial respiratory chain complex IV biogenesis(GO:0097034) |
| 0.1 | 0.5 | GO:0032287 | peripheral nervous system myelin maintenance(GO:0032287) |
| 0.1 | 0.2 | GO:0070676 | intralumenal vesicle formation(GO:0070676) |
| 0.1 | 1.3 | GO:0043485 | endosome to melanosome transport(GO:0035646) endosome to pigment granule transport(GO:0043485) pigment granule maturation(GO:0048757) |
| 0.1 | 0.1 | GO:0072717 | cellular response to actinomycin D(GO:0072717) |
| 0.1 | 0.3 | GO:0050747 | positive regulation of lipoprotein metabolic process(GO:0050747) |
| 0.1 | 0.4 | GO:2000301 | negative regulation of synaptic vesicle exocytosis(GO:2000301) |
| 0.1 | 1.6 | GO:1903846 | positive regulation of transforming growth factor beta receptor signaling pathway(GO:0030511) positive regulation of cellular response to transforming growth factor beta stimulus(GO:1903846) |
| 0.1 | 2.6 | GO:0071711 | basement membrane organization(GO:0071711) |
| 0.1 | 0.3 | GO:1990168 | protein K33-linked deubiquitination(GO:1990168) |
| 0.1 | 0.9 | GO:1903543 | positive regulation of exosomal secretion(GO:1903543) |
| 0.1 | 0.3 | GO:0061299 | retina vasculature morphogenesis in camera-type eye(GO:0061299) |
| 0.1 | 0.2 | GO:0006663 | platelet activating factor biosynthetic process(GO:0006663) |
| 0.1 | 0.1 | GO:0010193 | response to ozone(GO:0010193) |
| 0.1 | 2.1 | GO:0042149 | cellular response to glucose starvation(GO:0042149) |
| 0.1 | 0.1 | GO:0097368 | establishment of Sertoli cell barrier(GO:0097368) |
| 0.1 | 0.4 | GO:0043950 | positive regulation of cAMP-mediated signaling(GO:0043950) |
| 0.1 | 2.0 | GO:0016338 | calcium-independent cell-cell adhesion via plasma membrane cell-adhesion molecules(GO:0016338) |
| 0.1 | 0.3 | GO:0006015 | 5-phosphoribose 1-diphosphate biosynthetic process(GO:0006015) 5-phosphoribose 1-diphosphate metabolic process(GO:0046391) |
| 0.1 | 0.2 | GO:0000478 | endonucleolytic cleavage involved in rRNA processing(GO:0000478) |
| 0.1 | 0.3 | GO:0036302 | atrioventricular canal development(GO:0036302) |
| 0.1 | 0.5 | GO:0006659 | phosphatidylserine biosynthetic process(GO:0006659) |
| 0.1 | 1.5 | GO:0051639 | actin filament network formation(GO:0051639) |
| 0.1 | 2.9 | GO:1901998 | toxin transport(GO:1901998) |
| 0.1 | 0.3 | GO:0046075 | dTTP metabolic process(GO:0046075) |
| 0.1 | 0.1 | GO:0043605 | cellular amide catabolic process(GO:0043605) |
| 0.1 | 1.2 | GO:0010592 | positive regulation of lamellipodium assembly(GO:0010592) |
| 0.1 | 0.4 | GO:0060433 | bronchus development(GO:0060433) lobar bronchus development(GO:0060482) |
| 0.1 | 0.3 | GO:0050916 | sensory perception of sweet taste(GO:0050916) |
| 0.1 | 0.6 | GO:0071963 | establishment or maintenance of cell polarity regulating cell shape(GO:0071963) |
| 0.1 | 0.1 | GO:0075509 | receptor-mediated endocytosis of virus by host cell(GO:0019065) endocytosis involved in viral entry into host cell(GO:0075509) |
| 0.1 | 0.3 | GO:1900060 | negative regulation of sphingolipid biosynthetic process(GO:0090155) cellular sphingolipid homeostasis(GO:0090156) negative regulation of ceramide biosynthetic process(GO:1900060) |
| 0.1 | 0.4 | GO:0034227 | tRNA thio-modification(GO:0034227) |
| 0.1 | 0.1 | GO:0021847 | ventricular zone neuroblast division(GO:0021847) |
| 0.1 | 0.5 | GO:2000628 | regulation of miRNA metabolic process(GO:2000628) |
| 0.1 | 1.6 | GO:0001782 | B cell homeostasis(GO:0001782) |
| 0.1 | 0.3 | GO:0032057 | negative regulation of translational initiation in response to stress(GO:0032057) |
| 0.1 | 0.7 | GO:0015816 | glycine transport(GO:0015816) |
| 0.1 | 0.1 | GO:1900111 | positive regulation of histone H3-K9 dimethylation(GO:1900111) |
| 0.1 | 0.2 | GO:2000109 | regulation of macrophage apoptotic process(GO:2000109) |
| 0.1 | 0.2 | GO:0086103 | G-protein coupled receptor signaling pathway involved in heart process(GO:0086103) |
| 0.1 | 0.2 | GO:1904751 | positive regulation of protein localization to nucleolus(GO:1904751) |
| 0.1 | 0.6 | GO:0042256 | mature ribosome assembly(GO:0042256) |
| 0.1 | 0.2 | GO:0044376 | RNA polymerase II complex import to nucleus(GO:0044376) RNA polymerase III complex localization to nucleus(GO:1990022) |
| 0.1 | 0.4 | GO:0001712 | ectoderm formation(GO:0001705) ectodermal cell fate commitment(GO:0001712) |
| 0.1 | 0.3 | GO:1901097 | negative regulation of autophagosome maturation(GO:1901097) |
| 0.1 | 0.5 | GO:0031053 | primary miRNA processing(GO:0031053) |
| 0.1 | 0.4 | GO:0006051 | mannosamine metabolic process(GO:0006050) N-acetylmannosamine metabolic process(GO:0006051) |
| 0.1 | 0.2 | GO:0035627 | ceramide transport(GO:0035627) |
| 0.1 | 0.2 | GO:0070681 | glutaminyl-tRNAGln biosynthesis via transamidation(GO:0070681) |
| 0.1 | 1.0 | GO:0006610 | ribosomal protein import into nucleus(GO:0006610) |
| 0.1 | 0.7 | GO:0019852 | L-ascorbic acid metabolic process(GO:0019852) |
| 0.1 | 0.1 | GO:1904798 | positive regulation of core promoter binding(GO:1904798) |
| 0.1 | 0.2 | GO:0043652 | engulfment of apoptotic cell(GO:0043652) |
| 0.1 | 1.1 | GO:0019373 | epoxygenase P450 pathway(GO:0019373) |
| 0.1 | 0.5 | GO:0017196 | N-terminal peptidyl-methionine acetylation(GO:0017196) |
| 0.1 | 0.8 | GO:0034035 | purine ribonucleoside bisphosphate metabolic process(GO:0034035) 3'-phosphoadenosine 5'-phosphosulfate metabolic process(GO:0050427) |
| 0.1 | 0.2 | GO:2000322 | regulation of glucocorticoid receptor signaling pathway(GO:2000322) |
| 0.1 | 0.6 | GO:0034626 | fatty acid elongation, saturated fatty acid(GO:0019367) fatty acid elongation, unsaturated fatty acid(GO:0019368) fatty acid elongation, monounsaturated fatty acid(GO:0034625) fatty acid elongation, polyunsaturated fatty acid(GO:0034626) |
| 0.1 | 0.6 | GO:0071712 | ER-associated misfolded protein catabolic process(GO:0071712) |
| 0.1 | 0.1 | GO:0051714 | positive regulation of cytolysis in other organism(GO:0051714) |
| 0.1 | 0.6 | GO:0045072 | interferon-gamma biosynthetic process(GO:0042095) regulation of interferon-gamma biosynthetic process(GO:0045072) positive regulation of interferon-gamma biosynthetic process(GO:0045078) |
| 0.1 | 0.1 | GO:0019249 | lactate biosynthetic process(GO:0019249) |
| 0.1 | 0.1 | GO:0007290 | spermatid nucleus elongation(GO:0007290) |
| 0.1 | 0.1 | GO:0010911 | regulation of isomerase activity(GO:0010911) positive regulation of isomerase activity(GO:0010912) |
| 0.1 | 0.5 | GO:0014744 | positive regulation of muscle adaptation(GO:0014744) |
| 0.1 | 1.2 | GO:1990126 | retrograde transport, endosome to plasma membrane(GO:1990126) |
| 0.1 | 0.9 | GO:0006098 | pentose-phosphate shunt(GO:0006098) |
| 0.1 | 0.1 | GO:0061744 | psychomotor behavior(GO:0036343) motor behavior(GO:0061744) |
| 0.1 | 0.3 | GO:1904219 | regulation of CDP-diacylglycerol-serine O-phosphatidyltransferase activity(GO:1904217) positive regulation of CDP-diacylglycerol-serine O-phosphatidyltransferase activity(GO:1904219) positive regulation of serine C-palmitoyltransferase activity(GO:1904222) |
| 0.1 | 0.6 | GO:0061732 | mitochondrial acetyl-CoA biosynthetic process from pyruvate(GO:0061732) |
| 0.1 | 0.4 | GO:0090179 | planar cell polarity pathway involved in neural tube closure(GO:0090179) |
| 0.1 | 0.1 | GO:0044340 | canonical Wnt signaling pathway involved in regulation of cell proliferation(GO:0044340) |
| 0.1 | 0.2 | GO:2000490 | negative regulation of hepatic stellate cell activation(GO:2000490) |
| 0.1 | 0.2 | GO:0021503 | neural fold bending(GO:0021503) |
| 0.1 | 0.4 | GO:0036438 | maintenance of lens transparency(GO:0036438) |
| 0.1 | 0.1 | GO:2000051 | negative regulation of non-canonical Wnt signaling pathway(GO:2000051) |
| 0.1 | 0.5 | GO:0014807 | regulation of somitogenesis(GO:0014807) |
| 0.1 | 0.6 | GO:1903069 | regulation of ER-associated ubiquitin-dependent protein catabolic process(GO:1903069) |
| 0.1 | 0.4 | GO:0043697 | dedifferentiation(GO:0043696) cell dedifferentiation(GO:0043697) |
| 0.1 | 0.1 | GO:0072513 | positive regulation of secondary heart field cardioblast proliferation(GO:0072513) |
| 0.1 | 0.6 | GO:1903206 | negative regulation of hydrogen peroxide-induced cell death(GO:1903206) |
| 0.1 | 0.7 | GO:0016242 | negative regulation of macroautophagy(GO:0016242) |
| 0.1 | 0.1 | GO:0031133 | regulation of axon diameter(GO:0031133) response to acrylamide(GO:1903937) |
| 0.1 | 0.2 | GO:0048560 | establishment of anatomical structure orientation(GO:0048560) |
| 0.1 | 0.2 | GO:0090080 | positive regulation of MAPKKK cascade by fibroblast growth factor receptor signaling pathway(GO:0090080) |
| 0.1 | 0.2 | GO:1902544 | regulation of DNA N-glycosylase activity(GO:1902544) |
| 0.1 | 0.4 | GO:0031119 | tRNA pseudouridine synthesis(GO:0031119) |
| 0.1 | 0.2 | GO:0001207 | histone displacement(GO:0001207) positive regulation of transcription involved in meiotic cell cycle(GO:0051039) |
| 0.1 | 0.6 | GO:0035092 | sperm chromatin condensation(GO:0035092) |
| 0.1 | 0.2 | GO:1903251 | multi-ciliated epithelial cell differentiation(GO:1903251) |
| 0.1 | 0.3 | GO:0060988 | lipid tube assembly(GO:0060988) |
| 0.1 | 0.2 | GO:0051549 | positive regulation of keratinocyte migration(GO:0051549) |
| 0.1 | 0.8 | GO:0031284 | positive regulation of guanylate cyclase activity(GO:0031284) |
| 0.1 | 0.3 | GO:0051122 | hepoxilin metabolic process(GO:0051121) hepoxilin biosynthetic process(GO:0051122) |
| 0.1 | 0.4 | GO:1900223 | positive regulation of beta-amyloid clearance(GO:1900223) |
| 0.1 | 0.1 | GO:0003162 | atrioventricular node development(GO:0003162) |
| 0.1 | 0.6 | GO:0000160 | phosphorelay signal transduction system(GO:0000160) |
| 0.1 | 0.3 | GO:0043553 | negative regulation of phosphatidylinositol 3-kinase activity(GO:0043553) |
| 0.1 | 0.4 | GO:0051725 | protein de-ADP-ribosylation(GO:0051725) |
| 0.1 | 0.3 | GO:0002357 | defense response to tumor cell(GO:0002357) |
| 0.1 | 0.2 | GO:0060447 | bud outgrowth involved in lung branching(GO:0060447) mesenchymal-epithelial cell signaling involved in prostate gland development(GO:0060739) |
| 0.1 | 2.8 | GO:0018149 | peptide cross-linking(GO:0018149) |
| 0.1 | 0.1 | GO:0043316 | cytotoxic T cell degranulation(GO:0043316) |
| 0.0 | 0.4 | GO:1902661 | positive regulation of glucose mediated signaling pathway(GO:1902661) |
| 0.0 | 0.2 | GO:0045903 | positive regulation of translational fidelity(GO:0045903) |
| 0.0 | 0.0 | GO:0051533 | positive regulation of NFAT protein import into nucleus(GO:0051533) |
| 0.0 | 0.3 | GO:0051182 | coenzyme transport(GO:0051182) |
| 0.0 | 1.0 | GO:0042255 | ribosome assembly(GO:0042255) |
| 0.0 | 0.1 | GO:0035106 | negative regulation of luteinizing hormone secretion(GO:0033685) operant conditioning(GO:0035106) |
| 0.0 | 0.4 | GO:0051315 | attachment of mitotic spindle microtubules to kinetochore(GO:0051315) |
| 0.0 | 0.2 | GO:0071418 | cellular response to amine stimulus(GO:0071418) |
| 0.0 | 0.4 | GO:0034214 | protein hexamerization(GO:0034214) |
| 0.0 | 0.2 | GO:0034334 | adherens junction maintenance(GO:0034334) |
| 0.0 | 0.2 | GO:0071243 | cellular response to arsenic-containing substance(GO:0071243) |
| 0.0 | 3.4 | GO:0016266 | O-glycan processing(GO:0016266) |
| 0.0 | 0.2 | GO:2000370 | positive regulation of clathrin-mediated endocytosis(GO:2000370) |
| 0.0 | 1.0 | GO:0010800 | positive regulation of peptidyl-threonine phosphorylation(GO:0010800) |
| 0.0 | 0.4 | GO:0000712 | resolution of meiotic recombination intermediates(GO:0000712) |
| 0.0 | 0.7 | GO:0051683 | establishment of Golgi localization(GO:0051683) |
| 0.0 | 0.3 | GO:0006741 | NADP biosynthetic process(GO:0006741) |
| 0.0 | 0.1 | GO:0001188 | RNA polymerase I transcriptional preinitiation complex assembly(GO:0001188) RNA polymerase I transcriptional preinitiation complex assembly at the promoter for the nuclear large rRNA transcript(GO:0001189) |
| 0.0 | 0.0 | GO:2001188 | regulation of T cell activation via T cell receptor contact with antigen bound to MHC molecule on antigen presenting cell(GO:2001188) |
| 0.0 | 0.1 | GO:0048808 | male genitalia morphogenesis(GO:0048808) male anatomical structure morphogenesis(GO:0090598) |
| 0.0 | 0.6 | GO:1902913 | positive regulation of neuroepithelial cell differentiation(GO:1902913) |
| 0.0 | 0.2 | GO:0061370 | testosterone biosynthetic process(GO:0061370) |
| 0.0 | 0.1 | GO:1903781 | positive regulation of cardiac conduction(GO:1903781) |
| 0.0 | 0.6 | GO:0015669 | gas transport(GO:0015669) |
| 0.0 | 0.5 | GO:0048227 | plasma membrane to endosome transport(GO:0048227) |
| 0.0 | 0.2 | GO:0035694 | mitochondrial protein catabolic process(GO:0035694) |
| 0.0 | 0.3 | GO:0033632 | regulation of cell-cell adhesion mediated by integrin(GO:0033632) |
| 0.0 | 0.1 | GO:0003431 | growth plate cartilage chondrocyte development(GO:0003431) |
| 0.0 | 0.6 | GO:0060044 | negative regulation of cardiac muscle cell proliferation(GO:0060044) |
| 0.0 | 0.2 | GO:0036116 | medium-chain fatty-acyl-CoA catabolic process(GO:0036114) long-chain fatty-acyl-CoA catabolic process(GO:0036116) palmitic acid metabolic process(GO:1900533) palmitic acid biosynthetic process(GO:1900535) |
| 0.0 | 0.1 | GO:1900126 | negative regulation of hyaluronan biosynthetic process(GO:1900126) |
| 0.0 | 0.2 | GO:0090063 | positive regulation of microtubule nucleation(GO:0090063) |
| 0.0 | 0.3 | GO:0000012 | single strand break repair(GO:0000012) |
| 0.0 | 0.1 | GO:1990086 | lens fiber cell apoptotic process(GO:1990086) |
| 0.0 | 0.6 | GO:2000009 | negative regulation of protein localization to cell surface(GO:2000009) |
| 0.0 | 0.7 | GO:0015865 | purine nucleotide transport(GO:0015865) |
| 0.0 | 0.6 | GO:0043011 | myeloid dendritic cell differentiation(GO:0043011) |
| 0.0 | 0.0 | GO:0006532 | aspartate biosynthetic process(GO:0006532) |
| 0.0 | 0.4 | GO:0010614 | negative regulation of cardiac muscle hypertrophy(GO:0010614) |
| 0.0 | 0.2 | GO:1904526 | regulation of microtubule binding(GO:1904526) |
| 0.0 | 0.3 | GO:0021891 | olfactory bulb interneuron development(GO:0021891) |
| 0.0 | 0.1 | GO:0044752 | response to human chorionic gonadotropin(GO:0044752) |
| 0.0 | 0.1 | GO:0021873 | neuroblast division in subventricular zone(GO:0021849) forebrain neuroblast division(GO:0021873) |
| 0.0 | 1.9 | GO:0030490 | maturation of SSU-rRNA(GO:0030490) |
| 0.0 | 0.0 | GO:0035771 | interleukin-4-mediated signaling pathway(GO:0035771) |
| 0.0 | 1.1 | GO:0016339 | calcium-dependent cell-cell adhesion via plasma membrane cell adhesion molecules(GO:0016339) |
| 0.0 | 0.5 | GO:0090204 | protein localization to nuclear pore(GO:0090204) |
| 0.0 | 0.1 | GO:0070898 | RNA polymerase III transcriptional preinitiation complex assembly(GO:0070898) |
| 0.0 | 3.3 | GO:0042273 | ribosomal large subunit biogenesis(GO:0042273) |
| 0.0 | 0.1 | GO:0044278 | cell wall disruption in other organism(GO:0044278) |
| 0.0 | 0.1 | GO:0002317 | plasma cell differentiation(GO:0002317) |
| 0.0 | 0.1 | GO:0001544 | initiation of primordial ovarian follicle growth(GO:0001544) |
| 0.0 | 1.8 | GO:0002474 | antigen processing and presentation of peptide antigen via MHC class I(GO:0002474) |
| 0.0 | 0.1 | GO:0031117 | positive regulation of microtubule depolymerization(GO:0031117) |
| 0.0 | 0.1 | GO:0036289 | peptidyl-serine autophosphorylation(GO:0036289) |
| 0.0 | 0.4 | GO:0035414 | negative regulation of catenin import into nucleus(GO:0035414) |
| 0.0 | 0.0 | GO:0002467 | germinal center formation(GO:0002467) |
| 0.0 | 0.2 | GO:0060762 | regulation of branching involved in mammary gland duct morphogenesis(GO:0060762) |
| 0.0 | 0.1 | GO:1903527 | positive regulation of membrane tubulation(GO:1903527) |
| 0.0 | 2.9 | GO:0070098 | chemokine-mediated signaling pathway(GO:0070098) |
| 0.0 | 0.1 | GO:0072023 | thick ascending limb development(GO:0072023) metanephric thick ascending limb development(GO:0072233) |
| 0.0 | 0.1 | GO:1900247 | cytoplasmic translational elongation(GO:0002182) regulation of cytoplasmic translational elongation(GO:1900247) negative regulation of cytoplasmic translational elongation(GO:1900248) positive regulation of mRNA polyadenylation(GO:1900365) |
| 0.0 | 0.1 | GO:0008065 | establishment of blood-nerve barrier(GO:0008065) |
| 0.0 | 0.0 | GO:0019883 | antigen processing and presentation of endogenous antigen(GO:0019883) |
| 0.0 | 0.4 | GO:0035970 | peptidyl-threonine dephosphorylation(GO:0035970) |
| 0.0 | 0.2 | GO:0060754 | positive regulation of mast cell chemotaxis(GO:0060754) |
| 0.0 | 0.1 | GO:0048619 | embryonic hindgut morphogenesis(GO:0048619) |
| 0.0 | 1.7 | GO:0050650 | chondroitin sulfate proteoglycan biosynthetic process(GO:0050650) |
| 0.0 | 0.2 | GO:0032439 | endosome localization(GO:0032439) |
| 0.0 | 0.7 | GO:0003322 | pancreatic A cell development(GO:0003322) |
| 0.0 | 2.0 | GO:0007214 | gamma-aminobutyric acid signaling pathway(GO:0007214) |
| 0.0 | 0.2 | GO:0050746 | regulation of lipoprotein metabolic process(GO:0050746) |
| 0.0 | 0.4 | GO:0060052 | neurofilament cytoskeleton organization(GO:0060052) |
| 0.0 | 0.7 | GO:0030046 | parallel actin filament bundle assembly(GO:0030046) |
| 0.0 | 0.0 | GO:0090149 | mitochondrial membrane fission(GO:0090149) |
| 0.0 | 0.7 | GO:0050860 | negative regulation of antigen receptor-mediated signaling pathway(GO:0050858) negative regulation of T cell receptor signaling pathway(GO:0050860) |
| 0.0 | 0.7 | GO:0046501 | protoporphyrinogen IX metabolic process(GO:0046501) |
| 0.0 | 0.0 | GO:2000777 | positive regulation of proteasomal ubiquitin-dependent protein catabolic process involved in cellular response to hypoxia(GO:2000777) |
| 0.0 | 0.4 | GO:0002092 | positive regulation of receptor internalization(GO:0002092) |
| 0.0 | 0.2 | GO:0098957 | anterograde axonal transport of mitochondrion(GO:0098957) |
| 0.0 | 0.2 | GO:0047484 | regulation of response to osmotic stress(GO:0047484) |
| 0.0 | 0.4 | GO:0031087 | nuclear-transcribed mRNA catabolic process, deadenylation-independent decay(GO:0031086) deadenylation-independent decapping of nuclear-transcribed mRNA(GO:0031087) |
| 0.0 | 0.3 | GO:2001241 | positive regulation of extrinsic apoptotic signaling pathway in absence of ligand(GO:2001241) |
| 0.0 | 0.3 | GO:0043985 | histone H4-R3 methylation(GO:0043985) |
| 0.0 | 0.1 | GO:0070077 | peptidyl-lysine hydroxylation to 5-hydroxy-L-lysine(GO:0018395) histone arginine demethylation(GO:0070077) histone H3-R2 demethylation(GO:0070078) histone H4-R3 demethylation(GO:0070079) |
| 0.0 | 0.2 | GO:0072553 | terminal button organization(GO:0072553) |
| 0.0 | 0.1 | GO:0006566 | threonine metabolic process(GO:0006566) |
| 0.0 | 0.2 | GO:0006172 | ADP biosynthetic process(GO:0006172) |
| 0.0 | 0.1 | GO:0032808 | lacrimal gland development(GO:0032808) |
| 0.0 | 0.1 | GO:1901382 | chorionic trophoblast cell proliferation(GO:0097360) regulation of chorionic trophoblast cell proliferation(GO:1901382) |
| 0.0 | 0.1 | GO:0002765 | immune response-inhibiting signal transduction(GO:0002765) immune response-inhibiting cell surface receptor signaling pathway(GO:0002767) |
| 0.0 | 0.4 | GO:0036499 | PERK-mediated unfolded protein response(GO:0036499) |
| 0.0 | 0.0 | GO:0061470 | T follicular helper cell differentiation(GO:0061470) |
| 0.0 | 0.2 | GO:0051012 | microtubule sliding(GO:0051012) |
| 0.0 | 0.1 | GO:0061743 | motor learning(GO:0061743) |
| 0.0 | 0.2 | GO:0046685 | response to arsenic-containing substance(GO:0046685) |
| 0.0 | 0.2 | GO:0071394 | cellular response to testosterone stimulus(GO:0071394) |
| 0.0 | 0.1 | GO:0045347 | negative regulation of MHC class II biosynthetic process(GO:0045347) |
| 0.0 | 0.1 | GO:0045779 | negative regulation of bone resorption(GO:0045779) |
| 0.0 | 0.1 | GO:0075732 | viral penetration into host nucleus(GO:0075732) multi-organism nuclear import(GO:1902594) |
| 0.0 | 0.2 | GO:0006933 | negative regulation of cell adhesion involved in substrate-bound cell migration(GO:0006933) |
| 0.0 | 0.3 | GO:0070857 | regulation of bile acid biosynthetic process(GO:0070857) |
| 0.0 | 0.4 | GO:0045577 | regulation of B cell differentiation(GO:0045577) |
| 0.0 | 1.0 | GO:0061099 | negative regulation of protein tyrosine kinase activity(GO:0061099) |
| 0.0 | 0.9 | GO:0099517 | anterograde synaptic vesicle transport(GO:0048490) synaptic vesicle cytoskeletal transport(GO:0099514) synaptic vesicle transport along microtubule(GO:0099517) |
| 0.0 | 0.3 | GO:0007144 | female meiosis I(GO:0007144) |
| 0.0 | 0.9 | GO:0035338 | long-chain fatty-acyl-CoA biosynthetic process(GO:0035338) |
| 0.0 | 0.1 | GO:1902283 | negative regulation of primary amine oxidase activity(GO:1902283) |
| 0.0 | 0.1 | GO:0009188 | purine nucleoside diphosphate biosynthetic process(GO:0009136) purine ribonucleoside diphosphate biosynthetic process(GO:0009180) ribonucleoside diphosphate biosynthetic process(GO:0009188) |
| 0.0 | 0.1 | GO:0003321 | positive regulation of blood pressure by epinephrine-norepinephrine(GO:0003321) |
| 0.0 | 0.5 | GO:0001682 | tRNA 5'-leader removal(GO:0001682) |
| 0.0 | 3.2 | GO:0010923 | negative regulation of phosphatase activity(GO:0010923) |
| 0.0 | 0.1 | GO:1905150 | regulation of voltage-gated sodium channel activity(GO:1905150) |
| 0.0 | 0.1 | GO:0001732 | formation of cytoplasmic translation initiation complex(GO:0001732) |
| 0.0 | 1.1 | GO:0070373 | negative regulation of ERK1 and ERK2 cascade(GO:0070373) |
| 0.0 | 0.2 | GO:0033058 | directional locomotion(GO:0033058) |
| 0.0 | 1.0 | GO:0018023 | peptidyl-lysine trimethylation(GO:0018023) |
| 0.0 | 0.1 | GO:0036414 | protein citrullination(GO:0018101) histone citrullination(GO:0036414) |
| 0.0 | 0.1 | GO:0032483 | regulation of Rab protein signal transduction(GO:0032483) |
| 0.0 | 0.1 | GO:0072711 | cellular response to hydroxyurea(GO:0072711) |
| 0.0 | 0.2 | GO:0050755 | chemokine metabolic process(GO:0050755) |
| 0.0 | 0.3 | GO:0030210 | heparin metabolic process(GO:0030202) heparin biosynthetic process(GO:0030210) |
| 0.0 | 0.4 | GO:0034720 | histone H3-K4 demethylation(GO:0034720) |
| 0.0 | 0.2 | GO:0051697 | protein delipidation(GO:0051697) |
| 0.0 | 0.2 | GO:0042737 | drug catabolic process(GO:0042737) |
| 0.0 | 0.1 | GO:0001915 | negative regulation of T cell mediated cytotoxicity(GO:0001915) |
| 0.0 | 0.2 | GO:0039019 | pronephric nephron development(GO:0039019) |
| 0.0 | 0.1 | GO:0002118 | aggressive behavior(GO:0002118) general adaptation syndrome(GO:0051866) |
| 0.0 | 0.2 | GO:1900121 | negative regulation of receptor binding(GO:1900121) |
| 0.0 | 0.2 | GO:1904274 | tricellular tight junction assembly(GO:1904274) |
| 0.0 | 0.9 | GO:0019835 | cytolysis(GO:0019835) |
| 0.0 | 0.2 | GO:1902410 | mitotic cytokinetic process(GO:1902410) |
| 0.0 | 0.3 | GO:0033227 | dsRNA transport(GO:0033227) |
| 0.0 | 0.4 | GO:0008612 | peptidyl-lysine modification to peptidyl-hypusine(GO:0008612) |
| 0.0 | 1.1 | GO:0034198 | cellular response to amino acid starvation(GO:0034198) |
| 0.0 | 0.1 | GO:0015860 | purine nucleoside transmembrane transport(GO:0015860) |
| 0.0 | 0.2 | GO:1900044 | regulation of histone ubiquitination(GO:0033182) negative regulation of histone ubiquitination(GO:0033183) regulation of protein K63-linked ubiquitination(GO:1900044) negative regulation of protein K63-linked ubiquitination(GO:1900045) regulation of histone H2A K63-linked ubiquitination(GO:1901314) negative regulation of histone H2A K63-linked ubiquitination(GO:1901315) negative regulation of protein polyubiquitination(GO:1902915) |
| 0.0 | 0.2 | GO:0006651 | diacylglycerol biosynthetic process(GO:0006651) |
| 0.0 | 0.2 | GO:0070445 | oligodendrocyte progenitor proliferation(GO:0070444) regulation of oligodendrocyte progenitor proliferation(GO:0070445) |
| 0.0 | 0.1 | GO:0021978 | telencephalon regionalization(GO:0021978) |
| 0.0 | 0.1 | GO:0035606 | peptidyl-cysteine S-trans-nitrosylation(GO:0035606) |
| 0.0 | 0.1 | GO:0050968 | detection of chemical stimulus involved in sensory perception of pain(GO:0050968) |
| 0.0 | 0.8 | GO:0042059 | negative regulation of epidermal growth factor receptor signaling pathway(GO:0042059) |
| 0.0 | 0.4 | GO:0051764 | actin crosslink formation(GO:0051764) |
| 0.0 | 0.4 | GO:1902259 | regulation of delayed rectifier potassium channel activity(GO:1902259) |
| 0.0 | 1.1 | GO:0010737 | protein kinase A signaling(GO:0010737) |
| 0.0 | 1.8 | GO:0010501 | RNA secondary structure unwinding(GO:0010501) |
| 0.0 | 0.4 | GO:0048298 | positive regulation of isotype switching to IgA isotypes(GO:0048298) |
| 0.0 | 0.4 | GO:2000480 | negative regulation of cAMP-dependent protein kinase activity(GO:2000480) |
| 0.0 | 0.1 | GO:0032906 | transforming growth factor beta2 production(GO:0032906) regulation of transforming growth factor beta2 production(GO:0032909) |
| 0.0 | 0.7 | GO:0070884 | regulation of calcineurin-NFAT signaling cascade(GO:0070884) |
| 0.0 | 0.1 | GO:0042335 | cuticle development(GO:0042335) |
| 0.0 | 0.2 | GO:0048714 | positive regulation of oligodendrocyte differentiation(GO:0048714) |
| 0.0 | 0.1 | GO:0030223 | neutrophil differentiation(GO:0030223) |
| 0.0 | 0.1 | GO:0060721 | spongiotrophoblast cell proliferation(GO:0060720) regulation of spongiotrophoblast cell proliferation(GO:0060721) cell proliferation involved in embryonic placenta development(GO:0060722) regulation of cell proliferation involved in embryonic placenta development(GO:0060723) |
| 0.0 | 0.1 | GO:0034653 | diterpenoid catabolic process(GO:0016103) retinoic acid catabolic process(GO:0034653) |
| 0.0 | 0.4 | GO:0090520 | sphingolipid mediated signaling pathway(GO:0090520) |
| 0.0 | 0.2 | GO:0042759 | long-chain fatty acid biosynthetic process(GO:0042759) |
| 0.0 | 0.2 | GO:0033630 | positive regulation of cell adhesion mediated by integrin(GO:0033630) |
| 0.0 | 0.2 | GO:0032455 | nerve growth factor processing(GO:0032455) |
| 0.0 | 0.2 | GO:0075525 | viral translational termination-reinitiation(GO:0075525) |
| 0.0 | 0.2 | GO:0032927 | positive regulation of activin receptor signaling pathway(GO:0032927) |
| 0.0 | 0.1 | GO:0034414 | tRNA 3'-trailer cleavage, endonucleolytic(GO:0034414) tRNA 3'-trailer cleavage(GO:0042779) |
| 0.0 | 0.8 | GO:0090383 | phagosome acidification(GO:0090383) |
| 0.0 | 0.3 | GO:0017121 | phospholipid scrambling(GO:0017121) |
| 0.0 | 0.4 | GO:0001675 | acrosome assembly(GO:0001675) |
| 0.0 | 0.2 | GO:1902866 | regulation of retina development in camera-type eye(GO:1902866) |
| 0.0 | 0.4 | GO:2000052 | positive regulation of non-canonical Wnt signaling pathway(GO:2000052) |
| 0.0 | 0.3 | GO:1903818 | positive regulation of voltage-gated potassium channel activity(GO:1903818) |
| 0.0 | 0.3 | GO:0018095 | protein polyglutamylation(GO:0018095) |
| 0.0 | 0.2 | GO:0031915 | positive regulation of synaptic plasticity(GO:0031915) |
| 0.0 | 1.1 | GO:0006363 | termination of RNA polymerase I transcription(GO:0006363) |
| 0.0 | 0.1 | GO:0046886 | positive regulation of hormone biosynthetic process(GO:0046886) |
| 0.0 | 0.1 | GO:0071955 | recycling endosome to Golgi transport(GO:0071955) |
| 0.0 | 0.2 | GO:1904879 | positive regulation of calcium ion transmembrane transport via high voltage-gated calcium channel(GO:1904879) |
| 0.0 | 0.7 | GO:0007616 | long-term memory(GO:0007616) |
| 0.0 | 1.7 | GO:0000381 | regulation of alternative mRNA splicing, via spliceosome(GO:0000381) |
| 0.0 | 0.3 | GO:0015939 | pantothenate metabolic process(GO:0015939) |
| 0.0 | 0.1 | GO:0072086 | specification of loop of Henle identity(GO:0072086) |
| 0.0 | 0.2 | GO:0046618 | drug export(GO:0046618) |
| 0.0 | 0.2 | GO:0021520 | spinal cord motor neuron cell fate specification(GO:0021520) |
| 0.0 | 0.2 | GO:0021957 | corticospinal tract morphogenesis(GO:0021957) |
| 0.0 | 0.1 | GO:0090024 | negative regulation of granulocyte chemotaxis(GO:0071623) negative regulation of neutrophil chemotaxis(GO:0090024) negative regulation of neutrophil migration(GO:1902623) |
| 0.0 | 0.2 | GO:0005981 | regulation of glycogen catabolic process(GO:0005981) |
| 0.0 | 0.4 | GO:0070193 | synaptonemal complex assembly(GO:0007130) synaptonemal complex organization(GO:0070193) |
| 0.0 | 0.1 | GO:0010460 | positive regulation of heart rate(GO:0010460) |
| 0.0 | 0.1 | GO:1904685 | positive regulation of metalloendopeptidase activity(GO:1904685) |
| 0.0 | 0.2 | GO:2000660 | negative regulation of interleukin-1-mediated signaling pathway(GO:2000660) |
| 0.0 | 0.1 | GO:0060050 | positive regulation of protein glycosylation(GO:0060050) |
| 0.0 | 0.1 | GO:1900138 | negative regulation of phospholipase A2 activity(GO:1900138) |
| 0.0 | 0.2 | GO:1990441 | negative regulation of transcription from RNA polymerase II promoter in response to endoplasmic reticulum stress(GO:1990441) |
| 0.0 | 0.9 | GO:0061718 | NADH regeneration(GO:0006735) canonical glycolysis(GO:0061621) glucose catabolic process to pyruvate(GO:0061718) |
| 0.0 | 0.1 | GO:0099590 | neurotransmitter receptor internalization(GO:0099590) |
| 0.0 | 0.0 | GO:1904729 | regulation of intestinal cholesterol absorption(GO:0030300) regulation of intestinal lipid absorption(GO:1904729) |
| 0.0 | 0.0 | GO:1903348 | positive regulation of bicellular tight junction assembly(GO:1903348) |
| 0.0 | 0.2 | GO:0035331 | negative regulation of hippo signaling(GO:0035331) |
| 0.0 | 0.2 | GO:0098535 | de novo centriole assembly(GO:0098535) |
| 0.0 | 0.0 | GO:0034402 | recruitment of 3'-end processing factors to RNA polymerase II holoenzyme complex(GO:0034402) |
| 0.0 | 0.2 | GO:0048007 | antigen processing and presentation via MHC class Ib(GO:0002475) antigen processing and presentation of lipid antigen via MHC class Ib(GO:0048003) antigen processing and presentation, exogenous lipid antigen via MHC class Ib(GO:0048007) |
| 0.0 | 0.4 | GO:0006895 | Golgi to endosome transport(GO:0006895) |
| 0.0 | 0.1 | GO:0021914 | negative regulation of smoothened signaling pathway involved in ventral spinal cord patterning(GO:0021914) |
| 0.0 | 0.1 | GO:0071233 | cellular response to leucine(GO:0071233) |
| 0.0 | 0.1 | GO:0071896 | protein localization to adherens junction(GO:0071896) |
| 0.0 | 0.1 | GO:0043305 | negative regulation of mast cell degranulation(GO:0043305) |
| 0.0 | 0.1 | GO:0071374 | cellular response to parathyroid hormone stimulus(GO:0071374) |
| 0.0 | 0.1 | GO:1904059 | regulation of locomotor rhythm(GO:1904059) |
| 0.0 | 0.3 | GO:2000272 | negative regulation of receptor activity(GO:2000272) |
| 0.0 | 0.0 | GO:0051792 | medium-chain fatty acid biosynthetic process(GO:0051792) |
| 0.0 | 0.1 | GO:0045835 | negative regulation of meiotic nuclear division(GO:0045835) |
| 0.0 | 0.4 | GO:0090004 | positive regulation of establishment of protein localization to plasma membrane(GO:0090004) |
| 0.0 | 0.2 | GO:0007253 | cytoplasmic sequestering of NF-kappaB(GO:0007253) |
| 0.0 | 0.4 | GO:1903830 | magnesium ion transmembrane transport(GO:1903830) |
| 0.0 | 0.2 | GO:0043496 | regulation of protein homodimerization activity(GO:0043496) |
| 0.0 | 0.7 | GO:0035024 | negative regulation of Rho protein signal transduction(GO:0035024) |
| 0.0 | 0.1 | GO:1901070 | guanosine-containing compound biosynthetic process(GO:1901070) |
| 0.0 | 0.1 | GO:1900744 | regulation of p38MAPK cascade(GO:1900744) |
| 0.0 | 0.2 | GO:0000244 | spliceosomal tri-snRNP complex assembly(GO:0000244) |
| 0.0 | 0.2 | GO:0060088 | auditory receptor cell stereocilium organization(GO:0060088) |
| 0.0 | 0.6 | GO:0010390 | histone monoubiquitination(GO:0010390) |
| 0.0 | 0.1 | GO:0033578 | protein glycosylation in Golgi(GO:0033578) |
| 0.0 | 0.4 | GO:0001844 | protein insertion into mitochondrial membrane involved in apoptotic signaling pathway(GO:0001844) |
| 0.0 | 0.1 | GO:0044791 | modulation by host of viral release from host cell(GO:0044789) positive regulation by host of viral release from host cell(GO:0044791) |
| 0.0 | 0.0 | GO:1904562 | phosphatidylinositol 5-phosphate metabolic process(GO:1904562) |
| 0.0 | 0.0 | GO:0051547 | regulation of keratinocyte migration(GO:0051547) |
| 0.0 | 0.1 | GO:0009449 | gamma-aminobutyric acid biosynthetic process(GO:0009449) |
| 0.0 | 0.1 | GO:0045065 | cytotoxic T cell differentiation(GO:0045065) |
| 0.0 | 0.1 | GO:1990416 | cellular response to brain-derived neurotrophic factor stimulus(GO:1990416) |
| 0.0 | 0.1 | GO:0060715 | syncytiotrophoblast cell differentiation involved in labyrinthine layer development(GO:0060715) |
| 0.0 | 0.2 | GO:0051418 | interphase microtubule nucleation by interphase microtubule organizing center(GO:0051415) microtubule nucleation by microtubule organizing center(GO:0051418) |
| 0.0 | 2.1 | GO:0070125 | mitochondrial translational elongation(GO:0070125) |
| 0.0 | 0.6 | GO:0034067 | protein localization to Golgi apparatus(GO:0034067) |
| 0.0 | 0.1 | GO:0019355 | nicotinamide nucleotide biosynthetic process from aspartate(GO:0019355) 'de novo' NAD biosynthetic process from aspartate(GO:0034628) |
| 0.0 | 0.1 | GO:0070189 | kynurenine metabolic process(GO:0070189) |
| 0.0 | 0.2 | GO:0006030 | chitin metabolic process(GO:0006030) chitin catabolic process(GO:0006032) |
| 0.0 | 0.1 | GO:0035089 | establishment of apical/basal cell polarity(GO:0035089) |
| 0.0 | 0.3 | GO:0035721 | intraciliary retrograde transport(GO:0035721) |
| 0.0 | 0.2 | GO:1904380 | endoplasmic reticulum mannose trimming(GO:1904380) |
| 0.0 | 0.0 | GO:0036023 | limb joint morphogenesis(GO:0036022) embryonic skeletal limb joint morphogenesis(GO:0036023) |
| 0.0 | 0.1 | GO:1903831 | acetylcholine receptor signaling pathway(GO:0095500) postsynaptic signal transduction(GO:0098926) signal transduction involved in cellular response to ammonium ion(GO:1903831) response to acetylcholine(GO:1905144) cellular response to acetylcholine(GO:1905145) |
| 0.0 | 0.1 | GO:0097091 | synaptic vesicle clustering(GO:0097091) |
| 0.0 | 0.1 | GO:0009644 | response to high light intensity(GO:0009644) |
| 0.0 | 3.3 | GO:0050911 | detection of chemical stimulus involved in sensory perception of smell(GO:0050911) |
| 0.0 | 0.5 | GO:0035116 | embryonic hindlimb morphogenesis(GO:0035116) |
| 0.0 | 0.0 | GO:0043474 | eye pigment biosynthetic process(GO:0006726) eye pigment metabolic process(GO:0042441) pigment metabolic process involved in developmental pigmentation(GO:0043324) pigment metabolic process involved in pigmentation(GO:0043474) |
| 0.0 | 0.1 | GO:0001865 | NK T cell differentiation(GO:0001865) |
| 0.0 | 0.1 | GO:0046719 | regulation by virus of viral protein levels in host cell(GO:0046719) |
| 0.0 | 0.1 | GO:0009253 | peptidoglycan metabolic process(GO:0000270) peptidoglycan catabolic process(GO:0009253) |
| 0.0 | 0.1 | GO:0018874 | benzoate metabolic process(GO:0018874) |
| 0.0 | 0.2 | GO:0032332 | positive regulation of chondrocyte differentiation(GO:0032332) |
| 0.0 | 0.3 | GO:0008045 | motor neuron axon guidance(GO:0008045) |
| 0.0 | 0.1 | GO:0043686 | co-translational protein modification(GO:0043686) |
| 0.0 | 0.0 | GO:0071947 | protein deubiquitination involved in ubiquitin-dependent protein catabolic process(GO:0071947) |
| 0.0 | 0.1 | GO:0002347 | response to tumor cell(GO:0002347) |
| 0.0 | 0.2 | GO:0007196 | adenylate cyclase-inhibiting G-protein coupled glutamate receptor signaling pathway(GO:0007196) |
| 0.0 | 0.0 | GO:1990180 | mitochondrial tRNA 3'-end processing(GO:1990180) |
| 0.0 | 0.0 | GO:0045110 | intermediate filament bundle assembly(GO:0045110) |
| 0.0 | 0.1 | GO:0015015 | heparan sulfate proteoglycan biosynthetic process, enzymatic modification(GO:0015015) |
| 0.0 | 0.1 | GO:0030950 | establishment or maintenance of actin cytoskeleton polarity(GO:0030950) |
| 0.0 | 0.8 | GO:0018208 | peptidyl-proline modification(GO:0018208) |
| 0.0 | 0.2 | GO:0017183 | peptidyl-diphthamide metabolic process(GO:0017182) peptidyl-diphthamide biosynthetic process from peptidyl-histidine(GO:0017183) |
| 0.0 | 0.0 | GO:0060297 | regulation of sarcomere organization(GO:0060297) |
| 0.0 | 0.0 | GO:0009138 | pyrimidine nucleoside diphosphate metabolic process(GO:0009138) |
| 0.0 | 0.0 | GO:0040020 | regulation of meiotic nuclear division(GO:0040020) |
| 0.0 | 0.1 | GO:1904179 | regulation of adipose tissue development(GO:1904177) positive regulation of adipose tissue development(GO:1904179) |
| 0.0 | 0.1 | GO:0045950 | negative regulation of mitotic recombination(GO:0045950) |
| 0.0 | 0.1 | GO:2000852 | regulation of corticosterone secretion(GO:2000852) |
| 0.0 | 0.0 | GO:0006106 | fumarate metabolic process(GO:0006106) |
| 0.0 | 0.0 | GO:0034201 | response to oleic acid(GO:0034201) |
| 0.0 | 0.3 | GO:0051290 | protein heterotetramerization(GO:0051290) |
| 0.0 | 0.0 | GO:0030263 | apoptotic chromosome condensation(GO:0030263) |
| 0.0 | 0.1 | GO:0048096 | chromatin-mediated maintenance of transcription(GO:0048096) |
| 0.0 | 0.0 | GO:2000659 | regulation of interleukin-1-mediated signaling pathway(GO:2000659) |
| 0.0 | 0.2 | GO:0001829 | trophectodermal cell differentiation(GO:0001829) |
| 0.0 | 0.3 | GO:0051973 | positive regulation of telomerase activity(GO:0051973) |
| 0.0 | 0.0 | GO:0039689 | negative stranded viral RNA replication(GO:0039689) multi-organism biosynthetic process(GO:0044034) |
| 0.0 | 0.1 | GO:0006265 | DNA topological change(GO:0006265) |
| 0.0 | 0.3 | GO:0045745 | positive regulation of G-protein coupled receptor protein signaling pathway(GO:0045745) |
| 0.0 | 0.0 | GO:0000117 | regulation of transcription involved in G2/M transition of mitotic cell cycle(GO:0000117) |
| 0.0 | 0.2 | GO:0000132 | establishment of mitotic spindle orientation(GO:0000132) |
| 0.0 | 0.0 | GO:0006621 | protein retention in ER lumen(GO:0006621) maintenance of protein localization in endoplasmic reticulum(GO:0035437) |
| 0.0 | 0.0 | GO:1904172 | regulation of bleb assembly(GO:1904170) positive regulation of bleb assembly(GO:1904172) |
| 0.0 | 0.1 | GO:0002291 | T cell activation via T cell receptor contact with antigen bound to MHC molecule on antigen presenting cell(GO:0002291) |
| 0.0 | 0.1 | GO:2000172 | regulation of branching morphogenesis of a nerve(GO:2000172) |
| 0.0 | 0.2 | GO:0003334 | keratinocyte development(GO:0003334) |
| 0.0 | 0.1 | GO:0016480 | negative regulation of transcription from RNA polymerase III promoter(GO:0016480) |
| 0.0 | 0.1 | GO:0071763 | nuclear membrane organization(GO:0071763) |
| 0.0 | 0.0 | GO:0048021 | regulation of melanin biosynthetic process(GO:0048021) positive regulation of melanin biosynthetic process(GO:0048023) regulation of secondary metabolite biosynthetic process(GO:1900376) positive regulation of secondary metabolite biosynthetic process(GO:1900378) |
| 0.0 | 0.1 | GO:0070498 | interleukin-1-mediated signaling pathway(GO:0070498) |
| 0.0 | 0.5 | GO:0007157 | heterophilic cell-cell adhesion via plasma membrane cell adhesion molecules(GO:0007157) |
| 0.0 | 0.1 | GO:1990564 | protein polyufmylation(GO:1990564) protein K69-linked ufmylation(GO:1990592) |
| 0.0 | 0.2 | GO:0048016 | inositol phosphate-mediated signaling(GO:0048016) |
| 0.0 | 0.1 | GO:0006783 | heme biosynthetic process(GO:0006783) |
| 0.0 | 0.2 | GO:0019371 | cyclooxygenase pathway(GO:0019371) |
| 0.0 | 0.2 | GO:0045668 | negative regulation of osteoblast differentiation(GO:0045668) |
| 0.0 | 0.2 | GO:0038202 | TORC1 signaling(GO:0038202) |
| 0.0 | 0.0 | GO:1902414 | protein localization to cell junction(GO:1902414) |
| 0.0 | 0.2 | GO:0015074 | DNA integration(GO:0015074) |
| 0.0 | 0.4 | GO:0035036 | sperm-egg recognition(GO:0035036) |
| 0.0 | 0.1 | GO:0031065 | positive regulation of histone deacetylation(GO:0031065) |
| 0.0 | 0.1 | GO:2000427 | positive regulation of apoptotic cell clearance(GO:2000427) |
| 0.0 | 0.1 | GO:0046149 | porphyrin-containing compound catabolic process(GO:0006787) tetrapyrrole catabolic process(GO:0033015) heme catabolic process(GO:0042167) pigment catabolic process(GO:0046149) |
| 0.0 | 0.0 | GO:0002184 | cytoplasmic translational termination(GO:0002184) |
| 0.0 | 0.1 | GO:1900037 | regulation of cellular response to hypoxia(GO:1900037) |
| 0.0 | 0.2 | GO:0030279 | negative regulation of ossification(GO:0030279) |
| 0.0 | 0.1 | GO:0032210 | regulation of telomere maintenance via telomerase(GO:0032210) |
| 0.0 | 0.4 | GO:0006656 | phosphatidylcholine biosynthetic process(GO:0006656) |
Gene overrepresentation in cellular component category:
| Log-likelihood per target | Total log-likelihood | Term | Description |
|---|---|---|---|
| 1.2 | 10.4 | GO:0071144 | SMAD2-SMAD3 protein complex(GO:0071144) |
| 1.0 | 3.1 | GO:0005753 | mitochondrial proton-transporting ATP synthase complex(GO:0005753) proton-transporting ATP synthase complex(GO:0045259) |
| 1.0 | 7.8 | GO:1990111 | spermatoproteasome complex(GO:1990111) |
| 0.9 | 2.6 | GO:1990723 | cytoplasmic periphery of the nuclear pore complex(GO:1990723) |
| 0.8 | 6.2 | GO:0097451 | glial limiting end-foot(GO:0097451) |
| 0.6 | 3.0 | GO:0001405 | presequence translocase-associated import motor(GO:0001405) |
| 0.6 | 2.3 | GO:0008537 | proteasome activator complex(GO:0008537) |
| 0.6 | 1.7 | GO:0071065 | alpha9-beta1 integrin-vascular cell adhesion molecule-1 complex(GO:0071065) |
| 0.5 | 3.4 | GO:0042825 | TAP complex(GO:0042825) |
| 0.5 | 1.4 | GO:0035525 | NF-kappaB p50/p65 complex(GO:0035525) |
| 0.5 | 5.1 | GO:0035692 | macrophage migration inhibitory factor receptor complex(GO:0035692) |
| 0.5 | 1.8 | GO:0070435 | Shc-EGFR complex(GO:0070435) |
| 0.4 | 4.9 | GO:0042612 | MHC class I protein complex(GO:0042612) |
| 0.4 | 1.7 | GO:0030895 | apolipoprotein B mRNA editing enzyme complex(GO:0030895) |
| 0.4 | 1.2 | GO:0000229 | cytoplasmic chromosome(GO:0000229) |
| 0.4 | 1.2 | GO:1990622 | CHOP-ATF3 complex(GO:1990622) |
| 0.4 | 4.1 | GO:1990712 | HFE-transferrin receptor complex(GO:1990712) |
| 0.4 | 6.5 | GO:0035631 | CD40 receptor complex(GO:0035631) |
| 0.4 | 7.5 | GO:0005890 | sodium:potassium-exchanging ATPase complex(GO:0005890) |
| 0.4 | 2.5 | GO:0005610 | laminin-5 complex(GO:0005610) |
| 0.3 | 1.7 | GO:0036396 | MIS complex(GO:0036396) mRNA editing complex(GO:0045293) |
| 0.3 | 2.1 | GO:0032021 | NELF complex(GO:0032021) |
| 0.3 | 0.9 | GO:0016938 | kinesin I complex(GO:0016938) |
| 0.3 | 1.1 | GO:0033257 | Bcl3/NF-kappaB2 complex(GO:0033257) |
| 0.3 | 0.8 | GO:0097598 | sperm cytoplasmic droplet(GO:0097598) |
| 0.3 | 1.6 | GO:1990584 | cardiac Troponin complex(GO:1990584) |
| 0.3 | 1.4 | GO:1990031 | pinceau fiber(GO:1990031) |
| 0.3 | 0.8 | GO:0036194 | muscle cell projection(GO:0036194) muscle cell projection membrane(GO:0036195) |
| 0.3 | 1.3 | GO:0070557 | PCNA-p21 complex(GO:0070557) |
| 0.3 | 0.8 | GO:0033565 | ESCRT-0 complex(GO:0033565) |
| 0.3 | 0.3 | GO:0097450 | astrocyte end-foot(GO:0097450) |
| 0.3 | 1.0 | GO:0070044 | synaptobrevin 2-SNAP-25-syntaxin-1a complex(GO:0070044) |
| 0.3 | 1.8 | GO:0042721 | mitochondrial inner membrane protein insertion complex(GO:0042721) |
| 0.3 | 3.5 | GO:0005861 | troponin complex(GO:0005861) |
| 0.2 | 0.7 | GO:0030689 | Noc complex(GO:0030689) |
| 0.2 | 3.4 | GO:0046581 | intercellular canaliculus(GO:0046581) |
| 0.2 | 2.3 | GO:0000220 | vacuolar proton-transporting V-type ATPase, V0 domain(GO:0000220) |
| 0.2 | 3.2 | GO:0030015 | CCR4-NOT core complex(GO:0030015) |
| 0.2 | 1.5 | GO:0032010 | phagolysosome(GO:0032010) |
| 0.2 | 0.9 | GO:0045323 | interleukin-1 receptor complex(GO:0045323) |
| 0.2 | 0.6 | GO:0042565 | RNA nuclear export complex(GO:0042565) |
| 0.2 | 1.3 | GO:0072557 | IPAF inflammasome complex(GO:0072557) |
| 0.2 | 0.9 | GO:1990879 | CST complex(GO:1990879) |
| 0.2 | 0.6 | GO:0016939 | kinesin II complex(GO:0016939) |
| 0.2 | 2.2 | GO:0071438 | invadopodium membrane(GO:0071438) |
| 0.2 | 0.8 | GO:0072379 | BAT3 complex(GO:0071818) ER membrane insertion complex(GO:0072379) |
| 0.2 | 0.8 | GO:0071564 | npBAF complex(GO:0071564) |
| 0.2 | 0.2 | GO:0034681 | integrin alpha11-beta1 complex(GO:0034681) |
| 0.2 | 0.6 | GO:0098855 | HCN channel complex(GO:0098855) |
| 0.2 | 0.6 | GO:0043159 | acrosomal matrix(GO:0043159) |
| 0.2 | 0.6 | GO:1990716 | axonemal central apparatus(GO:1990716) |
| 0.2 | 1.9 | GO:0000015 | phosphopyruvate hydratase complex(GO:0000015) |
| 0.2 | 0.6 | GO:0071598 | neuronal ribonucleoprotein granule(GO:0071598) |
| 0.2 | 4.0 | GO:0032433 | filopodium tip(GO:0032433) |
| 0.2 | 0.2 | GO:0036502 | Derlin-1-VIMP complex(GO:0036502) |
| 0.2 | 0.2 | GO:0044753 | amphisome(GO:0044753) |
| 0.2 | 0.8 | GO:0045160 | myosin I complex(GO:0045160) |
| 0.2 | 4.2 | GO:0031264 | death-inducing signaling complex(GO:0031264) |
| 0.2 | 2.9 | GO:0033010 | paranodal junction(GO:0033010) |
| 0.2 | 0.5 | GO:0000333 | telomerase catalytic core complex(GO:0000333) |
| 0.2 | 0.6 | GO:1990604 | IRE1-TRAF2-ASK1 complex(GO:1990604) |
| 0.2 | 1.9 | GO:0000322 | storage vacuole(GO:0000322) |
| 0.2 | 0.8 | GO:0005927 | muscle tendon junction(GO:0005927) |
| 0.2 | 1.6 | GO:0097208 | alveolar lamellar body(GO:0097208) |
| 0.2 | 0.6 | GO:0008043 | intracellular ferritin complex(GO:0008043) ferritin complex(GO:0070288) |
| 0.2 | 0.5 | GO:0070701 | mucus layer(GO:0070701) |
| 0.2 | 0.5 | GO:0036338 | viral envelope(GO:0019031) viral membrane(GO:0036338) |
| 0.2 | 0.5 | GO:0031085 | BLOC-3 complex(GO:0031085) |
| 0.1 | 1.0 | GO:1990037 | Lewy body core(GO:1990037) |
| 0.1 | 0.4 | GO:0036398 | TCR signalosome(GO:0036398) |
| 0.1 | 0.4 | GO:0017102 | methionyl glutamyl tRNA synthetase complex(GO:0017102) |
| 0.1 | 1.0 | GO:0005956 | protein kinase CK2 complex(GO:0005956) |
| 0.1 | 3.7 | GO:0031229 | integral component of nuclear inner membrane(GO:0005639) intrinsic component of nuclear inner membrane(GO:0031229) |
| 0.1 | 1.0 | GO:0030868 | smooth endoplasmic reticulum membrane(GO:0030868) smooth endoplasmic reticulum part(GO:0097425) |
| 0.1 | 0.4 | GO:0043512 | inhibin complex(GO:0043511) inhibin A complex(GO:0043512) |
| 0.1 | 0.6 | GO:0005968 | Rab-protein geranylgeranyltransferase complex(GO:0005968) |
| 0.1 | 0.8 | GO:0097129 | cyclin D2-CDK4 complex(GO:0097129) |
| 0.1 | 0.5 | GO:0032437 | cuticular plate(GO:0032437) |
| 0.1 | 0.7 | GO:0070381 | endosome to plasma membrane transport vesicle(GO:0070381) |
| 0.1 | 1.2 | GO:0070761 | pre-snoRNP complex(GO:0070761) |
| 0.1 | 0.5 | GO:0035517 | PR-DUB complex(GO:0035517) |
| 0.1 | 0.5 | GO:1990356 | sumoylated E2 ligase complex(GO:1990356) |
| 0.1 | 0.9 | GO:1990452 | Parkin-FBXW7-Cul1 ubiquitin ligase complex(GO:1990452) |
| 0.1 | 1.7 | GO:0097136 | Bcl-2 family protein complex(GO:0097136) |
| 0.1 | 1.2 | GO:0005744 | mitochondrial inner membrane presequence translocase complex(GO:0005744) |
| 0.1 | 0.8 | GO:0033256 | I-kappaB/NF-kappaB complex(GO:0033256) |
| 0.1 | 1.4 | GO:0005638 | lamin filament(GO:0005638) |
| 0.1 | 0.9 | GO:0072589 | box H/ACA scaRNP complex(GO:0072589) box H/ACA telomerase RNP complex(GO:0090661) |
| 0.1 | 0.4 | GO:0005745 | m-AAA complex(GO:0005745) |
| 0.1 | 0.2 | GO:0060199 | clathrin-sculpted glutamate transport vesicle(GO:0060199) clathrin-sculpted glutamate transport vesicle membrane(GO:0060203) |
| 0.1 | 1.2 | GO:0005655 | nucleolar ribonuclease P complex(GO:0005655) |
| 0.1 | 1.3 | GO:0008541 | proteasome regulatory particle, lid subcomplex(GO:0008541) |
| 0.1 | 0.1 | GO:0000835 | ER ubiquitin ligase complex(GO:0000835) Hrd1p ubiquitin ligase complex(GO:0000836) Hrd1p ubiquitin ligase ERAD-L complex(GO:0000839) |
| 0.1 | 3.2 | GO:0005666 | DNA-directed RNA polymerase III complex(GO:0005666) |
| 0.1 | 0.8 | GO:0031428 | box C/D snoRNP complex(GO:0031428) |
| 0.1 | 1.0 | GO:0031415 | NatA complex(GO:0031415) |
| 0.1 | 1.3 | GO:0030991 | intraciliary transport particle A(GO:0030991) |
| 0.1 | 0.4 | GO:0034686 | integrin alphav-beta8 complex(GO:0034686) |
| 0.1 | 0.2 | GO:0044393 | microspike(GO:0044393) |
| 0.1 | 0.3 | GO:0017101 | aminoacyl-tRNA synthetase multienzyme complex(GO:0017101) |
| 0.1 | 1.9 | GO:0030127 | COPII vesicle coat(GO:0030127) |
| 0.1 | 0.3 | GO:0060342 | photoreceptor inner segment membrane(GO:0060342) |
| 0.1 | 0.9 | GO:0098559 | cytoplasmic side of early endosome membrane(GO:0098559) |
| 0.1 | 0.6 | GO:0071797 | LUBAC complex(GO:0071797) |
| 0.1 | 1.3 | GO:0070449 | elongin complex(GO:0070449) |
| 0.1 | 1.0 | GO:0002193 | MAML1-RBP-Jkappa- ICN1 complex(GO:0002193) |
| 0.1 | 1.3 | GO:0031931 | TORC1 complex(GO:0031931) |
| 0.1 | 1.0 | GO:0030893 | meiotic cohesin complex(GO:0030893) |
| 0.1 | 1.2 | GO:0033018 | sarcoplasmic reticulum lumen(GO:0033018) |
| 0.1 | 0.3 | GO:0008623 | CHRAC(GO:0008623) |
| 0.1 | 0.8 | GO:0032777 | Piccolo NuA4 histone acetyltransferase complex(GO:0032777) |
| 0.1 | 0.6 | GO:0033553 | rDNA heterochromatin(GO:0033553) |
| 0.1 | 1.7 | GO:0061700 | GATOR2 complex(GO:0061700) |
| 0.1 | 1.4 | GO:0005750 | mitochondrial respiratory chain complex III(GO:0005750) respiratory chain complex III(GO:0045275) |
| 0.1 | 0.2 | GO:0031074 | nucleocytoplasmic shuttling complex(GO:0031074) |
| 0.1 | 0.3 | GO:0010370 | perinucleolar chromocenter(GO:0010370) |
| 0.1 | 1.1 | GO:0005742 | mitochondrial outer membrane translocase complex(GO:0005742) |
| 0.1 | 2.3 | GO:0030056 | hemidesmosome(GO:0030056) |
| 0.1 | 0.7 | GO:0030057 | desmosome(GO:0030057) |
| 0.1 | 0.2 | GO:0097629 | extrinsic component of omegasome membrane(GO:0097629) |
| 0.1 | 0.2 | GO:0043259 | laminin-10 complex(GO:0043259) |
| 0.1 | 4.5 | GO:0030673 | axolemma(GO:0030673) |
| 0.1 | 0.3 | GO:0043196 | varicosity(GO:0043196) |
| 0.1 | 0.3 | GO:1990075 | periciliary membrane compartment(GO:1990075) |
| 0.1 | 0.7 | GO:0036157 | outer dynein arm(GO:0036157) |
| 0.1 | 0.5 | GO:0035859 | Seh1-associated complex(GO:0035859) |
| 0.1 | 0.1 | GO:0097449 | astrocyte projection(GO:0097449) |
| 0.1 | 0.5 | GO:0031232 | extrinsic component of external side of plasma membrane(GO:0031232) |
| 0.1 | 0.6 | GO:0033177 | proton-transporting two-sector ATPase complex, proton-transporting domain(GO:0033177) proton-transporting V-type ATPase, V0 domain(GO:0033179) |
| 0.1 | 0.4 | GO:0005863 | striated muscle myosin thick filament(GO:0005863) |
| 0.1 | 0.3 | GO:0000814 | ESCRT II complex(GO:0000814) |
| 0.1 | 3.0 | GO:0030687 | preribosome, large subunit precursor(GO:0030687) |
| 0.1 | 0.4 | GO:0071001 | U4/U6 snRNP(GO:0071001) |
| 0.1 | 2.7 | GO:0097381 | photoreceptor disc membrane(GO:0097381) |
| 0.1 | 1.0 | GO:0042587 | glycogen granule(GO:0042587) |
| 0.1 | 0.3 | GO:0033186 | CAF-1 complex(GO:0033186) |
| 0.1 | 1.2 | GO:0036056 | filtration diaphragm(GO:0036056) slit diaphragm(GO:0036057) |
| 0.1 | 0.7 | GO:0008282 | ATP-sensitive potassium channel complex(GO:0008282) |
| 0.1 | 6.1 | GO:0005771 | multivesicular body(GO:0005771) |
| 0.1 | 0.1 | GO:1903349 | omegasome membrane(GO:1903349) |
| 0.1 | 0.3 | GO:0034457 | Mpp10 complex(GO:0034457) |
| 0.1 | 0.3 | GO:0042589 | zymogen granule membrane(GO:0042589) |
| 0.1 | 0.4 | GO:0009368 | endopeptidase Clp complex(GO:0009368) |
| 0.1 | 0.4 | GO:0070826 | paraferritin complex(GO:0070826) |
| 0.1 | 0.3 | GO:0032311 | angiogenin-PRI complex(GO:0032311) |
| 0.1 | 0.5 | GO:0070470 | plasma membrane respiratory chain(GO:0070470) |
| 0.1 | 1.8 | GO:0005916 | fascia adherens(GO:0005916) |
| 0.1 | 0.4 | GO:1990425 | ryanodine receptor complex(GO:1990425) |
| 0.1 | 2.7 | GO:0030867 | rough endoplasmic reticulum membrane(GO:0030867) |
| 0.1 | 2.0 | GO:0032040 | small-subunit processome(GO:0032040) |
| 0.1 | 0.5 | GO:0005947 | mitochondrial alpha-ketoglutarate dehydrogenase complex(GO:0005947) |
| 0.1 | 1.8 | GO:0031143 | pseudopodium(GO:0031143) |
| 0.1 | 0.6 | GO:0034688 | integrin alphaM-beta2 complex(GO:0034688) |
| 0.1 | 0.5 | GO:0032280 | symmetric synapse(GO:0032280) |
| 0.1 | 0.2 | GO:0097413 | Lewy body(GO:0097413) |
| 0.1 | 0.2 | GO:0044609 | DBIRD complex(GO:0044609) |
| 0.1 | 0.2 | GO:0030312 | external encapsulating structure(GO:0030312) |
| 0.1 | 0.4 | GO:0031523 | Myb complex(GO:0031523) |
| 0.1 | 0.5 | GO:0000788 | nuclear nucleosome(GO:0000788) |
| 0.1 | 0.2 | GO:0016222 | procollagen-proline 4-dioxygenase complex(GO:0016222) |
| 0.1 | 0.2 | GO:0033011 | perinuclear theca(GO:0033011) |
| 0.1 | 0.2 | GO:0001534 | radial spoke(GO:0001534) |
| 0.1 | 0.7 | GO:0097197 | tetraspanin-enriched microdomain(GO:0097197) |
| 0.1 | 0.5 | GO:0044530 | supraspliceosomal complex(GO:0044530) |
| 0.1 | 1.0 | GO:0030126 | COPI vesicle coat(GO:0030126) |
| 0.1 | 0.3 | GO:0002945 | cyclin K-CDK13 complex(GO:0002945) |
| 0.1 | 3.8 | GO:0042645 | nucleoid(GO:0009295) mitochondrial nucleoid(GO:0042645) |
| 0.1 | 0.3 | GO:0044754 | autolysosome(GO:0044754) |
| 0.1 | 0.6 | GO:0000938 | GARP complex(GO:0000938) |
| 0.1 | 0.3 | GO:0038039 | G-protein coupled receptor heterodimeric complex(GO:0038039) |
| 0.1 | 0.5 | GO:0005826 | actomyosin contractile ring(GO:0005826) |
| 0.1 | 1.8 | GO:0043194 | axon initial segment(GO:0043194) |
| 0.1 | 0.5 | GO:0043083 | synaptic cleft(GO:0043083) |
| 0.1 | 0.3 | GO:1990597 | AIP1-IRE1 complex(GO:1990597) |
| 0.1 | 1.0 | GO:0001520 | outer dense fiber(GO:0001520) |
| 0.1 | 4.1 | GO:0015030 | Cajal body(GO:0015030) |
| 0.1 | 0.1 | GO:0035061 | interchromatin granule(GO:0035061) |
| 0.1 | 0.3 | GO:0032044 | DSIF complex(GO:0032044) |
| 0.1 | 0.4 | GO:1990630 | IRE1-RACK1-PP2A complex(GO:1990630) |
| 0.1 | 0.2 | GO:0034669 | integrin alpha4-beta7 complex(GO:0034669) |
| 0.1 | 0.5 | GO:0097422 | tubular endosome(GO:0097422) |
| 0.1 | 1.4 | GO:0034045 | pre-autophagosomal structure membrane(GO:0034045) |
| 0.1 | 1.8 | GO:0035371 | microtubule plus-end(GO:0035371) |
| 0.1 | 0.5 | GO:1990635 | proximal dendrite(GO:1990635) |
| 0.1 | 0.2 | GO:0030956 | glutamyl-tRNA(Gln) amidotransferase complex(GO:0030956) |
| 0.1 | 0.2 | GO:0071821 | FANCM-MHF complex(GO:0071821) |
| 0.1 | 14.0 | GO:0005741 | mitochondrial outer membrane(GO:0005741) |
| 0.1 | 0.3 | GO:0008278 | cohesin complex(GO:0008278) |
| 0.1 | 1.5 | GO:0044295 | axonal growth cone(GO:0044295) |
| 0.1 | 0.2 | GO:0005900 | oncostatin-M receptor complex(GO:0005900) |
| 0.1 | 0.4 | GO:0030934 | anchoring collagen complex(GO:0030934) |
| 0.1 | 0.3 | GO:0070852 | cell body fiber(GO:0070852) |
| 0.1 | 0.9 | GO:0030123 | AP-3 adaptor complex(GO:0030123) |
| 0.1 | 0.3 | GO:0005945 | 6-phosphofructokinase complex(GO:0005945) |
| 0.1 | 4.9 | GO:0005776 | autophagosome(GO:0005776) |
| 0.1 | 0.6 | GO:0031209 | SCAR complex(GO:0031209) |
| 0.1 | 1.7 | GO:0005779 | integral component of peroxisomal membrane(GO:0005779) intrinsic component of peroxisomal membrane(GO:0031231) |
| 0.1 | 0.8 | GO:0032059 | bleb(GO:0032059) |
| 0.1 | 0.5 | GO:0030285 | integral component of synaptic vesicle membrane(GO:0030285) intrinsic component of synaptic vesicle membrane(GO:0098563) |
| 0.1 | 0.4 | GO:0035032 | phosphatidylinositol 3-kinase complex, class III(GO:0035032) |
| 0.1 | 0.4 | GO:0005579 | membrane attack complex(GO:0005579) |
| 0.1 | 1.3 | GO:0036038 | MKS complex(GO:0036038) |
| 0.1 | 0.1 | GO:0032444 | activin responsive factor complex(GO:0032444) |
| 0.1 | 0.2 | GO:0048237 | rough endoplasmic reticulum lumen(GO:0048237) |
| 0.1 | 0.2 | GO:1990742 | microvesicle(GO:1990742) |
| 0.1 | 0.5 | GO:0044327 | dendritic spine head(GO:0044327) |
| 0.1 | 0.3 | GO:0005736 | DNA-directed RNA polymerase I complex(GO:0005736) |
| 0.1 | 0.3 | GO:0035339 | SPOTS complex(GO:0035339) |
| 0.1 | 0.5 | GO:0001739 | sex chromatin(GO:0001739) |
| 0.1 | 1.1 | GO:0042627 | chylomicron(GO:0042627) |
| 0.0 | 0.4 | GO:0005587 | collagen type IV trimer(GO:0005587) |
| 0.0 | 0.3 | GO:0005594 | collagen type IX trimer(GO:0005594) |
| 0.0 | 0.4 | GO:0042406 | extrinsic component of endoplasmic reticulum membrane(GO:0042406) |
| 0.0 | 0.4 | GO:0016272 | prefoldin complex(GO:0016272) |
| 0.0 | 1.0 | GO:0005865 | striated muscle thin filament(GO:0005865) |
| 0.0 | 1.0 | GO:0070971 | endoplasmic reticulum exit site(GO:0070971) |
| 0.0 | 0.7 | GO:0016013 | syntrophin complex(GO:0016013) |
| 0.0 | 0.3 | GO:0097504 | Gemini of coiled bodies(GO:0097504) |
| 0.0 | 0.1 | GO:0035354 | Toll-like receptor 1-Toll-like receptor 2 protein complex(GO:0035354) |
| 0.0 | 3.3 | GO:0001772 | immunological synapse(GO:0001772) |
| 0.0 | 0.4 | GO:0061689 | tricellular tight junction(GO:0061689) |
| 0.0 | 0.1 | GO:0055087 | Ski complex(GO:0055087) |
| 0.0 | 0.9 | GO:0005942 | phosphatidylinositol 3-kinase complex(GO:0005942) |
| 0.0 | 0.3 | GO:0090571 | RNA polymerase II transcription repressor complex(GO:0090571) |
| 0.0 | 0.1 | GO:0097149 | centralspindlin complex(GO:0097149) |
| 0.0 | 1.3 | GO:0043034 | costamere(GO:0043034) |
| 0.0 | 0.0 | GO:0036513 | Derlin-1 retrotranslocation complex(GO:0036513) |
| 0.0 | 1.0 | GO:0005697 | telomerase holoenzyme complex(GO:0005697) |
| 0.0 | 0.2 | GO:0071595 | Nem1-Spo7 phosphatase complex(GO:0071595) |
| 0.0 | 0.8 | GO:0005605 | basal lamina(GO:0005605) |
| 0.0 | 0.6 | GO:0030137 | COPI-coated vesicle(GO:0030137) |
| 0.0 | 1.8 | GO:1902711 | GABA receptor complex(GO:1902710) GABA-A receptor complex(GO:1902711) |
| 0.0 | 0.3 | GO:0000120 | RNA polymerase I transcription factor complex(GO:0000120) |
| 0.0 | 0.6 | GO:0000137 | Golgi cis cisterna(GO:0000137) |
| 0.0 | 4.6 | GO:0005581 | collagen trimer(GO:0005581) |
| 0.0 | 0.3 | GO:0016035 | zeta DNA polymerase complex(GO:0016035) |
| 0.0 | 1.1 | GO:0005719 | nuclear euchromatin(GO:0005719) |
| 0.0 | 0.2 | GO:0032133 | chromosome passenger complex(GO:0032133) |
| 0.0 | 0.2 | GO:0002081 | outer acrosomal membrane(GO:0002081) |
| 0.0 | 0.5 | GO:0019773 | proteasome core complex, alpha-subunit complex(GO:0019773) |
| 0.0 | 0.3 | GO:0098536 | deuterosome(GO:0098536) |
| 0.0 | 0.6 | GO:0031618 | nuclear pericentric heterochromatin(GO:0031618) |
| 0.0 | 0.1 | GO:0035686 | sperm fibrous sheath(GO:0035686) |
| 0.0 | 0.5 | GO:0034098 | VCP-NPL4-UFD1 AAA ATPase complex(GO:0034098) |
| 0.0 | 0.4 | GO:0000164 | protein phosphatase type 1 complex(GO:0000164) |
| 0.0 | 2.9 | GO:0005762 | organellar large ribosomal subunit(GO:0000315) mitochondrial large ribosomal subunit(GO:0005762) |
| 0.0 | 0.2 | GO:0009328 | phenylalanine-tRNA ligase complex(GO:0009328) |
| 0.0 | 0.7 | GO:0031616 | spindle pole centrosome(GO:0031616) |
| 0.0 | 5.6 | GO:0008076 | voltage-gated potassium channel complex(GO:0008076) |
| 0.0 | 0.7 | GO:0048188 | Set1C/COMPASS complex(GO:0048188) |
| 0.0 | 0.1 | GO:0044453 | nuclear membrane part(GO:0044453) |
| 0.0 | 0.2 | GO:0033596 | TSC1-TSC2 complex(GO:0033596) |
| 0.0 | 0.3 | GO:0061617 | MICOS complex(GO:0061617) |
| 0.0 | 0.8 | GO:0044322 | endoplasmic reticulum quality control compartment(GO:0044322) |
| 0.0 | 2.4 | GO:0031594 | neuromuscular junction(GO:0031594) |
| 0.0 | 0.2 | GO:0072534 | perineuronal net(GO:0072534) |
| 0.0 | 0.6 | GO:0033391 | chromatoid body(GO:0033391) |
| 0.0 | 0.5 | GO:0071203 | WASH complex(GO:0071203) |
| 0.0 | 0.5 | GO:0030870 | Mre11 complex(GO:0030870) |
| 0.0 | 0.5 | GO:0030014 | CCR4-NOT complex(GO:0030014) |
| 0.0 | 0.1 | GO:0034455 | t-UTP complex(GO:0034455) |
| 0.0 | 0.1 | GO:0034515 | proteasome storage granule(GO:0034515) |
| 0.0 | 0.6 | GO:0030904 | retromer complex(GO:0030904) |
| 0.0 | 0.6 | GO:0042622 | photoreceptor outer segment membrane(GO:0042622) |
| 0.0 | 3.3 | GO:0032580 | Golgi cisterna membrane(GO:0032580) |
| 0.0 | 0.6 | GO:0034709 | methylosome(GO:0034709) |
| 0.0 | 0.1 | GO:0097441 | basilar dendrite(GO:0097441) |
| 0.0 | 0.1 | GO:1990316 | ATG1/ULK1 kinase complex(GO:1990316) |
| 0.0 | 3.8 | GO:0005913 | cell-cell adherens junction(GO:0005913) |
| 0.0 | 1.0 | GO:0097228 | sperm principal piece(GO:0097228) |
| 0.0 | 1.7 | GO:0031941 | filamentous actin(GO:0031941) |
| 0.0 | 0.3 | GO:0030915 | Smc5-Smc6 complex(GO:0030915) |
| 0.0 | 0.2 | GO:0070187 | telosome(GO:0070187) |
| 0.0 | 0.2 | GO:0000408 | EKC/KEOPS complex(GO:0000408) |
| 0.0 | 1.8 | GO:0005758 | mitochondrial intermembrane space(GO:0005758) |
| 0.0 | 0.4 | GO:0005833 | hemoglobin complex(GO:0005833) |
| 0.0 | 0.2 | GO:1990682 | CSF1-CSF1R complex(GO:1990682) |
| 0.0 | 0.3 | GO:0019907 | cyclin-dependent protein kinase activating kinase holoenzyme complex(GO:0019907) |
| 0.0 | 0.2 | GO:0005869 | dynactin complex(GO:0005869) |
| 0.0 | 0.1 | GO:0030061 | mitochondrial crista(GO:0030061) |
| 0.0 | 0.4 | GO:0008385 | IkappaB kinase complex(GO:0008385) |
| 0.0 | 0.3 | GO:0032009 | early phagosome(GO:0032009) |
| 0.0 | 0.1 | GO:0042272 | nuclear RNA export factor complex(GO:0042272) |
| 0.0 | 0.7 | GO:0000145 | exocyst(GO:0000145) |
| 0.0 | 0.2 | GO:0033165 | interphotoreceptor matrix(GO:0033165) |
| 0.0 | 0.2 | GO:0000138 | Golgi trans cisterna(GO:0000138) |
| 0.0 | 0.2 | GO:0044292 | dendrite terminus(GO:0044292) |
| 0.0 | 0.1 | GO:0032584 | growth cone membrane(GO:0032584) |
| 0.0 | 0.1 | GO:0044326 | dendritic spine neck(GO:0044326) |
| 0.0 | 1.5 | GO:0001533 | cornified envelope(GO:0001533) |
| 0.0 | 0.4 | GO:0071439 | clathrin complex(GO:0071439) |
| 0.0 | 0.2 | GO:0035985 | senescence-associated heterochromatin focus(GO:0035985) |
| 0.0 | 0.4 | GO:0016327 | apicolateral plasma membrane(GO:0016327) |
| 0.0 | 0.1 | GO:0005732 | small nucleolar ribonucleoprotein complex(GO:0005732) |
| 0.0 | 4.9 | GO:0070160 | occluding junction(GO:0070160) |
| 0.0 | 0.2 | GO:0098575 | lumenal side of lysosomal membrane(GO:0098575) |
| 0.0 | 0.1 | GO:0034687 | integrin alphaL-beta2 complex(GO:0034687) |
| 0.0 | 0.1 | GO:0008275 | gamma-tubulin small complex(GO:0008275) |
| 0.0 | 0.1 | GO:0071008 | U2-type post-mRNA release spliceosomal complex(GO:0071008) |
| 0.0 | 0.2 | GO:0044194 | cytolytic granule(GO:0044194) |
| 0.0 | 0.3 | GO:0002199 | zona pellucida receptor complex(GO:0002199) |
| 0.0 | 0.1 | GO:0002189 | ribose phosphate diphosphokinase complex(GO:0002189) |
| 0.0 | 0.4 | GO:0005665 | DNA-directed RNA polymerase II, core complex(GO:0005665) |
| 0.0 | 0.1 | GO:0030688 | preribosome, small subunit precursor(GO:0030688) |
| 0.0 | 0.2 | GO:0045240 | dihydrolipoyl dehydrogenase complex(GO:0045240) |
| 0.0 | 0.3 | GO:0045009 | melanosome membrane(GO:0033162) chitosome(GO:0045009) |
| 0.0 | 0.9 | GO:0000313 | organellar ribosome(GO:0000313) mitochondrial ribosome(GO:0005761) |
| 0.0 | 1.1 | GO:0002102 | podosome(GO:0002102) |
| 0.0 | 0.3 | GO:0001891 | phagocytic cup(GO:0001891) |
| 0.0 | 0.5 | GO:0005852 | eukaryotic translation initiation factor 3 complex(GO:0005852) |
| 0.0 | 0.3 | GO:0005839 | proteasome core complex(GO:0005839) |
| 0.0 | 8.9 | GO:0031965 | nuclear membrane(GO:0031965) |
| 0.0 | 0.1 | GO:0005953 | CAAX-protein geranylgeranyltransferase complex(GO:0005953) |
| 0.0 | 2.5 | GO:0044306 | neuron projection terminus(GO:0044306) |
| 0.0 | 0.3 | GO:0031045 | dense core granule(GO:0031045) |
| 0.0 | 0.2 | GO:0072669 | tRNA-splicing ligase complex(GO:0072669) |
| 0.0 | 5.8 | GO:0019898 | extrinsic component of membrane(GO:0019898) |
| 0.0 | 0.3 | GO:0034663 | endoplasmic reticulum chaperone complex(GO:0034663) |
| 0.0 | 0.2 | GO:0000812 | Swr1 complex(GO:0000812) |
| 0.0 | 0.9 | GO:0016235 | aggresome(GO:0016235) |
| 0.0 | 0.1 | GO:0072487 | MSL complex(GO:0072487) |
| 0.0 | 0.2 | GO:0097225 | sperm midpiece(GO:0097225) |
| 0.0 | 0.2 | GO:0070522 | ERCC4-ERCC1 complex(GO:0070522) |
| 0.0 | 0.2 | GO:0033588 | Elongator holoenzyme complex(GO:0033588) |
| 0.0 | 0.1 | GO:0097543 | ciliary inversin compartment(GO:0097543) |
| 0.0 | 0.0 | GO:0031905 | early endosome lumen(GO:0031905) |
| 0.0 | 0.1 | GO:0000782 | telomere cap complex(GO:0000782) nuclear telomere cap complex(GO:0000783) |
| 0.0 | 0.2 | GO:0030686 | 90S preribosome(GO:0030686) |
| 0.0 | 0.1 | GO:0035976 | AP1 complex(GO:0035976) |
| 0.0 | 0.1 | GO:0071942 | XPC complex(GO:0071942) |
| 0.0 | 0.1 | GO:0033269 | internode region of axon(GO:0033269) |
| 0.0 | 1.0 | GO:0010494 | cytoplasmic stress granule(GO:0010494) |
| 0.0 | 0.1 | GO:0005858 | axonemal dynein complex(GO:0005858) |
| 0.0 | 0.0 | GO:0031088 | platelet dense granule membrane(GO:0031088) |
| 0.0 | 0.1 | GO:0048179 | activin receptor complex(GO:0048179) |
| 0.0 | 0.1 | GO:0099634 | postsynaptic specialization membrane(GO:0099634) |
| 0.0 | 0.2 | GO:0000940 | condensed chromosome outer kinetochore(GO:0000940) |
| 0.0 | 0.1 | GO:0016012 | dystroglycan complex(GO:0016011) sarcoglycan complex(GO:0016012) |
| 0.0 | 0.0 | GO:0031510 | SUMO activating enzyme complex(GO:0031510) |
| 0.0 | 0.4 | GO:0005892 | acetylcholine-gated channel complex(GO:0005892) |
| 0.0 | 0.1 | GO:0005955 | calcineurin complex(GO:0005955) |
| 0.0 | 0.1 | GO:0030289 | protein phosphatase 4 complex(GO:0030289) |
| 0.0 | 0.1 | GO:0005577 | fibrinogen complex(GO:0005577) |
| 0.0 | 0.1 | GO:0038038 | G-protein coupled receptor homodimeric complex(GO:0038038) |
| 0.0 | 0.0 | GO:0097038 | perinuclear endoplasmic reticulum(GO:0097038) |
| 0.0 | 0.3 | GO:0043189 | NuA4 histone acetyltransferase complex(GO:0035267) H4/H2A histone acetyltransferase complex(GO:0043189) H4 histone acetyltransferase complex(GO:1902562) |
| 0.0 | 0.5 | GO:0071565 | nBAF complex(GO:0071565) |
| 0.0 | 0.4 | GO:0000159 | protein phosphatase type 2A complex(GO:0000159) |
| 0.0 | 0.1 | GO:0030897 | HOPS complex(GO:0030897) |
| 0.0 | 0.1 | GO:0005827 | polar microtubule(GO:0005827) |
| 0.0 | 5.2 | GO:0005759 | mitochondrial matrix(GO:0005759) |
| 0.0 | 0.2 | GO:0005671 | Ada2/Gcn5/Ada3 transcription activator complex(GO:0005671) |
| 0.0 | 0.1 | GO:0005642 | annulate lamellae(GO:0005642) |
| 0.0 | 0.1 | GO:0071546 | pi-body(GO:0071546) |
| 0.0 | 0.1 | GO:0005853 | eukaryotic translation elongation factor 1 complex(GO:0005853) |
| 0.0 | 0.0 | GO:0018444 | translation release factor complex(GO:0018444) |
| 0.0 | 0.1 | GO:0000801 | central element(GO:0000801) |
| 0.0 | 0.1 | GO:0017119 | Golgi transport complex(GO:0017119) |
Gene overrepresentation in molecular function category:
| Log-likelihood per target | Total log-likelihood | Term | Description |
|---|---|---|---|
| 1.7 | 10.4 | GO:0031962 | mineralocorticoid receptor binding(GO:0031962) |
| 1.7 | 5.2 | GO:0031731 | CCR6 chemokine receptor binding(GO:0031731) |
| 1.4 | 5.7 | GO:0034041 | sterol-transporting ATPase activity(GO:0034041) |
| 1.4 | 4.2 | GO:0042007 | interleukin-18 binding(GO:0042007) |
| 1.3 | 12.8 | GO:0016721 | superoxide dismutase activity(GO:0004784) oxidoreductase activity, acting on superoxide radicals as acceptor(GO:0016721) |
| 1.2 | 17.5 | GO:0001730 | 2'-5'-oligoadenylate synthetase activity(GO:0001730) |
| 1.2 | 3.5 | GO:0004912 | interleukin-3 receptor activity(GO:0004912) |
| 1.1 | 3.3 | GO:0008859 | exoribonuclease II activity(GO:0008859) |
| 1.1 | 3.3 | GO:0004730 | pseudouridylate synthase activity(GO:0004730) |
| 0.9 | 6.2 | GO:0022897 | peptide:proton symporter activity(GO:0015333) proton-dependent peptide secondary active transmembrane transporter activity(GO:0022897) |
| 0.9 | 4.4 | GO:0015119 | hexose phosphate transmembrane transporter activity(GO:0015119) organophosphate:inorganic phosphate antiporter activity(GO:0015315) hexose-phosphate:inorganic phosphate antiporter activity(GO:0015526) glucose 6-phosphate:inorganic phosphate antiporter activity(GO:0061513) |
| 0.8 | 3.8 | GO:0030298 | receptor signaling protein tyrosine kinase activator activity(GO:0030298) |
| 0.7 | 5.7 | GO:0046979 | TAP2 binding(GO:0046979) |
| 0.7 | 2.1 | GO:0009032 | thymidine phosphorylase activity(GO:0009032) pyrimidine-nucleoside phosphorylase activity(GO:0016154) |
| 0.6 | 1.8 | GO:0098640 | integrin binding involved in cell-matrix adhesion(GO:0098640) |
| 0.5 | 2.9 | GO:0042806 | fucose binding(GO:0042806) |
| 0.5 | 8.6 | GO:0031996 | thioesterase binding(GO:0031996) |
| 0.5 | 2.8 | GO:0043120 | tumor necrosis factor binding(GO:0043120) |
| 0.5 | 1.4 | GO:0042008 | interleukin-18 receptor activity(GO:0042008) |
| 0.5 | 5.9 | GO:0031014 | troponin T binding(GO:0031014) |
| 0.4 | 3.4 | GO:0061133 | endopeptidase activator activity(GO:0061133) |
| 0.4 | 4.8 | GO:0005025 | transforming growth factor beta receptor activity, type I(GO:0005025) |
| 0.4 | 4.4 | GO:0004931 | extracellular ATP-gated cation channel activity(GO:0004931) ATP-gated ion channel activity(GO:0035381) |
| 0.4 | 2.7 | GO:0035473 | lipase binding(GO:0035473) |
| 0.4 | 1.9 | GO:0004066 | asparagine synthase (glutamine-hydrolyzing) activity(GO:0004066) |
| 0.4 | 1.9 | GO:0016823 | hydrolase activity, acting on acid carbon-carbon bonds(GO:0016822) hydrolase activity, acting on acid carbon-carbon bonds, in ketonic substances(GO:0016823) |
| 0.4 | 1.9 | GO:0004082 | bisphosphoglycerate mutase activity(GO:0004082) phosphoglycerate mutase activity(GO:0004619) 2,3-bisphosphoglycerate-dependent phosphoglycerate mutase activity(GO:0046538) |
| 0.4 | 1.5 | GO:0008478 | pyridoxal kinase activity(GO:0008478) |
| 0.4 | 1.1 | GO:0005287 | high-affinity basic amino acid transmembrane transporter activity(GO:0005287) high-affinity arginine transmembrane transporter activity(GO:0005289) high-affinity lysine transmembrane transporter activity(GO:0005292) |
| 0.4 | 1.1 | GO:0005497 | androgen binding(GO:0005497) |
| 0.4 | 2.9 | GO:0015349 | thyroid hormone transmembrane transporter activity(GO:0015349) |
| 0.4 | 1.1 | GO:0030550 | acetylcholine receptor inhibitor activity(GO:0030550) |
| 0.4 | 2.1 | GO:0047894 | flavonol 3-sulfotransferase activity(GO:0047894) |
| 0.4 | 1.4 | GO:0050510 | N-acetylgalactosaminyl-proteoglycan 3-beta-glucuronosyltransferase activity(GO:0050510) |
| 0.3 | 3.5 | GO:0016286 | small conductance calcium-activated potassium channel activity(GO:0016286) |
| 0.3 | 1.7 | GO:0019912 | cyclin-dependent protein kinase activating kinase activity(GO:0019912) |
| 0.3 | 1.0 | GO:0004613 | phosphoenolpyruvate carboxykinase activity(GO:0004611) phosphoenolpyruvate carboxykinase (GTP) activity(GO:0004613) |
| 0.3 | 2.4 | GO:0001595 | angiotensin receptor activity(GO:0001595) angiotensin type II receptor activity(GO:0004945) |
| 0.3 | 1.7 | GO:0004471 | malate dehydrogenase (decarboxylating) (NAD+) activity(GO:0004471) malate dehydrogenase (decarboxylating) (NADP+) activity(GO:0004473) oxaloacetate decarboxylase activity(GO:0008948) |
| 0.3 | 1.7 | GO:0004370 | glycerol kinase activity(GO:0004370) |
| 0.3 | 1.4 | GO:0004487 | methylenetetrahydrofolate dehydrogenase (NAD+) activity(GO:0004487) |
| 0.3 | 1.3 | GO:0005006 | epidermal growth factor-activated receptor activity(GO:0005006) |
| 0.3 | 1.7 | GO:0046899 | nucleoside triphosphate adenylate kinase activity(GO:0046899) |
| 0.3 | 1.3 | GO:0035402 | histone kinase activity (H3-T11 specific)(GO:0035402) |
| 0.3 | 2.6 | GO:0004645 | phosphorylase activity(GO:0004645) |
| 0.3 | 1.3 | GO:0070095 | fructose-6-phosphate binding(GO:0070095) |
| 0.3 | 1.3 | GO:0047685 | amine sulfotransferase activity(GO:0047685) |
| 0.3 | 2.5 | GO:0008048 | calcium sensitive guanylate cyclase activator activity(GO:0008048) |
| 0.3 | 0.9 | GO:0050571 | 1,5-anhydro-D-fructose reductase activity(GO:0050571) |
| 0.3 | 1.9 | GO:0004656 | procollagen-proline 4-dioxygenase activity(GO:0004656) |
| 0.3 | 2.2 | GO:0005157 | macrophage colony-stimulating factor receptor binding(GO:0005157) |
| 0.3 | 1.6 | GO:0016230 | sphingomyelin phosphodiesterase activator activity(GO:0016230) |
| 0.3 | 1.9 | GO:0048030 | disaccharide binding(GO:0048030) |
| 0.3 | 2.4 | GO:0071532 | ankyrin repeat binding(GO:0071532) |
| 0.3 | 1.2 | GO:0050119 | N-acetylglucosamine deacetylase activity(GO:0050119) |
| 0.3 | 0.6 | GO:0050294 | steroid sulfotransferase activity(GO:0050294) |
| 0.3 | 0.6 | GO:0051120 | hepoxilin A3 synthase activity(GO:0051120) |
| 0.3 | 8.3 | GO:0070003 | threonine-type endopeptidase activity(GO:0004298) threonine-type peptidase activity(GO:0070003) |
| 0.3 | 2.0 | GO:0086089 | voltage-gated potassium channel activity involved in atrial cardiac muscle cell action potential repolarization(GO:0086089) |
| 0.3 | 3.1 | GO:0004849 | uridine kinase activity(GO:0004849) |
| 0.3 | 2.2 | GO:0005332 | gamma-aminobutyric acid:sodium symporter activity(GO:0005332) |
| 0.3 | 1.1 | GO:0004992 | platelet activating factor receptor activity(GO:0004992) |
| 0.3 | 4.7 | GO:0008556 | potassium-transporting ATPase activity(GO:0008556) |
| 0.3 | 6.6 | GO:0102391 | decanoate--CoA ligase activity(GO:0102391) |
| 0.3 | 1.9 | GO:0005280 | hydrogen:amino acid symporter activity(GO:0005280) |
| 0.3 | 0.8 | GO:0008384 | IkappaB kinase activity(GO:0008384) |
| 0.3 | 1.1 | GO:0004127 | cytidylate kinase activity(GO:0004127) |
| 0.3 | 2.7 | GO:0043533 | inositol 1,3,4,5 tetrakisphosphate binding(GO:0043533) |
| 0.3 | 1.9 | GO:0017050 | sphinganine kinase activity(GO:0008481) D-erythro-sphingosine kinase activity(GO:0017050) |
| 0.3 | 1.3 | GO:0019238 | cyclohydrolase activity(GO:0019238) |
| 0.3 | 0.8 | GO:0008892 | guanine deaminase activity(GO:0008892) |
| 0.3 | 1.6 | GO:0031735 | CCR10 chemokine receptor binding(GO:0031735) |
| 0.3 | 1.0 | GO:0003953 | NAD+ nucleosidase activity(GO:0003953) |
| 0.3 | 0.8 | GO:0034736 | sterol O-acyltransferase activity(GO:0004772) cholesterol O-acyltransferase activity(GO:0034736) |
| 0.3 | 1.0 | GO:0060230 | lipoprotein lipase activator activity(GO:0060230) |
| 0.2 | 1.0 | GO:0005457 | GDP-fucose transmembrane transporter activity(GO:0005457) purine nucleotide-sugar transmembrane transporter activity(GO:0036080) |
| 0.2 | 0.7 | GO:0004963 | follicle-stimulating hormone receptor activity(GO:0004963) |
| 0.2 | 1.7 | GO:0004614 | phosphoglucomutase activity(GO:0004614) |
| 0.2 | 0.7 | GO:0070361 | mitochondrial light strand promoter anti-sense binding(GO:0070361) mitochondrial heavy strand promoter anti-sense binding(GO:0070362) mitochondrial heavy strand promoter sense binding(GO:0070364) |
| 0.2 | 1.0 | GO:0004769 | steroid delta-isomerase activity(GO:0004769) |
| 0.2 | 0.7 | GO:0004056 | argininosuccinate lyase activity(GO:0004056) |
| 0.2 | 0.7 | GO:0031896 | V2 vasopressin receptor binding(GO:0031896) |
| 0.2 | 1.2 | GO:0004052 | arachidonate 12-lipoxygenase activity(GO:0004052) |
| 0.2 | 0.9 | GO:0035800 | deubiquitinase activator activity(GO:0035800) |
| 0.2 | 1.2 | GO:0050220 | prostaglandin-E synthase activity(GO:0050220) |
| 0.2 | 0.9 | GO:0015181 | arginine transmembrane transporter activity(GO:0015181) |
| 0.2 | 0.7 | GO:0030158 | protein xylosyltransferase activity(GO:0030158) |
| 0.2 | 2.5 | GO:0033691 | sialic acid binding(GO:0033691) |
| 0.2 | 0.7 | GO:0015403 | thiamine uptake transmembrane transporter activity(GO:0015403) |
| 0.2 | 0.9 | GO:0008427 | calcium-dependent protein kinase inhibitor activity(GO:0008427) |
| 0.2 | 0.9 | GO:0033823 | procollagen-lysine 5-dioxygenase activity(GO:0008475) procollagen glucosyltransferase activity(GO:0033823) |
| 0.2 | 1.1 | GO:0031544 | peptidyl-proline 3-dioxygenase activity(GO:0031544) |
| 0.2 | 0.9 | GO:0031727 | CCR2 chemokine receptor binding(GO:0031727) |
| 0.2 | 2.0 | GO:0004062 | aryl sulfotransferase activity(GO:0004062) |
| 0.2 | 0.4 | GO:0015234 | thiamine transmembrane transporter activity(GO:0015234) |
| 0.2 | 0.6 | GO:0090631 | pre-miRNA transporter activity(GO:0090631) |
| 0.2 | 4.9 | GO:0019870 | potassium channel inhibitor activity(GO:0019870) |
| 0.2 | 2.1 | GO:0004128 | cytochrome-b5 reductase activity, acting on NAD(P)H(GO:0004128) |
| 0.2 | 3.0 | GO:0015501 | glutamate:sodium symporter activity(GO:0015501) |
| 0.2 | 0.6 | GO:0052858 | peptidyl-lysine N-acetyltransferase activity, acting on acetyl phosphate as donor(GO:0052858) |
| 0.2 | 1.3 | GO:0016748 | succinyltransferase activity(GO:0016748) |
| 0.2 | 0.8 | GO:0052901 | polyamine oxidase activity(GO:0046592) spermine:oxygen oxidoreductase (spermidine-forming) activity(GO:0052901) |
| 0.2 | 0.6 | GO:0052852 | (S)-2-hydroxy-acid oxidase activity(GO:0003973) very-long-chain-(S)-2-hydroxy-acid oxidase activity(GO:0052852) long-chain-(S)-2-hydroxy-long-chain-acid oxidase activity(GO:0052853) medium-chain-(S)-2-hydroxy-acid oxidase activity(GO:0052854) |
| 0.2 | 1.0 | GO:0004706 | JUN kinase kinase kinase activity(GO:0004706) |
| 0.2 | 0.8 | GO:0003963 | RNA-3'-phosphate cyclase activity(GO:0003963) |
| 0.2 | 1.2 | GO:0005381 | iron ion transmembrane transporter activity(GO:0005381) |
| 0.2 | 1.0 | GO:0043183 | vascular endothelial growth factor receptor 1 binding(GO:0043183) |
| 0.2 | 0.8 | GO:0004909 | interleukin-1, Type I, activating receptor activity(GO:0004909) |
| 0.2 | 0.4 | GO:0050211 | procollagen galactosyltransferase activity(GO:0050211) |
| 0.2 | 0.2 | GO:0000247 | C-8 sterol isomerase activity(GO:0000247) |
| 0.2 | 0.6 | GO:0004958 | prostaglandin F receptor activity(GO:0004958) |
| 0.2 | 0.4 | GO:0004743 | pyruvate kinase activity(GO:0004743) |
| 0.2 | 1.9 | GO:0004634 | phosphopyruvate hydratase activity(GO:0004634) |
| 0.2 | 1.3 | GO:0042500 | aspartic endopeptidase activity, intramembrane cleaving(GO:0042500) |
| 0.2 | 0.7 | GO:0003828 | alpha-N-acetylneuraminate alpha-2,8-sialyltransferase activity(GO:0003828) |
| 0.2 | 0.9 | GO:0004105 | choline-phosphate cytidylyltransferase activity(GO:0004105) |
| 0.2 | 0.7 | GO:0004996 | thyroid-stimulating hormone receptor activity(GO:0004996) |
| 0.2 | 1.1 | GO:0031752 | D5 dopamine receptor binding(GO:0031752) |
| 0.2 | 0.5 | GO:0001034 | RNA polymerase III transcription factor activity, sequence-specific DNA binding(GO:0001034) |
| 0.2 | 0.5 | GO:0031753 | endothelial differentiation G-protein coupled receptor binding(GO:0031753) Edg-2 lysophosphatidic acid receptor binding(GO:0031755) |
| 0.2 | 2.7 | GO:0031433 | telethonin binding(GO:0031433) |
| 0.2 | 3.6 | GO:0047372 | acylglycerol lipase activity(GO:0047372) |
| 0.2 | 0.5 | GO:0005502 | 11-cis retinal binding(GO:0005502) |
| 0.2 | 0.7 | GO:0004074 | biliverdin reductase activity(GO:0004074) |
| 0.2 | 1.1 | GO:0000064 | L-ornithine transmembrane transporter activity(GO:0000064) |
| 0.2 | 4.9 | GO:0070403 | NAD+ binding(GO:0070403) |
| 0.2 | 3.1 | GO:0005432 | calcium:sodium antiporter activity(GO:0005432) |
| 0.2 | 0.5 | GO:0031687 | A2A adenosine receptor binding(GO:0031687) |
| 0.2 | 3.8 | GO:0017128 | phospholipid scramblase activity(GO:0017128) |
| 0.2 | 0.9 | GO:0004905 | type I interferon receptor activity(GO:0004905) |
| 0.2 | 3.1 | GO:0015271 | outward rectifier potassium channel activity(GO:0015271) |
| 0.2 | 1.6 | GO:0048495 | Roundabout binding(GO:0048495) |
| 0.2 | 1.0 | GO:0045134 | uridine-diphosphatase activity(GO:0045134) |
| 0.2 | 1.2 | GO:0004594 | pantothenate kinase activity(GO:0004594) |
| 0.2 | 0.5 | GO:0008294 | calcium- and calmodulin-responsive adenylate cyclase activity(GO:0008294) |
| 0.2 | 3.0 | GO:0086080 | protein binding involved in heterotypic cell-cell adhesion(GO:0086080) |
| 0.2 | 1.4 | GO:0086008 | voltage-gated potassium channel activity involved in cardiac muscle cell action potential repolarization(GO:0086008) |
| 0.2 | 1.2 | GO:0004430 | 1-phosphatidylinositol 4-kinase activity(GO:0004430) |
| 0.2 | 6.6 | GO:0005540 | hyaluronic acid binding(GO:0005540) |
| 0.2 | 0.8 | GO:0070576 | vitamin D 24-hydroxylase activity(GO:0070576) |
| 0.2 | 2.1 | GO:0005078 | MAP-kinase scaffold activity(GO:0005078) |
| 0.2 | 1.1 | GO:0016672 | oxidoreductase activity, acting on a sulfur group of donors, quinone or similar compound as acceptor(GO:0016672) |
| 0.2 | 1.1 | GO:0004169 | dolichyl-phosphate-mannose-protein mannosyltransferase activity(GO:0004169) |
| 0.2 | 0.6 | GO:0003883 | CTP synthase activity(GO:0003883) |
| 0.2 | 1.6 | GO:0015288 | porin activity(GO:0015288) |
| 0.2 | 1.0 | GO:0070728 | leucine binding(GO:0070728) |
| 0.2 | 0.5 | GO:0070890 | L-ascorbate:sodium symporter activity(GO:0008520) L-ascorbic acid transporter activity(GO:0015229) sodium-dependent L-ascorbate transmembrane transporter activity(GO:0070890) |
| 0.2 | 3.0 | GO:0031701 | angiotensin receptor binding(GO:0031701) |
| 0.2 | 0.5 | GO:0071885 | N-terminal protein N-methyltransferase activity(GO:0071885) |
| 0.2 | 2.5 | GO:0050693 | LBD domain binding(GO:0050693) |
| 0.2 | 2.4 | GO:0055056 | D-glucose transmembrane transporter activity(GO:0055056) |
| 0.2 | 0.5 | GO:0042947 | glucoside transmembrane transporter activity(GO:0042947) |
| 0.2 | 0.5 | GO:0042903 | tubulin deacetylase activity(GO:0042903) |
| 0.2 | 1.1 | GO:1904288 | BAT3 complex binding(GO:1904288) |
| 0.2 | 0.6 | GO:0004949 | cannabinoid receptor activity(GO:0004949) |
| 0.2 | 1.2 | GO:0015186 | L-glutamine transmembrane transporter activity(GO:0015186) |
| 0.2 | 3.7 | GO:0001056 | RNA polymerase III activity(GO:0001056) |
| 0.2 | 0.6 | GO:0097677 | STAT family protein binding(GO:0097677) |
| 0.2 | 2.1 | GO:0042975 | peroxisome proliferator activated receptor binding(GO:0042975) |
| 0.2 | 0.5 | GO:0008336 | gamma-butyrobetaine dioxygenase activity(GO:0008336) |
| 0.2 | 0.6 | GO:0051734 | ATP-dependent polydeoxyribonucleotide 5'-hydroxyl-kinase activity(GO:0046404) polydeoxyribonucleotide kinase activity(GO:0051733) ATP-dependent polynucleotide kinase activity(GO:0051734) |
| 0.2 | 0.5 | GO:0047783 | steroid 11-beta-monooxygenase activity(GO:0004507) corticosterone 18-monooxygenase activity(GO:0047783) |
| 0.2 | 0.6 | GO:0031531 | thyrotropin-releasing hormone receptor binding(GO:0031531) |
| 0.2 | 0.2 | GO:0005114 | type II transforming growth factor beta receptor binding(GO:0005114) |
| 0.2 | 1.4 | GO:0004396 | glucokinase activity(GO:0004340) hexokinase activity(GO:0004396) fructokinase activity(GO:0008865) mannokinase activity(GO:0019158) |
| 0.1 | 0.4 | GO:0009383 | rRNA (cytosine-C5-)-methyltransferase activity(GO:0009383) |
| 0.1 | 0.6 | GO:0005314 | high-affinity glutamate transmembrane transporter activity(GO:0005314) |
| 0.1 | 0.9 | GO:0019958 | C-X-C chemokine binding(GO:0019958) |
| 0.1 | 0.4 | GO:0030156 | benzodiazepine receptor binding(GO:0030156) |
| 0.1 | 1.0 | GO:0036137 | kynurenine-oxoglutarate transaminase activity(GO:0016212) kynurenine aminotransferase activity(GO:0036137) |
| 0.1 | 0.6 | GO:0001855 | complement component C4b binding(GO:0001855) |
| 0.1 | 0.4 | GO:0010698 | acetyltransferase activator activity(GO:0010698) |
| 0.1 | 0.4 | GO:0070984 | SET domain binding(GO:0070984) |
| 0.1 | 2.8 | GO:0009881 | photoreceptor activity(GO:0009881) |
| 0.1 | 1.2 | GO:0015093 | ferrous iron transmembrane transporter activity(GO:0015093) |
| 0.1 | 0.6 | GO:0016793 | dGTPase activity(GO:0008832) triphosphoric monoester hydrolase activity(GO:0016793) guanyl deoxyribonucleotide binding(GO:0032560) dGTP binding(GO:0032567) |
| 0.1 | 4.4 | GO:0097200 | cysteine-type endopeptidase activity involved in execution phase of apoptosis(GO:0097200) |
| 0.1 | 0.6 | GO:0004616 | phosphogluconate dehydrogenase (decarboxylating) activity(GO:0004616) |
| 0.1 | 1.4 | GO:0008131 | primary amine oxidase activity(GO:0008131) |
| 0.1 | 0.4 | GO:0047223 | beta-1,3-galactosyl-O-glycosyl-glycoprotein beta-1,3-N-acetylglucosaminyltransferase activity(GO:0047223) |
| 0.1 | 2.9 | GO:0016638 | oxidoreductase activity, acting on the CH-NH2 group of donors(GO:0016638) |
| 0.1 | 0.7 | GO:0015204 | urea transmembrane transporter activity(GO:0015204) |
| 0.1 | 0.6 | GO:0004379 | glycylpeptide N-tetradecanoyltransferase activity(GO:0004379) myristoyltransferase activity(GO:0019107) |
| 0.1 | 0.7 | GO:0047280 | nicotinamide phosphoribosyltransferase activity(GO:0047280) |
| 0.1 | 4.6 | GO:0047555 | 3',5'-cyclic-GMP phosphodiesterase activity(GO:0047555) |
| 0.1 | 0.5 | GO:0035373 | chondroitin sulfate proteoglycan binding(GO:0035373) |
| 0.1 | 0.3 | GO:0002060 | purine nucleobase binding(GO:0002060) |
| 0.1 | 0.1 | GO:0005416 | cation:amino acid symporter activity(GO:0005416) |
| 0.1 | 1.1 | GO:0008158 | hedgehog receptor activity(GO:0008158) |
| 0.1 | 0.8 | GO:0042392 | sphingosine-1-phosphate phosphatase activity(GO:0042392) |
| 0.1 | 0.4 | GO:0005137 | interleukin-5 receptor binding(GO:0005137) |
| 0.1 | 0.7 | GO:0003945 | N-acetyllactosamine synthase activity(GO:0003945) |
| 0.1 | 0.4 | GO:0004345 | glucose-6-phosphate dehydrogenase activity(GO:0004345) |
| 0.1 | 0.5 | GO:0008745 | N-acetylmuramoyl-L-alanine amidase activity(GO:0008745) |
| 0.1 | 0.8 | GO:0023029 | MHC class Ib protein binding(GO:0023029) |
| 0.1 | 0.3 | GO:0031893 | vasopressin receptor binding(GO:0031893) |
| 0.1 | 0.5 | GO:0043398 | HLH domain binding(GO:0043398) SUMO conjugating enzyme activity(GO:0061656) |
| 0.1 | 0.3 | GO:0030613 | oxidoreductase activity, acting on phosphorus or arsenic in donors(GO:0030613) oxidoreductase activity, acting on phosphorus or arsenic in donors, disulfide as acceptor(GO:0030614) |
| 0.1 | 0.6 | GO:0004392 | heme oxygenase (decyclizing) activity(GO:0004392) |
| 0.1 | 2.7 | GO:0004653 | polypeptide N-acetylgalactosaminyltransferase activity(GO:0004653) |
| 0.1 | 0.4 | GO:0001727 | lipid kinase activity(GO:0001727) |
| 0.1 | 2.9 | GO:0016832 | aldehyde-lyase activity(GO:0016832) |
| 0.1 | 1.5 | GO:0038132 | neuregulin binding(GO:0038132) |
| 0.1 | 1.8 | GO:0008199 | ferric iron binding(GO:0008199) |
| 0.1 | 0.5 | GO:0003827 | alpha-1,3-mannosylglycoprotein 2-beta-N-acetylglucosaminyltransferase activity(GO:0003827) |
| 0.1 | 0.5 | GO:0003990 | acetylcholinesterase activity(GO:0003990) |
| 0.1 | 0.5 | GO:0035939 | microsatellite binding(GO:0035939) |
| 0.1 | 2.8 | GO:0043560 | insulin receptor substrate binding(GO:0043560) |
| 0.1 | 0.2 | GO:0019957 | C-C chemokine binding(GO:0019957) |
| 0.1 | 0.6 | GO:0017018 | myosin phosphatase activity(GO:0017018) |
| 0.1 | 0.2 | GO:0010853 | cyclase activator activity(GO:0010853) guanylate cyclase activator activity(GO:0030250) |
| 0.1 | 0.2 | GO:0005462 | UDP-N-acetylglucosamine transmembrane transporter activity(GO:0005462) |
| 0.1 | 0.5 | GO:0002046 | opsin binding(GO:0002046) |
| 0.1 | 0.4 | GO:0090482 | vitamin transmembrane transporter activity(GO:0090482) |
| 0.1 | 0.6 | GO:0005222 | intracellular cAMP activated cation channel activity(GO:0005222) |
| 0.1 | 0.8 | GO:1990050 | phosphatidic acid transporter activity(GO:1990050) |
| 0.1 | 4.7 | GO:0051019 | mitogen-activated protein kinase binding(GO:0051019) |
| 0.1 | 0.8 | GO:0031685 | adenosine receptor binding(GO:0031685) |
| 0.1 | 0.8 | GO:0004045 | aminoacyl-tRNA hydrolase activity(GO:0004045) |
| 0.1 | 0.2 | GO:0004040 | amidase activity(GO:0004040) |
| 0.1 | 0.6 | GO:0004692 | cGMP-dependent protein kinase activity(GO:0004692) |
| 0.1 | 0.5 | GO:0004667 | prostaglandin-D synthase activity(GO:0004667) |
| 0.1 | 0.8 | GO:0051525 | NFAT protein binding(GO:0051525) |
| 0.1 | 2.1 | GO:0016018 | cyclosporin A binding(GO:0016018) |
| 0.1 | 2.3 | GO:0042056 | chemoattractant activity(GO:0042056) |
| 0.1 | 0.1 | GO:0008309 | double-stranded DNA exodeoxyribonuclease activity(GO:0008309) |
| 0.1 | 4.8 | GO:0008009 | chemokine activity(GO:0008009) |
| 0.1 | 1.0 | GO:0008597 | calcium-dependent protein serine/threonine phosphatase regulator activity(GO:0008597) |
| 0.1 | 2.6 | GO:0005123 | death receptor binding(GO:0005123) |
| 0.1 | 0.6 | GO:0004663 | Rab geranylgeranyltransferase activity(GO:0004663) |
| 0.1 | 0.5 | GO:0034711 | inhibin binding(GO:0034711) |
| 0.1 | 1.8 | GO:0048185 | activin binding(GO:0048185) |
| 0.1 | 0.3 | GO:1990259 | protein-glutamine N-methyltransferase activity(GO:0036009) histone-glutamine methyltransferase activity(GO:1990259) |
| 0.1 | 3.3 | GO:0001965 | G-protein alpha-subunit binding(GO:0001965) |
| 0.1 | 1.3 | GO:0005172 | vascular endothelial growth factor receptor binding(GO:0005172) |
| 0.1 | 0.4 | GO:0032795 | heterotrimeric G-protein binding(GO:0032795) |
| 0.1 | 1.0 | GO:0047623 | AMP deaminase activity(GO:0003876) adenosine-phosphate deaminase activity(GO:0047623) |
| 0.1 | 0.3 | GO:0080101 | phosphatidyl-N-methylethanolamine N-methyltransferase activity(GO:0000773) phosphatidylethanolamine N-methyltransferase activity(GO:0004608) phosphatidyl-N-dimethylethanolamine N-methyltransferase activity(GO:0080101) |
| 0.1 | 1.8 | GO:0008503 | benzodiazepine receptor activity(GO:0008503) |
| 0.1 | 0.4 | GO:0046997 | oxidoreductase activity, acting on the CH-NH group of donors, flavin as acceptor(GO:0046997) |
| 0.1 | 0.7 | GO:0003846 | 2-acylglycerol O-acyltransferase activity(GO:0003846) |
| 0.1 | 1.1 | GO:0004969 | histamine receptor activity(GO:0004969) |
| 0.1 | 0.2 | GO:0016868 | intramolecular transferase activity, phosphotransferases(GO:0016868) |
| 0.1 | 0.8 | GO:0034513 | box H/ACA snoRNA binding(GO:0034513) |
| 0.1 | 2.4 | GO:0032183 | SUMO binding(GO:0032183) |
| 0.1 | 2.6 | GO:0042043 | neurexin family protein binding(GO:0042043) |
| 0.1 | 3.5 | GO:0001848 | complement binding(GO:0001848) |
| 0.1 | 0.5 | GO:0047844 | deoxycytidine deaminase activity(GO:0047844) |
| 0.1 | 1.3 | GO:0016176 | superoxide-generating NADPH oxidase activator activity(GO:0016176) |
| 0.1 | 2.4 | GO:0008510 | sodium:bicarbonate symporter activity(GO:0008510) |
| 0.1 | 1.2 | GO:0070324 | thyroid hormone binding(GO:0070324) |
| 0.1 | 0.7 | GO:0004459 | L-lactate dehydrogenase activity(GO:0004459) |
| 0.1 | 0.8 | GO:0051400 | BH domain binding(GO:0051400) |
| 0.1 | 1.8 | GO:0061578 | Lys63-specific deubiquitinase activity(GO:0061578) |
| 0.1 | 0.9 | GO:0004687 | myosin light chain kinase activity(GO:0004687) |
| 0.1 | 0.3 | GO:0004711 | ribosomal protein S6 kinase activity(GO:0004711) |
| 0.1 | 4.2 | GO:0008157 | protein phosphatase 1 binding(GO:0008157) |
| 0.1 | 0.4 | GO:0061714 | folic acid receptor activity(GO:0061714) |
| 0.1 | 0.3 | GO:0061676 | importin-alpha family protein binding(GO:0061676) |
| 0.1 | 0.2 | GO:0051373 | FATZ binding(GO:0051373) |
| 0.1 | 0.3 | GO:0004766 | spermidine synthase activity(GO:0004766) |
| 0.1 | 0.4 | GO:0004739 | pyruvate dehydrogenase (acetyl-transferring) activity(GO:0004739) |
| 0.1 | 2.4 | GO:0005527 | macrolide binding(GO:0005527) FK506 binding(GO:0005528) |
| 0.1 | 0.6 | GO:0004013 | adenosylhomocysteinase activity(GO:0004013) trialkylsulfonium hydrolase activity(GO:0016802) |
| 0.1 | 0.1 | GO:0019960 | C-X3-C chemokine binding(GO:0019960) |
| 0.1 | 0.3 | GO:0072345 | NAADP-sensitive calcium-release channel activity(GO:0072345) |
| 0.1 | 2.2 | GO:0030275 | LRR domain binding(GO:0030275) |
| 0.1 | 1.7 | GO:0030297 | transmembrane receptor protein tyrosine kinase activator activity(GO:0030297) |
| 0.1 | 0.7 | GO:0015450 | P-P-bond-hydrolysis-driven protein transmembrane transporter activity(GO:0015450) |
| 0.1 | 0.7 | GO:0004735 | pyrroline-5-carboxylate reductase activity(GO:0004735) |
| 0.1 | 0.3 | GO:0005219 | ryanodine-sensitive calcium-release channel activity(GO:0005219) calcium-induced calcium release activity(GO:0048763) |
| 0.1 | 1.8 | GO:0004089 | carbonate dehydratase activity(GO:0004089) |
| 0.1 | 0.6 | GO:0005298 | proline:sodium symporter activity(GO:0005298) |
| 0.1 | 0.9 | GO:0003810 | protein-glutamine gamma-glutamyltransferase activity(GO:0003810) |
| 0.1 | 0.6 | GO:0070699 | type II activin receptor binding(GO:0070699) |
| 0.1 | 1.4 | GO:0008296 | 3'-5'-exodeoxyribonuclease activity(GO:0008296) |
| 0.1 | 2.1 | GO:0052629 | phosphatidylinositol-3,5-bisphosphate 3-phosphatase activity(GO:0052629) |
| 0.1 | 0.2 | GO:0010521 | telomerase inhibitor activity(GO:0010521) |
| 0.1 | 1.1 | GO:0004526 | ribonuclease P activity(GO:0004526) |
| 0.1 | 1.6 | GO:0070513 | death domain binding(GO:0070513) |
| 0.1 | 0.7 | GO:0005047 | signal recognition particle binding(GO:0005047) |
| 0.1 | 0.5 | GO:0030346 | protein phosphatase 2B binding(GO:0030346) |
| 0.1 | 0.3 | GO:0002094 | polyprenyltransferase activity(GO:0002094) |
| 0.1 | 0.4 | GO:0005136 | interleukin-4 receptor binding(GO:0005136) |
| 0.1 | 0.7 | GO:0004704 | NF-kappaB-inducing kinase activity(GO:0004704) |
| 0.1 | 0.5 | GO:0031705 | bombesin receptor binding(GO:0031705) |
| 0.1 | 0.3 | GO:0070039 | rRNA (guanosine-2'-O-)-methyltransferase activity(GO:0070039) |
| 0.1 | 0.7 | GO:0004468 | lysine N-acetyltransferase activity, acting on acetyl phosphate as donor(GO:0004468) |
| 0.1 | 0.2 | GO:0031826 | type 2A serotonin receptor binding(GO:0031826) |
| 0.1 | 0.4 | GO:0030553 | cGMP binding(GO:0030553) |
| 0.1 | 0.3 | GO:0061629 | RNA polymerase II sequence-specific DNA binding transcription factor binding(GO:0061629) |
| 0.1 | 1.1 | GO:0017151 | DEAD/H-box RNA helicase binding(GO:0017151) |
| 0.1 | 0.6 | GO:0008142 | oxysterol binding(GO:0008142) |
| 0.1 | 0.5 | GO:0034511 | U3 snoRNA binding(GO:0034511) |
| 0.1 | 0.4 | GO:0035614 | snRNA stem-loop binding(GO:0035614) |
| 0.1 | 2.4 | GO:0005388 | calcium-transporting ATPase activity(GO:0005388) |
| 0.1 | 0.8 | GO:0031434 | mitogen-activated protein kinase kinase binding(GO:0031434) |
| 0.1 | 2.4 | GO:0005031 | tumor necrosis factor-activated receptor activity(GO:0005031) death receptor activity(GO:0005035) |
| 0.1 | 0.1 | GO:0015193 | L-proline transmembrane transporter activity(GO:0015193) |
| 0.1 | 18.6 | GO:0005125 | cytokine activity(GO:0005125) |
| 0.1 | 0.4 | GO:0004126 | cytidine deaminase activity(GO:0004126) |
| 0.1 | 0.4 | GO:0003875 | ADP-ribosylarginine hydrolase activity(GO:0003875) |
| 0.1 | 0.5 | GO:0005220 | inositol 1,4,5-trisphosphate-sensitive calcium-release channel activity(GO:0005220) |
| 0.1 | 0.2 | GO:0003918 | DNA topoisomerase type II (ATP-hydrolyzing) activity(GO:0003918) DNA topoisomerase II activity(GO:0061505) |
| 0.1 | 0.4 | GO:0019862 | IgA binding(GO:0019862) |
| 0.1 | 0.1 | GO:0070644 | vitamin D response element binding(GO:0070644) |
| 0.1 | 1.7 | GO:0022841 | potassium ion leak channel activity(GO:0022841) |
| 0.1 | 0.6 | GO:0000155 | phosphorelay sensor kinase activity(GO:0000155) |
| 0.1 | 0.6 | GO:0030621 | U4 snRNA binding(GO:0030621) |
| 0.1 | 0.3 | GO:0004449 | isocitrate dehydrogenase (NAD+) activity(GO:0004449) |
| 0.1 | 0.3 | GO:0070548 | glutamine-fructose-6-phosphate transaminase (isomerizing) activity(GO:0004360) L-glutamine aminotransferase activity(GO:0070548) |
| 0.1 | 0.1 | GO:0016361 | activin receptor activity, type I(GO:0016361) |
| 0.1 | 0.2 | GO:0070573 | metallodipeptidase activity(GO:0070573) |
| 0.1 | 0.7 | GO:0004024 | alcohol dehydrogenase activity, zinc-dependent(GO:0004024) |
| 0.1 | 1.9 | GO:0044548 | S100 protein binding(GO:0044548) |
| 0.1 | 0.4 | GO:0015018 | galactosylgalactosylxylosylprotein 3-beta-glucuronosyltransferase activity(GO:0015018) |
| 0.1 | 0.9 | GO:0070087 | chromo shadow domain binding(GO:0070087) |
| 0.1 | 1.5 | GO:0008392 | arachidonic acid monooxygenase activity(GO:0008391) arachidonic acid epoxygenase activity(GO:0008392) |
| 0.1 | 0.2 | GO:0008457 | beta-galactosyl-N-acetylglucosaminylgalactosylglucosyl-ceramide beta-1,3-acetylglucosaminyltransferase activity(GO:0008457) lactosylceramide 1,3-N-acetyl-beta-D-glucosaminyltransferase activity(GO:0047256) |
| 0.1 | 0.6 | GO:0035374 | chondroitin sulfate binding(GO:0035374) |
| 0.1 | 0.6 | GO:0030292 | protein tyrosine kinase inhibitor activity(GO:0030292) |
| 0.1 | 1.2 | GO:0004028 | 3-chloroallyl aldehyde dehydrogenase activity(GO:0004028) |
| 0.1 | 0.2 | GO:0001132 | RNA polymerase II transcription factor activity, TBP-class protein binding, involved in preinitiation complex assembly(GO:0001129) RNA polymerase II transcription factor activity, TBP-class protein binding(GO:0001132) |
| 0.1 | 0.3 | GO:0016724 | ferroxidase activity(GO:0004322) oxidoreductase activity, oxidizing metal ions, oxygen as acceptor(GO:0016724) |
| 0.1 | 0.8 | GO:0070739 | protein-glutamic acid ligase activity(GO:0070739) |
| 0.1 | 0.2 | GO:0008241 | peptidyl-dipeptidase activity(GO:0008241) |
| 0.1 | 0.4 | GO:0004910 | interleukin-1, Type II, blocking receptor activity(GO:0004910) |
| 0.1 | 0.4 | GO:0046624 | sphingolipid transporter activity(GO:0046624) |
| 0.1 | 0.4 | GO:0004771 | sterol esterase activity(GO:0004771) |
| 0.1 | 1.1 | GO:0001206 | transcriptional repressor activity, RNA polymerase II distal enhancer sequence-specific binding(GO:0001206) |
| 0.1 | 1.1 | GO:0070273 | phosphatidylinositol-4-phosphate binding(GO:0070273) |
| 0.1 | 4.1 | GO:0008536 | Ran GTPase binding(GO:0008536) |
| 0.1 | 0.3 | GO:0097001 | ceramide binding(GO:0097001) |
| 0.1 | 1.9 | GO:0004550 | nucleoside diphosphate kinase activity(GO:0004550) |
| 0.1 | 0.4 | GO:0004809 | tRNA (guanine-N2-)-methyltransferase activity(GO:0004809) |
| 0.1 | 0.7 | GO:0097371 | MDM2/MDM4 family protein binding(GO:0097371) |
| 0.1 | 0.6 | GO:0017150 | tRNA dihydrouridine synthase activity(GO:0017150) |
| 0.1 | 0.5 | GO:0008454 | alpha-1,3-mannosylglycoprotein 4-beta-N-acetylglucosaminyltransferase activity(GO:0008454) |
| 0.1 | 0.6 | GO:0035312 | 5'-3' exodeoxyribonuclease activity(GO:0035312) |
| 0.1 | 0.3 | GO:0001156 | TFIIIC-class transcription factor binding(GO:0001156) |
| 0.1 | 3.9 | GO:0017080 | sodium channel regulator activity(GO:0017080) |
| 0.1 | 0.5 | GO:0042289 | MHC class II protein binding(GO:0042289) |
| 0.1 | 0.6 | GO:0015187 | glycine transmembrane transporter activity(GO:0015187) |
| 0.1 | 2.1 | GO:0031698 | beta-2 adrenergic receptor binding(GO:0031698) |
| 0.1 | 0.9 | GO:0045294 | alpha-catenin binding(GO:0045294) |
| 0.1 | 1.4 | GO:0015095 | magnesium ion transmembrane transporter activity(GO:0015095) |
| 0.1 | 2.5 | GO:0005109 | frizzled binding(GO:0005109) |
| 0.1 | 1.4 | GO:0005344 | oxygen transporter activity(GO:0005344) |
| 0.1 | 1.0 | GO:0051864 | histone demethylase activity (H3-K36 specific)(GO:0051864) |
| 0.1 | 1.6 | GO:0005355 | glucose transmembrane transporter activity(GO:0005355) |
| 0.1 | 1.1 | GO:0001222 | transcription corepressor binding(GO:0001222) |
| 0.1 | 0.5 | GO:0016433 | rRNA (adenine) methyltransferase activity(GO:0016433) |
| 0.1 | 0.9 | GO:0017034 | Rap guanyl-nucleotide exchange factor activity(GO:0017034) |
| 0.1 | 0.3 | GO:0016971 | flavin-linked sulfhydryl oxidase activity(GO:0016971) |
| 0.1 | 2.0 | GO:0044769 | ATPase activity, coupled to transmembrane movement of ions, rotational mechanism(GO:0044769) proton-transporting ATPase activity, rotational mechanism(GO:0046961) |
| 0.1 | 1.4 | GO:0004185 | serine-type carboxypeptidase activity(GO:0004185) |
| 0.1 | 0.8 | GO:1990459 | transferrin receptor binding(GO:1990459) |
| 0.1 | 0.6 | GO:0102337 | fatty acid elongase activity(GO:0009922) 3-oxo-arachidoyl-CoA synthase activity(GO:0102336) 3-oxo-cerotoyl-CoA synthase activity(GO:0102337) 3-oxo-lignoceronyl-CoA synthase activity(GO:0102338) |
| 0.1 | 2.5 | GO:0004435 | phosphatidylinositol phospholipase C activity(GO:0004435) |
| 0.1 | 2.9 | GO:0032266 | phosphatidylinositol-3-phosphate binding(GO:0032266) |
| 0.1 | 2.7 | GO:0005154 | epidermal growth factor receptor binding(GO:0005154) |
| 0.1 | 1.8 | GO:0043027 | cysteine-type endopeptidase inhibitor activity involved in apoptotic process(GO:0043027) |
| 0.1 | 1.9 | GO:0004890 | GABA-A receptor activity(GO:0004890) |
| 0.1 | 0.4 | GO:0008109 | N-acetyllactosaminide beta-1,6-N-acetylglucosaminyltransferase activity(GO:0008109) |
| 0.1 | 0.2 | GO:0034584 | piRNA binding(GO:0034584) |
| 0.1 | 1.1 | GO:0008195 | phosphatidate phosphatase activity(GO:0008195) |
| 0.1 | 0.3 | GO:0032393 | MHC class I receptor activity(GO:0032393) |
| 0.1 | 1.0 | GO:0030881 | beta-2-microglobulin binding(GO:0030881) |
| 0.1 | 0.1 | GO:0004662 | CAAX-protein geranylgeranyltransferase activity(GO:0004662) |
| 0.1 | 0.4 | GO:0004366 | glycerol-3-phosphate O-acyltransferase activity(GO:0004366) |
| 0.1 | 0.2 | GO:0001588 | dopamine neurotransmitter receptor activity, coupled via Gs(GO:0001588) |
| 0.1 | 0.4 | GO:0030235 | nitric-oxide synthase regulator activity(GO:0030235) |
| 0.1 | 0.7 | GO:0046920 | alpha-(1->3)-fucosyltransferase activity(GO:0046920) |
| 0.1 | 0.3 | GO:1904929 | coreceptor activity involved in Wnt signaling pathway, planar cell polarity pathway(GO:1904929) |
| 0.1 | 7.0 | GO:0005518 | collagen binding(GO:0005518) |
| 0.1 | 0.3 | GO:0008321 | Ral guanyl-nucleotide exchange factor activity(GO:0008321) |
| 0.1 | 0.3 | GO:0097603 | temperature-gated ion channel activity(GO:0097603) |
| 0.1 | 0.3 | GO:0050816 | phosphothreonine binding(GO:0050816) |
| 0.1 | 0.3 | GO:0046935 | 1-phosphatidylinositol-3-kinase regulator activity(GO:0046935) |
| 0.1 | 0.7 | GO:0046972 | histone acetyltransferase activity (H4-K5 specific)(GO:0043995) histone acetyltransferase activity (H4-K8 specific)(GO:0043996) histone acetyltransferase activity (H4-K16 specific)(GO:0046972) |
| 0.1 | 0.2 | GO:0001010 | transcription factor activity, sequence-specific DNA binding transcription factor recruiting(GO:0001010) |
| 0.1 | 0.4 | GO:0034648 | histone demethylase activity (H3-dimethyl-K4 specific)(GO:0034648) |
| 0.1 | 0.2 | GO:0005334 | norepinephrine:sodium symporter activity(GO:0005334) |
| 0.1 | 0.2 | GO:0098770 | FBXO family protein binding(GO:0098770) |
| 0.1 | 8.5 | GO:0004222 | metalloendopeptidase activity(GO:0004222) |
| 0.1 | 3.7 | GO:0030374 | ligand-dependent nuclear receptor transcription coactivator activity(GO:0030374) |
| 0.1 | 1.4 | GO:0030898 | actin-dependent ATPase activity(GO:0030898) |
| 0.1 | 0.2 | GO:0004365 | glyceraldehyde-3-phosphate dehydrogenase (NAD+) (phosphorylating) activity(GO:0004365) glyceraldehyde-3-phosphate dehydrogenase (NAD(P)+) (phosphorylating) activity(GO:0043891) |
| 0.1 | 0.2 | GO:0036505 | prosaposin receptor activity(GO:0036505) |
| 0.1 | 0.5 | GO:0019784 | NEDD8-specific protease activity(GO:0019784) |
| 0.1 | 0.3 | GO:0004427 | inorganic diphosphatase activity(GO:0004427) |
| 0.1 | 0.2 | GO:0031716 | calcitonin receptor binding(GO:0031716) |
| 0.1 | 0.5 | GO:0050682 | AF-2 domain binding(GO:0050682) |
| 0.1 | 0.2 | GO:0000994 | RNA polymerase III core binding(GO:0000994) |
| 0.1 | 4.3 | GO:0015459 | potassium channel regulator activity(GO:0015459) |
| 0.1 | 1.4 | GO:0098641 | cadherin binding involved in cell-cell adhesion(GO:0098641) |
| 0.1 | 0.3 | GO:0019956 | chemokine binding(GO:0019956) |
| 0.1 | 0.2 | GO:0051185 | coenzyme transporter activity(GO:0051185) |
| 0.1 | 0.6 | GO:0017162 | aryl hydrocarbon receptor binding(GO:0017162) |
| 0.1 | 3.7 | GO:0001105 | RNA polymerase II transcription coactivator activity(GO:0001105) |
| 0.1 | 0.3 | GO:0003917 | DNA topoisomerase type I activity(GO:0003917) |
| 0.1 | 0.2 | GO:0003831 | beta-N-acetylglucosaminylglycopeptide beta-1,4-galactosyltransferase activity(GO:0003831) |
| 0.1 | 1.6 | GO:0030676 | Rac guanyl-nucleotide exchange factor activity(GO:0030676) |
| 0.1 | 0.5 | GO:0070679 | inositol 1,4,5 trisphosphate binding(GO:0070679) |
| 0.1 | 0.3 | GO:0016917 | GABA receptor activity(GO:0016917) |
| 0.1 | 0.4 | GO:0004499 | N,N-dimethylaniline monooxygenase activity(GO:0004499) |
| 0.1 | 0.6 | GO:0004311 | farnesyltranstransferase activity(GO:0004311) |
| 0.1 | 0.3 | GO:0001054 | RNA polymerase I activity(GO:0001054) |
| 0.1 | 1.2 | GO:0070064 | proline-rich region binding(GO:0070064) |
| 0.1 | 0.2 | GO:0005148 | prolactin receptor binding(GO:0005148) |
| 0.1 | 0.3 | GO:0008508 | bile acid:sodium symporter activity(GO:0008508) |
| 0.1 | 0.6 | GO:0008428 | ribonuclease inhibitor activity(GO:0008428) |
| 0.1 | 1.4 | GO:0070006 | metalloaminopeptidase activity(GO:0070006) |
| 0.1 | 0.4 | GO:0035259 | glucocorticoid receptor binding(GO:0035259) |
| 0.1 | 1.1 | GO:0070300 | phosphatidic acid binding(GO:0070300) |
| 0.1 | 0.4 | GO:0042296 | ISG15 transferase activity(GO:0042296) |
| 0.0 | 1.1 | GO:0034237 | protein kinase A regulatory subunit binding(GO:0034237) |
| 0.0 | 0.1 | GO:0030350 | iron-responsive element binding(GO:0030350) |
| 0.0 | 0.3 | GO:0001594 | trace-amine receptor activity(GO:0001594) |
| 0.0 | 1.5 | GO:0070034 | telomerase RNA binding(GO:0070034) |
| 0.0 | 0.1 | GO:0019534 | toxin transporter activity(GO:0019534) |
| 0.0 | 0.1 | GO:0016497 | substance K receptor activity(GO:0016497) |
| 0.0 | 0.2 | GO:0004852 | uroporphyrinogen-III synthase activity(GO:0004852) |
| 0.0 | 0.5 | GO:0017176 | phosphatidylinositol N-acetylglucosaminyltransferase activity(GO:0017176) |
| 0.0 | 0.7 | GO:0008061 | chitin binding(GO:0008061) |
| 0.0 | 0.1 | GO:0035663 | Toll-like receptor 2 binding(GO:0035663) |
| 0.0 | 0.1 | GO:0034056 | estrogen response element binding(GO:0034056) |
| 0.0 | 0.1 | GO:0004882 | androgen receptor activity(GO:0004882) |
| 0.0 | 0.1 | GO:0035662 | Toll-like receptor 4 binding(GO:0035662) |
| 0.0 | 0.2 | GO:0017077 | oxidative phosphorylation uncoupler activity(GO:0017077) |
| 0.0 | 0.2 | GO:0016713 | oxidoreductase activity, acting on paired donors, with incorporation or reduction of molecular oxygen, reduced iron-sulfur protein as one donor, and incorporation of one atom of oxygen(GO:0016713) |
| 0.0 | 0.1 | GO:0047374 | methylumbelliferyl-acetate deacetylase activity(GO:0047374) |
| 0.0 | 0.5 | GO:0001537 | N-acetylgalactosamine 4-O-sulfotransferase activity(GO:0001537) |
| 0.0 | 0.3 | GO:0034046 | poly(G) binding(GO:0034046) |
| 0.0 | 0.3 | GO:0071553 | uridine nucleotide receptor activity(GO:0015065) G-protein coupled pyrimidinergic nucleotide receptor activity(GO:0071553) |
| 0.0 | 0.4 | GO:0038036 | sphingosine-1-phosphate receptor activity(GO:0038036) |
| 0.0 | 0.2 | GO:0022840 | leak channel activity(GO:0022840) narrow pore channel activity(GO:0022842) |
| 0.0 | 0.2 | GO:0004803 | transposase activity(GO:0004803) |
| 0.0 | 0.1 | GO:0004629 | phospholipase C activity(GO:0004629) |
| 0.0 | 0.4 | GO:0045499 | chemorepellent activity(GO:0045499) |
| 0.0 | 0.2 | GO:0008969 | phosphohistidine phosphatase activity(GO:0008969) |
| 0.0 | 0.4 | GO:0097027 | ubiquitin-protein transferase activator activity(GO:0097027) |
| 0.0 | 0.3 | GO:0001515 | opioid peptide activity(GO:0001515) |
| 0.0 | 0.0 | GO:0048020 | CCR chemokine receptor binding(GO:0048020) |
| 0.0 | 0.6 | GO:0009982 | pseudouridine synthase activity(GO:0009982) |
| 0.0 | 0.2 | GO:1902444 | riboflavin binding(GO:1902444) |
| 0.0 | 0.1 | GO:0045322 | unmethylated CpG binding(GO:0045322) |
| 0.0 | 0.5 | GO:0019531 | oxalate transmembrane transporter activity(GO:0019531) |
| 0.0 | 0.1 | GO:0033749 | histone demethylase activity (H3-R2 specific)(GO:0033746) histone demethylase activity (H4-R3 specific)(GO:0033749) |
| 0.0 | 3.5 | GO:0004004 | ATP-dependent RNA helicase activity(GO:0004004) |
| 0.0 | 10.0 | GO:0001047 | core promoter binding(GO:0001047) |
| 0.0 | 0.2 | GO:0035529 | NADH pyrophosphatase activity(GO:0035529) |
| 0.0 | 0.1 | GO:0046923 | ER retention sequence binding(GO:0046923) |
| 0.0 | 0.8 | GO:0031005 | filamin binding(GO:0031005) |
| 0.0 | 0.5 | GO:0032050 | clathrin heavy chain binding(GO:0032050) |
| 0.0 | 0.3 | GO:0001665 | alpha-N-acetylgalactosaminide alpha-2,6-sialyltransferase activity(GO:0001665) |
| 0.0 | 0.1 | GO:0004698 | calcium-dependent protein kinase C activity(GO:0004698) |
| 0.0 | 0.2 | GO:0004906 | interferon-gamma receptor activity(GO:0004906) |
| 0.0 | 0.3 | GO:0004865 | protein serine/threonine phosphatase inhibitor activity(GO:0004865) |
| 0.0 | 0.1 | GO:0098808 | mRNA cap binding(GO:0098808) |
| 0.0 | 0.1 | GO:0019834 | phospholipase A2 inhibitor activity(GO:0019834) |
| 0.0 | 1.6 | GO:0005158 | insulin receptor binding(GO:0005158) |
| 0.0 | 0.1 | GO:0047025 | 3-oxoacyl-[acyl-carrier-protein] reductase (NADH) activity(GO:0047025) |
| 0.0 | 0.1 | GO:0004937 | alpha1-adrenergic receptor activity(GO:0004937) |
| 0.0 | 0.3 | GO:0010484 | H3 histone acetyltransferase activity(GO:0010484) |
| 0.0 | 0.2 | GO:0042285 | UDP-xylosyltransferase activity(GO:0035252) xylosyltransferase activity(GO:0042285) |
| 0.0 | 0.9 | GO:0004806 | triglyceride lipase activity(GO:0004806) |
| 0.0 | 0.4 | GO:0051378 | amine binding(GO:0043176) serotonin binding(GO:0051378) |
| 0.0 | 0.2 | GO:0003989 | acetyl-CoA carboxylase activity(GO:0003989) |
| 0.0 | 0.1 | GO:0051880 | G-quadruplex DNA binding(GO:0051880) |
| 0.0 | 0.1 | GO:0033192 | calmodulin-dependent protein phosphatase activity(GO:0033192) |
| 0.0 | 0.2 | GO:0042835 | BRE binding(GO:0042835) |
| 0.0 | 4.3 | GO:0004896 | cytokine receptor activity(GO:0004896) |
| 0.0 | 0.3 | GO:0003847 | 1-alkyl-2-acetylglycerophosphocholine esterase activity(GO:0003847) |
| 0.0 | 0.2 | GO:0001055 | RNA polymerase II activity(GO:0001055) |
| 0.0 | 0.7 | GO:0004000 | adenosine deaminase activity(GO:0004000) |
| 0.0 | 0.1 | GO:0033754 | indoleamine 2,3-dioxygenase activity(GO:0033754) |
| 0.0 | 0.2 | GO:0004017 | adenylate kinase activity(GO:0004017) |
| 0.0 | 0.7 | GO:0043014 | alpha-tubulin binding(GO:0043014) |
| 0.0 | 0.1 | GO:0004102 | choline O-acetyltransferase activity(GO:0004102) |
| 0.0 | 0.3 | GO:0008432 | JUN kinase binding(GO:0008432) |
| 0.0 | 0.6 | GO:0000339 | RNA cap binding(GO:0000339) |
| 0.0 | 0.3 | GO:0046912 | transferase activity, transferring acyl groups, acyl groups converted into alkyl on transfer(GO:0046912) |
| 0.0 | 0.9 | GO:0070530 | K63-linked polyubiquitin binding(GO:0070530) |
| 0.0 | 0.3 | GO:0017136 | NAD-dependent histone deacetylase activity(GO:0017136) |
| 0.0 | 0.3 | GO:0016884 | carbon-nitrogen ligase activity, with glutamine as amido-N-donor(GO:0016884) |
| 0.0 | 0.2 | GO:0004800 | thyroxine 5'-deiodinase activity(GO:0004800) |
| 0.0 | 0.1 | GO:0051380 | beta-adrenergic receptor activity(GO:0004939) norepinephrine binding(GO:0051380) |
| 0.0 | 0.1 | GO:0001601 | peptide YY receptor activity(GO:0001601) |
| 0.0 | 0.2 | GO:0004935 | adrenergic receptor activity(GO:0004935) |
| 0.0 | 0.2 | GO:0016814 | hydrolase activity, acting on carbon-nitrogen (but not peptide) bonds, in cyclic amidines(GO:0016814) |
| 0.0 | 0.2 | GO:0022889 | L-serine transmembrane transporter activity(GO:0015194) serine transmembrane transporter activity(GO:0022889) |
| 0.0 | 0.1 | GO:0052810 | 1-phosphatidylinositol-5-kinase activity(GO:0052810) |
| 0.0 | 0.7 | GO:0003951 | NAD+ kinase activity(GO:0003951) |
| 0.0 | 0.1 | GO:0003978 | UDP-N-acetylglucosamine 4-epimerase activity(GO:0003974) UDP-glucose 4-epimerase activity(GO:0003978) |
| 0.0 | 0.2 | GO:0003835 | beta-galactoside alpha-2,6-sialyltransferase activity(GO:0003835) |
| 0.0 | 1.0 | GO:0070840 | dynein complex binding(GO:0070840) |
| 0.0 | 0.4 | GO:0046965 | retinoid X receptor binding(GO:0046965) |
| 0.0 | 0.1 | GO:0005333 | norepinephrine transmembrane transporter activity(GO:0005333) |
| 0.0 | 0.7 | GO:0042169 | SH2 domain binding(GO:0042169) |
| 0.0 | 0.1 | GO:0015056 | corticotrophin-releasing factor receptor activity(GO:0015056) |
| 0.0 | 0.1 | GO:0051033 | nucleic acid transmembrane transporter activity(GO:0051032) RNA transmembrane transporter activity(GO:0051033) |
| 0.0 | 0.2 | GO:0030021 | extracellular matrix structural constituent conferring compression resistance(GO:0030021) structural constituent of tooth enamel(GO:0030345) |
| 0.0 | 0.1 | GO:0005471 | ATP:ADP antiporter activity(GO:0005471) adenine transmembrane transporter activity(GO:0015207) |
| 0.0 | 0.1 | GO:0042809 | vitamin D receptor binding(GO:0042809) |
| 0.0 | 0.0 | GO:0044388 | small protein activating enzyme binding(GO:0044388) |
| 0.0 | 0.4 | GO:0004861 | cyclin-dependent protein serine/threonine kinase inhibitor activity(GO:0004861) |
| 0.0 | 0.1 | GO:0042781 | 3'-tRNA processing endoribonuclease activity(GO:0042781) |
| 0.0 | 0.1 | GO:0015205 | nucleobase transmembrane transporter activity(GO:0015205) |
| 0.0 | 1.0 | GO:0051879 | Hsp90 protein binding(GO:0051879) |
| 0.0 | 0.5 | GO:0005104 | fibroblast growth factor receptor binding(GO:0005104) |
| 0.0 | 2.0 | GO:0004715 | non-membrane spanning protein tyrosine kinase activity(GO:0004715) |
| 0.0 | 1.0 | GO:0008331 | high voltage-gated calcium channel activity(GO:0008331) |
| 0.0 | 12.2 | GO:0005096 | GTPase activator activity(GO:0005096) |
| 0.0 | 0.7 | GO:0008569 | ATP-dependent microtubule motor activity, minus-end-directed(GO:0008569) |
| 0.0 | 0.1 | GO:0042134 | rRNA primary transcript binding(GO:0042134) |
| 0.0 | 0.2 | GO:0004972 | NMDA glutamate receptor activity(GO:0004972) |
| 0.0 | 0.1 | GO:0004668 | protein-arginine deiminase activity(GO:0004668) |
| 0.0 | 0.3 | GO:0030020 | extracellular matrix structural constituent conferring tensile strength(GO:0030020) |
| 0.0 | 1.3 | GO:0050699 | WW domain binding(GO:0050699) |
| 0.0 | 0.5 | GO:0000146 | microfilament motor activity(GO:0000146) |
| 0.0 | 1.7 | GO:0034212 | peptide N-acetyltransferase activity(GO:0034212) |
| 0.0 | 0.1 | GO:0030369 | ICAM-3 receptor activity(GO:0030369) |
| 0.0 | 0.2 | GO:0015307 | drug:proton antiporter activity(GO:0015307) |
| 0.0 | 0.1 | GO:0004878 | complement component C5a receptor activity(GO:0004878) |
| 0.0 | 0.2 | GO:0004523 | RNA-DNA hybrid ribonuclease activity(GO:0004523) |
| 0.0 | 0.2 | GO:0034452 | dynactin binding(GO:0034452) |
| 0.0 | 0.6 | GO:0004181 | metallocarboxypeptidase activity(GO:0004181) |
| 0.0 | 0.9 | GO:0005385 | zinc ion transmembrane transporter activity(GO:0005385) |
| 0.0 | 0.2 | GO:0042609 | CD4 receptor binding(GO:0042609) |
| 0.0 | 1.0 | GO:0043015 | gamma-tubulin binding(GO:0043015) |
| 0.0 | 0.1 | GO:0005149 | interleukin-1 receptor binding(GO:0005149) |
| 0.0 | 0.6 | GO:0017147 | Wnt-protein binding(GO:0017147) |
| 0.0 | 0.1 | GO:0015057 | thrombin receptor activity(GO:0015057) |
| 0.0 | 0.1 | GO:0016929 | SUMO-specific protease activity(GO:0016929) |
| 0.0 | 0.1 | GO:0005176 | ErbB-2 class receptor binding(GO:0005176) |
| 0.0 | 0.2 | GO:0019237 | centromeric DNA binding(GO:0019237) |
| 0.0 | 0.2 | GO:0031628 | opioid receptor binding(GO:0031628) |
| 0.0 | 0.1 | GO:0004875 | complement receptor activity(GO:0004875) |
| 0.0 | 0.7 | GO:0005080 | protein kinase C binding(GO:0005080) |
| 0.0 | 0.2 | GO:0015301 | anion:anion antiporter activity(GO:0015301) |
| 0.0 | 0.2 | GO:0031435 | mitogen-activated protein kinase kinase kinase binding(GO:0031435) |
| 0.0 | 0.1 | GO:0017095 | heparan sulfate 6-O-sulfotransferase activity(GO:0017095) |
| 0.0 | 0.0 | GO:0005329 | dopamine transmembrane transporter activity(GO:0005329) |
| 0.0 | 0.1 | GO:0003909 | DNA ligase activity(GO:0003909) |
| 0.0 | 0.2 | GO:0030023 | extracellular matrix constituent conferring elasticity(GO:0030023) |
| 0.0 | 0.5 | GO:0005521 | lamin binding(GO:0005521) |
| 0.0 | 0.1 | GO:0009019 | tRNA (guanine-N1-)-methyltransferase activity(GO:0009019) |
| 0.0 | 0.3 | GO:0015037 | peptide disulfide oxidoreductase activity(GO:0015037) |
| 0.0 | 0.1 | GO:0000033 | alpha-1,3-mannosyltransferase activity(GO:0000033) |
| 0.0 | 0.4 | GO:0035925 | mRNA 3'-UTR AU-rich region binding(GO:0035925) |
| 0.0 | 0.3 | GO:0008190 | eukaryotic initiation factor 4E binding(GO:0008190) |
| 0.0 | 0.1 | GO:0004515 | nicotinamide-nucleotide adenylyltransferase activity(GO:0000309) nicotinate-nucleotide adenylyltransferase activity(GO:0004515) |
| 0.0 | 0.2 | GO:0050733 | RS domain binding(GO:0050733) |
| 0.0 | 0.3 | GO:0003796 | lysozyme activity(GO:0003796) |
| 0.0 | 0.1 | GO:0035727 | lysophosphatidic acid binding(GO:0035727) |
| 0.0 | 0.2 | GO:0060072 | large conductance calcium-activated potassium channel activity(GO:0060072) |
| 0.0 | 0.1 | GO:0070051 | fibrinogen binding(GO:0070051) |
| 0.0 | 0.4 | GO:0033038 | bitter taste receptor activity(GO:0033038) |
| 0.0 | 0.1 | GO:0004060 | arylamine N-acetyltransferase activity(GO:0004060) |
| 0.0 | 0.1 | GO:0042284 | sphingolipid delta-4 desaturase activity(GO:0042284) |
| 0.0 | 0.3 | GO:0019864 | IgG binding(GO:0019864) |
| 0.0 | 0.1 | GO:0044736 | acid-sensing ion channel activity(GO:0044736) |
| 0.0 | 0.6 | GO:0005212 | structural constituent of eye lens(GO:0005212) |
| 0.0 | 0.3 | GO:0098505 | G-rich strand telomeric DNA binding(GO:0098505) |
| 0.0 | 0.1 | GO:1901338 | dopamine binding(GO:0035240) catecholamine binding(GO:1901338) |
| 0.0 | 3.3 | GO:0004984 | olfactory receptor activity(GO:0004984) |
| 0.0 | 0.0 | GO:0045118 | azole transporter activity(GO:0045118) |
| 0.0 | 0.1 | GO:0051011 | microtubule minus-end binding(GO:0051011) |
| 0.0 | 0.1 | GO:0061665 | SUMO ligase activity(GO:0061665) |
| 0.0 | 0.1 | GO:0032552 | deoxyribonucleotide binding(GO:0032552) |
| 0.0 | 0.1 | GO:0004605 | phosphatidate cytidylyltransferase activity(GO:0004605) |
| 0.0 | 0.1 | GO:0004597 | peptide-aspartate beta-dioxygenase activity(GO:0004597) |
| 0.0 | 0.2 | GO:1990825 | sequence-specific mRNA binding(GO:1990825) |
| 0.0 | 0.4 | GO:0004859 | phospholipase inhibitor activity(GO:0004859) |
| 0.0 | 0.1 | GO:0099528 | G-protein coupled acetylcholine receptor activity(GO:0016907) G-protein coupled neurotransmitter receptor activity(GO:0099528) |
| 0.0 | 0.1 | GO:0001641 | group II metabotropic glutamate receptor activity(GO:0001641) |
| 0.0 | 0.1 | GO:1901611 | phosphatidylglycerol binding(GO:1901611) |
| 0.0 | 0.3 | GO:0015101 | organic cation transmembrane transporter activity(GO:0015101) |
| 0.0 | 0.1 | GO:0003747 | translation release factor activity(GO:0003747) translation termination factor activity(GO:0008079) |
| 0.0 | 0.0 | GO:0004530 | deoxyribonuclease I activity(GO:0004530) |
| 0.0 | 0.1 | GO:0004999 | vasoactive intestinal polypeptide receptor activity(GO:0004999) |
| 0.0 | 0.1 | GO:0015106 | bicarbonate transmembrane transporter activity(GO:0015106) |
| 0.0 | 0.1 | GO:0001626 | nociceptin receptor activity(GO:0001626) |
| 0.0 | 0.1 | GO:0005042 | netrin receptor activity(GO:0005042) |
| 0.0 | 0.1 | GO:0036402 | proteasome-activating ATPase activity(GO:0036402) |
| 0.0 | 0.2 | GO:0003993 | acid phosphatase activity(GO:0003993) |
| 0.0 | 0.1 | GO:1990829 | C-rich single-stranded DNA binding(GO:1990829) |
| 0.0 | 0.0 | GO:0055106 | ubiquitin-protein transferase regulator activity(GO:0055106) |
| 0.0 | 1.5 | GO:0003705 | transcription factor activity, RNA polymerase II distal enhancer sequence-specific binding(GO:0003705) |
| 0.0 | 0.2 | GO:0008066 | glutamate receptor activity(GO:0008066) |
| 0.0 | 0.4 | GO:0015026 | coreceptor activity(GO:0015026) |
| 0.0 | 0.1 | GO:0004977 | melanocortin receptor activity(GO:0004977) |
| 0.0 | 0.2 | GO:0015216 | purine nucleotide transmembrane transporter activity(GO:0015216) |
| 0.0 | 0.0 | GO:0043813 | phosphatidylinositol-3,5-bisphosphate 5-phosphatase activity(GO:0043813) |
| 0.0 | 0.1 | GO:0004522 | ribonuclease A activity(GO:0004522) |
| 0.0 | 0.1 | GO:0070915 | lysophosphatidic acid receptor activity(GO:0070915) |
| 0.0 | 0.3 | GO:0005234 | extracellular-glutamate-gated ion channel activity(GO:0005234) |
| 0.0 | 0.3 | GO:0042605 | peptide antigen binding(GO:0042605) |
| 0.0 | 0.1 | GO:0042577 | lipid phosphatase activity(GO:0042577) |
| 0.0 | 0.1 | GO:0030628 | pre-mRNA 3'-splice site binding(GO:0030628) |
| 0.0 | 0.3 | GO:0003950 | NAD+ ADP-ribosyltransferase activity(GO:0003950) |
| 0.0 | 0.1 | GO:0061649 | ubiquitinated histone binding(GO:0061649) |
| 0.0 | 0.1 | GO:0001094 | TFIID-class transcription factor binding(GO:0001094) |
| 0.0 | 0.1 | GO:0004321 | fatty-acyl-CoA synthase activity(GO:0004321) |
| 0.0 | 2.0 | GO:0001078 | transcriptional repressor activity, RNA polymerase II core promoter proximal region sequence-specific binding(GO:0001078) |
| 0.0 | 0.1 | GO:0051575 | 5'-deoxyribose-5-phosphate lyase activity(GO:0051575) |
| 0.0 | 0.2 | GO:0001608 | G-protein coupled nucleotide receptor activity(GO:0001608) G-protein coupled purinergic nucleotide receptor activity(GO:0045028) |
| 0.0 | 0.1 | GO:0017153 | sodium:dicarboxylate symporter activity(GO:0017153) |
| 0.0 | 0.6 | GO:0043022 | ribosome binding(GO:0043022) |
| 0.0 | 0.1 | GO:0023026 | MHC class II protein complex binding(GO:0023026) |
| 0.0 | 0.3 | GO:0003887 | DNA-directed DNA polymerase activity(GO:0003887) |
| 0.0 | 0.8 | GO:0003725 | double-stranded RNA binding(GO:0003725) |
| 0.0 | 0.8 | GO:0002039 | p53 binding(GO:0002039) |
| 0.0 | 0.6 | GO:0017112 | Rab guanyl-nucleotide exchange factor activity(GO:0017112) |
| 0.0 | 0.2 | GO:0070628 | proteasome binding(GO:0070628) |
| 0.0 | 0.1 | GO:0047961 | glycine N-acyltransferase activity(GO:0047961) |
| 0.0 | 0.1 | GO:0000774 | adenyl-nucleotide exchange factor activity(GO:0000774) |
| 0.0 | 0.1 | GO:0001517 | N-acetylglucosamine 6-O-sulfotransferase activity(GO:0001517) |
Gene overrepresentation in curated gene sets: canonical pathways category:
| Log-likelihood per target | Total log-likelihood | Term | Description |
|---|---|---|---|
| 0.5 | 1.5 | PID AR NONGENOMIC PATHWAY | Nongenotropic Androgen signaling |
| 0.3 | 0.7 | PID GMCSF PATHWAY | GMCSF-mediated signaling events |
| 0.3 | 23.7 | PID HIV NEF PATHWAY | HIV-1 Nef: Negative effector of Fas and TNF-alpha |
| 0.3 | 7.6 | PID INTEGRIN5 PATHWAY | Beta5 beta6 beta7 and beta8 integrin cell surface interactions |
| 0.3 | 3.0 | ST TYPE I INTERFERON PATHWAY | Type I Interferon (alpha/beta IFN) Pathway |
| 0.2 | 8.7 | SIG IL4RECEPTOR IN B LYPHOCYTES | Genes related to IL4 rceptor signaling in B lymphocytes |
| 0.2 | 9.5 | PID SMAD2 3PATHWAY | Regulation of cytoplasmic and nuclear SMAD2/3 signaling |
| 0.2 | 8.1 | ST GAQ PATHWAY | G alpha q Pathway |
| 0.2 | 5.7 | PID IL5 PATHWAY | IL5-mediated signaling events |
| 0.2 | 2.6 | PID RET PATHWAY | Signaling events regulated by Ret tyrosine kinase |
| 0.2 | 3.3 | PID INTEGRIN4 PATHWAY | Alpha6 beta4 integrin-ligand interactions |
| 0.2 | 2.1 | PID IL12 STAT4 PATHWAY | IL12 signaling mediated by STAT4 |
| 0.2 | 14.0 | PID TAP63 PATHWAY | Validated transcriptional targets of TAp63 isoforms |
| 0.2 | 0.8 | ST JAK STAT PATHWAY | Jak-STAT Pathway |
| 0.1 | 6.9 | PID INTEGRIN2 PATHWAY | Beta2 integrin cell surface interactions |
| 0.1 | 4.2 | ST G ALPHA I PATHWAY | G alpha i Pathway |
| 0.1 | 4.5 | SA MMP CYTOKINE CONNECTION | Cytokines can induce activation of matrix metalloproteinases, which degrade extracellular matrix. |
| 0.1 | 1.1 | SA PROGRAMMED CELL DEATH | Programmed cell death, or apoptosis, eliminates damaged or unneeded cells. |
| 0.1 | 1.2 | SA PTEN PATHWAY | PTEN is a tumor suppressor that dephosphorylates the lipid messenger phosphatidylinositol triphosphate. |
| 0.1 | 3.5 | PID ARF 3PATHWAY | Arf1 pathway |
| 0.1 | 1.0 | PID THROMBIN PAR4 PATHWAY | PAR4-mediated thrombin signaling events |
| 0.1 | 3.0 | PID INSULIN GLUCOSE PATHWAY | Insulin-mediated glucose transport |
| 0.1 | 5.0 | PID INTEGRIN A9B1 PATHWAY | Alpha9 beta1 integrin signaling events |
| 0.1 | 0.8 | ST DIFFERENTIATION PATHWAY IN PC12 CELLS | Differentiation Pathway in PC12 Cells; this is a specific case of PAC1 Receptor Pathway. |
| 0.1 | 9.0 | PID FOXO PATHWAY | FoxO family signaling |
| 0.1 | 1.8 | PID RANBP2 PATHWAY | Sumoylation by RanBP2 regulates transcriptional repression |
| 0.1 | 5.5 | PID BMP PATHWAY | BMP receptor signaling |
| 0.1 | 4.0 | PID IL1 PATHWAY | IL1-mediated signaling events |
| 0.1 | 3.3 | NABA BASEMENT MEMBRANES | Genes encoding structural components of basement membranes |
| 0.1 | 4.2 | PID IL8 CXCR2 PATHWAY | IL8- and CXCR2-mediated signaling events |
| 0.1 | 1.4 | ST TUMOR NECROSIS FACTOR PATHWAY | Tumor Necrosis Factor Pathway. |
| 0.1 | 6.1 | PID SYNDECAN 1 PATHWAY | Syndecan-1-mediated signaling events |
| 0.1 | 2.9 | PID AMB2 NEUTROPHILS PATHWAY | amb2 Integrin signaling |
| 0.1 | 3.3 | PID WNT NONCANONICAL PATHWAY | Noncanonical Wnt signaling pathway |
| 0.1 | 1.0 | PID TCR CALCIUM PATHWAY | Calcium signaling in the CD4+ TCR pathway |
| 0.1 | 4.2 | PID TGFBR PATHWAY | TGF-beta receptor signaling |
| 0.1 | 0.8 | PID CD40 PATHWAY | CD40/CD40L signaling |
| 0.1 | 0.6 | PID ECADHERIN KERATINOCYTE PATHWAY | E-cadherin signaling in keratinocytes |
| 0.1 | 1.6 | PID PDGFRA PATHWAY | PDGFR-alpha signaling pathway |
| 0.1 | 2.2 | PID IL23 PATHWAY | IL23-mediated signaling events |
| 0.1 | 2.7 | PID ERBB1 DOWNSTREAM PATHWAY | ErbB1 downstream signaling |
| 0.1 | 2.2 | PID PI3KCI PATHWAY | Class I PI3K signaling events |
| 0.1 | 0.8 | PID FRA PATHWAY | Validated transcriptional targets of AP1 family members Fra1 and Fra2 |
| 0.1 | 1.1 | PID P38 GAMMA DELTA PATHWAY | Signaling mediated by p38-gamma and p38-delta |
| 0.1 | 0.6 | PID LYSOPHOSPHOLIPID PATHWAY | LPA receptor mediated events |
| 0.1 | 1.2 | PID MET PATHWAY | Signaling events mediated by Hepatocyte Growth Factor Receptor (c-Met) |
| 0.1 | 2.2 | PID MYC PATHWAY | C-MYC pathway |
| 0.1 | 0.7 | PID PI3KCI AKT PATHWAY | Class I PI3K signaling events mediated by Akt |
| 0.1 | 2.9 | PID DELTA NP63 PATHWAY | Validated transcriptional targets of deltaNp63 isoforms |
| 0.1 | 1.6 | PID PRL SIGNALING EVENTS PATHWAY | Signaling events mediated by PRL |
| 0.1 | 0.9 | SA G1 AND S PHASES | Cdk2, 4, and 6 bind cyclin D in G1, while cdk2/cyclin E promotes the G1/S transition. |
| 0.1 | 1.6 | SIG BCR SIGNALING PATHWAY | Members of the BCR signaling pathway |
| 0.1 | 2.8 | PID ECADHERIN NASCENT AJ PATHWAY | E-cadherin signaling in the nascent adherens junction |
| 0.1 | 3.0 | PID CD8 TCR DOWNSTREAM PATHWAY | Downstream signaling in naïve CD8+ T cells |
| 0.1 | 5.3 | PID RHOA REG PATHWAY | Regulation of RhoA activity |
| 0.1 | 0.2 | ST PAC1 RECEPTOR PATHWAY | PAC1 Receptor Pathway |
| 0.1 | 1.1 | PID INTEGRIN3 PATHWAY | Beta3 integrin cell surface interactions |
| 0.1 | 20.0 | NABA SECRETED FACTORS | Genes encoding secreted soluble factors |
| 0.1 | 0.1 | PID TRAIL PATHWAY | TRAIL signaling pathway |
| 0.0 | 0.4 | PID GLYPICAN 1PATHWAY | Glypican 1 network |
| 0.0 | 0.7 | PID IL12 2PATHWAY | IL12-mediated signaling events |
| 0.0 | 0.5 | PID BETA CATENIN DEG PATHWAY | Degradation of beta catenin |
| 0.0 | 2.4 | PID ATF2 PATHWAY | ATF-2 transcription factor network |
| 0.0 | 1.1 | SIG PIP3 SIGNALING IN CARDIAC MYOCTES | Genes related to PIP3 signaling in cardiac myocytes |
| 0.0 | 0.5 | ST GRANULE CELL SURVIVAL PATHWAY | Granule Cell Survival Pathway is a specific case of more general PAC1 Receptor Pathway. |
| 0.0 | 0.9 | PID UPA UPAR PATHWAY | Urokinase-type plasminogen activator (uPA) and uPAR-mediated signaling |
| 0.0 | 0.3 | PID WNT CANONICAL PATHWAY | Canonical Wnt signaling pathway |
| 0.0 | 0.4 | PID ENDOTHELIN PATHWAY | Endothelins |
| 0.0 | 1.5 | PID AJDISS 2PATHWAY | Posttranslational regulation of adherens junction stability and dissassembly |
| 0.0 | 0.3 | PID IFNG PATHWAY | IFN-gamma pathway |
| 0.0 | 3.4 | PID MYC ACTIV PATHWAY | Validated targets of C-MYC transcriptional activation |
| 0.0 | 0.7 | PID NFKAPPAB CANONICAL PATHWAY | Canonical NF-kappaB pathway |
| 0.0 | 0.5 | PID SYNDECAN 3 PATHWAY | Syndecan-3-mediated signaling events |
| 0.0 | 0.7 | PID DNA PK PATHWAY | DNA-PK pathway in nonhomologous end joining |
| 0.0 | 0.9 | PID RHOA PATHWAY | RhoA signaling pathway |
| 0.0 | 0.6 | PID P38 MKK3 6PATHWAY | p38 MAPK signaling pathway |
| 0.0 | 1.7 | PID LKB1 PATHWAY | LKB1 signaling events |
| 0.0 | 0.6 | PID CIRCADIAN PATHWAY | Circadian rhythm pathway |
| 0.0 | 1.3 | PID RAC1 PATHWAY | RAC1 signaling pathway |
| 0.0 | 0.2 | ST INTERFERON GAMMA PATHWAY | Interferon gamma pathway. |
| 0.0 | 1.2 | ST FAS SIGNALING PATHWAY | Fas Signaling Pathway |
| 0.0 | 0.7 | PID HIF1A PATHWAY | Hypoxic and oxygen homeostasis regulation of HIF-1-alpha |
| 0.0 | 1.0 | PID ECADHERIN STABILIZATION PATHWAY | Stabilization and expansion of the E-cadherin adherens junction |
| 0.0 | 0.2 | ST G ALPHA S PATHWAY | G alpha s Pathway |
| 0.0 | 0.8 | PID PS1 PATHWAY | Presenilin action in Notch and Wnt signaling |
| 0.0 | 0.1 | SIG INSULIN RECEPTOR PATHWAY IN CARDIAC MYOCYTES | Genes related to the insulin receptor pathway |
| 0.0 | 0.0 | PID EPHA2 FWD PATHWAY | EPHA2 forward signaling |
| 0.0 | 0.3 | NABA COLLAGENS | Genes encoding collagen proteins |
| 0.0 | 0.6 | PID FGF PATHWAY | FGF signaling pathway |
| 0.0 | 3.0 | PID P53 DOWNSTREAM PATHWAY | Direct p53 effectors |
| 0.0 | 0.5 | PID FCER1 PATHWAY | Fc-epsilon receptor I signaling in mast cells |
| 0.0 | 0.7 | PID REG GR PATHWAY | Glucocorticoid receptor regulatory network |
| 0.0 | 0.8 | PID RHODOPSIN PATHWAY | Visual signal transduction: Rods |
| 0.0 | 0.1 | ST MYOCYTE AD PATHWAY | Myocyte Adrenergic Pathway is a specific case of the generalized Adrenergic Pathway. |
| 0.0 | 0.0 | PID ER NONGENOMIC PATHWAY | Plasma membrane estrogen receptor signaling |
| 0.0 | 0.4 | PID FAK PATHWAY | Signaling events mediated by focal adhesion kinase |
| 0.0 | 0.2 | PID WNT SIGNALING PATHWAY | Wnt signaling network |
| 0.0 | 0.2 | PID IL3 PATHWAY | IL3-mediated signaling events |
| 0.0 | 0.1 | PID ERB GENOMIC PATHWAY | Validated nuclear estrogen receptor beta network |
| 0.0 | 0.2 | PID ATM PATHWAY | ATM pathway |
| 0.0 | 0.3 | PID REELIN PATHWAY | Reelin signaling pathway |
| 0.0 | 0.2 | PID AVB3 INTEGRIN PATHWAY | Integrins in angiogenesis |
| 0.0 | 0.0 | PID IL2 PI3K PATHWAY | IL2 signaling events mediated by PI3K |
| 0.0 | 0.4 | PID NFAT TFPATHWAY | Calcineurin-regulated NFAT-dependent transcription in lymphocytes |
| 0.0 | 0.2 | PID P38 MK2 PATHWAY | p38 signaling mediated by MAPKAP kinases |
| 0.0 | 2.4 | NABA ECM AFFILIATED | Genes encoding proteins affiliated structurally or functionally to extracellular matrix proteins |
Gene overrepresentation in curated gene sets: REACTOME pathways category:
| Log-likelihood per target | Total log-likelihood | Term | Description |
|---|---|---|---|
| 0.5 | 0.5 | REACTOME THROMBOXANE SIGNALLING THROUGH TP RECEPTOR | Genes involved in Thromboxane signalling through TP receptor |
| 0.4 | 4.4 | REACTOME ENDOSOMAL VACUOLAR PATHWAY | Genes involved in Endosomal/Vacuolar pathway |
| 0.3 | 38.1 | REACTOME INTERFERON GAMMA SIGNALING | Genes involved in Interferon gamma signaling |
| 0.3 | 6.1 | REACTOME IL 7 SIGNALING | Genes involved in Interleukin-7 signaling |
| 0.3 | 11.7 | REACTOME SIGNALING BY NODAL | Genes involved in Signaling by NODAL |
| 0.3 | 0.3 | REACTOME TRANSLOCATION OF ZAP 70 TO IMMUNOLOGICAL SYNAPSE | Genes involved in Translocation of ZAP-70 to Immunological synapse |
| 0.3 | 9.0 | REACTOME IL RECEPTOR SHC SIGNALING | Genes involved in Interleukin receptor SHC signaling |
| 0.2 | 6.3 | REACTOME CYTOSOLIC SULFONATION OF SMALL MOLECULES | Genes involved in Cytosolic sulfonation of small molecules |
| 0.2 | 2.9 | REACTOME OPSINS | Genes involved in Opsins |
| 0.2 | 2.6 | REACTOME COPI MEDIATED TRANSPORT | Genes involved in COPI Mediated Transport |
| 0.2 | 14.2 | REACTOME CHEMOKINE RECEPTORS BIND CHEMOKINES | Genes involved in Chemokine receptors bind chemokines |
| 0.2 | 1.0 | REACTOME P75NTR RECRUITS SIGNALLING COMPLEXES | Genes involved in p75NTR recruits signalling complexes |
| 0.2 | 0.4 | REACTOME THROMBIN SIGNALLING THROUGH PROTEINASE ACTIVATED RECEPTORS PARS | Genes involved in Thrombin signalling through proteinase activated receptors (PARs) |
| 0.2 | 13.2 | REACTOME INTERFERON ALPHA BETA SIGNALING | Genes involved in Interferon alpha/beta signaling |
| 0.2 | 3.7 | REACTOME TRANSPORT OF ORGANIC ANIONS | Genes involved in Transport of organic anions |
| 0.2 | 7.5 | REACTOME TAK1 ACTIVATES NFKB BY PHOSPHORYLATION AND ACTIVATION OF IKKS COMPLEX | Genes involved in TAK1 activates NFkB by phosphorylation and activation of IKKs complex |
| 0.2 | 5.4 | REACTOME EXTRINSIC PATHWAY FOR APOPTOSIS | Genes involved in Extrinsic Pathway for Apoptosis |
| 0.2 | 9.3 | REACTOME INTRINSIC PATHWAY FOR APOPTOSIS | Genes involved in Intrinsic Pathway for Apoptosis |
| 0.2 | 6.2 | REACTOME SYNTHESIS OF VERY LONG CHAIN FATTY ACYL COAS | Genes involved in Synthesis of very long-chain fatty acyl-CoAs |
| 0.2 | 3.9 | REACTOME ANTIGEN PRESENTATION FOLDING ASSEMBLY AND PEPTIDE LOADING OF CLASS I MHC | Genes involved in Antigen Presentation: Folding, assembly and peptide loading of class I MHC |
| 0.2 | 11.1 | REACTOME MITOCHONDRIAL PROTEIN IMPORT | Genes involved in Mitochondrial Protein Import |
| 0.2 | 2.7 | REACTOME P38MAPK EVENTS | Genes involved in p38MAPK events |
| 0.2 | 3.0 | REACTOME XENOBIOTICS | Genes involved in Xenobiotics |
| 0.2 | 5.3 | REACTOME NOD1 2 SIGNALING PATHWAY | Genes involved in NOD1/2 Signaling Pathway |
| 0.2 | 4.0 | REACTOME ABCA TRANSPORTERS IN LIPID HOMEOSTASIS | Genes involved in ABCA transporters in lipid homeostasis |
| 0.2 | 1.9 | REACTOME TRYPTOPHAN CATABOLISM | Genes involved in Tryptophan catabolism |
| 0.2 | 14.5 | REACTOME AMINO ACID AND OLIGOPEPTIDE SLC TRANSPORTERS | Genes involved in Amino acid and oligopeptide SLC transporters |
| 0.1 | 10.3 | REACTOME VIF MEDIATED DEGRADATION OF APOBEC3G | Genes involved in Vif-mediated degradation of APOBEC3G |
| 0.1 | 0.3 | REACTOME NEF MEDIATES DOWN MODULATION OF CELL SURFACE RECEPTORS BY RECRUITING THEM TO CLATHRIN ADAPTERS | Genes involved in Nef-mediates down modulation of cell surface receptors by recruiting them to clathrin adapters |
| 0.1 | 5.4 | REACTOME SIGNALING BY BMP | Genes involved in Signaling by BMP |
| 0.1 | 3.0 | REACTOME INITIAL TRIGGERING OF COMPLEMENT | Genes involved in Initial triggering of complement |
| 0.1 | 1.2 | REACTOME CYTOSOLIC TRNA AMINOACYLATION | Genes involved in Cytosolic tRNA aminoacylation |
| 0.1 | 1.8 | REACTOME GLUCOSE TRANSPORT | Genes involved in Glucose transport |
| 0.1 | 0.7 | REACTOME RAP1 SIGNALLING | Genes involved in Rap1 signalling |
| 0.1 | 1.3 | REACTOME MEMBRANE BINDING AND TARGETTING OF GAG PROTEINS | Genes involved in Membrane binding and targetting of GAG proteins |
| 0.1 | 6.1 | REACTOME CGMP EFFECTS | Genes involved in cGMP effects |
| 0.1 | 0.5 | REACTOME ERK MAPK TARGETS | Genes involved in ERK/MAPK targets |
| 0.1 | 3.2 | REACTOME RNA POL III CHAIN ELONGATION | Genes involved in RNA Polymerase III Chain Elongation |
| 0.1 | 1.3 | REACTOME ANTIGEN PROCESSING CROSS PRESENTATION | Genes involved in Antigen processing-Cross presentation |
| 0.1 | 5.6 | REACTOME ASSOCIATION OF TRIC CCT WITH TARGET PROTEINS DURING BIOSYNTHESIS | Genes involved in Association of TriC/CCT with target proteins during biosynthesis |
| 0.1 | 4.8 | REACTOME ACTIVATION OF GENES BY ATF4 | Genes involved in Activation of Genes by ATF4 |
| 0.1 | 2.8 | REACTOME FACILITATIVE NA INDEPENDENT GLUCOSE TRANSPORTERS | Genes involved in Facilitative Na+-independent glucose transporters |
| 0.1 | 1.6 | REACTOME SHC1 EVENTS IN EGFR SIGNALING | Genes involved in SHC1 events in EGFR signaling |
| 0.1 | 1.8 | REACTOME ANDROGEN BIOSYNTHESIS | Genes involved in Androgen biosynthesis |
| 0.1 | 1.9 | REACTOME SYNTHESIS OF SUBSTRATES IN N GLYCAN BIOSYTHESIS | Genes involved in Synthesis of substrates in N-glycan biosythesis |
| 0.1 | 0.2 | REACTOME LATENT INFECTION OF HOMO SAPIENS WITH MYCOBACTERIUM TUBERCULOSIS | Genes involved in Latent infection of Homo sapiens with Mycobacterium tuberculosis |
| 0.1 | 2.1 | REACTOME TRAF6 MEDIATED IRF7 ACTIVATION | Genes involved in TRAF6 mediated IRF7 activation |
| 0.1 | 1.6 | REACTOME SEROTONIN RECEPTORS | Genes involved in Serotonin receptors |
| 0.1 | 1.9 | REACTOME SYNTHESIS OF PIPS AT THE LATE ENDOSOME MEMBRANE | Genes involved in Synthesis of PIPs at the late endosome membrane |
| 0.1 | 1.3 | REACTOME HORMONE LIGAND BINDING RECEPTORS | Genes involved in Hormone ligand-binding receptors |
| 0.1 | 2.4 | REACTOME ACTIVATION OF RAC | Genes involved in Activation of Rac |
| 0.1 | 1.5 | REACTOME SPRY REGULATION OF FGF SIGNALING | Genes involved in Spry regulation of FGF signaling |
| 0.1 | 1.5 | REACTOME NEF MEDIATED DOWNREGULATION OF MHC CLASS I COMPLEX CELL SURFACE EXPRESSION | Genes involved in Nef mediated downregulation of MHC class I complex cell surface expression |
| 0.1 | 3.7 | REACTOME HORMONE SENSITIVE LIPASE HSL MEDIATED TRIACYLGLYCEROL HYDROLYSIS | Genes involved in Hormone-sensitive lipase (HSL)-mediated triacylglycerol hydrolysis |
| 0.1 | 0.3 | REACTOME SIGNALING BY EGFR IN CANCER | Genes involved in Signaling by EGFR in Cancer |
| 0.1 | 0.5 | REACTOME TETRAHYDROBIOPTERIN BH4 SYNTHESIS RECYCLING SALVAGE AND REGULATION | Genes involved in Tetrahydrobiopterin (BH4) synthesis, recycling, salvage and regulation |
| 0.1 | 7.5 | REACTOME VOLTAGE GATED POTASSIUM CHANNELS | Genes involved in Voltage gated Potassium channels |
| 0.1 | 1.4 | REACTOME ROLE OF DCC IN REGULATING APOPTOSIS | Genes involved in Role of DCC in regulating apoptosis |
| 0.1 | 2.9 | REACTOME BASIGIN INTERACTIONS | Genes involved in Basigin interactions |
| 0.1 | 3.3 | REACTOME PLATELET CALCIUM HOMEOSTASIS | Genes involved in Platelet calcium homeostasis |
| 0.1 | 1.7 | REACTOME REVERSIBLE HYDRATION OF CARBON DIOXIDE | Genes involved in Reversible Hydration of Carbon Dioxide |
| 0.1 | 0.3 | REACTOME FGFR4 LIGAND BINDING AND ACTIVATION | Genes involved in FGFR4 ligand binding and activation |
| 0.1 | 3.4 | REACTOME METAL ION SLC TRANSPORTERS | Genes involved in Metal ion SLC transporters |
| 0.1 | 5.6 | REACTOME STRIATED MUSCLE CONTRACTION | Genes involved in Striated Muscle Contraction |
| 0.1 | 2.7 | REACTOME RIG I MDA5 MEDIATED INDUCTION OF IFN ALPHA BETA PATHWAYS | Genes involved in RIG-I/MDA5 mediated induction of IFN-alpha/beta pathways |
| 0.1 | 3.7 | REACTOME A TETRASACCHARIDE LINKER SEQUENCE IS REQUIRED FOR GAG SYNTHESIS | Genes involved in A tetrasaccharide linker sequence is required for GAG synthesis |
| 0.1 | 1.5 | REACTOME FORMATION OF TUBULIN FOLDING INTERMEDIATES BY CCT TRIC | Genes involved in Formation of tubulin folding intermediates by CCT/TriC |
| 0.1 | 1.0 | REACTOME P53 DEPENDENT G1 DNA DAMAGE RESPONSE | Genes involved in p53-Dependent G1 DNA Damage Response |
| 0.1 | 2.5 | REACTOME INSULIN RECEPTOR RECYCLING | Genes involved in Insulin receptor recycling |
| 0.1 | 2.2 | REACTOME METABOLISM OF PORPHYRINS | Genes involved in Metabolism of porphyrins |
| 0.1 | 3.0 | REACTOME TIGHT JUNCTION INTERACTIONS | Genes involved in Tight junction interactions |
| 0.1 | 0.3 | REACTOME APC C CDH1 MEDIATED DEGRADATION OF CDC20 AND OTHER APC C CDH1 TARGETED PROTEINS IN LATE MITOSIS EARLY G1 | Genes involved in APC/C:Cdh1 mediated degradation of Cdc20 and other APC/C:Cdh1 targeted proteins in late mitosis/early G1 |
| 0.1 | 0.5 | REACTOME IRON UPTAKE AND TRANSPORT | Genes involved in Iron uptake and transport |
| 0.1 | 1.4 | REACTOME SHC1 EVENTS IN ERBB4 SIGNALING | Genes involved in SHC1 events in ERBB4 signaling |
| 0.1 | 0.9 | REACTOME EGFR DOWNREGULATION | Genes involved in EGFR downregulation |
| 0.1 | 1.2 | REACTOME SYNTHESIS OF PIPS AT THE GOLGI MEMBRANE | Genes involved in Synthesis of PIPs at the Golgi membrane |
| 0.1 | 0.6 | REACTOME ERKS ARE INACTIVATED | Genes involved in ERKs are inactivated |
| 0.1 | 1.1 | REACTOME TANDEM PORE DOMAIN POTASSIUM CHANNELS | Genes involved in Tandem pore domain potassium channels |
| 0.1 | 2.7 | REACTOME CELL CELL JUNCTION ORGANIZATION | Genes involved in Cell-cell junction organization |
| 0.1 | 1.4 | REACTOME FGFR2C LIGAND BINDING AND ACTIVATION | Genes involved in FGFR2c ligand binding and activation |
| 0.1 | 4.3 | REACTOME POTASSIUM CHANNELS | Genes involved in Potassium Channels |
| 0.1 | 0.2 | REACTOME ACTIVATED POINT MUTANTS OF FGFR2 | Genes involved in Activated point mutants of FGFR2 |
| 0.1 | 0.6 | REACTOME RNA POL III TRANSCRIPTION INITIATION FROM TYPE 3 PROMOTER | Genes involved in RNA Polymerase III Transcription Initiation From Type 3 Promoter |
| 0.1 | 0.3 | REACTOME ROLE OF SECOND MESSENGERS IN NETRIN1 SIGNALING | Genes involved in Role of second messengers in netrin-1 signaling |
| 0.1 | 2.7 | REACTOME GLYCOLYSIS | Genes involved in Glycolysis |
| 0.1 | 0.1 | REACTOME SYNTHESIS SECRETION AND INACTIVATION OF GLP1 | Genes involved in Synthesis, Secretion, and Inactivation of Glucagon-like Peptide-1 (GLP-1) |
| 0.1 | 0.1 | REACTOME CREB PHOSPHORYLATION THROUGH THE ACTIVATION OF RAS | Genes involved in CREB phosphorylation through the activation of Ras |
| 0.1 | 1.3 | REACTOME INTRINSIC PATHWAY | Genes involved in Intrinsic Pathway |
| 0.1 | 1.5 | REACTOME TRAFFICKING OF GLUR2 CONTAINING AMPA RECEPTORS | Genes involved in Trafficking of GluR2-containing AMPA receptors |
| 0.1 | 0.4 | REACTOME INFLUENZA VIRAL RNA TRANSCRIPTION AND REPLICATION | Genes involved in Influenza Viral RNA Transcription and Replication |
| 0.1 | 0.9 | REACTOME IL 3 5 AND GM CSF SIGNALING | Genes involved in Interleukin-3, 5 and GM-CSF signaling |
| 0.0 | 1.0 | REACTOME METABOLISM OF POLYAMINES | Genes involved in Metabolism of polyamines |
| 0.0 | 0.2 | REACTOME ER PHAGOSOME PATHWAY | Genes involved in ER-Phagosome pathway |
| 0.0 | 0.7 | REACTOME CD28 DEPENDENT VAV1 PATHWAY | Genes involved in CD28 dependent Vav1 pathway |
| 0.0 | 0.5 | REACTOME SCF BETA TRCP MEDIATED DEGRADATION OF EMI1 | Genes involved in SCF-beta-TrCP mediated degradation of Emi1 |
| 0.0 | 1.3 | REACTOME SYNTHESIS OF PC | Genes involved in Synthesis of PC |
| 0.0 | 0.6 | REACTOME VEGF LIGAND RECEPTOR INTERACTIONS | Genes involved in VEGF ligand-receptor interactions |
| 0.0 | 0.7 | REACTOME YAP1 AND WWTR1 TAZ STIMULATED GENE EXPRESSION | Genes involved in YAP1- and WWTR1 (TAZ)-stimulated gene expression |
| 0.0 | 1.7 | REACTOME SEMA4D INDUCED CELL MIGRATION AND GROWTH CONE COLLAPSE | Genes involved in Sema4D induced cell migration and growth-cone collapse |
| 0.0 | 0.4 | REACTOME ADENYLATE CYCLASE ACTIVATING PATHWAY | Genes involved in Adenylate cyclase activating pathway |
| 0.0 | 0.1 | REACTOME NRAGE SIGNALS DEATH THROUGH JNK | Genes involved in NRAGE signals death through JNK |
| 0.0 | 0.8 | REACTOME GAP JUNCTION DEGRADATION | Genes involved in Gap junction degradation |
| 0.0 | 0.9 | REACTOME N GLYCAN ANTENNAE ELONGATION | Genes involved in N-Glycan antennae elongation |
| 0.0 | 0.2 | REACTOME TRANSFERRIN ENDOCYTOSIS AND RECYCLING | Genes involved in Transferrin endocytosis and recycling |
| 0.0 | 0.7 | REACTOME MTORC1 MEDIATED SIGNALLING | Genes involved in mTORC1-mediated signalling |
| 0.0 | 1.2 | REACTOME ACTIVATED NOTCH1 TRANSMITS SIGNAL TO THE NUCLEUS | Genes involved in Activated NOTCH1 Transmits Signal to the Nucleus |
| 0.0 | 0.7 | REACTOME CHYLOMICRON MEDIATED LIPID TRANSPORT | Genes involved in Chylomicron-mediated lipid transport |
| 0.0 | 0.8 | REACTOME HS GAG BIOSYNTHESIS | Genes involved in HS-GAG biosynthesis |
| 0.0 | 0.5 | REACTOME REGULATION OF INSULIN SECRETION BY ACETYLCHOLINE | Genes involved in Regulation of Insulin Secretion by Acetylcholine |
| 0.0 | 0.6 | REACTOME NONSENSE MEDIATED DECAY ENHANCED BY THE EXON JUNCTION COMPLEX | Genes involved in Nonsense Mediated Decay Enhanced by the Exon Junction Complex |
| 0.0 | 2.5 | REACTOME CIRCADIAN CLOCK | Genes involved in Circadian Clock |
| 0.0 | 2.2 | REACTOME ACTIVATION OF CHAPERONE GENES BY XBP1S | Genes involved in Activation of Chaperone Genes by XBP1(S) |
| 0.0 | 0.3 | REACTOME INTEGRATION OF ENERGY METABOLISM | Genes involved in Integration of energy metabolism |
| 0.0 | 2.5 | REACTOME HOST INTERACTIONS OF HIV FACTORS | Genes involved in Host Interactions of HIV factors |
| 0.0 | 0.4 | REACTOME TGF BETA RECEPTOR SIGNALING IN EMT EPITHELIAL TO MESENCHYMAL TRANSITION | Genes involved in TGF-beta receptor signaling in EMT (epithelial to mesenchymal transition) |
| 0.0 | 0.6 | REACTOME CHONDROITIN SULFATE BIOSYNTHESIS | Genes involved in Chondroitin sulfate biosynthesis |
| 0.0 | 0.6 | REACTOME MICRORNA MIRNA BIOGENESIS | Genes involved in MicroRNA (miRNA) Biogenesis |
| 0.0 | 0.2 | REACTOME INHIBITION OF REPLICATION INITIATION OF DAMAGED DNA BY RB1 E2F1 | Genes involved in Inhibition of replication initiation of damaged DNA by RB1/E2F1 |
| 0.0 | 0.3 | REACTOME PACKAGING OF TELOMERE ENDS | Genes involved in Packaging Of Telomere Ends |
| 0.0 | 1.0 | REACTOME AMINE COMPOUND SLC TRANSPORTERS | Genes involved in Amine compound SLC transporters |
| 0.0 | 1.3 | REACTOME CELL JUNCTION ORGANIZATION | Genes involved in Cell junction organization |
| 0.0 | 1.0 | REACTOME GABA A RECEPTOR ACTIVATION | Genes involved in GABA A receptor activation |
| 0.0 | 0.5 | REACTOME APOPTOTIC CLEAVAGE OF CELL ADHESION PROTEINS | Genes involved in Apoptotic cleavage of cell adhesion proteins |
| 0.0 | 0.8 | REACTOME TERMINATION OF O GLYCAN BIOSYNTHESIS | Genes involved in Termination of O-glycan biosynthesis |
| 0.0 | 1.3 | REACTOME DOWNSTREAM SIGNAL TRANSDUCTION | Genes involved in Downstream signal transduction |
| 0.0 | 0.8 | REACTOME IONOTROPIC ACTIVITY OF KAINATE RECEPTORS | Genes involved in Ionotropic activity of Kainate Receptors |
| 0.0 | 0.4 | REACTOME GPVI MEDIATED ACTIVATION CASCADE | Genes involved in GPVI-mediated activation cascade |
| 0.0 | 0.6 | REACTOME RAS ACTIVATION UOPN CA2 INFUX THROUGH NMDA RECEPTOR | Genes involved in Ras activation uopn Ca2+ infux through NMDA receptor |
| 0.0 | 0.1 | REACTOME PHOSPHOLIPASE C MEDIATED CASCADE | Genes involved in Phospholipase C-mediated cascade |
| 0.0 | 0.4 | REACTOME CYCLIN E ASSOCIATED EVENTS DURING G1 S TRANSITION | Genes involved in Cyclin E associated events during G1/S transition |
| 0.0 | 0.3 | REACTOME RNA POL I TRANSCRIPTION TERMINATION | Genes involved in RNA Polymerase I Transcription Termination |
| 0.0 | 0.8 | REACTOME DEADENYLATION OF MRNA | Genes involved in Deadenylation of mRNA |
| 0.0 | 0.6 | REACTOME CRMPS IN SEMA3A SIGNALING | Genes involved in CRMPs in Sema3A signaling |
| 0.0 | 0.7 | REACTOME IL1 SIGNALING | Genes involved in Interleukin-1 signaling |
| 0.0 | 0.6 | REACTOME REGULATION OF MRNA STABILITY BY PROTEINS THAT BIND AU RICH ELEMENTS | Genes involved in Regulation of mRNA Stability by Proteins that Bind AU-rich Elements |
| 0.0 | 0.1 | REACTOME ACYL CHAIN REMODELLING OF PG | Genes involved in Acyl chain remodelling of PG |
| 0.0 | 3.5 | REACTOME OLFACTORY SIGNALING PATHWAY | Genes involved in Olfactory Signaling Pathway |
| 0.0 | 0.7 | REACTOME TRANSPORT OF VITAMINS NUCLEOSIDES AND RELATED MOLECULES | Genes involved in Transport of vitamins, nucleosides, and related molecules |
| 0.0 | 0.4 | REACTOME NEPHRIN INTERACTIONS | Genes involved in Nephrin interactions |
| 0.0 | 1.5 | REACTOME TRANSPORT OF INORGANIC CATIONS ANIONS AND AMINO ACIDS OLIGOPEPTIDES | Genes involved in Transport of inorganic cations/anions and amino acids/oligopeptides |
| 0.0 | 0.5 | REACTOME MRNA CAPPING | Genes involved in mRNA Capping |
| 0.0 | 0.7 | REACTOME REGULATION OF GENE EXPRESSION IN BETA CELLS | Genes involved in Regulation of gene expression in beta cells |
| 0.0 | 0.3 | REACTOME ABACAVIR TRANSPORT AND METABOLISM | Genes involved in Abacavir transport and metabolism |
| 0.0 | 0.4 | REACTOME P2Y RECEPTORS | Genes involved in P2Y receptors |
| 0.0 | 0.3 | REACTOME P75 NTR RECEPTOR MEDIATED SIGNALLING | Genes involved in p75 NTR receptor-mediated signalling |
| 0.0 | 1.5 | REACTOME MHC CLASS II ANTIGEN PRESENTATION | Genes involved in MHC class II antigen presentation |
| 0.0 | 0.5 | REACTOME INTERFERON SIGNALING | Genes involved in Interferon Signaling |
| 0.0 | 0.4 | REACTOME STEROID HORMONES | Genes involved in Steroid hormones |
| 0.0 | 0.6 | REACTOME DARPP 32 EVENTS | Genes involved in DARPP-32 events |
| 0.0 | 0.2 | REACTOME CDC6 ASSOCIATION WITH THE ORC ORIGIN COMPLEX | Genes involved in CDC6 association with the ORC:origin complex |
| 0.0 | 2.1 | REACTOME METABOLISM OF NUCLEOTIDES | Genes involved in Metabolism of nucleotides |
| 0.0 | 1.7 | REACTOME L1CAM INTERACTIONS | Genes involved in L1CAM interactions |
| 0.0 | 1.2 | REACTOME METABOLISM OF VITAMINS AND COFACTORS | Genes involved in Metabolism of vitamins and cofactors |
| 0.0 | 0.1 | REACTOME METABOLISM OF STEROID HORMONES AND VITAMINS A AND D | Genes involved in Metabolism of steroid hormones and vitamins A and D |
| 0.0 | 0.3 | REACTOME OTHER SEMAPHORIN INTERACTIONS | Genes involved in Other semaphorin interactions |
| 0.0 | 0.4 | REACTOME COSTIMULATION BY THE CD28 FAMILY | Genes involved in Costimulation by the CD28 family |
| 0.0 | 0.1 | REACTOME SLBP DEPENDENT PROCESSING OF REPLICATION DEPENDENT HISTONE PRE MRNAS | Genes involved in SLBP Dependent Processing of Replication-Dependent Histone Pre-mRNAs |
| 0.0 | 0.4 | REACTOME BETA DEFENSINS | Genes involved in Beta defensins |
| 0.0 | 0.2 | REACTOME SIGNALING BY PDGF | Genes involved in Signaling by PDGF |
| 0.0 | 0.5 | REACTOME NCAM1 INTERACTIONS | Genes involved in NCAM1 interactions |
| 0.0 | 0.5 | REACTOME MEIOTIC SYNAPSIS | Genes involved in Meiotic Synapsis |
| 0.0 | 0.3 | REACTOME METABOLISM OF NON CODING RNA | Genes involved in Metabolism of non-coding RNA |
| 0.0 | 0.0 | REACTOME PLATELET AGGREGATION PLUG FORMATION | Genes involved in Platelet Aggregation (Plug Formation) |
| 0.0 | 0.2 | REACTOME MRNA DECAY BY 5 TO 3 EXORIBONUCLEASE | Genes involved in mRNA Decay by 5' to 3' Exoribonuclease |
| 0.0 | 2.5 | REACTOME CLASS A1 RHODOPSIN LIKE RECEPTORS | Genes involved in Class A/1 (Rhodopsin-like receptors) |
| 0.0 | 0.4 | REACTOME ION TRANSPORT BY P TYPE ATPASES | Genes involved in Ion transport by P-type ATPases |
| 0.0 | 0.4 | REACTOME POST TRANSLATIONAL MODIFICATION SYNTHESIS OF GPI ANCHORED PROTEINS | Genes involved in Post-translational modification: synthesis of GPI-anchored proteins |
| 0.0 | 1.4 | REACTOME MRNA PROCESSING | Genes involved in mRNA Processing |