Project
Inflammatory response time course, HUVEC (Wada, 2009)
Navigation
Downloads
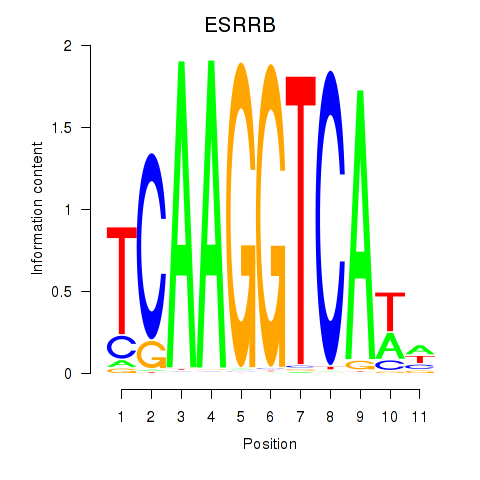
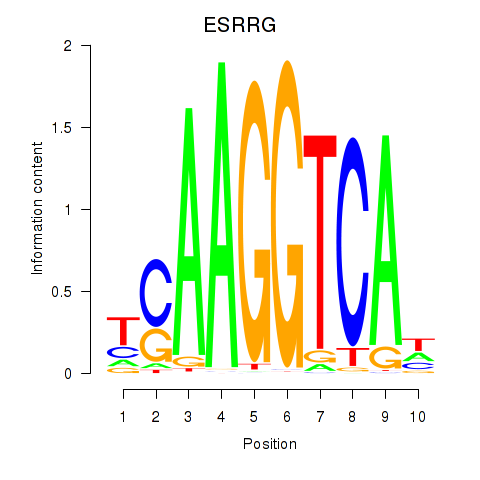
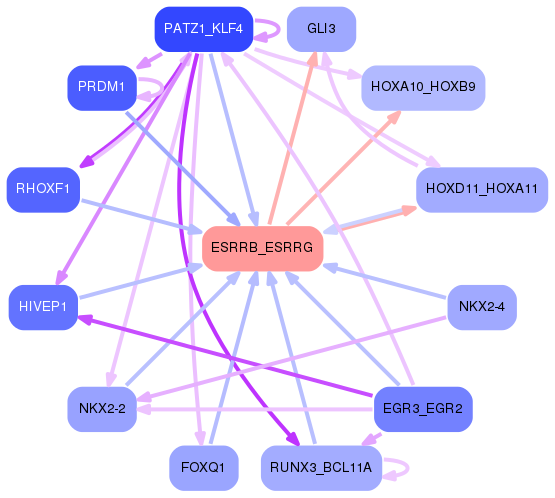
Results for ESRRB_ESRRG
Z-value: 0.85
Motif logo
Transcription factors associated with ESRRB_ESRRG
| Gene Symbol | Gene ID | Gene Info |
|---|---|---|
|
ESRRB
|
ENSG00000119715.15 | ESRRB |
|
ESRRG
|
ENSG00000196482.18 | ESRRG |
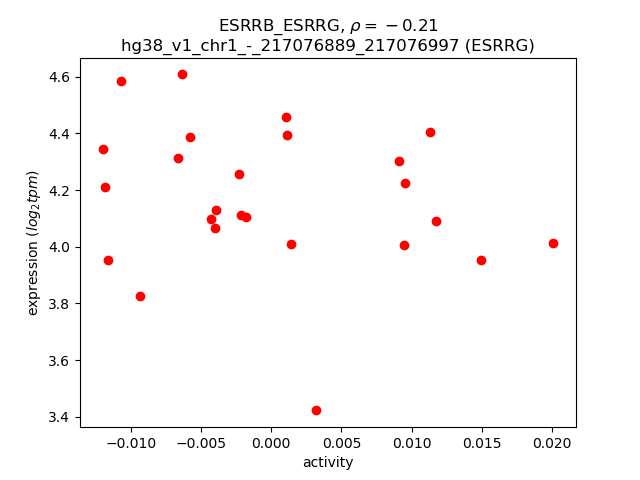
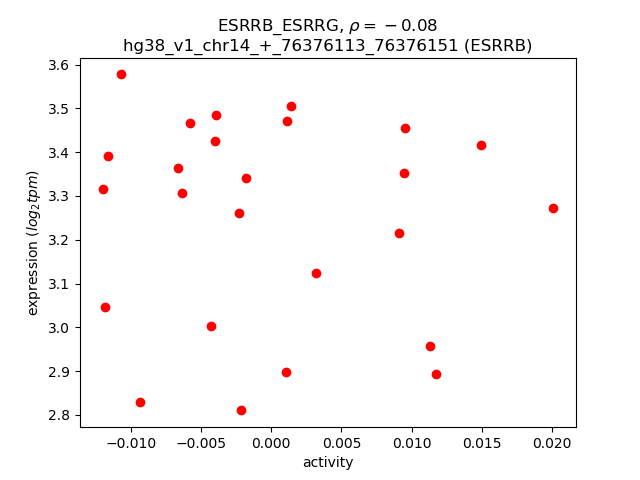
Activity-expression correlation:
| Gene | Promoter | Pearson corr. coef. | P-value | Plot |
|---|---|---|---|---|
| ESRRG | hg38_v1_chr1_-_217076889_217076997 | -0.21 | 3.0e-01 | Click! |
| ESRRB | hg38_v1_chr14_+_76376113_76376151 | -0.08 | 7.2e-01 | Click! |
Activity profile of ESRRB_ESRRG motif
Sorted Z-values of ESRRB_ESRRG motif
Network of associatons between targets according to the STRING database.

First level regulatory network of ESRRB_ESRRG
Gene Ontology Analysis
Gene overrepresentation in biological process category:
| Log-likelihood per target | Total log-likelihood | Term | Description |
|---|---|---|---|
| 0.5 | 3.7 | GO:0060414 | aorta smooth muscle tissue morphogenesis(GO:0060414) |
| 0.4 | 1.3 | GO:0006500 | N-terminal protein palmitoylation(GO:0006500) |
| 0.3 | 0.9 | GO:0021503 | neural fold bending(GO:0021503) |
| 0.3 | 2.7 | GO:0045039 | protein import into mitochondrial inner membrane(GO:0045039) |
| 0.2 | 0.7 | GO:0009386 | translational attenuation(GO:0009386) |
| 0.2 | 1.0 | GO:0055011 | atrial cardiac muscle cell differentiation(GO:0055011) atrial cardiac muscle cell development(GO:0055014) |
| 0.2 | 0.7 | GO:0060367 | subpallium cell proliferation in forebrain(GO:0022012) lateral ganglionic eminence cell proliferation(GO:0022018) lambdoid suture morphogenesis(GO:0060366) sagittal suture morphogenesis(GO:0060367) anterior semicircular canal development(GO:0060873) lateral semicircular canal development(GO:0060875) |
| 0.2 | 0.7 | GO:0006106 | fumarate metabolic process(GO:0006106) |
| 0.2 | 0.7 | GO:0000961 | negative regulation of mitochondrial RNA catabolic process(GO:0000961) |
| 0.2 | 0.8 | GO:1903352 | L-ornithine transmembrane transport(GO:1903352) |
| 0.1 | 0.6 | GO:0006121 | mitochondrial electron transport, succinate to ubiquinone(GO:0006121) |
| 0.1 | 0.6 | GO:0046166 | glyceraldehyde-3-phosphate biosynthetic process(GO:0046166) |
| 0.1 | 0.4 | GO:0035674 | tricarboxylic acid transmembrane transport(GO:0035674) |
| 0.1 | 0.5 | GO:2000983 | regulation of ATP citrate synthase activity(GO:2000983) negative regulation of ATP citrate synthase activity(GO:2000984) |
| 0.1 | 0.2 | GO:0034165 | positive regulation of toll-like receptor 9 signaling pathway(GO:0034165) |
| 0.1 | 0.3 | GO:0048162 | preantral ovarian follicle growth(GO:0001546) multi-layer follicle stage(GO:0048162) |
| 0.1 | 0.4 | GO:0035606 | peptidyl-cysteine S-trans-nitrosylation(GO:0035606) |
| 0.1 | 0.4 | GO:0030961 | peptidyl-arginine hydroxylation(GO:0030961) |
| 0.1 | 0.5 | GO:0006177 | GMP biosynthetic process(GO:0006177) |
| 0.1 | 0.9 | GO:0002175 | protein localization to paranode region of axon(GO:0002175) |
| 0.1 | 0.4 | GO:0010902 | positive regulation of very-low-density lipoprotein particle remodeling(GO:0010902) |
| 0.1 | 0.3 | GO:0060382 | release from viral latency(GO:0019046) regulation of DNA strand elongation(GO:0060382) |
| 0.1 | 0.3 | GO:0030037 | actin filament reorganization involved in cell cycle(GO:0030037) |
| 0.1 | 0.3 | GO:0002636 | positive regulation of germinal center formation(GO:0002636) |
| 0.1 | 0.4 | GO:0044240 | multicellular organism lipid catabolic process(GO:0044240) |
| 0.1 | 0.2 | GO:0045041 | protein import into mitochondrial intermembrane space(GO:0045041) |
| 0.1 | 0.5 | GO:0008218 | bioluminescence(GO:0008218) |
| 0.1 | 0.6 | GO:0061709 | reticulophagy(GO:0061709) |
| 0.1 | 0.8 | GO:2000348 | regulation of CD40 signaling pathway(GO:2000348) |
| 0.1 | 0.3 | GO:1990166 | protein localization to site of double-strand break(GO:1990166) |
| 0.1 | 0.6 | GO:0042866 | pyruvate biosynthetic process(GO:0042866) |
| 0.1 | 0.2 | GO:0071963 | establishment or maintenance of cell polarity regulating cell shape(GO:0071963) |
| 0.1 | 0.4 | GO:1903998 | regulation of eating behavior(GO:1903998) |
| 0.1 | 0.8 | GO:0098735 | positive regulation of the force of heart contraction(GO:0098735) |
| 0.1 | 0.4 | GO:0021966 | corticospinal neuron axon guidance(GO:0021966) |
| 0.1 | 0.6 | GO:0045602 | negative regulation of endothelial cell differentiation(GO:0045602) |
| 0.1 | 0.1 | GO:0002339 | B cell selection(GO:0002339) |
| 0.1 | 0.2 | GO:0071816 | tail-anchored membrane protein insertion into ER membrane(GO:0071816) |
| 0.1 | 0.5 | GO:0009438 | methylglyoxal metabolic process(GO:0009438) |
| 0.1 | 0.2 | GO:0051695 | actin filament uncapping(GO:0051695) |
| 0.1 | 1.2 | GO:1904714 | regulation of chaperone-mediated autophagy(GO:1904714) |
| 0.1 | 0.5 | GO:1901098 | positive regulation of autophagosome maturation(GO:1901098) |
| 0.1 | 0.2 | GO:0006781 | succinyl-CoA pathway(GO:0006781) |
| 0.1 | 1.0 | GO:0070072 | proton-transporting V-type ATPase complex assembly(GO:0070070) vacuolar proton-transporting V-type ATPase complex assembly(GO:0070072) |
| 0.1 | 0.5 | GO:0035507 | regulation of myosin-light-chain-phosphatase activity(GO:0035507) |
| 0.1 | 0.3 | GO:1900063 | regulation of peroxisome organization(GO:1900063) |
| 0.1 | 0.2 | GO:0071284 | cellular response to lead ion(GO:0071284) |
| 0.1 | 0.3 | GO:0009644 | response to high light intensity(GO:0009644) |
| 0.1 | 0.2 | GO:1990258 | box C/D snoRNA 3'-end processing(GO:0000494) box C/D snoRNA metabolic process(GO:0033967) box C/D snoRNA processing(GO:0034963) histone glutamine methylation(GO:1990258) |
| 0.1 | 0.2 | GO:2001287 | negative regulation of caveolin-mediated endocytosis(GO:2001287) |
| 0.1 | 0.4 | GO:0030450 | regulation of complement activation, classical pathway(GO:0030450) negative regulation of complement activation, classical pathway(GO:0045959) |
| 0.1 | 0.4 | GO:0072383 | plus-end-directed vesicle transport along microtubule(GO:0072383) |
| 0.0 | 0.1 | GO:0003192 | mitral valve formation(GO:0003192) |
| 0.0 | 1.1 | GO:1901897 | regulation of relaxation of cardiac muscle(GO:1901897) |
| 0.0 | 2.3 | GO:0030262 | apoptotic nuclear changes(GO:0030262) |
| 0.0 | 0.1 | GO:0010748 | regulation of plasma membrane long-chain fatty acid transport(GO:0010746) negative regulation of plasma membrane long-chain fatty acid transport(GO:0010748) regulation of I-kappaB phosphorylation(GO:1903719) positive regulation of I-kappaB phosphorylation(GO:1903721) |
| 0.0 | 0.2 | GO:0035519 | protein K29-linked ubiquitination(GO:0035519) |
| 0.0 | 0.3 | GO:0010731 | protein glutathionylation(GO:0010731) regulation of protein glutathionylation(GO:0010732) negative regulation of protein glutathionylation(GO:0010734) |
| 0.0 | 0.6 | GO:0051599 | response to hydrostatic pressure(GO:0051599) |
| 0.0 | 0.3 | GO:0033132 | negative regulation of glucokinase activity(GO:0033132) negative regulation of hexokinase activity(GO:1903300) |
| 0.0 | 1.6 | GO:0018345 | protein palmitoylation(GO:0018345) |
| 0.0 | 0.7 | GO:0031115 | negative regulation of microtubule polymerization(GO:0031115) |
| 0.0 | 0.3 | GO:0097461 | ferric iron import into cell(GO:0097461) ferric iron import across plasma membrane(GO:0098706) |
| 0.0 | 0.1 | GO:1903015 | regulation of exo-alpha-sialidase activity(GO:1903015) |
| 0.0 | 0.3 | GO:0070269 | pyroptosis(GO:0070269) |
| 0.0 | 0.2 | GO:0014886 | transition between slow and fast fiber(GO:0014886) |
| 0.0 | 0.2 | GO:0015015 | heparan sulfate proteoglycan biosynthetic process, enzymatic modification(GO:0015015) |
| 0.0 | 0.2 | GO:0006196 | AMP catabolic process(GO:0006196) |
| 0.0 | 0.4 | GO:0014809 | regulation of skeletal muscle contraction by regulation of release of sequestered calcium ion(GO:0014809) |
| 0.0 | 0.3 | GO:0072656 | maintenance of protein location in mitochondrion(GO:0072656) |
| 0.0 | 0.4 | GO:0019368 | fatty acid elongation, saturated fatty acid(GO:0019367) fatty acid elongation, unsaturated fatty acid(GO:0019368) fatty acid elongation, monounsaturated fatty acid(GO:0034625) fatty acid elongation, polyunsaturated fatty acid(GO:0034626) |
| 0.0 | 0.4 | GO:0043950 | positive regulation of cAMP-mediated signaling(GO:0043950) |
| 0.0 | 0.2 | GO:1904304 | regulation of gastro-intestinal system smooth muscle contraction(GO:1904304) positive regulation of gastro-intestinal system smooth muscle contraction(GO:1904306) |
| 0.0 | 0.1 | GO:0043465 | fermentation(GO:0006113) regulation of fermentation(GO:0043465) |
| 0.0 | 0.1 | GO:0038098 | sequestering of BMP from receptor via BMP binding(GO:0038098) |
| 0.0 | 0.1 | GO:2000314 | regulation of neural crest formation(GO:0090299) negative regulation of neural crest formation(GO:0090301) negative regulation of fibroblast growth factor receptor signaling pathway involved in neural plate anterior/posterior pattern formation(GO:2000314) |
| 0.0 | 0.5 | GO:0042407 | cristae formation(GO:0042407) |
| 0.0 | 0.6 | GO:0040033 | miRNA mediated inhibition of translation(GO:0035278) negative regulation of translation, ncRNA-mediated(GO:0040033) regulation of translation, ncRNA-mediated(GO:0045974) |
| 0.0 | 0.1 | GO:0017055 | negative regulation of RNA polymerase II transcriptional preinitiation complex assembly(GO:0017055) |
| 0.0 | 0.1 | GO:0052509 | induction by symbiont of host defense response(GO:0044416) induction of host immune response by virus(GO:0046730) active induction of host immune response by virus(GO:0046732) modulation by symbiont of host defense response(GO:0052031) induction by organism of defense response of other organism involved in symbiotic interaction(GO:0052251) modulation by organism of defense response of other organism involved in symbiotic interaction(GO:0052255) positive regulation by symbiont of host defense response(GO:0052509) positive regulation by organism of defense response of other organism involved in symbiotic interaction(GO:0052510) modulation by organism of immune response of other organism involved in symbiotic interaction(GO:0052552) modulation by symbiont of host immune response(GO:0052553) modulation by virus of host immune response(GO:0075528) |
| 0.0 | 0.5 | GO:0090385 | phagosome-lysosome fusion(GO:0090385) |
| 0.0 | 0.1 | GO:0009405 | pathogenesis(GO:0009405) |
| 0.0 | 0.2 | GO:0034316 | negative regulation of Arp2/3 complex-mediated actin nucleation(GO:0034316) |
| 0.0 | 0.1 | GO:0033387 | putrescine biosynthetic process from ornithine(GO:0033387) |
| 0.0 | 0.3 | GO:0061732 | mitochondrial acetyl-CoA biosynthetic process from pyruvate(GO:0061732) |
| 0.0 | 0.2 | GO:0043456 | regulation of pentose-phosphate shunt(GO:0043456) |
| 0.0 | 0.1 | GO:0006480 | N-terminal protein amino acid methylation(GO:0006480) N-terminal peptidyl-alanine methylation(GO:0018011) N-terminal peptidyl-alanine trimethylation(GO:0018012) N-terminal peptidyl-glycine methylation(GO:0018013) N-terminal peptidyl-proline dimethylation(GO:0018016) peptidyl-alanine modification(GO:0018194) N-terminal peptidyl-proline methylation(GO:0035568) N-terminal peptidyl-serine methylation(GO:0035570) N-terminal peptidyl-serine dimethylation(GO:0035572) N-terminal peptidyl-serine trimethylation(GO:0035573) |
| 0.0 | 0.1 | GO:1901671 | positive regulation of superoxide dismutase activity(GO:1901671) regulation of calcium-dependent ATPase activity(GO:1903610) negative regulation of calcium-dependent ATPase activity(GO:1903611) negative regulation of DNA catabolic process(GO:1903625) regulation of dUTP diphosphatase activity(GO:1903627) positive regulation of dUTP diphosphatase activity(GO:1903629) negative regulation of aminoacyl-tRNA ligase activity(GO:1903631) regulation of leucine-tRNA ligase activity(GO:1903633) negative regulation of leucine-tRNA ligase activity(GO:1903634) positive regulation of removal of superoxide radicals(GO:1904833) |
| 0.0 | 0.1 | GO:1990928 | response to amino acid starvation(GO:1990928) |
| 0.0 | 0.4 | GO:0000290 | deadenylation-dependent decapping of nuclear-transcribed mRNA(GO:0000290) |
| 0.0 | 0.1 | GO:2000296 | regulation of hydrogen peroxide catabolic process(GO:2000295) negative regulation of hydrogen peroxide catabolic process(GO:2000296) regulation of oxygen metabolic process(GO:2000374) |
| 0.0 | 0.4 | GO:0030210 | heparin metabolic process(GO:0030202) heparin biosynthetic process(GO:0030210) |
| 0.0 | 0.1 | GO:0007206 | phospholipase C-activating G-protein coupled glutamate receptor signaling pathway(GO:0007206) |
| 0.0 | 0.4 | GO:1901387 | positive regulation of voltage-gated calcium channel activity(GO:1901387) |
| 0.0 | 0.5 | GO:0006782 | protoporphyrinogen IX biosynthetic process(GO:0006782) |
| 0.0 | 0.2 | GO:0097460 | ferrous iron import into cell(GO:0097460) ferrous iron import across plasma membrane(GO:0098707) |
| 0.0 | 0.5 | GO:0060712 | spongiotrophoblast layer development(GO:0060712) |
| 0.0 | 0.1 | GO:0033133 | regulation of glucokinase activity(GO:0033131) positive regulation of glucokinase activity(GO:0033133) regulation of hexokinase activity(GO:1903299) positive regulation of hexokinase activity(GO:1903301) |
| 0.0 | 0.6 | GO:1900116 | extracellular regulation of signal transduction(GO:1900115) extracellular negative regulation of signal transduction(GO:1900116) |
| 0.0 | 0.1 | GO:0009822 | alkaloid catabolic process(GO:0009822) |
| 0.0 | 0.1 | GO:0032929 | negative regulation of superoxide anion generation(GO:0032929) |
| 0.0 | 0.4 | GO:0034244 | negative regulation of transcription elongation from RNA polymerase II promoter(GO:0034244) |
| 0.0 | 0.0 | GO:0070256 | negative regulation of circadian sleep/wake cycle, non-REM sleep(GO:0042323) negative regulation of mucus secretion(GO:0070256) |
| 0.0 | 0.1 | GO:2000312 | regulation of kainate selective glutamate receptor activity(GO:2000312) |
| 0.0 | 0.3 | GO:0060372 | regulation of atrial cardiac muscle cell membrane repolarization(GO:0060372) |
| 0.0 | 1.6 | GO:0015701 | bicarbonate transport(GO:0015701) |
| 0.0 | 0.3 | GO:0051665 | membrane raft localization(GO:0051665) |
| 0.0 | 0.3 | GO:0007144 | female meiosis I(GO:0007144) |
| 0.0 | 0.3 | GO:0000244 | spliceosomal tri-snRNP complex assembly(GO:0000244) |
| 0.0 | 0.3 | GO:0045075 | interleukin-12 biosynthetic process(GO:0042090) regulation of interleukin-12 biosynthetic process(GO:0045075) |
| 0.0 | 0.6 | GO:0048642 | negative regulation of skeletal muscle tissue development(GO:0048642) |
| 0.0 | 1.4 | GO:0006120 | mitochondrial electron transport, NADH to ubiquinone(GO:0006120) |
| 0.0 | 0.3 | GO:0006600 | creatine metabolic process(GO:0006600) |
| 0.0 | 0.1 | GO:0035565 | regulation of pronephros size(GO:0035565) |
| 0.0 | 0.2 | GO:0010593 | negative regulation of lamellipodium assembly(GO:0010593) |
| 0.0 | 0.6 | GO:0071420 | cellular response to histamine(GO:0071420) |
| 0.0 | 0.4 | GO:1904262 | negative regulation of TORC1 signaling(GO:1904262) |
| 0.0 | 0.5 | GO:0060272 | embryonic skeletal joint morphogenesis(GO:0060272) |
| 0.0 | 0.3 | GO:0051386 | regulation of neurotrophin TRK receptor signaling pathway(GO:0051386) |
| 0.0 | 0.2 | GO:0006627 | protein processing involved in protein targeting to mitochondrion(GO:0006627) |
| 0.0 | 0.3 | GO:0006308 | DNA catabolic process(GO:0006308) |
| 0.0 | 0.4 | GO:0006853 | carnitine shuttle(GO:0006853) |
| 0.0 | 0.1 | GO:1904354 | negative regulation of telomere capping(GO:1904354) |
| 0.0 | 0.2 | GO:0061525 | hindgut development(GO:0061525) |
| 0.0 | 0.3 | GO:0031284 | positive regulation of guanylate cyclase activity(GO:0031284) |
| 0.0 | 0.1 | GO:0021793 | chemorepulsion of branchiomotor axon(GO:0021793) |
| 0.0 | 0.2 | GO:0048711 | positive regulation of astrocyte differentiation(GO:0048711) |
| 0.0 | 0.0 | GO:0033076 | isoquinoline alkaloid metabolic process(GO:0033076) phytoalexin metabolic process(GO:0052314) |
| 0.0 | 0.1 | GO:0009443 | pyridoxal 5'-phosphate salvage(GO:0009443) |
| 0.0 | 0.2 | GO:0007021 | tubulin complex assembly(GO:0007021) |
| 0.0 | 0.4 | GO:0051085 | chaperone mediated protein folding requiring cofactor(GO:0051085) |
| 0.0 | 0.1 | GO:0097327 | response to antineoplastic agent(GO:0097327) |
| 0.0 | 0.1 | GO:1902231 | positive regulation of intrinsic apoptotic signaling pathway in response to DNA damage(GO:1902231) |
| 0.0 | 0.4 | GO:2000369 | regulation of clathrin-mediated endocytosis(GO:2000369) |
| 0.0 | 0.1 | GO:0006089 | lactate metabolic process(GO:0006089) |
| 0.0 | 0.2 | GO:0030213 | hyaluronan biosynthetic process(GO:0030213) |
| 0.0 | 0.0 | GO:0045110 | intermediate filament bundle assembly(GO:0045110) |
| 0.0 | 0.3 | GO:0030150 | protein import into mitochondrial matrix(GO:0030150) |
| 0.0 | 0.1 | GO:0005981 | regulation of glycogen catabolic process(GO:0005981) |
| 0.0 | 0.3 | GO:0048681 | negative regulation of axon regeneration(GO:0048681) |
| 0.0 | 0.4 | GO:0032793 | positive regulation of CREB transcription factor activity(GO:0032793) |
| 0.0 | 0.1 | GO:0030241 | skeletal muscle myosin thick filament assembly(GO:0030241) |
| 0.0 | 0.0 | GO:0003363 | lamellipodium assembly involved in ameboidal cell migration(GO:0003363) |
| 0.0 | 0.1 | GO:0032417 | positive regulation of sodium:proton antiporter activity(GO:0032417) |
| 0.0 | 0.1 | GO:1903593 | regulation of histamine secretion by mast cell(GO:1903593) |
| 0.0 | 0.5 | GO:0097237 | cellular response to toxic substance(GO:0097237) |
| 0.0 | 0.1 | GO:0006657 | CDP-choline pathway(GO:0006657) |
| 0.0 | 0.1 | GO:0071799 | response to prostaglandin D(GO:0071798) cellular response to prostaglandin D stimulus(GO:0071799) |
| 0.0 | 0.1 | GO:0060267 | positive regulation of respiratory burst(GO:0060267) |
| 0.0 | 0.1 | GO:2001135 | regulation of endocytic recycling(GO:2001135) |
| 0.0 | 0.2 | GO:0019371 | cyclooxygenase pathway(GO:0019371) |
| 0.0 | 0.1 | GO:0006499 | N-terminal protein myristoylation(GO:0006499) |
| 0.0 | 0.0 | GO:0030472 | mitotic spindle organization in nucleus(GO:0030472) |
| 0.0 | 0.2 | GO:0036066 | protein O-linked fucosylation(GO:0036066) |
| 0.0 | 0.2 | GO:0034197 | acylglycerol transport(GO:0034196) triglyceride transport(GO:0034197) |
| 0.0 | 0.2 | GO:0050746 | regulation of lipoprotein metabolic process(GO:0050746) |
| 0.0 | 0.2 | GO:0060856 | establishment of blood-brain barrier(GO:0060856) |
| 0.0 | 0.4 | GO:1901685 | glutathione derivative metabolic process(GO:1901685) glutathione derivative biosynthetic process(GO:1901687) |
| 0.0 | 0.3 | GO:0032098 | regulation of appetite(GO:0032098) |
| 0.0 | 0.1 | GO:0060052 | neurofilament cytoskeleton organization(GO:0060052) |
| 0.0 | 0.2 | GO:0060576 | intestinal epithelial cell development(GO:0060576) |
| 0.0 | 0.4 | GO:0042026 | protein refolding(GO:0042026) |
| 0.0 | 0.3 | GO:0016558 | protein import into peroxisome matrix(GO:0016558) |
| 0.0 | 1.3 | GO:0070126 | mitochondrial translational termination(GO:0070126) |
| 0.0 | 0.4 | GO:0016339 | calcium-dependent cell-cell adhesion via plasma membrane cell adhesion molecules(GO:0016339) |
| 0.0 | 0.1 | GO:0097091 | synaptic vesicle clustering(GO:0097091) |
| 0.0 | 0.0 | GO:0034334 | adherens junction maintenance(GO:0034334) |
| 0.0 | 0.1 | GO:0034427 | nuclear-transcribed mRNA catabolic process, exonucleolytic, 3'-5'(GO:0034427) |
| 0.0 | 0.0 | GO:1900454 | positive regulation of long term synaptic depression(GO:1900454) |
| 0.0 | 0.1 | GO:0070166 | enamel mineralization(GO:0070166) |
| 0.0 | 0.5 | GO:0045599 | negative regulation of fat cell differentiation(GO:0045599) |
Gene overrepresentation in cellular component category:
| Log-likelihood per target | Total log-likelihood | Term | Description |
|---|---|---|---|
| 0.4 | 2.7 | GO:0042721 | mitochondrial inner membrane protein insertion complex(GO:0042721) |
| 0.1 | 0.4 | GO:0016939 | kinesin II complex(GO:0016939) |
| 0.1 | 0.6 | GO:0045273 | mitochondrial respiratory chain complex II, succinate dehydrogenase complex (ubiquinone)(GO:0005749) succinate dehydrogenase complex (ubiquinone)(GO:0045257) respiratory chain complex II(GO:0045273) succinate dehydrogenase complex(GO:0045281) fumarate reductase complex(GO:0045283) |
| 0.1 | 0.5 | GO:1990851 | Wnt-Frizzled-LRP5/6 complex(GO:1990851) |
| 0.1 | 1.2 | GO:0005853 | eukaryotic translation elongation factor 1 complex(GO:0005853) |
| 0.1 | 0.8 | GO:0000220 | vacuolar proton-transporting V-type ATPase, V0 domain(GO:0000220) |
| 0.1 | 0.2 | GO:0005745 | m-AAA complex(GO:0005745) |
| 0.1 | 1.1 | GO:0097512 | cardiac myofibril(GO:0097512) |
| 0.1 | 0.4 | GO:0032021 | NELF complex(GO:0032021) |
| 0.1 | 0.2 | GO:0071818 | BAT3 complex(GO:0071818) ER membrane insertion complex(GO:0072379) |
| 0.1 | 0.4 | GO:1990130 | Iml1 complex(GO:1990130) |
| 0.1 | 0.2 | GO:0097598 | sperm cytoplasmic droplet(GO:0097598) |
| 0.0 | 0.4 | GO:0097452 | GAIT complex(GO:0097452) |
| 0.0 | 0.2 | GO:0005899 | insulin receptor complex(GO:0005899) |
| 0.0 | 0.7 | GO:0005862 | muscle thin filament tropomyosin(GO:0005862) |
| 0.0 | 0.5 | GO:0005742 | mitochondrial outer membrane translocase complex(GO:0005742) |
| 0.0 | 0.1 | GO:0000333 | telomerase catalytic core complex(GO:0000333) |
| 0.0 | 0.5 | GO:1990316 | ATG1/ULK1 kinase complex(GO:1990316) |
| 0.0 | 0.3 | GO:0072557 | IPAF inflammasome complex(GO:0072557) |
| 0.0 | 1.0 | GO:0033270 | paranode region of axon(GO:0033270) |
| 0.0 | 3.9 | GO:0097610 | cleavage furrow(GO:0032154) cell surface furrow(GO:0097610) |
| 0.0 | 0.2 | GO:0043291 | RAVE complex(GO:0043291) |
| 0.0 | 0.1 | GO:0055087 | Ski complex(GO:0055087) |
| 0.0 | 0.4 | GO:0031314 | extrinsic component of mitochondrial inner membrane(GO:0031314) |
| 0.0 | 0.1 | GO:0098592 | cytoplasmic side of apical plasma membrane(GO:0098592) |
| 0.0 | 0.4 | GO:0016013 | syntrophin complex(GO:0016013) |
| 0.0 | 0.2 | GO:0001651 | dense fibrillar component(GO:0001651) |
| 0.0 | 0.1 | GO:0071752 | dimeric IgA immunoglobulin complex(GO:0071750) secretory dimeric IgA immunoglobulin complex(GO:0071752) |
| 0.0 | 0.8 | GO:0005665 | DNA-directed RNA polymerase II, core complex(GO:0005665) |
| 0.0 | 0.2 | GO:0034363 | intermediate-density lipoprotein particle(GO:0034363) |
| 0.0 | 0.1 | GO:0070044 | synaptobrevin 2-SNAP-25-syntaxin-1a complex(GO:0070044) |
| 0.0 | 0.1 | GO:0009368 | endopeptidase Clp complex(GO:0009368) |
| 0.0 | 0.3 | GO:0045254 | pyruvate dehydrogenase complex(GO:0045254) |
| 0.0 | 0.4 | GO:0097433 | dense body(GO:0097433) |
| 0.0 | 0.3 | GO:0016593 | Cdc73/Paf1 complex(GO:0016593) |
| 0.0 | 0.6 | GO:0090665 | dystrophin-associated glycoprotein complex(GO:0016010) glycoprotein complex(GO:0090665) |
| 0.0 | 0.2 | GO:0031232 | extrinsic component of external side of plasma membrane(GO:0031232) |
| 0.0 | 0.1 | GO:0098855 | HCN channel complex(GO:0098855) |
| 0.0 | 1.4 | GO:0045271 | mitochondrial respiratory chain complex I(GO:0005747) NADH dehydrogenase complex(GO:0030964) respiratory chain complex I(GO:0045271) |
| 0.0 | 0.2 | GO:0000110 | nucleotide-excision repair factor 1 complex(GO:0000110) |
| 0.0 | 0.1 | GO:0061617 | MICOS complex(GO:0061617) |
| 0.0 | 1.5 | GO:0005834 | heterotrimeric G-protein complex(GO:0005834) |
| 0.0 | 1.4 | GO:0033017 | sarcoplasmic reticulum membrane(GO:0033017) |
| 0.0 | 0.3 | GO:0042622 | photoreceptor outer segment membrane(GO:0042622) |
| 0.0 | 0.4 | GO:0001518 | voltage-gated sodium channel complex(GO:0001518) |
| 0.0 | 1.0 | GO:0031430 | M band(GO:0031430) |
| 0.0 | 1.0 | GO:0009295 | nucleoid(GO:0009295) mitochondrial nucleoid(GO:0042645) |
| 0.0 | 0.2 | GO:0045239 | tricarboxylic acid cycle enzyme complex(GO:0045239) |
| 0.0 | 0.7 | GO:0042571 | immunoglobulin complex, circulating(GO:0042571) |
| 0.0 | 0.4 | GO:0090533 | cation-transporting ATPase complex(GO:0090533) |
| 0.0 | 0.1 | GO:0030896 | checkpoint clamp complex(GO:0030896) |
| 0.0 | 0.5 | GO:0000314 | organellar small ribosomal subunit(GO:0000314) mitochondrial small ribosomal subunit(GO:0005763) |
| 0.0 | 0.3 | GO:0036020 | endolysosome membrane(GO:0036020) |
| 0.0 | 0.1 | GO:0072357 | PTW/PP1 phosphatase complex(GO:0072357) |
| 0.0 | 0.6 | GO:1902711 | GABA-A receptor complex(GO:1902711) |
| 0.0 | 0.7 | GO:0097542 | ciliary tip(GO:0097542) |
| 0.0 | 1.0 | GO:0010494 | cytoplasmic stress granule(GO:0010494) |
| 0.0 | 0.8 | GO:0005871 | kinesin complex(GO:0005871) |
| 0.0 | 0.0 | GO:1990876 | cytoplasmic side of nuclear pore(GO:1990876) |
| 0.0 | 0.1 | GO:0043190 | ATP-binding cassette (ABC) transporter complex(GO:0043190) |
| 0.0 | 0.1 | GO:0097450 | astrocyte end-foot(GO:0097450) |
Gene overrepresentation in molecular function category:
| Log-likelihood per target | Total log-likelihood | Term | Description |
|---|---|---|---|
| 0.6 | 1.9 | GO:0008893 | guanosine-3',5'-bis(diphosphate) 3'-diphosphatase activity(GO:0008893) diphosphoric monoester hydrolase activity(GO:0016794) |
| 0.4 | 3.7 | GO:0004687 | myosin light chain kinase activity(GO:0004687) |
| 0.2 | 0.6 | GO:0052739 | phosphatidylserine 1-acylhydrolase activity(GO:0052739) |
| 0.2 | 0.6 | GO:0008177 | succinate dehydrogenase (ubiquinone) activity(GO:0008177) |
| 0.2 | 0.6 | GO:0004743 | pyruvate kinase activity(GO:0004743) |
| 0.1 | 0.4 | GO:0042007 | interleukin-18 binding(GO:0042007) |
| 0.1 | 0.4 | GO:0035605 | peptidyl-cysteine S-nitrosylase activity(GO:0035605) |
| 0.1 | 0.3 | GO:0004556 | alpha-amylase activity(GO:0004556) |
| 0.1 | 0.6 | GO:0034597 | phosphatidylinositol-3,4-bisphosphate 4-phosphatase activity(GO:0016316) inositol-1,3,4-trisphosphate 4-phosphatase activity(GO:0017161) phosphatidylinositol-4,5-bisphosphate 4-phosphatase activity(GO:0034597) inositol-3,4-bisphosphate 4-phosphatase activity(GO:0052828) |
| 0.1 | 0.3 | GO:0030158 | protein xylosyltransferase activity(GO:0030158) |
| 0.1 | 0.8 | GO:0000064 | L-ornithine transmembrane transporter activity(GO:0000064) |
| 0.1 | 0.5 | GO:0003870 | 5-aminolevulinate synthase activity(GO:0003870) N-succinyltransferase activity(GO:0016749) |
| 0.1 | 0.4 | GO:0015141 | succinate transmembrane transporter activity(GO:0015141) |
| 0.1 | 1.1 | GO:0004723 | calcium-dependent protein serine/threonine phosphatase activity(GO:0004723) |
| 0.1 | 0.6 | GO:0004771 | sterol esterase activity(GO:0004771) |
| 0.1 | 1.0 | GO:0016861 | intramolecular oxidoreductase activity, interconverting aldoses and ketoses(GO:0016861) |
| 0.1 | 0.6 | GO:0016361 | activin receptor activity, type I(GO:0016361) |
| 0.1 | 0.4 | GO:0086062 | voltage-gated sodium channel activity involved in Purkinje myocyte action potential(GO:0086062) |
| 0.1 | 0.4 | GO:0048248 | CXCR3 chemokine receptor binding(GO:0048248) |
| 0.1 | 0.7 | GO:0034485 | phosphatidylinositol-3,4,5-trisphosphate 5-phosphatase activity(GO:0034485) |
| 0.1 | 1.3 | GO:0031681 | G-protein beta-subunit binding(GO:0031681) |
| 0.1 | 0.2 | GO:0004967 | glucagon receptor activity(GO:0004967) |
| 0.1 | 0.2 | GO:0031755 | endothelial differentiation G-protein coupled receptor binding(GO:0031753) Edg-2 lysophosphatidic acid receptor binding(GO:0031755) |
| 0.1 | 1.5 | GO:0008510 | sodium:bicarbonate symporter activity(GO:0008510) |
| 0.1 | 0.2 | GO:0017095 | heparan sulfate 6-O-sulfotransferase activity(GO:0017095) |
| 0.1 | 0.4 | GO:0060230 | lipoprotein lipase activator activity(GO:0060230) |
| 0.1 | 0.6 | GO:0015288 | porin activity(GO:0015288) |
| 0.1 | 0.2 | GO:0036009 | protein-glutamine N-methyltransferase activity(GO:0036009) histone-glutamine methyltransferase activity(GO:1990259) |
| 0.1 | 0.2 | GO:0017129 | triglyceride binding(GO:0017129) |
| 0.0 | 0.4 | GO:0070290 | N-acylphosphatidylethanolamine-specific phospholipase D activity(GO:0070290) |
| 0.0 | 0.3 | GO:0052851 | cupric reductase activity(GO:0008823) ferric-chelate reductase (NADPH) activity(GO:0052851) |
| 0.0 | 0.3 | GO:0005499 | vitamin D binding(GO:0005499) |
| 0.0 | 1.6 | GO:0019706 | protein-cysteine S-palmitoyltransferase activity(GO:0019706) protein-cysteine S-acyltransferase activity(GO:0019707) |
| 0.0 | 0.2 | GO:0004775 | succinate-CoA ligase (ADP-forming) activity(GO:0004775) |
| 0.0 | 0.3 | GO:0004111 | creatine kinase activity(GO:0004111) |
| 0.0 | 0.7 | GO:0008503 | benzodiazepine receptor activity(GO:0008503) |
| 0.0 | 1.1 | GO:0003746 | translation elongation factor activity(GO:0003746) |
| 0.0 | 0.4 | GO:0004969 | histamine receptor activity(GO:0004969) |
| 0.0 | 0.3 | GO:0004738 | pyruvate dehydrogenase activity(GO:0004738) pyruvate dehydrogenase [NAD(P)+] activity(GO:0034603) pyruvate dehydrogenase (NAD+) activity(GO:0034604) |
| 0.0 | 0.8 | GO:0032036 | myosin heavy chain binding(GO:0032036) |
| 0.0 | 0.2 | GO:0050220 | prostaglandin-E synthase activity(GO:0050220) |
| 0.0 | 0.2 | GO:0010861 | thyroid hormone receptor activator activity(GO:0010861) thyroid hormone receptor coactivator activity(GO:0030375) |
| 0.0 | 0.1 | GO:0033265 | choline binding(GO:0033265) |
| 0.0 | 0.2 | GO:0004619 | bisphosphoglycerate mutase activity(GO:0004082) phosphoglycerate mutase activity(GO:0004619) 2,3-bisphosphoglycerate-dependent phosphoglycerate mutase activity(GO:0046538) |
| 0.0 | 0.3 | GO:0003910 | DNA ligase (ATP) activity(GO:0003910) |
| 0.0 | 0.1 | GO:0004958 | prostaglandin F receptor activity(GO:0004958) |
| 0.0 | 0.3 | GO:0004340 | glucokinase activity(GO:0004340) hexokinase activity(GO:0004396) fructokinase activity(GO:0008865) mannokinase activity(GO:0019158) |
| 0.0 | 0.3 | GO:0031685 | adenosine receptor binding(GO:0031685) |
| 0.0 | 0.7 | GO:1990380 | Lys48-specific deubiquitinase activity(GO:1990380) |
| 0.0 | 0.4 | GO:0102336 | fatty acid elongase activity(GO:0009922) 3-oxo-arachidoyl-CoA synthase activity(GO:0102336) 3-oxo-cerotoyl-CoA synthase activity(GO:0102337) 3-oxo-lignoceronyl-CoA synthase activity(GO:0102338) |
| 0.0 | 0.3 | GO:0008048 | calcium sensitive guanylate cyclase activator activity(GO:0008048) |
| 0.0 | 0.4 | GO:0008607 | phosphorylase kinase regulator activity(GO:0008607) |
| 0.0 | 0.5 | GO:0016884 | carbon-nitrogen ligase activity, with glutamine as amido-N-donor(GO:0016884) |
| 0.0 | 0.2 | GO:0047623 | AMP deaminase activity(GO:0003876) adenosine-phosphate deaminase activity(GO:0047623) |
| 0.0 | 0.2 | GO:0051021 | GDP-dissociation inhibitor binding(GO:0051021) Rho GDP-dissociation inhibitor binding(GO:0051022) |
| 0.0 | 0.1 | GO:0071885 | N-terminal protein N-methyltransferase activity(GO:0071885) |
| 0.0 | 0.1 | GO:0004341 | gluconolactonase activity(GO:0004341) |
| 0.0 | 0.3 | GO:0030976 | thiamine pyrophosphate binding(GO:0030976) |
| 0.0 | 1.0 | GO:0070182 | DNA polymerase binding(GO:0070182) |
| 0.0 | 3.8 | GO:0051087 | chaperone binding(GO:0051087) |
| 0.0 | 0.1 | GO:0019166 | trans-2-enoyl-CoA reductase (NADPH) activity(GO:0019166) |
| 0.0 | 0.1 | GO:0030346 | protein phosphatase 2B binding(GO:0030346) |
| 0.0 | 0.2 | GO:0047756 | chondroitin 4-sulfotransferase activity(GO:0047756) |
| 0.0 | 0.2 | GO:0004176 | ATP-dependent peptidase activity(GO:0004176) |
| 0.0 | 0.1 | GO:0017018 | myosin phosphatase activity(GO:0017018) |
| 0.0 | 0.3 | GO:0035374 | chondroitin sulfate binding(GO:0035374) |
| 0.0 | 0.1 | GO:0070643 | vitamin D3 25-hydroxylase activity(GO:0030343) vitamin D 25-hydroxylase activity(GO:0070643) |
| 0.0 | 0.3 | GO:0052650 | NADP-retinol dehydrogenase activity(GO:0052650) |
| 0.0 | 0.1 | GO:0032440 | 2-alkenal reductase [NAD(P)] activity(GO:0032440) |
| 0.0 | 1.0 | GO:0008157 | protein phosphatase 1 binding(GO:0008157) |
| 0.0 | 0.3 | GO:0086008 | voltage-gated potassium channel activity involved in cardiac muscle cell action potential repolarization(GO:0086008) |
| 0.0 | 0.1 | GO:0001594 | trace-amine receptor activity(GO:0001594) |
| 0.0 | 0.4 | GO:0004017 | adenylate kinase activity(GO:0004017) |
| 0.0 | 0.1 | GO:0004127 | cytidylate kinase activity(GO:0004127) |
| 0.0 | 0.1 | GO:0030235 | nitric-oxide synthase regulator activity(GO:0030235) |
| 0.0 | 1.0 | GO:0005164 | tumor necrosis factor receptor binding(GO:0005164) |
| 0.0 | 0.5 | GO:0042813 | Wnt-activated receptor activity(GO:0042813) |
| 0.0 | 0.1 | GO:0004459 | L-lactate dehydrogenase activity(GO:0004459) |
| 0.0 | 0.1 | GO:0072320 | volume-sensitive chloride channel activity(GO:0072320) |
| 0.0 | 0.3 | GO:0008199 | ferric iron binding(GO:0008199) |
| 0.0 | 0.2 | GO:0071933 | Arp2/3 complex binding(GO:0071933) |
| 0.0 | 0.1 | GO:0001849 | complement component C1q binding(GO:0001849) |
| 0.0 | 0.3 | GO:0016888 | endodeoxyribonuclease activity, producing 5'-phosphomonoesters(GO:0016888) |
| 0.0 | 1.1 | GO:0050136 | NADH dehydrogenase (ubiquinone) activity(GO:0008137) NADH dehydrogenase (quinone) activity(GO:0050136) |
| 0.0 | 0.1 | GO:0008142 | oxysterol binding(GO:0008142) |
| 0.0 | 0.1 | GO:0008853 | exodeoxyribonuclease III activity(GO:0008853) |
| 0.0 | 0.3 | GO:0031702 | type 1 angiotensin receptor binding(GO:0031702) |
| 0.0 | 0.2 | GO:0033691 | sialic acid binding(GO:0033691) |
| 0.0 | 0.0 | GO:0008294 | calcium- and calmodulin-responsive adenylate cyclase activity(GO:0008294) |
| 0.0 | 0.6 | GO:0008266 | poly(U) RNA binding(GO:0008266) |
| 0.0 | 0.4 | GO:0050998 | nitric-oxide synthase binding(GO:0050998) |
| 0.0 | 0.1 | GO:0050119 | N-acetylglucosamine deacetylase activity(GO:0050119) |
| 0.0 | 0.1 | GO:0008478 | pyridoxal kinase activity(GO:0008478) |
| 0.0 | 0.4 | GO:0044548 | S100 protein binding(GO:0044548) |
| 0.0 | 0.1 | GO:0005471 | ATP:ADP antiporter activity(GO:0005471) adenine transmembrane transporter activity(GO:0015207) |
| 0.0 | 0.2 | GO:0036122 | BMP binding(GO:0036122) |
| 0.0 | 0.1 | GO:0016941 | natriuretic peptide receptor activity(GO:0016941) |
| 0.0 | 0.4 | GO:0005251 | delayed rectifier potassium channel activity(GO:0005251) |
| 0.0 | 0.8 | GO:0034987 | immunoglobulin receptor binding(GO:0034987) |
| 0.0 | 0.1 | GO:0004802 | transketolase activity(GO:0004802) |
| 0.0 | 0.1 | GO:0005222 | intracellular cAMP activated cation channel activity(GO:0005222) |
| 0.0 | 0.4 | GO:0008574 | ATP-dependent microtubule motor activity, plus-end-directed(GO:0008574) |
| 0.0 | 0.7 | GO:0035035 | histone acetyltransferase binding(GO:0035035) |
| 0.0 | 0.1 | GO:0017040 | ceramidase activity(GO:0017040) |
| 0.0 | 0.1 | GO:0099583 | neurotransmitter receptor activity involved in regulation of postsynaptic cytosolic calcium ion concentration(GO:0099583) |
| 0.0 | 0.1 | GO:0030023 | extracellular matrix constituent conferring elasticity(GO:0030023) |
| 0.0 | 0.1 | GO:0047184 | 1-acylglycerophosphocholine O-acyltransferase activity(GO:0047184) |
| 0.0 | 0.4 | GO:0046961 | ATPase activity, coupled to transmembrane movement of ions, rotational mechanism(GO:0044769) proton-transporting ATPase activity, rotational mechanism(GO:0046961) |
| 0.0 | 0.1 | GO:0008113 | peptide-methionine (S)-S-oxide reductase activity(GO:0008113) |
| 0.0 | 0.1 | GO:0016812 | hydrolase activity, acting on carbon-nitrogen (but not peptide) bonds, in cyclic amides(GO:0016812) |
| 0.0 | 0.4 | GO:0005184 | neuropeptide hormone activity(GO:0005184) |
| 0.0 | 0.1 | GO:0071936 | coreceptor activity involved in Wnt signaling pathway(GO:0071936) coreceptor activity involved in Wnt signaling pathway, planar cell polarity pathway(GO:1904929) |
| 0.0 | 0.8 | GO:0003777 | microtubule motor activity(GO:0003777) |
Gene overrepresentation in curated gene sets: canonical pathways category:
| Log-likelihood per target | Total log-likelihood | Term | Description |
|---|---|---|---|
| 0.1 | 3.6 | SIG REGULATION OF THE ACTIN CYTOSKELETON BY RHO GTPASES | Genes related to regulation of the actin cytoskeleton |
| 0.0 | 0.8 | PID THROMBIN PAR4 PATHWAY | PAR4-mediated thrombin signaling events |
| 0.0 | 1.4 | PID HDAC CLASSIII PATHWAY | Signaling events mediated by HDAC Class III |
| 0.0 | 0.3 | SA G2 AND M PHASES | Cdc25 activates the cdc2/cyclin B complex to induce the G2/M transition. |
| 0.0 | 1.2 | ST WNT CA2 CYCLIC GMP PATHWAY | Wnt/Ca2+/cyclic GMP signaling. |
| 0.0 | 1.1 | PID FANCONI PATHWAY | Fanconi anemia pathway |
| 0.0 | 0.3 | PID ALK2 PATHWAY | ALK2 signaling events |
| 0.0 | 0.6 | PID ALK1 PATHWAY | ALK1 signaling events |
| 0.0 | 0.5 | PID WNT SIGNALING PATHWAY | Wnt signaling network |
| 0.0 | 0.6 | PID INTEGRIN2 PATHWAY | Beta2 integrin cell surface interactions |
Gene overrepresentation in curated gene sets: REACTOME pathways category:
| Log-likelihood per target | Total log-likelihood | Term | Description |
|---|---|---|---|
| 0.1 | 4.6 | REACTOME SMOOTH MUSCLE CONTRACTION | Genes involved in Smooth Muscle Contraction |
| 0.1 | 0.8 | REACTOME REGULATION OF THE FANCONI ANEMIA PATHWAY | Genes involved in Regulation of the Fanconi anemia pathway |
| 0.0 | 1.3 | REACTOME CITRIC ACID CYCLE TCA CYCLE | Genes involved in Citric acid cycle (TCA cycle) |
| 0.0 | 2.4 | REACTOME MITOCHONDRIAL PROTEIN IMPORT | Genes involved in Mitochondrial Protein Import |
| 0.0 | 0.5 | REACTOME PURINE RIBONUCLEOSIDE MONOPHOSPHATE BIOSYNTHESIS | Genes involved in Purine ribonucleoside monophosphate biosynthesis |
| 0.0 | 0.5 | REACTOME SYNTHESIS OF SUBSTRATES IN N GLYCAN BIOSYTHESIS | Genes involved in Synthesis of substrates in N-glycan biosythesis |
| 0.0 | 0.5 | REACTOME PEPTIDE HORMONE BIOSYNTHESIS | Genes involved in Peptide hormone biosynthesis |
| 0.0 | 0.3 | REACTOME DIGESTION OF DIETARY CARBOHYDRATE | Genes involved in Digestion of dietary carbohydrate |
| 0.0 | 0.6 | REACTOME SYNTHESIS OF PIPS AT THE EARLY ENDOSOME MEMBRANE | Genes involved in Synthesis of PIPs at the early endosome membrane |
| 0.0 | 0.1 | REACTOME MTORC1 MEDIATED SIGNALLING | Genes involved in mTORC1-mediated signalling |
| 0.0 | 1.3 | REACTOME GLYCOLYSIS | Genes involved in Glycolysis |
| 0.0 | 0.3 | REACTOME REGULATION OF PYRUVATE DEHYDROGENASE PDH COMPLEX | Genes involved in Regulation of pyruvate dehydrogenase (PDH) complex |
| 0.0 | 0.6 | REACTOME PROLACTIN RECEPTOR SIGNALING | Genes involved in Prolactin receptor signaling |
| 0.0 | 1.0 | REACTOME STRIATED MUSCLE CONTRACTION | Genes involved in Striated Muscle Contraction |
| 0.0 | 0.4 | REACTOME BILE SALT AND ORGANIC ANION SLC TRANSPORTERS | Genes involved in Bile salt and organic anion SLC transporters |
| 0.0 | 0.2 | REACTOME HDL MEDIATED LIPID TRANSPORT | Genes involved in HDL-mediated lipid transport |
| 0.0 | 0.4 | REACTOME REGULATION OF RHEB GTPASE ACTIVITY BY AMPK | Genes involved in Regulation of Rheb GTPase activity by AMPK |
| 0.0 | 0.6 | REACTOME REGULATORY RNA PATHWAYS | Genes involved in Regulatory RNA pathways |
| 0.0 | 0.4 | REACTOME MRNA DECAY BY 5 TO 3 EXORIBONUCLEASE | Genes involved in mRNA Decay by 5' to 3' Exoribonuclease |
| 0.0 | 0.1 | REACTOME PYRUVATE METABOLISM | Genes involved in Pyruvate metabolism |
| 0.0 | 0.5 | REACTOME METABOLISM OF PORPHYRINS | Genes involved in Metabolism of porphyrins |
| 0.0 | 0.5 | REACTOME TRANSFERRIN ENDOCYTOSIS AND RECYCLING | Genes involved in Transferrin endocytosis and recycling |
| 0.0 | 0.6 | REACTOME GABA A RECEPTOR ACTIVATION | Genes involved in GABA A receptor activation |
| 0.0 | 0.3 | REACTOME CHYLOMICRON MEDIATED LIPID TRANSPORT | Genes involved in Chylomicron-mediated lipid transport |
| 0.0 | 0.3 | REACTOME REGULATION OF COMPLEMENT CASCADE | Genes involved in Regulation of Complement cascade |
| 0.0 | 1.1 | REACTOME RESPIRATORY ELECTRON TRANSPORT | Genes involved in Respiratory electron transport |
| 0.0 | 0.4 | REACTOME SYNTHESIS AND INTERCONVERSION OF NUCLEOTIDE DI AND TRIPHOSPHATES | Genes involved in Synthesis and interconversion of nucleotide di- and triphosphates |
| 0.0 | 0.2 | REACTOME FANCONI ANEMIA PATHWAY | Genes involved in Fanconi Anemia pathway |
| 0.0 | 0.3 | REACTOME CYCLIN A B1 ASSOCIATED EVENTS DURING G2 M TRANSITION | Genes involved in Cyclin A/B1 associated events during G2/M transition |
| 0.0 | 0.3 | REACTOME P38MAPK EVENTS | Genes involved in p38MAPK events |
| 0.0 | 0.4 | REACTOME KINESINS | Genes involved in Kinesins |
| 0.0 | 0.1 | REACTOME SEROTONIN RECEPTORS | Genes involved in Serotonin receptors |