Project
Inflammatory response time course, HUVEC (Wada, 2009)
Navigation
Downloads
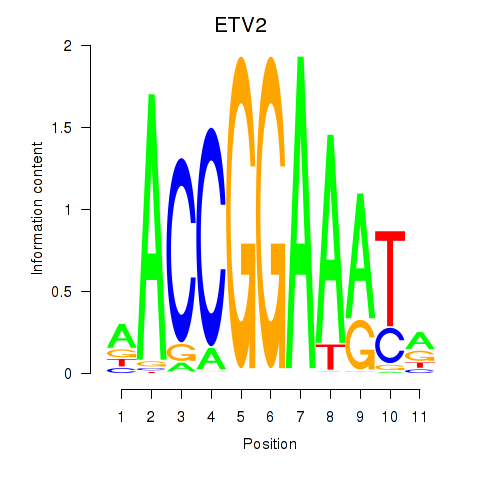
Results for ETV2
Z-value: 0.80
Motif logo
Transcription factors associated with ETV2
| Gene Symbol | Gene ID | Gene Info |
|---|---|---|
|
ETV2
|
ENSG00000105672.14 | ETV2 |
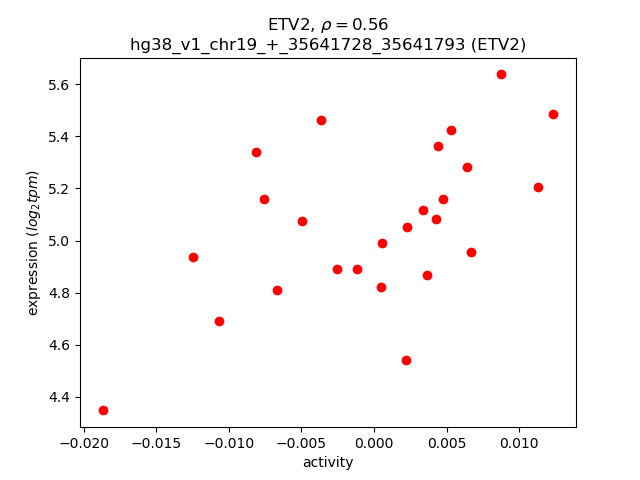
Activity-expression correlation:
| Gene | Promoter | Pearson corr. coef. | P-value | Plot |
|---|---|---|---|---|
| ETV2 | hg38_v1_chr19_+_35641728_35641793 | 0.56 | 3.7e-03 | Click! |
Activity profile of ETV2 motif
Sorted Z-values of ETV2 motif
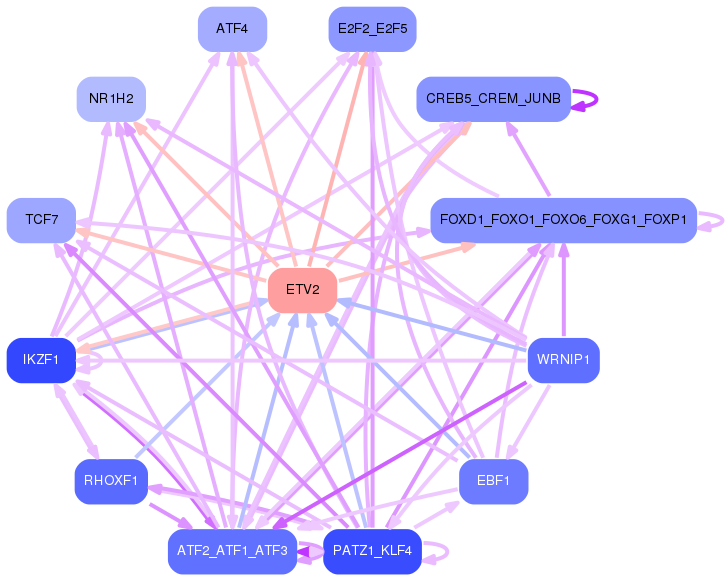
Network of associatons between targets according to the STRING database.

First level regulatory network of ETV2
Gene Ontology Analysis
Gene overrepresentation in biological process category:
| Log-likelihood per target | Total log-likelihood | Term | Description |
|---|---|---|---|
| 0.5 | 1.4 | GO:2000661 | positive regulation of interleukin-1-mediated signaling pathway(GO:2000661) |
| 0.4 | 1.1 | GO:2000523 | regulation of T cell costimulation(GO:2000523) positive regulation of T cell costimulation(GO:2000525) |
| 0.3 | 1.0 | GO:1904717 | excitatory chemical synaptic transmission(GO:0098976) regulation of AMPA glutamate receptor clustering(GO:1904717) positive regulation of AMPA glutamate receptor clustering(GO:1904719) |
| 0.3 | 1.8 | GO:0071051 | polyadenylation-dependent snoRNA 3'-end processing(GO:0071051) |
| 0.3 | 1.7 | GO:2000158 | positive regulation of ubiquitin-specific protease activity(GO:2000158) |
| 0.3 | 1.1 | GO:0000738 | DNA catabolic process, exonucleolytic(GO:0000738) |
| 0.3 | 2.4 | GO:0045084 | positive regulation of interleukin-12 biosynthetic process(GO:0045084) |
| 0.3 | 1.0 | GO:0033590 | response to cobalamin(GO:0033590) |
| 0.2 | 2.7 | GO:1903943 | regulation of hepatocyte apoptotic process(GO:1903943) negative regulation of hepatocyte apoptotic process(GO:1903944) |
| 0.2 | 0.9 | GO:1903070 | negative regulation of ER-associated ubiquitin-dependent protein catabolic process(GO:1903070) |
| 0.2 | 1.1 | GO:0000393 | spliceosomal conformational changes to generate catalytic conformation(GO:0000393) |
| 0.2 | 0.6 | GO:2000097 | chronological cell aging(GO:0001300) regulation of smooth muscle cell-matrix adhesion(GO:2000097) |
| 0.2 | 0.6 | GO:0032887 | regulation of spindle elongation(GO:0032887) regulation of mitotic spindle elongation(GO:0032888) anastral spindle assembly(GO:0055048) protein localization to spindle pole body(GO:0071988) regulation of protein localization to spindle pole body(GO:1902363) positive regulation of protein localization to spindle pole body(GO:1902365) positive regulation of mitotic spindle elongation(GO:1902846) |
| 0.2 | 1.2 | GO:0019276 | UDP-N-acetylgalactosamine metabolic process(GO:0019276) |
| 0.2 | 0.7 | GO:0043311 | positive regulation of eosinophil degranulation(GO:0043311) positive regulation of eosinophil activation(GO:1902568) |
| 0.2 | 0.5 | GO:0090187 | positive regulation of pancreatic juice secretion(GO:0090187) |
| 0.2 | 0.5 | GO:1904579 | response to thapsigargin(GO:1904578) cellular response to thapsigargin(GO:1904579) |
| 0.2 | 0.6 | GO:0034445 | negative regulation of lipoprotein oxidation(GO:0034443) regulation of plasma lipoprotein particle oxidation(GO:0034444) negative regulation of plasma lipoprotein particle oxidation(GO:0034445) |
| 0.2 | 0.6 | GO:1904327 | tail-anchored membrane protein insertion into ER membrane(GO:0071816) protein localization to cytosolic proteasome complex(GO:1904327) protein localization to cytosolic proteasome complex involved in ERAD pathway(GO:1904379) |
| 0.1 | 0.4 | GO:0061394 | regulation of transcription from RNA polymerase II promoter in response to arsenic-containing substance(GO:0061394) |
| 0.1 | 2.2 | GO:0051601 | exocyst localization(GO:0051601) |
| 0.1 | 2.9 | GO:1902083 | negative regulation of peptidyl-cysteine S-nitrosylation(GO:1902083) |
| 0.1 | 0.5 | GO:1903423 | positive regulation of synaptic vesicle endocytosis(GO:1900244) positive regulation of synaptic vesicle recycling(GO:1903423) |
| 0.1 | 2.1 | GO:0032625 | interleukin-21 production(GO:0032625) interleukin-21 secretion(GO:0072619) |
| 0.1 | 0.8 | GO:0007000 | nucleolus organization(GO:0007000) |
| 0.1 | 1.4 | GO:0050861 | positive regulation of B cell receptor signaling pathway(GO:0050861) |
| 0.1 | 0.5 | GO:0016080 | synaptic vesicle targeting(GO:0016080) |
| 0.1 | 0.6 | GO:1903936 | cellular response to sodium arsenite(GO:1903936) |
| 0.1 | 0.3 | GO:0098507 | polynucleotide 5' dephosphorylation(GO:0098507) |
| 0.1 | 0.3 | GO:0035752 | lysosomal lumen pH elevation(GO:0035752) |
| 0.1 | 0.4 | GO:0090301 | regulation of neural crest formation(GO:0090299) negative regulation of neural crest formation(GO:0090301) negative regulation of fibroblast growth factor receptor signaling pathway involved in neural plate anterior/posterior pattern formation(GO:2000314) |
| 0.1 | 0.3 | GO:0090234 | regulation of kinetochore assembly(GO:0090234) |
| 0.1 | 0.5 | GO:0016480 | negative regulation of transcription from RNA polymerase III promoter(GO:0016480) |
| 0.1 | 0.5 | GO:0043988 | histone H3-S28 phosphorylation(GO:0043988) |
| 0.1 | 0.8 | GO:0034316 | negative regulation of Arp2/3 complex-mediated actin nucleation(GO:0034316) |
| 0.1 | 0.4 | GO:0061086 | negative regulation of histone H3-K27 methylation(GO:0061086) |
| 0.1 | 0.5 | GO:0010513 | positive regulation of phosphatidylinositol biosynthetic process(GO:0010513) |
| 0.1 | 0.3 | GO:0002184 | cytoplasmic translational termination(GO:0002184) |
| 0.1 | 0.1 | GO:1903004 | regulation of protein K63-linked deubiquitination(GO:1903004) positive regulation of protein K63-linked deubiquitination(GO:1903006) |
| 0.1 | 0.6 | GO:1903378 | positive regulation of oxidative stress-induced neuron intrinsic apoptotic signaling pathway(GO:1903378) |
| 0.1 | 0.7 | GO:0010792 | DNA double-strand break processing involved in repair via single-strand annealing(GO:0010792) |
| 0.1 | 0.2 | GO:1901253 | negative regulation of intracellular transport of viral material(GO:1901253) |
| 0.1 | 0.4 | GO:0048619 | embryonic genitalia morphogenesis(GO:0030538) embryonic hindgut morphogenesis(GO:0048619) |
| 0.1 | 2.6 | GO:0043968 | histone H2A acetylation(GO:0043968) |
| 0.1 | 1.5 | GO:0033617 | mitochondrial respiratory chain complex IV assembly(GO:0033617) |
| 0.1 | 0.4 | GO:0010836 | negative regulation of protein ADP-ribosylation(GO:0010836) |
| 0.1 | 0.7 | GO:0033211 | adiponectin-activated signaling pathway(GO:0033211) |
| 0.1 | 0.4 | GO:0033512 | L-lysine catabolic process to acetyl-CoA via saccharopine(GO:0033512) |
| 0.1 | 0.2 | GO:1903939 | negative regulation of histone H3-K9 dimethylation(GO:1900110) regulation of TORC2 signaling(GO:1903939) |
| 0.1 | 1.1 | GO:0021796 | cerebral cortex regionalization(GO:0021796) |
| 0.1 | 0.2 | GO:0060434 | bronchus morphogenesis(GO:0060434) |
| 0.1 | 0.3 | GO:0000821 | regulation of arginine metabolic process(GO:0000821) |
| 0.1 | 0.2 | GO:0048213 | Golgi vesicle prefusion complex stabilization(GO:0048213) |
| 0.1 | 0.4 | GO:1903232 | melanosome assembly(GO:1903232) |
| 0.1 | 0.3 | GO:0071921 | establishment of sister chromatid cohesion(GO:0034085) cohesin loading(GO:0071921) regulation of cohesin loading(GO:0071922) |
| 0.1 | 0.2 | GO:1904170 | positive regulation of interleukin-1 alpha secretion(GO:0050717) regulation of bleb assembly(GO:1904170) positive regulation of bleb assembly(GO:1904172) |
| 0.1 | 0.5 | GO:0097461 | ferric iron import into cell(GO:0097461) ferric iron import across plasma membrane(GO:0098706) |
| 0.1 | 0.3 | GO:0042631 | cellular response to water deprivation(GO:0042631) |
| 0.1 | 0.2 | GO:0019858 | cytosine metabolic process(GO:0019858) |
| 0.1 | 0.2 | GO:1903722 | regulation of centriole elongation(GO:1903722) |
| 0.1 | 0.4 | GO:0061624 | fructose catabolic process(GO:0006001) fructose catabolic process to hydroxyacetone phosphate and glyceraldehyde-3-phosphate(GO:0061624) |
| 0.1 | 0.1 | GO:0018364 | peptidyl-glutamine methylation(GO:0018364) |
| 0.1 | 0.4 | GO:0044034 | negative stranded viral RNA replication(GO:0039689) multi-organism biosynthetic process(GO:0044034) |
| 0.1 | 0.5 | GO:0072734 | response to staurosporine(GO:0072733) cellular response to staurosporine(GO:0072734) |
| 0.1 | 0.2 | GO:0052552 | induction by symbiont of host defense response(GO:0044416) induction of host immune response by virus(GO:0046730) active induction of host immune response by virus(GO:0046732) modulation by symbiont of host defense response(GO:0052031) induction by organism of defense response of other organism involved in symbiotic interaction(GO:0052251) modulation by organism of defense response of other organism involved in symbiotic interaction(GO:0052255) positive regulation by symbiont of host defense response(GO:0052509) positive regulation by organism of defense response of other organism involved in symbiotic interaction(GO:0052510) modulation by organism of immune response of other organism involved in symbiotic interaction(GO:0052552) modulation by symbiont of host immune response(GO:0052553) modulation by virus of host immune response(GO:0075528) |
| 0.1 | 0.7 | GO:0006268 | DNA unwinding involved in DNA replication(GO:0006268) |
| 0.1 | 0.2 | GO:2000395 | regulation of ubiquitin-dependent endocytosis(GO:2000395) positive regulation of ubiquitin-dependent endocytosis(GO:2000397) |
| 0.1 | 0.6 | GO:0060717 | chorion development(GO:0060717) |
| 0.1 | 0.3 | GO:0071105 | response to interleukin-11(GO:0071105) |
| 0.1 | 0.4 | GO:0035469 | determination of pancreatic left/right asymmetry(GO:0035469) |
| 0.1 | 0.3 | GO:0031438 | negative regulation of mRNA cleavage(GO:0031438) negative regulation of mRNA endonucleolytic cleavage involved in unfolded protein response(GO:1904721) |
| 0.1 | 0.3 | GO:0070940 | dephosphorylation of RNA polymerase II C-terminal domain(GO:0070940) |
| 0.1 | 0.2 | GO:0031938 | regulation of chromatin silencing at telomere(GO:0031938) |
| 0.1 | 0.3 | GO:0048254 | snoRNA localization(GO:0048254) |
| 0.1 | 0.3 | GO:0051001 | negative regulation of nitric-oxide synthase activity(GO:0051001) |
| 0.1 | 0.2 | GO:0034552 | respiratory chain complex II assembly(GO:0034552) mitochondrial respiratory chain complex II assembly(GO:0034553) mitochondrial respiratory chain complex II biogenesis(GO:0097032) |
| 0.1 | 0.5 | GO:0002826 | negative regulation of T-helper 1 type immune response(GO:0002826) |
| 0.1 | 0.2 | GO:0016256 | N-glycan processing to lysosome(GO:0016256) |
| 0.1 | 0.2 | GO:0035552 | oxidative single-stranded DNA demethylation(GO:0035552) |
| 0.1 | 0.2 | GO:0048162 | preantral ovarian follicle growth(GO:0001546) multi-layer follicle stage(GO:0048162) |
| 0.0 | 0.6 | GO:2001288 | positive regulation of caveolin-mediated endocytosis(GO:2001288) |
| 0.0 | 0.2 | GO:0000454 | snoRNA guided rRNA pseudouridine synthesis(GO:0000454) |
| 0.0 | 0.1 | GO:0018307 | enzyme active site formation(GO:0018307) |
| 0.0 | 0.1 | GO:0002625 | regulation of T cell antigen processing and presentation(GO:0002625) |
| 0.0 | 0.1 | GO:0045014 | carbon catabolite repression of transcription(GO:0045013) negative regulation of transcription by glucose(GO:0045014) |
| 0.0 | 0.7 | GO:0000290 | deadenylation-dependent decapping of nuclear-transcribed mRNA(GO:0000290) |
| 0.0 | 0.3 | GO:1904431 | positive regulation of t-circle formation(GO:1904431) |
| 0.0 | 0.5 | GO:0016255 | attachment of GPI anchor to protein(GO:0016255) |
| 0.0 | 0.1 | GO:0033023 | mast cell homeostasis(GO:0033023) mast cell apoptotic process(GO:0033024) regulation of mast cell apoptotic process(GO:0033025) |
| 0.0 | 0.6 | GO:0043249 | erythrocyte maturation(GO:0043249) |
| 0.0 | 0.1 | GO:1903538 | meiotic spindle elongation(GO:0051232) meiotic cell cycle process involved in oocyte maturation(GO:1903537) regulation of meiotic cell cycle process involved in oocyte maturation(GO:1903538) |
| 0.0 | 0.7 | GO:0071712 | ER-associated misfolded protein catabolic process(GO:0071712) |
| 0.0 | 0.1 | GO:1902766 | skeletal muscle satellite cell migration(GO:1902766) |
| 0.0 | 0.4 | GO:0033088 | negative regulation of immature T cell proliferation in thymus(GO:0033088) |
| 0.0 | 0.2 | GO:0035787 | neural plate elongation(GO:0014022) convergent extension involved in neural plate elongation(GO:0022007) cell migration involved in kidney development(GO:0035787) dichotomous subdivision of terminal units involved in lung branching(GO:0060448) |
| 0.0 | 0.1 | GO:1903259 | exon-exon junction complex disassembly(GO:1903259) |
| 0.0 | 0.1 | GO:0070086 | ubiquitin-dependent endocytosis(GO:0070086) |
| 0.0 | 0.6 | GO:0034244 | negative regulation of transcription elongation from RNA polymerase II promoter(GO:0034244) |
| 0.0 | 0.1 | GO:1901355 | response to rapamycin(GO:1901355) |
| 0.0 | 0.4 | GO:2000002 | negative regulation of DNA damage checkpoint(GO:2000002) |
| 0.0 | 0.2 | GO:0015891 | iron chelate transport(GO:0015688) siderophore transport(GO:0015891) sensory perception of sour taste(GO:0050915) |
| 0.0 | 0.4 | GO:0017196 | N-terminal peptidyl-methionine acetylation(GO:0017196) |
| 0.0 | 0.4 | GO:0070294 | renal sodium ion absorption(GO:0070294) |
| 0.0 | 0.5 | GO:0000244 | spliceosomal tri-snRNP complex assembly(GO:0000244) |
| 0.0 | 0.3 | GO:0016584 | nucleosome positioning(GO:0016584) |
| 0.0 | 0.5 | GO:1904869 | regulation of protein localization to Cajal body(GO:1904869) positive regulation of protein localization to Cajal body(GO:1904871) |
| 0.0 | 0.2 | GO:0046601 | positive regulation of centriole replication(GO:0046601) |
| 0.0 | 2.6 | GO:0048384 | retinoic acid receptor signaling pathway(GO:0048384) |
| 0.0 | 0.6 | GO:0010225 | response to UV-C(GO:0010225) |
| 0.0 | 0.1 | GO:0043328 | protein targeting to vacuole involved in ubiquitin-dependent protein catabolic process via the multivesicular body sorting pathway(GO:0043328) |
| 0.0 | 0.2 | GO:0038016 | insulin receptor internalization(GO:0038016) |
| 0.0 | 0.1 | GO:0046833 | positive regulation of RNA export from nucleus(GO:0046833) |
| 0.0 | 0.8 | GO:0046069 | cGMP catabolic process(GO:0046069) |
| 0.0 | 0.3 | GO:0034773 | histone H4-K20 trimethylation(GO:0034773) |
| 0.0 | 0.2 | GO:0090309 | positive regulation of methylation-dependent chromatin silencing(GO:0090309) |
| 0.0 | 0.3 | GO:0061484 | hematopoietic stem cell homeostasis(GO:0061484) |
| 0.0 | 0.4 | GO:0035331 | negative regulation of hippo signaling(GO:0035331) |
| 0.0 | 0.2 | GO:0032439 | endosome localization(GO:0032439) |
| 0.0 | 0.3 | GO:0070836 | caveola assembly(GO:0070836) |
| 0.0 | 0.1 | GO:2000642 | intralumenal vesicle formation(GO:0070676) negative regulation of early endosome to late endosome transport(GO:2000642) |
| 0.0 | 0.2 | GO:0060770 | negative regulation of epithelial cell proliferation involved in prostate gland development(GO:0060770) |
| 0.0 | 0.2 | GO:2000210 | positive regulation of anoikis(GO:2000210) |
| 0.0 | 0.1 | GO:0003431 | growth plate cartilage chondrocyte development(GO:0003431) |
| 0.0 | 0.5 | GO:0070389 | chaperone cofactor-dependent protein refolding(GO:0070389) |
| 0.0 | 0.3 | GO:0046104 | thymidine metabolic process(GO:0046104) pyrimidine deoxyribonucleoside metabolic process(GO:0046125) |
| 0.0 | 0.2 | GO:0036438 | maintenance of lens transparency(GO:0036438) |
| 0.0 | 0.2 | GO:0016344 | meiotic chromosome movement towards spindle pole(GO:0016344) |
| 0.0 | 1.1 | GO:0042347 | negative regulation of NF-kappaB import into nucleus(GO:0042347) |
| 0.0 | 0.2 | GO:0006102 | isocitrate metabolic process(GO:0006102) |
| 0.0 | 0.1 | GO:0010847 | regulation of chromatin assembly(GO:0010847) |
| 0.0 | 0.1 | GO:1902410 | mitotic cytokinetic process(GO:1902410) |
| 0.0 | 0.1 | GO:0044179 | hemolysis by symbiont of host erythrocytes(GO:0019836) hemolysis in other organism(GO:0044179) hemolysis in other organism involved in symbiotic interaction(GO:0052331) |
| 0.0 | 3.2 | GO:0070126 | mitochondrial translational termination(GO:0070126) |
| 0.0 | 0.2 | GO:0036493 | positive regulation of translation in response to endoplasmic reticulum stress(GO:0036493) |
| 0.0 | 0.6 | GO:0031033 | myosin filament organization(GO:0031033) |
| 0.0 | 0.1 | GO:0030576 | Cajal body organization(GO:0030576) |
| 0.0 | 0.2 | GO:1902527 | positive regulation of protein monoubiquitination(GO:1902527) |
| 0.0 | 0.5 | GO:0042994 | cytoplasmic sequestering of transcription factor(GO:0042994) |
| 0.0 | 0.5 | GO:0034498 | early endosome to Golgi transport(GO:0034498) |
| 0.0 | 0.2 | GO:0071421 | manganese ion transmembrane transport(GO:0071421) |
| 0.0 | 1.2 | GO:0071800 | podosome assembly(GO:0071800) |
| 0.0 | 0.1 | GO:0019303 | D-ribose catabolic process(GO:0019303) |
| 0.0 | 0.2 | GO:0006880 | intracellular sequestering of iron ion(GO:0006880) sequestering of iron ion(GO:0097577) |
| 0.0 | 0.1 | GO:0032485 | Ral protein signal transduction(GO:0032484) regulation of Ral protein signal transduction(GO:0032485) |
| 0.0 | 0.2 | GO:0030951 | establishment or maintenance of microtubule cytoskeleton polarity(GO:0030951) |
| 0.0 | 0.1 | GO:0019075 | virus maturation(GO:0019075) |
| 0.0 | 0.1 | GO:0060903 | germ-line stem cell population maintenance(GO:0030718) positive regulation of meiosis I(GO:0060903) |
| 0.0 | 0.0 | GO:0035359 | negative regulation of peroxisome proliferator activated receptor signaling pathway(GO:0035359) |
| 0.0 | 0.2 | GO:1904628 | response to phorbol 13-acetate 12-myristate(GO:1904627) cellular response to phorbol 13-acetate 12-myristate(GO:1904628) |
| 0.0 | 0.6 | GO:0006123 | mitochondrial electron transport, cytochrome c to oxygen(GO:0006123) |
| 0.0 | 0.2 | GO:0042791 | 5S class rRNA transcription from RNA polymerase III type 1 promoter(GO:0042791) tRNA transcription from RNA polymerase III promoter(GO:0042797) |
| 0.0 | 0.2 | GO:0035879 | plasma membrane lactate transport(GO:0035879) |
| 0.0 | 0.5 | GO:0045723 | positive regulation of fatty acid biosynthetic process(GO:0045723) |
| 0.0 | 0.1 | GO:0090035 | regulation of chaperone-mediated protein complex assembly(GO:0090034) positive regulation of chaperone-mediated protein complex assembly(GO:0090035) |
| 0.0 | 0.1 | GO:0042270 | protection from natural killer cell mediated cytotoxicity(GO:0042270) |
| 0.0 | 0.1 | GO:0043553 | negative regulation of phosphatidylinositol 3-kinase activity(GO:0043553) |
| 0.0 | 0.3 | GO:0007084 | mitotic nuclear envelope reassembly(GO:0007084) |
| 0.0 | 0.2 | GO:0007598 | blood coagulation, extrinsic pathway(GO:0007598) |
| 0.0 | 0.3 | GO:0070862 | negative regulation of protein exit from endoplasmic reticulum(GO:0070862) negative regulation of retrograde protein transport, ER to cytosol(GO:1904153) |
| 0.0 | 0.1 | GO:2000234 | positive regulation of ribosome biogenesis(GO:0090070) positive regulation of rRNA processing(GO:2000234) |
| 0.0 | 0.1 | GO:0035927 | RNA import into mitochondrion(GO:0035927) |
| 0.0 | 0.8 | GO:0097421 | liver regeneration(GO:0097421) |
| 0.0 | 0.2 | GO:0075525 | viral translational termination-reinitiation(GO:0075525) |
| 0.0 | 0.1 | GO:0006382 | adenosine to inosine editing(GO:0006382) |
| 0.0 | 0.1 | GO:0051771 | negative regulation of nitric-oxide synthase biosynthetic process(GO:0051771) |
| 0.0 | 0.2 | GO:0007144 | female meiosis I(GO:0007144) |
| 0.0 | 0.8 | GO:0000188 | inactivation of MAPK activity(GO:0000188) |
| 0.0 | 0.4 | GO:0007220 | Notch receptor processing(GO:0007220) |
| 0.0 | 0.1 | GO:0000395 | mRNA 5'-splice site recognition(GO:0000395) |
| 0.0 | 0.1 | GO:0033299 | secretion of lysosomal enzymes(GO:0033299) |
| 0.0 | 0.2 | GO:1903800 | positive regulation of production of miRNAs involved in gene silencing by miRNA(GO:1903800) |
| 0.0 | 0.3 | GO:0016998 | cell wall macromolecule catabolic process(GO:0016998) |
| 0.0 | 0.2 | GO:0045039 | protein import into mitochondrial inner membrane(GO:0045039) |
| 0.0 | 0.3 | GO:0070863 | positive regulation of protein exit from endoplasmic reticulum(GO:0070863) |
| 0.0 | 0.1 | GO:0070902 | mitochondrial tRNA pseudouridine synthesis(GO:0070902) |
| 0.0 | 0.3 | GO:0034315 | regulation of Arp2/3 complex-mediated actin nucleation(GO:0034315) |
| 0.0 | 0.4 | GO:0044030 | regulation of DNA methylation(GO:0044030) |
| 0.0 | 0.2 | GO:1901098 | positive regulation of autophagosome maturation(GO:1901098) |
| 0.0 | 0.1 | GO:1901096 | regulation of autophagosome maturation(GO:1901096) |
| 0.0 | 0.1 | GO:0032218 | riboflavin transport(GO:0032218) |
| 0.0 | 0.2 | GO:0000463 | maturation of LSU-rRNA from tricistronic rRNA transcript (SSU-rRNA, 5.8S rRNA, LSU-rRNA)(GO:0000463) |
| 0.0 | 0.4 | GO:0045899 | positive regulation of RNA polymerase II transcriptional preinitiation complex assembly(GO:0045899) |
| 0.0 | 0.2 | GO:0000055 | ribosomal large subunit export from nucleus(GO:0000055) |
| 0.0 | 0.5 | GO:0036295 | cellular response to increased oxygen levels(GO:0036295) |
| 0.0 | 0.2 | GO:0075522 | IRES-dependent viral translational initiation(GO:0075522) |
| 0.0 | 0.5 | GO:0030539 | male genitalia development(GO:0030539) |
| 0.0 | 0.1 | GO:0009048 | dosage compensation(GO:0007549) dosage compensation by inactivation of X chromosome(GO:0009048) |
| 0.0 | 0.4 | GO:0006491 | N-glycan processing(GO:0006491) |
| 0.0 | 0.1 | GO:0071962 | mitotic sister chromatid cohesion, centromeric(GO:0071962) |
| 0.0 | 0.3 | GO:0000470 | maturation of LSU-rRNA(GO:0000470) |
| 0.0 | 0.1 | GO:0038123 | toll-like receptor TLR1:TLR2 signaling pathway(GO:0038123) response to triacyl bacterial lipopeptide(GO:0071725) cellular response to triacyl bacterial lipopeptide(GO:0071727) |
| 0.0 | 0.1 | GO:2000452 | CD8-positive, alpha-beta cytotoxic T cell extravasation(GO:0035698) regulation of CD8-positive, alpha-beta cytotoxic T cell extravasation(GO:2000452) |
| 0.0 | 0.2 | GO:0010826 | negative regulation of centrosome duplication(GO:0010826) |
| 0.0 | 0.2 | GO:0018095 | protein polyglutamylation(GO:0018095) |
| 0.0 | 0.2 | GO:0060842 | arterial endothelial cell differentiation(GO:0060842) |
| 0.0 | 0.7 | GO:0051031 | tRNA export from nucleus(GO:0006409) tRNA transport(GO:0051031) tRNA-containing ribonucleoprotein complex export from nucleus(GO:0071431) |
| 0.0 | 0.1 | GO:0001672 | regulation of chromatin assembly or disassembly(GO:0001672) |
| 0.0 | 0.4 | GO:0006488 | dolichol-linked oligosaccharide biosynthetic process(GO:0006488) |
| 0.0 | 0.2 | GO:0015886 | heme transport(GO:0015886) iron coordination entity transport(GO:1901678) |
| 0.0 | 0.2 | GO:0051013 | microtubule severing(GO:0051013) |
| 0.0 | 0.3 | GO:0090110 | cargo loading into COPII-coated vesicle(GO:0090110) |
| 0.0 | 0.2 | GO:1901727 | positive regulation of histone deacetylase activity(GO:1901727) |
| 0.0 | 0.1 | GO:0034378 | chylomicron assembly(GO:0034378) |
| 0.0 | 0.1 | GO:0035970 | peptidyl-threonine dephosphorylation(GO:0035970) |
| 0.0 | 0.4 | GO:0032802 | low-density lipoprotein particle receptor catabolic process(GO:0032802) |
| 0.0 | 0.1 | GO:0051045 | negative regulation of membrane protein ectodomain proteolysis(GO:0051045) |
| 0.0 | 0.2 | GO:0017182 | peptidyl-diphthamide metabolic process(GO:0017182) peptidyl-diphthamide biosynthetic process from peptidyl-histidine(GO:0017183) |
| 0.0 | 0.3 | GO:0034975 | protein folding in endoplasmic reticulum(GO:0034975) |
| 0.0 | 0.1 | GO:0060335 | positive regulation of response to interferon-gamma(GO:0060332) positive regulation of interferon-gamma-mediated signaling pathway(GO:0060335) |
| 0.0 | 0.3 | GO:0006895 | Golgi to endosome transport(GO:0006895) |
| 0.0 | 0.4 | GO:0007216 | G-protein coupled glutamate receptor signaling pathway(GO:0007216) |
| 0.0 | 0.4 | GO:0034389 | lipid particle organization(GO:0034389) |
| 0.0 | 0.2 | GO:0042407 | cristae formation(GO:0042407) |
| 0.0 | 0.0 | GO:0032764 | negative regulation of mast cell cytokine production(GO:0032764) negative regulation of mitotic cell cycle DNA replication(GO:1903464) |
| 0.0 | 0.0 | GO:0051877 | pigment granule aggregation in cell center(GO:0051877) |
| 0.0 | 0.0 | GO:0032707 | negative regulation of interleukin-23 production(GO:0032707) |
| 0.0 | 0.5 | GO:0018345 | protein palmitoylation(GO:0018345) |
| 0.0 | 0.1 | GO:0007042 | lysosomal lumen acidification(GO:0007042) |
| 0.0 | 0.1 | GO:0002644 | negative regulation of tolerance induction(GO:0002644) |
| 0.0 | 0.0 | GO:0045347 | negative regulation of MHC class II biosynthetic process(GO:0045347) |
| 0.0 | 0.1 | GO:0033152 | immunoglobulin V(D)J recombination(GO:0033152) |
| 0.0 | 0.2 | GO:0006450 | regulation of translational fidelity(GO:0006450) |
| 0.0 | 0.3 | GO:0007096 | regulation of exit from mitosis(GO:0007096) |
| 0.0 | 0.2 | GO:2000623 | regulation of nuclear-transcribed mRNA catabolic process, nonsense-mediated decay(GO:2000622) negative regulation of nuclear-transcribed mRNA catabolic process, nonsense-mediated decay(GO:2000623) |
| 0.0 | 0.2 | GO:0040032 | post-embryonic body morphogenesis(GO:0040032) |
| 0.0 | 0.1 | GO:0006662 | glycerol ether metabolic process(GO:0006662) |
| 0.0 | 0.2 | GO:0015868 | purine ribonucleotide transport(GO:0015868) |
| 0.0 | 0.7 | GO:0018279 | protein N-linked glycosylation via asparagine(GO:0018279) |
| 0.0 | 0.4 | GO:0061099 | negative regulation of protein tyrosine kinase activity(GO:0061099) |
| 0.0 | 0.1 | GO:0016576 | histone dephosphorylation(GO:0016576) |
| 0.0 | 0.2 | GO:0045475 | locomotor rhythm(GO:0045475) |
| 0.0 | 0.2 | GO:0070935 | 3'-UTR-mediated mRNA stabilization(GO:0070935) |
| 0.0 | 0.1 | GO:0071028 | nuclear RNA surveillance(GO:0071027) nuclear mRNA surveillance(GO:0071028) |
| 0.0 | 0.1 | GO:0001920 | negative regulation of receptor recycling(GO:0001920) |
| 0.0 | 0.1 | GO:0006398 | mRNA 3'-end processing by stem-loop binding and cleavage(GO:0006398) |
| 0.0 | 0.1 | GO:0051697 | protein delipidation(GO:0051697) |
| 0.0 | 1.6 | GO:0006613 | cotranslational protein targeting to membrane(GO:0006613) |
| 0.0 | 0.1 | GO:0034227 | tRNA thio-modification(GO:0034227) |
| 0.0 | 0.0 | GO:0030035 | microspike assembly(GO:0030035) |
Gene overrepresentation in cellular component category:
| Log-likelihood per target | Total log-likelihood | Term | Description |
|---|---|---|---|
| 0.2 | 0.6 | GO:0055028 | cortical microtubule(GO:0055028) |
| 0.2 | 0.5 | GO:0071006 | U2-type catalytic step 1 spliceosome(GO:0071006) |
| 0.2 | 0.6 | GO:0034365 | discoidal high-density lipoprotein particle(GO:0034365) |
| 0.2 | 0.6 | GO:0071818 | BAT3 complex(GO:0071818) ER membrane insertion complex(GO:0072379) |
| 0.1 | 0.4 | GO:0010370 | perinucleolar chromocenter(GO:0010370) |
| 0.1 | 1.3 | GO:0072487 | MSL complex(GO:0072487) |
| 0.1 | 1.1 | GO:0097451 | glial limiting end-foot(GO:0097451) |
| 0.1 | 0.4 | GO:1990590 | ATF1-ATF4 transcription factor complex(GO:1990590) |
| 0.1 | 1.1 | GO:0098560 | cytoplasmic side of early endosome membrane(GO:0098559) cytoplasmic side of late endosome membrane(GO:0098560) |
| 0.1 | 0.4 | GO:0071012 | catalytic step 1 spliceosome(GO:0071012) |
| 0.1 | 1.0 | GO:0043196 | varicosity(GO:0043196) |
| 0.1 | 0.4 | GO:0005595 | collagen type XII trimer(GO:0005595) |
| 0.1 | 0.9 | GO:0019907 | cyclin-dependent protein kinase activating kinase holoenzyme complex(GO:0019907) |
| 0.1 | 0.9 | GO:0070765 | gamma-secretase complex(GO:0070765) |
| 0.1 | 1.5 | GO:0000176 | nuclear exosome (RNase complex)(GO:0000176) |
| 0.1 | 0.3 | GO:0005674 | transcription factor TFIIF complex(GO:0005674) |
| 0.1 | 0.3 | GO:0018444 | translation release factor complex(GO:0018444) |
| 0.1 | 1.1 | GO:0072546 | ER membrane protein complex(GO:0072546) |
| 0.1 | 1.0 | GO:0033588 | Elongator holoenzyme complex(GO:0033588) |
| 0.1 | 0.5 | GO:0042765 | GPI-anchor transamidase complex(GO:0042765) |
| 0.1 | 2.2 | GO:0000145 | exocyst(GO:0000145) |
| 0.1 | 1.6 | GO:0031265 | CD95 death-inducing signaling complex(GO:0031265) |
| 0.1 | 0.5 | GO:0032021 | NELF complex(GO:0032021) |
| 0.1 | 5.1 | GO:0005881 | cytoplasmic microtubule(GO:0005881) |
| 0.1 | 0.2 | GO:0071001 | U4/U6 snRNP(GO:0071001) |
| 0.1 | 0.5 | GO:0042406 | extrinsic component of endoplasmic reticulum membrane(GO:0042406) |
| 0.1 | 0.2 | GO:0060187 | cell pole(GO:0060187) |
| 0.1 | 0.6 | GO:0071541 | eukaryotic translation initiation factor 3 complex, eIF3m(GO:0071541) |
| 0.1 | 0.3 | GO:1990769 | proximal neuron projection(GO:1990769) |
| 0.1 | 0.3 | GO:0031417 | NatC complex(GO:0031417) |
| 0.1 | 0.7 | GO:0035749 | myelin sheath adaxonal region(GO:0035749) |
| 0.1 | 0.2 | GO:0070435 | Shc-EGFR complex(GO:0070435) |
| 0.0 | 0.4 | GO:0016272 | prefoldin complex(GO:0016272) |
| 0.0 | 0.3 | GO:0005956 | protein kinase CK2 complex(GO:0005956) |
| 0.0 | 0.5 | GO:0097255 | R2TP complex(GO:0097255) |
| 0.0 | 0.4 | GO:0032133 | chromosome passenger complex(GO:0032133) |
| 0.0 | 0.4 | GO:0071986 | Ragulator complex(GO:0071986) |
| 0.0 | 0.6 | GO:0097136 | Bcl-2 family protein complex(GO:0097136) |
| 0.0 | 0.1 | GO:0034455 | t-UTP complex(GO:0034455) |
| 0.0 | 0.8 | GO:0008250 | oligosaccharyltransferase complex(GO:0008250) |
| 0.0 | 0.7 | GO:0005687 | U4 snRNP(GO:0005687) |
| 0.0 | 1.2 | GO:0035267 | NuA4 histone acetyltransferase complex(GO:0035267) H4/H2A histone acetyltransferase complex(GO:0043189) H4 histone acetyltransferase complex(GO:1902562) |
| 0.0 | 0.1 | GO:0016222 | procollagen-proline 4-dioxygenase complex(GO:0016222) |
| 0.0 | 1.2 | GO:0070971 | endoplasmic reticulum exit site(GO:0070971) |
| 0.0 | 0.5 | GO:0002199 | zona pellucida receptor complex(GO:0002199) |
| 0.0 | 0.1 | GO:0001534 | radial spoke(GO:0001534) |
| 0.0 | 0.1 | GO:0008537 | proteasome activator complex(GO:0008537) |
| 0.0 | 0.6 | GO:0005751 | mitochondrial respiratory chain complex IV(GO:0005751) |
| 0.0 | 0.1 | GO:0000814 | ESCRT II complex(GO:0000814) |
| 0.0 | 0.3 | GO:0042719 | mitochondrial intermembrane space protein transporter complex(GO:0042719) |
| 0.0 | 0.6 | GO:0030008 | TRAPP complex(GO:0030008) |
| 0.0 | 0.4 | GO:0045252 | oxoglutarate dehydrogenase complex(GO:0045252) |
| 0.0 | 0.3 | GO:0000110 | nucleotide-excision repair factor 1 complex(GO:0000110) |
| 0.0 | 0.2 | GO:0070022 | transforming growth factor beta receptor homodimeric complex(GO:0070022) |
| 0.0 | 0.4 | GO:0005785 | signal recognition particle receptor complex(GO:0005785) |
| 0.0 | 0.2 | GO:0061617 | MICOS complex(GO:0061617) |
| 0.0 | 0.5 | GO:0000815 | ESCRT III complex(GO:0000815) |
| 0.0 | 0.5 | GO:0042555 | MCM complex(GO:0042555) |
| 0.0 | 0.4 | GO:0030478 | actin cap(GO:0030478) |
| 0.0 | 0.2 | GO:0097165 | nuclear stress granule(GO:0097165) |
| 0.0 | 0.2 | GO:0072589 | box H/ACA scaRNP complex(GO:0072589) box H/ACA telomerase RNP complex(GO:0090661) |
| 0.0 | 0.5 | GO:0071439 | clathrin complex(GO:0071439) |
| 0.0 | 0.4 | GO:0005744 | mitochondrial inner membrane presequence translocase complex(GO:0005744) |
| 0.0 | 0.7 | GO:0046540 | U4/U6 x U5 tri-snRNP complex(GO:0046540) |
| 0.0 | 0.1 | GO:0001651 | dense fibrillar component(GO:0001651) |
| 0.0 | 0.1 | GO:0005745 | m-AAA complex(GO:0005745) |
| 0.0 | 0.4 | GO:0033179 | proton-transporting V-type ATPase, V0 domain(GO:0033179) |
| 0.0 | 0.2 | GO:0000127 | transcription factor TFIIIC complex(GO:0000127) |
| 0.0 | 0.3 | GO:0036513 | Derlin-1 retrotranslocation complex(GO:0036513) |
| 0.0 | 0.2 | GO:0031618 | nuclear pericentric heterochromatin(GO:0031618) |
| 0.0 | 0.1 | GO:0005846 | nuclear cap binding complex(GO:0005846) |
| 0.0 | 0.3 | GO:0031595 | nuclear proteasome complex(GO:0031595) |
| 0.0 | 1.7 | GO:0000315 | organellar large ribosomal subunit(GO:0000315) mitochondrial large ribosomal subunit(GO:0005762) |
| 0.0 | 0.3 | GO:0030127 | COPII vesicle coat(GO:0030127) |
| 0.0 | 0.6 | GO:0005849 | mRNA cleavage factor complex(GO:0005849) |
| 0.0 | 0.1 | GO:0032044 | DSIF complex(GO:0032044) |
| 0.0 | 0.1 | GO:0005577 | fibrinogen complex(GO:0005577) |
| 0.0 | 0.2 | GO:0031414 | N-terminal protein acetyltransferase complex(GO:0031414) |
| 0.0 | 0.3 | GO:0005852 | eukaryotic translation initiation factor 3 complex(GO:0005852) |
| 0.0 | 0.2 | GO:0043203 | axon hillock(GO:0043203) |
| 0.0 | 0.3 | GO:0008278 | cohesin complex(GO:0008278) |
| 0.0 | 0.2 | GO:0031298 | replication fork protection complex(GO:0031298) |
| 0.0 | 1.1 | GO:0002102 | podosome(GO:0002102) |
| 0.0 | 2.8 | GO:0016605 | PML body(GO:0016605) |
| 0.0 | 0.1 | GO:0033553 | rDNA heterochromatin(GO:0033553) |
| 0.0 | 0.2 | GO:0070552 | BRISC complex(GO:0070552) |
| 0.0 | 0.3 | GO:0042588 | zymogen granule(GO:0042588) |
| 0.0 | 0.3 | GO:0005689 | U12-type spliceosomal complex(GO:0005689) |
| 0.0 | 0.1 | GO:0042272 | nuclear RNA export factor complex(GO:0042272) |
| 0.0 | 0.0 | GO:0034657 | GID complex(GO:0034657) |
| 0.0 | 0.1 | GO:0036156 | inner dynein arm(GO:0036156) |
| 0.0 | 0.5 | GO:0030686 | 90S preribosome(GO:0030686) |
| 0.0 | 0.4 | GO:0044322 | endoplasmic reticulum quality control compartment(GO:0044322) |
| 0.0 | 1.4 | GO:0097610 | cleavage furrow(GO:0032154) cell surface furrow(GO:0097610) |
| 0.0 | 0.1 | GO:0097443 | sorting endosome(GO:0097443) |
| 0.0 | 0.1 | GO:0034709 | methylosome(GO:0034709) |
| 0.0 | 0.1 | GO:0030289 | protein phosphatase 4 complex(GO:0030289) |
| 0.0 | 0.6 | GO:0000407 | pre-autophagosomal structure(GO:0000407) |
| 0.0 | 0.2 | GO:0033391 | chromatoid body(GO:0033391) |
| 0.0 | 0.2 | GO:0033018 | sarcoplasmic reticulum lumen(GO:0033018) |
| 0.0 | 0.1 | GO:0032937 | SREBP-SCAP-Insig complex(GO:0032937) |
| 0.0 | 0.2 | GO:1990316 | ATG1/ULK1 kinase complex(GO:1990316) |
| 0.0 | 0.0 | GO:0090498 | extrinsic component of Golgi membrane(GO:0090498) |
| 0.0 | 0.1 | GO:0030905 | retromer, tubulation complex(GO:0030905) |
| 0.0 | 0.5 | GO:0030687 | preribosome, large subunit precursor(GO:0030687) |
| 0.0 | 0.1 | GO:0034687 | integrin alphaL-beta2 complex(GO:0034687) |
| 0.0 | 1.5 | GO:0022625 | cytosolic large ribosomal subunit(GO:0022625) |
| 0.0 | 0.0 | GO:1902636 | kinociliary basal body(GO:1902636) |
| 0.0 | 0.4 | GO:0005719 | nuclear euchromatin(GO:0005719) |
| 0.0 | 0.1 | GO:0000812 | Swr1 complex(GO:0000812) |
| 0.0 | 0.1 | GO:0036157 | outer dynein arm(GO:0036157) |
| 0.0 | 0.1 | GO:0002177 | manchette(GO:0002177) |
| 0.0 | 0.1 | GO:0036396 | MIS complex(GO:0036396) mRNA editing complex(GO:0045293) |
| 0.0 | 0.2 | GO:0000813 | ESCRT I complex(GO:0000813) |
| 0.0 | 0.4 | GO:0031143 | pseudopodium(GO:0031143) |
| 0.0 | 0.2 | GO:0005721 | pericentric heterochromatin(GO:0005721) |
| 0.0 | 0.2 | GO:0005685 | U1 snRNP(GO:0005685) |
| 0.0 | 0.7 | GO:0042645 | nucleoid(GO:0009295) mitochondrial nucleoid(GO:0042645) |
| 0.0 | 0.2 | GO:0008385 | IkappaB kinase complex(GO:0008385) |
| 0.0 | 0.2 | GO:0030904 | retromer complex(GO:0030904) |
| 0.0 | 0.1 | GO:0005784 | Sec61 translocon complex(GO:0005784) translocon complex(GO:0071256) |
| 0.0 | 0.0 | GO:0005953 | CAAX-protein geranylgeranyltransferase complex(GO:0005953) |
| 0.0 | 0.2 | GO:0032059 | bleb(GO:0032059) |
| 0.0 | 0.3 | GO:0005671 | Ada2/Gcn5/Ada3 transcription activator complex(GO:0005671) |
| 0.0 | 0.7 | GO:0016235 | aggresome(GO:0016235) |
| 0.0 | 0.5 | GO:0002080 | acrosomal membrane(GO:0002080) |
| 0.0 | 0.0 | GO:0097679 | other organism cytoplasm(GO:0097679) |
| 0.0 | 0.2 | GO:0005838 | proteasome regulatory particle(GO:0005838) proteasome accessory complex(GO:0022624) |
| 0.0 | 1.2 | GO:0031093 | platelet alpha granule lumen(GO:0031093) |
| 0.0 | 0.3 | GO:0031307 | integral component of mitochondrial outer membrane(GO:0031307) |
| 0.0 | 0.3 | GO:0031528 | microvillus membrane(GO:0031528) |
Gene overrepresentation in molecular function category:
| Log-likelihood per target | Total log-likelihood | Term | Description |
|---|---|---|---|
| 0.4 | 1.2 | GO:0035248 | alpha-1,4-N-acetylgalactosaminyltransferase activity(GO:0035248) |
| 0.4 | 1.1 | GO:0008859 | exoribonuclease II activity(GO:0008859) |
| 0.3 | 1.4 | GO:0004909 | interleukin-1, Type I, activating receptor activity(GO:0004909) |
| 0.3 | 1.7 | GO:0035800 | deubiquitinase activator activity(GO:0035800) |
| 0.2 | 0.9 | GO:1904288 | BAT3 complex binding(GO:1904288) |
| 0.2 | 0.2 | GO:0000992 | polymerase III regulatory region sequence-specific DNA binding(GO:0000992) RNA polymerase III type 1 promoter sequence-specific DNA binding(GO:0001002) RNA polymerase III type 2 promoter sequence-specific DNA binding(GO:0001003) |
| 0.2 | 0.5 | GO:0002113 | interleukin-33 binding(GO:0002113) |
| 0.2 | 2.9 | GO:0008140 | cAMP response element binding protein binding(GO:0008140) |
| 0.2 | 1.6 | GO:0001042 | RNA polymerase I core binding(GO:0001042) |
| 0.1 | 0.7 | GO:0016230 | sphingomyelin phosphodiesterase activator activity(GO:0016230) |
| 0.1 | 0.4 | GO:0005519 | cytoskeletal regulatory protein binding(GO:0005519) |
| 0.1 | 0.6 | GO:0001010 | transcription factor activity, sequence-specific DNA binding transcription factor recruiting(GO:0001010) |
| 0.1 | 0.4 | GO:0042134 | rRNA primary transcript binding(GO:0042134) |
| 0.1 | 0.3 | GO:0055100 | adiponectin binding(GO:0055100) |
| 0.1 | 0.3 | GO:0004651 | polynucleotide 5'-phosphatase activity(GO:0004651) |
| 0.1 | 0.5 | GO:0070180 | large ribosomal subunit rRNA binding(GO:0070180) |
| 0.1 | 0.3 | GO:0004146 | dihydrofolate reductase activity(GO:0004146) |
| 0.1 | 0.4 | GO:0000179 | rRNA (adenine-N6,N6-)-dimethyltransferase activity(GO:0000179) |
| 0.1 | 0.9 | GO:0030621 | U4 snRNA binding(GO:0030621) |
| 0.1 | 0.5 | GO:0003923 | GPI-anchor transamidase activity(GO:0003923) |
| 0.1 | 0.5 | GO:0042500 | aspartic endopeptidase activity, intramembrane cleaving(GO:0042500) |
| 0.1 | 0.4 | GO:0008321 | Ral guanyl-nucleotide exchange factor activity(GO:0008321) |
| 0.1 | 0.2 | GO:0005026 | transforming growth factor beta receptor activity, type II(GO:0005026) |
| 0.1 | 0.2 | GO:0047025 | 3-oxoacyl-[acyl-carrier-protein] reductase (NADH) activity(GO:0047025) |
| 0.1 | 3.1 | GO:0005164 | tumor necrosis factor receptor binding(GO:0005164) |
| 0.1 | 1.5 | GO:0051787 | misfolded protein binding(GO:0051787) |
| 0.1 | 2.0 | GO:0097200 | cysteine-type endopeptidase activity involved in execution phase of apoptosis(GO:0097200) |
| 0.1 | 0.5 | GO:0001016 | RNA polymerase III regulatory region DNA binding(GO:0001016) |
| 0.1 | 0.3 | GO:0032184 | SUMO polymer binding(GO:0032184) |
| 0.1 | 0.3 | GO:0004045 | aminoacyl-tRNA hydrolase activity(GO:0004045) |
| 0.1 | 0.4 | GO:0016748 | succinyltransferase activity(GO:0016748) |
| 0.1 | 0.8 | GO:0071933 | Arp2/3 complex binding(GO:0071933) |
| 0.1 | 0.2 | GO:0005471 | ATP:ADP antiporter activity(GO:0005471) adenine transmembrane transporter activity(GO:0015207) |
| 0.1 | 0.6 | GO:0004565 | beta-galactosidase activity(GO:0004565) |
| 0.1 | 0.2 | GO:0102008 | cytosolic dipeptidase activity(GO:0102008) |
| 0.1 | 0.3 | GO:0008823 | cupric reductase activity(GO:0008823) ferric-chelate reductase (NADPH) activity(GO:0052851) |
| 0.1 | 0.7 | GO:0015266 | protein channel activity(GO:0015266) |
| 0.1 | 0.2 | GO:0035514 | DNA demethylase activity(GO:0035514) |
| 0.0 | 0.2 | GO:0098770 | FBXO family protein binding(GO:0098770) |
| 0.0 | 0.5 | GO:0043139 | 5'-3' DNA helicase activity(GO:0043139) |
| 0.0 | 0.6 | GO:0004579 | dolichyl-diphosphooligosaccharide-protein glycotransferase activity(GO:0004579) |
| 0.0 | 2.1 | GO:0017091 | AU-rich element binding(GO:0017091) |
| 0.0 | 0.1 | GO:0051377 | mannose-ethanolamine phosphotransferase activity(GO:0051377) |
| 0.0 | 0.3 | GO:0060698 | endoribonuclease inhibitor activity(GO:0060698) |
| 0.0 | 0.4 | GO:0035174 | histone serine kinase activity(GO:0035174) |
| 0.0 | 0.7 | GO:0000014 | single-stranded DNA endodeoxyribonuclease activity(GO:0000014) |
| 0.0 | 0.4 | GO:0000990 | transcription factor activity, core RNA polymerase binding(GO:0000990) |
| 0.0 | 0.4 | GO:0005047 | signal recognition particle binding(GO:0005047) |
| 0.0 | 0.1 | GO:0080023 | 3R-hydroxyacyl-CoA dehydratase activity(GO:0080023) |
| 0.0 | 0.4 | GO:0070290 | N-acylphosphatidylethanolamine-specific phospholipase D activity(GO:0070290) |
| 0.0 | 0.2 | GO:0004449 | isocitrate dehydrogenase (NAD+) activity(GO:0004449) |
| 0.0 | 0.7 | GO:0034450 | ubiquitin-ubiquitin ligase activity(GO:0034450) |
| 0.0 | 0.2 | GO:0003976 | UDP-N-acetylglucosamine-lysosomal-enzyme N-acetylglucosaminephosphotransferase activity(GO:0003976) |
| 0.0 | 0.2 | GO:0035614 | snRNA stem-loop binding(GO:0035614) |
| 0.0 | 0.4 | GO:0036402 | proteasome-activating ATPase activity(GO:0036402) |
| 0.0 | 0.2 | GO:0044736 | acid-sensing ion channel activity(GO:0044736) |
| 0.0 | 0.2 | GO:0030620 | U2 snRNA binding(GO:0030620) |
| 0.0 | 3.4 | GO:0030374 | ligand-dependent nuclear receptor transcription coactivator activity(GO:0030374) |
| 0.0 | 0.2 | GO:0004169 | dolichyl-phosphate-mannose-protein mannosyltransferase activity(GO:0004169) |
| 0.0 | 0.7 | GO:0009931 | calcium-dependent protein serine/threonine kinase activity(GO:0009931) |
| 0.0 | 0.5 | GO:0043176 | amine binding(GO:0043176) serotonin binding(GO:0051378) |
| 0.0 | 0.3 | GO:0016531 | copper chaperone activity(GO:0016531) |
| 0.0 | 0.5 | GO:0051011 | microtubule minus-end binding(GO:0051011) |
| 0.0 | 3.1 | GO:0050681 | androgen receptor binding(GO:0050681) |
| 0.0 | 0.1 | GO:0034511 | U3 snoRNA binding(GO:0034511) |
| 0.0 | 0.1 | GO:0004461 | lactose synthase activity(GO:0004461) |
| 0.0 | 0.5 | GO:0032050 | clathrin heavy chain binding(GO:0032050) |
| 0.0 | 0.5 | GO:0000774 | adenyl-nucleotide exchange factor activity(GO:0000774) |
| 0.0 | 0.3 | GO:0008553 | hydrogen-exporting ATPase activity, phosphorylative mechanism(GO:0008553) |
| 0.0 | 0.2 | GO:0008109 | N-acetyllactosaminide beta-1,6-N-acetylglucosaminyltransferase activity(GO:0008109) |
| 0.0 | 0.3 | GO:0008420 | CTD phosphatase activity(GO:0008420) |
| 0.0 | 0.1 | GO:0034353 | RNA pyrophosphohydrolase activity(GO:0034353) |
| 0.0 | 0.6 | GO:0097602 | cullin family protein binding(GO:0097602) |
| 0.0 | 0.2 | GO:0003747 | translation release factor activity(GO:0003747) translation termination factor activity(GO:0008079) |
| 0.0 | 0.4 | GO:0030020 | extracellular matrix structural constituent conferring tensile strength(GO:0030020) |
| 0.0 | 0.2 | GO:0001165 | RNA polymerase I upstream control element sequence-specific DNA binding(GO:0001165) |
| 0.0 | 0.4 | GO:0043522 | leucine zipper domain binding(GO:0043522) |
| 0.0 | 0.2 | GO:0047961 | glycine N-acyltransferase activity(GO:0047961) |
| 0.0 | 0.3 | GO:1904264 | ubiquitin protein ligase activity involved in ERAD pathway(GO:1904264) |
| 0.0 | 0.1 | GO:0004792 | thiosulfate sulfurtransferase activity(GO:0004792) |
| 0.0 | 0.5 | GO:0004596 | peptide alpha-N-acetyltransferase activity(GO:0004596) |
| 0.0 | 0.2 | GO:0003886 | DNA (cytosine-5-)-methyltransferase activity(GO:0003886) |
| 0.0 | 0.2 | GO:0015235 | cobalamin transporter activity(GO:0015235) |
| 0.0 | 0.1 | GO:1990460 | leptin receptor binding(GO:1990460) |
| 0.0 | 0.1 | GO:0047134 | protein-disulfide reductase activity(GO:0047134) |
| 0.0 | 0.1 | GO:0044715 | 8-oxo-dGDP phosphatase activity(GO:0044715) |
| 0.0 | 0.1 | GO:0047179 | platelet-activating factor acetyltransferase activity(GO:0047179) |
| 0.0 | 0.6 | GO:0019871 | sodium channel inhibitor activity(GO:0019871) |
| 0.0 | 0.1 | GO:0008113 | peptide-methionine (S)-S-oxide reductase activity(GO:0008113) |
| 0.0 | 0.9 | GO:0005035 | tumor necrosis factor-activated receptor activity(GO:0005031) death receptor activity(GO:0005035) |
| 0.0 | 0.1 | GO:0022865 | transmembrane electron transfer carrier(GO:0022865) |
| 0.0 | 0.1 | GO:0034584 | piRNA binding(GO:0034584) |
| 0.0 | 0.2 | GO:0034513 | box H/ACA snoRNA binding(GO:0034513) |
| 0.0 | 0.8 | GO:0047555 | 3',5'-cyclic-GMP phosphodiesterase activity(GO:0047555) |
| 0.0 | 0.1 | GO:0046933 | proton-transporting ATP synthase activity, rotational mechanism(GO:0046933) |
| 0.0 | 0.8 | GO:0008327 | methyl-CpG binding(GO:0008327) |
| 0.0 | 0.1 | GO:0016422 | mRNA (2'-O-methyladenosine-N6-)-methyltransferase activity(GO:0016422) |
| 0.0 | 0.3 | GO:0031821 | G-protein coupled serotonin receptor binding(GO:0031821) |
| 0.0 | 0.2 | GO:0005384 | manganese ion transmembrane transporter activity(GO:0005384) |
| 0.0 | 0.4 | GO:0035256 | G-protein coupled glutamate receptor binding(GO:0035256) |
| 0.0 | 1.2 | GO:0001103 | RNA polymerase II repressing transcription factor binding(GO:0001103) |
| 0.0 | 0.3 | GO:0003796 | lysozyme activity(GO:0003796) |
| 0.0 | 0.1 | GO:0004656 | procollagen-proline 4-dioxygenase activity(GO:0004656) |
| 0.0 | 0.1 | GO:0061575 | cyclin-dependent protein serine/threonine kinase activator activity(GO:0061575) |
| 0.0 | 0.1 | GO:0004730 | pseudouridylate synthase activity(GO:0004730) |
| 0.0 | 0.3 | GO:0008097 | 5S rRNA binding(GO:0008097) |
| 0.0 | 0.6 | GO:0016676 | cytochrome-c oxidase activity(GO:0004129) heme-copper terminal oxidase activity(GO:0015002) oxidoreductase activity, acting on a heme group of donors, oxygen as acceptor(GO:0016676) |
| 0.0 | 1.0 | GO:0032266 | phosphatidylinositol-3-phosphate binding(GO:0032266) |
| 0.0 | 0.1 | GO:0032217 | riboflavin transporter activity(GO:0032217) |
| 0.0 | 0.1 | GO:0061133 | endopeptidase activator activity(GO:0061133) |
| 0.0 | 0.2 | GO:0070740 | tubulin-glutamic acid ligase activity(GO:0070740) |
| 0.0 | 0.2 | GO:0035381 | extracellular ATP-gated cation channel activity(GO:0004931) ATP-gated ion channel activity(GO:0035381) |
| 0.0 | 0.1 | GO:0004614 | phosphoglucomutase activity(GO:0004614) |
| 0.0 | 0.1 | GO:1990259 | protein-glutamine N-methyltransferase activity(GO:0036009) histone-glutamine methyltransferase activity(GO:1990259) |
| 0.0 | 0.3 | GO:0031681 | G-protein beta-subunit binding(GO:0031681) |
| 0.0 | 0.3 | GO:0043422 | protein kinase B binding(GO:0043422) |
| 0.0 | 0.1 | GO:0004982 | N-formyl peptide receptor activity(GO:0004982) |
| 0.0 | 0.2 | GO:0019784 | NEDD8-specific protease activity(GO:0019784) |
| 0.0 | 0.3 | GO:0004791 | thioredoxin-disulfide reductase activity(GO:0004791) |
| 0.0 | 0.6 | GO:0001671 | ATPase activator activity(GO:0001671) |
| 0.0 | 0.3 | GO:0015174 | basic amino acid transmembrane transporter activity(GO:0015174) |
| 0.0 | 0.2 | GO:0015129 | lactate transmembrane transporter activity(GO:0015129) |
| 0.0 | 0.2 | GO:0015232 | heme transporter activity(GO:0015232) |
| 0.0 | 0.2 | GO:0008568 | microtubule-severing ATPase activity(GO:0008568) |
| 0.0 | 0.4 | GO:0017025 | TBP-class protein binding(GO:0017025) |
| 0.0 | 0.6 | GO:0019707 | protein-cysteine S-palmitoyltransferase activity(GO:0019706) protein-cysteine S-acyltransferase activity(GO:0019707) |
| 0.0 | 0.9 | GO:0004693 | cyclin-dependent protein serine/threonine kinase activity(GO:0004693) |
| 0.0 | 0.3 | GO:0070273 | phosphatidylinositol-4-phosphate binding(GO:0070273) |
| 0.0 | 0.1 | GO:0008889 | glycerophosphodiester phosphodiesterase activity(GO:0008889) |
| 0.0 | 0.8 | GO:0050699 | WW domain binding(GO:0050699) |
| 0.0 | 0.0 | GO:1990932 | 5.8S rRNA binding(GO:1990932) |
| 0.0 | 0.4 | GO:0005095 | GTPase inhibitor activity(GO:0005095) |
| 0.0 | 0.3 | GO:0070300 | phosphatidic acid binding(GO:0070300) |
| 0.0 | 0.1 | GO:0016019 | peptidoglycan receptor activity(GO:0016019) |
| 0.0 | 0.2 | GO:0008199 | ferric iron binding(GO:0008199) |
| 0.0 | 0.1 | GO:0005138 | interleukin-6 receptor binding(GO:0005138) |
| 0.0 | 0.4 | GO:0008239 | dipeptidyl-peptidase activity(GO:0008239) |
| 0.0 | 0.1 | GO:0000268 | peroxisome targeting sequence binding(GO:0000268) |
| 0.0 | 0.1 | GO:0042289 | MHC class II protein binding(GO:0042289) |
| 0.0 | 0.6 | GO:0030544 | Hsp70 protein binding(GO:0030544) |
| 0.0 | 0.1 | GO:0004105 | choline-phosphate cytidylyltransferase activity(GO:0004105) |
| 0.0 | 0.2 | GO:0030306 | ADP-ribosylation factor binding(GO:0030306) |
| 0.0 | 0.1 | GO:1990381 | ubiquitin-specific protease binding(GO:1990381) |
| 0.0 | 3.1 | GO:0003735 | structural constituent of ribosome(GO:0003735) |
| 0.0 | 0.1 | GO:0004430 | 1-phosphatidylinositol 4-kinase activity(GO:0004430) |
| 0.0 | 0.4 | GO:0070577 | lysine-acetylated histone binding(GO:0070577) |
| 0.0 | 0.1 | GO:0030369 | ICAM-3 receptor activity(GO:0030369) |
| 0.0 | 0.7 | GO:0001205 | transcriptional activator activity, RNA polymerase II distal enhancer sequence-specific binding(GO:0001205) |
| 0.0 | 0.0 | GO:0004662 | CAAX-protein geranylgeranyltransferase activity(GO:0004662) |
| 0.0 | 0.2 | GO:0016846 | carbon-sulfur lyase activity(GO:0016846) |
| 0.0 | 0.5 | GO:0030676 | Rac guanyl-nucleotide exchange factor activity(GO:0030676) |
| 0.0 | 0.3 | GO:0005537 | mannose binding(GO:0005537) |
| 0.0 | 1.1 | GO:0050840 | extracellular matrix binding(GO:0050840) |
| 0.0 | 0.1 | GO:0031544 | peptidyl-proline 3-dioxygenase activity(GO:0031544) |
| 0.0 | 1.3 | GO:0003777 | microtubule motor activity(GO:0003777) |
| 0.0 | 0.8 | GO:0008138 | protein tyrosine/serine/threonine phosphatase activity(GO:0008138) |
| 0.0 | 0.1 | GO:0070679 | inositol 1,4,5 trisphosphate binding(GO:0070679) |
| 0.0 | 2.0 | GO:0000149 | SNARE binding(GO:0000149) |
| 0.0 | 0.7 | GO:0017112 | Rab guanyl-nucleotide exchange factor activity(GO:0017112) |
| 0.0 | 0.2 | GO:0051430 | corticotropin-releasing hormone receptor 1 binding(GO:0051430) |
Gene overrepresentation in curated gene sets: canonical pathways category:
| Log-likelihood per target | Total log-likelihood | Term | Description |
|---|---|---|---|
| 0.0 | 0.4 | PID ERBB NETWORK PATHWAY | ErbB receptor signaling network |
| 0.0 | 2.8 | PID AURORA A PATHWAY | Aurora A signaling |
| 0.0 | 1.6 | SA FAS SIGNALING | The TNF-type receptor Fas induces apoptosis on ligand binding. |
| 0.0 | 2.3 | PID TCR CALCIUM PATHWAY | Calcium signaling in the CD4+ TCR pathway |
| 0.0 | 0.5 | PID AP1 PATHWAY | AP-1 transcription factor network |
| 0.0 | 0.6 | SA G1 AND S PHASES | Cdk2, 4, and 6 bind cyclin D in G1, while cdk2/cyclin E promotes the G1/S transition. |
| 0.0 | 0.9 | PID ARF 3PATHWAY | Arf1 pathway |
| 0.0 | 1.8 | ST P38 MAPK PATHWAY | p38 MAPK Pathway |
| 0.0 | 1.4 | SIG CD40PATHWAYMAP | Genes related to CD40 signaling |
| 0.0 | 1.1 | PID HIV NEF PATHWAY | HIV-1 Nef: Negative effector of Fas and TNF-alpha |
| 0.0 | 0.8 | PID SYNDECAN 3 PATHWAY | Syndecan-3-mediated signaling events |
| 0.0 | 0.9 | PID IL12 STAT4 PATHWAY | IL12 signaling mediated by STAT4 |
| 0.0 | 2.9 | PID ERA GENOMIC PATHWAY | Validated nuclear estrogen receptor alpha network |
| 0.0 | 0.7 | PID WNT CANONICAL PATHWAY | Canonical Wnt signaling pathway |
| 0.0 | 0.3 | PID TCR JNK PATHWAY | JNK signaling in the CD4+ TCR pathway |
| 0.0 | 2.1 | PID E2F PATHWAY | E2F transcription factor network |
| 0.0 | 0.3 | PID NFKAPPAB ATYPICAL PATHWAY | Atypical NF-kappaB pathway |
| 0.0 | 0.6 | PID ALPHA SYNUCLEIN PATHWAY | Alpha-synuclein signaling |
| 0.0 | 0.6 | PID INSULIN GLUCOSE PATHWAY | Insulin-mediated glucose transport |
| 0.0 | 1.0 | SIG PIP3 SIGNALING IN CARDIAC MYOCTES | Genes related to PIP3 signaling in cardiac myocytes |
| 0.0 | 1.0 | PID FGF PATHWAY | FGF signaling pathway |
| 0.0 | 0.8 | PID ERBB1 RECEPTOR PROXIMAL PATHWAY | EGF receptor (ErbB1) signaling pathway |
| 0.0 | 0.6 | PID FCER1 PATHWAY | Fc-epsilon receptor I signaling in mast cells |
| 0.0 | 0.6 | PID ATR PATHWAY | ATR signaling pathway |
| 0.0 | 0.8 | PID TRKR PATHWAY | Neurotrophic factor-mediated Trk receptor signaling |
Gene overrepresentation in curated gene sets: REACTOME pathways category:
| Log-likelihood per target | Total log-likelihood | Term | Description |
|---|---|---|---|
| 0.1 | 1.8 | REACTOME MRNA DECAY BY 3 TO 5 EXORIBONUCLEASE | Genes involved in mRNA Decay by 3' to 5' Exoribonuclease |
| 0.1 | 1.0 | REACTOME REGULATED PROTEOLYSIS OF P75NTR | Genes involved in Regulated proteolysis of p75NTR |
| 0.1 | 1.6 | REACTOME EXTRINSIC PATHWAY FOR APOPTOSIS | Genes involved in Extrinsic Pathway for Apoptosis |
| 0.0 | 1.3 | REACTOME PROTEOLYTIC CLEAVAGE OF SNARE COMPLEX PROTEINS | Genes involved in Proteolytic cleavage of SNARE complex proteins |
| 0.0 | 1.2 | REACTOME ADVANCED GLYCOSYLATION ENDPRODUCT RECEPTOR SIGNALING | Genes involved in Advanced glycosylation endproduct receptor signaling |
| 0.0 | 0.4 | REACTOME ELONGATION ARREST AND RECOVERY | Genes involved in Elongation arrest and recovery |
| 0.0 | 1.7 | REACTOME TRAF6 MEDIATED IRF7 ACTIVATION | Genes involved in TRAF6 mediated IRF7 activation |
| 0.0 | 0.6 | REACTOME ACTIVATION OF CHAPERONE GENES BY ATF6 ALPHA | Genes involved in Activation of Chaperone Genes by ATF6-alpha |
| 0.0 | 1.0 | REACTOME SPRY REGULATION OF FGF SIGNALING | Genes involved in Spry regulation of FGF signaling |
| 0.0 | 0.7 | REACTOME ROLE OF DCC IN REGULATING APOPTOSIS | Genes involved in Role of DCC in regulating apoptosis |
| 0.0 | 0.7 | REACTOME UNWINDING OF DNA | Genes involved in Unwinding of DNA |
| 0.0 | 0.2 | REACTOME NFKB ACTIVATION THROUGH FADD RIP1 PATHWAY MEDIATED BY CASPASE 8 AND10 | Genes involved in NF-kB activation through FADD/RIP-1 pathway mediated by caspase-8 and -10 |
| 0.0 | 0.4 | REACTOME APOBEC3G MEDIATED RESISTANCE TO HIV1 INFECTION | Genes involved in APOBEC3G mediated resistance to HIV-1 infection |
| 0.0 | 0.6 | REACTOME RECRUITMENT OF NUMA TO MITOTIC CENTROSOMES | Genes involved in Recruitment of NuMA to mitotic centrosomes |
| 0.0 | 1.8 | REACTOME SMAD2 SMAD3 SMAD4 HETEROTRIMER REGULATES TRANSCRIPTION | Genes involved in SMAD2/SMAD3:SMAD4 heterotrimer regulates transcription |
| 0.0 | 0.8 | REACTOME MRNA DECAY BY 5 TO 3 EXORIBONUCLEASE | Genes involved in mRNA Decay by 5' to 3' Exoribonuclease |
| 0.0 | 0.4 | REACTOME PACKAGING OF TELOMERE ENDS | Genes involved in Packaging Of Telomere Ends |
| 0.0 | 0.5 | REACTOME SEROTONIN RECEPTORS | Genes involved in Serotonin receptors |
| 0.0 | 1.1 | REACTOME KINESINS | Genes involved in Kinesins |
| 0.0 | 1.3 | REACTOME MRNA SPLICING MINOR PATHWAY | Genes involved in mRNA Splicing - Minor Pathway |
| 0.0 | 0.7 | REACTOME TRAFFICKING OF GLUR2 CONTAINING AMPA RECEPTORS | Genes involved in Trafficking of GluR2-containing AMPA receptors |
| 0.0 | 0.5 | REACTOME GAP JUNCTION DEGRADATION | Genes involved in Gap junction degradation |
| 0.0 | 0.9 | REACTOME PREFOLDIN MEDIATED TRANSFER OF SUBSTRATE TO CCT TRIC | Genes involved in Prefoldin mediated transfer of substrate to CCT/TriC |
| 0.0 | 1.0 | REACTOME MRNA 3 END PROCESSING | Genes involved in mRNA 3'-end processing |
| 0.0 | 0.1 | REACTOME PROCESSING OF CAPPED INTRON CONTAINING PRE MRNA | Genes involved in Processing of Capped Intron-Containing Pre-mRNA |
| 0.0 | 1.6 | REACTOME MRNA SPLICING | Genes involved in mRNA Splicing |
| 0.0 | 0.1 | REACTOME G ALPHA1213 SIGNALLING EVENTS | Genes involved in G alpha (12/13) signalling events |
| 0.0 | 0.8 | REACTOME MEIOTIC RECOMBINATION | Genes involved in Meiotic Recombination |
| 0.0 | 0.5 | REACTOME SYNTHESIS OF PIPS AT THE GOLGI MEMBRANE | Genes involved in Synthesis of PIPs at the Golgi membrane |
| 0.0 | 0.5 | REACTOME SIGNAL REGULATORY PROTEIN SIRP FAMILY INTERACTIONS | Genes involved in Signal regulatory protein (SIRP) family interactions |
| 0.0 | 0.8 | REACTOME INTERACTIONS OF VPR WITH HOST CELLULAR PROTEINS | Genes involved in Interactions of Vpr with host cellular proteins |
| 0.0 | 0.6 | REACTOME INSULIN RECEPTOR RECYCLING | Genes involved in Insulin receptor recycling |
| 0.0 | 0.9 | REACTOME IL1 SIGNALING | Genes involved in Interleukin-1 signaling |
| 0.0 | 0.2 | REACTOME SIGNAL ATTENUATION | Genes involved in Signal attenuation |
| 0.0 | 0.3 | REACTOME ADENYLATE CYCLASE INHIBITORY PATHWAY | Genes involved in Adenylate cyclase inhibitory pathway |
| 0.0 | 0.1 | REACTOME TAK1 ACTIVATES NFKB BY PHOSPHORYLATION AND ACTIVATION OF IKKS COMPLEX | Genes involved in TAK1 activates NFkB by phosphorylation and activation of IKKs complex |
| 0.0 | 0.4 | REACTOME CASPASE MEDIATED CLEAVAGE OF CYTOSKELETAL PROTEINS | Genes involved in Caspase-mediated cleavage of cytoskeletal proteins |
| 0.0 | 0.1 | REACTOME CLEAVAGE OF GROWING TRANSCRIPT IN THE TERMINATION REGION | Genes involved in Cleavage of Growing Transcript in the Termination Region |
| 0.0 | 0.6 | REACTOME CGMP EFFECTS | Genes involved in cGMP effects |
| 0.0 | 0.6 | REACTOME BASIGIN INTERACTIONS | Genes involved in Basigin interactions |
| 0.0 | 0.3 | REACTOME CITRIC ACID CYCLE TCA CYCLE | Genes involved in Citric acid cycle (TCA cycle) |
| 0.0 | 2.1 | REACTOME 3 UTR MEDIATED TRANSLATIONAL REGULATION | Genes involved in 3' -UTR-mediated translational regulation |
| 0.0 | 0.2 | REACTOME GAMMA CARBOXYLATION TRANSPORT AND AMINO TERMINAL CLEAVAGE OF PROTEINS | Genes involved in Gamma-carboxylation, transport, and amino-terminal cleavage of proteins |
| 0.0 | 0.7 | REACTOME AUTODEGRADATION OF THE E3 UBIQUITIN LIGASE COP1 | Genes involved in Autodegradation of the E3 ubiquitin ligase COP1 |
| 0.0 | 0.9 | REACTOME RESPIRATORY ELECTRON TRANSPORT | Genes involved in Respiratory electron transport |
| 0.0 | 0.1 | REACTOME PD1 SIGNALING | Genes involved in PD-1 signaling |