Project
Inflammatory response time course, HUVEC (Wada, 2009)
Navigation
Downloads
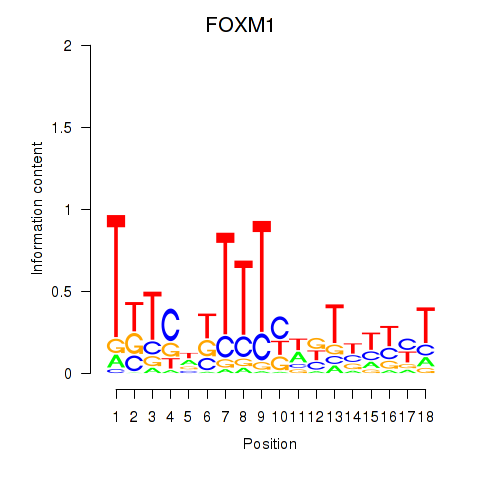
Results for FOXM1_TBL1XR1
Z-value: 0.98
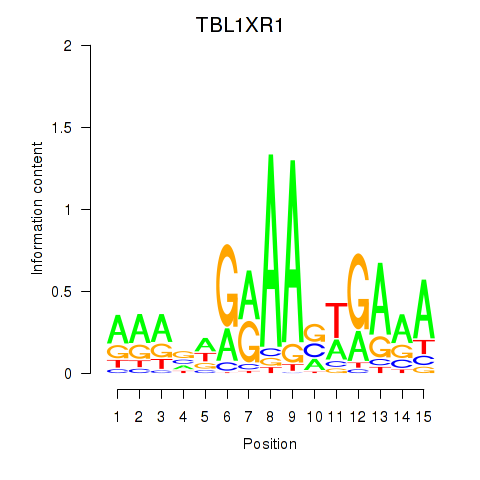
Motif logo
Transcription factors associated with FOXM1_TBL1XR1
| Gene Symbol | Gene ID | Gene Info |
|---|---|---|
|
FOXM1
|
ENSG00000111206.13 | FOXM1 |
|
TBL1XR1
|
ENSG00000177565.18 | TBL1XR1 |
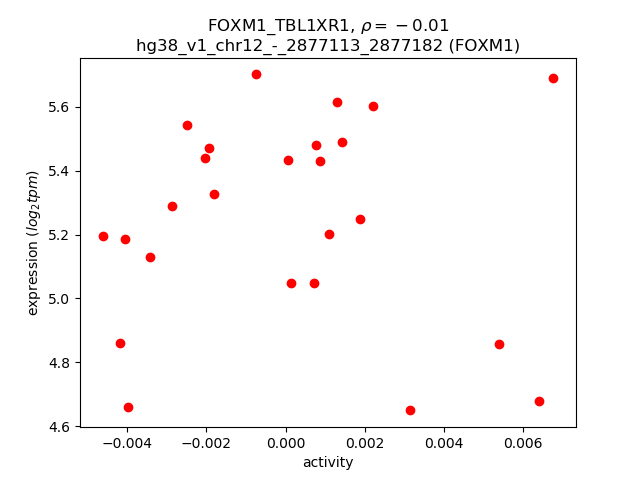
Activity-expression correlation:
| Gene | Promoter | Pearson corr. coef. | P-value | Plot |
|---|---|---|---|---|
| TBL1XR1 | hg38_v1_chr3_-_177197210_177197233 | 0.26 | 2.2e-01 | Click! |
| FOXM1 | hg38_v1_chr12_-_2877113_2877182, hg38_v1_chr12_-_2876986_2877092 | -0.01 | 9.7e-01 | Click! |
Activity profile of FOXM1_TBL1XR1 motif
Sorted Z-values of FOXM1_TBL1XR1 motif
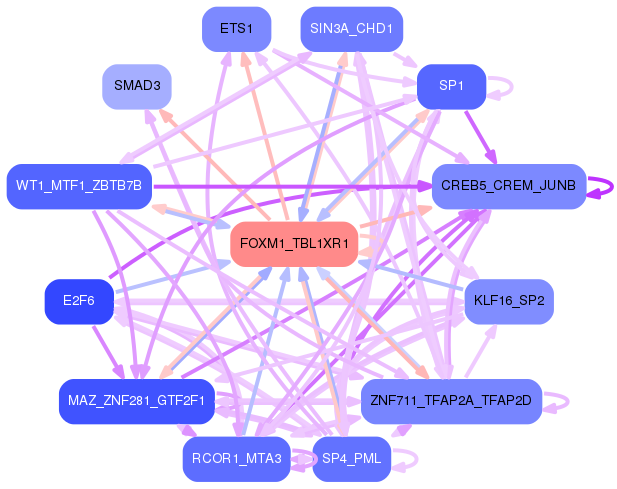
Network of associatons between targets according to the STRING database.

First level regulatory network of FOXM1_TBL1XR1
| Promoter | Score | Transcript | Gene | Gene Info |
|---|---|---|---|---|
| chr9_-_120914549 | 2.89 |
ENST00000546084.5
|
TRAF1
|
TNF receptor associated factor 1 |
| chr2_+_102355881 | 2.32 |
ENST00000409599.5
|
IL18R1
|
interleukin 18 receptor 1 |
| chr2_+_102355750 | 2.21 |
ENST00000233957.7
|
IL18R1
|
interleukin 18 receptor 1 |
| chr4_-_76023489 | 2.19 |
ENST00000306602.3
|
CXCL10
|
C-X-C motif chemokine ligand 10 |
| chr1_+_100719734 | 2.14 |
ENST00000370119.8
ENST00000294728.7 ENST00000347652.6 ENST00000370115.1 |
VCAM1
|
vascular cell adhesion molecule 1 |
| chr2_+_151357583 | 2.07 |
ENST00000243347.5
|
TNFAIP6
|
TNF alpha induced protein 6 |
| chr1_-_169734064 | 2.05 |
ENST00000333360.12
|
SELE
|
selectin E |
| chr14_+_22281097 | 1.92 |
ENST00000390465.2
|
TRAV38-2DV8
|
T cell receptor alpha variable 38-2/delta variable 8 |
| chr6_+_26383176 | 1.79 |
ENST00000416795.6
ENST00000494184.1 |
BTN2A2
|
butyrophilin subfamily 2 member A2 |
| chr11_-_102780620 | 1.51 |
ENST00000279441.9
ENST00000539681.1 |
MMP10
|
matrix metallopeptidase 10 |
| chr6_+_127577168 | 1.49 |
ENST00000329722.8
|
C6orf58
|
chromosome 6 open reading frame 58 |
| chr6_+_26383090 | 1.48 |
ENST00000469230.5
ENST00000490025.5 ENST00000352867.6 ENST00000356709.9 ENST00000493275.5 ENST00000472507.5 ENST00000482536.5 ENST00000432533.6 ENST00000482842.1 |
BTN2A2
|
butyrophilin subfamily 2 member A2 |
| chr5_+_119354771 | 1.47 |
ENST00000503646.1
|
TNFAIP8
|
TNF alpha induced protein 8 |
| chr9_-_21305313 | 1.33 |
ENST00000610521.2
|
IFNA5
|
interferon alpha 5 |
| chr7_-_22194709 | 1.29 |
ENST00000458533.5
|
RAPGEF5
|
Rap guanine nucleotide exchange factor 5 |
| chr4_+_155666963 | 1.25 |
ENST00000455639.6
|
GUCY1A1
|
guanylate cyclase 1 soluble subunit alpha 1 |
| chr11_-_72721908 | 1.23 |
ENST00000426523.5
ENST00000429686.5 |
ARAP1
|
ArfGAP with RhoGAP domain, ankyrin repeat and PH domain 1 |
| chr10_+_89332484 | 1.22 |
ENST00000371811.4
ENST00000680037.1 ENST00000679583.1 ENST00000679897.1 |
IFIT3
|
interferon induced protein with tetratricopeptide repeats 3 |
| chr6_-_159745186 | 1.21 |
ENST00000537657.5
|
SOD2
|
superoxide dismutase 2 |
| chr19_-_49896868 | 1.21 |
ENST00000593956.5
ENST00000391826.7 |
IL4I1
|
interleukin 4 induced 1 |
| chr4_+_155666718 | 1.18 |
ENST00000621234.4
ENST00000511108.5 |
GUCY1A1
|
guanylate cyclase 1 soluble subunit alpha 1 |
| chr4_+_155667096 | 1.15 |
ENST00000393832.7
|
GUCY1A1
|
guanylate cyclase 1 soluble subunit alpha 1 |
| chr6_-_29559724 | 1.15 |
ENST00000377050.5
|
UBD
|
ubiquitin D |
| chr6_-_31582415 | 1.11 |
ENST00000429299.3
ENST00000446745.2 |
LTB
|
lymphotoxin beta |
| chr4_-_76036060 | 1.06 |
ENST00000306621.8
|
CXCL11
|
C-X-C motif chemokine ligand 11 |
| chr3_-_108058361 | 1.04 |
ENST00000398258.7
|
CD47
|
CD47 molecule |
| chr6_-_10414985 | 1.03 |
ENST00000466073.5
ENST00000498450.3 |
TFAP2A
|
transcription factor AP-2 alpha |
| chr3_-_127736329 | 1.03 |
ENST00000398101.7
|
MGLL
|
monoglyceride lipase |
| chr9_-_120929160 | 1.00 |
ENST00000540010.1
|
TRAF1
|
TNF receptor associated factor 1 |
| chr7_+_28685968 | 0.98 |
ENST00000396298.6
|
CREB5
|
cAMP responsive element binding protein 5 |
| chr18_+_63887698 | 0.98 |
ENST00000457692.5
ENST00000299502.9 ENST00000413956.5 |
SERPINB2
|
serpin family B member 2 |
| chr21_+_25639272 | 0.97 |
ENST00000400532.5
ENST00000312957.9 |
JAM2
|
junctional adhesion molecule 2 |
| chr8_-_7416863 | 0.95 |
ENST00000318157.3
|
DEFB4B
|
defensin beta 4B |
| chr11_+_102317450 | 0.93 |
ENST00000615299.4
ENST00000527309.2 ENST00000526421.6 ENST00000263464.9 |
BIRC3
|
baculoviral IAP repeat containing 3 |
| chr4_+_8580387 | 0.93 |
ENST00000382487.5
|
GPR78
|
G protein-coupled receptor 78 |
| chrX_+_30235894 | 0.92 |
ENST00000620842.1
|
MAGEB3
|
MAGE family member B3 |
| chr6_-_154430495 | 0.92 |
ENST00000424998.3
|
CNKSR3
|
CNKSR family member 3 |
| chr6_+_29099490 | 0.92 |
ENST00000641659.2
|
OR2J1
|
olfactory receptor family 2 subfamily J member 1 |
| chr15_+_67138001 | 0.92 |
ENST00000439724.7
|
SMAD3
|
SMAD family member 3 |
| chr3_+_122680802 | 0.88 |
ENST00000474629.7
|
PARP14
|
poly(ADP-ribose) polymerase family member 14 |
| chr1_-_7940825 | 0.88 |
ENST00000377507.8
|
TNFRSF9
|
TNF receptor superfamily member 9 |
| chr11_+_102317492 | 0.88 |
ENST00000673846.1
|
BIRC3
|
baculoviral IAP repeat containing 3 |
| chr10_+_113709261 | 0.87 |
ENST00000672138.1
ENST00000452490.3 |
CASP7
|
caspase 7 |
| chr21_+_25639251 | 0.86 |
ENST00000480456.6
|
JAM2
|
junctional adhesion molecule 2 |
| chr10_+_89327989 | 0.86 |
ENST00000679923.1
ENST00000680085.1 ENST00000371818.9 ENST00000680779.1 |
IFIT3
|
interferon induced protein with tetratricopeptide repeats 3 |
| chr17_+_79022908 | 0.86 |
ENST00000354124.7
ENST00000580454.5 |
C1QTNF1
|
C1q and TNF related 1 |
| chr14_+_75605462 | 0.85 |
ENST00000539311.5
|
FLVCR2
|
FLVCR heme transporter 2 |
| chr12_-_52385649 | 0.84 |
ENST00000257951.3
|
KRT84
|
keratin 84 |
| chr17_+_79022814 | 0.83 |
ENST00000578229.5
|
C1QTNF1
|
C1q and TNF related 1 |
| chr19_-_55166565 | 0.82 |
ENST00000526003.5
ENST00000534170.5 ENST00000524407.7 |
DNAAF3
|
dynein axonemal assembly factor 3 |
| chr12_-_55842950 | 0.82 |
ENST00000548629.5
|
MMP19
|
matrix metallopeptidase 19 |
| chr10_+_89327977 | 0.82 |
ENST00000681277.1
|
IFIT3
|
interferon induced protein with tetratricopeptide repeats 3 |
| chr3_-_191282383 | 0.80 |
ENST00000427544.6
|
UTS2B
|
urotensin 2B |
| chr11_-_60952067 | 0.80 |
ENST00000681275.1
|
SLC15A3
|
solute carrier family 15 member 3 |
| chr19_-_55166632 | 0.79 |
ENST00000532817.5
ENST00000527223.6 ENST00000391720.8 |
DNAAF3
|
dynein axonemal assembly factor 3 |
| chr12_+_116910935 | 0.78 |
ENST00000652555.1
ENST00000455858.2 |
FBXW8
|
F-box and WD repeat domain containing 8 |
| chr10_+_88594746 | 0.77 |
ENST00000531458.1
|
LIPJ
|
lipase family member J |
| chr2_+_227813834 | 0.76 |
ENST00000358813.5
ENST00000409189.7 |
CCL20
|
C-C motif chemokine ligand 20 |
| chrX_+_30243715 | 0.76 |
ENST00000378981.8
ENST00000397550.6 |
MAGEB1
|
MAGE family member B1 |
| chr4_-_69214743 | 0.75 |
ENST00000446444.2
|
UGT2B11
|
UDP glucuronosyltransferase family 2 member B11 |
| chr9_+_5510492 | 0.75 |
ENST00000397747.5
|
PDCD1LG2
|
programmed cell death 1 ligand 2 |
| chr6_+_29100609 | 0.74 |
ENST00000377171.3
|
OR2J1
|
olfactory receptor family 2 subfamily J member 1 |
| chr11_-_72674394 | 0.74 |
ENST00000418754.6
ENST00000334456.10 ENST00000542969.2 |
PDE2A
|
phosphodiesterase 2A |
| chr11_-_128587551 | 0.73 |
ENST00000392668.8
|
ETS1
|
ETS proto-oncogene 1, transcription factor |
| chr22_-_26618026 | 0.73 |
ENST00000647684.1
|
CRYBB1
|
crystallin beta B1 |
| chr1_-_150765785 | 0.73 |
ENST00000680311.1
ENST00000681728.1 ENST00000680288.1 |
CTSS
|
cathepsin S |
| chr6_+_125919296 | 0.71 |
ENST00000444128.2
|
NCOA7
|
nuclear receptor coactivator 7 |
| chr6_-_10415043 | 0.71 |
ENST00000379613.10
|
TFAP2A
|
transcription factor AP-2 alpha |
| chr9_-_120926752 | 0.70 |
ENST00000373887.8
|
TRAF1
|
TNF receptor associated factor 1 |
| chr1_-_150765735 | 0.69 |
ENST00000679898.1
ENST00000448301.7 ENST00000680664.1 ENST00000679512.1 ENST00000368985.8 ENST00000679582.1 |
CTSS
|
cathepsin S |
| chr8_+_38728550 | 0.69 |
ENST00000520340.5
ENST00000518415.5 |
TACC1
|
transforming acidic coiled-coil containing protein 1 |
| chr12_+_75480800 | 0.69 |
ENST00000456650.7
|
GLIPR1
|
GLI pathogenesis related 1 |
| chr7_+_20615653 | 0.68 |
ENST00000404938.7
|
ABCB5
|
ATP binding cassette subfamily B member 5 |
| chr3_+_190615308 | 0.68 |
ENST00000412080.1
|
IL1RAP
|
interleukin 1 receptor accessory protein |
| chr7_+_134866831 | 0.68 |
ENST00000435928.1
|
CALD1
|
caldesmon 1 |
| chr2_+_102418642 | 0.68 |
ENST00000264260.6
|
IL18RAP
|
interleukin 18 receptor accessory protein |
| chr10_+_89301932 | 0.68 |
ENST00000371826.4
ENST00000679755.1 |
IFIT2
|
interferon induced protein with tetratricopeptide repeats 2 |
| chr8_+_17497108 | 0.67 |
ENST00000470360.5
|
SLC7A2
|
solute carrier family 7 member 2 |
| chr5_+_119356011 | 0.67 |
ENST00000504771.3
ENST00000415806.2 |
TNFAIP8
|
TNF alpha induced protein 8 |
| chr1_+_158461574 | 0.66 |
ENST00000641432.1
ENST00000641460.1 ENST00000641535.1 ENST00000641971.1 |
OR10K1
|
olfactory receptor family 10 subfamily K member 1 |
| chr6_+_125919210 | 0.66 |
ENST00000438495.6
|
NCOA7
|
nuclear receptor coactivator 7 |
| chr12_+_77830886 | 0.65 |
ENST00000397909.7
ENST00000549464.5 |
NAV3
|
neuron navigator 3 |
| chr15_+_88635626 | 0.65 |
ENST00000379224.10
|
ISG20
|
interferon stimulated exonuclease gene 20 |
| chr5_+_126423176 | 0.64 |
ENST00000542322.5
ENST00000544396.5 |
GRAMD2B
|
GRAM domain containing 2B |
| chr22_+_35648438 | 0.64 |
ENST00000409652.5
|
APOL6
|
apolipoprotein L6 |
| chr6_-_11382247 | 0.64 |
ENST00000397378.7
ENST00000513989.5 ENST00000508546.5 ENST00000504387.5 |
NEDD9
|
neural precursor cell expressed, developmentally down-regulated 9 |
| chr12_+_75481204 | 0.63 |
ENST00000550491.1
|
GLIPR1
|
GLI pathogenesis related 1 |
| chr4_+_73740541 | 0.63 |
ENST00000401931.1
ENST00000307407.8 |
CXCL8
|
C-X-C motif chemokine ligand 8 |
| chr4_+_155667198 | 0.63 |
ENST00000296518.11
|
GUCY1A1
|
guanylate cyclase 1 soluble subunit alpha 1 |
| chr6_-_32838727 | 0.62 |
ENST00000652259.1
ENST00000374897.4 ENST00000620123.4 ENST00000452392.2 |
TAP2
ENSG00000250264.1
|
transporter 2, ATP binding cassette subfamily B member novel protein, TAP2-HLA-DOB readthrough |
| chr2_+_201129318 | 0.62 |
ENST00000417748.1
|
CFLAR
|
CASP8 and FADD like apoptosis regulator |
| chr1_+_218345326 | 0.61 |
ENST00000366930.9
|
TGFB2
|
transforming growth factor beta 2 |
| chr8_+_7894674 | 0.61 |
ENST00000302247.3
|
DEFB4A
|
defensin beta 4A |
| chr11_+_102317542 | 0.61 |
ENST00000532808.5
|
BIRC3
|
baculoviral IAP repeat containing 3 |
| chr15_-_79971164 | 0.61 |
ENST00000335661.6
ENST00000267953.4 ENST00000677151.1 |
BCL2A1
|
BCL2 related protein A1 |
| chr4_-_119628791 | 0.61 |
ENST00000354960.8
|
PDE5A
|
phosphodiesterase 5A |
| chr19_-_47232649 | 0.60 |
ENST00000449228.5
ENST00000300880.11 ENST00000341983.8 |
BBC3
|
BCL2 binding component 3 |
| chrX_+_79144664 | 0.60 |
ENST00000645147.2
|
GPR174
|
G protein-coupled receptor 174 |
| chr8_-_79767462 | 0.60 |
ENST00000674295.1
ENST00000518733.1 ENST00000674418.1 ENST00000674358.1 ENST00000354724.8 |
HEY1
|
hes related family bHLH transcription factor with YRPW motif 1 |
| chr1_+_161722659 | 0.60 |
ENST00000336830.9
ENST00000367944.3 ENST00000367945.5 ENST00000367946.7 |
FCRLB
|
Fc receptor like B |
| chr5_+_126423363 | 0.60 |
ENST00000285689.8
|
GRAMD2B
|
GRAM domain containing 2B |
| chr5_-_16916400 | 0.60 |
ENST00000513882.5
|
MYO10
|
myosin X |
| chr6_+_29439306 | 0.59 |
ENST00000444197.3
|
OR10C1
|
olfactory receptor family 10 subfamily C member 1 |
| chr15_+_62066975 | 0.59 |
ENST00000355522.5
|
C2CD4A
|
C2 calcium dependent domain containing 4A |
| chr17_+_34285734 | 0.59 |
ENST00000305869.4
|
CCL11
|
C-C motif chemokine ligand 11 |
| chr15_+_67125707 | 0.59 |
ENST00000540846.6
|
SMAD3
|
SMAD family member 3 |
| chr18_-_5396265 | 0.58 |
ENST00000579951.2
|
EPB41L3
|
erythrocyte membrane protein band 4.1 like 3 |
| chr15_-_35085295 | 0.58 |
ENST00000528386.4
|
NANOGP8
|
Nanog homeobox retrogene P8 |
| chr1_-_56579555 | 0.58 |
ENST00000371250.4
|
PLPP3
|
phospholipid phosphatase 3 |
| chr4_-_6070162 | 0.57 |
ENST00000636216.1
ENST00000637373.2 |
ENSG00000284684.1
JAKMIP1
|
novel protein janus kinase and microtubule interacting protein 1 |
| chr4_+_56505782 | 0.57 |
ENST00000640821.3
|
ARL9
|
ADP ribosylation factor like GTPase 9 |
| chr19_-_55166671 | 0.56 |
ENST00000455045.5
|
DNAAF3
|
dynein axonemal assembly factor 3 |
| chr1_-_184974477 | 0.56 |
ENST00000367511.4
|
NIBAN1
|
niban apoptosis regulator 1 |
| chr15_-_62165274 | 0.56 |
ENST00000380392.4
|
C2CD4B
|
C2 calcium dependent domain containing 4B |
| chr11_+_61222347 | 0.56 |
ENST00000378149.9
|
PGA4
|
pepsinogen A4 |
| chr8_+_17497078 | 0.55 |
ENST00000494857.6
ENST00000522656.5 |
SLC7A2
|
solute carrier family 7 member 2 |
| chr11_-_60952134 | 0.55 |
ENST00000679573.1
ENST00000681882.1 ENST00000681951.1 ENST00000227880.8 |
SLC15A3
|
solute carrier family 15 member 3 |
| chr2_+_201129826 | 0.55 |
ENST00000457277.5
|
CFLAR
|
CASP8 and FADD like apoptosis regulator |
| chr6_+_31587049 | 0.55 |
ENST00000376089.6
ENST00000396112.6 |
LST1
|
leukocyte specific transcript 1 |
| chr1_+_86547070 | 0.55 |
ENST00000370563.3
|
CLCA4
|
chloride channel accessory 4 |
| chr6_+_26457904 | 0.55 |
ENST00000541522.5
|
BTN2A1
|
butyrophilin subfamily 2 member A1 |
| chr21_+_36135071 | 0.54 |
ENST00000290354.6
|
CBR3
|
carbonyl reductase 3 |
| chr3_-_112499358 | 0.54 |
ENST00000383680.4
|
BTLA
|
B and T lymphocyte associated |
| chr22_+_36913620 | 0.54 |
ENST00000403662.8
ENST00000262825.9 |
CSF2RB
|
colony stimulating factor 2 receptor subunit beta |
| chr22_-_36160773 | 0.54 |
ENST00000531095.1
ENST00000349314.6 ENST00000397293.6 |
APOL3
|
apolipoprotein L3 |
| chr12_+_108515262 | 0.54 |
ENST00000552695.6
ENST00000552758.1 ENST00000361549.2 |
FICD
|
FIC domain protein adenylyltransferase |
| chr2_-_207166818 | 0.53 |
ENST00000423015.5
|
KLF7
|
Kruppel like factor 7 |
| chr5_+_126423122 | 0.53 |
ENST00000515200.5
|
GRAMD2B
|
GRAM domain containing 2B |
| chr3_+_112333147 | 0.53 |
ENST00000473539.5
ENST00000315711.12 ENST00000383681.7 |
CD200
|
CD200 molecule |
| chr21_+_42199686 | 0.53 |
ENST00000398457.6
|
ABCG1
|
ATP binding cassette subfamily G member 1 |
| chr10_+_15032193 | 0.53 |
ENST00000428897.5
ENST00000413672.5 |
OLAH
|
oleoyl-ACP hydrolase |
| chr3_-_112975018 | 0.53 |
ENST00000471858.5
ENST00000308611.8 ENST00000295863.4 |
CD200R1
|
CD200 receptor 1 |
| chrX_-_64230600 | 0.53 |
ENST00000362002.3
|
ASB12
|
ankyrin repeat and SOCS box containing 12 |
| chr11_-_60952559 | 0.53 |
ENST00000538739.2
|
SLC15A3
|
solute carrier family 15 member 3 |
| chr4_-_79326008 | 0.53 |
ENST00000286794.5
|
NAA11
|
N-alpha-acetyltransferase 11, NatA catalytic subunit |
| chr14_+_96482982 | 0.53 |
ENST00000554706.1
|
AK7
|
adenylate kinase 7 |
| chr17_-_39778213 | 0.53 |
ENST00000583368.1
|
IKZF3
|
IKAROS family zinc finger 3 |
| chr19_+_56595279 | 0.53 |
ENST00000328070.10
ENST00000599599.7 ENST00000650950.1 |
ZNF71
ZIM2-AS1
|
zinc finger protein 71 ZIM2 antisense RNA 1 |
| chr6_-_11779606 | 0.53 |
ENST00000506810.1
|
ADTRP
|
androgen dependent TFPI regulating protein |
| chr7_-_22193728 | 0.52 |
ENST00000620335.4
|
RAPGEF5
|
Rap guanine nucleotide exchange factor 5 |
| chr7_-_22220226 | 0.52 |
ENST00000420196.5
|
RAPGEF5
|
Rap guanine nucleotide exchange factor 5 |
| chr10_+_6144883 | 0.52 |
ENST00000379789.8
|
PFKFB3
|
6-phosphofructo-2-kinase/fructose-2,6-biphosphatase 3 |
| chr7_-_113086815 | 0.51 |
ENST00000424100.2
|
GPR85
|
G protein-coupled receptor 85 |
| chr2_-_31414694 | 0.51 |
ENST00000379416.4
|
XDH
|
xanthine dehydrogenase |
| chr3_-_122564577 | 0.51 |
ENST00000477522.6
ENST00000360356.6 |
PARP9
|
poly(ADP-ribose) polymerase family member 9 |
| chr1_+_170532131 | 0.51 |
ENST00000367762.2
ENST00000367763.8 |
GORAB
|
golgin, RAB6 interacting |
| chr4_-_121164314 | 0.51 |
ENST00000057513.8
|
TNIP3
|
TNFAIP3 interacting protein 3 |
| chr3_-_112499457 | 0.51 |
ENST00000334529.10
|
BTLA
|
B and T lymphocyte associated |
| chr6_+_32854179 | 0.51 |
ENST00000374859.3
|
PSMB9
|
proteasome 20S subunit beta 9 |
| chr4_+_2418932 | 0.51 |
ENST00000635017.1
|
CFAP99
|
cilia and flagella associated protein 99 |
| chr15_-_64046322 | 0.50 |
ENST00000457488.5
ENST00000612884.4 |
DAPK2
|
death associated protein kinase 2 |
| chr7_-_22193824 | 0.50 |
ENST00000401957.6
|
RAPGEF5
|
Rap guanine nucleotide exchange factor 5 |
| chr1_-_12618198 | 0.50 |
ENST00000616661.5
|
DHRS3
|
dehydrogenase/reductase 3 |
| chr5_+_55024250 | 0.50 |
ENST00000231009.3
|
GZMK
|
granzyme K |
| chr19_-_55160668 | 0.50 |
ENST00000588076.1
|
DNAAF3
|
dynein axonemal assembly factor 3 |
| chr8_+_85177135 | 0.49 |
ENST00000416274.7
|
E2F5
|
E2F transcription factor 5 |
| chr6_+_31587185 | 0.49 |
ENST00000376092.7
ENST00000376086.7 ENST00000303757.12 ENST00000376093.6 |
LST1
|
leukocyte specific transcript 1 |
| chr2_+_102104563 | 0.49 |
ENST00000409589.5
ENST00000409329.5 |
IL1R1
|
interleukin 1 receptor type 1 |
| chr6_+_29439939 | 0.49 |
ENST00000622521.1
|
OR10C1
|
olfactory receptor family 10 subfamily C member 1 |
| chr18_+_45825666 | 0.49 |
ENST00000389474.8
|
SIGLEC15
|
sialic acid binding Ig like lectin 15 |
| chr2_-_224947030 | 0.48 |
ENST00000409592.7
|
DOCK10
|
dedicator of cytokinesis 10 |
| chr10_+_80132591 | 0.48 |
ENST00000372267.6
|
PLAC9
|
placenta associated 9 |
| chr1_+_158289916 | 0.48 |
ENST00000368170.8
|
CD1C
|
CD1c molecule |
| chr5_-_11588842 | 0.48 |
ENST00000503622.5
|
CTNND2
|
catenin delta 2 |
| chr22_+_23688133 | 0.48 |
ENST00000401461.5
|
RGL4
|
ral guanine nucleotide dissociation stimulator like 4 |
| chr1_-_173207322 | 0.48 |
ENST00000281834.4
|
TNFSF4
|
TNF superfamily member 4 |
| chr14_+_22070548 | 0.48 |
ENST00000390450.3
|
TRAV22
|
T cell receptor alpha variable 22 |
| chr9_+_113444725 | 0.48 |
ENST00000374140.6
|
RGS3
|
regulator of G protein signaling 3 |
| chr15_-_74367637 | 0.47 |
ENST00000268053.11
ENST00000416978.1 |
CYP11A1
|
cytochrome P450 family 11 subfamily A member 1 |
| chr15_+_67067780 | 0.47 |
ENST00000679624.1
|
SMAD3
|
SMAD family member 3 |
| chr2_+_101839815 | 0.47 |
ENST00000421882.5
|
MAP4K4
|
mitogen-activated protein kinase kinase kinase kinase 4 |
| chr16_-_72094371 | 0.47 |
ENST00000426362.6
|
TXNL4B
|
thioredoxin like 4B |
| chr11_+_54706832 | 0.47 |
ENST00000319760.8
|
OR4A5
|
olfactory receptor family 4 subfamily A member 5 |
| chr11_+_55635113 | 0.47 |
ENST00000641760.1
|
OR4P4
|
olfactory receptor family 4 subfamily P member 4 |
| chr3_+_10992175 | 0.47 |
ENST00000646702.1
|
SLC6A1
|
solute carrier family 6 member 1 |
| chr6_-_32853618 | 0.47 |
ENST00000354258.5
|
TAP1
|
transporter 1, ATP binding cassette subfamily B member |
| chr5_-_16738341 | 0.47 |
ENST00000515803.5
|
MYO10
|
myosin X |
| chr3_-_172523460 | 0.47 |
ENST00000420541.6
|
TNFSF10
|
TNF superfamily member 10 |
| chr5_-_35938572 | 0.46 |
ENST00000651391.1
ENST00000397366.5 ENST00000513623.5 ENST00000514524.2 ENST00000397367.6 |
CAPSL
|
calcyphosine like |
| chr9_-_115091018 | 0.46 |
ENST00000542877.5
ENST00000537320.5 ENST00000341037.8 |
TNC
|
tenascin C |
| chr2_+_126656128 | 0.46 |
ENST00000259254.9
ENST00000409836.3 ENST00000356887.12 |
GYPC
|
glycophorin C (Gerbich blood group) |
| chr21_-_41926680 | 0.46 |
ENST00000329623.11
|
C2CD2
|
C2 calcium dependent domain containing 2 |
| chr16_-_87936529 | 0.46 |
ENST00000649794.3
ENST00000649158.1 ENST00000648177.1 |
CA5A
|
carbonic anhydrase 5A |
| chr9_+_114155526 | 0.45 |
ENST00000356083.8
|
COL27A1
|
collagen type XXVII alpha 1 chain |
| chr12_+_10179024 | 0.45 |
ENST00000543484.2
|
TMEM52B
|
transmembrane protein 52B |
| chr21_+_41420515 | 0.45 |
ENST00000398600.6
ENST00000679626.1 |
MX1
|
MX dynamin like GTPase 1 |
| chr1_+_165895583 | 0.45 |
ENST00000470820.1
|
UCK2
|
uridine-cytidine kinase 2 |
| chr1_+_154321107 | 0.45 |
ENST00000484864.1
|
AQP10
|
aquaporin 10 |
| chr19_-_48044037 | 0.45 |
ENST00000293255.3
|
CABP5
|
calcium binding protein 5 |
| chr6_-_32853813 | 0.45 |
ENST00000643049.2
|
TAP1
|
transporter 1, ATP binding cassette subfamily B member |
| chr11_-_8810635 | 0.45 |
ENST00000527510.5
ENST00000528527.5 ENST00000313726.11 ENST00000528523.5 |
DENND2B
|
DENN domain containing 2B |
| chr5_-_116574802 | 0.45 |
ENST00000343348.11
|
SEMA6A
|
semaphorin 6A |
| chr19_+_18173804 | 0.45 |
ENST00000407280.4
|
IFI30
|
IFI30 lysosomal thiol reductase |
| chr2_-_224982420 | 0.44 |
ENST00000645028.1
|
DOCK10
|
dedicator of cytokinesis 10 |
| chr1_-_161307420 | 0.44 |
ENST00000491222.5
ENST00000672287.2 |
MPZ
|
myelin protein zero |
| chr6_+_37929959 | 0.44 |
ENST00000373389.5
|
ZFAND3
|
zinc finger AN1-type containing 3 |
| chr11_+_61241175 | 0.44 |
ENST00000312403.10
|
PGA5
|
pepsinogen A5 |
| chr11_+_113908983 | 0.44 |
ENST00000537778.5
|
HTR3B
|
5-hydroxytryptamine receptor 3B |
| chr18_+_24138958 | 0.44 |
ENST00000627314.1
|
CABYR
|
calcium binding tyrosine phosphorylation regulated |
| chr6_+_29723340 | 0.44 |
ENST00000334668.8
|
HLA-F
|
major histocompatibility complex, class I, F |
Gene Ontology Analysis
Gene overrepresentation in biological process category:
| Log-likelihood per target | Total log-likelihood | Term | Description |
|---|---|---|---|
| 0.6 | 5.2 | GO:0035655 | interleukin-18-mediated signaling pathway(GO:0035655) |
| 0.5 | 1.5 | GO:0046967 | cytosol to ER transport(GO:0046967) |
| 0.5 | 2.0 | GO:0003409 | optic cup structural organization(GO:0003409) |
| 0.5 | 1.4 | GO:0034769 | basement membrane disassembly(GO:0034769) |
| 0.4 | 1.2 | GO:0038156 | interleukin-3-mediated signaling pathway(GO:0038156) |
| 0.4 | 1.2 | GO:1903400 | L-arginine transmembrane transport(GO:1903400) |
| 0.4 | 2.3 | GO:0061767 | negative regulation of lung blood pressure(GO:0061767) |
| 0.4 | 4.4 | GO:1901740 | negative regulation of myoblast fusion(GO:1901740) |
| 0.3 | 2.4 | GO:0022614 | membrane to membrane docking(GO:0022614) |
| 0.3 | 1.6 | GO:0032730 | positive regulation of interleukin-1 alpha production(GO:0032730) |
| 0.3 | 0.9 | GO:0048058 | compound eye corneal lens development(GO:0048058) |
| 0.3 | 1.2 | GO:0030037 | actin filament reorganization involved in cell cycle(GO:0030037) |
| 0.3 | 1.5 | GO:0003068 | age-dependent response to oxidative stress(GO:0001306) age-dependent response to reactive oxygen species(GO:0001315) regulation of systemic arterial blood pressure by acetylcholine(GO:0003068) vasodilation by acetylcholine involved in regulation of systemic arterial blood pressure(GO:0003069) regulation of systemic arterial blood pressure by neurotransmitter(GO:0003070) age-dependent general metabolic decline(GO:0007571) |
| 0.3 | 2.1 | GO:2000860 | positive regulation of mineralocorticoid secretion(GO:2000857) positive regulation of aldosterone secretion(GO:2000860) |
| 0.3 | 0.8 | GO:2000661 | positive regulation of interleukin-1-mediated signaling pathway(GO:2000661) |
| 0.3 | 0.8 | GO:0043006 | activation of phospholipase A2 activity by calcium-mediated signaling(GO:0043006) |
| 0.3 | 1.5 | GO:1903435 | positive regulation of constitutive secretory pathway(GO:1903435) |
| 0.3 | 0.3 | GO:1902524 | positive regulation of protein K48-linked ubiquitination(GO:1902524) |
| 0.2 | 0.7 | GO:0051939 | gamma-aminobutyric acid import(GO:0051939) |
| 0.2 | 0.9 | GO:0097045 | phosphatidylserine exposure on blood platelet(GO:0097045) |
| 0.2 | 3.9 | GO:0046007 | negative regulation of activated T cell proliferation(GO:0046007) |
| 0.2 | 0.9 | GO:0000738 | DNA catabolic process, exonucleolytic(GO:0000738) |
| 0.2 | 0.9 | GO:0042704 | uterine wall breakdown(GO:0042704) |
| 0.2 | 1.5 | GO:0072734 | response to staurosporine(GO:0072733) cellular response to staurosporine(GO:0072734) |
| 0.2 | 0.7 | GO:0050928 | negative regulation of positive chemotaxis(GO:0050928) |
| 0.2 | 0.9 | GO:0009436 | glyoxylate catabolic process(GO:0009436) |
| 0.2 | 0.9 | GO:1903490 | regulation of cytokinetic process(GO:0032954) regulation of mitotic cytokinetic process(GO:1903436) positive regulation of mitotic cytokinetic process(GO:1903438) positive regulation of mitotic cytokinesis(GO:1903490) |
| 0.2 | 0.6 | GO:0044278 | cell wall disruption in other organism(GO:0044278) |
| 0.2 | 0.8 | GO:0046035 | CMP salvage(GO:0006238) CMP biosynthetic process(GO:0009224) CMP metabolic process(GO:0046035) |
| 0.2 | 0.8 | GO:2001247 | positive regulation of phosphatidylcholine biosynthetic process(GO:2001247) |
| 0.2 | 0.6 | GO:0060739 | mesenchymal-epithelial cell signaling involved in prostate gland development(GO:0060739) |
| 0.2 | 0.8 | GO:0033159 | negative regulation of protein import into nucleus, translocation(GO:0033159) |
| 0.2 | 0.6 | GO:0036304 | umbilical cord morphogenesis(GO:0036304) umbilical cord development(GO:0061027) |
| 0.2 | 0.6 | GO:0052250 | modulation of signal transduction in other organism(GO:0044501) modulation by symbiont of host signal transduction pathway(GO:0052027) modulation of signal transduction in other organism involved in symbiotic interaction(GO:0052250) modulation by symbiont of host I-kappaB kinase/NF-kappaB cascade(GO:0085032) |
| 0.2 | 0.8 | GO:0002215 | defense response to nematode(GO:0002215) |
| 0.2 | 0.6 | GO:0046110 | xanthine metabolic process(GO:0046110) |
| 0.2 | 2.3 | GO:2001288 | positive regulation of caveolin-mediated endocytosis(GO:2001288) |
| 0.2 | 2.8 | GO:0035457 | cellular response to interferon-alpha(GO:0035457) |
| 0.2 | 1.1 | GO:0071918 | urea transmembrane transport(GO:0071918) |
| 0.2 | 3.0 | GO:0070424 | regulation of nucleotide-binding oligomerization domain containing signaling pathway(GO:0070424) |
| 0.2 | 0.5 | GO:0009720 | detection of hormone stimulus(GO:0009720) |
| 0.2 | 0.5 | GO:1990654 | regulation of extrathymic T cell differentiation(GO:0033082) sebum secreting cell proliferation(GO:1990654) |
| 0.2 | 0.5 | GO:0018002 | N-terminal peptidyl-serine acetylation(GO:0017198) N-terminal peptidyl-glutamic acid acetylation(GO:0018002) peptidyl-serine acetylation(GO:0030920) |
| 0.2 | 0.5 | GO:0045062 | extrathymic T cell differentiation(GO:0033078) extrathymic T cell selection(GO:0045062) |
| 0.2 | 0.5 | GO:0038195 | urokinase plasminogen activator signaling pathway(GO:0038195) |
| 0.2 | 1.2 | GO:0045084 | positive regulation of interleukin-12 biosynthetic process(GO:0045084) |
| 0.2 | 0.7 | GO:0050925 | negative regulation of negative chemotaxis(GO:0050925) |
| 0.2 | 0.3 | GO:0055099 | response to high density lipoprotein particle(GO:0055099) |
| 0.2 | 0.3 | GO:0042940 | D-amino acid transport(GO:0042940) |
| 0.2 | 0.6 | GO:0050822 | peptide stabilization(GO:0050822) peptide antigen stabilization(GO:0050823) |
| 0.2 | 0.8 | GO:0035962 | response to interleukin-13(GO:0035962) |
| 0.2 | 0.9 | GO:0038172 | interleukin-33-mediated signaling pathway(GO:0038172) |
| 0.2 | 0.6 | GO:0035880 | embryonic nail plate morphogenesis(GO:0035880) |
| 0.1 | 0.1 | GO:0010847 | regulation of chromatin assembly(GO:0010847) |
| 0.1 | 0.6 | GO:0010900 | negative regulation of phosphatidylcholine catabolic process(GO:0010900) |
| 0.1 | 0.1 | GO:1903487 | regulation of lactation(GO:1903487) |
| 0.1 | 0.3 | GO:0072254 | positive regulation of granulocyte colony-stimulating factor production(GO:0071657) metanephric mesangial cell differentiation(GO:0072209) metanephric glomerular mesangial cell differentiation(GO:0072254) positive regulation of macrophage colony-stimulating factor production(GO:1901258) |
| 0.1 | 0.3 | GO:1900041 | negative regulation of interleukin-2 secretion(GO:1900041) |
| 0.1 | 0.3 | GO:0034125 | negative regulation of MyD88-dependent toll-like receptor signaling pathway(GO:0034125) |
| 0.1 | 0.4 | GO:0002339 | B cell selection(GO:0002339) |
| 0.1 | 0.4 | GO:0003221 | right ventricular cardiac muscle tissue morphogenesis(GO:0003221) |
| 0.1 | 0.7 | GO:0043932 | ossification involved in bone remodeling(GO:0043932) |
| 0.1 | 0.1 | GO:0090133 | mesendoderm migration(GO:0090133) cell migration involved in mesendoderm migration(GO:0090134) |
| 0.1 | 0.7 | GO:0034421 | post-translational protein acetylation(GO:0034421) |
| 0.1 | 1.1 | GO:0071317 | cellular response to morphine(GO:0071315) cellular response to isoquinoline alkaloid(GO:0071317) |
| 0.1 | 1.1 | GO:0070842 | aggresome assembly(GO:0070842) |
| 0.1 | 0.7 | GO:1902081 | regulation of calcium ion import into sarcoplasmic reticulum(GO:1902080) negative regulation of calcium ion import into sarcoplasmic reticulum(GO:1902081) |
| 0.1 | 1.3 | GO:0002480 | antigen processing and presentation of exogenous peptide antigen via MHC class I, TAP-independent(GO:0002480) |
| 0.1 | 0.4 | GO:0042946 | glucoside transport(GO:0042946) |
| 0.1 | 0.4 | GO:1904204 | regulation of skeletal muscle hypertrophy(GO:1904204) |
| 0.1 | 1.1 | GO:0043950 | positive regulation of cAMP-mediated signaling(GO:0043950) |
| 0.1 | 0.4 | GO:0061394 | regulation of transcription from RNA polymerase II promoter in response to arsenic-containing substance(GO:0061394) |
| 0.1 | 0.4 | GO:0042495 | detection of triacyl bacterial lipopeptide(GO:0042495) detection of bacterial lipopeptide(GO:0070340) |
| 0.1 | 0.6 | GO:1901662 | phylloquinone metabolic process(GO:0042374) phylloquinone catabolic process(GO:0042376) quinone catabolic process(GO:1901662) |
| 0.1 | 0.5 | GO:1903971 | positive regulation of odontogenesis of dentin-containing tooth(GO:0042488) mammary gland fat development(GO:0060611) positive regulation of macrophage colony-stimulating factor signaling pathway(GO:1902228) positive regulation of response to macrophage colony-stimulating factor(GO:1903971) positive regulation of cellular response to macrophage colony-stimulating factor stimulus(GO:1903974) positive regulation of microglial cell migration(GO:1904141) |
| 0.1 | 0.9 | GO:0016344 | meiotic chromosome movement towards spindle pole(GO:0016344) |
| 0.1 | 1.1 | GO:0070212 | protein poly-ADP-ribosylation(GO:0070212) |
| 0.1 | 0.4 | GO:0046521 | sphingoid catabolic process(GO:0046521) |
| 0.1 | 0.4 | GO:2000097 | regulation of smooth muscle cell-matrix adhesion(GO:2000097) |
| 0.1 | 0.1 | GO:0032425 | positive regulation of mismatch repair(GO:0032425) |
| 0.1 | 0.4 | GO:0001545 | primary ovarian follicle growth(GO:0001545) |
| 0.1 | 0.4 | GO:1901073 | N-acetylglucosamine biosynthetic process(GO:0006045) glucosamine-containing compound biosynthetic process(GO:1901073) |
| 0.1 | 0.5 | GO:0021965 | spinal cord ventral commissure morphogenesis(GO:0021965) |
| 0.1 | 0.4 | GO:0070858 | negative regulation of bile acid biosynthetic process(GO:0070858) negative regulation of bile acid metabolic process(GO:1904252) |
| 0.1 | 0.4 | GO:0002581 | negative regulation of antigen processing and presentation of peptide or polysaccharide antigen via MHC class II(GO:0002581) |
| 0.1 | 2.0 | GO:0032625 | interleukin-21 production(GO:0032625) interleukin-21 secretion(GO:0072619) |
| 0.1 | 0.9 | GO:0009253 | peptidoglycan metabolic process(GO:0000270) peptidoglycan catabolic process(GO:0009253) |
| 0.1 | 0.3 | GO:1900127 | positive regulation of hyaluronan biosynthetic process(GO:1900127) |
| 0.1 | 0.9 | GO:0001554 | luteolysis(GO:0001554) |
| 0.1 | 0.3 | GO:0016094 | polyprenol biosynthetic process(GO:0016094) |
| 0.1 | 0.5 | GO:0033384 | geranyl diphosphate metabolic process(GO:0033383) geranyl diphosphate biosynthetic process(GO:0033384) farnesyl diphosphate biosynthetic process(GO:0045337) |
| 0.1 | 0.2 | GO:1904170 | regulation of bleb assembly(GO:1904170) positive regulation of bleb assembly(GO:1904172) |
| 0.1 | 0.2 | GO:0072573 | tolerance induction to lipopolysaccharide(GO:0072573) |
| 0.1 | 1.0 | GO:2000124 | regulation of endocannabinoid signaling pathway(GO:2000124) |
| 0.1 | 0.3 | GO:0051040 | regulation of calcium-independent cell-cell adhesion(GO:0051040) corticotropin hormone secreting cell differentiation(GO:0060128) |
| 0.1 | 0.3 | GO:0060578 | subthalamic nucleus development(GO:0021763) prolactin secreting cell differentiation(GO:0060127) superior vena cava morphogenesis(GO:0060578) |
| 0.1 | 1.0 | GO:0042905 | 9-cis-retinoic acid biosynthetic process(GO:0042904) 9-cis-retinoic acid metabolic process(GO:0042905) |
| 0.1 | 0.4 | GO:0010387 | COP9 signalosome assembly(GO:0010387) |
| 0.1 | 0.4 | GO:0046900 | tetrahydrofolylpolyglutamate metabolic process(GO:0046900) |
| 0.1 | 0.3 | GO:1900111 | positive regulation of histone H3-K9 dimethylation(GO:1900111) |
| 0.1 | 0.5 | GO:0034343 | type III interferon production(GO:0034343) regulation of type III interferon production(GO:0034344) |
| 0.1 | 0.8 | GO:0002254 | kinin cascade(GO:0002254) plasma kallikrein-kinin cascade(GO:0002353) |
| 0.1 | 0.4 | GO:0002879 | positive regulation of acute inflammatory response to non-antigenic stimulus(GO:0002879) |
| 0.1 | 0.6 | GO:2000418 | positive regulation of eosinophil migration(GO:2000418) |
| 0.1 | 0.6 | GO:1901509 | regulation of endothelial tube morphogenesis(GO:1901509) |
| 0.1 | 0.6 | GO:0008218 | bioluminescence(GO:0008218) |
| 0.1 | 0.6 | GO:2001180 | negative regulation of interleukin-10 secretion(GO:2001180) |
| 0.1 | 0.3 | GO:0031064 | negative regulation of histone deacetylation(GO:0031064) |
| 0.1 | 0.3 | GO:0061026 | cardiac muscle tissue regeneration(GO:0061026) |
| 0.1 | 0.3 | GO:0043049 | hepatocyte cell migration(GO:0002194) otic placode formation(GO:0043049) branching involved in pancreas morphogenesis(GO:0061114) acinar cell differentiation(GO:0090425) positive regulation of forebrain neuron differentiation(GO:2000979) |
| 0.1 | 0.9 | GO:0038110 | interleukin-2-mediated signaling pathway(GO:0038110) |
| 0.1 | 1.7 | GO:0002315 | marginal zone B cell differentiation(GO:0002315) |
| 0.1 | 0.3 | GO:0035281 | pre-miRNA export from nucleus(GO:0035281) |
| 0.1 | 0.3 | GO:0050993 | dimethylallyl diphosphate biosynthetic process(GO:0050992) dimethylallyl diphosphate metabolic process(GO:0050993) |
| 0.1 | 0.7 | GO:0043305 | negative regulation of mast cell degranulation(GO:0043305) |
| 0.1 | 0.6 | GO:0019060 | intracellular transport of viral protein in host cell(GO:0019060) symbiont intracellular protein transport in host(GO:0030581) intracellular protein transport in other organism involved in symbiotic interaction(GO:0051708) |
| 0.1 | 0.9 | GO:0021891 | olfactory bulb interneuron development(GO:0021891) |
| 0.1 | 0.3 | GO:1990764 | regulation of myofibroblast contraction(GO:1904328) myofibroblast contraction(GO:1990764) |
| 0.1 | 0.8 | GO:0002018 | renin-angiotensin regulation of aldosterone production(GO:0002018) |
| 0.1 | 1.2 | GO:0030578 | PML body organization(GO:0030578) |
| 0.1 | 0.4 | GO:0032916 | positive regulation of transforming growth factor beta3 production(GO:0032916) |
| 0.1 | 1.0 | GO:0060700 | regulation of ribonuclease activity(GO:0060700) |
| 0.1 | 0.8 | GO:0002175 | protein localization to paranode region of axon(GO:0002175) |
| 0.1 | 0.2 | GO:0035624 | receptor transactivation(GO:0035624) |
| 0.1 | 1.0 | GO:0048007 | antigen processing and presentation via MHC class Ib(GO:0002475) antigen processing and presentation of lipid antigen via MHC class Ib(GO:0048003) antigen processing and presentation, exogenous lipid antigen via MHC class Ib(GO:0048007) |
| 0.1 | 0.4 | GO:2000866 | positive regulation of estrogen secretion(GO:2000863) positive regulation of estradiol secretion(GO:2000866) |
| 0.1 | 0.3 | GO:0000472 | endonucleolytic cleavage to generate mature 5'-end of SSU-rRNA from (SSU-rRNA, 5.8S rRNA, LSU-rRNA)(GO:0000472) rRNA 5'-end processing(GO:0000967) ncRNA 5'-end processing(GO:0034471) |
| 0.1 | 0.3 | GO:0051414 | response to cortisol(GO:0051414) |
| 0.1 | 0.1 | GO:1902159 | regulation of cyclic nucleotide-gated ion channel activity(GO:1902159) |
| 0.1 | 0.4 | GO:2000158 | positive regulation of ubiquitin-specific protease activity(GO:2000158) |
| 0.1 | 0.4 | GO:0032747 | positive regulation of interleukin-23 production(GO:0032747) |
| 0.1 | 0.4 | GO:1904800 | negative regulation of dendrite extension(GO:1903860) regulation of neuron remodeling(GO:1904799) negative regulation of neuron remodeling(GO:1904800) negative regulation of branching morphogenesis of a nerve(GO:2000173) |
| 0.1 | 0.5 | GO:0003431 | growth plate cartilage chondrocyte development(GO:0003431) |
| 0.1 | 0.3 | GO:0045643 | regulation of eosinophil differentiation(GO:0045643) positive regulation of eosinophil differentiation(GO:0045645) |
| 0.1 | 3.1 | GO:0044458 | motile cilium assembly(GO:0044458) |
| 0.1 | 1.0 | GO:0055118 | negative regulation of cardiac muscle contraction(GO:0055118) |
| 0.1 | 0.3 | GO:0036058 | filtration diaphragm assembly(GO:0036058) slit diaphragm assembly(GO:0036060) negative regulation of retinal ganglion cell axon guidance(GO:0090260) |
| 0.1 | 0.7 | GO:0006682 | galactosylceramide biosynthetic process(GO:0006682) galactolipid biosynthetic process(GO:0019375) |
| 0.1 | 0.3 | GO:0034476 | U1 snRNA 3'-end processing(GO:0034473) U5 snRNA 3'-end processing(GO:0034476) |
| 0.1 | 0.1 | GO:0097252 | oligodendrocyte apoptotic process(GO:0097252) |
| 0.1 | 0.1 | GO:2000318 | positive regulation of T-helper 17 type immune response(GO:2000318) |
| 0.1 | 0.2 | GO:0033590 | response to cobalamin(GO:0033590) |
| 0.1 | 0.2 | GO:0060018 | astrocyte fate commitment(GO:0060018) |
| 0.1 | 0.2 | GO:0036269 | swimming behavior(GO:0036269) |
| 0.1 | 0.2 | GO:2000347 | positive regulation of hepatocyte proliferation(GO:2000347) |
| 0.1 | 0.2 | GO:0003147 | neural crest cell migration involved in heart formation(GO:0003147) anterior neural tube closure(GO:0061713) |
| 0.1 | 0.6 | GO:0006003 | fructose 2,6-bisphosphate metabolic process(GO:0006003) |
| 0.1 | 0.4 | GO:0018352 | protein-pyridoxal-5-phosphate linkage(GO:0018352) |
| 0.1 | 0.2 | GO:0046832 | negative regulation of nucleobase-containing compound transport(GO:0032240) negative regulation of RNA export from nucleus(GO:0046832) |
| 0.1 | 0.6 | GO:0010749 | regulation of nitric oxide mediated signal transduction(GO:0010749) |
| 0.1 | 0.2 | GO:1903565 | negative regulation of protein localization to cilium(GO:1903565) regulation of protein localization to ciliary membrane(GO:1903567) negative regulation of protein localization to ciliary membrane(GO:1903568) |
| 0.1 | 0.3 | GO:0000454 | snoRNA guided rRNA pseudouridine synthesis(GO:0000454) |
| 0.1 | 0.2 | GO:0043686 | co-translational protein modification(GO:0043686) |
| 0.1 | 0.2 | GO:1904397 | negative regulation of neuromuscular junction development(GO:1904397) |
| 0.1 | 0.4 | GO:0071034 | CUT catabolic process(GO:0071034) CUT metabolic process(GO:0071043) |
| 0.1 | 1.0 | GO:1900623 | regulation of monocyte aggregation(GO:1900623) positive regulation of monocyte aggregation(GO:1900625) |
| 0.1 | 0.9 | GO:0032782 | bile acid secretion(GO:0032782) |
| 0.1 | 0.2 | GO:0072344 | rescue of stalled ribosome(GO:0072344) |
| 0.1 | 0.4 | GO:0060574 | intestinal epithelial cell maturation(GO:0060574) |
| 0.1 | 0.1 | GO:0090467 | L-arginine import(GO:0043091) arginine import(GO:0090467) L-arginine transport(GO:1902023) |
| 0.1 | 0.3 | GO:2000683 | regulation of cellular response to X-ray(GO:2000683) |
| 0.1 | 0.4 | GO:0002309 | T cell proliferation involved in immune response(GO:0002309) |
| 0.1 | 0.5 | GO:0070269 | pyroptosis(GO:0070269) |
| 0.1 | 0.8 | GO:0035878 | nail development(GO:0035878) |
| 0.1 | 0.3 | GO:1902544 | regulation of DNA N-glycosylase activity(GO:1902544) |
| 0.1 | 0.2 | GO:1903348 | positive regulation of bicellular tight junction assembly(GO:1903348) |
| 0.1 | 0.3 | GO:0090290 | positive regulation of osteoclast proliferation(GO:0090290) |
| 0.1 | 0.2 | GO:0097534 | lymphoid lineage cell migration(GO:0097534) lymphoid lineage cell migration into thymus(GO:0097535) |
| 0.1 | 0.9 | GO:2000172 | regulation of branching morphogenesis of a nerve(GO:2000172) |
| 0.1 | 0.2 | GO:0031448 | regulation of fast-twitch skeletal muscle fiber contraction(GO:0031446) positive regulation of fast-twitch skeletal muscle fiber contraction(GO:0031448) |
| 0.1 | 0.2 | GO:0014054 | positive regulation of gamma-aminobutyric acid secretion(GO:0014054) |
| 0.1 | 1.1 | GO:0060020 | Bergmann glial cell differentiation(GO:0060020) |
| 0.1 | 0.2 | GO:0051039 | histone displacement(GO:0001207) positive regulation of transcription involved in meiotic cell cycle(GO:0051039) |
| 0.1 | 0.2 | GO:0031117 | positive regulation of microtubule depolymerization(GO:0031117) |
| 0.1 | 0.2 | GO:0002876 | positive regulation of chronic inflammatory response to antigenic stimulus(GO:0002876) |
| 0.1 | 0.3 | GO:0006617 | SRP-dependent cotranslational protein targeting to membrane, signal sequence recognition(GO:0006617) |
| 0.1 | 0.6 | GO:0061734 | parkin-mediated mitophagy in response to mitochondrial depolarization(GO:0061734) |
| 0.1 | 0.6 | GO:0036005 | response to macrophage colony-stimulating factor(GO:0036005) cellular response to macrophage colony-stimulating factor stimulus(GO:0036006) |
| 0.1 | 0.9 | GO:0072643 | interferon-gamma secretion(GO:0072643) |
| 0.1 | 1.5 | GO:0071294 | cellular response to zinc ion(GO:0071294) |
| 0.1 | 0.8 | GO:0035585 | calcium-mediated signaling using extracellular calcium source(GO:0035585) |
| 0.1 | 0.6 | GO:0007252 | I-kappaB phosphorylation(GO:0007252) |
| 0.1 | 0.7 | GO:0046598 | positive regulation of viral entry into host cell(GO:0046598) |
| 0.1 | 0.1 | GO:0051919 | positive regulation of fibrinolysis(GO:0051919) |
| 0.1 | 0.5 | GO:0071287 | cellular response to manganese ion(GO:0071287) |
| 0.1 | 1.4 | GO:0002523 | leukocyte migration involved in inflammatory response(GO:0002523) |
| 0.1 | 1.2 | GO:0097296 | activation of cysteine-type endopeptidase activity involved in apoptotic signaling pathway(GO:0097296) |
| 0.1 | 0.1 | GO:0019858 | cytosine metabolic process(GO:0019858) |
| 0.1 | 0.1 | GO:0071639 | positive regulation of monocyte chemotactic protein-1 production(GO:0071639) |
| 0.1 | 0.2 | GO:0055005 | ventricular cardiac myofibril assembly(GO:0055005) |
| 0.1 | 0.3 | GO:0072683 | T cell extravasation(GO:0072683) |
| 0.1 | 0.2 | GO:0030573 | bile acid catabolic process(GO:0030573) |
| 0.1 | 0.5 | GO:0071651 | positive regulation of chemokine (C-C motif) ligand 5 production(GO:0071651) |
| 0.1 | 0.3 | GO:0046208 | spermine catabolic process(GO:0046208) |
| 0.1 | 0.8 | GO:1900747 | negative regulation of vascular endothelial growth factor signaling pathway(GO:1900747) |
| 0.1 | 0.1 | GO:0032687 | negative regulation of interferon-alpha production(GO:0032687) |
| 0.1 | 0.2 | GO:0061300 | cerebellum vasculature development(GO:0061300) |
| 0.1 | 0.3 | GO:0040030 | regulation of molecular function, epigenetic(GO:0040030) |
| 0.1 | 0.5 | GO:0051534 | negative regulation of NFAT protein import into nucleus(GO:0051534) |
| 0.1 | 0.1 | GO:0009441 | glycolate metabolic process(GO:0009441) |
| 0.1 | 0.1 | GO:0051771 | negative regulation of nitric-oxide synthase biosynthetic process(GO:0051771) |
| 0.1 | 0.1 | GO:0051659 | maintenance of mitochondrion location(GO:0051659) |
| 0.1 | 0.3 | GO:1900108 | negative regulation of nodal signaling pathway(GO:1900108) |
| 0.1 | 0.3 | GO:0070857 | regulation of bile acid biosynthetic process(GO:0070857) |
| 0.1 | 0.1 | GO:0035385 | Roundabout signaling pathway(GO:0035385) |
| 0.1 | 0.2 | GO:0071393 | cellular response to progesterone stimulus(GO:0071393) |
| 0.1 | 0.1 | GO:1905073 | positive regulation of relaxation of muscle(GO:1901079) occluding junction disassembly(GO:1905071) regulation of occluding junction disassembly(GO:1905073) positive regulation of occluding junction disassembly(GO:1905075) |
| 0.1 | 0.1 | GO:1903897 | regulation of PERK-mediated unfolded protein response(GO:1903897) |
| 0.1 | 0.2 | GO:0048162 | preantral ovarian follicle growth(GO:0001546) multi-layer follicle stage(GO:0048162) |
| 0.1 | 1.1 | GO:0051256 | mitotic spindle midzone assembly(GO:0051256) |
| 0.1 | 0.2 | GO:1900365 | positive regulation of mRNA polyadenylation(GO:1900365) |
| 0.1 | 0.8 | GO:0070327 | thyroid hormone transport(GO:0070327) |
| 0.1 | 1.2 | GO:0030277 | maintenance of gastrointestinal epithelium(GO:0030277) |
| 0.1 | 0.4 | GO:0006642 | triglyceride mobilization(GO:0006642) |
| 0.1 | 0.1 | GO:2000354 | regulation of ovarian follicle development(GO:2000354) |
| 0.1 | 0.4 | GO:0034141 | positive regulation of toll-like receptor 3 signaling pathway(GO:0034141) |
| 0.1 | 0.2 | GO:2000298 | regulation of Rho-dependent protein serine/threonine kinase activity(GO:2000298) |
| 0.1 | 0.2 | GO:1904117 | response to vasopressin(GO:1904116) cellular response to vasopressin(GO:1904117) |
| 0.1 | 0.4 | GO:0051754 | meiotic sister chromatid cohesion, centromeric(GO:0051754) |
| 0.1 | 0.1 | GO:0060686 | negative regulation of prostatic bud formation(GO:0060686) |
| 0.1 | 0.1 | GO:0060435 | bronchiole development(GO:0060435) |
| 0.1 | 0.2 | GO:1904823 | pyrimidine nucleobase transport(GO:0015855) purine nucleobase transmembrane transport(GO:1904823) |
| 0.1 | 1.5 | GO:0050930 | induction of positive chemotaxis(GO:0050930) |
| 0.1 | 1.3 | GO:0008228 | opsonization(GO:0008228) |
| 0.1 | 0.3 | GO:2000653 | regulation of genetic imprinting(GO:2000653) |
| 0.1 | 0.3 | GO:0071504 | cellular response to heparin(GO:0071504) |
| 0.1 | 0.1 | GO:0060392 | negative regulation of SMAD protein import into nucleus(GO:0060392) |
| 0.1 | 0.5 | GO:0015760 | hexose phosphate transport(GO:0015712) glucose-6-phosphate transport(GO:0015760) |
| 0.1 | 0.4 | GO:0048241 | epinephrine transport(GO:0048241) |
| 0.1 | 0.2 | GO:1904742 | regulation of telomeric DNA binding(GO:1904742) |
| 0.1 | 0.2 | GO:0060665 | regulation of branching involved in salivary gland morphogenesis by mesenchymal-epithelial signaling(GO:0060665) |
| 0.1 | 0.1 | GO:0010940 | positive regulation of necrotic cell death(GO:0010940) |
| 0.1 | 0.2 | GO:0070945 | neutrophil mediated killing of gram-negative bacterium(GO:0070945) |
| 0.1 | 0.2 | GO:1903288 | positive regulation of potassium ion import(GO:1903288) |
| 0.1 | 0.2 | GO:0015993 | molecular hydrogen transport(GO:0015993) |
| 0.1 | 0.2 | GO:1902908 | regulation of melanosome transport(GO:1902908) |
| 0.1 | 1.7 | GO:0048240 | sperm capacitation(GO:0048240) |
| 0.1 | 0.1 | GO:0006711 | estrogen catabolic process(GO:0006711) |
| 0.1 | 0.1 | GO:0002361 | CD4-positive, CD25-positive, alpha-beta regulatory T cell differentiation(GO:0002361) |
| 0.1 | 4.9 | GO:0010803 | regulation of tumor necrosis factor-mediated signaling pathway(GO:0010803) |
| 0.1 | 0.1 | GO:0072054 | renal inner medulla development(GO:0072053) renal outer medulla development(GO:0072054) |
| 0.1 | 0.1 | GO:0060434 | bronchus morphogenesis(GO:0060434) |
| 0.1 | 0.4 | GO:0016554 | cytidine to uridine editing(GO:0016554) |
| 0.1 | 0.1 | GO:1903826 | arginine transmembrane transport(GO:1903826) |
| 0.1 | 0.2 | GO:0034414 | tRNA 3'-trailer cleavage, endonucleolytic(GO:0034414) tRNA 3'-trailer cleavage(GO:0042779) |
| 0.1 | 0.3 | GO:0002074 | extraocular skeletal muscle development(GO:0002074) |
| 0.1 | 0.2 | GO:0016185 | synaptic vesicle budding from presynaptic endocytic zone membrane(GO:0016185) |
| 0.1 | 0.4 | GO:0006001 | fructose catabolic process(GO:0006001) fructose catabolic process to hydroxyacetone phosphate and glyceraldehyde-3-phosphate(GO:0061624) |
| 0.1 | 0.1 | GO:0090164 | asymmetric Golgi ribbon formation(GO:0090164) |
| 0.1 | 0.3 | GO:0042986 | positive regulation of amyloid precursor protein biosynthetic process(GO:0042986) |
| 0.1 | 0.3 | GO:0019556 | histidine catabolic process to glutamate and formamide(GO:0019556) histidine catabolic process to glutamate and formate(GO:0019557) formamide metabolic process(GO:0043606) |
| 0.1 | 0.4 | GO:0050689 | negative regulation of defense response to virus by host(GO:0050689) |
| 0.1 | 0.3 | GO:1903899 | positive regulation of PERK-mediated unfolded protein response(GO:1903899) |
| 0.1 | 0.4 | GO:0072584 | caveolin-mediated endocytosis(GO:0072584) |
| 0.1 | 0.2 | GO:0071442 | positive regulation of histone H3-K14 acetylation(GO:0071442) |
| 0.1 | 0.1 | GO:0090594 | wound healing involved in inflammatory response(GO:0002246) connective tissue replacement involved in inflammatory response wound healing(GO:0002248) inflammatory response to wounding(GO:0090594) |
| 0.1 | 1.1 | GO:2001224 | positive regulation of neuron migration(GO:2001224) |
| 0.1 | 0.1 | GO:1903977 | positive regulation of glial cell migration(GO:1903977) |
| 0.1 | 0.2 | GO:0098989 | NMDA selective glutamate receptor signaling pathway(GO:0098989) |
| 0.1 | 0.4 | GO:0002291 | T cell activation via T cell receptor contact with antigen bound to MHC molecule on antigen presenting cell(GO:0002291) |
| 0.1 | 0.1 | GO:0019276 | UDP-N-acetylgalactosamine metabolic process(GO:0019276) |
| 0.1 | 0.2 | GO:0070898 | RNA polymerase III transcriptional preinitiation complex assembly(GO:0070898) |
| 0.1 | 0.1 | GO:2000439 | positive regulation of monocyte extravasation(GO:2000439) |
| 0.1 | 1.7 | GO:1903204 | negative regulation of oxidative stress-induced neuron death(GO:1903204) |
| 0.1 | 0.2 | GO:0090158 | endoplasmic reticulum membrane organization(GO:0090158) |
| 0.1 | 0.1 | GO:0051885 | positive regulation of anagen(GO:0051885) |
| 0.1 | 0.9 | GO:0006048 | UDP-N-acetylglucosamine biosynthetic process(GO:0006048) amino sugar biosynthetic process(GO:0046349) |
| 0.1 | 0.2 | GO:0099553 | trans-synaptic signaling by lipid, modulating synaptic transmission(GO:0099552) trans-synaptic signaling by endocannabinoid, modulating synaptic transmission(GO:0099553) |
| 0.1 | 0.1 | GO:0021847 | ventricular zone neuroblast division(GO:0021847) |
| 0.1 | 0.1 | GO:2000525 | regulation of T cell costimulation(GO:2000523) positive regulation of T cell costimulation(GO:2000525) |
| 0.1 | 0.8 | GO:0032703 | negative regulation of interleukin-2 production(GO:0032703) |
| 0.1 | 0.2 | GO:0043321 | regulation of natural killer cell degranulation(GO:0043321) positive regulation of natural killer cell degranulation(GO:0043323) |
| 0.1 | 0.1 | GO:0015920 | lipopolysaccharide transport(GO:0015920) |
| 0.1 | 0.5 | GO:1904153 | negative regulation of protein exit from endoplasmic reticulum(GO:0070862) negative regulation of retrograde protein transport, ER to cytosol(GO:1904153) |
| 0.1 | 0.2 | GO:0002925 | positive regulation of humoral immune response mediated by circulating immunoglobulin(GO:0002925) |
| 0.1 | 0.7 | GO:1902221 | L-phenylalanine metabolic process(GO:0006558) L-phenylalanine catabolic process(GO:0006559) erythrose 4-phosphate/phosphoenolpyruvate family amino acid metabolic process(GO:1902221) erythrose 4-phosphate/phosphoenolpyruvate family amino acid catabolic process(GO:1902222) |
| 0.1 | 0.5 | GO:0032264 | IMP salvage(GO:0032264) |
| 0.1 | 0.4 | GO:0008582 | regulation of synaptic growth at neuromuscular junction(GO:0008582) |
| 0.1 | 0.1 | GO:0021524 | visceral motor neuron differentiation(GO:0021524) |
| 0.1 | 0.2 | GO:1901859 | negative regulation of mitochondrial DNA replication(GO:0090298) negative regulation of mitochondrial DNA metabolic process(GO:1901859) |
| 0.1 | 0.3 | GO:0045204 | MAPK export from nucleus(GO:0045204) |
| 0.1 | 0.1 | GO:0009726 | detection of endogenous stimulus(GO:0009726) |
| 0.1 | 0.3 | GO:0060356 | leucine import(GO:0060356) |
| 0.1 | 0.4 | GO:0050882 | voluntary musculoskeletal movement(GO:0050882) |
| 0.1 | 1.6 | GO:0045332 | phospholipid translocation(GO:0045332) |
| 0.1 | 0.4 | GO:0006382 | adenosine to inosine editing(GO:0006382) |
| 0.1 | 0.3 | GO:2000405 | negative regulation of establishment of T cell polarity(GO:1903904) negative regulation of T cell migration(GO:2000405) negative regulation of Rho guanyl-nucleotide exchange factor activity(GO:2001107) |
| 0.0 | 0.3 | GO:0051563 | smooth endoplasmic reticulum calcium ion homeostasis(GO:0051563) |
| 0.0 | 0.0 | GO:0099558 | maintenance of synapse structure(GO:0099558) |
| 0.0 | 0.2 | GO:0042214 | carotene metabolic process(GO:0016119) terpene metabolic process(GO:0042214) |
| 0.0 | 0.1 | GO:0035638 | patched ligand maturation(GO:0007225) signal maturation(GO:0035638) |
| 0.0 | 0.6 | GO:0060088 | auditory receptor cell stereocilium organization(GO:0060088) |
| 0.0 | 0.1 | GO:0030505 | inorganic diphosphate transport(GO:0030505) |
| 0.0 | 0.0 | GO:0070100 | negative regulation of chemokine-mediated signaling pathway(GO:0070100) |
| 0.0 | 0.2 | GO:0006933 | negative regulation of cell adhesion involved in substrate-bound cell migration(GO:0006933) |
| 0.0 | 0.1 | GO:1900019 | regulation of protein kinase C activity(GO:1900019) positive regulation of protein kinase C activity(GO:1900020) |
| 0.0 | 0.1 | GO:0098937 | dendritic transport(GO:0098935) anterograde dendritic transport(GO:0098937) |
| 0.0 | 0.0 | GO:0016199 | axon midline choice point recognition(GO:0016199) |
| 0.0 | 0.4 | GO:0044375 | regulation of peroxisome size(GO:0044375) |
| 0.0 | 0.4 | GO:2000543 | positive regulation of gastrulation(GO:2000543) |
| 0.0 | 0.2 | GO:1990167 | protein K27-linked deubiquitination(GO:1990167) |
| 0.0 | 0.1 | GO:0010899 | regulation of phosphatidylcholine catabolic process(GO:0010899) |
| 0.0 | 1.1 | GO:0042730 | fibrinolysis(GO:0042730) |
| 0.0 | 0.2 | GO:0015692 | lead ion transport(GO:0015692) |
| 0.0 | 0.3 | GO:0038165 | oncostatin-M-mediated signaling pathway(GO:0038165) |
| 0.0 | 0.2 | GO:1903279 | regulation of calcium:sodium antiporter activity(GO:1903279) |
| 0.0 | 0.1 | GO:0009624 | response to nematode(GO:0009624) |
| 0.0 | 0.3 | GO:0035610 | protein side chain deglutamylation(GO:0035610) |
| 0.0 | 0.1 | GO:1903862 | positive regulation of oxidative phosphorylation(GO:1903862) |
| 0.0 | 0.0 | GO:1903433 | regulation of constitutive secretory pathway(GO:1903433) |
| 0.0 | 0.6 | GO:0071402 | cellular response to lipoprotein particle stimulus(GO:0071402) |
| 0.0 | 0.1 | GO:0042819 | pyridoxine metabolic process(GO:0008614) pyridoxine biosynthetic process(GO:0008615) vitamin B6 biosynthetic process(GO:0042819) |
| 0.0 | 0.2 | GO:0009822 | alkaloid catabolic process(GO:0009822) |
| 0.0 | 0.1 | GO:1990535 | neuron projection maintenance(GO:1990535) |
| 0.0 | 0.1 | GO:1903251 | multi-ciliated epithelial cell differentiation(GO:1903251) |
| 0.0 | 0.2 | GO:0010513 | positive regulation of phosphatidylinositol biosynthetic process(GO:0010513) |
| 0.0 | 0.2 | GO:1903936 | cellular response to sodium arsenite(GO:1903936) |
| 0.0 | 0.7 | GO:0034116 | positive regulation of heterotypic cell-cell adhesion(GO:0034116) |
| 0.0 | 0.3 | GO:0015822 | ornithine transport(GO:0015822) |
| 0.0 | 0.1 | GO:0090234 | regulation of kinetochore assembly(GO:0090234) |
| 0.0 | 0.0 | GO:0031443 | fast-twitch skeletal muscle fiber contraction(GO:0031443) |
| 0.0 | 0.2 | GO:0032489 | regulation of Cdc42 protein signal transduction(GO:0032489) |
| 0.0 | 0.1 | GO:1901053 | sarcosine metabolic process(GO:1901052) sarcosine catabolic process(GO:1901053) |
| 0.0 | 0.1 | GO:0006421 | asparaginyl-tRNA aminoacylation(GO:0006421) |
| 0.0 | 0.1 | GO:2000503 | positive regulation of natural killer cell chemotaxis(GO:2000503) |
| 0.0 | 0.4 | GO:0006054 | N-acetylneuraminate metabolic process(GO:0006054) |
| 0.0 | 0.3 | GO:0014807 | regulation of somitogenesis(GO:0014807) |
| 0.0 | 0.4 | GO:0043353 | enucleate erythrocyte differentiation(GO:0043353) |
| 0.0 | 0.5 | GO:0006044 | N-acetylglucosamine metabolic process(GO:0006044) |
| 0.0 | 0.3 | GO:0046061 | dATP catabolic process(GO:0046061) |
| 0.0 | 0.5 | GO:0010668 | ectodermal cell differentiation(GO:0010668) |
| 0.0 | 0.1 | GO:0045819 | positive regulation of glycogen catabolic process(GO:0045819) |
| 0.0 | 0.2 | GO:0007056 | spindle assembly involved in female meiosis(GO:0007056) |
| 0.0 | 0.0 | GO:0046874 | quinolinate metabolic process(GO:0046874) |
| 0.0 | 0.2 | GO:0060414 | aorta smooth muscle tissue morphogenesis(GO:0060414) |
| 0.0 | 0.1 | GO:0007518 | myoblast fate determination(GO:0007518) |
| 0.0 | 0.7 | GO:0007021 | tubulin complex assembly(GO:0007021) |
| 0.0 | 0.8 | GO:0034356 | NAD biosynthesis via nicotinamide riboside salvage pathway(GO:0034356) |
| 0.0 | 0.3 | GO:0034379 | very-low-density lipoprotein particle assembly(GO:0034379) |
| 0.0 | 0.4 | GO:0046604 | positive regulation of mitotic centrosome separation(GO:0046604) |
| 0.0 | 0.2 | GO:0035063 | nuclear speck organization(GO:0035063) |
| 0.0 | 0.0 | GO:0002439 | chronic inflammatory response to antigenic stimulus(GO:0002439) |
| 0.0 | 0.3 | GO:1990822 | basic amino acid transmembrane transport(GO:1990822) |
| 0.0 | 0.1 | GO:0071109 | superior temporal gyrus development(GO:0071109) |
| 0.0 | 0.2 | GO:0003025 | regulation of systemic arterial blood pressure by baroreceptor feedback(GO:0003025) |
| 0.0 | 0.2 | GO:1902869 | regulation of amacrine cell differentiation(GO:1902869) |
| 0.0 | 0.2 | GO:0042335 | cuticle development(GO:0042335) |
| 0.0 | 0.8 | GO:0030322 | stabilization of membrane potential(GO:0030322) |
| 0.0 | 0.2 | GO:0001915 | negative regulation of T cell mediated cytotoxicity(GO:0001915) |
| 0.0 | 0.0 | GO:0046601 | positive regulation of centriole replication(GO:0046601) |
| 0.0 | 0.0 | GO:0002584 | negative regulation of antigen processing and presentation of peptide antigen(GO:0002584) |
| 0.0 | 0.4 | GO:0006776 | vitamin A metabolic process(GO:0006776) |
| 0.0 | 0.2 | GO:0071673 | positive regulation of smooth muscle cell chemotaxis(GO:0071673) response to 1-oleoyl-sn-glycerol 3-phosphate(GO:1904565) cellular response to 1-oleoyl-sn-glycerol 3-phosphate(GO:1904566) |
| 0.0 | 0.1 | GO:0060059 | embryonic retina morphogenesis in camera-type eye(GO:0060059) |
| 0.0 | 0.2 | GO:0009786 | regulation of asymmetric cell division(GO:0009786) |
| 0.0 | 0.3 | GO:0030240 | skeletal muscle thin filament assembly(GO:0030240) |
| 0.0 | 0.2 | GO:0045065 | cytotoxic T cell differentiation(GO:0045065) |
| 0.0 | 0.1 | GO:0014050 | negative regulation of glutamate secretion(GO:0014050) |
| 0.0 | 0.1 | GO:0042640 | anagen(GO:0042640) |
| 0.0 | 0.1 | GO:0050915 | sensory perception of sour taste(GO:0050915) |
| 0.0 | 0.4 | GO:0016322 | neuron remodeling(GO:0016322) |
| 0.0 | 0.2 | GO:0006049 | UDP-N-acetylglucosamine catabolic process(GO:0006049) |
| 0.0 | 0.1 | GO:0006742 | NADP catabolic process(GO:0006742) pyridine nucleotide catabolic process(GO:0019364) |
| 0.0 | 0.2 | GO:0033387 | putrescine biosynthetic process from ornithine(GO:0033387) |
| 0.0 | 0.3 | GO:1900103 | positive regulation of endoplasmic reticulum unfolded protein response(GO:1900103) |
| 0.0 | 0.6 | GO:2000766 | negative regulation of cytoplasmic translation(GO:2000766) |
| 0.0 | 0.2 | GO:0006569 | tryptophan catabolic process(GO:0006569) indole-containing compound catabolic process(GO:0042436) indolalkylamine catabolic process(GO:0046218) |
| 0.0 | 0.2 | GO:0032972 | regulation of muscle filament sliding speed(GO:0032972) |
| 0.0 | 0.0 | GO:1900104 | hyaluranon cable assembly(GO:0036118) regulation of hyaluranon cable assembly(GO:1900104) positive regulation of hyaluranon cable assembly(GO:1900106) |
| 0.0 | 0.1 | GO:0005989 | lactose metabolic process(GO:0005988) lactose biosynthetic process(GO:0005989) |
| 0.0 | 0.0 | GO:1903935 | response to sodium arsenite(GO:1903935) |
| 0.0 | 0.2 | GO:0010836 | negative regulation of protein ADP-ribosylation(GO:0010836) |
| 0.0 | 0.1 | GO:1904579 | response to thapsigargin(GO:1904578) cellular response to thapsigargin(GO:1904579) response to hypobaric hypoxia(GO:1990910) |
| 0.0 | 0.0 | GO:1903301 | positive regulation of glucokinase activity(GO:0033133) positive regulation of hexokinase activity(GO:1903301) |
| 0.0 | 0.1 | GO:0042483 | negative regulation of odontogenesis(GO:0042483) |
| 0.0 | 0.5 | GO:2000480 | negative regulation of cAMP-dependent protein kinase activity(GO:2000480) |
| 0.0 | 0.2 | GO:0015820 | leucine transport(GO:0015820) |
| 0.0 | 0.1 | GO:0070427 | nucleotide-binding oligomerization domain containing 1 signaling pathway(GO:0070427) |
| 0.0 | 0.2 | GO:0061762 | CAMKK-AMPK signaling cascade(GO:0061762) |
| 0.0 | 0.1 | GO:0002416 | IgG immunoglobulin transcytosis in epithelial cells mediated by FcRn immunoglobulin receptor(GO:0002416) |
| 0.0 | 0.2 | GO:0090085 | regulation of protein deubiquitination(GO:0090085) |
| 0.0 | 6.5 | GO:0050911 | detection of chemical stimulus involved in sensory perception of smell(GO:0050911) |
| 0.0 | 0.1 | GO:0035262 | gonad morphogenesis(GO:0035262) |
| 0.0 | 0.3 | GO:0032472 | Golgi calcium ion transport(GO:0032472) |
| 0.0 | 0.2 | GO:0010269 | response to selenium ion(GO:0010269) |
| 0.0 | 0.1 | GO:0060332 | positive regulation of response to interferon-gamma(GO:0060332) positive regulation of interferon-gamma-mediated signaling pathway(GO:0060335) |
| 0.0 | 0.2 | GO:0019805 | quinolinate biosynthetic process(GO:0019805) |
| 0.0 | 0.5 | GO:0007250 | activation of NF-kappaB-inducing kinase activity(GO:0007250) |
| 0.0 | 0.2 | GO:0048245 | eosinophil chemotaxis(GO:0048245) |
| 0.0 | 0.2 | GO:2001034 | positive regulation of double-strand break repair via nonhomologous end joining(GO:2001034) |
| 0.0 | 0.1 | GO:1900042 | positive regulation of interleukin-2 secretion(GO:1900042) |
| 0.0 | 0.1 | GO:1900239 | phenotypic switching(GO:0036166) regulation of phenotypic switching(GO:1900239) |
| 0.0 | 0.1 | GO:0075509 | receptor-mediated endocytosis of virus by host cell(GO:0019065) endocytosis involved in viral entry into host cell(GO:0075509) |
| 0.0 | 0.1 | GO:2000276 | regulation of mitochondrial membrane permeability involved in programmed necrotic cell death(GO:1902445) negative regulation of oxidative phosphorylation uncoupler activity(GO:2000276) |
| 0.0 | 0.3 | GO:0007197 | adenylate cyclase-inhibiting G-protein coupled acetylcholine receptor signaling pathway(GO:0007197) |
| 0.0 | 0.2 | GO:0010814 | substance P catabolic process(GO:0010814) calcitonin catabolic process(GO:0010816) endothelin maturation(GO:0034959) |
| 0.0 | 0.2 | GO:0035726 | common myeloid progenitor cell proliferation(GO:0035726) |
| 0.0 | 0.4 | GO:0048251 | elastic fiber assembly(GO:0048251) |
| 0.0 | 0.1 | GO:0002408 | myeloid dendritic cell chemotaxis(GO:0002408) |
| 0.0 | 0.1 | GO:0060672 | epithelial cell differentiation involved in embryonic placenta development(GO:0060671) epithelial cell morphogenesis involved in placental branching(GO:0060672) |
| 0.0 | 0.1 | GO:0010966 | regulation of phosphate transport(GO:0010966) |
| 0.0 | 0.6 | GO:0003373 | dynamin polymerization involved in membrane fission(GO:0003373) dynamin polymerization involved in mitochondrial fission(GO:0003374) |
| 0.0 | 1.1 | GO:0089711 | L-glutamate transmembrane transport(GO:0089711) |
| 0.0 | 0.1 | GO:0071922 | establishment of sister chromatid cohesion(GO:0034085) cohesin loading(GO:0071921) regulation of cohesin loading(GO:0071922) |
| 0.0 | 0.7 | GO:0051923 | sulfation(GO:0051923) |
| 0.0 | 0.2 | GO:0038180 | nerve growth factor signaling pathway(GO:0038180) |
| 0.0 | 0.1 | GO:0032764 | negative regulation of mast cell cytokine production(GO:0032764) |
| 0.0 | 0.5 | GO:0090026 | positive regulation of monocyte chemotaxis(GO:0090026) |
| 0.0 | 0.1 | GO:0003245 | cardiac muscle tissue growth involved in heart morphogenesis(GO:0003245) |
| 0.0 | 0.1 | GO:0006579 | amino-acid betaine catabolic process(GO:0006579) |
| 0.0 | 0.2 | GO:0044334 | canonical Wnt signaling pathway involved in positive regulation of epithelial to mesenchymal transition(GO:0044334) |
| 0.0 | 0.2 | GO:0043380 | memory T cell differentiation(GO:0043379) regulation of memory T cell differentiation(GO:0043380) |
| 0.0 | 0.2 | GO:0031860 | telomeric 3' overhang formation(GO:0031860) |
| 0.0 | 0.2 | GO:0010890 | positive regulation of sequestering of triglyceride(GO:0010890) |
| 0.0 | 0.1 | GO:0098957 | anterograde axonal transport of mitochondrion(GO:0098957) |
| 0.0 | 0.1 | GO:1904693 | midbrain morphogenesis(GO:1904693) |
| 0.0 | 0.1 | GO:0044691 | tooth eruption(GO:0044691) |
| 0.0 | 0.2 | GO:1902847 | regulation of neuronal signal transduction(GO:1902847) positive regulation of neurofibrillary tangle assembly(GO:1902998) |
| 0.0 | 0.3 | GO:1990573 | potassium ion import across plasma membrane(GO:1990573) |
| 0.0 | 0.1 | GO:0050955 | thermoception(GO:0050955) |
| 0.0 | 0.1 | GO:0042322 | negative regulation of circadian sleep/wake cycle, REM sleep(GO:0042322) |
| 0.0 | 0.1 | GO:0000430 | regulation of transcription from RNA polymerase II promoter by glucose(GO:0000430) positive regulation of transcription from RNA polymerase II promoter by glucose(GO:0000432) |
| 0.0 | 0.1 | GO:0050712 | negative regulation of interleukin-1 alpha production(GO:0032690) negative regulation of interleukin-1 alpha secretion(GO:0050712) |
| 0.0 | 0.1 | GO:1903182 | regulation of SUMO transferase activity(GO:1903182) positive regulation of SUMO transferase activity(GO:1903755) |
| 0.0 | 0.4 | GO:0038003 | opioid receptor signaling pathway(GO:0038003) |
| 0.0 | 0.0 | GO:0002277 | myeloid dendritic cell activation involved in immune response(GO:0002277) |
| 0.0 | 0.3 | GO:0001957 | intramembranous ossification(GO:0001957) direct ossification(GO:0036072) |
| 0.0 | 0.1 | GO:1904479 | negative regulation of intestinal absorption(GO:1904479) |
| 0.0 | 0.2 | GO:0071802 | negative regulation of podosome assembly(GO:0071802) |
| 0.0 | 0.5 | GO:0031272 | regulation of pseudopodium assembly(GO:0031272) |
| 0.0 | 0.4 | GO:1904871 | regulation of protein localization to Cajal body(GO:1904869) positive regulation of protein localization to Cajal body(GO:1904871) |
| 0.0 | 0.2 | GO:0060648 | mammary gland bud morphogenesis(GO:0060648) |
| 0.0 | 0.1 | GO:0009597 | detection of virus(GO:0009597) |
| 0.0 | 0.2 | GO:0035616 | histone H2B conserved C-terminal lysine deubiquitination(GO:0035616) |
| 0.0 | 0.2 | GO:0036337 | Fas signaling pathway(GO:0036337) regulation of Fas signaling pathway(GO:1902044) |
| 0.0 | 0.2 | GO:0009149 | pyrimidine nucleoside triphosphate catabolic process(GO:0009149) pyrimidine deoxyribonucleoside triphosphate catabolic process(GO:0009213) |
| 0.0 | 0.3 | GO:0032464 | positive regulation of protein homooligomerization(GO:0032464) |
| 0.0 | 0.2 | GO:0097577 | intracellular sequestering of iron ion(GO:0006880) sequestering of iron ion(GO:0097577) |
| 0.0 | 0.2 | GO:0002158 | osteoclast proliferation(GO:0002158) |
| 0.0 | 0.2 | GO:0031120 | snRNA pseudouridine synthesis(GO:0031120) |
| 0.0 | 0.7 | GO:0042359 | vitamin D metabolic process(GO:0042359) |
| 0.0 | 0.1 | GO:1901421 | positive regulation of response to alcohol(GO:1901421) |
| 0.0 | 0.1 | GO:0099566 | regulation of postsynaptic cytosolic calcium ion concentration(GO:0099566) |
| 0.0 | 0.1 | GO:0038098 | sequestering of BMP from receptor via BMP binding(GO:0038098) |
| 0.0 | 0.3 | GO:0015886 | heme transport(GO:0015886) |
| 0.0 | 0.1 | GO:2000182 | regulation of progesterone biosynthetic process(GO:2000182) |
| 0.0 | 0.2 | GO:0071105 | response to interleukin-11(GO:0071105) |
| 0.0 | 0.0 | GO:2001027 | negative regulation of endothelial cell chemotaxis(GO:2001027) |
| 0.0 | 0.2 | GO:1904207 | regulation of chemokine (C-C motif) ligand 2 secretion(GO:1904207) positive regulation of chemokine (C-C motif) ligand 2 secretion(GO:1904209) |
| 0.0 | 0.1 | GO:2000563 | positive regulation of CD4-positive, alpha-beta T cell proliferation(GO:2000563) |
| 0.0 | 0.1 | GO:0061182 | negative regulation of chondrocyte development(GO:0061182) |
| 0.0 | 0.2 | GO:0086073 | bundle of His cell-Purkinje myocyte adhesion involved in cell communication(GO:0086073) |
| 0.0 | 0.1 | GO:0003192 | mitral valve formation(GO:0003192) |
| 0.0 | 0.3 | GO:0098914 | membrane repolarization during atrial cardiac muscle cell action potential(GO:0098914) |
| 0.0 | 0.1 | GO:0071073 | positive regulation of phospholipid biosynthetic process(GO:0071073) |
| 0.0 | 0.2 | GO:0045743 | positive regulation of fibroblast growth factor receptor signaling pathway(GO:0045743) |
| 0.0 | 0.0 | GO:0014063 | negative regulation of serotonin secretion(GO:0014063) |
| 0.0 | 0.2 | GO:2000232 | regulation of rRNA processing(GO:2000232) |
| 0.0 | 0.2 | GO:1901098 | positive regulation of autophagosome maturation(GO:1901098) |
| 0.0 | 0.1 | GO:0045636 | positive regulation of melanocyte differentiation(GO:0045636) |
| 0.0 | 0.1 | GO:0070966 | nuclear-transcribed mRNA catabolic process, no-go decay(GO:0070966) |
| 0.0 | 0.1 | GO:0030644 | cellular chloride ion homeostasis(GO:0030644) |
| 0.0 | 0.1 | GO:0002322 | B cell proliferation involved in immune response(GO:0002322) |
| 0.0 | 0.0 | GO:0051660 | establishment of centrosome localization(GO:0051660) |
| 0.0 | 0.0 | GO:0010536 | positive regulation of activation of Janus kinase activity(GO:0010536) |
| 0.0 | 0.1 | GO:0034729 | histone H3-K79 methylation(GO:0034729) |
| 0.0 | 0.3 | GO:0035791 | platelet-derived growth factor receptor-beta signaling pathway(GO:0035791) |
| 0.0 | 0.1 | GO:0016480 | negative regulation of transcription from RNA polymerase III promoter(GO:0016480) |
| 0.0 | 0.1 | GO:0038043 | interleukin-5-mediated signaling pathway(GO:0038043) |
| 0.0 | 0.3 | GO:1900038 | negative regulation of cellular response to hypoxia(GO:1900038) |
| 0.0 | 0.3 | GO:0032287 | peripheral nervous system myelin maintenance(GO:0032287) |
| 0.0 | 0.5 | GO:0007196 | adenylate cyclase-inhibiting G-protein coupled glutamate receptor signaling pathway(GO:0007196) |
| 0.0 | 0.2 | GO:2000324 | positive regulation of glucocorticoid receptor signaling pathway(GO:2000324) |
| 0.0 | 0.3 | GO:0070234 | positive regulation of T cell apoptotic process(GO:0070234) |
| 0.0 | 0.1 | GO:0001865 | NK T cell differentiation(GO:0001865) |
| 0.0 | 0.1 | GO:0060267 | positive regulation of respiratory burst(GO:0060267) |
| 0.0 | 0.1 | GO:0035881 | amacrine cell differentiation(GO:0035881) |
| 0.0 | 0.2 | GO:0031022 | nuclear migration along microfilament(GO:0031022) |
| 0.0 | 0.1 | GO:0042732 | D-xylose metabolic process(GO:0042732) |
| 0.0 | 0.2 | GO:0021798 | forebrain dorsal/ventral pattern formation(GO:0021798) |
| 0.0 | 0.3 | GO:0035694 | mitochondrial protein catabolic process(GO:0035694) |
| 0.0 | 0.1 | GO:0018395 | peptidyl-lysine hydroxylation to 5-hydroxy-L-lysine(GO:0018395) histone arginine demethylation(GO:0070077) histone H3-R2 demethylation(GO:0070078) histone H4-R3 demethylation(GO:0070079) |
| 0.0 | 0.5 | GO:0006705 | mineralocorticoid biosynthetic process(GO:0006705) mineralocorticoid metabolic process(GO:0008212) |
| 0.0 | 0.1 | GO:0046338 | phosphatidylethanolamine catabolic process(GO:0046338) |
| 0.0 | 0.1 | GO:0060715 | syncytiotrophoblast cell differentiation involved in labyrinthine layer development(GO:0060715) |
| 0.0 | 0.2 | GO:0016926 | protein desumoylation(GO:0016926) |
| 0.0 | 0.1 | GO:1904717 | excitatory chemical synaptic transmission(GO:0098976) regulation of AMPA glutamate receptor clustering(GO:1904717) positive regulation of AMPA glutamate receptor clustering(GO:1904719) |
| 0.0 | 0.1 | GO:2000969 | positive regulation of alpha-amino-3-hydroxy-5-methyl-4-isoxazole propionate selective glutamate receptor activity(GO:2000969) |
| 0.0 | 0.2 | GO:0045876 | positive regulation of sister chromatid cohesion(GO:0045876) |
| 0.0 | 0.4 | GO:1903069 | regulation of ER-associated ubiquitin-dependent protein catabolic process(GO:1903069) |
| 0.0 | 0.1 | GO:0045357 | interferon-beta biosynthetic process(GO:0045350) regulation of interferon-beta biosynthetic process(GO:0045357) positive regulation of interferon-beta biosynthetic process(GO:0045359) |
| 0.0 | 0.1 | GO:0006522 | alanine metabolic process(GO:0006522) alanine catabolic process(GO:0006524) pyruvate family amino acid metabolic process(GO:0009078) pyruvate family amino acid catabolic process(GO:0009080) |
| 0.0 | 0.1 | GO:2000616 | negative regulation of histone H3-K9 acetylation(GO:2000616) |
| 0.0 | 0.6 | GO:0019373 | epoxygenase P450 pathway(GO:0019373) |
| 0.0 | 0.1 | GO:0007174 | epidermal growth factor catabolic process(GO:0007174) |
| 0.0 | 0.3 | GO:0043031 | negative regulation of macrophage activation(GO:0043031) |
| 0.0 | 0.1 | GO:0031291 | Ran protein signal transduction(GO:0031291) |
| 0.0 | 0.1 | GO:0071283 | regulation of chromosome condensation(GO:0060623) cellular response to iron(III) ion(GO:0071283) |
| 0.0 | 0.1 | GO:1902866 | regulation of retina development in camera-type eye(GO:1902866) |
| 0.0 | 0.3 | GO:0070170 | regulation of tooth mineralization(GO:0070170) |
| 0.0 | 0.6 | GO:0031581 | hemidesmosome assembly(GO:0031581) |
| 0.0 | 0.3 | GO:0006828 | manganese ion transport(GO:0006828) |
| 0.0 | 0.1 | GO:0061304 | retinal blood vessel morphogenesis(GO:0061304) |
| 0.0 | 0.0 | GO:0045763 | negative regulation of cellular amino acid metabolic process(GO:0045763) |
| 0.0 | 0.1 | GO:1901675 | negative regulation of histone H3-K27 acetylation(GO:1901675) |
| 0.0 | 0.5 | GO:0006020 | inositol metabolic process(GO:0006020) |
| 0.0 | 0.9 | GO:0043968 | histone H2A acetylation(GO:0043968) |
| 0.0 | 0.5 | GO:0003322 | pancreatic A cell development(GO:0003322) |
| 0.0 | 0.1 | GO:0030035 | microspike assembly(GO:0030035) |
| 0.0 | 0.2 | GO:0060012 | synaptic transmission, glycinergic(GO:0060012) |
| 0.0 | 0.1 | GO:0070352 | positive regulation of white fat cell proliferation(GO:0070352) |
| 0.0 | 0.1 | GO:0051464 | positive regulation of cortisol secretion(GO:0051464) |
| 0.0 | 0.1 | GO:0072513 | positive regulation of secondary heart field cardioblast proliferation(GO:0072513) |
| 0.0 | 0.2 | GO:0055129 | L-proline biosynthetic process(GO:0055129) |
| 0.0 | 0.2 | GO:0030951 | establishment or maintenance of microtubule cytoskeleton polarity(GO:0030951) |
| 0.0 | 0.3 | GO:0086024 | adrenergic receptor signaling pathway involved in positive regulation of heart rate(GO:0086024) |
| 0.0 | 0.1 | GO:1990418 | response to insulin-like growth factor stimulus(GO:1990418) |
| 0.0 | 0.1 | GO:0043128 | regulation of 1-phosphatidylinositol 4-kinase activity(GO:0043126) positive regulation of 1-phosphatidylinositol 4-kinase activity(GO:0043128) |
| 0.0 | 0.1 | GO:0016198 | axon choice point recognition(GO:0016198) |
| 0.0 | 0.1 | GO:1904582 | regulation of intracellular mRNA localization(GO:1904580) positive regulation of intracellular mRNA localization(GO:1904582) |
| 0.0 | 0.1 | GO:0021758 | caudate nucleus development(GO:0021757) putamen development(GO:0021758) |
| 0.0 | 0.1 | GO:0042487 | regulation of odontogenesis of dentin-containing tooth(GO:0042487) |
| 0.0 | 0.0 | GO:0003162 | atrioventricular node development(GO:0003162) |
| 0.0 | 2.2 | GO:0006521 | regulation of cellular amino acid metabolic process(GO:0006521) |
| 0.0 | 0.1 | GO:0097156 | fasciculation of motor neuron axon(GO:0097156) |
| 0.0 | 0.2 | GO:0010724 | regulation of definitive erythrocyte differentiation(GO:0010724) |
| 0.0 | 0.3 | GO:0018401 | peptidyl-proline hydroxylation to 4-hydroxy-L-proline(GO:0018401) |
| 0.0 | 0.3 | GO:0032926 | negative regulation of activin receptor signaling pathway(GO:0032926) |
| 0.0 | 0.2 | GO:0045078 | positive regulation of interferon-gamma biosynthetic process(GO:0045078) |
| 0.0 | 0.1 | GO:0045626 | negative regulation of T-helper 1 cell differentiation(GO:0045626) |
| 0.0 | 0.1 | GO:0090261 | positive regulation of inclusion body assembly(GO:0090261) |
| 0.0 | 0.3 | GO:0097688 | AMPA glutamate receptor clustering(GO:0097113) glutamate receptor clustering(GO:0097688) |
| 0.0 | 0.1 | GO:0030423 | targeting of mRNA for destruction involved in RNA interference(GO:0030423) |
| 0.0 | 0.1 | GO:0050902 | leukocyte adhesive activation(GO:0050902) |
| 0.0 | 0.2 | GO:0033504 | floor plate development(GO:0033504) |
| 0.0 | 0.2 | GO:0033313 | meiotic cell cycle checkpoint(GO:0033313) |
| 0.0 | 0.2 | GO:0002934 | desmosome organization(GO:0002934) |
| 0.0 | 0.1 | GO:0010820 | positive regulation of T cell chemotaxis(GO:0010820) |
| 0.0 | 0.1 | GO:0006015 | 5-phosphoribose 1-diphosphate biosynthetic process(GO:0006015) 5-phosphoribose 1-diphosphate metabolic process(GO:0046391) |
| 0.0 | 0.1 | GO:1903588 | negative regulation of blood vessel endothelial cell proliferation involved in sprouting angiogenesis(GO:1903588) |
| 0.0 | 0.1 | GO:0010650 | positive regulation of cell communication by electrical coupling(GO:0010650) |
| 0.0 | 0.1 | GO:0035803 | egg coat formation(GO:0035803) |
| 0.0 | 0.1 | GO:0072233 | thick ascending limb development(GO:0072023) metanephric thick ascending limb development(GO:0072233) |
| 0.0 | 0.1 | GO:0003050 | regulation of systemic arterial blood pressure by atrial natriuretic peptide(GO:0003050) |
| 0.0 | 0.1 | GO:0033364 | mast cell secretory granule organization(GO:0033364) |
| 0.0 | 0.4 | GO:1900029 | positive regulation of ruffle assembly(GO:1900029) |
| 0.0 | 0.1 | GO:0021764 | amygdala development(GO:0021764) |
| 0.0 | 0.2 | GO:0048672 | positive regulation of collateral sprouting(GO:0048672) |
| 0.0 | 0.3 | GO:0060453 | regulation of gastric acid secretion(GO:0060453) |
| 0.0 | 0.1 | GO:1903774 | positive regulation of viral budding via host ESCRT complex(GO:1903774) |
| 0.0 | 0.2 | GO:0022605 | oogenesis stage(GO:0022605) |
| 0.0 | 0.1 | GO:0002760 | positive regulation of antimicrobial peptide production(GO:0002225) positive regulation of antimicrobial humoral response(GO:0002760) regulation of antimicrobial peptide production(GO:0002784) regulation of antibacterial peptide production(GO:0002786) positive regulation of antibacterial peptide production(GO:0002803) |
| 0.0 | 0.1 | GO:0061484 | hematopoietic stem cell homeostasis(GO:0061484) |
| 0.0 | 0.1 | GO:0044146 | negative regulation of growth of symbiont involved in interaction with host(GO:0044146) |
| 0.0 | 0.0 | GO:0001834 | trophectodermal cell proliferation(GO:0001834) |
| 0.0 | 0.2 | GO:0015705 | iodide transport(GO:0015705) |
| 0.0 | 0.1 | GO:0034334 | adherens junction maintenance(GO:0034334) |
| 0.0 | 0.3 | GO:0071803 | positive regulation of podosome assembly(GO:0071803) |
| 0.0 | 0.1 | GO:0002483 | antigen processing and presentation of endogenous peptide antigen(GO:0002483) |
| 0.0 | 0.0 | GO:1904000 | positive regulation of eating behavior(GO:1904000) regulation of small intestine smooth muscle contraction(GO:1904347) positive regulation of small intestine smooth muscle contraction(GO:1904349) small intestine smooth muscle contraction(GO:1990770) |
| 0.0 | 0.0 | GO:1904383 | response to sodium phosphate(GO:1904383) |
| 0.0 | 0.1 | GO:0050653 | chondroitin sulfate proteoglycan biosynthetic process, polysaccharide chain biosynthetic process(GO:0050653) |
| 0.0 | 0.1 | GO:1903718 | carbamoyl phosphate metabolic process(GO:0070408) carbamoyl phosphate biosynthetic process(GO:0070409) response to ammonia(GO:1903717) cellular response to ammonia(GO:1903718) |
| 0.0 | 0.5 | GO:0021681 | cerebellar granular layer development(GO:0021681) |
| 0.0 | 0.1 | GO:0010587 | miRNA catabolic process(GO:0010587) |
| 0.0 | 0.1 | GO:0008295 | spermidine biosynthetic process(GO:0008295) |
| 0.0 | 0.2 | GO:0051967 | negative regulation of synaptic transmission, glutamatergic(GO:0051967) |
| 0.0 | 0.1 | GO:0015942 | formate metabolic process(GO:0015942) |
| 0.0 | 0.0 | GO:0097676 | histone H3-K36 dimethylation(GO:0097676) |
| 0.0 | 0.2 | GO:0015816 | glycine transport(GO:0015816) |
| 0.0 | 0.3 | GO:1904706 | negative regulation of vascular smooth muscle cell proliferation(GO:1904706) |
| 0.0 | 0.1 | GO:0070574 | cadmium ion transport(GO:0015691) cadmium ion transmembrane transport(GO:0070574) |
| 0.0 | 0.1 | GO:0001544 | initiation of primordial ovarian follicle growth(GO:0001544) |
| 0.0 | 0.2 | GO:0051386 | regulation of neurotrophin TRK receptor signaling pathway(GO:0051386) |
| 0.0 | 0.0 | GO:0003344 | pericardium morphogenesis(GO:0003344) |
| 0.0 | 0.2 | GO:0051725 | protein de-ADP-ribosylation(GO:0051725) |
| 0.0 | 0.1 | GO:0034627 | nicotinamide nucleotide biosynthetic process from aspartate(GO:0019355) 'de novo' NAD biosynthetic process(GO:0034627) 'de novo' NAD biosynthetic process from aspartate(GO:0034628) |
| 0.0 | 0.1 | GO:0010835 | regulation of protein ADP-ribosylation(GO:0010835) |
| 0.0 | 0.0 | GO:0002679 | respiratory burst involved in defense response(GO:0002679) |
| 0.0 | 0.0 | GO:0035546 | interferon-beta secretion(GO:0035546) regulation of interferon-beta secretion(GO:0035547) |
| 0.0 | 0.8 | GO:0033198 | response to ATP(GO:0033198) |
| 0.0 | 0.5 | GO:0090022 | regulation of neutrophil chemotaxis(GO:0090022) |
| 0.0 | 0.2 | GO:0000012 | single strand break repair(GO:0000012) |
| 0.0 | 0.2 | GO:0035641 | locomotory exploration behavior(GO:0035641) |
| 0.0 | 0.7 | GO:0032011 | ARF protein signal transduction(GO:0032011) |
| 0.0 | 0.1 | GO:1990918 | double-strand break repair involved in meiotic recombination(GO:1990918) |
| 0.0 | 0.2 | GO:2000741 | positive regulation of mesenchymal stem cell differentiation(GO:2000741) |
| 0.0 | 0.4 | GO:0051764 | actin crosslink formation(GO:0051764) |
| 0.0 | 0.1 | GO:0072180 | mesonephric duct morphogenesis(GO:0072180) |
| 0.0 | 0.1 | GO:1903659 | regulation of complement-dependent cytotoxicity(GO:1903659) |
| 0.0 | 0.0 | GO:2000382 | positive regulation of mesoderm development(GO:2000382) |
| 0.0 | 0.1 | GO:0048194 | Golgi vesicle budding(GO:0048194) |
| 0.0 | 0.1 | GO:0048262 | determination of dorsal/ventral asymmetry(GO:0048262) |
| 0.0 | 0.2 | GO:1902031 | regulation of NADP metabolic process(GO:1902031) |
| 0.0 | 0.1 | GO:1900086 | regulation of peptidyl-tyrosine autophosphorylation(GO:1900084) positive regulation of peptidyl-tyrosine autophosphorylation(GO:1900086) |
| 0.0 | 0.3 | GO:0045793 | positive regulation of cell size(GO:0045793) |
| 0.0 | 0.1 | GO:0006704 | glucocorticoid biosynthetic process(GO:0006704) |
| 0.0 | 0.0 | GO:0007442 | hindgut morphogenesis(GO:0007442) embryonic hindgut morphogenesis(GO:0048619) |
| 0.0 | 0.2 | GO:0038166 | angiotensin-activated signaling pathway(GO:0038166) |
| 0.0 | 0.2 | GO:0051639 | actin filament network formation(GO:0051639) |
| 0.0 | 0.4 | GO:0035455 | response to interferon-alpha(GO:0035455) |
| 0.0 | 0.2 | GO:0035521 | monoubiquitinated histone deubiquitination(GO:0035521) monoubiquitinated histone H2A deubiquitination(GO:0035522) |
| 0.0 | 0.2 | GO:0070922 | small RNA loading onto RISC(GO:0070922) |
| 0.0 | 0.1 | GO:0060313 | negative regulation of blood vessel remodeling(GO:0060313) |
| 0.0 | 0.0 | GO:0034146 | toll-like receptor 5 signaling pathway(GO:0034146) |
| 0.0 | 0.1 | GO:1904692 | positive regulation of type B pancreatic cell proliferation(GO:1904692) |
| 0.0 | 0.0 | GO:0000479 | endonucleolytic cleavage of tricistronic rRNA transcript (SSU-rRNA, 5.8S rRNA, LSU-rRNA)(GO:0000479) |
| 0.0 | 1.0 | GO:0007029 | endoplasmic reticulum organization(GO:0007029) |
| 0.0 | 0.1 | GO:0009236 | cobalamin biosynthetic process(GO:0009236) |
| 0.0 | 0.2 | GO:0032020 | ISG15-protein conjugation(GO:0032020) |
| 0.0 | 0.1 | GO:0018199 | peptidyl-glutamine modification(GO:0018199) |
| 0.0 | 0.2 | GO:0031584 | activation of phospholipase D activity(GO:0031584) |
| 0.0 | 1.3 | GO:0015701 | bicarbonate transport(GO:0015701) |
| 0.0 | 0.1 | GO:0019883 | antigen processing and presentation of endogenous antigen(GO:0019883) |
| 0.0 | 0.2 | GO:0000052 | citrulline metabolic process(GO:0000052) |
| 0.0 | 0.1 | GO:0051280 | negative regulation of release of sequestered calcium ion into cytosol(GO:0051280) positive regulation of sequestering of calcium ion(GO:0051284) negative regulation of ryanodine-sensitive calcium-release channel activity(GO:0060315) |
| 0.0 | 0.2 | GO:0046549 | retinal cone cell differentiation(GO:0042670) retinal cone cell development(GO:0046549) |
| 0.0 | 0.1 | GO:0018343 | protein farnesylation(GO:0018343) |
| 0.0 | 0.0 | GO:0021553 | olfactory nerve development(GO:0021553) |
| 0.0 | 0.1 | GO:0000393 | spliceosomal conformational changes to generate catalytic conformation(GO:0000393) |
| 0.0 | 0.4 | GO:0072678 | T cell migration(GO:0072678) |
| 0.0 | 0.4 | GO:1901748 | leukotriene D4 metabolic process(GO:1901748) leukotriene D4 biosynthetic process(GO:1901750) |
| 0.0 | 0.1 | GO:0055089 | fatty acid homeostasis(GO:0055089) |
| 0.0 | 0.1 | GO:0001831 | trophectodermal cellular morphogenesis(GO:0001831) |
| 0.0 | 0.1 | GO:0035405 | histone-threonine phosphorylation(GO:0035405) |
| 0.0 | 0.2 | GO:0016560 | protein import into peroxisome matrix, docking(GO:0016560) |
| 0.0 | 0.1 | GO:0006216 | cytidine catabolic process(GO:0006216) cytidine deamination(GO:0009972) cytidine metabolic process(GO:0046087) |
| 0.0 | 0.1 | GO:0035502 | metanephric part of ureteric bud development(GO:0035502) |
| 0.0 | 0.3 | GO:0010839 | negative regulation of keratinocyte proliferation(GO:0010839) |
| 0.0 | 0.3 | GO:0010613 | positive regulation of cardiac muscle hypertrophy(GO:0010613) positive regulation of muscle hypertrophy(GO:0014742) |
| 0.0 | 0.3 | GO:0032620 | interleukin-17 production(GO:0032620) |
| 0.0 | 0.0 | GO:0000469 | cleavage involved in rRNA processing(GO:0000469) |
| 0.0 | 0.1 | GO:0048239 | negative regulation of DNA recombination at telomere(GO:0048239) regulation of DNA recombination at telomere(GO:0072695) |
| 0.0 | 0.2 | GO:0048387 | negative regulation of retinoic acid receptor signaling pathway(GO:0048387) |
| 0.0 | 0.2 | GO:0060670 | branching involved in labyrinthine layer morphogenesis(GO:0060670) |
| 0.0 | 0.2 | GO:0050951 | sensory perception of temperature stimulus(GO:0050951) |
| 0.0 | 0.1 | GO:0035279 | mRNA cleavage involved in gene silencing by miRNA(GO:0035279) mRNA cleavage involved in gene silencing(GO:0098795) |
| 0.0 | 0.2 | GO:0051988 | regulation of attachment of spindle microtubules to kinetochore(GO:0051988) |
| 0.0 | 0.1 | GO:1903715 | regulation of aerobic respiration(GO:1903715) |
| 0.0 | 0.1 | GO:1903203 | regulation of oxidative stress-induced neuron death(GO:1903203) |
| 0.0 | 0.5 | GO:0042347 | negative regulation of NF-kappaB import into nucleus(GO:0042347) |
| 0.0 | 0.0 | GO:1901252 | regulation of intracellular transport of viral material(GO:1901252) negative regulation of intracellular transport of viral material(GO:1901253) |
| 0.0 | 0.2 | GO:0061732 | mitochondrial acetyl-CoA biosynthetic process from pyruvate(GO:0061732) |
| 0.0 | 0.0 | GO:0090526 | regulation of gluconeogenesis involved in cellular glucose homeostasis(GO:0090526) |
| 0.0 | 0.2 | GO:0043562 | cellular response to nitrogen starvation(GO:0006995) cellular response to nitrogen levels(GO:0043562) |
| 0.0 | 0.1 | GO:0045919 | positive regulation of cytolysis(GO:0045919) |
| 0.0 | 0.0 | GO:0042998 | positive regulation of Golgi to plasma membrane protein transport(GO:0042998) |
| 0.0 | 0.0 | GO:1902093 | positive regulation of sperm motility(GO:1902093) |
| 0.0 | 0.2 | GO:0071578 | zinc II ion transmembrane import(GO:0071578) |
| 0.0 | 0.1 | GO:0035526 | retrograde transport, plasma membrane to Golgi(GO:0035526) |
| 0.0 | 0.1 | GO:0090362 | positive regulation of platelet-derived growth factor production(GO:0090362) |
| 0.0 | 0.1 | GO:0031125 | rRNA 3'-end processing(GO:0031125) |
| 0.0 | 0.6 | GO:0018146 | keratan sulfate biosynthetic process(GO:0018146) |
| 0.0 | 0.1 | GO:0003433 | chondrocyte development involved in endochondral bone morphogenesis(GO:0003433) |
| 0.0 | 0.1 | GO:0043922 | negative regulation by host of viral transcription(GO:0043922) |
| 0.0 | 0.1 | GO:1901096 | regulation of autophagosome maturation(GO:1901096) |
| 0.0 | 0.1 | GO:2000825 | positive regulation of androgen receptor activity(GO:2000825) |
| 0.0 | 1.3 | GO:0000381 | regulation of alternative mRNA splicing, via spliceosome(GO:0000381) |
| 0.0 | 0.3 | GO:0034501 | protein localization to kinetochore(GO:0034501) |
| 0.0 | 0.0 | GO:0002371 | dendritic cell cytokine production(GO:0002371) |
| 0.0 | 0.0 | GO:0048755 | branching morphogenesis of a nerve(GO:0048755) |
| 0.0 | 0.1 | GO:0000957 | mitochondrial RNA catabolic process(GO:0000957) regulation of mitochondrial RNA catabolic process(GO:0000960) |
| 0.0 | 0.3 | GO:0008090 | retrograde axonal transport(GO:0008090) |
| 0.0 | 0.3 | GO:0034389 | lipid particle organization(GO:0034389) |
| 0.0 | 0.1 | GO:1900383 | regulation of synaptic plasticity by receptor localization to synapse(GO:1900383) |
| 0.0 | 0.1 | GO:0010815 | bradykinin catabolic process(GO:0010815) |
| 0.0 | 0.3 | GO:0021819 | layer formation in cerebral cortex(GO:0021819) |
| 0.0 | 0.2 | GO:0071474 | cellular hyperosmotic response(GO:0071474) |
| 0.0 | 0.3 | GO:0090200 | positive regulation of release of cytochrome c from mitochondria(GO:0090200) |
| 0.0 | 0.2 | GO:0014883 | transition between fast and slow fiber(GO:0014883) |
| 0.0 | 0.1 | GO:0003383 | apical constriction(GO:0003383) |
| 0.0 | 0.1 | GO:2000297 | negative regulation of synapse maturation(GO:2000297) |
| 0.0 | 0.1 | GO:1904628 | response to phorbol 13-acetate 12-myristate(GO:1904627) cellular response to phorbol 13-acetate 12-myristate(GO:1904628) |
| 0.0 | 0.0 | GO:0006532 | aspartate biosynthetic process(GO:0006532) |
| 0.0 | 0.3 | GO:0001836 | release of cytochrome c from mitochondria(GO:0001836) |
| 0.0 | 0.0 | GO:0002125 | maternal aggressive behavior(GO:0002125) positive regulation of cellular pH reduction(GO:0032849) |
| 0.0 | 0.1 | GO:0031133 | regulation of axon diameter(GO:0031133) |
| 0.0 | 0.1 | GO:0006432 | phenylalanyl-tRNA aminoacylation(GO:0006432) |
| 0.0 | 0.3 | GO:0048730 | epidermis morphogenesis(GO:0048730) |
| 0.0 | 0.1 | GO:0007621 | negative regulation of female receptivity(GO:0007621) |
| 0.0 | 0.1 | GO:0035754 | B cell chemotaxis(GO:0035754) |
| 0.0 | 0.1 | GO:0060770 | negative regulation of epithelial cell proliferation involved in prostate gland development(GO:0060770) |
| 0.0 | 0.0 | GO:0002554 | serotonin production involved in inflammatory response(GO:0002351) serotonin secretion involved in inflammatory response(GO:0002442) serotonin secretion by platelet(GO:0002554) |
| 0.0 | 0.4 | GO:0006544 | glycine metabolic process(GO:0006544) |
| 0.0 | 0.0 | GO:0045348 | positive regulation of MHC class II biosynthetic process(GO:0045348) |
| 0.0 | 0.1 | GO:0001920 | negative regulation of receptor recycling(GO:0001920) |
| 0.0 | 0.1 | GO:0018094 | protein polyglycylation(GO:0018094) |
| 0.0 | 0.1 | GO:0048691 | modulation by virus of host transcription(GO:0019056) positive regulation of sprouting of injured axon(GO:0048687) positive regulation of axon extension involved in regeneration(GO:0048691) modulation by symbiont of host transcription(GO:0052026) |
| 0.0 | 0.1 | GO:1902525 | regulation of protein monoubiquitination(GO:1902525) |
| 0.0 | 0.4 | GO:0032211 | negative regulation of telomere maintenance via telomerase(GO:0032211) |
| 0.0 | 0.1 | GO:0043619 | regulation of transcription from RNA polymerase II promoter in response to oxidative stress(GO:0043619) |
| 0.0 | 0.1 | GO:0046833 | positive regulation of RNA export from nucleus(GO:0046833) |
| 0.0 | 0.0 | GO:1902913 | positive regulation of neuroepithelial cell differentiation(GO:1902913) |
| 0.0 | 0.1 | GO:1902410 | mitotic cytokinetic process(GO:1902410) |
| 0.0 | 0.1 | GO:0098908 | regulation of neuronal action potential(GO:0098908) |
| 0.0 | 0.3 | GO:0035898 | parathyroid hormone secretion(GO:0035898) |
| 0.0 | 0.1 | GO:0071313 | cellular response to caffeine(GO:0071313) |
| 0.0 | 0.0 | GO:0002025 | vasodilation by norepinephrine-epinephrine involved in regulation of systemic arterial blood pressure(GO:0002025) |
| 0.0 | 0.1 | GO:0032025 | response to cobalt ion(GO:0032025) |
| 0.0 | 0.1 | GO:0060029 | convergent extension involved in organogenesis(GO:0060029) |
| 0.0 | 0.1 | GO:0061709 | reticulophagy(GO:0061709) |
| 0.0 | 0.0 | GO:0006014 | D-ribose metabolic process(GO:0006014) |
| 0.0 | 0.1 | GO:0007161 | calcium-independent cell-matrix adhesion(GO:0007161) |
| 0.0 | 0.1 | GO:0097211 | response to gonadotropin-releasing hormone(GO:0097210) cellular response to gonadotropin-releasing hormone(GO:0097211) |
| 0.0 | 0.4 | GO:0070262 | peptidyl-serine dephosphorylation(GO:0070262) |
| 0.0 | 0.0 | GO:0010193 | response to ozone(GO:0010193) |
| 0.0 | 0.1 | GO:0042866 | pyruvate biosynthetic process(GO:0042866) |
| 0.0 | 0.1 | GO:0097052 | L-kynurenine metabolic process(GO:0097052) |
| 0.0 | 0.0 | GO:0043653 | mitochondrial fragmentation involved in apoptotic process(GO:0043653) |
| 0.0 | 1.6 | GO:0051965 | positive regulation of synapse assembly(GO:0051965) |
| 0.0 | 0.1 | GO:0009305 | protein biotinylation(GO:0009305) response to biotin(GO:0070781) histone biotinylation(GO:0071110) |
| 0.0 | 0.1 | GO:0046640 | regulation of alpha-beta T cell proliferation(GO:0046640) positive regulation of alpha-beta T cell proliferation(GO:0046641) |
| 0.0 | 0.3 | GO:0032292 | myelination in peripheral nervous system(GO:0022011) peripheral nervous system axon ensheathment(GO:0032292) |
| 0.0 | 0.1 | GO:0006542 | glutamine biosynthetic process(GO:0006542) |
| 0.0 | 0.3 | GO:0010592 | positive regulation of lamellipodium assembly(GO:0010592) |
| 0.0 | 0.3 | GO:0048935 | peripheral nervous system neuron differentiation(GO:0048934) peripheral nervous system neuron development(GO:0048935) |
| 0.0 | 0.1 | GO:0098532 | histone H3-K27 trimethylation(GO:0098532) |
| 0.0 | 0.1 | GO:0018231 | peptidyl-L-cysteine S-palmitoylation(GO:0018230) peptidyl-S-diacylglycerol-L-cysteine biosynthetic process from peptidyl-cysteine(GO:0018231) |
| 0.0 | 0.6 | GO:0000188 | inactivation of MAPK activity(GO:0000188) |
| 0.0 | 0.1 | GO:0048105 | establishment of body hair or bristle planar orientation(GO:0048104) establishment of body hair planar orientation(GO:0048105) |
| 0.0 | 0.1 | GO:0042348 | regulation of NF-kappaB import into nucleus(GO:0042345) NF-kappaB import into nucleus(GO:0042348) |
| 0.0 | 0.1 | GO:0038018 | Wnt receptor catabolic process(GO:0038018) |
| 0.0 | 0.0 | GO:0072429 | response to intra-S DNA damage checkpoint signaling(GO:0072429) |
| 0.0 | 0.3 | GO:0042104 | positive regulation of activated T cell proliferation(GO:0042104) |
| 0.0 | 0.4 | GO:0042438 | melanin biosynthetic process(GO:0042438) |
| 0.0 | 0.2 | GO:0099639 | endosome to plasma membrane protein transport(GO:0099638) neurotransmitter receptor transport, endosome to plasma membrane(GO:0099639) |
| 0.0 | 0.1 | GO:1902412 | regulation of mitotic cytokinesis(GO:1902412) |
| 0.0 | 0.0 | GO:0035771 | interleukin-4-mediated signaling pathway(GO:0035771) |
| 0.0 | 0.0 | GO:0060463 | lung lobe development(GO:0060462) lung lobe morphogenesis(GO:0060463) |
| 0.0 | 0.0 | GO:0044335 | canonical Wnt signaling pathway involved in neural crest cell differentiation(GO:0044335) |
| 0.0 | 0.2 | GO:0003334 | keratinocyte development(GO:0003334) |
| 0.0 | 0.0 | GO:0046633 | alpha-beta T cell proliferation(GO:0046633) |
| 0.0 | 0.0 | GO:0046968 | peptide antigen transport(GO:0046968) |
| 0.0 | 0.2 | GO:0060712 | spongiotrophoblast layer development(GO:0060712) |
| 0.0 | 0.1 | GO:0018342 | protein prenylation(GO:0018342) prenylation(GO:0097354) |
| 0.0 | 0.0 | GO:0060022 | hard palate development(GO:0060022) |
| 0.0 | 0.2 | GO:0006069 | ethanol oxidation(GO:0006069) |
| 0.0 | 0.1 | GO:0006616 | SRP-dependent cotranslational protein targeting to membrane, translocation(GO:0006616) |
| 0.0 | 0.2 | GO:0019800 | peptide cross-linking via chondroitin 4-sulfate glycosaminoglycan(GO:0019800) |
| 0.0 | 0.0 | GO:0010760 | negative regulation of macrophage chemotaxis(GO:0010760) |
| 0.0 | 0.1 | GO:0035520 | monoubiquitinated protein deubiquitination(GO:0035520) |
| 0.0 | 0.1 | GO:0001992 | regulation of systemic arterial blood pressure by vasopressin(GO:0001992) |
| 0.0 | 0.0 | GO:0061056 | sclerotome development(GO:0061056) |
| 0.0 | 0.0 | GO:0044336 | embryonic genitalia morphogenesis(GO:0030538) canonical Wnt signaling pathway involved in negative regulation of apoptotic process(GO:0044336) |
| 0.0 | 0.1 | GO:0007000 | nucleolus organization(GO:0007000) |
| 0.0 | 0.3 | GO:0098743 | cell aggregation(GO:0098743) |
| 0.0 | 0.0 | GO:0006570 | tyrosine metabolic process(GO:0006570) |
| 0.0 | 0.2 | GO:0019511 | peptidyl-proline hydroxylation(GO:0019511) |
| 0.0 | 0.0 | GO:1904350 | regulation of protein catabolic process in the vacuole(GO:1904350) positive regulation of protein catabolic process in the vacuole(GO:1904352) |
| 0.0 | 0.0 | GO:0045226 | extracellular polysaccharide biosynthetic process(GO:0045226) extracellular polysaccharide metabolic process(GO:0046379) |
| 0.0 | 0.1 | GO:0070257 | positive regulation of mucus secretion(GO:0070257) |
| 0.0 | 0.5 | GO:0007205 | protein kinase C-activating G-protein coupled receptor signaling pathway(GO:0007205) |
| 0.0 | 0.1 | GO:1990440 | positive regulation of transcription from RNA polymerase II promoter in response to endoplasmic reticulum stress(GO:1990440) |
| 0.0 | 0.0 | GO:0002023 | reduction of food intake in response to dietary excess(GO:0002023) |
| 0.0 | 0.2 | GO:0031053 | primary miRNA processing(GO:0031053) |
| 0.0 | 0.1 | GO:0035986 | senescence-associated heterochromatin focus assembly(GO:0035986) |
| 0.0 | 0.3 | GO:0034656 | nucleobase-containing small molecule catabolic process(GO:0034656) |
| 0.0 | 0.6 | GO:0034383 | low-density lipoprotein particle clearance(GO:0034383) |
| 0.0 | 0.0 | GO:0070230 | positive regulation of lymphocyte apoptotic process(GO:0070230) |
| 0.0 | 0.2 | GO:0018298 | protein-chromophore linkage(GO:0018298) |
| 0.0 | 0.0 | GO:0002184 | cytoplasmic translational termination(GO:0002184) |
| 0.0 | 0.0 | GO:1902613 | regulation of anti-Mullerian hormone signaling pathway(GO:1902612) negative regulation of anti-Mullerian hormone signaling pathway(GO:1902613) anti-Mullerian hormone signaling pathway(GO:1990262) |
| 0.0 | 0.0 | GO:0090487 | toxin catabolic process(GO:0009407) secondary metabolite catabolic process(GO:0090487) |
| 0.0 | 0.0 | GO:0002331 | pre-B cell allelic exclusion(GO:0002331) |
| 0.0 | 0.0 | GO:0043553 | negative regulation of phosphatidylinositol 3-kinase activity(GO:0043553) |
| 0.0 | 0.1 | GO:0044107 | ergosterol biosynthetic process(GO:0006696) ergosterol metabolic process(GO:0008204) cellular alcohol metabolic process(GO:0044107) cellular alcohol biosynthetic process(GO:0044108) |
| 0.0 | 0.2 | GO:1901550 | regulation of endothelial cell development(GO:1901550) regulation of establishment of endothelial barrier(GO:1903140) |
| 0.0 | 0.2 | GO:0007096 | regulation of exit from mitosis(GO:0007096) |
| 0.0 | 1.2 | GO:0006890 | retrograde vesicle-mediated transport, Golgi to ER(GO:0006890) |
| 0.0 | 0.6 | GO:0070373 | negative regulation of ERK1 and ERK2 cascade(GO:0070373) |
| 0.0 | 0.3 | GO:0045742 | positive regulation of epidermal growth factor receptor signaling pathway(GO:0045742) |
| 0.0 | 0.3 | GO:0050690 | regulation of defense response to virus by virus(GO:0050690) |
| 0.0 | 0.8 | GO:0050672 | negative regulation of mononuclear cell proliferation(GO:0032945) negative regulation of lymphocyte proliferation(GO:0050672) |
| 0.0 | 0.5 | GO:0000462 | maturation of SSU-rRNA from tricistronic rRNA transcript (SSU-rRNA, 5.8S rRNA, LSU-rRNA)(GO:0000462) |
| 0.0 | 0.1 | GO:0033490 | cholesterol biosynthetic process via desmosterol(GO:0033489) cholesterol biosynthetic process via lathosterol(GO:0033490) |
| 0.0 | 0.1 | GO:0071880 | adenylate cyclase-activating adrenergic receptor signaling pathway(GO:0071880) |
| 0.0 | 0.0 | GO:0019249 | lactate biosynthetic process(GO:0019249) |
| 0.0 | 0.4 | GO:0090004 | positive regulation of establishment of protein localization to plasma membrane(GO:0090004) |
| 0.0 | 0.0 | GO:0072717 | cellular response to actinomycin D(GO:0072717) |
| 0.0 | 0.4 | GO:0042590 | antigen processing and presentation of exogenous peptide antigen via MHC class I(GO:0042590) |
| 0.0 | 0.0 | GO:0044007 | negative regulation of transcription from RNA polymerase II promoter in response to UV-induced DNA damage(GO:0010768) transmission of virus(GO:0019089) dissemination or transmission of symbiont from host(GO:0044007) development involved in symbiotic interaction(GO:0044111) dissemination or transmission of organism from other organism involved in symbiotic interaction(GO:0051821) |
| 0.0 | 0.5 | GO:0006607 | NLS-bearing protein import into nucleus(GO:0006607) |
| 0.0 | 0.1 | GO:1901724 | positive regulation of cell proliferation involved in kidney development(GO:1901724) |
| 0.0 | 0.0 | GO:0032488 | Cdc42 protein signal transduction(GO:0032488) |
| 0.0 | 0.1 | GO:0006067 | ethanol metabolic process(GO:0006067) |
| 0.0 | 0.1 | GO:1903278 | regulation of sodium ion export(GO:1903273) positive regulation of sodium ion export(GO:1903275) regulation of sodium ion export from cell(GO:1903276) positive regulation of sodium ion export from cell(GO:1903278) |
| 0.0 | 0.3 | GO:0045943 | positive regulation of transcription from RNA polymerase I promoter(GO:0045943) |
| 0.0 | 0.0 | GO:0097698 | telomere maintenance via base-excision repair(GO:0097698) |
| 0.0 | 0.2 | GO:0031293 | membrane protein intracellular domain proteolysis(GO:0031293) |
| 0.0 | 0.1 | GO:0033629 | negative regulation of cell adhesion mediated by integrin(GO:0033629) |
| 0.0 | 0.4 | GO:0039703 | viral RNA genome replication(GO:0039694) RNA replication(GO:0039703) |
| 0.0 | 0.3 | GO:0006646 | phosphatidylethanolamine biosynthetic process(GO:0006646) |
| 0.0 | 0.0 | GO:0048808 | male genitalia morphogenesis(GO:0048808) male anatomical structure morphogenesis(GO:0090598) |
| 0.0 | 0.0 | GO:0098974 | postsynaptic actin cytoskeleton organization(GO:0098974) |
| 0.0 | 0.1 | GO:0001672 | regulation of chromatin assembly or disassembly(GO:0001672) |
| 0.0 | 0.0 | GO:2000296 | negative regulation of hydrogen peroxide catabolic process(GO:2000296) |
| 0.0 | 0.1 | GO:0051315 | attachment of mitotic spindle microtubules to kinetochore(GO:0051315) |
| 0.0 | 0.0 | GO:0048769 | sarcomerogenesis(GO:0048769) |
| 0.0 | 0.1 | GO:0032119 | sequestering of zinc ion(GO:0032119) regulation of sequestering of zinc ion(GO:0061088) |
| 0.0 | 0.0 | GO:0002101 | tRNA wobble cytosine modification(GO:0002101) |
| 0.0 | 0.7 | GO:0061418 | regulation of transcription from RNA polymerase II promoter in response to hypoxia(GO:0061418) |
| 0.0 | 0.0 | GO:0021526 | medial motor column neuron differentiation(GO:0021526) |
| 0.0 | 0.1 | GO:0061179 | negative regulation of insulin secretion involved in cellular response to glucose stimulus(GO:0061179) |
| 0.0 | 0.1 | GO:0044245 | polysaccharide digestion(GO:0044245) |
| 0.0 | 0.0 | GO:1904732 | regulation of electron carrier activity(GO:1904732) |
| 0.0 | 0.6 | GO:0048024 | regulation of mRNA splicing, via spliceosome(GO:0048024) |
| 0.0 | 0.1 | GO:0007614 | short-term memory(GO:0007614) |
| 0.0 | 0.1 | GO:0010591 | regulation of lamellipodium assembly(GO:0010591) |
| 0.0 | 0.0 | GO:0006499 | N-terminal protein myristoylation(GO:0006499) N-terminal peptidyl-glycine N-myristoylation(GO:0018008) |
| 0.0 | 1.9 | GO:0038094 | Fc-gamma receptor signaling pathway(GO:0038094) |
| 0.0 | 0.1 | GO:0048254 | snoRNA localization(GO:0048254) |
| 0.0 | 0.3 | GO:0030033 | microvillus assembly(GO:0030033) |
| 0.0 | 0.0 | GO:0035048 | splicing factor protein import into nucleus(GO:0035048) |
| 0.0 | 0.1 | GO:2000811 | negative regulation of anoikis(GO:2000811) |
| 0.0 | 0.2 | GO:0070129 | regulation of mitochondrial translation(GO:0070129) |
| 0.0 | 0.0 | GO:0061743 | motor learning(GO:0061743) |
| 0.0 | 0.0 | GO:0035562 | negative regulation of chromatin binding(GO:0035562) |
| 0.0 | 0.0 | GO:0042939 | glutathione transport(GO:0034635) tripeptide transport(GO:0042939) |
| 0.0 | 0.6 | GO:0032233 | positive regulation of actin filament bundle assembly(GO:0032233) |
| 0.0 | 0.0 | GO:0006147 | guanine catabolic process(GO:0006147) |
| 0.0 | 0.0 | GO:1902463 | protein localization to cell leading edge(GO:1902463) |
| 0.0 | 0.0 | GO:0032641 | lymphotoxin A production(GO:0032641) lymphotoxin A biosynthetic process(GO:0042109) |
| 0.0 | 0.2 | GO:0070208 | protein heterotrimerization(GO:0070208) |
| 0.0 | 0.0 | GO:0018076 | N-terminal peptidyl-lysine acetylation(GO:0018076) |
| 0.0 | 0.0 | GO:1904381 | Golgi apparatus mannose trimming(GO:1904381) |
| 0.0 | 0.6 | GO:0007189 | adenylate cyclase-activating G-protein coupled receptor signaling pathway(GO:0007189) |
| 0.0 | 0.1 | GO:0034638 | phosphatidylcholine catabolic process(GO:0034638) |
| 0.0 | 0.1 | GO:0042758 | long-chain fatty acid catabolic process(GO:0042758) |
| 0.0 | 0.1 | GO:0038092 | nodal signaling pathway(GO:0038092) |
| 0.0 | 0.1 | GO:0006930 | substrate-dependent cell migration, cell extension(GO:0006930) |
| 0.0 | 0.0 | GO:0006729 | tetrahydrobiopterin biosynthetic process(GO:0006729) tetrahydrobiopterin metabolic process(GO:0046146) |
| 0.0 | 0.2 | GO:0006107 | oxaloacetate metabolic process(GO:0006107) |
| 0.0 | 0.0 | GO:1900425 | negative regulation of defense response to bacterium(GO:1900425) |
| 0.0 | 0.0 | GO:0003350 | pulmonary myocardium development(GO:0003350) |
| 0.0 | 0.1 | GO:0048549 | positive regulation of pinocytosis(GO:0048549) |
| 0.0 | 0.1 | GO:0015755 | fructose transport(GO:0015755) fructose import(GO:0032445) cellular response to fructose stimulus(GO:0071332) carbohydrate import into cell(GO:0097319) carbohydrate import across plasma membrane(GO:0098704) fructose import across plasma membrane(GO:1990539) |
| 0.0 | 0.2 | GO:0070389 | chaperone cofactor-dependent protein refolding(GO:0070389) |
| 0.0 | 0.1 | GO:0042534 | tumor necrosis factor biosynthetic process(GO:0042533) regulation of tumor necrosis factor biosynthetic process(GO:0042534) |
| 0.0 | 0.0 | GO:0098507 | polynucleotide 5' dephosphorylation(GO:0098507) |
| 0.0 | 0.0 | GO:2000686 | negative regulation of rubidium ion transport(GO:2000681) regulation of rubidium ion transmembrane transporter activity(GO:2000686) negative regulation of rubidium ion transmembrane transporter activity(GO:2000687) |
| 0.0 | 0.0 | GO:0051710 | regulation of cytolysis in other organism(GO:0051710) |
| 0.0 | 0.0 | GO:1903803 | glutamine secretion(GO:0010585) L-glutamine import(GO:0036229) L-glutamine import into cell(GO:1903803) |
| 0.0 | 0.0 | GO:1901165 | positive regulation of trophoblast cell migration(GO:1901165) |
| 0.0 | 0.1 | GO:0006307 | DNA dealkylation involved in DNA repair(GO:0006307) |
| 0.0 | 0.0 | GO:0002051 | osteoblast fate commitment(GO:0002051) |
| 0.0 | 0.0 | GO:2000819 | regulation of nucleotide-excision repair(GO:2000819) |
| 0.0 | 0.1 | GO:0097503 | sialylation(GO:0097503) |
| 0.0 | 0.0 | GO:1990785 | response to water-immersion restraint stress(GO:1990785) |
| 0.0 | 0.0 | GO:0046271 | phenylpropanoid catabolic process(GO:0046271) |
| 0.0 | 0.1 | GO:1903543 | positive regulation of exosomal secretion(GO:1903543) |
| 0.0 | 0.6 | GO:0006968 | cellular defense response(GO:0006968) |
| 0.0 | 0.1 | GO:0030643 | cellular phosphate ion homeostasis(GO:0030643) cellular trivalent inorganic anion homeostasis(GO:0072502) |
| 0.0 | 0.1 | GO:1901843 | positive regulation of high voltage-gated calcium channel activity(GO:1901843) |
| 0.0 | 0.1 | GO:0060134 | prepulse inhibition(GO:0060134) |
| 0.0 | 0.0 | GO:0008616 | queuosine biosynthetic process(GO:0008616) queuosine metabolic process(GO:0046116) |
| 0.0 | 0.5 | GO:0018196 | peptidyl-asparagine modification(GO:0018196) protein N-linked glycosylation via asparagine(GO:0018279) |
| 0.0 | 0.1 | GO:0070537 | histone H2A K63-linked deubiquitination(GO:0070537) |
| 0.0 | 0.1 | GO:0016576 | histone dephosphorylation(GO:0016576) |
| 0.0 | 0.1 | GO:0001771 | immunological synapse formation(GO:0001771) |
| 0.0 | 0.0 | GO:0072086 | proximal/distal pattern formation involved in nephron development(GO:0072047) specification of nephron tubule identity(GO:0072081) specification of loop of Henle identity(GO:0072086) |
| 0.0 | 0.1 | GO:0061158 | 3'-UTR-mediated mRNA destabilization(GO:0061158) |
| 0.0 | 0.0 | GO:0098728 | germ-line stem cell division(GO:0042078) male germ-line stem cell asymmetric division(GO:0048133) germline stem cell asymmetric division(GO:0098728) |
| 0.0 | 0.1 | GO:0006707 | cholesterol catabolic process(GO:0006707) sterol catabolic process(GO:0016127) |
| 0.0 | 0.0 | GO:0039534 | negative regulation of MDA-5 signaling pathway(GO:0039534) |
| 0.0 | 0.0 | GO:0036003 | positive regulation of transcription from RNA polymerase II promoter in response to stress(GO:0036003) |
| 0.0 | 0.1 | GO:0007616 | long-term memory(GO:0007616) |
| 0.0 | 0.0 | GO:1903575 | cornified envelope assembly(GO:1903575) |
| 0.0 | 0.0 | GO:1903336 | negative regulation of vacuolar transport(GO:1903336) |
| 0.0 | 0.1 | GO:0007468 | regulation of rhodopsin gene expression(GO:0007468) positive regulation of rhodopsin gene expression(GO:0045872) |
| 0.0 | 0.2 | GO:0042026 | protein refolding(GO:0042026) |
Gene overrepresentation in cellular component category:
| Log-likelihood per target | Total log-likelihood | Term | Description |
|---|---|---|---|
| 0.7 | 2.1 | GO:0071065 | alpha9-beta1 integrin-vascular cell adhesion molecule-1 complex(GO:0071065) |
| 0.3 | 1.3 | GO:0097229 | sperm end piece(GO:0097229) |
| 0.3 | 2.2 | GO:0042825 | TAP complex(GO:0042825) |
| 0.3 | 2.3 | GO:0071144 | SMAD2-SMAD3 protein complex(GO:0071144) |
| 0.2 | 1.7 | GO:0036021 | endolysosome lumen(GO:0036021) |
| 0.2 | 1.9 | GO:1990111 | spermatoproteasome complex(GO:1990111) |
| 0.2 | 1.0 | GO:1990682 | CSF1-CSF1R complex(GO:1990682) |
| 0.2 | 2.0 | GO:0097486 | multivesicular body lumen(GO:0097486) |
| 0.1 | 0.1 | GO:0034688 | integrin alphaM-beta2 complex(GO:0034688) |
| 0.1 | 0.4 | GO:0035354 | Toll-like receptor 1-Toll-like receptor 2 protein complex(GO:0035354) |
| 0.1 | 1.9 | GO:0030478 | actin cap(GO:0030478) |
| 0.1 | 0.6 | GO:0036502 | Derlin-1-VIMP complex(GO:0036502) |
| 0.1 | 1.6 | GO:0033093 | Weibel-Palade body(GO:0033093) |
| 0.1 | 0.8 | GO:0031467 | Cul7-RING ubiquitin ligase complex(GO:0031467) |
| 0.1 | 0.6 | GO:0072557 | IPAF inflammasome complex(GO:0072557) |
| 0.1 | 0.3 | GO:0033150 | cytoskeletal calyx(GO:0033150) |
| 0.1 | 0.3 | GO:1990622 | CHOP-ATF3 complex(GO:1990622) |
| 0.1 | 1.1 | GO:0042612 | MHC class I protein complex(GO:0042612) |
| 0.1 | 0.5 | GO:0035841 | new growing cell tip(GO:0035841) |
| 0.1 | 0.3 | GO:0042565 | RNA nuclear export complex(GO:0042565) |
| 0.1 | 0.5 | GO:0005943 | phosphatidylinositol 3-kinase complex, class IA(GO:0005943) |
| 0.1 | 0.8 | GO:0098559 | cytoplasmic side of early endosome membrane(GO:0098559) |
| 0.1 | 1.0 | GO:0035692 | macrophage migration inhibitory factor receptor complex(GO:0035692) |
| 0.1 | 0.6 | GO:0034388 | Pwp2p-containing subcomplex of 90S preribosome(GO:0034388) |
| 0.1 | 0.5 | GO:1990589 | ATF4-CREB1 transcription factor complex(GO:1990589) |
| 0.1 | 0.4 | GO:1990423 | RZZ complex(GO:1990423) |
| 0.1 | 0.1 | GO:0042643 | actomyosin, actin portion(GO:0042643) |
| 0.1 | 0.3 | GO:0010370 | perinucleolar chromocenter(GO:0010370) |
| 0.1 | 1.9 | GO:0097342 | ripoptosome(GO:0097342) |
| 0.1 | 0.5 | GO:0020018 | ciliary pocket(GO:0020016) ciliary pocket membrane(GO:0020018) |
| 0.1 | 0.2 | GO:1990723 | cytoplasmic periphery of the nuclear pore complex(GO:1990723) |
| 0.1 | 0.2 | GO:1990590 | ATF1-ATF4 transcription factor complex(GO:1990590) |
| 0.1 | 0.3 | GO:0000811 | GINS complex(GO:0000811) |
| 0.1 | 0.3 | GO:0070435 | Shc-EGFR complex(GO:0070435) |
| 0.1 | 0.2 | GO:0097232 | lamellar body membrane(GO:0097232) alveolar lamellar body membrane(GO:0097233) |
| 0.1 | 0.1 | GO:0034681 | integrin alpha11-beta1 complex(GO:0034681) |
| 0.1 | 0.3 | GO:0005595 | collagen type XII trimer(GO:0005595) |
| 0.1 | 0.5 | GO:0072589 | box H/ACA scaRNP complex(GO:0072589) box H/ACA telomerase RNP complex(GO:0090661) |
| 0.1 | 0.7 | GO:0032133 | chromosome passenger complex(GO:0032133) |
| 0.1 | 0.3 | GO:0008537 | proteasome activator complex(GO:0008537) |
| 0.1 | 0.6 | GO:0097425 | smooth endoplasmic reticulum membrane(GO:0030868) smooth endoplasmic reticulum part(GO:0097425) |
| 0.1 | 0.4 | GO:0071598 | neuronal ribonucleoprotein granule(GO:0071598) |
| 0.1 | 0.4 | GO:0042567 | insulin-like growth factor ternary complex(GO:0042567) |
| 0.1 | 1.2 | GO:0032433 | filopodium tip(GO:0032433) |
| 0.1 | 0.2 | GO:0005900 | oncostatin-M receptor complex(GO:0005900) |
| 0.1 | 0.5 | GO:0031415 | NatA complex(GO:0031415) |
| 0.1 | 0.4 | GO:1990037 | Lewy body core(GO:1990037) |
| 0.1 | 0.4 | GO:0097149 | centralspindlin complex(GO:0097149) |
| 0.1 | 0.2 | GO:0000818 | nuclear MIS12/MIND complex(GO:0000818) |
| 0.1 | 0.4 | GO:0031673 | H zone(GO:0031673) |
| 0.1 | 0.7 | GO:0098647 | collagen type VI trimer(GO:0005589) collagen beaded filament(GO:0098647) |
| 0.1 | 0.4 | GO:0032010 | phagolysosome(GO:0032010) |
| 0.1 | 0.1 | GO:0001405 | presequence translocase-associated import motor(GO:0001405) |
| 0.1 | 0.9 | GO:0010369 | chromocenter(GO:0010369) |
| 0.1 | 0.4 | GO:0032280 | symmetric synapse(GO:0032280) |
| 0.1 | 0.5 | GO:0072687 | meiotic spindle(GO:0072687) |
| 0.1 | 0.9 | GO:0032059 | bleb(GO:0032059) |
| 0.1 | 0.4 | GO:0035686 | sperm fibrous sheath(GO:0035686) |
| 0.1 | 0.4 | GO:0097451 | glial limiting end-foot(GO:0097451) |
| 0.1 | 0.6 | GO:0033018 | sarcoplasmic reticulum lumen(GO:0033018) |
| 0.1 | 0.8 | GO:0030126 | COPI vesicle coat(GO:0030126) |
| 0.1 | 0.6 | GO:0060091 | kinocilium(GO:0060091) |
| 0.0 | 0.6 | GO:0033256 | I-kappaB/NF-kappaB complex(GO:0033256) |
| 0.0 | 0.2 | GO:0070826 | paraferritin complex(GO:0070826) |
| 0.0 | 0.4 | GO:0072487 | MSL complex(GO:0072487) |
| 0.0 | 0.7 | GO:0046581 | intercellular canaliculus(GO:0046581) |
| 0.0 | 0.2 | GO:1902937 | inward rectifier potassium channel complex(GO:1902937) |
| 0.0 | 0.2 | GO:0044393 | microspike(GO:0044393) |
| 0.0 | 0.1 | GO:0001674 | female germ cell nucleus(GO:0001674) |
| 0.0 | 0.2 | GO:0034665 | integrin alpha1-beta1 complex(GO:0034665) |
| 0.0 | 0.2 | GO:0038038 | G-protein coupled receptor homodimeric complex(GO:0038038) |
| 0.0 | 0.1 | GO:0060342 | photoreceptor inner segment membrane(GO:0060342) |
| 0.0 | 0.3 | GO:0031262 | Ndc80 complex(GO:0031262) |
| 0.0 | 0.9 | GO:0044613 | nuclear pore central transport channel(GO:0044613) |
| 0.0 | 0.1 | GO:0033565 | ESCRT-0 complex(GO:0033565) |
| 0.0 | 0.2 | GO:0035061 | interchromatin granule(GO:0035061) |
| 0.0 | 0.2 | GO:0042272 | nuclear RNA export factor complex(GO:0042272) |
| 0.0 | 0.4 | GO:0000015 | phosphopyruvate hydratase complex(GO:0000015) |
| 0.0 | 0.4 | GO:0035985 | senescence-associated heterochromatin focus(GO:0035985) |
| 0.0 | 0.5 | GO:0070449 | elongin complex(GO:0070449) |
| 0.0 | 0.3 | GO:0097209 | epidermal lamellar body(GO:0097209) |
| 0.0 | 0.1 | GO:0097441 | basilar dendrite(GO:0097441) |
| 0.0 | 0.2 | GO:0090571 | RNA polymerase II transcription repressor complex(GO:0090571) |
| 0.0 | 0.8 | GO:1990454 | L-type voltage-gated calcium channel complex(GO:1990454) |
| 0.0 | 0.2 | GO:0097123 | cyclin A1-CDK2 complex(GO:0097123) |
| 0.0 | 0.4 | GO:0097197 | tetraspanin-enriched microdomain(GO:0097197) |
| 0.0 | 0.3 | GO:0043196 | varicosity(GO:0043196) |
| 0.0 | 0.2 | GO:0070288 | intracellular ferritin complex(GO:0008043) ferritin complex(GO:0070288) |
| 0.0 | 0.1 | GO:0005863 | striated muscle myosin thick filament(GO:0005863) |
| 0.0 | 0.2 | GO:0072534 | perineuronal net(GO:0072534) |
| 0.0 | 0.5 | GO:0098643 | fibrillar collagen trimer(GO:0005583) banded collagen fibril(GO:0098643) |
| 0.0 | 0.3 | GO:0001939 | female pronucleus(GO:0001939) |
| 0.0 | 0.1 | GO:0033597 | mitotic checkpoint complex(GO:0033597) bub1-bub3 complex(GO:1990298) |
| 0.0 | 0.3 | GO:0008282 | ATP-sensitive potassium channel complex(GO:0008282) |
| 0.0 | 0.3 | GO:0042406 | extrinsic component of endoplasmic reticulum membrane(GO:0042406) |
| 0.0 | 0.2 | GO:0036396 | MIS complex(GO:0036396) mRNA editing complex(GO:0045293) |
| 0.0 | 0.1 | GO:0043159 | acrosomal matrix(GO:0043159) |
| 0.0 | 0.1 | GO:0009328 | phenylalanine-tRNA ligase complex(GO:0009328) |
| 0.0 | 0.5 | GO:0005686 | U2 snRNP(GO:0005686) |
| 0.0 | 0.3 | GO:0070765 | gamma-secretase complex(GO:0070765) |
| 0.0 | 0.5 | GO:0002199 | zona pellucida receptor complex(GO:0002199) |
| 0.0 | 0.1 | GO:0005674 | transcription factor TFIIF complex(GO:0005674) |
| 0.0 | 0.2 | GO:0005873 | plus-end kinesin complex(GO:0005873) |
| 0.0 | 0.1 | GO:0034455 | t-UTP complex(GO:0034455) |
| 0.0 | 0.3 | GO:0005785 | signal recognition particle receptor complex(GO:0005785) |
| 0.0 | 0.7 | GO:0033270 | paranode region of axon(GO:0033270) |
| 0.0 | 1.0 | GO:0005614 | interstitial matrix(GO:0005614) |
| 0.0 | 0.3 | GO:0016272 | prefoldin complex(GO:0016272) |
| 0.0 | 1.0 | GO:0005682 | U5 snRNP(GO:0005682) |
| 0.0 | 0.4 | GO:0005955 | calcineurin complex(GO:0005955) |
| 0.0 | 0.1 | GO:1990356 | sumoylated E2 ligase complex(GO:1990356) |
| 0.0 | 0.1 | GO:1990666 | PCSK9-LDLR complex(GO:1990666) |
| 0.0 | 0.4 | GO:0070369 | beta-catenin-TCF7L2 complex(GO:0070369) |
| 0.0 | 0.1 | GO:0045259 | mitochondrial proton-transporting ATP synthase complex(GO:0005753) proton-transporting ATP synthase complex(GO:0045259) |
| 0.0 | 0.1 | GO:0031838 | haptoglobin-hemoglobin complex(GO:0031838) |
| 0.0 | 0.1 | GO:0071001 | U4/U6 snRNP(GO:0071001) |
| 0.0 | 0.1 | GO:0034457 | Mpp10 complex(GO:0034457) |
| 0.0 | 0.3 | GO:0030688 | preribosome, small subunit precursor(GO:0030688) |
| 0.0 | 0.6 | GO:0035267 | NuA4 histone acetyltransferase complex(GO:0035267) H4/H2A histone acetyltransferase complex(GO:0043189) H4 histone acetyltransferase complex(GO:1902562) |
| 0.0 | 0.1 | GO:0033186 | CAF-1 complex(GO:0033186) |
| 0.0 | 0.2 | GO:0008622 | epsilon DNA polymerase complex(GO:0008622) |
| 0.0 | 0.1 | GO:0030289 | protein phosphatase 4 complex(GO:0030289) |
| 0.0 | 0.2 | GO:0001652 | granular component(GO:0001652) |
| 0.0 | 0.4 | GO:0030870 | Mre11 complex(GO:0030870) |
| 0.0 | 0.2 | GO:1990769 | proximal neuron projection(GO:1990769) |
| 0.0 | 0.5 | GO:0030127 | COPII vesicle coat(GO:0030127) |
| 0.0 | 0.3 | GO:0097449 | astrocyte projection(GO:0097449) |
| 0.0 | 0.2 | GO:0005610 | laminin-5 complex(GO:0005610) |
| 0.0 | 0.3 | GO:1990316 | ATG1/ULK1 kinase complex(GO:1990316) |
| 0.0 | 0.1 | GO:0000942 | condensed nuclear chromosome outer kinetochore(GO:0000942) |
| 0.0 | 0.5 | GO:0097512 | cardiac myofibril(GO:0097512) |
| 0.0 | 0.6 | GO:0005942 | phosphatidylinositol 3-kinase complex(GO:0005942) |
| 0.0 | 0.1 | GO:0097208 | alveolar lamellar body(GO:0097208) |
| 0.0 | 0.2 | GO:0071953 | elastic fiber(GO:0071953) |
| 0.0 | 0.3 | GO:0060171 | stereocilium membrane(GO:0060171) |
| 0.0 | 0.1 | GO:1990584 | cardiac Troponin complex(GO:1990584) |
| 0.0 | 0.8 | GO:1990124 | messenger ribonucleoprotein complex(GO:1990124) |
| 0.0 | 1.2 | GO:0032839 | dendrite cytoplasm(GO:0032839) |
| 0.0 | 0.2 | GO:1990745 | EARP complex(GO:1990745) |
| 0.0 | 1.4 | GO:0005771 | multivesicular body(GO:0005771) |
| 0.0 | 0.2 | GO:0034687 | integrin alphaL-beta2 complex(GO:0034687) |
| 0.0 | 0.1 | GO:0044326 | dendritic spine neck(GO:0044326) |
| 0.0 | 0.1 | GO:0098843 | postsynaptic endocytic zone(GO:0098843) |
| 0.0 | 0.2 | GO:0071797 | LUBAC complex(GO:0071797) |
| 0.0 | 0.1 | GO:0036195 | muscle cell projection(GO:0036194) muscle cell projection membrane(GO:0036195) |
| 0.0 | 0.1 | GO:0000778 | condensed nuclear chromosome kinetochore(GO:0000778) |
| 0.0 | 0.2 | GO:0005786 | signal recognition particle, endoplasmic reticulum targeting(GO:0005786) |
| 0.0 | 0.1 | GO:0033185 | dolichol-phosphate-mannose synthase complex(GO:0033185) |
| 0.0 | 0.6 | GO:0090533 | cation-transporting ATPase complex(GO:0090533) |
| 0.0 | 0.1 | GO:0005687 | U4 snRNP(GO:0005687) |
| 0.0 | 0.3 | GO:0000176 | nuclear exosome (RNase complex)(GO:0000176) |
| 0.0 | 0.1 | GO:0070701 | mucus layer(GO:0070701) |
| 0.0 | 1.7 | GO:1904724 | tertiary granule lumen(GO:1904724) |
| 0.0 | 1.0 | GO:0000159 | protein phosphatase type 2A complex(GO:0000159) |
| 0.0 | 0.1 | GO:0005927 | muscle tendon junction(GO:0005927) |
| 0.0 | 0.1 | GO:0005953 | CAAX-protein geranylgeranyltransferase complex(GO:0005953) |
| 0.0 | 0.3 | GO:0031209 | SCAR complex(GO:0031209) |
| 0.0 | 2.2 | GO:0034707 | chloride channel complex(GO:0034707) |
| 0.0 | 2.7 | GO:0005796 | Golgi lumen(GO:0005796) |
| 0.0 | 0.2 | GO:0031314 | extrinsic component of mitochondrial inner membrane(GO:0031314) |
| 0.0 | 0.3 | GO:0005861 | troponin complex(GO:0005861) |
| 0.0 | 0.1 | GO:0060187 | cell pole(GO:0060187) |
| 0.0 | 0.0 | GO:0016939 | kinesin II complex(GO:0016939) |
| 0.0 | 0.4 | GO:0001741 | XY body(GO:0001741) |
| 0.0 | 0.3 | GO:0005885 | Arp2/3 protein complex(GO:0005885) |
| 0.0 | 0.1 | GO:0045272 | plasma membrane respiratory chain complex I(GO:0045272) |
| 0.0 | 0.1 | GO:0048269 | methionine adenosyltransferase complex(GO:0048269) |
| 0.0 | 0.2 | GO:0000506 | glycosylphosphatidylinositol-N-acetylglucosaminyltransferase (GPI-GnT) complex(GO:0000506) |
| 0.0 | 0.2 | GO:0019907 | cyclin-dependent protein kinase activating kinase holoenzyme complex(GO:0019907) |
| 0.0 | 0.1 | GO:0071006 | U2-type catalytic step 1 spliceosome(GO:0071006) |
| 0.0 | 0.2 | GO:0005744 | mitochondrial inner membrane presequence translocase complex(GO:0005744) |
| 0.0 | 0.9 | GO:0034364 | high-density lipoprotein particle(GO:0034364) |
| 0.0 | 0.1 | GO:0005960 | glycine cleavage complex(GO:0005960) |
| 0.0 | 0.5 | GO:0005639 | integral component of nuclear inner membrane(GO:0005639) intrinsic component of nuclear inner membrane(GO:0031229) |
| 0.0 | 0.1 | GO:0001534 | radial spoke(GO:0001534) |
| 0.0 | 0.3 | GO:0031095 | platelet dense tubular network membrane(GO:0031095) |
| 0.0 | 0.0 | GO:0031205 | endoplasmic reticulum Sec complex(GO:0031205) |
| 0.0 | 0.2 | GO:1990712 | HFE-transferrin receptor complex(GO:1990712) |
| 0.0 | 0.1 | GO:0034669 | integrin alpha4-beta7 complex(GO:0034669) |
| 0.0 | 0.2 | GO:0044666 | MLL3/4 complex(GO:0044666) |
| 0.0 | 0.3 | GO:0000812 | Swr1 complex(GO:0000812) |
| 0.0 | 0.1 | GO:0071752 | dimeric IgA immunoglobulin complex(GO:0071750) secretory dimeric IgA immunoglobulin complex(GO:0071752) |
| 0.0 | 0.1 | GO:0044615 | nuclear pore nuclear basket(GO:0044615) |
| 0.0 | 1.7 | GO:0005581 | collagen trimer(GO:0005581) |
| 0.0 | 1.5 | GO:0031093 | platelet alpha granule lumen(GO:0031093) |
| 0.0 | 0.0 | GO:0016222 | procollagen-proline 4-dioxygenase complex(GO:0016222) |
| 0.0 | 0.2 | GO:0071141 | SMAD protein complex(GO:0071141) |
| 0.0 | 0.1 | GO:0098845 | postsynaptic endosome(GO:0098845) |
| 0.0 | 0.0 | GO:0044609 | DBIRD complex(GO:0044609) |
| 0.0 | 0.3 | GO:0030137 | COPI-coated vesicle(GO:0030137) |
| 0.0 | 0.2 | GO:0005685 | U1 snRNP(GO:0005685) |
| 0.0 | 0.2 | GO:0035068 | micro-ribonucleoprotein complex(GO:0035068) |
| 0.0 | 0.9 | GO:0016235 | aggresome(GO:0016235) |
| 0.0 | 0.2 | GO:0019773 | proteasome core complex, alpha-subunit complex(GO:0019773) |
| 0.0 | 0.2 | GO:0099634 | postsynaptic specialization membrane(GO:0099634) |
| 0.0 | 0.1 | GO:0097504 | Gemini of coiled bodies(GO:0097504) |
| 0.0 | 0.0 | GO:0033011 | perinuclear theca(GO:0033011) |
| 0.0 | 0.0 | GO:0097135 | cyclin E2-CDK2 complex(GO:0097135) |
| 0.0 | 0.2 | GO:0097136 | Bcl-2 family protein complex(GO:0097136) |
| 0.0 | 0.2 | GO:0042382 | paraspeckles(GO:0042382) |
| 0.0 | 0.1 | GO:0089701 | U2AF(GO:0089701) |
| 0.0 | 0.1 | GO:0033269 | internode region of axon(GO:0033269) |
| 0.0 | 0.1 | GO:0044530 | supraspliceosomal complex(GO:0044530) |
| 0.0 | 0.1 | GO:0030895 | apolipoprotein B mRNA editing enzyme complex(GO:0030895) |
| 0.0 | 0.1 | GO:0071204 | histone pre-mRNA 3'end processing complex(GO:0071204) |
| 0.0 | 0.0 | GO:0018444 | translation release factor complex(GO:0018444) |
| 0.0 | 0.2 | GO:0070775 | H3 histone acetyltransferase complex(GO:0070775) MOZ/MORF histone acetyltransferase complex(GO:0070776) |
| 0.0 | 0.7 | GO:0002102 | podosome(GO:0002102) |
| 0.0 | 0.1 | GO:0000127 | transcription factor TFIIIC complex(GO:0000127) |
| 0.0 | 0.1 | GO:0035517 | PR-DUB complex(GO:0035517) |
| 0.0 | 0.2 | GO:0019908 | nuclear cyclin-dependent protein kinase holoenzyme complex(GO:0019908) |
| 0.0 | 0.1 | GO:0005899 | insulin receptor complex(GO:0005899) |
| 0.0 | 0.4 | GO:0097381 | photoreceptor disc membrane(GO:0097381) |
| 0.0 | 0.8 | GO:0015030 | Cajal body(GO:0015030) |
| 0.0 | 0.2 | GO:0030867 | rough endoplasmic reticulum membrane(GO:0030867) |
| 0.0 | 0.1 | GO:0044423 | virion(GO:0019012) virion part(GO:0044423) |
| 0.0 | 0.2 | GO:0070937 | CRD-mediated mRNA stability complex(GO:0070937) |
| 0.0 | 0.5 | GO:0071782 | endoplasmic reticulum tubular network(GO:0071782) |
| 0.0 | 1.3 | GO:0032580 | Golgi cisterna membrane(GO:0032580) |
| 0.0 | 0.1 | GO:0031094 | platelet dense tubular network(GO:0031094) |
| 0.0 | 0.1 | GO:0005826 | actomyosin contractile ring(GO:0005826) |
| 0.0 | 0.1 | GO:0098536 | deuterosome(GO:0098536) |
| 0.0 | 0.1 | GO:0000126 | transcription factor TFIIIB complex(GO:0000126) |
| 0.0 | 0.2 | GO:0008278 | cohesin complex(GO:0008278) |
| 0.0 | 0.1 | GO:0070695 | FHF complex(GO:0070695) |
| 0.0 | 0.4 | GO:0030687 | preribosome, large subunit precursor(GO:0030687) |
| 0.0 | 0.1 | GO:0070557 | PCNA-p21 complex(GO:0070557) |
| 0.0 | 0.3 | GO:0032040 | small-subunit processome(GO:0032040) |
| 0.0 | 0.0 | GO:0032002 | interleukin-28 receptor complex(GO:0032002) |
| 0.0 | 0.2 | GO:0097225 | sperm midpiece(GO:0097225) |
| 0.0 | 0.3 | GO:0005852 | eukaryotic translation initiation factor 3 complex(GO:0005852) |
| 0.0 | 0.1 | GO:0000125 | PCAF complex(GO:0000125) |
| 0.0 | 0.1 | GO:0030121 | AP-1 adaptor complex(GO:0030121) |
| 0.0 | 0.1 | GO:0031332 | RISC complex(GO:0016442) RNAi effector complex(GO:0031332) |
| 0.0 | 1.2 | GO:0101003 | ficolin-1-rich granule membrane(GO:0101003) |
| 0.0 | 1.1 | GO:0005776 | autophagosome(GO:0005776) |
| 0.0 | 0.1 | GO:1903439 | calcitonin family receptor complex(GO:1903439) amylin receptor complex(GO:1903440) |
| 0.0 | 0.0 | GO:0071547 | piP-body(GO:0071547) |
| 0.0 | 0.1 | GO:1990452 | Parkin-FBXW7-Cul1 ubiquitin ligase complex(GO:1990452) |
| 0.0 | 0.2 | GO:0042622 | photoreceptor outer segment membrane(GO:0042622) |
| 0.0 | 0.1 | GO:0032593 | insulin-responsive compartment(GO:0032593) |
| 0.0 | 0.7 | GO:0070821 | tertiary granule membrane(GO:0070821) |
| 0.0 | 0.2 | GO:0008250 | oligosaccharyltransferase complex(GO:0008250) |
| 0.0 | 0.0 | GO:0005968 | Rab-protein geranylgeranyltransferase complex(GO:0005968) |
| 0.0 | 0.1 | GO:0005964 | phosphorylase kinase complex(GO:0005964) |
Gene overrepresentation in molecular function category:
| Log-likelihood per target | Total log-likelihood | Term | Description |
|---|---|---|---|
| 1.6 | 4.8 | GO:0042008 | interleukin-18 receptor activity(GO:0042008) |
| 0.6 | 3.2 | GO:0048248 | CXCR3 chemokine receptor binding(GO:0048248) |
| 0.5 | 1.6 | GO:0001716 | L-amino-acid oxidase activity(GO:0001716) |
| 0.4 | 1.3 | GO:0031731 | CCR6 chemokine receptor binding(GO:0031731) |
| 0.4 | 1.2 | GO:0004912 | interleukin-3 receptor activity(GO:0004912) |
| 0.4 | 1.2 | GO:0005292 | high-affinity basic amino acid transmembrane transporter activity(GO:0005287) high-affinity arginine transmembrane transporter activity(GO:0005289) high-affinity lysine transmembrane transporter activity(GO:0005292) |
| 0.4 | 2.3 | GO:0031962 | mineralocorticoid receptor binding(GO:0031962) |
| 0.3 | 0.9 | GO:0008859 | exoribonuclease II activity(GO:0008859) |
| 0.3 | 2.8 | GO:0046978 | TAP binding(GO:0046977) TAP1 binding(GO:0046978) |
| 0.3 | 1.9 | GO:0015333 | peptide:proton symporter activity(GO:0015333) proton-dependent peptide secondary active transmembrane transporter activity(GO:0022897) |
| 0.3 | 4.6 | GO:0031996 | thioesterase binding(GO:0031996) |
| 0.2 | 2.4 | GO:0008131 | primary amine oxidase activity(GO:0008131) |
| 0.2 | 0.7 | GO:0000253 | 3-keto sterol reductase activity(GO:0000253) |
| 0.2 | 3.7 | GO:0070492 | oligosaccharide binding(GO:0070492) |
| 0.2 | 0.4 | GO:0004720 | protein-lysine 6-oxidase activity(GO:0004720) |
| 0.2 | 2.9 | GO:0017034 | Rap guanyl-nucleotide exchange factor activity(GO:0017034) |
| 0.2 | 2.1 | GO:0045236 | CXCR chemokine receptor binding(GO:0045236) |
| 0.2 | 0.8 | GO:0004909 | interleukin-1, Type I, activating receptor activity(GO:0004909) |
| 0.2 | 0.7 | GO:0004360 | glutamine-fructose-6-phosphate transaminase (isomerizing) activity(GO:0004360) |
| 0.2 | 1.1 | GO:0015204 | urea transmembrane transporter activity(GO:0015204) |
| 0.2 | 1.8 | GO:0016721 | superoxide dismutase activity(GO:0004784) oxidoreductase activity, acting on superoxide radicals as acceptor(GO:0016721) |
| 0.2 | 0.5 | GO:1990190 | peptide-glutamate-N-acetyltransferase activity(GO:1990190) |
| 0.2 | 0.7 | GO:0004911 | interleukin-2 receptor activity(GO:0004911) interleukin-2 binding(GO:0019976) |
| 0.2 | 0.6 | GO:0043273 | CTPase activity(GO:0043273) |
| 0.2 | 1.0 | GO:0030197 | extracellular matrix constituent, lubricant activity(GO:0030197) |
| 0.2 | 0.5 | GO:0061609 | fructose-1-phosphate aldolase activity(GO:0061609) |
| 0.2 | 1.1 | GO:0008109 | N-acetyllactosaminide beta-1,6-N-acetylglucosaminyltransferase activity(GO:0008109) |
| 0.2 | 0.9 | GO:0002114 | interleukin-33 receptor activity(GO:0002114) |
| 0.2 | 0.9 | GO:0034714 | type III transforming growth factor beta receptor binding(GO:0034714) |
| 0.2 | 0.8 | GO:0031728 | CCR3 chemokine receptor binding(GO:0031728) |
| 0.2 | 0.6 | GO:0035939 | microsatellite binding(GO:0035939) |
| 0.1 | 0.4 | GO:0008457 | beta-galactosyl-N-acetylglucosaminylgalactosylglucosyl-ceramide beta-1,3-acetylglucosaminyltransferase activity(GO:0008457) lactosylceramide 1,3-N-acetyl-beta-D-glucosaminyltransferase activity(GO:0047256) |
| 0.1 | 0.6 | GO:0016295 | oleoyl-[acyl-carrier-protein] hydrolase activity(GO:0004320) myristoyl-[acyl-carrier-protein] hydrolase activity(GO:0016295) palmitoyl-[acyl-carrier-protein] hydrolase activity(GO:0016296) acyl-[acyl-carrier-protein] hydrolase activity(GO:0016297) |
| 0.1 | 1.2 | GO:0060002 | plus-end directed microfilament motor activity(GO:0060002) |
| 0.1 | 4.2 | GO:0097200 | cysteine-type endopeptidase activity involved in execution phase of apoptosis(GO:0097200) |
| 0.1 | 0.4 | GO:0004772 | sterol O-acyltransferase activity(GO:0004772) cholesterol O-acyltransferase activity(GO:0034736) |
| 0.1 | 0.4 | GO:0042947 | glucoside transmembrane transporter activity(GO:0042947) |
| 0.1 | 0.5 | GO:0004979 | beta-endorphin receptor activity(GO:0004979) morphine receptor activity(GO:0038047) |
| 0.1 | 0.4 | GO:0102008 | cytosolic dipeptidase activity(GO:0102008) |
| 0.1 | 0.5 | GO:0004769 | steroid delta-isomerase activity(GO:0004769) |
| 0.1 | 1.0 | GO:0005332 | gamma-aminobutyric acid:sodium symporter activity(GO:0005332) |
| 0.1 | 0.4 | GO:0004963 | follicle-stimulating hormone receptor activity(GO:0004963) |
| 0.1 | 0.5 | GO:0031727 | CCR2 chemokine receptor binding(GO:0031727) |
| 0.1 | 0.8 | GO:0015562 | efflux transmembrane transporter activity(GO:0015562) |
| 0.1 | 0.4 | GO:0030156 | benzodiazepine receptor binding(GO:0030156) |
| 0.1 | 1.1 | GO:0030882 | lipid antigen binding(GO:0030882) endogenous lipid antigen binding(GO:0030883) exogenous lipid antigen binding(GO:0030884) |
| 0.1 | 0.5 | GO:0005042 | netrin receptor activity(GO:0005042) |
| 0.1 | 0.6 | GO:0023029 | MHC class Ib protein binding(GO:0023029) |
| 0.1 | 1.1 | GO:0005237 | inhibitory extracellular ligand-gated ion channel activity(GO:0005237) |
| 0.1 | 0.5 | GO:0004337 | dimethylallyltranstransferase activity(GO:0004161) geranyltranstransferase activity(GO:0004337) |
| 0.1 | 0.6 | GO:0004127 | cytidylate kinase activity(GO:0004127) |
| 0.1 | 0.3 | GO:0004060 | arylamine N-acetyltransferase activity(GO:0004060) |
| 0.1 | 0.3 | GO:0043739 | G/U mismatch-specific uracil-DNA glycosylase activity(GO:0043739) |
| 0.1 | 0.3 | GO:0009383 | rRNA (cytosine-C5-)-methyltransferase activity(GO:0009383) |
| 0.1 | 0.6 | GO:0005497 | androgen binding(GO:0005497) |
| 0.1 | 0.4 | GO:0034041 | sterol-transporting ATPase activity(GO:0034041) |
| 0.1 | 0.6 | GO:0022850 | serotonin-gated cation channel activity(GO:0022850) |
| 0.1 | 0.3 | GO:0090631 | pre-miRNA transporter activity(GO:0090631) |
| 0.1 | 0.4 | GO:0005006 | epidermal growth factor-activated receptor activity(GO:0005006) |
| 0.1 | 0.3 | GO:0004452 | isopentenyl-diphosphate delta-isomerase activity(GO:0004452) |
| 0.1 | 0.3 | GO:0004345 | glucose-6-phosphate dehydrogenase activity(GO:0004345) |
| 0.1 | 0.4 | GO:0016793 | dGTPase activity(GO:0008832) triphosphoric monoester hydrolase activity(GO:0016793) guanyl deoxyribonucleotide binding(GO:0032560) dGTP binding(GO:0032567) |
| 0.1 | 0.3 | GO:0005017 | platelet-derived growth factor-activated receptor activity(GO:0005017) |
| 0.1 | 0.3 | GO:0001596 | angiotensin type I receptor activity(GO:0001596) |
| 0.1 | 0.6 | GO:0003873 | 6-phosphofructo-2-kinase activity(GO:0003873) |
| 0.1 | 1.0 | GO:0004931 | extracellular ATP-gated cation channel activity(GO:0004931) ATP-gated ion channel activity(GO:0035381) |
| 0.1 | 0.3 | GO:0002094 | polyprenyltransferase activity(GO:0002094) |
| 0.1 | 2.2 | GO:0019870 | potassium channel inhibitor activity(GO:0019870) |
| 0.1 | 0.3 | GO:0005519 | cytoskeletal regulatory protein binding(GO:0005519) |
| 0.1 | 3.6 | GO:0005540 | hyaluronic acid binding(GO:0005540) |
| 0.1 | 0.3 | GO:0005011 | macrophage colony-stimulating factor receptor activity(GO:0005011) |
| 0.1 | 0.6 | GO:0004873 | asialoglycoprotein receptor activity(GO:0004873) |
| 0.1 | 0.3 | GO:0001595 | angiotensin receptor activity(GO:0001595) angiotensin type II receptor activity(GO:0004945) |
| 0.1 | 0.5 | GO:1990763 | arrestin family protein binding(GO:1990763) |
| 0.1 | 0.5 | GO:0018479 | benzaldehyde dehydrogenase (NAD+) activity(GO:0018479) |
| 0.1 | 0.3 | GO:0004906 | interferon-gamma receptor activity(GO:0004906) |
| 0.1 | 0.3 | GO:0005137 | interleukin-5 receptor binding(GO:0005137) |
| 0.1 | 0.7 | GO:0004468 | lysine N-acetyltransferase activity, acting on acetyl phosphate as donor(GO:0004468) |
| 0.1 | 0.3 | GO:0035248 | alpha-1,4-N-acetylgalactosaminyltransferase activity(GO:0035248) |
| 0.1 | 0.4 | GO:0019912 | cyclin-dependent protein kinase activating kinase activity(GO:0019912) |
| 0.1 | 0.6 | GO:0005280 | hydrogen:amino acid symporter activity(GO:0005280) |
| 0.1 | 0.2 | GO:0008900 | hydrogen:potassium-exchanging ATPase activity(GO:0008900) |
| 0.1 | 0.7 | GO:0004849 | uridine kinase activity(GO:0004849) |
| 0.1 | 0.8 | GO:0035005 | 1-phosphatidylinositol-4-phosphate 3-kinase activity(GO:0035005) |
| 0.1 | 0.6 | GO:0045545 | syndecan binding(GO:0045545) |
| 0.1 | 0.4 | GO:0015526 | hexose phosphate transmembrane transporter activity(GO:0015119) organophosphate:inorganic phosphate antiporter activity(GO:0015315) hexose-phosphate:inorganic phosphate antiporter activity(GO:0015526) glucose 6-phosphate:inorganic phosphate antiporter activity(GO:0061513) |
| 0.1 | 0.2 | GO:0034584 | piRNA binding(GO:0034584) |
| 0.1 | 4.1 | GO:0043027 | cysteine-type endopeptidase inhibitor activity involved in apoptotic process(GO:0043027) |
| 0.1 | 0.6 | GO:0005157 | macrophage colony-stimulating factor receptor binding(GO:0005157) |
| 0.1 | 0.5 | GO:0042392 | sphingosine-1-phosphate phosphatase activity(GO:0042392) |
| 0.1 | 0.3 | GO:0008745 | N-acetylmuramoyl-L-alanine amidase activity(GO:0008745) |
| 0.1 | 0.3 | GO:0035501 | MH1 domain binding(GO:0035501) |
| 0.1 | 0.4 | GO:0004052 | arachidonate 12-lipoxygenase activity(GO:0004052) |
| 0.1 | 0.3 | GO:0050692 | DBD domain binding(GO:0050692) |
| 0.1 | 0.2 | GO:0017098 | sulfonylurea receptor binding(GO:0017098) |
| 0.1 | 0.4 | GO:0004977 | melanocortin receptor activity(GO:0004977) |
| 0.1 | 0.3 | GO:0045569 | TRAIL binding(GO:0045569) |
| 0.1 | 2.2 | GO:0004298 | threonine-type endopeptidase activity(GO:0004298) threonine-type peptidase activity(GO:0070003) |
| 0.1 | 0.6 | GO:0004111 | creatine kinase activity(GO:0004111) |
| 0.1 | 0.3 | GO:0003953 | NAD+ nucleosidase activity(GO:0003953) |
| 0.1 | 0.4 | GO:0047961 | glycine N-acyltransferase activity(GO:0047961) |
| 0.1 | 0.3 | GO:1901375 | acetylcholine transmembrane transporter activity(GO:0005277) acetate ester transmembrane transporter activity(GO:1901375) |
| 0.1 | 0.1 | GO:0061628 | H3K27me3 modified histone binding(GO:0061628) |
| 0.1 | 2.2 | GO:0070001 | aspartic-type endopeptidase activity(GO:0004190) aspartic-type peptidase activity(GO:0070001) |
| 0.1 | 0.8 | GO:0070053 | thrombospondin receptor activity(GO:0070053) |
| 0.1 | 2.0 | GO:0005229 | intracellular calcium activated chloride channel activity(GO:0005229) |
| 0.1 | 0.6 | GO:0035174 | histone serine kinase activity(GO:0035174) |
| 0.1 | 0.6 | GO:0038049 | transcription factor activity, ligand-activated RNA polymerase II transcription factor binding(GO:0038049) |
| 0.1 | 0.4 | GO:0003835 | beta-galactoside alpha-2,6-sialyltransferase activity(GO:0003835) |
| 0.1 | 0.3 | GO:0030620 | U2 snRNA binding(GO:0030620) |
| 0.1 | 0.3 | GO:0008453 | alanine-glyoxylate transaminase activity(GO:0008453) |
| 0.1 | 0.3 | GO:0070137 | ubiquitin-like protein-specific endopeptidase activity(GO:0070137) SUMO-specific endopeptidase activity(GO:0070139) |
| 0.1 | 0.4 | GO:0004771 | sterol esterase activity(GO:0004771) |
| 0.1 | 0.3 | GO:0034647 | histone demethylase activity (H3-trimethyl-K4 specific)(GO:0034647) |
| 0.1 | 0.2 | GO:0002046 | opsin binding(GO:0002046) |
| 0.1 | 0.2 | GO:0005350 | pyrimidine nucleobase transmembrane transporter activity(GO:0005350) pyrimidine- and adenine-specific:sodium symporter activity(GO:0015389) |
| 0.1 | 0.7 | GO:0030911 | TPR domain binding(GO:0030911) |
| 0.1 | 0.5 | GO:0034513 | box H/ACA snoRNA binding(GO:0034513) |
| 0.1 | 0.2 | GO:0061714 | folic acid receptor activity(GO:0061714) |
| 0.1 | 0.6 | GO:0008046 | axon guidance receptor activity(GO:0008046) |
| 0.1 | 0.2 | GO:0008384 | IkappaB kinase activity(GO:0008384) |
| 0.1 | 0.2 | GO:0030550 | acetylcholine receptor inhibitor activity(GO:0030550) |
| 0.1 | 0.7 | GO:0035374 | chondroitin sulfate binding(GO:0035374) |
| 0.1 | 0.4 | GO:0035800 | deubiquitinase activator activity(GO:0035800) |
| 0.1 | 0.3 | GO:0047280 | nicotinamide phosphoribosyltransferase activity(GO:0047280) |
| 0.1 | 0.2 | GO:0046997 | oxidoreductase activity, acting on the CH-NH group of donors, flavin as acceptor(GO:0046997) |
| 0.1 | 0.5 | GO:0035252 | UDP-xylosyltransferase activity(GO:0035252) xylosyltransferase activity(GO:0042285) |
| 0.1 | 0.5 | GO:0008048 | calcium sensitive guanylate cyclase activator activity(GO:0008048) |
| 0.1 | 0.5 | GO:0003876 | AMP deaminase activity(GO:0003876) adenosine-phosphate deaminase activity(GO:0047623) |
| 0.1 | 0.2 | GO:0042781 | 3'-tRNA processing endoribonuclease activity(GO:0042781) |
| 0.1 | 1.7 | GO:0031489 | myosin V binding(GO:0031489) |
| 0.1 | 1.3 | GO:0016918 | retinal binding(GO:0016918) |
| 0.1 | 0.6 | GO:0043199 | sulfate binding(GO:0043199) |
| 0.1 | 0.3 | GO:0004392 | heme oxygenase (decyclizing) activity(GO:0004392) |
| 0.1 | 0.8 | GO:0086056 | voltage-gated calcium channel activity involved in AV node cell action potential(GO:0086056) |
| 0.1 | 0.3 | GO:0004924 | oncostatin-M receptor activity(GO:0004924) |
| 0.1 | 0.7 | GO:0016713 | oxidoreductase activity, acting on paired donors, with incorporation or reduction of molecular oxygen, reduced iron-sulfur protein as one donor, and incorporation of one atom of oxygen(GO:0016713) |
| 0.1 | 0.3 | GO:0004966 | galanin receptor activity(GO:0004966) |
| 0.1 | 1.9 | GO:0005164 | tumor necrosis factor receptor binding(GO:0005164) |
| 0.1 | 0.3 | GO:0031544 | peptidyl-proline 3-dioxygenase activity(GO:0031544) |
| 0.1 | 0.4 | GO:0015349 | thyroid hormone transmembrane transporter activity(GO:0015349) |
| 0.1 | 1.6 | GO:0004012 | phospholipid-translocating ATPase activity(GO:0004012) |
| 0.1 | 0.3 | GO:0043183 | vascular endothelial growth factor receptor 1 binding(GO:0043183) |
| 0.1 | 0.4 | GO:0030628 | pre-mRNA 3'-splice site binding(GO:0030628) |
| 0.1 | 0.2 | GO:0004611 | phosphoenolpyruvate carboxykinase activity(GO:0004611) phosphoenolpyruvate carboxykinase (GTP) activity(GO:0004613) |
| 0.1 | 1.9 | GO:0001968 | fibronectin binding(GO:0001968) |
| 0.1 | 0.1 | GO:0005275 | amine transmembrane transporter activity(GO:0005275) |
| 0.1 | 0.4 | GO:0001640 | adenylate cyclase inhibiting G-protein coupled glutamate receptor activity(GO:0001640) G-protein coupled glutamate receptor activity(GO:0098988) |
| 0.1 | 1.0 | GO:0004089 | carbonate dehydratase activity(GO:0004089) |
| 0.1 | 0.4 | GO:0016833 | oxo-acid-lyase activity(GO:0016833) |
| 0.0 | 0.2 | GO:0004905 | type I interferon receptor activity(GO:0004905) |
| 0.0 | 0.1 | GO:0070051 | fibrinogen binding(GO:0070051) |
| 0.0 | 0.2 | GO:0005294 | neutral L-amino acid secondary active transmembrane transporter activity(GO:0005294) |
| 0.0 | 0.1 | GO:0033878 | hormone-sensitive lipase activity(GO:0033878) |
| 0.0 | 0.8 | GO:0004062 | aryl sulfotransferase activity(GO:0004062) |
| 0.0 | 0.9 | GO:0047372 | acylglycerol lipase activity(GO:0047372) |
| 0.0 | 0.4 | GO:0030160 | GKAP/Homer scaffold activity(GO:0030160) |
| 0.0 | 0.2 | GO:0015086 | cadmium ion transmembrane transporter activity(GO:0015086) cobalt ion transmembrane transporter activity(GO:0015087) lead ion transmembrane transporter activity(GO:0015094) ferrous iron uptake transmembrane transporter activity(GO:0015639) |
| 0.0 | 0.3 | GO:0015272 | ATP-activated inward rectifier potassium channel activity(GO:0015272) |
| 0.0 | 0.2 | GO:0004487 | methylenetetrahydrofolate dehydrogenase (NAD+) activity(GO:0004487) |
| 0.0 | 0.1 | GO:0001003 | polymerase III regulatory region sequence-specific DNA binding(GO:0000992) RNA polymerase III type 1 promoter sequence-specific DNA binding(GO:0001002) RNA polymerase III type 2 promoter sequence-specific DNA binding(GO:0001003) RNA polymerase III transcription factor activity, sequence-specific DNA binding(GO:0001034) |
| 0.0 | 0.4 | GO:0005220 | inositol 1,4,5-trisphosphate-sensitive calcium-release channel activity(GO:0005220) |
| 0.0 | 1.3 | GO:0005523 | tropomyosin binding(GO:0005523) |
| 0.0 | 0.5 | GO:0046935 | 1-phosphatidylinositol-3-kinase regulator activity(GO:0046935) |
| 0.0 | 0.3 | GO:0042296 | ISG15 transferase activity(GO:0042296) |
| 0.0 | 0.1 | GO:0001132 | RNA polymerase II transcription factor activity, TBP-class protein binding, involved in preinitiation complex assembly(GO:0001129) RNA polymerase II transcription factor activity, TBP-class protein binding(GO:0001132) |
| 0.0 | 0.3 | GO:0061133 | endopeptidase activator activity(GO:0061133) |
| 0.0 | 0.3 | GO:0004430 | 1-phosphatidylinositol 4-kinase activity(GO:0004430) |
| 0.0 | 0.7 | GO:0003796 | lysozyme activity(GO:0003796) |
| 0.0 | 0.3 | GO:0000064 | L-ornithine transmembrane transporter activity(GO:0000064) |
| 0.0 | 0.1 | GO:0060001 | minus-end directed microfilament motor activity(GO:0060001) |
| 0.0 | 1.3 | GO:0005031 | tumor necrosis factor-activated receptor activity(GO:0005031) death receptor activity(GO:0005035) |
| 0.0 | 0.2 | GO:0044736 | acid-sensing ion channel activity(GO:0044736) |
| 0.0 | 0.3 | GO:0004045 | aminoacyl-tRNA hydrolase activity(GO:0004045) |
| 0.0 | 0.1 | GO:0008523 | sodium-dependent multivitamin transmembrane transporter activity(GO:0008523) |
| 0.0 | 0.2 | GO:0050211 | procollagen galactosyltransferase activity(GO:0050211) |
| 0.0 | 1.0 | GO:0102391 | decanoate--CoA ligase activity(GO:0102391) |
| 0.0 | 0.3 | GO:0009019 | tRNA (guanine-N1-)-methyltransferase activity(GO:0009019) |
| 0.0 | 0.3 | GO:1904929 | coreceptor activity involved in Wnt signaling pathway, planar cell polarity pathway(GO:1904929) |
| 0.0 | 1.1 | GO:0022842 | leak channel activity(GO:0022840) narrow pore channel activity(GO:0022842) |
| 0.0 | 0.2 | GO:0031735 | CCR10 chemokine receptor binding(GO:0031735) |
| 0.0 | 0.4 | GO:0004634 | phosphopyruvate hydratase activity(GO:0004634) |
| 0.0 | 0.4 | GO:0008597 | calcium-dependent protein serine/threonine phosphatase regulator activity(GO:0008597) |
| 0.0 | 0.1 | GO:0061629 | RNA polymerase II sequence-specific DNA binding transcription factor binding(GO:0061629) |
| 0.0 | 0.2 | GO:0015187 | glycine transmembrane transporter activity(GO:0015187) |
| 0.0 | 0.3 | GO:0015277 | kainate selective glutamate receptor activity(GO:0015277) |
| 0.0 | 0.3 | GO:0016812 | hydrolase activity, acting on carbon-nitrogen (but not peptide) bonds, in cyclic amides(GO:0016812) |
| 0.0 | 0.8 | GO:0031701 | angiotensin receptor binding(GO:0031701) type 1 angiotensin receptor binding(GO:0031702) |
| 0.0 | 0.3 | GO:0004126 | cytidine deaminase activity(GO:0004126) |
| 0.0 | 1.1 | GO:0050811 | GABA receptor binding(GO:0050811) |
| 0.0 | 0.1 | GO:0004698 | calcium-dependent protein kinase C activity(GO:0004698) |
| 0.0 | 0.4 | GO:0008440 | inositol-1,4,5-trisphosphate 3-kinase activity(GO:0008440) |
| 0.0 | 0.6 | GO:0038036 | sphingosine-1-phosphate receptor activity(GO:0038036) |
| 0.0 | 0.5 | GO:0004022 | alcohol dehydrogenase (NAD) activity(GO:0004022) |
| 0.0 | 0.3 | GO:0015450 | P-P-bond-hydrolysis-driven protein transmembrane transporter activity(GO:0015450) |
| 0.0 | 0.4 | GO:0097157 | pre-mRNA intronic binding(GO:0097157) |
| 0.0 | 1.4 | GO:0017147 | Wnt-protein binding(GO:0017147) |
| 0.0 | 0.3 | GO:0015016 | [heparan sulfate]-glucosamine N-sulfotransferase activity(GO:0015016) |
| 0.0 | 0.2 | GO:0051431 | corticotropin-releasing hormone receptor 2 binding(GO:0051431) |
| 0.0 | 0.1 | GO:0035184 | histone threonine kinase activity(GO:0035184) |
| 0.0 | 0.2 | GO:0004739 | pyruvate dehydrogenase (acetyl-transferring) activity(GO:0004739) |
| 0.0 | 0.4 | GO:0070700 | BMP receptor binding(GO:0070700) |
| 0.0 | 0.2 | GO:0003875 | ADP-ribosylarginine hydrolase activity(GO:0003875) |
| 0.0 | 0.2 | GO:0003827 | alpha-1,3-mannosylglycoprotein 2-beta-N-acetylglucosaminyltransferase activity(GO:0003827) |
| 0.0 | 0.2 | GO:0035614 | snRNA stem-loop binding(GO:0035614) |
| 0.0 | 0.3 | GO:0050682 | AF-2 domain binding(GO:0050682) |
| 0.0 | 0.4 | GO:0008517 | folic acid transporter activity(GO:0008517) |
| 0.0 | 0.8 | GO:0070628 | proteasome binding(GO:0070628) |
| 0.0 | 0.2 | GO:0036033 | mediator complex binding(GO:0036033) |
| 0.0 | 0.4 | GO:0046703 | natural killer cell lectin-like receptor binding(GO:0046703) |
| 0.0 | 6.5 | GO:0004984 | olfactory receptor activity(GO:0004984) |
| 0.0 | 0.2 | GO:0008525 | phosphatidylcholine transporter activity(GO:0008525) |
| 0.0 | 0.0 | GO:0097604 | temperature-gated cation channel activity(GO:0097604) |
| 0.0 | 0.5 | GO:0009931 | calcium-dependent protein serine/threonine kinase activity(GO:0009931) |
| 0.0 | 0.6 | GO:0008391 | arachidonic acid monooxygenase activity(GO:0008391) arachidonic acid epoxygenase activity(GO:0008392) |
| 0.0 | 0.8 | GO:0004185 | serine-type carboxypeptidase activity(GO:0004185) |
| 0.0 | 0.1 | GO:0034875 | oxidoreductase activity, acting on CH or CH2 groups, quinone or similar compound as acceptor(GO:0033695) caffeine oxidase activity(GO:0034875) |
| 0.0 | 0.3 | GO:0035727 | lysophosphatidic acid binding(GO:0035727) |
| 0.0 | 0.2 | GO:0001007 | transcription factor activity, RNA polymerase III transcription factor binding(GO:0001007) |
| 0.0 | 0.3 | GO:0016403 | dimethylargininase activity(GO:0016403) |
| 0.0 | 0.3 | GO:0004704 | NF-kappaB-inducing kinase activity(GO:0004704) |
| 0.0 | 0.3 | GO:0015232 | heme transporter activity(GO:0015232) |
| 0.0 | 0.1 | GO:0031751 | D4 dopamine receptor binding(GO:0031751) |
| 0.0 | 0.1 | GO:0004766 | spermidine synthase activity(GO:0004766) |
| 0.0 | 0.6 | GO:0008195 | phosphatidate phosphatase activity(GO:0008195) |
| 0.0 | 0.0 | GO:0016015 | morphogen activity(GO:0016015) |
| 0.0 | 0.1 | GO:0061656 | SUMO conjugating enzyme activity(GO:0061656) |
| 0.0 | 0.1 | GO:0050571 | 1,5-anhydro-D-fructose reductase activity(GO:0050571) |
| 0.0 | 0.1 | GO:0047315 | kynurenine-glyoxylate transaminase activity(GO:0047315) |
| 0.0 | 0.3 | GO:0031811 | G-protein coupled nucleotide receptor binding(GO:0031811) P2Y1 nucleotide receptor binding(GO:0031812) |
| 0.0 | 0.1 | GO:0033265 | choline binding(GO:0033265) |
| 0.0 | 0.1 | GO:0097677 | STAT family protein binding(GO:0097677) |
| 0.0 | 0.1 | GO:0051733 | ATP-dependent polydeoxyribonucleotide 5'-hydroxyl-kinase activity(GO:0046404) polydeoxyribonucleotide kinase activity(GO:0051733) ATP-dependent polynucleotide kinase activity(GO:0051734) |
| 0.0 | 0.7 | GO:0044548 | S100 protein binding(GO:0044548) |
| 0.0 | 0.4 | GO:0019531 | oxalate transmembrane transporter activity(GO:0019531) |
| 0.0 | 0.3 | GO:0043533 | inositol 1,3,4,5 tetrakisphosphate binding(GO:0043533) |
| 0.0 | 0.6 | GO:0004143 | diacylglycerol kinase activity(GO:0004143) |
| 0.0 | 0.2 | GO:0051373 | FATZ binding(GO:0051373) |
| 0.0 | 0.2 | GO:0016725 | oxidoreductase activity, acting on CH or CH2 groups(GO:0016725) |
| 0.0 | 0.5 | GO:0017017 | MAP kinase tyrosine/serine/threonine phosphatase activity(GO:0017017) |
| 0.0 | 0.2 | GO:0005298 | proline:sodium symporter activity(GO:0005298) |
| 0.0 | 0.6 | GO:0061578 | Lys63-specific deubiquitinase activity(GO:0061578) |
| 0.0 | 0.2 | GO:0004176 | ATP-dependent peptidase activity(GO:0004176) |
| 0.0 | 0.4 | GO:0004985 | opioid receptor activity(GO:0004985) |
| 0.0 | 0.2 | GO:0039552 | RIG-I binding(GO:0039552) |
| 0.0 | 0.2 | GO:0086083 | cell adhesive protein binding involved in bundle of His cell-Purkinje myocyte communication(GO:0086083) |
| 0.0 | 0.1 | GO:0070506 | high-density lipoprotein particle receptor activity(GO:0070506) |
| 0.0 | 0.1 | GO:0016314 | phosphatidylinositol-3,4,5-trisphosphate 3-phosphatase activity(GO:0016314) phosphatidylinositol-3,4-bisphosphate 3-phosphatase activity(GO:0051800) |
| 0.0 | 0.0 | GO:0032427 | GBD domain binding(GO:0032427) |
| 0.0 | 0.6 | GO:0004859 | phospholipase inhibitor activity(GO:0004859) |
| 0.0 | 0.6 | GO:0051400 | BH domain binding(GO:0051400) |
| 0.0 | 0.2 | GO:0005250 | A-type (transient outward) potassium channel activity(GO:0005250) |
| 0.0 | 0.1 | GO:0004914 | interleukin-5 receptor activity(GO:0004914) |
| 0.0 | 0.3 | GO:0051425 | PTB domain binding(GO:0051425) |
| 0.0 | 0.5 | GO:0005432 | calcium:sodium antiporter activity(GO:0005432) |
| 0.0 | 0.1 | GO:0005135 | interleukin-3 receptor binding(GO:0005135) |
| 0.0 | 0.1 | GO:1902271 | D3 vitamins binding(GO:1902271) |
| 0.0 | 0.1 | GO:0036487 | nitric-oxide synthase inhibitor activity(GO:0036487) |
| 0.0 | 0.1 | GO:0033749 | histone demethylase activity (H3-R2 specific)(GO:0033746) histone demethylase activity (H4-R3 specific)(GO:0033749) |
| 0.0 | 0.1 | GO:0031403 | lithium ion binding(GO:0031403) |
| 0.0 | 0.2 | GO:0004322 | ferroxidase activity(GO:0004322) oxidoreductase activity, oxidizing metal ions, oxygen as acceptor(GO:0016724) |
| 0.0 | 0.5 | GO:0051787 | misfolded protein binding(GO:0051787) |
| 0.0 | 0.4 | GO:0005007 | fibroblast growth factor-activated receptor activity(GO:0005007) |
| 0.0 | 0.7 | GO:0008242 | omega peptidase activity(GO:0008242) |
| 0.0 | 0.1 | GO:0016838 | carbon-oxygen lyase activity, acting on phosphates(GO:0016838) |
| 0.0 | 0.1 | GO:0042134 | rRNA primary transcript binding(GO:0042134) |
| 0.0 | 0.1 | GO:0032552 | deoxyribonucleotide binding(GO:0032552) |
| 0.0 | 0.1 | GO:0033699 | DNA 5'-adenosine monophosphate hydrolase activity(GO:0033699) |
| 0.0 | 0.5 | GO:0048018 | receptor agonist activity(GO:0048018) |
| 0.0 | 0.2 | GO:0099583 | neurotransmitter receptor activity involved in regulation of postsynaptic cytosolic calcium ion concentration(GO:0099583) |
| 0.0 | 0.7 | GO:0048020 | CCR chemokine receptor binding(GO:0048020) |
| 0.0 | 0.1 | GO:0016404 | 15-hydroxyprostaglandin dehydrogenase (NAD+) activity(GO:0016404) |
| 0.0 | 0.2 | GO:0042289 | MHC class II protein binding(GO:0042289) |
| 0.0 | 0.2 | GO:0004735 | pyrroline-5-carboxylate reductase activity(GO:0004735) |
| 0.0 | 0.1 | GO:0017116 | single-stranded DNA-dependent ATP-dependent DNA helicase activity(GO:0017116) |
| 0.0 | 0.5 | GO:0031005 | filamin binding(GO:0031005) |
| 0.0 | 0.3 | GO:0036122 | BMP binding(GO:0036122) |
| 0.0 | 0.1 | GO:0031753 | endothelial differentiation G-protein coupled receptor binding(GO:0031753) Edg-2 lysophosphatidic acid receptor binding(GO:0031755) |
| 0.0 | 0.3 | GO:0017169 | CDP-alcohol phosphatidyltransferase activity(GO:0017169) |
| 0.0 | 0.2 | GO:0003998 | acylphosphatase activity(GO:0003998) |
| 0.0 | 0.1 | GO:0045145 | single-stranded DNA 5'-3' exodeoxyribonuclease activity(GO:0045145) |
| 0.0 | 0.1 | GO:0004743 | pyruvate kinase activity(GO:0004743) |
| 0.0 | 0.1 | GO:0003918 | DNA topoisomerase type II (ATP-hydrolyzing) activity(GO:0003918) DNA topoisomerase II activity(GO:0061505) |
| 0.0 | 0.3 | GO:0070567 | cytidylyltransferase activity(GO:0070567) |
| 0.0 | 0.1 | GO:0005152 | interleukin-1 receptor antagonist activity(GO:0005152) |
| 0.0 | 0.4 | GO:0032183 | SUMO binding(GO:0032183) |
| 0.0 | 0.6 | GO:0008510 | sodium:bicarbonate symporter activity(GO:0008510) |
| 0.0 | 0.1 | GO:0000827 | inositol-1,3,4,5,6-pentakisphosphate kinase activity(GO:0000827) inositol hexakisphosphate kinase activity(GO:0000828) inositol heptakisphosphate kinase activity(GO:0000829) inositol hexakisphosphate 5-kinase activity(GO:0000832) diphosphoinositol-pentakisphosphate kinase activity(GO:0033857) inositol hexakisphosphate 1-kinase activity(GO:0052723) inositol hexakisphosphate 3-kinase activity(GO:0052724) |
| 0.0 | 0.1 | GO:0070095 | fructose-6-phosphate binding(GO:0070095) |
| 0.0 | 0.9 | GO:0001671 | ATPase activator activity(GO:0001671) |
| 0.0 | 0.1 | GO:0005549 | odorant binding(GO:0005549) |
| 0.0 | 0.2 | GO:0046912 | transferase activity, transferring acyl groups, acyl groups converted into alkyl on transfer(GO:0046912) |
| 0.0 | 0.1 | GO:0031862 | prostanoid receptor binding(GO:0031862) |
| 0.0 | 0.3 | GO:0030280 | structural constituent of epidermis(GO:0030280) |
| 0.0 | 0.1 | GO:0004998 | transferrin receptor activity(GO:0004998) |
| 0.0 | 0.4 | GO:0019864 | IgG binding(GO:0019864) |
| 0.0 | 1.3 | GO:0061631 | ubiquitin conjugating enzyme activity(GO:0061631) ubiquitin-like protein conjugating enzyme activity(GO:0061650) |
| 0.0 | 0.7 | GO:0042056 | chemoattractant activity(GO:0042056) |
| 0.0 | 0.3 | GO:0042834 | peptidoglycan binding(GO:0042834) |
| 0.0 | 0.1 | GO:0004908 | interleukin-1 receptor activity(GO:0004908) |
| 0.0 | 0.2 | GO:0050694 | galactosylceramide sulfotransferase activity(GO:0001733) galactose 3-O-sulfotransferase activity(GO:0050694) |
| 0.0 | 0.0 | GO:0010853 | cyclase activator activity(GO:0010853) guanylate cyclase activator activity(GO:0030250) |
| 0.0 | 0.1 | GO:0004146 | dihydrofolate reductase activity(GO:0004146) |
| 0.0 | 0.9 | GO:0015020 | glucuronosyltransferase activity(GO:0015020) |
| 0.0 | 0.2 | GO:0008467 | [heparan sulfate]-glucosamine 3-sulfotransferase 1 activity(GO:0008467) |
| 0.0 | 0.1 | GO:0000990 | transcription factor activity, core RNA polymerase binding(GO:0000990) |
| 0.0 | 0.1 | GO:0047237 | glucuronylgalactosylproteoglycan 4-beta-N-acetylgalactosaminyltransferase activity(GO:0047237) |
| 0.0 | 0.1 | GO:0050146 | nucleoside phosphotransferase activity(GO:0050146) |
| 0.0 | 0.1 | GO:0004088 | carbamoyl-phosphate synthase (ammonia) activity(GO:0004087) carbamoyl-phosphate synthase (glutamine-hydrolyzing) activity(GO:0004088) |
| 0.0 | 0.3 | GO:0008429 | phosphatidylethanolamine binding(GO:0008429) |
| 0.0 | 0.1 | GO:1990446 | U1 snRNP binding(GO:1990446) |
| 0.0 | 0.7 | GO:0005086 | ARF guanyl-nucleotide exchange factor activity(GO:0005086) |
| 0.0 | 0.3 | GO:0008020 | G-protein coupled photoreceptor activity(GO:0008020) |
| 0.0 | 0.1 | GO:0030350 | iron-responsive element binding(GO:0030350) |
| 0.0 | 0.5 | GO:0016018 | cyclosporin A binding(GO:0016018) |
| 0.0 | 0.1 | GO:0016907 | G-protein coupled acetylcholine receptor activity(GO:0016907) |
| 0.0 | 0.1 | GO:0005047 | signal recognition particle binding(GO:0005047) |
| 0.0 | 0.3 | GO:0015280 | ligand-gated sodium channel activity(GO:0015280) |
| 0.0 | 0.1 | GO:0004582 | dolichyl-phosphate beta-D-mannosyltransferase activity(GO:0004582) |
| 0.0 | 0.3 | GO:0043138 | 3'-5' DNA helicase activity(GO:0043138) |
| 0.0 | 0.2 | GO:0016286 | small conductance calcium-activated potassium channel activity(GO:0016286) |
| 0.0 | 0.3 | GO:0016176 | superoxide-generating NADPH oxidase activator activity(GO:0016176) |
| 0.0 | 0.2 | GO:0019863 | IgE binding(GO:0019863) |
| 0.0 | 0.2 | GO:0016813 | hydrolase activity, acting on carbon-nitrogen (but not peptide) bonds, in linear amidines(GO:0016813) |
| 0.0 | 0.1 | GO:0042835 | BRE binding(GO:0042835) |
| 0.0 | 0.1 | GO:0000309 | nicotinamide-nucleotide adenylyltransferase activity(GO:0000309) |
| 0.0 | 0.1 | GO:0004694 | eukaryotic translation initiation factor 2alpha kinase activity(GO:0004694) |
| 0.0 | 0.1 | GO:0036134 | thromboxane-A synthase activity(GO:0004796) 12-hydroxyheptadecatrienoic acid synthase activity(GO:0036134) |
| 0.0 | 0.2 | GO:0004687 | myosin light chain kinase activity(GO:0004687) |
| 0.0 | 0.1 | GO:0016941 | natriuretic peptide receptor activity(GO:0016941) |
| 0.0 | 0.1 | GO:0003845 | 11-beta-hydroxysteroid dehydrogenase [NAD(P)] activity(GO:0003845) |
| 0.0 | 0.2 | GO:0004844 | uracil DNA N-glycosylase activity(GO:0004844) deaminated base DNA N-glycosylase activity(GO:0097506) |
| 0.0 | 0.3 | GO:0034236 | protein kinase A catalytic subunit binding(GO:0034236) |
| 0.0 | 0.1 | GO:0070363 | mitochondrial light strand promoter sense binding(GO:0070363) |
| 0.0 | 0.7 | GO:0005212 | structural constituent of eye lens(GO:0005212) |
| 0.0 | 0.1 | GO:0030492 | hemoglobin binding(GO:0030492) |
| 0.0 | 0.1 | GO:0004662 | CAAX-protein geranylgeranyltransferase activity(GO:0004662) |
| 0.0 | 0.1 | GO:0031208 | POZ domain binding(GO:0031208) |
| 0.0 | 0.2 | GO:0031748 | D1 dopamine receptor binding(GO:0031748) |
| 0.0 | 0.9 | GO:0003950 | NAD+ ADP-ribosyltransferase activity(GO:0003950) |
| 0.0 | 0.1 | GO:0035529 | NADH pyrophosphatase activity(GO:0035529) |
| 0.0 | 0.1 | GO:1990226 | histone methyltransferase binding(GO:1990226) |
| 0.0 | 0.1 | GO:0001851 | complement component C3b binding(GO:0001851) |
| 0.0 | 0.2 | GO:0004594 | pantothenate kinase activity(GO:0004594) |
| 0.0 | 0.1 | GO:0015183 | L-aspartate transmembrane transporter activity(GO:0015183) |
| 0.0 | 0.2 | GO:0017176 | phosphatidylinositol N-acetylglucosaminyltransferase activity(GO:0017176) |
| 0.0 | 0.3 | GO:0015174 | basic amino acid transmembrane transporter activity(GO:0015174) |
| 0.0 | 0.2 | GO:0042301 | phosphate ion binding(GO:0042301) |
| 0.0 | 1.8 | GO:0030374 | ligand-dependent nuclear receptor transcription coactivator activity(GO:0030374) |
| 0.0 | 0.2 | GO:0032393 | MHC class I receptor activity(GO:0032393) |
| 0.0 | 0.4 | GO:0097109 | neuroligin family protein binding(GO:0097109) |
| 0.0 | 0.1 | GO:0005052 | peroxisome matrix targeting signal-1 binding(GO:0005052) |
| 0.0 | 0.1 | GO:0016427 | tRNA (cytosine) methyltransferase activity(GO:0016427) |
| 0.0 | 0.5 | GO:0008331 | high voltage-gated calcium channel activity(GO:0008331) |
| 0.0 | 0.3 | GO:0031681 | G-protein beta-subunit binding(GO:0031681) |
| 0.0 | 0.2 | GO:0032051 | clathrin light chain binding(GO:0032051) |
| 0.0 | 0.6 | GO:0016864 | protein disulfide isomerase activity(GO:0003756) intramolecular oxidoreductase activity, transposing S-S bonds(GO:0016864) |
| 0.0 | 0.0 | GO:0044388 | small protein activating enzyme binding(GO:0044388) |
| 0.0 | 1.0 | GO:0008139 | nuclear localization sequence binding(GO:0008139) |
| 0.0 | 0.0 | GO:0045322 | unmethylated CpG binding(GO:0045322) |
| 0.0 | 0.0 | GO:0031893 | vasopressin receptor binding(GO:0031893) |
| 0.0 | 0.1 | GO:0035663 | Toll-like receptor 2 binding(GO:0035663) |
| 0.0 | 0.3 | GO:0000774 | adenyl-nucleotide exchange factor activity(GO:0000774) |
| 0.0 | 0.1 | GO:0001594 | trace-amine receptor activity(GO:0001594) |
| 0.0 | 0.1 | GO:0004167 | dopachrome isomerase activity(GO:0004167) |
| 0.0 | 0.1 | GO:0035500 | MH2 domain binding(GO:0035500) |
| 0.0 | 0.1 | GO:0071207 | histone pre-mRNA stem-loop binding(GO:0071207) |
| 0.0 | 0.1 | GO:0015197 | peptide transporter activity(GO:0015197) |
| 0.0 | 0.1 | GO:0052816 | medium-chain acyl-CoA hydrolase activity(GO:0052815) long-chain acyl-CoA hydrolase activity(GO:0052816) |
| 0.0 | 0.1 | GO:0031716 | calcitonin receptor binding(GO:0031716) |
| 0.0 | 0.6 | GO:0015269 | calcium-activated potassium channel activity(GO:0015269) |
| 0.0 | 0.9 | GO:0005547 | phosphatidylinositol-3,4,5-trisphosphate binding(GO:0005547) |
| 0.0 | 0.1 | GO:0070576 | vitamin D 24-hydroxylase activity(GO:0070576) |
| 0.0 | 0.2 | GO:0008312 | 7S RNA binding(GO:0008312) |
| 0.0 | 0.2 | GO:0070097 | delta-catenin binding(GO:0070097) |
| 0.0 | 0.3 | GO:0019911 | structural constituent of myelin sheath(GO:0019911) |
| 0.0 | 0.0 | GO:0016639 | oxidoreductase activity, acting on the CH-NH2 group of donors, NAD or NADP as acceptor(GO:0016639) |
| 0.0 | 0.6 | GO:0031698 | beta-2 adrenergic receptor binding(GO:0031698) |
| 0.0 | 0.1 | GO:0055131 | C3HC4-type RING finger domain binding(GO:0055131) |
| 0.0 | 0.2 | GO:0035613 | RNA stem-loop binding(GO:0035613) |
| 0.0 | 0.1 | GO:0086089 | voltage-gated potassium channel activity involved in atrial cardiac muscle cell action potential repolarization(GO:0086089) |
| 0.0 | 0.1 | GO:0000248 | C-5 sterol desaturase activity(GO:0000248) sterol desaturase activity(GO:0070704) |
| 0.0 | 0.0 | GO:0031752 | D5 dopamine receptor binding(GO:0031752) |
| 0.0 | 0.1 | GO:0042007 | interleukin-18 binding(GO:0042007) |
| 0.0 | 0.4 | GO:1990381 | ubiquitin-specific protease binding(GO:1990381) |
| 0.0 | 0.1 | GO:0004459 | L-lactate dehydrogenase activity(GO:0004459) |
| 0.0 | 0.1 | GO:0098519 | nucleotide phosphatase activity, acting on free nucleotides(GO:0098519) |
| 0.0 | 0.1 | GO:0031013 | troponin I binding(GO:0031013) |
| 0.0 | 0.2 | GO:0019826 | oxygen sensor activity(GO:0019826) |
| 0.0 | 0.1 | GO:0003945 | N-acetyllactosamine synthase activity(GO:0003945) |
| 0.0 | 0.1 | GO:0044547 | DNA topoisomerase binding(GO:0044547) |
| 0.0 | 0.1 | GO:0008336 | gamma-butyrobetaine dioxygenase activity(GO:0008336) |
| 0.0 | 0.5 | GO:0070034 | telomerase RNA binding(GO:0070034) |
| 0.0 | 0.1 | GO:0050693 | LBD domain binding(GO:0050693) |
| 0.0 | 0.3 | GO:0005522 | profilin binding(GO:0005522) |
| 0.0 | 0.1 | GO:0034046 | poly(G) binding(GO:0034046) |
| 0.0 | 0.1 | GO:0004082 | bisphosphoglycerate mutase activity(GO:0004082) phosphoglycerate mutase activity(GO:0004619) 2,3-bisphosphoglycerate-dependent phosphoglycerate mutase activity(GO:0046538) |
| 0.0 | 0.0 | GO:0034604 | pyruvate dehydrogenase activity(GO:0004738) pyruvate dehydrogenase [NAD(P)+] activity(GO:0034603) pyruvate dehydrogenase (NAD+) activity(GO:0034604) |
| 0.0 | 0.3 | GO:0034185 | apolipoprotein binding(GO:0034185) |
| 0.0 | 0.1 | GO:0099529 | neurotransmitter receptor activity involved in regulation of postsynaptic membrane potential(GO:0099529) transmitter-gated ion channel activity involved in regulation of postsynaptic membrane potential(GO:1904315) |
| 0.0 | 0.1 | GO:0060422 | peptidyl-dipeptidase inhibitor activity(GO:0060422) |
| 0.0 | 0.1 | GO:0071074 | eukaryotic initiation factor eIF2 binding(GO:0071074) |
| 0.0 | 0.1 | GO:0004826 | phenylalanine-tRNA ligase activity(GO:0004826) |
| 0.0 | 0.1 | GO:0046592 | polyamine oxidase activity(GO:0046592) spermine:oxygen oxidoreductase (spermidine-forming) activity(GO:0052901) |
| 0.0 | 0.1 | GO:0004477 | formate-tetrahydrofolate ligase activity(GO:0004329) methenyltetrahydrofolate cyclohydrolase activity(GO:0004477) methylenetetrahydrofolate dehydrogenase (NADP+) activity(GO:0004488) |
| 0.0 | 0.1 | GO:0070735 | protein-glycine ligase activity(GO:0070735) |
| 0.0 | 0.2 | GO:0004861 | cyclin-dependent protein serine/threonine kinase inhibitor activity(GO:0004861) |
| 0.0 | 0.1 | GO:0061649 | ubiquitinated histone binding(GO:0061649) |
| 0.0 | 0.1 | GO:0008665 | 2'-phosphotransferase activity(GO:0008665) |
| 0.0 | 0.1 | GO:0005223 | intracellular cGMP activated cation channel activity(GO:0005223) |
| 0.0 | 0.3 | GO:0008190 | eukaryotic initiation factor 4E binding(GO:0008190) |
| 0.0 | 0.1 | GO:0005005 | transmembrane-ephrin receptor activity(GO:0005005) |
| 0.0 | 0.7 | GO:0046875 | ephrin receptor binding(GO:0046875) |
| 0.0 | 0.1 | GO:0070180 | large ribosomal subunit rRNA binding(GO:0070180) |
| 0.0 | 0.1 | GO:0004667 | prostaglandin-D synthase activity(GO:0004667) |
| 0.0 | 0.1 | GO:0004077 | biotin-[acetyl-CoA-carboxylase] ligase activity(GO:0004077) biotin-[methylcrotonoyl-CoA-carboxylase] ligase activity(GO:0004078) biotin-[methylmalonyl-CoA-carboxytransferase] ligase activity(GO:0004079) biotin-[propionyl-CoA-carboxylase (ATP-hydrolyzing)] ligase activity(GO:0004080) biotin-protein ligase activity(GO:0018271) |
| 0.0 | 0.1 | GO:0004356 | glutamate-ammonia ligase activity(GO:0004356) ammonia ligase activity(GO:0016211) acid-ammonia (or amide) ligase activity(GO:0016880) |
| 0.0 | 0.0 | GO:0042284 | sphingolipid delta-4 desaturase activity(GO:0042284) |
| 0.0 | 0.1 | GO:0008479 | queuine tRNA-ribosyltransferase activity(GO:0008479) |
| 0.0 | 1.4 | GO:0043621 | protein self-association(GO:0043621) |
| 0.0 | 0.0 | GO:0004515 | nicotinate-nucleotide adenylyltransferase activity(GO:0004515) |
| 0.0 | 0.1 | GO:0015288 | porin activity(GO:0015288) |
| 0.0 | 0.1 | GO:0016715 | oxidoreductase activity, acting on paired donors, with incorporation or reduction of molecular oxygen, reduced ascorbate as one donor, and incorporation of one atom of oxygen(GO:0016715) |
| 0.0 | 0.3 | GO:0016493 | C-C chemokine receptor activity(GO:0016493) |
| 0.0 | 0.2 | GO:0005068 | transmembrane receptor protein tyrosine kinase adaptor activity(GO:0005068) |
| 0.0 | 0.4 | GO:0005388 | calcium-transporting ATPase activity(GO:0005388) |
| 0.0 | 0.0 | GO:0005151 | interleukin-1, Type II receptor binding(GO:0005151) |
| 0.0 | 0.3 | GO:0042800 | histone methyltransferase activity (H3-K4 specific)(GO:0042800) |
| 0.0 | 0.1 | GO:0017077 | oxidative phosphorylation uncoupler activity(GO:0017077) |
| 0.0 | 0.3 | GO:0052629 | phosphatidylinositol-3,5-bisphosphate 3-phosphatase activity(GO:0052629) |
| 0.0 | 0.1 | GO:0045127 | N-acetylglucosamine kinase activity(GO:0045127) |
| 0.0 | 0.1 | GO:0004971 | AMPA glutamate receptor activity(GO:0004971) |
| 0.0 | 0.2 | GO:0070324 | thyroid hormone binding(GO:0070324) |
| 0.0 | 0.1 | GO:0097643 | amylin receptor activity(GO:0097643) |
| 0.0 | 0.1 | GO:0045125 | bioactive lipid receptor activity(GO:0045125) |
| 0.0 | 0.2 | GO:0097322 | 7SK snRNA binding(GO:0097322) |
| 0.0 | 0.1 | GO:0004749 | ribose phosphate diphosphokinase activity(GO:0004749) |
| 0.0 | 0.1 | GO:0001517 | N-acetylglucosamine 6-O-sulfotransferase activity(GO:0001517) |
| 0.0 | 0.6 | GO:0017091 | AU-rich element binding(GO:0017091) |
| 0.0 | 0.5 | GO:0043539 | protein serine/threonine kinase activator activity(GO:0043539) |
| 0.0 | 0.0 | GO:0005026 | transforming growth factor beta receptor activity, type II(GO:0005026) |
| 0.0 | 0.0 | GO:0030272 | 5-formyltetrahydrofolate cyclo-ligase activity(GO:0030272) |
| 0.0 | 0.1 | GO:0004310 | farnesyl-diphosphate farnesyltransferase activity(GO:0004310) squalene synthase activity(GO:0051996) |
| 0.0 | 0.5 | GO:0051879 | Hsp90 protein binding(GO:0051879) |
| 0.0 | 0.1 | GO:0008035 | high-density lipoprotein particle binding(GO:0008035) |
| 0.0 | 0.0 | GO:0015173 | aromatic amino acid transmembrane transporter activity(GO:0015173) |
| 0.0 | 0.4 | GO:0004862 | cAMP-dependent protein kinase inhibitor activity(GO:0004862) |
| 0.0 | 0.3 | GO:0023026 | MHC class II protein complex binding(GO:0023026) |
| 0.0 | 0.2 | GO:0097371 | MDM2/MDM4 family protein binding(GO:0097371) |
| 0.0 | 0.1 | GO:0022865 | transmembrane electron transfer carrier(GO:0022865) |
| 0.0 | 0.7 | GO:0035035 | histone acetyltransferase binding(GO:0035035) |
| 0.0 | 0.1 | GO:0031014 | troponin T binding(GO:0031014) |
| 0.0 | 0.2 | GO:0004579 | dolichyl-diphosphooligosaccharide-protein glycotransferase activity(GO:0004579) |
| 0.0 | 0.0 | GO:0031177 | phosphopantetheine binding(GO:0031177) |
| 0.0 | 0.1 | GO:0050816 | phosphothreonine binding(GO:0050816) |
| 0.0 | 0.0 | GO:0004661 | protein geranylgeranyltransferase activity(GO:0004661) |
| 0.0 | 1.3 | GO:0005518 | collagen binding(GO:0005518) |
| 0.0 | 0.0 | GO:0033906 | hyaluronoglucuronidase activity(GO:0033906) |
| 0.0 | 0.0 | GO:0004576 | oligosaccharyl transferase activity(GO:0004576) |
| 0.0 | 0.6 | GO:0004869 | cysteine-type endopeptidase inhibitor activity(GO:0004869) |
| 0.0 | 0.4 | GO:0070530 | K63-linked polyubiquitin binding(GO:0070530) |
| 0.0 | 0.0 | GO:0098918 | structural constituent of synapse(GO:0098918) structural constituent of postsynaptic actin cytoskeleton(GO:0098973) |
| 0.0 | 0.1 | GO:0030369 | ICAM-3 receptor activity(GO:0030369) |
| 0.0 | 0.0 | GO:0008332 | low voltage-gated calcium channel activity(GO:0008332) |
| 0.0 | 0.1 | GO:0030346 | protein phosphatase 2B binding(GO:0030346) |
| 0.0 | 0.0 | GO:0052810 | 1-phosphatidylinositol-5-kinase activity(GO:0052810) |
| 0.0 | 0.1 | GO:0019776 | Atg8 ligase activity(GO:0019776) |
| 0.0 | 0.1 | GO:0003854 | 3-beta-hydroxy-delta5-steroid dehydrogenase activity(GO:0003854) |
| 0.0 | 0.3 | GO:0005344 | oxygen transporter activity(GO:0005344) |
| 0.0 | 0.0 | GO:0019107 | glycylpeptide N-tetradecanoyltransferase activity(GO:0004379) myristoyltransferase activity(GO:0019107) |
| 0.0 | 0.0 | GO:0044378 | non-sequence-specific DNA binding, bending(GO:0044378) |
| 0.0 | 0.9 | GO:0019212 | phosphatase inhibitor activity(GO:0019212) |
| 0.0 | 0.1 | GO:0004706 | JUN kinase kinase kinase activity(GO:0004706) |
| 0.0 | 0.3 | GO:0008239 | dipeptidyl-peptidase activity(GO:0008239) |
| 0.0 | 0.0 | GO:0004047 | aminomethyltransferase activity(GO:0004047) |
| 0.0 | 0.5 | GO:0016417 | S-acyltransferase activity(GO:0016417) |
| 0.0 | 0.0 | GO:0008892 | guanine deaminase activity(GO:0008892) |
| 0.0 | 0.1 | GO:1990239 | steroid hormone binding(GO:1990239) |
| 0.0 | 0.1 | GO:0030618 | transforming growth factor beta receptor, pathway-specific cytoplasmic mediator activity(GO:0030618) |
| 0.0 | 0.1 | GO:0004727 | prenylated protein tyrosine phosphatase activity(GO:0004727) |
| 0.0 | 0.4 | GO:0070566 | adenylyltransferase activity(GO:0070566) |
| 0.0 | 0.3 | GO:0019789 | SUMO transferase activity(GO:0019789) |
| 0.0 | 0.6 | GO:0008138 | protein tyrosine/serine/threonine phosphatase activity(GO:0008138) |
| 0.0 | 0.0 | GO:1902282 | voltage-gated potassium channel activity involved in ventricular cardiac muscle cell action potential repolarization(GO:1902282) |
| 0.0 | 0.0 | GO:0005260 | channel-conductance-controlling ATPase activity(GO:0005260) |
| 0.0 | 0.3 | GO:0070006 | metalloaminopeptidase activity(GO:0070006) |
| 0.0 | 0.1 | GO:0004471 | malate dehydrogenase (decarboxylating) (NAD+) activity(GO:0004471) malate dehydrogenase (decarboxylating) (NADP+) activity(GO:0004473) |
| 0.0 | 0.0 | GO:0036505 | prosaposin receptor activity(GO:0036505) |
| 0.0 | 0.1 | GO:0047499 | calcium-independent phospholipase A2 activity(GO:0047499) |
| 0.0 | 0.2 | GO:0005003 | ephrin receptor activity(GO:0005003) |
| 0.0 | 0.0 | GO:0004638 | phosphoribosylaminoimidazole carboxylase activity(GO:0004638) phosphoribosylaminoimidazolesuccinocarboxamide synthase activity(GO:0004639) |
| 0.0 | 0.4 | GO:0050840 | extracellular matrix binding(GO:0050840) |
| 0.0 | 0.2 | GO:0031435 | mitogen-activated protein kinase kinase kinase binding(GO:0031435) |
| 0.0 | 0.1 | GO:0005353 | fructose transmembrane transporter activity(GO:0005353) |
| 0.0 | 0.1 | GO:0048495 | Roundabout binding(GO:0048495) |
| 0.0 | 0.1 | GO:0008379 | thioredoxin peroxidase activity(GO:0008379) |
| 0.0 | 0.1 | GO:0004957 | prostaglandin E receptor activity(GO:0004957) |
| 0.0 | 0.1 | GO:0003828 | alpha-N-acetylneuraminate alpha-2,8-sialyltransferase activity(GO:0003828) |
| 0.0 | 0.0 | GO:0034040 | lipid-transporting ATPase activity(GO:0034040) |
| 0.0 | 0.0 | GO:0004793 | glycine hydroxymethyltransferase activity(GO:0004372) threonine aldolase activity(GO:0004793) L-allo-threonine aldolase activity(GO:0008732) |
| 0.0 | 0.1 | GO:0060698 | endoribonuclease inhibitor activity(GO:0060698) |
| 0.0 | 3.0 | GO:0004252 | serine-type endopeptidase activity(GO:0004252) |
| 0.0 | 0.0 | GO:0004346 | glucose-6-phosphatase activity(GO:0004346) sugar-terminal-phosphatase activity(GO:0050309) |
| 0.0 | 0.3 | GO:0030371 | translation repressor activity(GO:0030371) |
| 0.0 | 0.1 | GO:0004802 | transketolase activity(GO:0004802) |
| 0.0 | 0.1 | GO:0016886 | ligase activity, forming phosphoric ester bonds(GO:0016886) |
| 0.0 | 0.2 | GO:0017110 | nucleoside-diphosphatase activity(GO:0017110) |
| 0.0 | 0.1 | GO:0004689 | phosphorylase kinase activity(GO:0004689) |
Gene overrepresentation in curated gene sets: canonical pathways category:
| Log-likelihood per target | Total log-likelihood | Term | Description |
|---|---|---|---|
| 0.2 | 11.8 | PID HIV NEF PATHWAY | HIV-1 Nef: Negative effector of Fas and TNF-alpha |
| 0.2 | 0.8 | PID IL3 PATHWAY | IL3-mediated signaling events |
| 0.1 | 5.5 | PID IL12 STAT4 PATHWAY | IL12 signaling mediated by STAT4 |
| 0.1 | 2.7 | PID INTEGRIN5 PATHWAY | Beta5 beta6 beta7 and beta8 integrin cell surface interactions |
| 0.1 | 2.6 | ST G ALPHA S PATHWAY | G alpha s Pathway |
| 0.1 | 0.2 | PID SMAD2 3PATHWAY | Regulation of cytoplasmic and nuclear SMAD2/3 signaling |
| 0.1 | 0.4 | PID TCPTP PATHWAY | Signaling events mediated by TCPTP |
| 0.1 | 1.7 | PID IL5 PATHWAY | IL5-mediated signaling events |
| 0.1 | 2.2 | SA MMP CYTOKINE CONNECTION | Cytokines can induce activation of matrix metalloproteinases, which degrade extracellular matrix. |
| 0.1 | 0.6 | ST IL 13 PATHWAY | Interleukin 13 (IL-13) Pathway |
| 0.1 | 6.0 | PID TGFBR PATHWAY | TGF-beta receptor signaling |
| 0.1 | 0.7 | PID TRAIL PATHWAY | TRAIL signaling pathway |
| 0.1 | 0.4 | PID FAS PATHWAY | FAS (CD95) signaling pathway |
| 0.1 | 1.2 | ST TUMOR NECROSIS FACTOR PATHWAY | Tumor Necrosis Factor Pathway. |
| 0.1 | 3.6 | PID CXCR3 PATHWAY | CXCR3-mediated signaling events |
| 0.1 | 2.0 | PID IL1 PATHWAY | IL1-mediated signaling events |
| 0.0 | 2.7 | PID INTEGRIN3 PATHWAY | Beta3 integrin cell surface interactions |
| 0.0 | 0.1 | SIG PIP3 SIGNALING IN B LYMPHOCYTES | Genes related to PIP3 signaling in B lymphocytes |
| 0.0 | 0.6 | SA G2 AND M PHASES | Cdc25 activates the cdc2/cyclin B complex to induce the G2/M transition. |
| 0.0 | 1.1 | PID SYNDECAN 3 PATHWAY | Syndecan-3-mediated signaling events |
| 0.0 | 0.1 | ST PAC1 RECEPTOR PATHWAY | PAC1 Receptor Pathway |
| 0.0 | 2.6 | PID AURORA B PATHWAY | Aurora B signaling |
| 0.0 | 0.4 | ST JAK STAT PATHWAY | Jak-STAT Pathway |
| 0.0 | 1.7 | PID AMB2 NEUTROPHILS PATHWAY | amb2 Integrin signaling |
| 0.0 | 0.2 | ST G ALPHA I PATHWAY | G alpha i Pathway |
| 0.0 | 2.9 | PID IL4 2PATHWAY | IL4-mediated signaling events |
| 0.0 | 0.8 | PID EPHRINB REV PATHWAY | Ephrin B reverse signaling |
| 0.0 | 1.4 | ST MYOCYTE AD PATHWAY | Myocyte Adrenergic Pathway is a specific case of the generalized Adrenergic Pathway. |
| 0.0 | 1.1 | PID PRL SIGNALING EVENTS PATHWAY | Signaling events mediated by PRL |
| 0.0 | 0.2 | ST INTERFERON GAMMA PATHWAY | Interferon gamma pathway. |
| 0.0 | 1.1 | PID WNT SIGNALING PATHWAY | Wnt signaling network |
| 0.0 | 0.3 | PID RET PATHWAY | Signaling events regulated by Ret tyrosine kinase |
| 0.0 | 0.7 | PID AR NONGENOMIC PATHWAY | Nongenotropic Androgen signaling |
| 0.0 | 1.7 | NABA PROTEOGLYCANS | Genes encoding proteoglycans |
| 0.0 | 0.5 | PID AR TF PATHWAY | Regulation of Androgen receptor activity |
| 0.0 | 1.0 | ST B CELL ANTIGEN RECEPTOR | B Cell Antigen Receptor |
| 0.0 | 0.1 | PID TCR JNK PATHWAY | JNK signaling in the CD4+ TCR pathway |
| 0.0 | 1.2 | PID TXA2PATHWAY | Thromboxane A2 receptor signaling |
| 0.0 | 1.1 | PID NETRIN PATHWAY | Netrin-mediated signaling events |
| 0.0 | 0.4 | PID UPA UPAR PATHWAY | Urokinase-type plasminogen activator (uPA) and uPAR-mediated signaling |
| 0.0 | 0.2 | SA PTEN PATHWAY | PTEN is a tumor suppressor that dephosphorylates the lipid messenger phosphatidylinositol triphosphate. |
| 0.0 | 0.9 | PID CD8 TCR DOWNSTREAM PATHWAY | Downstream signaling in naïve CD8+ T cells |
| 0.0 | 0.8 | PID SYNDECAN 2 PATHWAY | Syndecan-2-mediated signaling events |
| 0.0 | 0.1 | PID S1P S1P1 PATHWAY | S1P1 pathway |
| 0.0 | 0.3 | PID NECTIN PATHWAY | Nectin adhesion pathway |
| 0.0 | 0.4 | SA G1 AND S PHASES | Cdk2, 4, and 6 bind cyclin D in G1, while cdk2/cyclin E promotes the G1/S transition. |
| 0.0 | 0.4 | PID IL6 7 PATHWAY | IL6-mediated signaling events |
| 0.0 | 5.3 | NABA ECM AFFILIATED | Genes encoding proteins affiliated structurally or functionally to extracellular matrix proteins |
| 0.0 | 0.4 | SA REG CASCADE OF CYCLIN EXPR | Expression of cyclins regulates progression through the cell cycle by activating cyclin-dependent kinases. |
| 0.0 | 0.7 | PID INSULIN GLUCOSE PATHWAY | Insulin-mediated glucose transport |
| 0.0 | 0.6 | ST P38 MAPK PATHWAY | p38 MAPK Pathway |
| 0.0 | 0.3 | PID P38 ALPHA BETA PATHWAY | Regulation of p38-alpha and p38-beta |
| 0.0 | 1.1 | PID TAP63 PATHWAY | Validated transcriptional targets of TAp63 isoforms |
| 0.0 | 0.2 | PID RANBP2 PATHWAY | Sumoylation by RanBP2 regulates transcriptional repression |
| 0.0 | 0.4 | PID TNF PATHWAY | TNF receptor signaling pathway |
| 0.0 | 0.7 | NABA BASEMENT MEMBRANES | Genes encoding structural components of basement membranes |
| 0.0 | 0.2 | PID NCADHERIN PATHWAY | N-cadherin signaling events |
| 0.0 | 0.6 | PID NFAT 3PATHWAY | Role of Calcineurin-dependent NFAT signaling in lymphocytes |
| 0.0 | 0.4 | PID EPHA FWDPATHWAY | EPHA forward signaling |
| 0.0 | 0.2 | PID ANGIOPOIETIN RECEPTOR PATHWAY | Angiopoietin receptor Tie2-mediated signaling |
| 0.0 | 5.1 | NABA ECM REGULATORS | Genes encoding enzymes and their regulators involved in the remodeling of the extracellular matrix |
| 0.0 | 0.5 | PID RHOA PATHWAY | RhoA signaling pathway |
| 0.0 | 0.5 | PID PS1 PATHWAY | Presenilin action in Notch and Wnt signaling |
| 0.0 | 0.5 | PID KIT PATHWAY | Signaling events mediated by Stem cell factor receptor (c-Kit) |
| 0.0 | 0.9 | PID FOXO PATHWAY | FoxO family signaling |
| 0.0 | 3.4 | NABA ECM GLYCOPROTEINS | Genes encoding structural ECM glycoproteins |
| 0.0 | 0.3 | PID HEDGEHOG 2PATHWAY | Signaling events mediated by the Hedgehog family |
| 0.0 | 5.7 | NABA SECRETED FACTORS | Genes encoding secreted soluble factors |
| 0.0 | 1.4 | PID PDGFRB PATHWAY | PDGFR-beta signaling pathway |
| 0.0 | 0.8 | PID RAC1 REG PATHWAY | Regulation of RAC1 activity |
| 0.0 | 0.2 | PID INTEGRIN A9B1 PATHWAY | Alpha9 beta1 integrin signaling events |
| 0.0 | 0.1 | PID AVB3 INTEGRIN PATHWAY | Integrins in angiogenesis |
| 0.0 | 0.0 | PID S1P S1P4 PATHWAY | S1P4 pathway |
| 0.0 | 0.1 | PID CD40 PATHWAY | CD40/CD40L signaling |
| 0.0 | 0.2 | PID NFKAPPAB CANONICAL PATHWAY | Canonical NF-kappaB pathway |
| 0.0 | 0.4 | ST FAS SIGNALING PATHWAY | Fas Signaling Pathway |
| 0.0 | 0.5 | NABA MATRISOME | Ensemble of genes encoding extracellular matrix and extracellular matrix-associated proteins |
| 0.0 | 0.6 | PID CDC42 PATHWAY | CDC42 signaling events |
| 0.0 | 0.3 | PID FGF PATHWAY | FGF signaling pathway |
| 0.0 | 0.4 | PID TRKR PATHWAY | Neurotrophic factor-mediated Trk receptor signaling |
| 0.0 | 0.0 | PID WNT NONCANONICAL PATHWAY | Noncanonical Wnt signaling pathway |
Gene overrepresentation in curated gene sets: REACTOME pathways category:
| Log-likelihood per target | Total log-likelihood | Term | Description |
|---|---|---|---|
| 0.2 | 2.7 | REACTOME ENDOSOMAL VACUOLAR PATHWAY | Genes involved in Endosomal/Vacuolar pathway |
| 0.1 | 3.4 | REACTOME EXTRINSIC PATHWAY FOR APOPTOSIS | Genes involved in Extrinsic Pathway for Apoptosis |
| 0.1 | 6.8 | REACTOME CHEMOKINE RECEPTORS BIND CHEMOKINES | Genes involved in Chemokine receptors bind chemokines |
| 0.1 | 1.7 | REACTOME ANTIGEN PRESENTATION FOLDING ASSEMBLY AND PEPTIDE LOADING OF CLASS I MHC | Genes involved in Antigen Presentation: Folding, assembly and peptide loading of class I MHC |
| 0.1 | 3.3 | REACTOME NOD1 2 SIGNALING PATHWAY | Genes involved in NOD1/2 Signaling Pathway |
| 0.1 | 3.4 | REACTOME IL RECEPTOR SHC SIGNALING | Genes involved in Interleukin receptor SHC signaling |
| 0.1 | 4.5 | REACTOME INTERFERON GAMMA SIGNALING | Genes involved in Interferon gamma signaling |
| 0.1 | 2.4 | REACTOME SIGNALING BY NODAL | Genes involved in Signaling by NODAL |
| 0.1 | 0.6 | REACTOME IL 7 SIGNALING | Genes involved in Interleukin-7 signaling |
| 0.1 | 2.9 | REACTOME INTRINSIC PATHWAY FOR APOPTOSIS | Genes involved in Intrinsic Pathway for Apoptosis |
| 0.1 | 0.7 | REACTOME ROLE OF SECOND MESSENGERS IN NETRIN1 SIGNALING | Genes involved in Role of second messengers in netrin-1 signaling |
| 0.1 | 1.6 | REACTOME BETA DEFENSINS | Genes involved in Beta defensins |
| 0.1 | 0.2 | REACTOME BINDING AND ENTRY OF HIV VIRION | Genes involved in Binding and entry of HIV virion |
| 0.1 | 1.0 | REACTOME SIGNALING BY NOTCH2 | Genes involved in Signaling by NOTCH2 |
| 0.1 | 0.2 | REACTOME NUCLEAR EVENTS KINASE AND TRANSCRIPTION FACTOR ACTIVATION | Genes involved in Nuclear Events (kinase and transcription factor activation) |
| 0.1 | 0.9 | REACTOME REVERSIBLE HYDRATION OF CARBON DIOXIDE | Genes involved in Reversible Hydration of Carbon Dioxide |
| 0.1 | 1.0 | REACTOME SPRY REGULATION OF FGF SIGNALING | Genes involved in Spry regulation of FGF signaling |
| 0.1 | 0.8 | REACTOME SHC1 EVENTS IN EGFR SIGNALING | Genes involved in SHC1 events in EGFR signaling |
| 0.0 | 5.0 | REACTOME INTERFERON ALPHA BETA SIGNALING | Genes involved in Interferon alpha/beta signaling |
| 0.0 | 2.1 | REACTOME A TETRASACCHARIDE LINKER SEQUENCE IS REQUIRED FOR GAG SYNTHESIS | Genes involved in A tetrasaccharide linker sequence is required for GAG synthesis |
| 0.0 | 0.9 | REACTOME TRANSPORT OF ORGANIC ANIONS | Genes involved in Transport of organic anions |
| 0.0 | 0.8 | REACTOME TRAF6 MEDIATED IRF7 ACTIVATION | Genes involved in TRAF6 mediated IRF7 activation |
| 0.0 | 1.0 | REACTOME SIGNAL REGULATORY PROTEIN SIRP FAMILY INTERACTIONS | Genes involved in Signal regulatory protein (SIRP) family interactions |
| 0.0 | 1.7 | REACTOME IL1 SIGNALING | Genes involved in Interleukin-1 signaling |
| 0.0 | 0.0 | REACTOME APC CDC20 MEDIATED DEGRADATION OF NEK2A | Genes involved in APC-Cdc20 mediated degradation of Nek2A |
| 0.0 | 0.6 | REACTOME MRNA DECAY BY 3 TO 5 EXORIBONUCLEASE | Genes involved in mRNA Decay by 3' to 5' Exoribonuclease |
| 0.0 | 1.7 | REACTOME EFFECTS OF PIP2 HYDROLYSIS | Genes involved in Effects of PIP2 hydrolysis |
| 0.0 | 4.1 | REACTOME AMINO ACID AND OLIGOPEPTIDE SLC TRANSPORTERS | Genes involved in Amino acid and oligopeptide SLC transporters |
| 0.0 | 0.6 | REACTOME NEF MEDIATED DOWNREGULATION OF MHC CLASS I COMPLEX CELL SURFACE EXPRESSION | Genes involved in Nef mediated downregulation of MHC class I complex cell surface expression |
| 0.0 | 0.7 | REACTOME XENOBIOTICS | Genes involved in Xenobiotics |
| 0.0 | 0.7 | REACTOME TANDEM PORE DOMAIN POTASSIUM CHANNELS | Genes involved in Tandem pore domain potassium channels |
| 0.0 | 0.4 | REACTOME REGULATION OF SIGNALING BY CBL | Genes involved in Regulation of signaling by CBL |
| 0.0 | 1.0 | REACTOME CYTOSOLIC SULFONATION OF SMALL MOLECULES | Genes involved in Cytosolic sulfonation of small molecules |
| 0.0 | 1.3 | REACTOME G0 AND EARLY G1 | Genes involved in G0 and Early G1 |
| 0.0 | 0.2 | REACTOME ACYL CHAIN REMODELLING OF PG | Genes involved in Acyl chain remodelling of PG |
| 0.0 | 1.1 | REACTOME RORA ACTIVATES CIRCADIAN EXPRESSION | Genes involved in RORA Activates Circadian Expression |
| 0.0 | 5.4 | REACTOME OLFACTORY SIGNALING PATHWAY | Genes involved in Olfactory Signaling Pathway |
| 0.0 | 2.3 | REACTOME SCFSKP2 MEDIATED DEGRADATION OF P27 P21 | Genes involved in SCF(Skp2)-mediated degradation of p27/p21 |
| 0.0 | 0.5 | REACTOME PD1 SIGNALING | Genes involved in PD-1 signaling |
| 0.0 | 0.4 | REACTOME TIE2 SIGNALING | Genes involved in Tie2 Signaling |
| 0.0 | 1.8 | REACTOME SMOOTH MUSCLE CONTRACTION | Genes involved in Smooth Muscle Contraction |
| 0.0 | 0.7 | REACTOME ENDOGENOUS STEROLS | Genes involved in Endogenous sterols |
| 0.0 | 0.4 | REACTOME OPSINS | Genes involved in Opsins |
| 0.0 | 1.0 | REACTOME TERMINATION OF O GLYCAN BIOSYNTHESIS | Genes involved in Termination of O-glycan biosynthesis |
| 0.0 | 1.2 | REACTOME CHOLESTEROL BIOSYNTHESIS | Genes involved in Cholesterol biosynthesis |
| 0.0 | 0.6 | REACTOME SYNTHESIS OF PE | Genes involved in Synthesis of PE |
| 0.0 | 0.6 | REACTOME ACTIVATION OF RAC | Genes involved in Activation of Rac |
| 0.0 | 1.8 | REACTOME ION TRANSPORT BY P TYPE ATPASES | Genes involved in Ion transport by P-type ATPases |
| 0.0 | 0.6 | REACTOME GLUCURONIDATION | Genes involved in Glucuronidation |
| 0.0 | 0.6 | REACTOME METABOLISM OF POLYAMINES | Genes involved in Metabolism of polyamines |
| 0.0 | 0.0 | REACTOME VIF MEDIATED DEGRADATION OF APOBEC3G | Genes involved in Vif-mediated degradation of APOBEC3G |
| 0.0 | 0.3 | REACTOME N GLYCAN TRIMMING IN THE ER AND CALNEXIN CALRETICULIN CYCLE | Genes involved in N-glycan trimming in the ER and Calnexin/Calreticulin cycle |
| 0.0 | 0.6 | REACTOME INITIAL TRIGGERING OF COMPLEMENT | Genes involved in Initial triggering of complement |
| 0.0 | 0.3 | REACTOME COPI MEDIATED TRANSPORT | Genes involved in COPI Mediated Transport |
| 0.0 | 0.2 | REACTOME HEMOSTASIS | Genes involved in Hemostasis |
| 0.0 | 1.5 | REACTOME COSTIMULATION BY THE CD28 FAMILY | Genes involved in Costimulation by the CD28 family |
| 0.0 | 0.8 | REACTOME FORMATION OF TUBULIN FOLDING INTERMEDIATES BY CCT TRIC | Genes involved in Formation of tubulin folding intermediates by CCT/TriC |
| 0.0 | 0.6 | REACTOME INTRINSIC PATHWAY | Genes involved in Intrinsic Pathway |
| 0.0 | 0.9 | REACTOME OXYGEN DEPENDENT PROLINE HYDROXYLATION OF HYPOXIA INDUCIBLE FACTOR ALPHA | Genes involved in Oxygen-dependent Proline Hydroxylation of Hypoxia-inducible Factor Alpha |
| 0.0 | 0.3 | REACTOME ROLE OF DCC IN REGULATING APOPTOSIS | Genes involved in Role of DCC in regulating apoptosis |
| 0.0 | 0.6 | REACTOME OTHER SEMAPHORIN INTERACTIONS | Genes involved in Other semaphorin interactions |
| 0.0 | 0.4 | REACTOME SYNTHESIS OF SUBSTRATES IN N GLYCAN BIOSYTHESIS | Genes involved in Synthesis of substrates in N-glycan biosythesis |
| 0.0 | 0.6 | REACTOME KERATAN SULFATE BIOSYNTHESIS | Genes involved in Keratan sulfate biosynthesis |
| 0.0 | 2.4 | REACTOME INTEGRIN CELL SURFACE INTERACTIONS | Genes involved in Integrin cell surface interactions |
| 0.0 | 1.1 | REACTOME CGMP EFFECTS | Genes involved in cGMP effects |
| 0.0 | 0.1 | REACTOME RAS ACTIVATION UOPN CA2 INFUX THROUGH NMDA RECEPTOR | Genes involved in Ras activation uopn Ca2+ infux through NMDA receptor |
| 0.0 | 0.4 | REACTOME NA CL DEPENDENT NEUROTRANSMITTER TRANSPORTERS | Genes involved in Na+/Cl- dependent neurotransmitter transporters |
| 0.0 | 0.4 | REACTOME BMAL1 CLOCK NPAS2 ACTIVATES CIRCADIAN EXPRESSION | Genes involved in BMAL1:CLOCK/NPAS2 Activates Circadian Expression |
| 0.0 | 0.3 | REACTOME CHYLOMICRON MEDIATED LIPID TRANSPORT | Genes involved in Chylomicron-mediated lipid transport |
| 0.0 | 0.6 | REACTOME PERK REGULATED GENE EXPRESSION | Genes involved in PERK regulated gene expression |
| 0.0 | 0.2 | REACTOME ANTIGEN PROCESSING CROSS PRESENTATION | Genes involved in Antigen processing-Cross presentation |
| 0.0 | 0.2 | REACTOME HORMONE LIGAND BINDING RECEPTORS | Genes involved in Hormone ligand-binding receptors |
| 0.0 | 0.7 | REACTOME SYNTHESIS OF VERY LONG CHAIN FATTY ACYL COAS | Genes involved in Synthesis of very long-chain fatty acyl-CoAs |
| 0.0 | 0.1 | REACTOME DESTABILIZATION OF MRNA BY KSRP | Genes involved in Destabilization of mRNA by KSRP |
| 0.0 | 0.2 | REACTOME ANDROGEN BIOSYNTHESIS | Genes involved in Androgen biosynthesis |
| 0.0 | 0.4 | REACTOME FGFR4 LIGAND BINDING AND ACTIVATION | Genes involved in FGFR4 ligand binding and activation |
| 0.0 | 0.2 | REACTOME UNBLOCKING OF NMDA RECEPTOR GLUTAMATE BINDING AND ACTIVATION | Genes involved in Unblocking of NMDA receptor, glutamate binding and activation |
| 0.0 | 0.5 | REACTOME SYNTHESIS OF PIPS AT THE GOLGI MEMBRANE | Genes involved in Synthesis of PIPs at the Golgi membrane |
| 0.0 | 0.3 | REACTOME ACTIVATION OF NF KAPPAB IN B CELLS | Genes involved in Activation of NF-kappaB in B Cells |
| 0.0 | 0.4 | REACTOME HS GAG BIOSYNTHESIS | Genes involved in HS-GAG biosynthesis |
| 0.0 | 0.1 | REACTOME REGULATION OF KIT SIGNALING | Genes involved in Regulation of KIT signaling |
| 0.0 | 0.6 | REACTOME INSULIN SYNTHESIS AND PROCESSING | Genes involved in Insulin Synthesis and Processing |
| 0.0 | 0.3 | REACTOME AMINE COMPOUND SLC TRANSPORTERS | Genes involved in Amine compound SLC transporters |
| 0.0 | 0.4 | REACTOME CLASS C 3 METABOTROPIC GLUTAMATE PHEROMONE RECEPTORS | Genes involved in Class C/3 (Metabotropic glutamate/pheromone receptors) |
| 0.0 | 0.2 | REACTOME REGULATION OF ORNITHINE DECARBOXYLASE ODC | Genes involved in Regulation of ornithine decarboxylase (ODC) |
| 0.0 | 0.3 | REACTOME PASSIVE TRANSPORT BY AQUAPORINS | Genes involved in Passive Transport by Aquaporins |
| 0.0 | 0.1 | REACTOME ER PHAGOSOME PATHWAY | Genes involved in ER-Phagosome pathway |
| 0.0 | 0.0 | REACTOME PLATELET ADHESION TO EXPOSED COLLAGEN | Genes involved in Platelet Adhesion to exposed collagen |
| 0.0 | 0.8 | REACTOME ABC FAMILY PROTEINS MEDIATED TRANSPORT | Genes involved in ABC-family proteins mediated transport |
| 0.0 | 0.1 | REACTOME DESTABILIZATION OF MRNA BY BRF1 | Genes involved in Destabilization of mRNA by Butyrate Response Factor 1 (BRF1) |
| 0.0 | 0.1 | REACTOME SCF BETA TRCP MEDIATED DEGRADATION OF EMI1 | Genes involved in SCF-beta-TrCP mediated degradation of Emi1 |
| 0.0 | 0.6 | REACTOME KINESINS | Genes involved in Kinesins |
| 0.0 | 1.9 | REACTOME RESPONSE TO ELEVATED PLATELET CYTOSOLIC CA2 | Genes involved in Response to elevated platelet cytosolic Ca2+ |
| 0.0 | 0.0 | REACTOME REGULATION OF INSULIN SECRETION BY GLUCAGON LIKE PEPTIDE1 | Genes involved in Regulation of Insulin Secretion by Glucagon-like Peptide-1 |
| 0.0 | 0.5 | REACTOME NETRIN1 SIGNALING | Genes involved in Netrin-1 signaling |
| 0.0 | 0.1 | REACTOME FGFR2C LIGAND BINDING AND ACTIVATION | Genes involved in FGFR2c ligand binding and activation |
| 0.0 | 0.2 | REACTOME PROSTANOID LIGAND RECEPTORS | Genes involved in Prostanoid ligand receptors |
| 0.0 | 0.0 | REACTOME TRANSPORT OF MATURE MRNA DERIVED FROM AN INTRONLESS TRANSCRIPT | Genes involved in Transport of Mature mRNA Derived from an Intronless Transcript |
| 0.0 | 0.1 | REACTOME HORMONE SENSITIVE LIPASE HSL MEDIATED TRIACYLGLYCEROL HYDROLYSIS | Genes involved in Hormone-sensitive lipase (HSL)-mediated triacylglycerol hydrolysis |
| 0.0 | 0.3 | REACTOME METABOLISM OF STEROID HORMONES AND VITAMINS A AND D | Genes involved in Metabolism of steroid hormones and vitamins A and D |
| 0.0 | 0.2 | REACTOME MICRORNA MIRNA BIOGENESIS | Genes involved in MicroRNA (miRNA) Biogenesis |
| 0.0 | 0.3 | REACTOME NONSENSE MEDIATED DECAY ENHANCED BY THE EXON JUNCTION COMPLEX | Genes involved in Nonsense Mediated Decay Enhanced by the Exon Junction Complex |
| 0.0 | 0.2 | REACTOME UNWINDING OF DNA | Genes involved in Unwinding of DNA |
| 0.0 | 0.1 | REACTOME SIGNALING BY ERBB2 | Genes involved in Signaling by ERBB2 |
| 0.0 | 2.3 | REACTOME MRNA SPLICING | Genes involved in mRNA Splicing |
| 0.0 | 0.2 | REACTOME TGF BETA RECEPTOR SIGNALING IN EMT EPITHELIAL TO MESENCHYMAL TRANSITION | Genes involved in TGF-beta receptor signaling in EMT (epithelial to mesenchymal transition) |
| 0.0 | 0.2 | REACTOME TRYPTOPHAN CATABOLISM | Genes involved in Tryptophan catabolism |
| 0.0 | 0.1 | REACTOME PACKAGING OF TELOMERE ENDS | Genes involved in Packaging Of Telomere Ends |
| 0.0 | 0.2 | REACTOME PLATELET CALCIUM HOMEOSTASIS | Genes involved in Platelet calcium homeostasis |
| 0.0 | 0.1 | REACTOME CYCLIN A B1 ASSOCIATED EVENTS DURING G2 M TRANSITION | Genes involved in Cyclin A/B1 associated events during G2/M transition |
| 0.0 | 0.0 | REACTOME G ALPHA1213 SIGNALLING EVENTS | Genes involved in G alpha (12/13) signalling events |
| 0.0 | 0.5 | REACTOME TRANSPORT OF RIBONUCLEOPROTEINS INTO THE HOST NUCLEUS | Genes involved in Transport of Ribonucleoproteins into the Host Nucleus |
| 0.0 | 0.3 | REACTOME ORGANIC CATION ANION ZWITTERION TRANSPORT | Genes involved in Organic cation/anion/zwitterion transport |
| 0.0 | 0.5 | REACTOME TIGHT JUNCTION INTERACTIONS | Genes involved in Tight junction interactions |
| 0.0 | 0.4 | REACTOME DEGRADATION OF THE EXTRACELLULAR MATRIX | Genes involved in Degradation of the extracellular matrix |
| 0.0 | 0.4 | REACTOME SYNTHESIS SECRETION AND INACTIVATION OF GIP | Genes involved in Synthesis, Secretion, and Inactivation of Glucose-dependent Insulinotropic Polypeptide (GIP) |
| 0.0 | 0.1 | REACTOME MEMBRANE BINDING AND TARGETTING OF GAG PROTEINS | Genes involved in Membrane binding and targetting of GAG proteins |
| 0.0 | 0.3 | REACTOME IONOTROPIC ACTIVITY OF KAINATE RECEPTORS | Genes involved in Ionotropic activity of Kainate Receptors |
| 0.0 | 0.0 | REACTOME ACTIVATION OF THE PRE REPLICATIVE COMPLEX | Genes involved in Activation of the pre-replicative complex |
| 0.0 | 0.1 | REACTOME PREFOLDIN MEDIATED TRANSFER OF SUBSTRATE TO CCT TRIC | Genes involved in Prefoldin mediated transfer of substrate to CCT/TriC |
| 0.0 | 0.7 | REACTOME ACTIVATION OF CHAPERONE GENES BY XBP1S | Genes involved in Activation of Chaperone Genes by XBP1(S) |
| 0.0 | 0.3 | REACTOME DARPP 32 EVENTS | Genes involved in DARPP-32 events |
| 0.0 | 0.4 | REACTOME REGULATION OF MITOTIC CELL CYCLE | Genes involved in Regulation of mitotic cell cycle |
| 0.0 | 0.1 | REACTOME FATTY ACYL COA BIOSYNTHESIS | Genes involved in Fatty Acyl-CoA Biosynthesis |