Project
Inflammatory response time course, HUVEC (Wada, 2009)
Navigation
Downloads
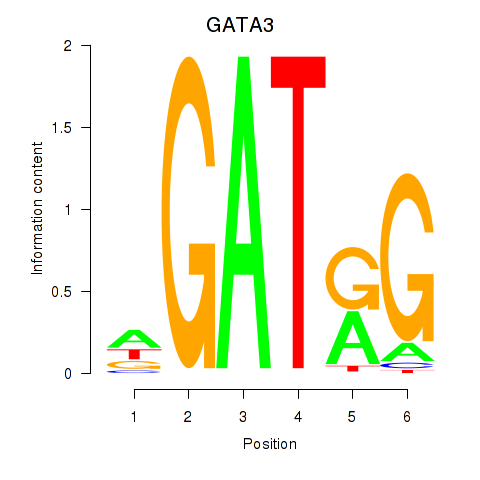
Results for GATA3
Z-value: 1.63
Motif logo
Transcription factors associated with GATA3
| Gene Symbol | Gene ID | Gene Info |
|---|---|---|
|
GATA3
|
ENSG00000107485.18 | GATA3 |
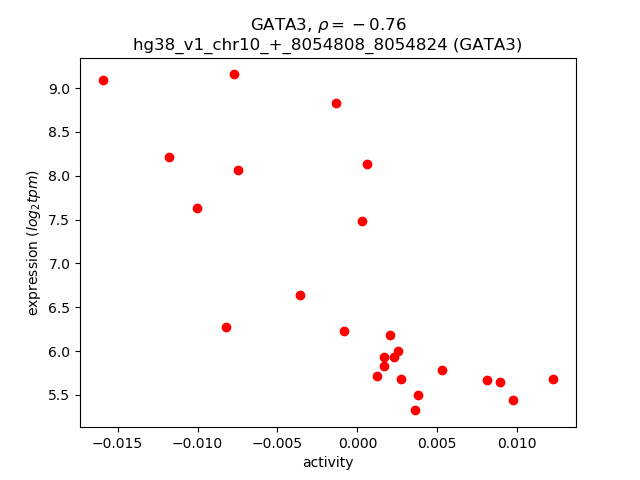
Activity-expression correlation:
| Gene | Promoter | Pearson corr. coef. | P-value | Plot |
|---|---|---|---|---|
| GATA3 | hg38_v1_chr10_+_8054808_8054824 | -0.76 | 1.0e-05 | Click! |
Activity profile of GATA3 motif
Sorted Z-values of GATA3 motif
Network of associatons between targets according to the STRING database.

First level regulatory network of GATA3
| Promoter | Score | Transcript | Gene | Gene Info |
|---|---|---|---|---|
| chr10_-_48652493 | 4.67 |
ENST00000435790.6
|
ARHGAP22
|
Rho GTPase activating protein 22 |
| chr2_+_227813834 | 4.65 |
ENST00000358813.5
ENST00000409189.7 |
CCL20
|
C-C motif chemokine ligand 20 |
| chr2_-_224982420 | 4.50 |
ENST00000645028.1
|
DOCK10
|
dedicator of cytokinesis 10 |
| chr4_+_73740541 | 4.12 |
ENST00000401931.1
ENST00000307407.8 |
CXCL8
|
C-X-C motif chemokine ligand 8 |
| chr5_-_147401591 | 4.03 |
ENST00000520473.1
|
DPYSL3
|
dihydropyrimidinase like 3 |
| chr6_+_32844789 | 3.93 |
ENST00000414474.5
|
PSMB9
|
proteasome 20S subunit beta 9 |
| chr5_+_132073782 | 3.43 |
ENST00000296871.4
|
CSF2
|
colony stimulating factor 2 |
| chr3_-_127822455 | 3.26 |
ENST00000265052.10
|
MGLL
|
monoglyceride lipase |
| chr15_+_67125707 | 3.26 |
ENST00000540846.6
|
SMAD3
|
SMAD family member 3 |
| chr7_-_93148345 | 3.22 |
ENST00000437805.5
ENST00000446959.5 ENST00000439952.5 ENST00000414791.5 ENST00000446033.1 ENST00000411955.5 ENST00000318238.9 |
SAMD9L
|
sterile alpha motif domain containing 9 like |
| chr2_-_89213917 | 3.13 |
ENST00000498435.1
|
IGKV1-27
|
immunoglobulin kappa variable 1-27 |
| chr6_-_29559724 | 3.11 |
ENST00000377050.5
|
UBD
|
ubiquitin D |
| chr5_-_160685379 | 3.05 |
ENST00000642502.1
|
ATP10B
|
ATPase phospholipid transporting 10B (putative) |
| chr19_+_10086787 | 3.03 |
ENST00000590378.5
ENST00000397881.7 |
SHFL
|
shiftless antiviral inhibitor of ribosomal frameshifting |
| chr15_+_67067780 | 3.00 |
ENST00000679624.1
|
SMAD3
|
SMAD family member 3 |
| chr11_-_102798148 | 2.95 |
ENST00000315274.7
|
MMP1
|
matrix metallopeptidase 1 |
| chr9_-_120914549 | 2.84 |
ENST00000546084.5
|
TRAF1
|
TNF receptor associated factor 1 |
| chr5_-_151087131 | 2.82 |
ENST00000315050.11
ENST00000523338.5 ENST00000522100.5 |
TNIP1
|
TNFAIP3 interacting protein 1 |
| chr19_+_4229502 | 2.81 |
ENST00000221847.6
|
EBI3
|
Epstein-Barr virus induced 3 |
| chr6_-_159745186 | 2.78 |
ENST00000537657.5
|
SOD2
|
superoxide dismutase 2 |
| chr15_+_88635626 | 2.76 |
ENST00000379224.10
|
ISG20
|
interferon stimulated exonuclease gene 20 |
| chr12_-_52385649 | 2.65 |
ENST00000257951.3
|
KRT84
|
keratin 84 |
| chr1_+_212565334 | 2.64 |
ENST00000366981.8
ENST00000366987.6 |
ATF3
|
activating transcription factor 3 |
| chr1_-_120051714 | 2.63 |
ENST00000579475.7
|
NOTCH2
|
notch receptor 2 |
| chr3_-_127736329 | 2.54 |
ENST00000398101.7
|
MGLL
|
monoglyceride lipase |
| chr6_-_31582415 | 2.52 |
ENST00000429299.3
ENST00000446745.2 |
LTB
|
lymphotoxin beta |
| chr11_+_19712823 | 2.48 |
ENST00000396085.6
ENST00000349880.9 |
NAV2
|
neuron navigator 2 |
| chr16_-_75556214 | 2.40 |
ENST00000568377.5
ENST00000565067.5 ENST00000258173.11 |
TMEM231
|
transmembrane protein 231 |
| chr8_+_53851786 | 2.38 |
ENST00000297313.8
ENST00000344277.10 |
RGS20
|
regulator of G protein signaling 20 |
| chr11_+_35180342 | 2.38 |
ENST00000639002.1
|
CD44
|
CD44 molecule (Indian blood group) |
| chr6_-_29628038 | 2.37 |
ENST00000355973.7
ENST00000377012.8 |
GABBR1
|
gamma-aminobutyric acid type B receptor subunit 1 |
| chr1_+_161722659 | 2.32 |
ENST00000336830.9
ENST00000367944.3 ENST00000367945.5 ENST00000367946.7 |
FCRLB
|
Fc receptor like B |
| chr5_-_59216826 | 2.31 |
ENST00000638939.1
|
PDE4D
|
phosphodiesterase 4D |
| chr11_+_35180279 | 2.28 |
ENST00000531873.5
|
CD44
|
CD44 molecule (Indian blood group) |
| chr7_+_143222037 | 2.23 |
ENST00000408947.4
|
TAS2R40
|
taste 2 receptor member 40 |
| chr3_+_53168687 | 2.21 |
ENST00000650940.1
ENST00000654719.1 |
PRKCD
|
protein kinase C delta |
| chr1_+_78620432 | 2.20 |
ENST00000370751.10
ENST00000459784.6 ENST00000680110.1 ENST00000680295.1 |
IFI44L
|
interferon induced protein 44 like |
| chr19_-_51024211 | 2.20 |
ENST00000593681.5
|
KLK11
|
kallikrein related peptidase 11 |
| chr16_-_11587450 | 2.13 |
ENST00000571688.5
|
LITAF
|
lipopolysaccharide induced TNF factor |
| chr17_+_32991844 | 2.13 |
ENST00000269053.8
|
SPACA3
|
sperm acrosome associated 3 |
| chr5_-_151093566 | 2.11 |
ENST00000521001.1
|
TNIP1
|
TNFAIP3 interacting protein 1 |
| chr17_+_43006740 | 2.11 |
ENST00000438323.2
ENST00000415816.7 |
IFI35
|
interferon induced protein 35 |
| chrX_+_129779930 | 2.10 |
ENST00000356892.4
|
SASH3
|
SAM and SH3 domain containing 3 |
| chr20_-_45547648 | 2.07 |
ENST00000651288.1
|
EPPIN-WFDC6
|
EPPIN-WFDC6 readthrough |
| chr21_+_42219123 | 2.05 |
ENST00000398449.8
|
ABCG1
|
ATP binding cassette subfamily G member 1 |
| chr11_-_55936400 | 2.04 |
ENST00000301532.3
|
OR5I1
|
olfactory receptor family 5 subfamily I member 1 |
| chr16_-_11587162 | 2.02 |
ENST00000570904.5
ENST00000574701.5 |
LITAF
|
lipopolysaccharide induced TNF factor |
| chr12_+_121132869 | 1.99 |
ENST00000328963.10
|
P2RX7
|
purinergic receptor P2X 7 |
| chr2_+_126656128 | 1.99 |
ENST00000259254.9
ENST00000409836.3 ENST00000356887.12 |
GYPC
|
glycophorin C (Gerbich blood group) |
| chr19_+_18173804 | 1.98 |
ENST00000407280.4
|
IFI30
|
IFI30 lysosomal thiol reductase |
| chr3_-_79019444 | 1.96 |
ENST00000618833.4
ENST00000436010.6 ENST00000618846.4 |
ROBO1
|
roundabout guidance receptor 1 |
| chr5_+_114362286 | 1.96 |
ENST00000610748.4
ENST00000264773.7 |
KCNN2
|
potassium calcium-activated channel subfamily N member 2 |
| chr1_+_205257180 | 1.95 |
ENST00000330675.12
|
TMCC2
|
transmembrane and coiled-coil domain family 2 |
| chr15_-_79971164 | 1.93 |
ENST00000335661.6
ENST00000267953.4 ENST00000677151.1 |
BCL2A1
|
BCL2 related protein A1 |
| chr11_+_5389377 | 1.93 |
ENST00000328611.5
|
OR51M1
|
olfactory receptor family 51 subfamily M member 1 |
| chr5_+_132257670 | 1.92 |
ENST00000253754.8
ENST00000379018.7 |
PDLIM4
|
PDZ and LIM domain 4 |
| chr21_+_42219111 | 1.90 |
ENST00000450121.5
ENST00000361802.6 |
ABCG1
|
ATP binding cassette subfamily G member 1 |
| chr1_+_205227889 | 1.85 |
ENST00000358024.8
|
TMCC2
|
transmembrane and coiled-coil domain family 2 |
| chr11_+_64206663 | 1.85 |
ENST00000544997.5
ENST00000345728.10 ENST00000279227.9 |
FERMT3
|
fermitin family member 3 |
| chr6_+_29100609 | 1.84 |
ENST00000377171.3
|
OR2J1
|
olfactory receptor family 2 subfamily J member 1 |
| chr12_-_57129001 | 1.80 |
ENST00000556155.5
|
STAT6
|
signal transducer and activator of transcription 6 |
| chr14_+_54754821 | 1.79 |
ENST00000555192.1
|
SAMD4A
|
sterile alpha motif domain containing 4A |
| chr11_-_72785932 | 1.78 |
ENST00000539138.1
ENST00000542989.5 |
STARD10
|
StAR related lipid transfer domain containing 10 |
| chr1_-_173050931 | 1.76 |
ENST00000404377.5
|
TNFSF18
|
TNF superfamily member 18 |
| chr10_+_72692125 | 1.72 |
ENST00000373053.7
ENST00000357157.10 |
MCU
|
mitochondrial calcium uniporter |
| chr10_-_5978022 | 1.72 |
ENST00000525219.6
|
IL15RA
|
interleukin 15 receptor subunit alpha |
| chr1_-_169734064 | 1.70 |
ENST00000333360.12
|
SELE
|
selectin E |
| chr1_-_149936324 | 1.69 |
ENST00000369140.7
|
MTMR11
|
myotubularin related protein 11 |
| chr10_+_113709261 | 1.67 |
ENST00000672138.1
ENST00000452490.3 |
CASP7
|
caspase 7 |
| chr4_+_141636923 | 1.66 |
ENST00000529613.5
|
IL15
|
interleukin 15 |
| chr6_-_44265541 | 1.66 |
ENST00000619360.6
|
NFKBIE
|
NFKB inhibitor epsilon |
| chr12_+_112907006 | 1.66 |
ENST00000680455.1
ENST00000551241.6 ENST00000550689.2 ENST00000679841.1 ENST00000679494.1 ENST00000553185.2 |
OAS1
|
2'-5'-oligoadenylate synthetase 1 |
| chr21_+_41426197 | 1.66 |
ENST00000680942.1
ENST00000288383.11 ENST00000679386.1 |
MX1
|
MX dynamin like GTPase 1 |
| chr5_-_170389349 | 1.64 |
ENST00000274629.9
|
KCNMB1
|
potassium calcium-activated channel subfamily M regulatory beta subunit 1 |
| chr11_-_117877463 | 1.63 |
ENST00000527717.5
|
FXYD6
|
FXYD domain containing ion transport regulator 6 |
| chr12_-_70788914 | 1.62 |
ENST00000342084.8
|
PTPRR
|
protein tyrosine phosphatase receptor type R |
| chr12_+_112906949 | 1.62 |
ENST00000679971.1
ENST00000675868.2 ENST00000550883.2 ENST00000553152.2 ENST00000202917.10 ENST00000679467.1 ENST00000680659.1 ENST00000540589.3 ENST00000552526.2 ENST00000681228.1 ENST00000680934.1 ENST00000681700.1 ENST00000679987.1 |
OAS1
|
2'-5'-oligoadenylate synthetase 1 |
| chr3_-_158732442 | 1.58 |
ENST00000479756.1
ENST00000237696.10 |
RARRES1
|
retinoic acid receptor responder 1 |
| chr11_-_117876892 | 1.57 |
ENST00000539526.5
|
FXYD6
|
FXYD domain containing ion transport regulator 6 |
| chr1_+_206470463 | 1.56 |
ENST00000581977.7
ENST00000578328.6 ENST00000584998.5 ENST00000579827.6 |
IKBKE
|
inhibitor of nuclear factor kappa B kinase subunit epsilon |
| chr10_-_48605032 | 1.56 |
ENST00000249601.9
|
ARHGAP22
|
Rho GTPase activating protein 22 |
| chr19_-_55149193 | 1.55 |
ENST00000587758.5
ENST00000588981.6 ENST00000356783.9 ENST00000291901.12 ENST00000588426.5 ENST00000536926.5 ENST00000588147.5 |
TNNT1
|
troponin T1, slow skeletal type |
| chr17_+_6756035 | 1.55 |
ENST00000361842.8
ENST00000574907.5 |
XAF1
|
XIAP associated factor 1 |
| chr11_+_102317492 | 1.54 |
ENST00000673846.1
|
BIRC3
|
baculoviral IAP repeat containing 3 |
| chr20_+_33217325 | 1.54 |
ENST00000375452.3
ENST00000375454.8 |
BPIFA3
|
BPI fold containing family A member 3 |
| chr9_-_120926752 | 1.54 |
ENST00000373887.8
|
TRAF1
|
TNF receptor associated factor 1 |
| chr1_-_150765735 | 1.53 |
ENST00000679898.1
ENST00000448301.7 ENST00000680664.1 ENST00000679512.1 ENST00000368985.8 ENST00000679582.1 |
CTSS
|
cathepsin S |
| chr6_+_125781108 | 1.52 |
ENST00000368357.7
|
NCOA7
|
nuclear receptor coactivator 7 |
| chr11_+_5449323 | 1.52 |
ENST00000641930.1
|
OR51I2
|
olfactory receptor family 51 subfamily I member 2 |
| chr12_-_57078739 | 1.52 |
ENST00000379391.7
|
NEMP1
|
nuclear envelope integral membrane protein 1 |
| chr10_+_89332484 | 1.51 |
ENST00000371811.4
ENST00000680037.1 ENST00000679583.1 ENST00000679897.1 |
IFIT3
|
interferon induced protein with tetratricopeptide repeats 3 |
| chr18_+_63887698 | 1.51 |
ENST00000457692.5
ENST00000299502.9 ENST00000413956.5 |
SERPINB2
|
serpin family B member 2 |
| chr2_-_162152404 | 1.51 |
ENST00000375497.3
|
GCG
|
glucagon |
| chr10_-_48604952 | 1.51 |
ENST00000417912.6
|
ARHGAP22
|
Rho GTPase activating protein 22 |
| chr12_-_57078784 | 1.50 |
ENST00000300128.9
|
NEMP1
|
nuclear envelope integral membrane protein 1 |
| chr12_-_49904217 | 1.50 |
ENST00000550635.6
|
FAIM2
|
Fas apoptotic inhibitory molecule 2 |
| chr17_+_42289213 | 1.50 |
ENST00000677301.1
|
STAT5A
|
signal transducer and activator of transcription 5A |
| chr5_+_114362043 | 1.49 |
ENST00000673685.1
|
KCNN2
|
potassium calcium-activated channel subfamily N member 2 |
| chr16_+_30201057 | 1.48 |
ENST00000569485.5
|
SULT1A3
|
sulfotransferase family 1A member 3 |
| chr3_-_172711166 | 1.48 |
ENST00000538775.5
ENST00000543711.5 |
NCEH1
|
neutral cholesterol ester hydrolase 1 |
| chr7_-_105679089 | 1.47 |
ENST00000477775.5
|
ATXN7L1
|
ataxin 7 like 1 |
| chr17_+_44847905 | 1.47 |
ENST00000587021.1
|
HIGD1B
|
HIG1 hypoxia inducible domain family member 1B |
| chr21_+_41426590 | 1.46 |
ENST00000679543.1
ENST00000680364.1 |
MX1
|
MX dynamin like GTPase 1 |
| chr6_-_154430495 | 1.46 |
ENST00000424998.3
|
CNKSR3
|
CNKSR family member 3 |
| chr3_-_64687613 | 1.44 |
ENST00000295903.8
|
ADAMTS9
|
ADAM metallopeptidase with thrombospondin type 1 motif 9 |
| chr15_+_88639009 | 1.42 |
ENST00000306072.10
|
ISG20
|
interferon stimulated exonuclease gene 20 |
| chr21_+_41426168 | 1.40 |
ENST00000681266.1
ENST00000417963.6 |
MX1
|
MX dynamin like GTPase 1 |
| chr6_+_4706133 | 1.40 |
ENST00000328908.9
|
CDYL
|
chromodomain Y like |
| chr10_-_103855406 | 1.40 |
ENST00000355946.6
ENST00000369774.8 |
SH3PXD2A
|
SH3 and PX domains 2A |
| chr11_-_57410113 | 1.40 |
ENST00000529411.1
|
ENSG00000254979.5
|
novel protein |
| chr2_+_201132769 | 1.40 |
ENST00000494258.5
|
CFLAR
|
CASP8 and FADD like apoptosis regulator |
| chr7_-_139777986 | 1.38 |
ENST00000406875.8
|
HIPK2
|
homeodomain interacting protein kinase 2 |
| chr1_-_32964685 | 1.38 |
ENST00000373456.11
ENST00000356990.9 ENST00000235150.5 |
RNF19B
|
ring finger protein 19B |
| chr7_-_108240049 | 1.37 |
ENST00000379022.8
|
NRCAM
|
neuronal cell adhesion molecule |
| chr12_+_55681647 | 1.37 |
ENST00000614691.1
|
METTL7B
|
methyltransferase like 7B |
| chr2_+_102311502 | 1.37 |
ENST00000404917.6
ENST00000410040.5 |
IL1RL1
IL18R1
|
interleukin 1 receptor like 1 interleukin 18 receptor 1 |
| chr21_+_42199686 | 1.37 |
ENST00000398457.6
|
ABCG1
|
ATP binding cassette subfamily G member 1 |
| chr20_-_63572455 | 1.37 |
ENST00000467148.1
|
HELZ2
|
helicase with zinc finger 2 |
| chr1_-_149936816 | 1.37 |
ENST00000439741.4
|
MTMR11
|
myotubularin related protein 11 |
| chr11_+_2461432 | 1.36 |
ENST00000335475.6
|
KCNQ1
|
potassium voltage-gated channel subfamily Q member 1 |
| chr1_-_150765785 | 1.35 |
ENST00000680311.1
ENST00000681728.1 ENST00000680288.1 |
CTSS
|
cathepsin S |
| chr2_+_201129318 | 1.35 |
ENST00000417748.1
|
CFLAR
|
CASP8 and FADD like apoptosis regulator |
| chr2_+_201132928 | 1.35 |
ENST00000462763.5
|
CFLAR
|
CASP8 and FADD like apoptosis regulator |
| chr12_+_112906777 | 1.35 |
ENST00000452357.7
ENST00000445409.7 |
OAS1
|
2'-5'-oligoadenylate synthetase 1 |
| chr6_+_127577168 | 1.34 |
ENST00000329722.8
|
C6orf58
|
chromosome 6 open reading frame 58 |
| chr14_+_21070273 | 1.33 |
ENST00000555038.5
ENST00000298694.9 |
ARHGEF40
|
Rho guanine nucleotide exchange factor 40 |
| chr12_+_55681711 | 1.33 |
ENST00000394252.4
|
METTL7B
|
methyltransferase like 7B |
| chr14_+_23376765 | 1.33 |
ENST00000649278.1
|
CMTM5
|
CKLF like MARVEL transmembrane domain containing 5 |
| chr15_+_67166019 | 1.32 |
ENST00000537194.6
|
SMAD3
|
SMAD family member 3 |
| chr6_+_31587002 | 1.31 |
ENST00000376090.6
|
LST1
|
leukocyte specific transcript 1 |
| chr15_+_76336755 | 1.31 |
ENST00000290759.9
|
ISL2
|
ISL LIM homeobox 2 |
| chr9_+_70043840 | 1.31 |
ENST00000377182.5
|
MAMDC2
|
MAM domain containing 2 |
| chr6_+_31587049 | 1.31 |
ENST00000376089.6
ENST00000396112.6 |
LST1
|
leukocyte specific transcript 1 |
| chr3_+_155083889 | 1.30 |
ENST00000680282.1
|
MME
|
membrane metalloendopeptidase |
| chr3_-_16482850 | 1.29 |
ENST00000432519.5
|
RFTN1
|
raftlin, lipid raft linker 1 |
| chr22_-_31107517 | 1.28 |
ENST00000400299.6
ENST00000611680.1 |
SELENOM
|
selenoprotein M |
| chr1_+_169795022 | 1.28 |
ENST00000359326.9
ENST00000496973.5 |
C1orf112
|
chromosome 1 open reading frame 112 |
| chr11_+_35189869 | 1.28 |
ENST00000525688.5
ENST00000278385.10 ENST00000533222.5 |
CD44
|
CD44 molecule (Indian blood group) |
| chr18_+_24155938 | 1.27 |
ENST00000582229.1
|
CABYR
|
calcium binding tyrosine phosphorylation regulated |
| chr7_-_22194709 | 1.27 |
ENST00000458533.5
|
RAPGEF5
|
Rap guanine nucleotide exchange factor 5 |
| chr4_-_113979635 | 1.26 |
ENST00000315366.8
|
ARSJ
|
arylsulfatase family member J |
| chr5_+_132873660 | 1.26 |
ENST00000296877.3
|
LEAP2
|
liver enriched antimicrobial peptide 2 |
| chr7_-_19145306 | 1.25 |
ENST00000275461.3
|
FERD3L
|
Fer3 like bHLH transcription factor |
| chr17_-_35121487 | 1.25 |
ENST00000593039.5
|
ENSG00000267618.5
|
RAD51L3-RFFL readthrough |
| chr8_-_124565699 | 1.24 |
ENST00000519168.5
|
MTSS1
|
MTSS I-BAR domain containing 1 |
| chr11_-_3057386 | 1.23 |
ENST00000529772.5
ENST00000278224.13 ENST00000380525.9 |
CARS1
|
cysteinyl-tRNA synthetase 1 |
| chr4_+_88378733 | 1.23 |
ENST00000273960.7
ENST00000380265.9 |
HERC6
|
HECT and RLD domain containing E3 ubiquitin protein ligase family member 6 |
| chr1_+_205256189 | 1.22 |
ENST00000329800.7
|
TMCC2
|
transmembrane and coiled-coil domain family 2 |
| chr12_+_116910935 | 1.22 |
ENST00000652555.1
ENST00000455858.2 |
FBXW8
|
F-box and WD repeat domain containing 8 |
| chr2_+_102104563 | 1.22 |
ENST00000409589.5
ENST00000409329.5 |
IL1R1
|
interleukin 1 receptor type 1 |
| chr12_-_55842950 | 1.22 |
ENST00000548629.5
|
MMP19
|
matrix metallopeptidase 19 |
| chr11_-_57426745 | 1.22 |
ENST00000529554.5
|
SLC43A3
|
solute carrier family 43 member 3 |
| chr11_+_62190212 | 1.22 |
ENST00000306238.3
|
SCGB1D1
|
secretoglobin family 1D member 1 |
| chr7_+_134745460 | 1.21 |
ENST00000436461.6
|
CALD1
|
caldesmon 1 |
| chr21_+_25639272 | 1.21 |
ENST00000400532.5
ENST00000312957.9 |
JAM2
|
junctional adhesion molecule 2 |
| chr17_-_181640 | 1.21 |
ENST00000613549.3
|
DOC2B
|
double C2 domain beta |
| chr2_-_51032151 | 1.20 |
ENST00000628515.2
|
NRXN1
|
neurexin 1 |
| chr19_-_48511793 | 1.20 |
ENST00000600059.6
|
LMTK3
|
lemur tyrosine kinase 3 |
| chr17_+_28335571 | 1.20 |
ENST00000544907.6
|
TNFAIP1
|
TNF alpha induced protein 1 |
| chr7_+_18496162 | 1.20 |
ENST00000406072.5
|
HDAC9
|
histone deacetylase 9 |
| chr19_+_15049469 | 1.19 |
ENST00000427043.4
|
CASP14
|
caspase 14 |
| chr19_-_10315987 | 1.19 |
ENST00000393708.3
ENST00000494368.5 |
FDX2
|
ferredoxin 2 |
| chr19_+_57487735 | 1.19 |
ENST00000347466.10
ENST00000523138.5 ENST00000415379.6 ENST00000221735.12 ENST00000521754.5 |
ZNF419
|
zinc finger protein 419 |
| chr11_+_102317542 | 1.19 |
ENST00000532808.5
|
BIRC3
|
baculoviral IAP repeat containing 3 |
| chr16_+_1989949 | 1.18 |
ENST00000248121.7
ENST00000618464.1 |
SYNGR3
|
synaptogyrin 3 |
| chr17_-_41124178 | 1.18 |
ENST00000394014.2
|
KRTAP4-12
|
keratin associated protein 4-12 |
| chr1_+_172452885 | 1.18 |
ENST00000367725.4
|
C1orf105
|
chromosome 1 open reading frame 105 |
| chr11_-_36598221 | 1.18 |
ENST00000311485.8
ENST00000527033.5 ENST00000532616.1 ENST00000618712.4 |
RAG2
|
recombination activating 2 |
| chr17_-_81656532 | 1.17 |
ENST00000331056.10
|
PDE6G
|
phosphodiesterase 6G |
| chr12_-_52517929 | 1.17 |
ENST00000548409.5
|
KRT5
|
keratin 5 |
| chrX_+_154190058 | 1.17 |
ENST00000596998.2
|
OPN1MW
|
opsin 1, medium wave sensitive |
| chr17_+_58192723 | 1.16 |
ENST00000225371.6
|
EPX
|
eosinophil peroxidase |
| chr11_-_5324297 | 1.16 |
ENST00000624187.1
|
OR51B2
|
olfactory receptor family 51 subfamily B member 2 |
| chr1_+_46671821 | 1.16 |
ENST00000334122.5
ENST00000415500.1 |
TEX38
|
testis expressed 38 |
| chr11_-_57567617 | 1.16 |
ENST00000287156.9
|
UBE2L6
|
ubiquitin conjugating enzyme E2 L6 |
| chr12_+_124295085 | 1.16 |
ENST00000546355.4
|
RFLNA
|
refilin A |
| chr22_+_31212207 | 1.16 |
ENST00000406516.5
ENST00000331728.9 |
LIMK2
|
LIM domain kinase 2 |
| chr12_-_104958268 | 1.16 |
ENST00000432951.1
ENST00000258538.8 ENST00000415674.1 ENST00000424946.1 ENST00000433540.5 |
SLC41A2
|
solute carrier family 41 member 2 |
| chr10_+_102245371 | 1.15 |
ENST00000676513.1
ENST00000676939.1 ENST00000677947.1 ENST00000677247.1 ENST00000369983.4 ENST00000678351.1 ENST00000679238.1 ENST00000677439.1 ENST00000677240.1 ENST00000677618.1 ENST00000673650.1 ENST00000674034.1 ENST00000676993.1 |
GBF1
|
golgi brefeldin A resistant guanine nucleotide exchange factor 1 |
| chr14_+_93333210 | 1.15 |
ENST00000256339.8
|
UNC79
|
unc-79 homolog, NALCN channel complex subunit |
| chr19_-_49155130 | 1.15 |
ENST00000595625.1
|
HRC
|
histidine rich calcium binding protein |
| chr8_+_89757789 | 1.15 |
ENST00000220751.5
|
RIPK2
|
receptor interacting serine/threonine kinase 2 |
| chr22_+_20774092 | 1.14 |
ENST00000215727.10
|
SERPIND1
|
serpin family D member 1 |
| chr21_+_42499600 | 1.14 |
ENST00000398341.7
|
SLC37A1
|
solute carrier family 37 member 1 |
| chr21_+_42653734 | 1.14 |
ENST00000335512.8
ENST00000328862.10 ENST00000335440.10 ENST00000380328.6 ENST00000398225.7 ENST00000398227.7 ENST00000398229.7 ENST00000398232.7 ENST00000398234.7 ENST00000398236.7 ENST00000349112.7 ENST00000398224.3 |
PDE9A
|
phosphodiesterase 9A |
| chr11_-_57427474 | 1.13 |
ENST00000533235.5
ENST00000526621.5 ENST00000352187.5 |
SLC43A3
|
solute carrier family 43 member 3 |
| chr1_-_111200633 | 1.13 |
ENST00000357640.9
|
DENND2D
|
DENN domain containing 2D |
| chr1_+_46671871 | 1.13 |
ENST00000564373.1
|
TEX38
|
testis expressed 38 |
| chr17_-_35880350 | 1.13 |
ENST00000605140.6
ENST00000651122.1 ENST00000603197.6 |
CCL5
|
C-C motif chemokine ligand 5 |
| chr9_-_34381531 | 1.13 |
ENST00000379124.5
ENST00000379126.7 ENST00000379127.1 |
C9orf24
|
chromosome 9 open reading frame 24 |
| chr4_+_141636563 | 1.12 |
ENST00000320650.9
ENST00000296545.11 |
IL15
|
interleukin 15 |
| chr21_+_36135071 | 1.12 |
ENST00000290354.6
|
CBR3
|
carbonyl reductase 3 |
| chr11_+_110093372 | 1.12 |
ENST00000278590.8
|
ZC3H12C
|
zinc finger CCCH-type containing 12C |
| chr7_-_1459461 | 1.11 |
ENST00000297508.8
|
MICALL2
|
MICAL like 2 |
| chr11_+_102317450 | 1.11 |
ENST00000615299.4
ENST00000527309.2 ENST00000526421.6 ENST00000263464.9 |
BIRC3
|
baculoviral IAP repeat containing 3 |
| chr6_+_31587185 | 1.11 |
ENST00000376092.7
ENST00000376086.7 ENST00000303757.12 ENST00000376093.6 |
LST1
|
leukocyte specific transcript 1 |
| chr21_+_25639251 | 1.11 |
ENST00000480456.6
|
JAM2
|
junctional adhesion molecule 2 |
| chr2_+_201132872 | 1.11 |
ENST00000470178.6
|
CFLAR
|
CASP8 and FADD like apoptosis regulator |
| chr2_+_201132958 | 1.10 |
ENST00000479953.6
ENST00000340870.6 |
CFLAR
|
CASP8 and FADD like apoptosis regulator |
| chr11_-_72781833 | 1.10 |
ENST00000535054.1
ENST00000545082.5 |
STARD10
|
StAR related lipid transfer domain containing 10 |
Gene Ontology Analysis
Gene overrepresentation in biological process category:
| Log-likelihood per target | Total log-likelihood | Term | Description |
|---|---|---|---|
| 1.8 | 5.3 | GO:0009720 | detection of hormone stimulus(GO:0009720) |
| 1.6 | 4.9 | GO:0044501 | modulation of signal transduction in other organism(GO:0044501) modulation by symbiont of host signal transduction pathway(GO:0052027) modulation of signal transduction in other organism involved in symbiotic interaction(GO:0052250) modulation by symbiont of host I-kappaB kinase/NF-kappaB cascade(GO:0085032) |
| 1.5 | 4.6 | GO:0045360 | regulation of interleukin-1 biosynthetic process(GO:0045360) positive regulation of interleukin-1 biosynthetic process(GO:0045362) |
| 1.3 | 7.6 | GO:0061767 | negative regulation of lung blood pressure(GO:0061767) |
| 1.0 | 4.2 | GO:0000738 | DNA catabolic process, exonucleolytic(GO:0000738) |
| 1.0 | 2.9 | GO:0034769 | basement membrane disassembly(GO:0034769) |
| 0.9 | 2.8 | GO:0045062 | extrathymic T cell selection(GO:0045062) |
| 0.9 | 2.8 | GO:0050717 | positive regulation of interleukin-1 alpha secretion(GO:0050717) |
| 0.9 | 2.6 | GO:0061394 | regulation of transcription from RNA polymerase II promoter in response to arsenic-containing substance(GO:0061394) |
| 0.8 | 2.4 | GO:2000661 | positive regulation of interleukin-1-mediated signaling pathway(GO:2000661) |
| 0.7 | 2.2 | GO:2000754 | regulation of phospholipid scramblase activity(GO:1900161) positive regulation of phospholipid scramblase activity(GO:1900163) regulation of glucosylceramide catabolic process(GO:2000752) positive regulation of glucosylceramide catabolic process(GO:2000753) regulation of sphingomyelin catabolic process(GO:2000754) positive regulation of sphingomyelin catabolic process(GO:2000755) |
| 0.7 | 3.6 | GO:0032747 | positive regulation of interleukin-23 production(GO:0032747) |
| 0.7 | 2.0 | GO:1901899 | positive regulation of relaxation of cardiac muscle(GO:1901899) |
| 0.6 | 6.9 | GO:1903944 | regulation of hepatocyte apoptotic process(GO:1903943) negative regulation of hepatocyte apoptotic process(GO:1903944) |
| 0.6 | 2.5 | GO:0002296 | T-helper 1 cell lineage commitment(GO:0002296) |
| 0.6 | 3.6 | GO:0035617 | stress granule disassembly(GO:0035617) |
| 0.6 | 1.8 | GO:0048250 | mitochondrial iron ion transport(GO:0048250) |
| 0.6 | 7.8 | GO:1900625 | regulation of monocyte aggregation(GO:1900623) positive regulation of monocyte aggregation(GO:1900625) |
| 0.6 | 2.4 | GO:0002215 | defense response to nematode(GO:0002215) |
| 0.6 | 1.8 | GO:0061182 | negative regulation of chondrocyte development(GO:0061182) |
| 0.6 | 4.0 | GO:0038172 | interleukin-33-mediated signaling pathway(GO:0038172) |
| 0.6 | 2.8 | GO:0003069 | age-dependent response to oxidative stress(GO:0001306) age-dependent response to reactive oxygen species(GO:0001315) regulation of systemic arterial blood pressure by acetylcholine(GO:0003068) vasodilation by acetylcholine involved in regulation of systemic arterial blood pressure(GO:0003069) regulation of systemic arterial blood pressure by neurotransmitter(GO:0003070) age-dependent general metabolic decline(GO:0007571) |
| 0.5 | 4.9 | GO:2000124 | regulation of endocannabinoid signaling pathway(GO:2000124) |
| 0.5 | 1.0 | GO:0046136 | positive regulation of vitamin metabolic process(GO:0046136) positive regulation of vitamin D biosynthetic process(GO:0060557) positive regulation of calcidiol 1-monooxygenase activity(GO:0060559) |
| 0.5 | 5.7 | GO:2000535 | regulation of entry of bacterium into host cell(GO:2000535) |
| 0.5 | 2.1 | GO:2000329 | negative regulation of T-helper 17 cell lineage commitment(GO:2000329) |
| 0.5 | 3.0 | GO:1903435 | positive regulation of constitutive secretory pathway(GO:1903435) |
| 0.5 | 2.0 | GO:0021836 | cerebral cortex tangential migration using cell-cell interactions(GO:0021823) postnatal olfactory bulb interneuron migration(GO:0021827) chemorepulsion involved in postnatal olfactory bulb interneuron migration(GO:0021836) negative regulation of negative chemotaxis(GO:0050925) |
| 0.5 | 1.9 | GO:0033634 | positive regulation of cell-cell adhesion mediated by integrin(GO:0033634) |
| 0.5 | 1.8 | GO:1904800 | negative regulation of dendrite extension(GO:1903860) regulation of neuron remodeling(GO:1904799) negative regulation of neuron remodeling(GO:1904800) negative regulation of branching morphogenesis of a nerve(GO:2000173) |
| 0.4 | 0.4 | GO:0032707 | negative regulation of interleukin-23 production(GO:0032707) |
| 0.4 | 1.3 | GO:0021524 | visceral motor neuron differentiation(GO:0021524) |
| 0.4 | 2.5 | GO:0003025 | regulation of systemic arterial blood pressure by baroreceptor feedback(GO:0003025) |
| 0.4 | 1.2 | GO:0086097 | phospholipase C-activating angiotensin-activated signaling pathway(GO:0086097) |
| 0.4 | 3.3 | GO:0000270 | peptidoglycan metabolic process(GO:0000270) peptidoglycan catabolic process(GO:0009253) |
| 0.4 | 3.2 | GO:0070842 | aggresome assembly(GO:0070842) |
| 0.4 | 3.2 | GO:0031444 | slow-twitch skeletal muscle fiber contraction(GO:0031444) |
| 0.4 | 2.8 | GO:0000255 | allantoin metabolic process(GO:0000255) |
| 0.4 | 1.2 | GO:0006742 | NADP catabolic process(GO:0006742) pyridine nucleotide catabolic process(GO:0019364) |
| 0.4 | 6.7 | GO:0002315 | marginal zone B cell differentiation(GO:0002315) |
| 0.4 | 1.2 | GO:0035498 | carnosine metabolic process(GO:0035498) |
| 0.4 | 1.2 | GO:0019046 | release from viral latency(GO:0019046) |
| 0.4 | 1.1 | GO:0071224 | cellular response to peptidoglycan(GO:0071224) |
| 0.4 | 1.5 | GO:0090299 | regulation of neural crest formation(GO:0090299) negative regulation of neural crest formation(GO:0090301) negative regulation of fibroblast growth factor receptor signaling pathway involved in neural plate anterior/posterior pattern formation(GO:2000314) |
| 0.4 | 1.5 | GO:0099558 | maintenance of synapse structure(GO:0099558) |
| 0.4 | 1.1 | GO:0000103 | sulfate assimilation(GO:0000103) |
| 0.4 | 1.1 | GO:0016185 | synaptic vesicle budding from presynaptic endocytic zone membrane(GO:0016185) |
| 0.4 | 5.1 | GO:0098914 | membrane repolarization during atrial cardiac muscle cell action potential(GO:0098914) |
| 0.4 | 3.6 | GO:0086024 | adrenergic receptor signaling pathway involved in positive regulation of heart rate(GO:0086024) |
| 0.4 | 4.3 | GO:2001288 | positive regulation of caveolin-mediated endocytosis(GO:2001288) |
| 0.4 | 1.8 | GO:1903413 | cellular response to bile acid(GO:1903413) |
| 0.4 | 1.8 | GO:0042360 | vitamin E metabolic process(GO:0042360) |
| 0.4 | 1.1 | GO:0051097 | negative regulation of helicase activity(GO:0051097) |
| 0.4 | 1.4 | GO:0072674 | multinuclear osteoclast differentiation(GO:0072674) osteoclast fusion(GO:0072675) |
| 0.3 | 1.0 | GO:0002428 | antigen processing and presentation of peptide antigen via MHC class Ib(GO:0002428) |
| 0.3 | 1.0 | GO:0046521 | sphingoid catabolic process(GO:0046521) |
| 0.3 | 1.0 | GO:0035048 | splicing factor protein import into nucleus(GO:0035048) |
| 0.3 | 1.0 | GO:0006478 | peptidyl-tyrosine sulfation(GO:0006478) |
| 0.3 | 1.7 | GO:0035948 | positive regulation of gluconeogenesis by positive regulation of transcription from RNA polymerase II promoter(GO:0035948) |
| 0.3 | 1.0 | GO:2000097 | regulation of smooth muscle cell-matrix adhesion(GO:2000097) |
| 0.3 | 3.6 | GO:0032782 | bile acid secretion(GO:0032782) |
| 0.3 | 2.6 | GO:1903237 | negative regulation of leukocyte tethering or rolling(GO:1903237) |
| 0.3 | 1.6 | GO:0030035 | microspike assembly(GO:0030035) |
| 0.3 | 0.6 | GO:0042704 | uterine wall breakdown(GO:0042704) |
| 0.3 | 1.3 | GO:0034239 | macrophage fusion(GO:0034238) regulation of macrophage fusion(GO:0034239) positive regulation of macrophage fusion(GO:0034241) |
| 0.3 | 1.3 | GO:0097045 | phosphatidylserine exposure on blood platelet(GO:0097045) |
| 0.3 | 2.5 | GO:0045084 | positive regulation of interleukin-12 biosynthetic process(GO:0045084) |
| 0.3 | 1.3 | GO:1904021 | negative regulation of G-protein coupled receptor internalization(GO:1904021) |
| 0.3 | 0.9 | GO:0060309 | elastin catabolic process(GO:0060309) |
| 0.3 | 0.6 | GO:1903412 | response to bile acid(GO:1903412) |
| 0.3 | 1.8 | GO:0098989 | NMDA selective glutamate receptor signaling pathway(GO:0098989) |
| 0.3 | 0.3 | GO:0051795 | positive regulation of catagen(GO:0051795) |
| 0.3 | 1.4 | GO:0071393 | cellular response to progesterone stimulus(GO:0071393) |
| 0.3 | 1.2 | GO:0035964 | COPI-coated vesicle budding(GO:0035964) Golgi transport vesicle coating(GO:0048200) COPI coating of Golgi vesicle(GO:0048205) |
| 0.3 | 4.9 | GO:0003373 | dynamin polymerization involved in membrane fission(GO:0003373) dynamin polymerization involved in mitochondrial fission(GO:0003374) |
| 0.3 | 4.3 | GO:0070424 | regulation of nucleotide-binding oligomerization domain containing signaling pathway(GO:0070424) |
| 0.3 | 0.8 | GO:0051232 | meiotic spindle elongation(GO:0051232) meiotic cell cycle process involved in oocyte maturation(GO:1903537) regulation of meiotic cell cycle process involved in oocyte maturation(GO:1903538) |
| 0.3 | 1.9 | GO:0060770 | negative regulation of epithelial cell proliferation involved in prostate gland development(GO:0060770) |
| 0.3 | 4.6 | GO:0072619 | interleukin-21 production(GO:0032625) interleukin-21 secretion(GO:0072619) |
| 0.3 | 0.3 | GO:0002589 | regulation of antigen processing and presentation of peptide antigen via MHC class I(GO:0002589) negative regulation of antigen processing and presentation of peptide antigen via MHC class I(GO:0002590) |
| 0.3 | 3.2 | GO:0034058 | endosomal vesicle fusion(GO:0034058) |
| 0.3 | 0.8 | GO:0060164 | regulation of timing of neuron differentiation(GO:0060164) |
| 0.3 | 1.8 | GO:0043932 | ossification involved in bone remodeling(GO:0043932) |
| 0.3 | 1.3 | GO:0010513 | positive regulation of phosphatidylinositol biosynthetic process(GO:0010513) |
| 0.3 | 0.5 | GO:0098712 | L-glutamate import across plasma membrane(GO:0098712) |
| 0.3 | 2.0 | GO:0002480 | antigen processing and presentation of exogenous peptide antigen via MHC class I, TAP-independent(GO:0002480) |
| 0.3 | 0.8 | GO:0060721 | spongiotrophoblast cell proliferation(GO:0060720) regulation of spongiotrophoblast cell proliferation(GO:0060721) cell proliferation involved in embryonic placenta development(GO:0060722) regulation of cell proliferation involved in embryonic placenta development(GO:0060723) |
| 0.3 | 2.0 | GO:0032962 | regulation of inositol trisphosphate biosynthetic process(GO:0032960) positive regulation of inositol trisphosphate biosynthetic process(GO:0032962) |
| 0.2 | 0.7 | GO:1903644 | regulation of chaperone-mediated protein folding(GO:1903644) |
| 0.2 | 1.5 | GO:0019276 | UDP-N-acetylgalactosamine metabolic process(GO:0019276) |
| 0.2 | 1.5 | GO:0060332 | positive regulation of response to interferon-gamma(GO:0060332) positive regulation of interferon-gamma-mediated signaling pathway(GO:0060335) |
| 0.2 | 1.0 | GO:0060313 | negative regulation of blood vessel remodeling(GO:0060313) |
| 0.2 | 1.0 | GO:1901662 | phylloquinone metabolic process(GO:0042374) phylloquinone catabolic process(GO:0042376) quinone catabolic process(GO:1901662) |
| 0.2 | 1.7 | GO:0033632 | regulation of cell-cell adhesion mediated by integrin(GO:0033632) |
| 0.2 | 0.7 | GO:0090403 | oxidative stress-induced premature senescence(GO:0090403) |
| 0.2 | 1.4 | GO:0001554 | luteolysis(GO:0001554) |
| 0.2 | 0.7 | GO:0038195 | urokinase plasminogen activator signaling pathway(GO:0038195) |
| 0.2 | 0.2 | GO:0070427 | nucleotide-binding oligomerization domain containing 1 signaling pathway(GO:0070427) |
| 0.2 | 0.5 | GO:0045626 | negative regulation of T-helper 1 cell differentiation(GO:0045626) |
| 0.2 | 0.9 | GO:0009236 | cobalamin biosynthetic process(GO:0009236) |
| 0.2 | 0.7 | GO:0046586 | regulation of calcium-dependent cell-cell adhesion(GO:0046586) |
| 0.2 | 2.1 | GO:2001206 | positive regulation of osteoclast development(GO:2001206) |
| 0.2 | 0.9 | GO:0042450 | arginine biosynthetic process via ornithine(GO:0042450) |
| 0.2 | 0.9 | GO:0060298 | positive regulation of sarcomere organization(GO:0060298) |
| 0.2 | 0.9 | GO:0009298 | GDP-mannose biosynthetic process(GO:0009298) |
| 0.2 | 0.9 | GO:0044333 | Wnt signaling pathway involved in digestive tract morphogenesis(GO:0044333) |
| 0.2 | 1.3 | GO:0090669 | telomerase RNA stabilization(GO:0090669) |
| 0.2 | 1.6 | GO:0046449 | creatinine metabolic process(GO:0046449) |
| 0.2 | 0.7 | GO:0038043 | interleukin-5-mediated signaling pathway(GO:0038043) |
| 0.2 | 1.3 | GO:1903936 | cellular response to sodium arsenite(GO:1903936) |
| 0.2 | 3.5 | GO:0035878 | nail development(GO:0035878) |
| 0.2 | 0.9 | GO:1900738 | positive regulation of phospholipase C-activating G-protein coupled receptor signaling pathway(GO:1900738) |
| 0.2 | 0.7 | GO:0006566 | threonine metabolic process(GO:0006566) |
| 0.2 | 2.4 | GO:0002726 | positive regulation of T cell cytokine production(GO:0002726) |
| 0.2 | 0.6 | GO:1900042 | positive regulation of interleukin-2 secretion(GO:1900042) |
| 0.2 | 3.6 | GO:0042940 | D-amino acid transport(GO:0042940) |
| 0.2 | 0.4 | GO:0051695 | actin filament uncapping(GO:0051695) |
| 0.2 | 0.6 | GO:0016094 | polyprenol biosynthetic process(GO:0016094) |
| 0.2 | 1.7 | GO:0002457 | T cell antigen processing and presentation(GO:0002457) |
| 0.2 | 0.6 | GO:1903281 | regulation of the force of heart contraction by cardiac conduction(GO:0086092) positive regulation of calcium:sodium antiporter activity(GO:1903281) |
| 0.2 | 0.4 | GO:0001545 | primary ovarian follicle growth(GO:0001545) |
| 0.2 | 0.2 | GO:0009233 | menaquinone metabolic process(GO:0009233) |
| 0.2 | 1.7 | GO:0072733 | response to staurosporine(GO:0072733) cellular response to staurosporine(GO:0072734) |
| 0.2 | 0.2 | GO:0036515 | serotonergic neuron axon guidance(GO:0036515) |
| 0.2 | 1.0 | GO:0044027 | hypermethylation of CpG island(GO:0044027) |
| 0.2 | 0.4 | GO:1903774 | positive regulation of viral budding via host ESCRT complex(GO:1903774) |
| 0.2 | 2.8 | GO:0097116 | gephyrin clustering involved in postsynaptic density assembly(GO:0097116) |
| 0.2 | 0.8 | GO:0010585 | glutamine secretion(GO:0010585) L-glutamine import(GO:0036229) L-glutamine import into cell(GO:1903803) |
| 0.2 | 0.8 | GO:0061358 | negative regulation of Wnt protein secretion(GO:0061358) |
| 0.2 | 2.4 | GO:2000172 | regulation of branching morphogenesis of a nerve(GO:2000172) |
| 0.2 | 1.2 | GO:1903385 | regulation of homophilic cell adhesion(GO:1903385) |
| 0.2 | 1.0 | GO:0048549 | positive regulation of pinocytosis(GO:0048549) |
| 0.2 | 1.4 | GO:0002326 | B cell lineage commitment(GO:0002326) |
| 0.2 | 1.5 | GO:0033504 | floor plate development(GO:0033504) |
| 0.2 | 1.2 | GO:0008218 | bioluminescence(GO:0008218) |
| 0.2 | 1.2 | GO:0060370 | susceptibility to T cell mediated cytotoxicity(GO:0060370) |
| 0.2 | 1.5 | GO:2000391 | positive regulation of neutrophil extravasation(GO:2000391) |
| 0.2 | 2.3 | GO:0045636 | positive regulation of melanocyte differentiation(GO:0045636) |
| 0.2 | 0.4 | GO:2000981 | auditory receptor cell fate determination(GO:0042668) negative regulation of mechanoreceptor differentiation(GO:0045632) negative regulation of pro-B cell differentiation(GO:2000974) negative regulation of inner ear receptor cell differentiation(GO:2000981) |
| 0.2 | 0.4 | GO:1904798 | positive regulation of core promoter binding(GO:1904798) |
| 0.2 | 1.5 | GO:1900368 | regulation of RNA interference(GO:1900368) |
| 0.2 | 0.2 | GO:0044335 | canonical Wnt signaling pathway involved in neural crest cell differentiation(GO:0044335) |
| 0.2 | 0.6 | GO:0033364 | mast cell secretory granule organization(GO:0033364) |
| 0.2 | 0.7 | GO:1904640 | response to methionine(GO:1904640) |
| 0.2 | 0.6 | GO:1990834 | response to odorant(GO:1990834) |
| 0.2 | 1.3 | GO:2000324 | positive regulation of glucocorticoid receptor signaling pathway(GO:2000324) |
| 0.2 | 0.2 | GO:0072717 | cellular response to actinomycin D(GO:0072717) |
| 0.2 | 0.6 | GO:1904397 | positive regulation of skeletal muscle acetylcholine-gated channel clustering(GO:1904395) negative regulation of neuromuscular junction development(GO:1904397) |
| 0.2 | 1.7 | GO:0042866 | pyruvate biosynthetic process(GO:0042866) |
| 0.2 | 0.2 | GO:0051541 | elastin metabolic process(GO:0051541) |
| 0.2 | 0.5 | GO:1901492 | positive regulation of lymphangiogenesis(GO:1901492) |
| 0.2 | 1.8 | GO:0032020 | ISG15-protein conjugation(GO:0032020) |
| 0.2 | 0.9 | GO:0061668 | mitochondrial ribosome assembly(GO:0061668) |
| 0.2 | 0.5 | GO:0010607 | negative regulation of cytoplasmic mRNA processing body assembly(GO:0010607) |
| 0.2 | 1.3 | GO:0030579 | ubiquitin-dependent SMAD protein catabolic process(GO:0030579) |
| 0.2 | 0.4 | GO:0060166 | olfactory pit development(GO:0060166) |
| 0.2 | 0.7 | GO:0002322 | B cell proliferation involved in immune response(GO:0002322) |
| 0.2 | 0.4 | GO:0003162 | atrioventricular node development(GO:0003162) |
| 0.2 | 0.5 | GO:0036304 | umbilical cord morphogenesis(GO:0036304) umbilical cord development(GO:0061027) |
| 0.2 | 0.5 | GO:0008614 | pyridoxine metabolic process(GO:0008614) pyridoxine biosynthetic process(GO:0008615) vitamin B6 biosynthetic process(GO:0042819) |
| 0.2 | 0.7 | GO:1904744 | positive regulation of telomeric DNA binding(GO:1904744) |
| 0.2 | 0.5 | GO:0042137 | sequestering of neurotransmitter(GO:0042137) |
| 0.2 | 0.9 | GO:0019060 | intracellular transport of viral protein in host cell(GO:0019060) symbiont intracellular protein transport in host(GO:0030581) intracellular protein transport in other organism involved in symbiotic interaction(GO:0051708) |
| 0.2 | 1.6 | GO:0010269 | response to selenium ion(GO:0010269) |
| 0.2 | 2.2 | GO:1900017 | positive regulation of cytokine production involved in inflammatory response(GO:1900017) |
| 0.2 | 0.3 | GO:0048105 | establishment of body hair or bristle planar orientation(GO:0048104) establishment of body hair planar orientation(GO:0048105) |
| 0.2 | 0.7 | GO:0018199 | peptidyl-glutamine modification(GO:0018199) |
| 0.2 | 0.5 | GO:1902161 | positive regulation of cyclic nucleotide-gated ion channel activity(GO:1902161) |
| 0.2 | 2.4 | GO:0045162 | clustering of voltage-gated sodium channels(GO:0045162) |
| 0.2 | 1.3 | GO:0002254 | kinin cascade(GO:0002254) plasma kallikrein-kinin cascade(GO:0002353) |
| 0.2 | 0.7 | GO:0060011 | Sertoli cell proliferation(GO:0060011) |
| 0.2 | 1.3 | GO:0015712 | hexose phosphate transport(GO:0015712) glucose-6-phosphate transport(GO:0015760) |
| 0.2 | 0.5 | GO:1903487 | regulation of lactation(GO:1903487) |
| 0.2 | 0.7 | GO:0090400 | stress-induced premature senescence(GO:0090400) |
| 0.2 | 0.5 | GO:0042322 | negative regulation of circadian sleep/wake cycle, REM sleep(GO:0042322) negative regulation of energy homeostasis(GO:2000506) |
| 0.2 | 4.4 | GO:0051764 | actin crosslink formation(GO:0051764) |
| 0.2 | 0.6 | GO:2001138 | regulation of phospholipid transport(GO:2001138) positive regulation of phospholipid transport(GO:2001140) |
| 0.2 | 1.1 | GO:1904396 | regulation of neuromuscular junction development(GO:1904396) |
| 0.2 | 0.8 | GO:0030241 | skeletal muscle myosin thick filament assembly(GO:0030241) |
| 0.2 | 1.3 | GO:1902031 | regulation of NADP metabolic process(GO:1902031) |
| 0.2 | 0.8 | GO:0034421 | post-translational protein acetylation(GO:0034421) |
| 0.2 | 0.6 | GO:0046900 | tetrahydrofolylpolyglutamate metabolic process(GO:0046900) |
| 0.2 | 0.6 | GO:1901165 | positive regulation of trophoblast cell migration(GO:1901165) |
| 0.2 | 0.6 | GO:0035803 | egg coat formation(GO:0035803) |
| 0.2 | 1.1 | GO:2000969 | positive regulation of alpha-amino-3-hydroxy-5-methyl-4-isoxazole propionate selective glutamate receptor activity(GO:2000969) |
| 0.2 | 1.1 | GO:0046985 | negative regulation of megakaryocyte differentiation(GO:0045653) positive regulation of hemoglobin biosynthetic process(GO:0046985) |
| 0.2 | 0.9 | GO:0032468 | Golgi calcium ion homeostasis(GO:0032468) |
| 0.2 | 3.9 | GO:0071420 | cellular response to histamine(GO:0071420) |
| 0.2 | 0.5 | GO:1901656 | glucoside transport(GO:0042946) glycoside transport(GO:1901656) |
| 0.2 | 1.2 | GO:0035799 | ureter maturation(GO:0035799) |
| 0.2 | 0.6 | GO:2000639 | regulation of SREBP signaling pathway(GO:2000638) negative regulation of SREBP signaling pathway(GO:2000639) |
| 0.2 | 0.3 | GO:1904616 | regulation of actin filament binding(GO:1904529) regulation of actin binding(GO:1904616) |
| 0.2 | 1.5 | GO:0021633 | optic nerve structural organization(GO:0021633) |
| 0.2 | 1.1 | GO:2000860 | positive regulation of mineralocorticoid secretion(GO:2000857) positive regulation of aldosterone secretion(GO:2000860) |
| 0.2 | 1.1 | GO:0060414 | aorta smooth muscle tissue morphogenesis(GO:0060414) |
| 0.2 | 2.6 | GO:0045078 | positive regulation of interferon-gamma biosynthetic process(GO:0045078) |
| 0.2 | 0.3 | GO:0045643 | regulation of eosinophil differentiation(GO:0045643) positive regulation of eosinophil differentiation(GO:0045645) |
| 0.2 | 0.6 | GO:0061484 | hematopoietic stem cell homeostasis(GO:0061484) |
| 0.2 | 0.8 | GO:0046013 | regulation of T cell homeostatic proliferation(GO:0046013) |
| 0.2 | 1.2 | GO:0045448 | regulation of mitotic cell cycle, embryonic(GO:0009794) mitotic cell cycle, embryonic(GO:0045448) |
| 0.1 | 0.4 | GO:0001757 | somite specification(GO:0001757) |
| 0.1 | 0.1 | GO:1905237 | response to cyclosporin A(GO:1905237) |
| 0.1 | 1.6 | GO:1990573 | potassium ion import across plasma membrane(GO:1990573) |
| 0.1 | 0.9 | GO:0006003 | fructose 2,6-bisphosphate metabolic process(GO:0006003) |
| 0.1 | 0.4 | GO:1900110 | negative regulation of histone H3-K9 dimethylation(GO:1900110) |
| 0.1 | 0.9 | GO:0045218 | zonula adherens maintenance(GO:0045218) |
| 0.1 | 0.7 | GO:0042713 | sperm ejaculation(GO:0042713) |
| 0.1 | 0.4 | GO:0051414 | response to cortisol(GO:0051414) |
| 0.1 | 0.6 | GO:0099543 | retrograde trans-synaptic signaling by soluble gas(GO:0098923) trans-synaptic signaling by soluble gas(GO:0099543) |
| 0.1 | 0.3 | GO:0045054 | constitutive secretory pathway(GO:0045054) |
| 0.1 | 0.7 | GO:0061762 | CAMKK-AMPK signaling cascade(GO:0061762) |
| 0.1 | 0.3 | GO:0035385 | Roundabout signaling pathway(GO:0035385) |
| 0.1 | 0.4 | GO:0001732 | formation of cytoplasmic translation initiation complex(GO:0001732) |
| 0.1 | 0.6 | GO:0060448 | dichotomous subdivision of terminal units involved in lung branching(GO:0060448) |
| 0.1 | 1.0 | GO:0016344 | meiotic chromosome movement towards spindle pole(GO:0016344) |
| 0.1 | 1.4 | GO:0038166 | angiotensin-activated signaling pathway(GO:0038166) |
| 0.1 | 0.8 | GO:1900383 | regulation of synaptic plasticity by receptor localization to synapse(GO:1900383) |
| 0.1 | 0.3 | GO:0045359 | positive regulation of interferon-beta biosynthetic process(GO:0045359) |
| 0.1 | 0.4 | GO:0021758 | caudate nucleus development(GO:0021757) putamen development(GO:0021758) |
| 0.1 | 0.7 | GO:0010966 | regulation of phosphate transport(GO:0010966) |
| 0.1 | 0.7 | GO:2000858 | renin-angiotensin regulation of aldosterone production(GO:0002018) mineralocorticoid secretion(GO:0035931) aldosterone secretion(GO:0035932) regulation of mineralocorticoid secretion(GO:2000855) regulation of aldosterone secretion(GO:2000858) |
| 0.1 | 0.3 | GO:0045080 | positive regulation of chemokine biosynthetic process(GO:0045080) |
| 0.1 | 0.6 | GO:0072301 | negative regulation of metanephric glomerulus development(GO:0072299) regulation of metanephric glomerular mesangial cell proliferation(GO:0072301) negative regulation of metanephric glomerular mesangial cell proliferation(GO:0072302) |
| 0.1 | 1.3 | GO:0018377 | protein myristoylation(GO:0018377) |
| 0.1 | 1.1 | GO:0061737 | leukotriene signaling pathway(GO:0061737) |
| 0.1 | 0.8 | GO:0036493 | positive regulation of translation in response to endoplasmic reticulum stress(GO:0036493) |
| 0.1 | 1.2 | GO:0014877 | response to muscle inactivity involved in regulation of muscle adaptation(GO:0014877) response to denervation involved in regulation of muscle adaptation(GO:0014894) |
| 0.1 | 0.7 | GO:0043126 | regulation of 1-phosphatidylinositol 4-kinase activity(GO:0043126) positive regulation of 1-phosphatidylinositol 4-kinase activity(GO:0043128) |
| 0.1 | 0.4 | GO:1901993 | meiotic cell cycle phase transition(GO:0044771) regulation of meiotic cell cycle phase transition(GO:1901993) negative regulation of meiotic cell cycle phase transition(GO:1901994) |
| 0.1 | 1.6 | GO:0060059 | embryonic retina morphogenesis in camera-type eye(GO:0060059) |
| 0.1 | 0.1 | GO:0009441 | glycolate metabolic process(GO:0009441) |
| 0.1 | 0.4 | GO:0071626 | mastication(GO:0071626) learned vocalization behavior(GO:0098583) |
| 0.1 | 0.4 | GO:0044828 | negative regulation by host of viral genome replication(GO:0044828) |
| 0.1 | 0.4 | GO:0021849 | neuroblast division in subventricular zone(GO:0021849) |
| 0.1 | 0.3 | GO:2000569 | T-helper 2 cell activation(GO:0035712) regulation of T-helper 2 cell activation(GO:2000569) positive regulation of T-helper 2 cell activation(GO:2000570) |
| 0.1 | 0.4 | GO:0002901 | mature B cell apoptotic process(GO:0002901) regulation of mature B cell apoptotic process(GO:0002905) negative regulation of mature B cell apoptotic process(GO:0002906) |
| 0.1 | 0.7 | GO:0050755 | chemokine metabolic process(GO:0050755) |
| 0.1 | 0.3 | GO:1904751 | positive regulation of protein localization to nucleolus(GO:1904751) |
| 0.1 | 2.4 | GO:0097186 | amelogenesis(GO:0097186) |
| 0.1 | 0.9 | GO:0090170 | regulation of Golgi inheritance(GO:0090170) |
| 0.1 | 0.4 | GO:1904158 | axonemal central apparatus assembly(GO:1904158) |
| 0.1 | 0.6 | GO:0051891 | positive regulation of cardioblast differentiation(GO:0051891) |
| 0.1 | 0.4 | GO:2000359 | regulation of binding of sperm to zona pellucida(GO:2000359) |
| 0.1 | 0.6 | GO:0002351 | serotonin production involved in inflammatory response(GO:0002351) serotonin secretion involved in inflammatory response(GO:0002442) serotonin secretion by platelet(GO:0002554) |
| 0.1 | 0.4 | GO:0045085 | negative regulation of interleukin-2 biosynthetic process(GO:0045085) |
| 0.1 | 0.6 | GO:0035962 | response to interleukin-13(GO:0035962) |
| 0.1 | 0.5 | GO:0021780 | oligodendrocyte cell fate specification(GO:0021778) oligodendrocyte cell fate commitment(GO:0021779) glial cell fate specification(GO:0021780) |
| 0.1 | 0.4 | GO:0070625 | zymogen granule exocytosis(GO:0070625) |
| 0.1 | 0.9 | GO:0002175 | protein localization to paranode region of axon(GO:0002175) |
| 0.1 | 0.4 | GO:0007343 | egg activation(GO:0007343) |
| 0.1 | 0.2 | GO:0045590 | negative regulation of regulatory T cell differentiation(GO:0045590) |
| 0.1 | 0.7 | GO:1904274 | tricellular tight junction assembly(GO:1904274) |
| 0.1 | 2.7 | GO:0031581 | hemidesmosome assembly(GO:0031581) |
| 0.1 | 3.7 | GO:0007214 | gamma-aminobutyric acid signaling pathway(GO:0007214) |
| 0.1 | 0.2 | GO:0046110 | xanthine metabolic process(GO:0046110) |
| 0.1 | 0.4 | GO:0008065 | establishment of blood-nerve barrier(GO:0008065) |
| 0.1 | 0.4 | GO:2000418 | positive regulation of eosinophil migration(GO:2000418) |
| 0.1 | 0.2 | GO:0021558 | trochlear nerve development(GO:0021558) |
| 0.1 | 0.4 | GO:0051970 | negative regulation of transmission of nerve impulse(GO:0051970) |
| 0.1 | 1.0 | GO:0097052 | L-kynurenine metabolic process(GO:0097052) |
| 0.1 | 1.3 | GO:0015684 | ferrous iron transport(GO:0015684) ferrous iron transmembrane transport(GO:1903874) |
| 0.1 | 0.4 | GO:0060739 | mesenchymal-epithelial cell signaling involved in prostate gland development(GO:0060739) |
| 0.1 | 1.6 | GO:0006449 | regulation of translational termination(GO:0006449) |
| 0.1 | 1.9 | GO:0007252 | I-kappaB phosphorylation(GO:0007252) |
| 0.1 | 0.5 | GO:1903265 | positive regulation of tumor necrosis factor-mediated signaling pathway(GO:1903265) |
| 0.1 | 4.3 | GO:0042347 | negative regulation of NF-kappaB import into nucleus(GO:0042347) |
| 0.1 | 0.4 | GO:1901355 | response to rapamycin(GO:1901355) |
| 0.1 | 0.4 | GO:0061589 | calcium activated phosphatidylserine scrambling(GO:0061589) |
| 0.1 | 0.6 | GO:0090131 | mesenchyme migration(GO:0090131) |
| 0.1 | 1.2 | GO:0072592 | oxygen metabolic process(GO:0072592) |
| 0.1 | 0.7 | GO:0051012 | microtubule sliding(GO:0051012) |
| 0.1 | 0.9 | GO:0002118 | aggressive behavior(GO:0002118) |
| 0.1 | 0.7 | GO:0061052 | negative regulation of cell growth involved in cardiac muscle cell development(GO:0061052) |
| 0.1 | 0.1 | GO:0071550 | death-inducing signaling complex assembly(GO:0071550) |
| 0.1 | 0.9 | GO:0007197 | adenylate cyclase-inhibiting G-protein coupled acetylcholine receptor signaling pathway(GO:0007197) |
| 0.1 | 1.2 | GO:0036444 | calcium ion transmembrane import into mitochondrion(GO:0036444) |
| 0.1 | 0.2 | GO:0034392 | negative regulation of smooth muscle cell apoptotic process(GO:0034392) |
| 0.1 | 0.1 | GO:1901526 | positive regulation of macromitophagy(GO:1901526) positive regulation of mitophagy in response to mitochondrial depolarization(GO:1904925) |
| 0.1 | 1.7 | GO:0050862 | positive regulation of T cell receptor signaling pathway(GO:0050862) |
| 0.1 | 0.5 | GO:0042335 | cuticle development(GO:0042335) |
| 0.1 | 0.8 | GO:1901509 | regulation of endothelial tube morphogenesis(GO:1901509) |
| 0.1 | 1.0 | GO:1902897 | regulation of postsynaptic density protein 95 clustering(GO:1902897) |
| 0.1 | 1.8 | GO:0021796 | cerebral cortex regionalization(GO:0021796) |
| 0.1 | 0.6 | GO:0030860 | regulation of polarized epithelial cell differentiation(GO:0030860) |
| 0.1 | 1.0 | GO:0048742 | regulation of skeletal muscle fiber development(GO:0048742) |
| 0.1 | 0.1 | GO:0097252 | oligodendrocyte apoptotic process(GO:0097252) |
| 0.1 | 19.4 | GO:0050911 | detection of chemical stimulus involved in sensory perception of smell(GO:0050911) |
| 0.1 | 1.2 | GO:1902866 | regulation of retina development in camera-type eye(GO:1902866) |
| 0.1 | 3.9 | GO:0022400 | regulation of rhodopsin mediated signaling pathway(GO:0022400) |
| 0.1 | 0.7 | GO:0044339 | canonical Wnt signaling pathway involved in osteoblast differentiation(GO:0044339) |
| 0.1 | 0.5 | GO:0019348 | dolichol metabolic process(GO:0019348) |
| 0.1 | 0.5 | GO:0010266 | response to vitamin B1(GO:0010266) |
| 0.1 | 0.2 | GO:0098735 | positive regulation of the force of heart contraction(GO:0098735) |
| 0.1 | 0.2 | GO:2000382 | positive regulation of mesoderm development(GO:2000382) |
| 0.1 | 0.7 | GO:1904207 | maintenance of blood-brain barrier(GO:0035633) regulation of chemokine (C-C motif) ligand 2 secretion(GO:1904207) positive regulation of chemokine (C-C motif) ligand 2 secretion(GO:1904209) |
| 0.1 | 4.2 | GO:0050832 | defense response to fungus(GO:0050832) |
| 0.1 | 0.3 | GO:0072277 | metanephric glomerulus morphogenesis(GO:0072275) metanephric glomerulus vasculature morphogenesis(GO:0072276) metanephric glomerular capillary formation(GO:0072277) |
| 0.1 | 0.4 | GO:0097498 | endothelial tube lumen extension(GO:0097498) |
| 0.1 | 0.6 | GO:1904352 | positive regulation of protein catabolic process in the vacuole(GO:1904352) |
| 0.1 | 0.5 | GO:0015842 | aminergic neurotransmitter loading into synaptic vesicle(GO:0015842) |
| 0.1 | 0.6 | GO:0035582 | sequestering of BMP in extracellular matrix(GO:0035582) |
| 0.1 | 0.2 | GO:1904020 | regulation of G-protein coupled receptor internalization(GO:1904020) |
| 0.1 | 0.3 | GO:0060577 | subthalamic nucleus development(GO:0021763) prolactin secreting cell differentiation(GO:0060127) left lung morphogenesis(GO:0060460) pulmonary vein morphogenesis(GO:0060577) superior vena cava morphogenesis(GO:0060578) |
| 0.1 | 0.5 | GO:0043606 | histidine catabolic process to glutamate and formamide(GO:0019556) histidine catabolic process to glutamate and formate(GO:0019557) formamide metabolic process(GO:0043606) |
| 0.1 | 3.2 | GO:0045332 | phospholipid translocation(GO:0045332) |
| 0.1 | 0.2 | GO:1902941 | regulation of voltage-gated chloride channel activity(GO:1902941) positive regulation of voltage-gated chloride channel activity(GO:1902943) positive regulation of inorganic anion transmembrane transport(GO:1903797) |
| 0.1 | 1.4 | GO:0019344 | cysteine biosynthetic process(GO:0019344) |
| 0.1 | 1.6 | GO:0030007 | cellular potassium ion homeostasis(GO:0030007) |
| 0.1 | 0.1 | GO:0045014 | carbon catabolite repression of transcription(GO:0045013) negative regulation of transcription by glucose(GO:0045014) |
| 0.1 | 0.2 | GO:1902732 | positive regulation of chondrocyte proliferation(GO:1902732) |
| 0.1 | 0.3 | GO:0060279 | positive regulation of ovulation(GO:0060279) |
| 0.1 | 0.1 | GO:0002752 | cell surface pattern recognition receptor signaling pathway(GO:0002752) |
| 0.1 | 0.1 | GO:1902617 | response to fluoride(GO:1902617) |
| 0.1 | 1.2 | GO:0035457 | cellular response to interferon-alpha(GO:0035457) |
| 0.1 | 0.2 | GO:1990418 | response to insulin-like growth factor stimulus(GO:1990418) |
| 0.1 | 1.8 | GO:0031665 | negative regulation of lipopolysaccharide-mediated signaling pathway(GO:0031665) |
| 0.1 | 1.5 | GO:0070257 | positive regulation of mucus secretion(GO:0070257) |
| 0.1 | 0.5 | GO:0010820 | regulation of T cell chemotaxis(GO:0010819) positive regulation of T cell chemotaxis(GO:0010820) |
| 0.1 | 1.6 | GO:0007213 | G-protein coupled acetylcholine receptor signaling pathway(GO:0007213) |
| 0.1 | 0.3 | GO:0044336 | canonical Wnt signaling pathway involved in negative regulation of apoptotic process(GO:0044336) |
| 0.1 | 0.4 | GO:0018242 | protein O-linked glycosylation via serine(GO:0018242) |
| 0.1 | 0.3 | GO:0051754 | meiotic sister chromatid cohesion, centromeric(GO:0051754) |
| 0.1 | 0.5 | GO:0042699 | follicle-stimulating hormone signaling pathway(GO:0042699) |
| 0.1 | 0.4 | GO:0002879 | positive regulation of acute inflammatory response to non-antigenic stimulus(GO:0002879) |
| 0.1 | 0.3 | GO:0018401 | peptidyl-proline hydroxylation to 4-hydroxy-L-proline(GO:0018401) |
| 0.1 | 0.7 | GO:0034141 | positive regulation of toll-like receptor 3 signaling pathway(GO:0034141) |
| 0.1 | 0.4 | GO:0002483 | antigen processing and presentation of endogenous peptide antigen(GO:0002483) |
| 0.1 | 0.7 | GO:0030854 | positive regulation of granulocyte differentiation(GO:0030854) |
| 0.1 | 0.3 | GO:1903225 | negative regulation of endodermal cell differentiation(GO:1903225) |
| 0.1 | 2.8 | GO:0006700 | C21-steroid hormone biosynthetic process(GO:0006700) |
| 0.1 | 1.5 | GO:1902260 | negative regulation of delayed rectifier potassium channel activity(GO:1902260) |
| 0.1 | 1.3 | GO:2000009 | negative regulation of protein localization to cell surface(GO:2000009) |
| 0.1 | 0.1 | GO:1901535 | regulation of DNA demethylation(GO:1901535) negative regulation of DNA demethylation(GO:1901536) |
| 0.1 | 0.1 | GO:0072103 | glomerulus vasculature morphogenesis(GO:0072103) glomerular capillary formation(GO:0072104) |
| 0.1 | 0.5 | GO:0021707 | cerebellar granular layer formation(GO:0021684) cerebellar granule cell differentiation(GO:0021707) |
| 0.1 | 1.0 | GO:0017183 | peptidyl-diphthamide metabolic process(GO:0017182) peptidyl-diphthamide biosynthetic process from peptidyl-histidine(GO:0017183) |
| 0.1 | 1.1 | GO:0070327 | thyroid hormone transport(GO:0070327) |
| 0.1 | 1.2 | GO:0089711 | L-glutamate transmembrane transport(GO:0089711) |
| 0.1 | 0.3 | GO:1904747 | apoptotic process involved in mammary gland involution(GO:0060057) positive regulation of apoptotic process involved in mammary gland involution(GO:0060058) positive regulation of apoptotic process involved in morphogenesis(GO:1902339) regulation of mammary gland involution(GO:1903519) positive regulation of mammary gland involution(GO:1903521) positive regulation of apoptotic process involved in development(GO:1904747) |
| 0.1 | 1.6 | GO:0034501 | protein localization to kinetochore(GO:0034501) |
| 0.1 | 0.3 | GO:1903691 | positive regulation of wound healing, spreading of epidermal cells(GO:1903691) |
| 0.1 | 1.2 | GO:0048311 | mitochondrion distribution(GO:0048311) |
| 0.1 | 0.3 | GO:0043449 | cellular alkene metabolic process(GO:0043449) |
| 0.1 | 0.2 | GO:0070634 | transepithelial ammonium transport(GO:0070634) |
| 0.1 | 0.2 | GO:0002361 | CD4-positive, CD25-positive, alpha-beta regulatory T cell differentiation(GO:0002361) |
| 0.1 | 0.7 | GO:0042483 | negative regulation of odontogenesis(GO:0042483) |
| 0.1 | 1.1 | GO:0021694 | cerebellar Purkinje cell layer formation(GO:0021694) cerebellar Purkinje cell differentiation(GO:0021702) |
| 0.1 | 0.8 | GO:0030951 | establishment or maintenance of microtubule cytoskeleton polarity(GO:0030951) |
| 0.1 | 1.9 | GO:1901739 | regulation of myoblast fusion(GO:1901739) |
| 0.1 | 0.3 | GO:0032641 | negative regulation of T cell tolerance induction(GO:0002665) negative regulation of T cell anergy(GO:0002668) negative regulation of lymphocyte anergy(GO:0002912) lymphotoxin A production(GO:0032641) regulation of lymphotoxin A production(GO:0032681) positive regulation of lymphotoxin A production(GO:0032761) lymphotoxin A biosynthetic process(GO:0042109) regulation of lymphotoxin A biosynthetic process(GO:0043016) positive regulation of lymphotoxin A biosynthetic process(GO:0043017) |
| 0.1 | 0.2 | GO:1990262 | regulation of anti-Mullerian hormone signaling pathway(GO:1902612) negative regulation of anti-Mullerian hormone signaling pathway(GO:1902613) anti-Mullerian hormone signaling pathway(GO:1990262) |
| 0.1 | 3.1 | GO:0010613 | positive regulation of cardiac muscle hypertrophy(GO:0010613) positive regulation of muscle hypertrophy(GO:0014742) |
| 0.1 | 0.3 | GO:0086053 | AV node cell to bundle of His cell communication by electrical coupling(GO:0086053) |
| 0.1 | 0.5 | GO:0006432 | phenylalanyl-tRNA aminoacylation(GO:0006432) |
| 0.1 | 0.3 | GO:0002101 | tRNA wobble cytosine modification(GO:0002101) |
| 0.1 | 2.2 | GO:0071294 | cellular response to zinc ion(GO:0071294) |
| 0.1 | 0.9 | GO:0007039 | protein catabolic process in the vacuole(GO:0007039) |
| 0.1 | 0.3 | GO:0048058 | compound eye corneal lens development(GO:0048058) |
| 0.1 | 0.5 | GO:0031953 | negative regulation of protein autophosphorylation(GO:0031953) |
| 0.1 | 0.2 | GO:1902263 | apoptotic process involved in embryonic digit morphogenesis(GO:1902263) |
| 0.1 | 0.7 | GO:0036072 | intramembranous ossification(GO:0001957) direct ossification(GO:0036072) |
| 0.1 | 0.3 | GO:0007174 | epidermal growth factor catabolic process(GO:0007174) |
| 0.1 | 0.4 | GO:0010813 | neuropeptide catabolic process(GO:0010813) substance P catabolic process(GO:0010814) calcitonin catabolic process(GO:0010816) endothelin maturation(GO:0034959) |
| 0.1 | 0.2 | GO:0032930 | positive regulation of superoxide anion generation(GO:0032930) |
| 0.1 | 1.6 | GO:0002523 | leukocyte migration involved in inflammatory response(GO:0002523) |
| 0.1 | 0.2 | GO:1901382 | chorionic trophoblast cell proliferation(GO:0097360) regulation of chorionic trophoblast cell proliferation(GO:1901382) |
| 0.1 | 0.6 | GO:0006704 | glucocorticoid biosynthetic process(GO:0006704) |
| 0.1 | 0.2 | GO:0070093 | negative regulation of glucagon secretion(GO:0070093) |
| 0.1 | 0.3 | GO:0060327 | cytoplasmic actin-based contraction involved in cell motility(GO:0060327) |
| 0.1 | 0.4 | GO:0000393 | spliceosomal conformational changes to generate catalytic conformation(GO:0000393) |
| 0.1 | 1.6 | GO:0051923 | sulfation(GO:0051923) |
| 0.1 | 0.3 | GO:0003430 | growth plate cartilage chondrocyte growth(GO:0003430) |
| 0.1 | 0.3 | GO:0030573 | bile acid catabolic process(GO:0030573) |
| 0.1 | 0.3 | GO:0050942 | regulation of pigment cell differentiation(GO:0050932) positive regulation of pigment cell differentiation(GO:0050942) |
| 0.1 | 0.4 | GO:0070086 | ubiquitin-dependent endocytosis(GO:0070086) |
| 0.1 | 0.7 | GO:0001976 | neurological system process involved in regulation of systemic arterial blood pressure(GO:0001976) |
| 0.1 | 1.1 | GO:0071803 | positive regulation of podosome assembly(GO:0071803) |
| 0.1 | 0.3 | GO:2000642 | negative regulation of early endosome to late endosome transport(GO:2000642) |
| 0.1 | 0.3 | GO:0090234 | regulation of kinetochore assembly(GO:0090234) |
| 0.1 | 0.6 | GO:2000771 | regulation of unidimensional cell growth(GO:0051510) negative regulation of unidimensional cell growth(GO:0051511) establishment of cell polarity regulating cell shape(GO:0071964) regulation of establishment or maintenance of cell polarity regulating cell shape(GO:2000769) positive regulation of establishment or maintenance of cell polarity regulating cell shape(GO:2000771) regulation of establishment of cell polarity regulating cell shape(GO:2000782) positive regulation of establishment of cell polarity regulating cell shape(GO:2000784) positive regulation of barbed-end actin filament capping(GO:2000814) |
| 0.1 | 0.3 | GO:0035106 | operant conditioning(GO:0035106) |
| 0.1 | 0.3 | GO:0003344 | pericardium morphogenesis(GO:0003344) |
| 0.1 | 1.2 | GO:0098912 | membrane depolarization during atrial cardiac muscle cell action potential(GO:0098912) |
| 0.1 | 0.2 | GO:0045410 | positive regulation of interleukin-6 biosynthetic process(GO:0045410) |
| 0.1 | 0.8 | GO:0002051 | osteoblast fate commitment(GO:0002051) |
| 0.1 | 0.3 | GO:0060708 | spongiotrophoblast differentiation(GO:0060708) |
| 0.1 | 1.1 | GO:1900029 | positive regulation of ruffle assembly(GO:1900029) |
| 0.1 | 0.3 | GO:0009826 | unidimensional cell growth(GO:0009826) |
| 0.1 | 0.9 | GO:0098856 | intestinal cholesterol absorption(GO:0030299) intestinal lipid absorption(GO:0098856) |
| 0.1 | 0.3 | GO:0015785 | UDP-galactose transport(GO:0015785) UDP-galactose transmembrane transport(GO:0072334) |
| 0.1 | 1.6 | GO:0003334 | keratinocyte development(GO:0003334) |
| 0.1 | 0.9 | GO:0002475 | antigen processing and presentation via MHC class Ib(GO:0002475) |
| 0.1 | 0.3 | GO:0036343 | psychomotor behavior(GO:0036343) |
| 0.1 | 0.2 | GO:1904304 | regulation of gastro-intestinal system smooth muscle contraction(GO:1904304) positive regulation of gastro-intestinal system smooth muscle contraction(GO:1904306) |
| 0.1 | 0.3 | GO:0010900 | negative regulation of phosphatidylcholine catabolic process(GO:0010900) |
| 0.1 | 0.7 | GO:2000427 | positive regulation of apoptotic cell clearance(GO:2000427) |
| 0.1 | 0.3 | GO:2000297 | negative regulation of synapse maturation(GO:2000297) |
| 0.1 | 0.3 | GO:1901843 | positive regulation of high voltage-gated calcium channel activity(GO:1901843) |
| 0.1 | 0.8 | GO:0017121 | phospholipid scrambling(GO:0017121) |
| 0.1 | 1.1 | GO:0001553 | luteinization(GO:0001553) |
| 0.1 | 0.2 | GO:0036269 | swimming behavior(GO:0036269) |
| 0.1 | 0.6 | GO:0031860 | regulation of DNA-dependent DNA replication initiation(GO:0030174) telomeric 3' overhang formation(GO:0031860) |
| 0.1 | 0.2 | GO:0071421 | manganese ion transmembrane transport(GO:0071421) |
| 0.1 | 0.9 | GO:0060088 | auditory receptor cell stereocilium organization(GO:0060088) |
| 0.1 | 0.2 | GO:0002874 | regulation of chronic inflammatory response to antigenic stimulus(GO:0002874) positive regulation of chronic inflammatory response to antigenic stimulus(GO:0002876) |
| 0.1 | 0.4 | GO:0006642 | triglyceride mobilization(GO:0006642) |
| 0.1 | 0.4 | GO:0071918 | urea transmembrane transport(GO:0071918) |
| 0.1 | 0.2 | GO:0038162 | erythropoietin-mediated signaling pathway(GO:0038162) |
| 0.1 | 0.3 | GO:0061739 | protein lipidation involved in autophagosome assembly(GO:0061739) |
| 0.1 | 0.5 | GO:0071899 | regulation of estrogen receptor binding(GO:0071898) negative regulation of estrogen receptor binding(GO:0071899) |
| 0.1 | 0.2 | GO:0030718 | germ-line stem cell population maintenance(GO:0030718) |
| 0.1 | 0.8 | GO:0048149 | behavioral response to ethanol(GO:0048149) |
| 0.1 | 0.6 | GO:0072584 | caveolin-mediated endocytosis(GO:0072584) |
| 0.1 | 0.4 | GO:0051122 | hepoxilin metabolic process(GO:0051121) hepoxilin biosynthetic process(GO:0051122) |
| 0.1 | 0.9 | GO:0071402 | cellular response to lipoprotein particle stimulus(GO:0071402) |
| 0.1 | 0.3 | GO:0035544 | negative regulation of SNARE complex assembly(GO:0035544) |
| 0.1 | 0.6 | GO:0072383 | plus-end-directed vesicle transport along microtubule(GO:0072383) plus-end-directed organelle transport along microtubule(GO:0072386) |
| 0.1 | 1.2 | GO:0006020 | inositol metabolic process(GO:0006020) |
| 0.1 | 0.5 | GO:0060356 | leucine import(GO:0060356) |
| 0.1 | 1.6 | GO:0006957 | complement activation, alternative pathway(GO:0006957) |
| 0.1 | 0.3 | GO:0003366 | cell-matrix adhesion involved in ameboidal cell migration(GO:0003366) |
| 0.1 | 0.5 | GO:0044146 | negative regulation of growth of symbiont involved in interaction with host(GO:0044146) |
| 0.1 | 0.2 | GO:1902081 | regulation of calcium ion import into sarcoplasmic reticulum(GO:1902080) negative regulation of calcium ion import into sarcoplasmic reticulum(GO:1902081) |
| 0.1 | 0.8 | GO:1902414 | protein localization to cell junction(GO:1902414) |
| 0.1 | 0.5 | GO:0044341 | sodium-dependent phosphate transport(GO:0044341) |
| 0.1 | 0.3 | GO:1901626 | regulation of postsynaptic membrane organization(GO:1901626) |
| 0.1 | 0.3 | GO:0090155 | negative regulation of sphingolipid biosynthetic process(GO:0090155) cellular sphingolipid homeostasis(GO:0090156) negative regulation of ceramide biosynthetic process(GO:1900060) |
| 0.1 | 0.2 | GO:1903031 | regulation of microtubule plus-end binding(GO:1903031) positive regulation of microtubule plus-end binding(GO:1903033) |
| 0.1 | 0.4 | GO:0046208 | spermine catabolic process(GO:0046208) |
| 0.1 | 0.4 | GO:0007406 | negative regulation of neuroblast proliferation(GO:0007406) |
| 0.1 | 1.1 | GO:0031272 | regulation of pseudopodium assembly(GO:0031272) |
| 0.1 | 0.4 | GO:2000406 | positive regulation of T cell migration(GO:2000406) |
| 0.1 | 0.2 | GO:1901073 | N-acetylglucosamine biosynthetic process(GO:0006045) glucosamine-containing compound biosynthetic process(GO:1901073) |
| 0.1 | 0.4 | GO:0045204 | MAPK export from nucleus(GO:0045204) |
| 0.1 | 0.4 | GO:0042986 | positive regulation of amyloid precursor protein biosynthetic process(GO:0042986) |
| 0.1 | 0.1 | GO:1901859 | regulation of mitochondrial DNA replication(GO:0090296) negative regulation of mitochondrial DNA replication(GO:0090298) negative regulation of mitochondrial DNA metabolic process(GO:1901859) |
| 0.1 | 0.9 | GO:0006776 | vitamin A metabolic process(GO:0006776) |
| 0.1 | 0.8 | GO:0031087 | deadenylation-independent decapping of nuclear-transcribed mRNA(GO:0031087) |
| 0.1 | 0.9 | GO:0045161 | neuronal ion channel clustering(GO:0045161) |
| 0.1 | 0.6 | GO:0006682 | galactosylceramide biosynthetic process(GO:0006682) galactolipid biosynthetic process(GO:0019375) |
| 0.1 | 2.2 | GO:0051156 | glucose 6-phosphate metabolic process(GO:0051156) |
| 0.1 | 0.4 | GO:1900223 | positive regulation of beta-amyloid clearance(GO:1900223) |
| 0.1 | 0.3 | GO:1901842 | negative regulation of high voltage-gated calcium channel activity(GO:1901842) |
| 0.1 | 0.6 | GO:0045039 | protein import into mitochondrial inner membrane(GO:0045039) |
| 0.1 | 0.2 | GO:0042631 | cellular response to water deprivation(GO:0042631) |
| 0.1 | 1.4 | GO:0046931 | pore complex assembly(GO:0046931) |
| 0.1 | 0.4 | GO:0045217 | cell-cell junction maintenance(GO:0045217) |
| 0.1 | 0.9 | GO:0090204 | protein localization to nuclear pore(GO:0090204) |
| 0.1 | 0.3 | GO:0032581 | ER-dependent peroxisome organization(GO:0032581) |
| 0.1 | 0.3 | GO:0035989 | tendon development(GO:0035989) |
| 0.1 | 0.3 | GO:0061724 | lipophagy(GO:0061724) |
| 0.1 | 0.4 | GO:0002933 | lipid hydroxylation(GO:0002933) |
| 0.1 | 0.2 | GO:0015670 | carbon dioxide transport(GO:0015670) |
| 0.1 | 0.8 | GO:0030321 | transepithelial chloride transport(GO:0030321) |
| 0.1 | 0.6 | GO:0031053 | primary miRNA processing(GO:0031053) |
| 0.1 | 0.5 | GO:2000543 | positive regulation of gastrulation(GO:2000543) |
| 0.1 | 0.3 | GO:1903251 | multi-ciliated epithelial cell differentiation(GO:1903251) |
| 0.1 | 0.7 | GO:1901096 | regulation of autophagosome maturation(GO:1901096) |
| 0.1 | 0.3 | GO:0019249 | lactate biosynthetic process(GO:0019249) |
| 0.1 | 1.0 | GO:1903543 | positive regulation of exosomal secretion(GO:1903543) |
| 0.1 | 0.1 | GO:0036023 | limb joint morphogenesis(GO:0036022) embryonic skeletal limb joint morphogenesis(GO:0036023) |
| 0.1 | 0.4 | GO:0046340 | diacylglycerol catabolic process(GO:0046340) |
| 0.1 | 0.4 | GO:2000301 | negative regulation of synaptic vesicle exocytosis(GO:2000301) |
| 0.1 | 0.3 | GO:0034331 | cell junction maintenance(GO:0034331) |
| 0.1 | 0.1 | GO:0061101 | neuroendocrine cell differentiation(GO:0061101) |
| 0.1 | 0.6 | GO:0035986 | senescence-associated heterochromatin focus assembly(GO:0035986) |
| 0.1 | 0.2 | GO:0060369 | positive regulation of Fc receptor mediated stimulatory signaling pathway(GO:0060369) |
| 0.1 | 0.7 | GO:0051967 | negative regulation of synaptic transmission, glutamatergic(GO:0051967) |
| 0.1 | 0.1 | GO:0016198 | axon choice point recognition(GO:0016198) |
| 0.1 | 0.3 | GO:0008616 | queuosine biosynthetic process(GO:0008616) queuosine metabolic process(GO:0046116) |
| 0.1 | 0.3 | GO:0071934 | thiamine transmembrane transport(GO:0071934) |
| 0.1 | 0.3 | GO:0090095 | regulation of metanephric cap mesenchymal cell proliferation(GO:0090095) positive regulation of metanephric cap mesenchymal cell proliferation(GO:0090096) |
| 0.1 | 0.6 | GO:0034134 | toll-like receptor 2 signaling pathway(GO:0034134) |
| 0.1 | 0.4 | GO:2000234 | positive regulation of ribosome biogenesis(GO:0090070) positive regulation of rRNA processing(GO:2000234) |
| 0.1 | 0.5 | GO:1902723 | negative regulation of skeletal muscle cell proliferation(GO:0014859) negative regulation of skeletal muscle satellite cell proliferation(GO:1902723) |
| 0.1 | 0.1 | GO:1901094 | regulation of protein tetramerization(GO:1901090) negative regulation of protein tetramerization(GO:1901091) regulation of protein homotetramerization(GO:1901093) negative regulation of protein homotetramerization(GO:1901094) |
| 0.1 | 0.2 | GO:0018874 | benzoate metabolic process(GO:0018874) |
| 0.1 | 0.2 | GO:0099538 | synaptic signaling via neuropeptide(GO:0099538) trans-synaptic signaling by neuropeptide(GO:0099540) trans-synaptic signaling by neuropeptide, modulating synaptic transmission(GO:0099551) |
| 0.1 | 0.7 | GO:0061087 | positive regulation of histone H3-K27 methylation(GO:0061087) |
| 0.1 | 0.5 | GO:0001781 | neutrophil apoptotic process(GO:0001781) regulation of neutrophil apoptotic process(GO:0033029) |
| 0.1 | 0.2 | GO:0090222 | centrosome-templated microtubule nucleation(GO:0090222) |
| 0.1 | 3.4 | GO:2000649 | regulation of sodium ion transmembrane transporter activity(GO:2000649) |
| 0.1 | 0.3 | GO:0010760 | negative regulation of macrophage chemotaxis(GO:0010760) positive regulation of estrogen secretion(GO:2000863) positive regulation of estradiol secretion(GO:2000866) |
| 0.1 | 0.3 | GO:0071418 | cellular response to amine stimulus(GO:0071418) |
| 0.1 | 0.1 | GO:0007518 | myoblast fate determination(GO:0007518) |
| 0.1 | 0.1 | GO:0052509 | induction by symbiont of host defense response(GO:0044416) induction of host immune response by virus(GO:0046730) active induction of host immune response by virus(GO:0046732) modulation by symbiont of host defense response(GO:0052031) induction by organism of defense response of other organism involved in symbiotic interaction(GO:0052251) modulation by organism of defense response of other organism involved in symbiotic interaction(GO:0052255) positive regulation by symbiont of host defense response(GO:0052509) positive regulation by organism of defense response of other organism involved in symbiotic interaction(GO:0052510) modulation by organism of immune response of other organism involved in symbiotic interaction(GO:0052552) modulation by symbiont of host immune response(GO:0052553) modulation by virus of host immune response(GO:0075528) |
| 0.1 | 0.1 | GO:0043652 | engulfment of apoptotic cell(GO:0043652) |
| 0.1 | 0.3 | GO:1903215 | negative regulation of protein targeting to mitochondrion(GO:1903215) |
| 0.1 | 0.2 | GO:0015840 | urea transport(GO:0015840) |
| 0.1 | 0.3 | GO:0060040 | retinal bipolar neuron differentiation(GO:0060040) |
| 0.1 | 0.3 | GO:0008295 | spermidine biosynthetic process(GO:0008295) |
| 0.1 | 0.3 | GO:0045065 | cytotoxic T cell differentiation(GO:0045065) |
| 0.1 | 0.9 | GO:0043562 | cellular response to nitrogen starvation(GO:0006995) cellular response to nitrogen levels(GO:0043562) |
| 0.1 | 0.6 | GO:0070586 | cell-cell adhesion involved in gastrulation(GO:0070586) |
| 0.1 | 0.2 | GO:1903431 | positive regulation of cell maturation(GO:1903431) |
| 0.1 | 0.4 | GO:0070995 | NADPH oxidation(GO:0070995) |
| 0.1 | 0.4 | GO:0072180 | mesonephric duct morphogenesis(GO:0072180) |
| 0.1 | 1.0 | GO:1903140 | regulation of endothelial cell development(GO:1901550) regulation of establishment of endothelial barrier(GO:1903140) |
| 0.1 | 0.3 | GO:0002447 | eosinophil activation involved in immune response(GO:0002278) eosinophil mediated immunity(GO:0002447) eosinophil degranulation(GO:0043308) regulation of histamine secretion by mast cell(GO:1903593) |
| 0.1 | 0.3 | GO:1904566 | response to 1-oleoyl-sn-glycerol 3-phosphate(GO:1904565) cellular response to 1-oleoyl-sn-glycerol 3-phosphate(GO:1904566) |
| 0.1 | 0.2 | GO:0071503 | response to heparin(GO:0071503) |
| 0.1 | 0.2 | GO:0045780 | positive regulation of bone resorption(GO:0045780) positive regulation of bone remodeling(GO:0046852) |
| 0.1 | 0.1 | GO:0097272 | ammonia homeostasis(GO:0097272) |
| 0.1 | 0.4 | GO:0036438 | maintenance of lens transparency(GO:0036438) |
| 0.1 | 1.0 | GO:0000479 | endonucleolytic cleavage of tricistronic rRNA transcript (SSU-rRNA, 5.8S rRNA, LSU-rRNA)(GO:0000479) |
| 0.1 | 0.9 | GO:0006044 | N-acetylglucosamine metabolic process(GO:0006044) |
| 0.1 | 0.2 | GO:1903070 | negative regulation of ER-associated ubiquitin-dependent protein catabolic process(GO:1903070) |
| 0.1 | 0.8 | GO:0032074 | negative regulation of nuclease activity(GO:0032074) |
| 0.1 | 0.2 | GO:0070317 | negative regulation of G0 to G1 transition(GO:0070317) |
| 0.1 | 0.5 | GO:0032695 | negative regulation of interleukin-12 production(GO:0032695) |
| 0.1 | 0.7 | GO:0006030 | chitin metabolic process(GO:0006030) chitin catabolic process(GO:0006032) glucosamine-containing compound catabolic process(GO:1901072) |
| 0.1 | 1.3 | GO:0046339 | diacylglycerol metabolic process(GO:0046339) |
| 0.1 | 0.7 | GO:0045063 | T-helper 1 cell differentiation(GO:0045063) |
| 0.1 | 0.2 | GO:0000117 | regulation of transcription involved in G2/M transition of mitotic cell cycle(GO:0000117) |
| 0.1 | 0.7 | GO:0061088 | regulation of sequestering of zinc ion(GO:0061088) |
| 0.1 | 0.2 | GO:0001828 | inner cell mass cell fate commitment(GO:0001827) inner cell mass cellular morphogenesis(GO:0001828) |
| 0.1 | 0.5 | GO:0002084 | protein depalmitoylation(GO:0002084) |
| 0.1 | 0.2 | GO:0008272 | sulfate transport(GO:0008272) |
| 0.1 | 0.6 | GO:0045329 | carnitine biosynthetic process(GO:0045329) |
| 0.1 | 0.2 | GO:0015855 | pyrimidine nucleobase transport(GO:0015855) purine nucleobase transmembrane transport(GO:1904823) |
| 0.1 | 0.5 | GO:0002759 | regulation of antimicrobial humoral response(GO:0002759) |
| 0.1 | 0.1 | GO:0039019 | pronephric nephron development(GO:0039019) |
| 0.1 | 3.1 | GO:0006730 | one-carbon metabolic process(GO:0006730) |
| 0.1 | 0.3 | GO:0050747 | positive regulation of lipoprotein metabolic process(GO:0050747) |
| 0.1 | 0.2 | GO:0009386 | translational attenuation(GO:0009386) |
| 0.1 | 0.2 | GO:0034224 | cellular response to zinc ion starvation(GO:0034224) |
| 0.1 | 0.5 | GO:1901318 | negative regulation of sperm motility(GO:1901318) |
| 0.1 | 0.4 | GO:1901297 | arterial endothelial cell fate commitment(GO:0060844) blood vessel lumenization(GO:0072554) positive regulation of ephrin receptor signaling pathway(GO:1901189) positive regulation of canonical Wnt signaling pathway involved in cardiac muscle cell fate commitment(GO:1901297) positive regulation of canonical Wnt signaling pathway involved in heart development(GO:1905068) |
| 0.1 | 0.5 | GO:0006883 | cellular sodium ion homeostasis(GO:0006883) |
| 0.1 | 0.1 | GO:0035791 | platelet-derived growth factor receptor-beta signaling pathway(GO:0035791) |
| 0.1 | 0.3 | GO:1900112 | regulation of histone H3-K9 trimethylation(GO:1900112) |
| 0.1 | 0.2 | GO:0071596 | ubiquitin-dependent protein catabolic process via the N-end rule pathway(GO:0071596) |
| 0.1 | 0.6 | GO:0032287 | peripheral nervous system myelin maintenance(GO:0032287) |
| 0.1 | 0.5 | GO:0010818 | T cell chemotaxis(GO:0010818) |
| 0.1 | 0.3 | GO:0007016 | cytoskeletal anchoring at plasma membrane(GO:0007016) |
| 0.1 | 0.5 | GO:0006048 | UDP-N-acetylglucosamine biosynthetic process(GO:0006048) amino sugar biosynthetic process(GO:0046349) |
| 0.1 | 0.5 | GO:0030202 | heparin metabolic process(GO:0030202) heparin biosynthetic process(GO:0030210) |
| 0.1 | 0.3 | GO:0015808 | L-alanine transport(GO:0015808) |
| 0.1 | 1.5 | GO:0042730 | fibrinolysis(GO:0042730) |
| 0.1 | 0.3 | GO:1904220 | regulation of serine C-palmitoyltransferase activity(GO:1904220) |
| 0.1 | 0.1 | GO:1902623 | negative regulation of granulocyte chemotaxis(GO:0071623) negative regulation of neutrophil chemotaxis(GO:0090024) negative regulation of neutrophil migration(GO:1902623) |
| 0.1 | 0.4 | GO:0034773 | histone H4-K20 trimethylation(GO:0034773) |
| 0.1 | 0.1 | GO:0048087 | positive regulation of developmental pigmentation(GO:0048087) |
| 0.1 | 0.6 | GO:0001672 | regulation of chromatin assembly or disassembly(GO:0001672) |
| 0.1 | 1.2 | GO:0006851 | mitochondrial calcium ion transport(GO:0006851) |
| 0.1 | 0.3 | GO:1900748 | positive regulation of vascular endothelial growth factor signaling pathway(GO:1900748) |
| 0.1 | 0.2 | GO:0001831 | trophectodermal cellular morphogenesis(GO:0001831) |
| 0.1 | 0.9 | GO:0007021 | tubulin complex assembly(GO:0007021) |
| 0.1 | 0.1 | GO:0018963 | phthalate metabolic process(GO:0018963) |
| 0.1 | 0.2 | GO:0042346 | positive regulation of NF-kappaB import into nucleus(GO:0042346) |
| 0.1 | 0.4 | GO:0055129 | L-proline biosynthetic process(GO:0055129) |
| 0.1 | 0.4 | GO:0035616 | histone H2B conserved C-terminal lysine deubiquitination(GO:0035616) |
| 0.1 | 0.5 | GO:0072344 | rescue of stalled ribosome(GO:0072344) |
| 0.1 | 0.9 | GO:0070208 | protein heterotrimerization(GO:0070208) |
| 0.1 | 0.5 | GO:0048280 | vesicle fusion with Golgi apparatus(GO:0048280) |
| 0.1 | 5.2 | GO:0042590 | antigen processing and presentation of exogenous peptide antigen via MHC class I(GO:0042590) |
| 0.1 | 0.7 | GO:0070307 | lens fiber cell development(GO:0070307) |
| 0.1 | 0.7 | GO:0010713 | negative regulation of collagen metabolic process(GO:0010713) |
| 0.1 | 1.1 | GO:1902083 | negative regulation of peptidyl-cysteine S-nitrosylation(GO:1902083) |
| 0.1 | 0.3 | GO:2000628 | regulation of miRNA metabolic process(GO:2000628) |
| 0.1 | 0.1 | GO:0007176 | regulation of epidermal growth factor-activated receptor activity(GO:0007176) |
| 0.1 | 1.6 | GO:0035024 | negative regulation of Rho protein signal transduction(GO:0035024) |
| 0.1 | 0.3 | GO:0032911 | negative regulation of transforming growth factor beta1 production(GO:0032911) |
| 0.1 | 0.1 | GO:0030185 | nitric oxide transport(GO:0030185) |
| 0.1 | 5.1 | GO:0006501 | C-terminal protein lipidation(GO:0006501) |
| 0.1 | 0.2 | GO:0034402 | recruitment of 3'-end processing factors to RNA polymerase II holoenzyme complex(GO:0034402) |
| 0.1 | 0.3 | GO:1902412 | regulation of mitotic cytokinesis(GO:1902412) |
| 0.1 | 1.0 | GO:0030575 | nuclear body organization(GO:0030575) |
| 0.1 | 0.5 | GO:0060039 | pericardium development(GO:0060039) |
| 0.1 | 0.3 | GO:0035630 | bone mineralization involved in bone maturation(GO:0035630) |
| 0.1 | 0.6 | GO:0051531 | NFAT protein import into nucleus(GO:0051531) |
| 0.1 | 0.1 | GO:0021764 | amygdala development(GO:0021764) |
| 0.1 | 0.2 | GO:0032534 | regulation of microvillus assembly(GO:0032534) |
| 0.1 | 0.2 | GO:2000819 | regulation of nucleotide-excision repair(GO:2000819) |
| 0.1 | 0.2 | GO:0070105 | positive regulation of interleukin-6-mediated signaling pathway(GO:0070105) |
| 0.1 | 0.7 | GO:0060712 | spongiotrophoblast layer development(GO:0060712) |
| 0.1 | 0.2 | GO:0038163 | thrombopoietin-mediated signaling pathway(GO:0038163) |
| 0.1 | 0.1 | GO:0097278 | complement-dependent cytotoxicity(GO:0097278) |
| 0.1 | 0.3 | GO:0002357 | defense response to tumor cell(GO:0002357) |
| 0.1 | 0.2 | GO:0070904 | L-ascorbic acid transport(GO:0015882) transepithelial L-ascorbic acid transport(GO:0070904) |
| 0.1 | 1.3 | GO:0090162 | establishment of epithelial cell polarity(GO:0090162) |
| 0.1 | 0.4 | GO:0001705 | ectoderm formation(GO:0001705) ectodermal cell fate commitment(GO:0001712) |
| 0.1 | 0.5 | GO:0016322 | neuron remodeling(GO:0016322) |
| 0.1 | 0.3 | GO:0034227 | tRNA thio-modification(GO:0034227) |
| 0.0 | 0.2 | GO:0071894 | histone H2B conserved C-terminal lysine ubiquitination(GO:0071894) |
| 0.0 | 0.1 | GO:0021553 | olfactory nerve development(GO:0021553) |
| 0.0 | 0.6 | GO:0019511 | peptidyl-proline hydroxylation(GO:0019511) |
| 0.0 | 0.2 | GO:0071313 | cellular response to caffeine(GO:0071313) |
| 0.0 | 0.1 | GO:0000212 | meiotic spindle organization(GO:0000212) |
| 0.0 | 0.1 | GO:0060729 | intestinal epithelial structure maintenance(GO:0060729) |
| 0.0 | 0.0 | GO:0031959 | mineralocorticoid receptor signaling pathway(GO:0031959) |
| 0.0 | 0.2 | GO:0007206 | phospholipase C-activating G-protein coupled glutamate receptor signaling pathway(GO:0007206) |
| 0.0 | 0.4 | GO:0032218 | riboflavin transport(GO:0032218) |
| 0.0 | 0.2 | GO:0048241 | epinephrine transport(GO:0048241) |
| 0.0 | 0.1 | GO:0043006 | reduction of food intake in response to dietary excess(GO:0002023) activation of phospholipase A2 activity by calcium-mediated signaling(GO:0043006) |
| 0.0 | 1.0 | GO:0035456 | response to interferon-beta(GO:0035456) |
| 0.0 | 0.1 | GO:0019230 | proprioception(GO:0019230) |
| 0.0 | 0.5 | GO:0086069 | bundle of His cell to Purkinje myocyte communication(GO:0086069) |
| 0.0 | 0.3 | GO:0070127 | tRNA aminoacylation for mitochondrial protein translation(GO:0070127) |
| 0.0 | 0.1 | GO:0052331 | cytolysis by symbiont of host cells(GO:0001897) hemolysis by symbiont of host erythrocytes(GO:0019836) hemolysis in other organism(GO:0044179) hemolysis in other organism involved in symbiotic interaction(GO:0052331) |
| 0.0 | 0.2 | GO:0071955 | recycling endosome to Golgi transport(GO:0071955) |
| 0.0 | 0.1 | GO:0003363 | lamellipodium assembly involved in ameboidal cell migration(GO:0003363) |
| 0.0 | 2.5 | GO:0021762 | substantia nigra development(GO:0021762) |
| 0.0 | 0.4 | GO:0097577 | intracellular sequestering of iron ion(GO:0006880) sequestering of iron ion(GO:0097577) |
| 0.0 | 0.3 | GO:1903921 | protein processing in phagocytic vesicle(GO:1900756) regulation of protein processing in phagocytic vesicle(GO:1903921) positive regulation of protein processing in phagocytic vesicle(GO:1903923) |
| 0.0 | 0.3 | GO:0032482 | Rab protein signal transduction(GO:0032482) |
| 0.0 | 0.6 | GO:0070584 | mitochondrion morphogenesis(GO:0070584) |
| 0.0 | 0.4 | GO:0006054 | N-acetylneuraminate metabolic process(GO:0006054) |
| 0.0 | 0.5 | GO:0010592 | positive regulation of lamellipodium assembly(GO:0010592) |
| 0.0 | 0.2 | GO:0046075 | dTTP metabolic process(GO:0046075) |
| 0.0 | 0.2 | GO:0018916 | nitrobenzene metabolic process(GO:0018916) |
| 0.0 | 0.1 | GO:0061537 | glycine secretion(GO:0061536) glycine secretion, neurotransmission(GO:0061537) |
| 0.0 | 0.3 | GO:0016554 | cytidine to uridine editing(GO:0016554) |
| 0.0 | 0.1 | GO:0060018 | astrocyte fate commitment(GO:0060018) |
| 0.0 | 0.1 | GO:1903259 | exon-exon junction complex disassembly(GO:1903259) |
| 0.0 | 0.5 | GO:1904706 | negative regulation of vascular smooth muscle cell proliferation(GO:1904706) |
| 0.0 | 0.4 | GO:0016560 | protein import into peroxisome matrix, docking(GO:0016560) |
| 0.0 | 0.3 | GO:0060385 | axonogenesis involved in innervation(GO:0060385) |
| 0.0 | 3.3 | GO:0045071 | negative regulation of viral genome replication(GO:0045071) |
| 0.0 | 0.9 | GO:0070306 | lens fiber cell differentiation(GO:0070306) |
| 0.0 | 0.1 | GO:0030037 | actin filament reorganization involved in cell cycle(GO:0030037) |
| 0.0 | 0.2 | GO:0032927 | positive regulation of activin receptor signaling pathway(GO:0032927) |
| 0.0 | 0.4 | GO:0008063 | Toll signaling pathway(GO:0008063) |
| 0.0 | 0.4 | GO:0008627 | intrinsic apoptotic signaling pathway in response to osmotic stress(GO:0008627) |
| 0.0 | 0.2 | GO:0046874 | quinolinate metabolic process(GO:0046874) |
| 0.0 | 0.5 | GO:0060314 | regulation of ryanodine-sensitive calcium-release channel activity(GO:0060314) |
| 0.0 | 0.3 | GO:0010898 | positive regulation of triglyceride catabolic process(GO:0010898) |
| 0.0 | 0.1 | GO:0003420 | regulation of growth plate cartilage chondrocyte proliferation(GO:0003420) histone H3-R2 methylation(GO:0034970) |
| 0.0 | 0.2 | GO:0046391 | 5-phosphoribose 1-diphosphate biosynthetic process(GO:0006015) 5-phosphoribose 1-diphosphate metabolic process(GO:0046391) |
| 0.0 | 2.3 | GO:0000413 | protein peptidyl-prolyl isomerization(GO:0000413) |
| 0.0 | 0.2 | GO:1902626 | assembly of large subunit precursor of preribosome(GO:1902626) |
| 0.0 | 0.1 | GO:1900138 | negative regulation of phospholipase A2 activity(GO:1900138) |
| 0.0 | 0.7 | GO:0051601 | exocyst localization(GO:0051601) |
| 0.0 | 0.4 | GO:0009226 | nucleotide-sugar biosynthetic process(GO:0009226) |
| 0.0 | 0.1 | GO:0014732 | skeletal muscle atrophy(GO:0014732) striated muscle atrophy(GO:0014891) |
| 0.0 | 0.2 | GO:0006526 | arginine biosynthetic process(GO:0006526) |
| 0.0 | 0.2 | GO:1902525 | regulation of protein monoubiquitination(GO:1902525) |
| 0.0 | 0.8 | GO:0043485 | endosome to melanosome transport(GO:0035646) endosome to pigment granule transport(GO:0043485) pigment granule maturation(GO:0048757) |
| 0.0 | 0.2 | GO:2001223 | negative regulation of neuron migration(GO:2001223) |
| 0.0 | 0.8 | GO:0016973 | poly(A)+ mRNA export from nucleus(GO:0016973) |
| 0.0 | 0.4 | GO:0070475 | rRNA base methylation(GO:0070475) |
| 0.0 | 0.3 | GO:0008635 | activation of cysteine-type endopeptidase activity involved in apoptotic process by cytochrome c(GO:0008635) |
| 0.0 | 0.2 | GO:0009138 | pyrimidine nucleoside diphosphate metabolic process(GO:0009138) |
| 0.0 | 0.1 | GO:0002903 | negative regulation of B cell apoptotic process(GO:0002903) |
| 0.0 | 0.2 | GO:0070445 | oligodendrocyte progenitor proliferation(GO:0070444) regulation of oligodendrocyte progenitor proliferation(GO:0070445) |
| 0.0 | 0.1 | GO:1903580 | positive regulation of nucleoside metabolic process(GO:0045979) positive regulation of ATP metabolic process(GO:1903580) |
| 0.0 | 1.3 | GO:0008053 | mitochondrial fusion(GO:0008053) |
| 0.0 | 0.0 | GO:0010536 | positive regulation of activation of Janus kinase activity(GO:0010536) |
| 0.0 | 0.2 | GO:0072402 | response to cell cycle checkpoint signaling(GO:0072396) response to DNA integrity checkpoint signaling(GO:0072402) response to DNA damage checkpoint signaling(GO:0072423) |
| 0.0 | 0.8 | GO:0042136 | neurotransmitter biosynthetic process(GO:0042136) |
| 0.0 | 0.3 | GO:0002666 | positive regulation of T cell tolerance induction(GO:0002666) |
| 0.0 | 0.2 | GO:0050705 | regulation of interleukin-1 alpha production(GO:0032650) regulation of interleukin-1 alpha secretion(GO:0050705) |
| 0.0 | 0.2 | GO:0031536 | positive regulation of exit from mitosis(GO:0031536) |
| 0.0 | 1.2 | GO:0019228 | neuronal action potential(GO:0019228) |
| 0.0 | 0.2 | GO:0043653 | mitochondrial fragmentation involved in apoptotic process(GO:0043653) |
| 0.0 | 1.3 | GO:0048025 | negative regulation of mRNA splicing, via spliceosome(GO:0048025) |
| 0.0 | 0.1 | GO:0046015 | regulation of transcription by glucose(GO:0046015) |
| 0.0 | 0.4 | GO:0010960 | magnesium ion homeostasis(GO:0010960) |
| 0.0 | 0.1 | GO:1900109 | regulation of histone H3-K9 dimethylation(GO:1900109) positive regulation of histone H3-K9 dimethylation(GO:1900111) |
| 0.0 | 0.6 | GO:2000059 | negative regulation of protein ubiquitination involved in ubiquitin-dependent protein catabolic process(GO:2000059) |
| 0.0 | 0.4 | GO:0071847 | TNFSF11-mediated signaling pathway(GO:0071847) |
| 0.0 | 0.2 | GO:0072513 | positive regulation of secondary heart field cardioblast proliferation(GO:0072513) |
| 0.0 | 0.7 | GO:0015812 | gamma-aminobutyric acid transport(GO:0015812) |
| 0.0 | 0.5 | GO:0045821 | positive regulation of glycolytic process(GO:0045821) |
| 0.0 | 0.5 | GO:0006307 | DNA dealkylation involved in DNA repair(GO:0006307) |
| 0.0 | 0.8 | GO:0090004 | positive regulation of establishment of protein localization to plasma membrane(GO:0090004) |
| 0.0 | 0.4 | GO:0071578 | zinc II ion transmembrane import(GO:0071578) |
| 0.0 | 0.4 | GO:0000469 | cleavage involved in rRNA processing(GO:0000469) |
| 0.0 | 0.2 | GO:0006617 | SRP-dependent cotranslational protein targeting to membrane, signal sequence recognition(GO:0006617) |
| 0.0 | 0.3 | GO:0030423 | targeting of mRNA for destruction involved in RNA interference(GO:0030423) |
| 0.0 | 0.2 | GO:0009838 | abscission(GO:0009838) |
| 0.0 | 0.1 | GO:0036166 | phenotypic switching(GO:0036166) regulation of phenotypic switching(GO:1900239) |
| 0.0 | 0.7 | GO:0070262 | peptidyl-serine dephosphorylation(GO:0070262) |
| 0.0 | 0.0 | GO:0030223 | neutrophil differentiation(GO:0030223) |
| 0.0 | 0.1 | GO:0010587 | miRNA catabolic process(GO:0010587) |
| 0.0 | 0.2 | GO:0035524 | proline transmembrane transport(GO:0035524) |
| 0.0 | 0.5 | GO:1903286 | regulation of potassium ion import(GO:1903286) |
| 0.0 | 0.4 | GO:0035970 | peptidyl-threonine dephosphorylation(GO:0035970) |
| 0.0 | 0.2 | GO:1900378 | positive regulation of melanin biosynthetic process(GO:0048023) positive regulation of secondary metabolite biosynthetic process(GO:1900378) |
| 0.0 | 0.1 | GO:0016999 | antibiotic metabolic process(GO:0016999) |
| 0.0 | 0.6 | GO:0034695 | response to prostaglandin E(GO:0034695) |
| 0.0 | 0.2 | GO:0006177 | GMP biosynthetic process(GO:0006177) |
| 0.0 | 0.1 | GO:0071963 | establishment or maintenance of cell polarity regulating cell shape(GO:0071963) |
| 0.0 | 0.1 | GO:1900121 | negative regulation of receptor binding(GO:1900121) |
| 0.0 | 2.0 | GO:0010803 | regulation of tumor necrosis factor-mediated signaling pathway(GO:0010803) |
| 0.0 | 0.3 | GO:0070858 | negative regulation of bile acid biosynthetic process(GO:0070858) negative regulation of bile acid metabolic process(GO:1904252) |
| 0.0 | 0.3 | GO:0042256 | mature ribosome assembly(GO:0042256) |
| 0.0 | 0.0 | GO:0045414 | regulation of interleukin-8 biosynthetic process(GO:0045414) |
| 0.0 | 0.1 | GO:1900425 | negative regulation of defense response to bacterium(GO:1900425) |
| 0.0 | 0.1 | GO:1900535 | medium-chain fatty-acyl-CoA catabolic process(GO:0036114) long-chain fatty-acyl-CoA catabolic process(GO:0036116) palmitic acid metabolic process(GO:1900533) palmitic acid biosynthetic process(GO:1900535) |
| 0.0 | 0.3 | GO:0030949 | positive regulation of vascular endothelial growth factor receptor signaling pathway(GO:0030949) |
| 0.0 | 0.3 | GO:0061669 | spontaneous neurotransmitter secretion(GO:0061669) spontaneous synaptic transmission(GO:0098814) |
| 0.0 | 0.2 | GO:2000809 | positive regulation of presynaptic membrane organization(GO:1901631) positive regulation of synaptic vesicle clustering(GO:2000809) |
| 0.0 | 0.2 | GO:0015742 | alpha-ketoglutarate transport(GO:0015742) |
| 0.0 | 0.3 | GO:0046598 | positive regulation of viral entry into host cell(GO:0046598) |
| 0.0 | 0.3 | GO:0035522 | monoubiquitinated histone deubiquitination(GO:0035521) monoubiquitinated histone H2A deubiquitination(GO:0035522) |
| 0.0 | 0.4 | GO:0035721 | intraciliary retrograde transport(GO:0035721) |
| 0.0 | 0.3 | GO:0097688 | AMPA glutamate receptor clustering(GO:0097113) glutamate receptor clustering(GO:0097688) |
| 0.0 | 0.4 | GO:0048739 | cardiac muscle fiber development(GO:0048739) |
| 0.0 | 0.1 | GO:0033606 | B cell receptor transport within lipid bilayer(GO:0032595) B cell receptor transport into membrane raft(GO:0032597) protein transport out of membrane raft(GO:0032599) chemokine receptor transport out of membrane raft(GO:0032600) negative regulation of transforming growth factor beta3 production(GO:0032913) chemokine receptor transport within lipid bilayer(GO:0033606) |
| 0.0 | 1.1 | GO:0045662 | negative regulation of myoblast differentiation(GO:0045662) |
| 0.0 | 0.5 | GO:0007175 | negative regulation of epidermal growth factor-activated receptor activity(GO:0007175) |
| 0.0 | 0.3 | GO:0021979 | hypothalamus cell differentiation(GO:0021979) |
| 0.0 | 0.1 | GO:0032713 | negative regulation of interleukin-4 production(GO:0032713) |
| 0.0 | 0.2 | GO:0045647 | negative regulation of erythrocyte differentiation(GO:0045647) |
| 0.0 | 0.9 | GO:0038066 | p38MAPK cascade(GO:0038066) |
| 0.0 | 0.1 | GO:0090080 | positive regulation of MAPKKK cascade by fibroblast growth factor receptor signaling pathway(GO:0090080) |
| 0.0 | 0.2 | GO:0019464 | glycine catabolic process(GO:0006546) glycine decarboxylation via glycine cleavage system(GO:0019464) |
| 0.0 | 0.1 | GO:0000961 | negative regulation of mitochondrial RNA catabolic process(GO:0000961) |
| 0.0 | 0.2 | GO:0060054 | positive regulation of epithelial cell proliferation involved in wound healing(GO:0060054) |
| 0.0 | 0.4 | GO:0003360 | brainstem development(GO:0003360) |
| 0.0 | 0.1 | GO:1990022 | RNA polymerase II complex import to nucleus(GO:0044376) RNA polymerase III complex localization to nucleus(GO:1990022) |
| 0.0 | 0.1 | GO:0098758 | response to interleukin-8(GO:0098758) cellular response to interleukin-8(GO:0098759) |
| 0.0 | 0.2 | GO:0035881 | amacrine cell differentiation(GO:0035881) |
| 0.0 | 0.2 | GO:0071475 | cellular hyperosmotic salinity response(GO:0071475) |
| 0.0 | 0.3 | GO:0016576 | histone dephosphorylation(GO:0016576) |
| 0.0 | 1.1 | GO:1901385 | regulation of voltage-gated calcium channel activity(GO:1901385) |
| 0.0 | 0.4 | GO:0030277 | maintenance of gastrointestinal epithelium(GO:0030277) |
| 0.0 | 1.0 | GO:0042059 | negative regulation of epidermal growth factor receptor signaling pathway(GO:0042059) |
| 0.0 | 0.1 | GO:0070681 | glutaminyl-tRNAGln biosynthesis via transamidation(GO:0070681) |
| 0.0 | 2.2 | GO:0030574 | collagen catabolic process(GO:0030574) |
| 0.0 | 0.4 | GO:0050930 | induction of positive chemotaxis(GO:0050930) |
| 0.0 | 0.2 | GO:0060154 | cellular process regulating host cell cycle in response to virus(GO:0060154) |
| 0.0 | 0.7 | GO:0035590 | purinergic nucleotide receptor signaling pathway(GO:0035590) |
| 0.0 | 0.5 | GO:0010002 | cardioblast differentiation(GO:0010002) |
| 0.0 | 0.1 | GO:0021978 | telencephalon regionalization(GO:0021978) |
| 0.0 | 0.2 | GO:0045086 | positive regulation of interleukin-2 biosynthetic process(GO:0045086) |
| 0.0 | 0.1 | GO:0030472 | mitotic spindle organization in nucleus(GO:0030472) |
| 0.0 | 0.3 | GO:0007144 | female meiosis I(GO:0007144) |
| 0.0 | 0.1 | GO:2000587 | negative regulation of platelet-derived growth factor receptor-beta signaling pathway(GO:2000587) |
| 0.0 | 0.1 | GO:0061304 | retinal blood vessel morphogenesis(GO:0061304) |
| 0.0 | 0.2 | GO:0044314 | protein K27-linked ubiquitination(GO:0044314) |
| 0.0 | 0.2 | GO:0032000 | positive regulation of fatty acid beta-oxidation(GO:0032000) |
| 0.0 | 0.2 | GO:1990253 | cellular response to leucine starvation(GO:1990253) |
| 0.0 | 0.8 | GO:0060972 | left/right pattern formation(GO:0060972) |
| 0.0 | 0.2 | GO:0032740 | positive regulation of interleukin-17 production(GO:0032740) |
| 0.0 | 0.1 | GO:0046271 | phenylpropanoid catabolic process(GO:0046271) |
| 0.0 | 0.1 | GO:0006311 | meiotic gene conversion(GO:0006311) gene conversion(GO:0035822) |
| 0.0 | 1.6 | GO:0061418 | regulation of transcription from RNA polymerase II promoter in response to hypoxia(GO:0061418) |
| 0.0 | 0.4 | GO:0060484 | lung-associated mesenchyme development(GO:0060484) |
| 0.0 | 0.2 | GO:0015813 | L-glutamate transport(GO:0015813) |
| 0.0 | 0.2 | GO:0021891 | olfactory bulb interneuron development(GO:0021891) |
| 0.0 | 0.7 | GO:1901186 | positive regulation of ERBB signaling pathway(GO:1901186) |
| 0.0 | 0.5 | GO:0007398 | ectoderm development(GO:0007398) |
| 0.0 | 0.1 | GO:0098957 | anterograde axonal transport of mitochondrion(GO:0098957) |
| 0.0 | 0.2 | GO:0060391 | positive regulation of SMAD protein import into nucleus(GO:0060391) |
| 0.0 | 0.1 | GO:0090063 | positive regulation of microtubule nucleation(GO:0090063) |
| 0.0 | 0.3 | GO:0006657 | CDP-choline pathway(GO:0006657) |
| 0.0 | 0.1 | GO:0061073 | ciliary body morphogenesis(GO:0061073) |
| 0.0 | 0.1 | GO:0007500 | mesodermal cell fate determination(GO:0007500) |
| 0.0 | 0.2 | GO:0090306 | spindle assembly involved in meiosis(GO:0090306) |
| 0.0 | 0.1 | GO:0072233 | thick ascending limb development(GO:0072023) metanephric thick ascending limb development(GO:0072233) |
| 0.0 | 0.1 | GO:0014722 | regulation of skeletal muscle contraction by calcium ion signaling(GO:0014722) |
| 0.0 | 0.1 | GO:1902416 | positive regulation of mRNA binding(GO:1902416) positive regulation of RNA binding(GO:1905216) |
| 0.0 | 0.3 | GO:0045838 | positive regulation of membrane potential(GO:0045838) |
| 0.0 | 0.9 | GO:0007339 | binding of sperm to zona pellucida(GO:0007339) |
| 0.0 | 0.1 | GO:0090119 | vesicle-mediated cholesterol transport(GO:0090119) |
| 0.0 | 0.2 | GO:0032494 | response to peptidoglycan(GO:0032494) |
| 0.0 | 0.7 | GO:0034389 | lipid particle organization(GO:0034389) |
| 0.0 | 0.3 | GO:0018095 | protein polyglutamylation(GO:0018095) |
| 0.0 | 0.0 | GO:0002032 | desensitization of G-protein coupled receptor protein signaling pathway by arrestin(GO:0002032) |
| 0.0 | 0.1 | GO:0002934 | desmosome organization(GO:0002934) |
| 0.0 | 0.1 | GO:0015788 | UDP-N-acetylglucosamine transport(GO:0015788) UDP-N-acetylglucosamine transmembrane transport(GO:1990569) |
| 0.0 | 0.2 | GO:0075525 | viral translational termination-reinitiation(GO:0075525) |
| 0.0 | 0.1 | GO:0060029 | convergent extension involved in organogenesis(GO:0060029) |
| 0.0 | 0.2 | GO:0019236 | response to pheromone(GO:0019236) |
| 0.0 | 0.1 | GO:0021554 | optic nerve development(GO:0021554) |
| 0.0 | 0.1 | GO:0033386 | geranylgeranyl diphosphate metabolic process(GO:0033385) geranylgeranyl diphosphate biosynthetic process(GO:0033386) |
| 0.0 | 0.5 | GO:0060334 | regulation of interferon-gamma-mediated signaling pathway(GO:0060334) |
| 0.0 | 0.6 | GO:0048240 | sperm capacitation(GO:0048240) |
| 0.0 | 0.1 | GO:0034729 | histone H3-K79 methylation(GO:0034729) |
| 0.0 | 0.3 | GO:0097150 | neuronal stem cell population maintenance(GO:0097150) |
| 0.0 | 0.4 | GO:2000766 | negative regulation of cytoplasmic translation(GO:2000766) |
| 0.0 | 0.6 | GO:0048665 | neuron fate specification(GO:0048665) |
| 0.0 | 0.3 | GO:0019433 | triglyceride catabolic process(GO:0019433) |
| 0.0 | 0.2 | GO:0000395 | mRNA 5'-splice site recognition(GO:0000395) |
| 0.0 | 0.1 | GO:0090383 | phagosome acidification(GO:0090383) |
| 0.0 | 0.9 | GO:0006735 | NADH regeneration(GO:0006735) canonical glycolysis(GO:0061621) glucose catabolic process to pyruvate(GO:0061718) |
| 0.0 | 1.2 | GO:0045773 | positive regulation of axon extension(GO:0045773) |
| 0.0 | 1.9 | GO:0042273 | ribosomal large subunit biogenesis(GO:0042273) |
| 0.0 | 0.1 | GO:0021562 | vestibulocochlear nerve development(GO:0021562) |
| 0.0 | 0.5 | GO:0031069 | hair follicle morphogenesis(GO:0031069) |
| 0.0 | 0.1 | GO:0042270 | protection from natural killer cell mediated cytotoxicity(GO:0042270) |
| 0.0 | 1.2 | GO:0050913 | sensory perception of bitter taste(GO:0050913) |
| 0.0 | 0.2 | GO:0097500 | receptor localization to nonmotile primary cilium(GO:0097500) |
| 0.0 | 0.1 | GO:0001544 | initiation of primordial ovarian follicle growth(GO:0001544) response to water-immersion restraint stress(GO:1990785) |
| 0.0 | 0.1 | GO:0016098 | monoterpenoid metabolic process(GO:0016098) |
| 0.0 | 0.1 | GO:0032971 | regulation of muscle filament sliding(GO:0032971) |
| 0.0 | 0.3 | GO:0042355 | fucose catabolic process(GO:0019317) L-fucose metabolic process(GO:0042354) L-fucose catabolic process(GO:0042355) |
| 0.0 | 0.2 | GO:0045577 | regulation of B cell differentiation(GO:0045577) |
| 0.0 | 0.5 | GO:1903146 | regulation of mitophagy(GO:1903146) |
| 0.0 | 0.1 | GO:0035641 | locomotory exploration behavior(GO:0035641) |
| 0.0 | 0.5 | GO:0048747 | muscle fiber development(GO:0048747) |
| 0.0 | 0.4 | GO:0015884 | folic acid transport(GO:0015884) |
| 0.0 | 2.4 | GO:0010923 | negative regulation of phosphatase activity(GO:0010923) |
| 0.0 | 0.1 | GO:0042040 | molybdenum incorporation into molybdenum-molybdopterin complex(GO:0018315) metal incorporation into metallo-molybdopterin complex(GO:0042040) glycine receptor clustering(GO:0072579) |
| 0.0 | 0.1 | GO:0045835 | negative regulation of meiotic nuclear division(GO:0045835) |
| 0.0 | 0.3 | GO:0000056 | ribosomal small subunit export from nucleus(GO:0000056) |
| 0.0 | 0.2 | GO:0071481 | cellular response to X-ray(GO:0071481) |
| 0.0 | 0.3 | GO:0050962 | detection of light stimulus involved in visual perception(GO:0050908) detection of light stimulus involved in sensory perception(GO:0050962) |
| 0.0 | 0.1 | GO:0044791 | modulation by host of viral release from host cell(GO:0044789) positive regulation by host of viral release from host cell(GO:0044791) |
| 0.0 | 0.1 | GO:0038161 | prolactin signaling pathway(GO:0038161) |
| 0.0 | 1.4 | GO:0000381 | regulation of alternative mRNA splicing, via spliceosome(GO:0000381) |
| 0.0 | 0.0 | GO:0097368 | establishment of Sertoli cell barrier(GO:0097368) |
| 0.0 | 0.3 | GO:0060850 | regulation of transcription involved in cell fate commitment(GO:0060850) |
| 0.0 | 0.1 | GO:1903182 | regulation of SUMO transferase activity(GO:1903182) positive regulation of SUMO transferase activity(GO:1903755) |
| 0.0 | 0.2 | GO:0070072 | proton-transporting V-type ATPase complex assembly(GO:0070070) vacuolar proton-transporting V-type ATPase complex assembly(GO:0070072) |
| 0.0 | 0.2 | GO:0046618 | drug export(GO:0046618) |
| 0.0 | 0.6 | GO:0070373 | negative regulation of ERK1 and ERK2 cascade(GO:0070373) |
| 0.0 | 0.1 | GO:2000563 | positive regulation of CD4-positive, alpha-beta T cell proliferation(GO:2000563) |
| 0.0 | 2.0 | GO:0006890 | retrograde vesicle-mediated transport, Golgi to ER(GO:0006890) |
| 0.0 | 0.8 | GO:0035338 | long-chain fatty-acyl-CoA biosynthetic process(GO:0035338) |
| 0.0 | 0.1 | GO:0030730 | sequestering of triglyceride(GO:0030730) |
| 0.0 | 0.1 | GO:0060075 | regulation of resting membrane potential(GO:0060075) |
| 0.0 | 0.5 | GO:0001825 | blastocyst formation(GO:0001825) |
| 0.0 | 0.2 | GO:0043578 | nuclear matrix organization(GO:0043578) nuclear matrix anchoring at nuclear membrane(GO:0090292) |
| 0.0 | 0.8 | GO:0015701 | bicarbonate transport(GO:0015701) |
| 0.0 | 0.1 | GO:0019856 | 'de novo' pyrimidine nucleobase biosynthetic process(GO:0006207) pyrimidine nucleobase biosynthetic process(GO:0019856) |
| 0.0 | 0.0 | GO:0090231 | regulation of spindle checkpoint(GO:0090231) |
| 0.0 | 0.2 | GO:0034374 | low-density lipoprotein particle remodeling(GO:0034374) |
| 0.0 | 0.3 | GO:1902369 | negative regulation of RNA catabolic process(GO:1902369) |
| 0.0 | 0.5 | GO:0051491 | positive regulation of filopodium assembly(GO:0051491) |
| 0.0 | 0.1 | GO:0018197 | peptidyl-aspartic acid modification(GO:0018197) peptidyl-aspartic acid hydroxylation(GO:0042264) |
| 0.0 | 0.1 | GO:0018094 | protein polyglycylation(GO:0018094) |
| 0.0 | 0.1 | GO:0097156 | fasciculation of sensory neuron axon(GO:0097155) fasciculation of motor neuron axon(GO:0097156) |
| 0.0 | 0.0 | GO:0035502 | metanephric part of ureteric bud development(GO:0035502) |
| 0.0 | 0.1 | GO:0010571 | positive regulation of nuclear cell cycle DNA replication(GO:0010571) |
| 0.0 | 0.3 | GO:0018298 | protein-chromophore linkage(GO:0018298) |
| 0.0 | 0.1 | GO:0044334 | canonical Wnt signaling pathway involved in positive regulation of epithelial to mesenchymal transition(GO:0044334) |
| 0.0 | 0.4 | GO:0036149 | phosphatidylinositol acyl-chain remodeling(GO:0036149) |
| 0.0 | 0.2 | GO:0010839 | negative regulation of keratinocyte proliferation(GO:0010839) |
| 0.0 | 0.0 | GO:0003415 | chondrocyte hypertrophy(GO:0003415) |
| 0.0 | 0.0 | GO:0071883 | activation of MAPK activity by adrenergic receptor signaling pathway(GO:0071883) |
| 0.0 | 0.1 | GO:0015798 | myo-inositol transport(GO:0015798) |
| 0.0 | 0.0 | GO:0016093 | sesquiterpenoid metabolic process(GO:0006714) polyprenol metabolic process(GO:0016093) polyprenol catabolic process(GO:0016095) sesquiterpenoid catabolic process(GO:0016107) farnesol metabolic process(GO:0016487) farnesol catabolic process(GO:0016488) |
| 0.0 | 0.1 | GO:0071557 | histone H3-K27 demethylation(GO:0071557) |
| 0.0 | 0.1 | GO:1902857 | positive regulation of nonmotile primary cilium assembly(GO:1902857) |
| 0.0 | 0.0 | GO:0042415 | norepinephrine metabolic process(GO:0042415) |
| 0.0 | 0.7 | GO:2000816 | negative regulation of mitotic sister chromatid separation(GO:2000816) |
| 0.0 | 0.1 | GO:0072719 | cellular response to cisplatin(GO:0072719) |
| 0.0 | 0.1 | GO:0035864 | response to potassium ion(GO:0035864) |
| 0.0 | 0.5 | GO:0071398 | cellular response to fatty acid(GO:0071398) |
| 0.0 | 0.4 | GO:0015721 | bile acid and bile salt transport(GO:0015721) |
| 0.0 | 0.1 | GO:0010446 | response to alkaline pH(GO:0010446) |
| 0.0 | 0.2 | GO:1903071 | regulation of ER-associated ubiquitin-dependent protein catabolic process(GO:1903069) positive regulation of ER-associated ubiquitin-dependent protein catabolic process(GO:1903071) |
| 0.0 | 0.1 | GO:0043248 | proteasome assembly(GO:0043248) |
| 0.0 | 0.0 | GO:0050916 | sensory perception of sweet taste(GO:0050916) |
| 0.0 | 0.2 | GO:0042167 | porphyrin-containing compound catabolic process(GO:0006787) tetrapyrrole catabolic process(GO:0033015) heme catabolic process(GO:0042167) pigment catabolic process(GO:0046149) |
| 0.0 | 0.1 | GO:0046604 | positive regulation of mitotic centrosome separation(GO:0046604) |
| 0.0 | 0.1 | GO:0018160 | peptidyl-pyrromethane cofactor linkage(GO:0018160) |
| 0.0 | 0.1 | GO:0019919 | peptidyl-arginine methylation, to asymmetrical-dimethyl arginine(GO:0019919) |
| 0.0 | 0.1 | GO:0002074 | extraocular skeletal muscle development(GO:0002074) |
| 0.0 | 0.1 | GO:1904588 | cellular response to glycoprotein(GO:1904588) cellular response to thyrotropin-releasing hormone(GO:1905229) |
| 0.0 | 0.1 | GO:0006824 | cobalt ion transport(GO:0006824) |
| 0.0 | 0.1 | GO:0000066 | mitochondrial ornithine transport(GO:0000066) |
| 0.0 | 0.1 | GO:0038092 | nodal signaling pathway(GO:0038092) |
| 0.0 | 0.1 | GO:0060576 | intestinal epithelial cell development(GO:0060576) |
| 0.0 | 0.1 | GO:0051415 | interphase microtubule nucleation by interphase microtubule organizing center(GO:0051415) microtubule nucleation by microtubule organizing center(GO:0051418) |
| 0.0 | 0.5 | GO:0046825 | regulation of protein export from nucleus(GO:0046825) |
| 0.0 | 0.0 | GO:2001295 | malonyl-CoA biosynthetic process(GO:2001295) |
| 0.0 | 0.1 | GO:0051665 | membrane raft polarization(GO:0001766) membrane raft distribution(GO:0031580) membrane raft localization(GO:0051665) |
| 0.0 | 0.0 | GO:1903223 | positive regulation of oxidative stress-induced neuron death(GO:1903223) positive regulation of oxidative stress-induced neuron intrinsic apoptotic signaling pathway(GO:1903378) |
| 0.0 | 0.1 | GO:1903575 | cornified envelope assembly(GO:1903575) |
| 0.0 | 1.0 | GO:0070664 | negative regulation of leukocyte proliferation(GO:0070664) |
| 0.0 | 0.2 | GO:0070498 | interleukin-1-mediated signaling pathway(GO:0070498) |
| 0.0 | 0.1 | GO:0097062 | dendritic spine maintenance(GO:0097062) |
| 0.0 | 0.3 | GO:1902043 | positive regulation of extrinsic apoptotic signaling pathway via death domain receptors(GO:1902043) |
| 0.0 | 0.1 | GO:0061709 | reticulophagy(GO:0061709) |
| 0.0 | 0.1 | GO:0035988 | chondrocyte proliferation(GO:0035988) |
| 0.0 | 0.4 | GO:0045747 | positive regulation of Notch signaling pathway(GO:0045747) |
| 0.0 | 0.0 | GO:0001865 | NK T cell differentiation(GO:0001865) |
| 0.0 | 0.1 | GO:0072643 | interferon-gamma secretion(GO:0072643) |
| 0.0 | 0.1 | GO:2000741 | asymmetric neuroblast division(GO:0055059) positive regulation of mesenchymal stem cell differentiation(GO:2000741) |
| 0.0 | 0.0 | GO:0021548 | pons development(GO:0021548) |
| 0.0 | 0.1 | GO:0010606 | positive regulation of cytoplasmic mRNA processing body assembly(GO:0010606) |
| 0.0 | 0.4 | GO:0007340 | acrosome reaction(GO:0007340) |
| 0.0 | 0.0 | GO:0042441 | eye pigment biosynthetic process(GO:0006726) eye pigment metabolic process(GO:0042441) pigment metabolic process involved in developmental pigmentation(GO:0043324) pigment metabolic process involved in pigmentation(GO:0043474) |
| 0.0 | 0.2 | GO:0070934 | CRD-mediated mRNA stabilization(GO:0070934) |
| 0.0 | 0.3 | GO:0055008 | cardiac muscle tissue morphogenesis(GO:0055008) |
| 0.0 | 0.0 | GO:0031120 | snRNA pseudouridine synthesis(GO:0031120) |
| 0.0 | 0.1 | GO:2000286 | receptor internalization involved in canonical Wnt signaling pathway(GO:2000286) |
| 0.0 | 0.0 | GO:1904628 | response to phorbol 13-acetate 12-myristate(GO:1904627) cellular response to phorbol 13-acetate 12-myristate(GO:1904628) |
| 0.0 | 0.5 | GO:0032024 | positive regulation of insulin secretion(GO:0032024) |
| 0.0 | 2.0 | GO:0038096 | immune response-regulating cell surface receptor signaling pathway involved in phagocytosis(GO:0002433) Fc-gamma receptor signaling pathway involved in phagocytosis(GO:0038096) |
| 0.0 | 0.2 | GO:0016242 | negative regulation of macroautophagy(GO:0016242) |
| 0.0 | 0.1 | GO:0045743 | positive regulation of fibroblast growth factor receptor signaling pathway(GO:0045743) |
| 0.0 | 0.1 | GO:0000492 | box C/D snoRNP assembly(GO:0000492) |
| 0.0 | 0.1 | GO:0014029 | neural crest formation(GO:0014029) |
| 0.0 | 0.1 | GO:0000023 | maltose metabolic process(GO:0000023) |
| 0.0 | 0.1 | GO:0022038 | corpus callosum development(GO:0022038) |
| 0.0 | 0.1 | GO:0021692 | cerebellar Purkinje cell layer morphogenesis(GO:0021692) |
| 0.0 | 0.1 | GO:0060988 | lipid tube assembly(GO:0060988) |
| 0.0 | 0.0 | GO:1901052 | sarcosine metabolic process(GO:1901052) sarcosine catabolic process(GO:1901053) |
| 0.0 | 0.0 | GO:0051039 | histone displacement(GO:0001207) positive regulation of transcription involved in meiotic cell cycle(GO:0051039) |
| 0.0 | 0.2 | GO:0044804 | nucleophagy(GO:0044804) |
| 0.0 | 0.1 | GO:0097011 | cellular response to granulocyte macrophage colony-stimulating factor stimulus(GO:0097011) response to granulocyte macrophage colony-stimulating factor(GO:0097012) |
| 0.0 | 0.1 | GO:0008595 | tripartite regional subdivision(GO:0007351) anterior/posterior axis specification, embryo(GO:0008595) |
| 0.0 | 0.3 | GO:0006471 | protein ADP-ribosylation(GO:0006471) |
| 0.0 | 0.1 | GO:0046103 | adenosine catabolic process(GO:0006154) inosine biosynthetic process(GO:0046103) |
| 0.0 | 0.1 | GO:0030259 | lipid glycosylation(GO:0030259) |
| 0.0 | 0.5 | GO:0033572 | transferrin transport(GO:0033572) |
| 0.0 | 0.0 | GO:0018171 | peptidyl-cysteine oxidation(GO:0018171) |
| 0.0 | 0.2 | GO:0030199 | collagen fibril organization(GO:0030199) |
| 0.0 | 0.0 | GO:0006616 | SRP-dependent cotranslational protein targeting to membrane, translocation(GO:0006616) |
| 0.0 | 0.0 | GO:1904263 | positive regulation of TORC1 signaling(GO:1904263) |
| 0.0 | 0.1 | GO:1902513 | regulation of organelle transport along microtubule(GO:1902513) |
| 0.0 | 0.1 | GO:0035435 | phosphate ion transmembrane transport(GO:0035435) |
| 0.0 | 0.1 | GO:0046322 | negative regulation of fatty acid oxidation(GO:0046322) |
| 0.0 | 0.1 | GO:0051182 | coenzyme transport(GO:0051182) |
| 0.0 | 0.1 | GO:0006228 | UTP biosynthetic process(GO:0006228) |
| 0.0 | 0.3 | GO:0035116 | embryonic hindlimb morphogenesis(GO:0035116) |
| 0.0 | 0.1 | GO:0043697 | dedifferentiation(GO:0043696) cell dedifferentiation(GO:0043697) |
| 0.0 | 0.1 | GO:0038003 | opioid receptor signaling pathway(GO:0038003) |
| 0.0 | 0.1 | GO:0043383 | negative T cell selection(GO:0043383) |
| 0.0 | 0.1 | GO:1904970 | brush border assembly(GO:1904970) |
Gene overrepresentation in cellular component category:
| Log-likelihood per target | Total log-likelihood | Term | Description |
|---|---|---|---|
| 0.9 | 2.6 | GO:1990622 | CHOP-ATF3 complex(GO:1990622) |
| 0.8 | 7.6 | GO:0071144 | SMAD2-SMAD3 protein complex(GO:0071144) |
| 0.7 | 7.4 | GO:0035692 | macrophage migration inhibitory factor receptor complex(GO:0035692) |
| 0.6 | 2.4 | GO:0038039 | G-protein coupled receptor heterodimeric complex(GO:0038039) |
| 0.6 | 4.5 | GO:1990111 | spermatoproteasome complex(GO:1990111) |
| 0.6 | 3.9 | GO:0036021 | endolysosome lumen(GO:0036021) |
| 0.5 | 4.1 | GO:0098559 | cytoplasmic side of early endosome membrane(GO:0098559) |
| 0.3 | 1.0 | GO:0033565 | ESCRT-0 complex(GO:0033565) |
| 0.3 | 1.3 | GO:0097229 | sperm end piece(GO:0097229) |
| 0.3 | 6.5 | GO:0031265 | CD95 death-inducing signaling complex(GO:0031265) |
| 0.3 | 1.6 | GO:0020016 | ciliary pocket(GO:0020016) ciliary pocket membrane(GO:0020018) |
| 0.3 | 1.3 | GO:0043083 | synaptic cleft(GO:0043083) |
| 0.2 | 3.5 | GO:0046581 | intercellular canaliculus(GO:0046581) |
| 0.2 | 0.9 | GO:0045323 | interleukin-1 receptor complex(GO:0045323) |
| 0.2 | 2.0 | GO:0097450 | astrocyte end-foot(GO:0097450) |
| 0.2 | 3.0 | GO:0033093 | Weibel-Palade body(GO:0033093) |
| 0.2 | 0.2 | GO:0042643 | actomyosin, actin portion(GO:0042643) |
| 0.2 | 1.5 | GO:0005610 | laminin-5 complex(GO:0005610) |
| 0.2 | 2.3 | GO:0042612 | MHC class I protein complex(GO:0042612) |
| 0.2 | 0.6 | GO:0016939 | kinesin II complex(GO:0016939) |
| 0.2 | 2.2 | GO:0033018 | sarcoplasmic reticulum lumen(GO:0033018) |
| 0.2 | 0.6 | GO:0033185 | dolichol-phosphate-mannose synthase complex(GO:0033185) |
| 0.2 | 0.8 | GO:0033257 | Bcl3/NF-kappaB2 complex(GO:0033257) |
| 0.2 | 2.8 | GO:0030478 | actin cap(GO:0030478) |
| 0.2 | 1.1 | GO:1990246 | uniplex complex(GO:1990246) |
| 0.2 | 3.2 | GO:0032059 | bleb(GO:0032059) |
| 0.2 | 0.7 | GO:0005863 | striated muscle myosin thick filament(GO:0005863) |
| 0.2 | 1.2 | GO:0090661 | box H/ACA scaRNP complex(GO:0072589) box H/ACA telomerase RNP complex(GO:0090661) |
| 0.2 | 0.8 | GO:1990425 | ryanodine receptor complex(GO:1990425) |
| 0.2 | 1.7 | GO:0044194 | cytolytic granule(GO:0044194) |
| 0.2 | 0.5 | GO:1902636 | kinociliary basal body(GO:1902636) |
| 0.2 | 0.6 | GO:0008537 | proteasome activator complex(GO:0008537) |
| 0.2 | 0.8 | GO:0031074 | nucleocytoplasmic shuttling complex(GO:0031074) |
| 0.2 | 1.1 | GO:0000788 | nuclear nucleosome(GO:0000788) |
| 0.2 | 0.8 | GO:0044301 | climbing fiber(GO:0044301) |
| 0.2 | 0.6 | GO:0034457 | Mpp10 complex(GO:0034457) |
| 0.2 | 1.1 | GO:0032437 | cuticular plate(GO:0032437) |
| 0.1 | 0.7 | GO:0071458 | integral component of cytoplasmic side of endoplasmic reticulum membrane(GO:0071458) |
| 0.1 | 1.4 | GO:0000015 | phosphopyruvate hydratase complex(GO:0000015) |
| 0.1 | 1.0 | GO:0002177 | manchette(GO:0002177) |
| 0.1 | 0.6 | GO:1990578 | perinuclear endoplasmic reticulum membrane(GO:1990578) |
| 0.1 | 0.5 | GO:0009328 | phenylalanine-tRNA ligase complex(GO:0009328) |
| 0.1 | 0.9 | GO:0034388 | Pwp2p-containing subcomplex of 90S preribosome(GO:0034388) |
| 0.1 | 0.8 | GO:1990584 | cardiac Troponin complex(GO:1990584) |
| 0.1 | 2.1 | GO:0034709 | methylosome(GO:0034709) |
| 0.1 | 0.6 | GO:0036502 | Derlin-1-VIMP complex(GO:0036502) |
| 0.1 | 0.4 | GO:0060187 | cell pole(GO:0060187) |
| 0.1 | 1.7 | GO:0005861 | troponin complex(GO:0005861) |
| 0.1 | 0.8 | GO:0097209 | epidermal lamellar body(GO:0097209) |
| 0.1 | 5.0 | GO:1902710 | GABA receptor complex(GO:1902710) GABA-A receptor complex(GO:1902711) |
| 0.1 | 0.8 | GO:0044530 | supraspliceosomal complex(GO:0044530) |
| 0.1 | 1.4 | GO:0034098 | VCP-NPL4-UFD1 AAA ATPase complex(GO:0034098) |
| 0.1 | 0.8 | GO:0042825 | MHC class I peptide loading complex(GO:0042824) TAP complex(GO:0042825) |
| 0.1 | 0.5 | GO:0005960 | glycine cleavage complex(GO:0005960) |
| 0.1 | 0.7 | GO:0043527 | tRNA methyltransferase complex(GO:0043527) |
| 0.1 | 0.3 | GO:0030689 | Noc complex(GO:0030689) |
| 0.1 | 0.5 | GO:0045179 | apical cortex(GO:0045179) |
| 0.1 | 0.2 | GO:0031933 | telomeric heterochromatin(GO:0031933) |
| 0.1 | 0.7 | GO:1990452 | Parkin-FBXW7-Cul1 ubiquitin ligase complex(GO:1990452) |
| 0.1 | 1.3 | GO:0097524 | sperm plasma membrane(GO:0097524) |
| 0.1 | 1.1 | GO:0097512 | cardiac myofibril(GO:0097512) |
| 0.1 | 0.9 | GO:0014701 | junctional sarcoplasmic reticulum membrane(GO:0014701) |
| 0.1 | 0.5 | GO:0031205 | endoplasmic reticulum Sec complex(GO:0031205) |
| 0.1 | 0.4 | GO:0005965 | protein farnesyltransferase complex(GO:0005965) |
| 0.1 | 0.7 | GO:0031467 | Cul7-RING ubiquitin ligase complex(GO:0031467) |
| 0.1 | 0.3 | GO:0016222 | procollagen-proline 4-dioxygenase complex(GO:0016222) |
| 0.1 | 0.4 | GO:0002945 | cyclin K-CDK13 complex(GO:0002945) |
| 0.1 | 0.3 | GO:0005588 | collagen type V trimer(GO:0005588) |
| 0.1 | 0.7 | GO:0034750 | Scrib-APC-beta-catenin complex(GO:0034750) |
| 0.1 | 1.1 | GO:0060171 | stereocilium membrane(GO:0060171) |
| 0.1 | 0.8 | GO:0061689 | tricellular tight junction(GO:0061689) |
| 0.1 | 0.7 | GO:0042721 | mitochondrial inner membrane protein insertion complex(GO:0042721) |
| 0.1 | 0.3 | GO:0043159 | acrosomal matrix(GO:0043159) |
| 0.1 | 0.5 | GO:0035339 | SPOTS complex(GO:0035339) |
| 0.1 | 0.3 | GO:0005592 | collagen type XI trimer(GO:0005592) |
| 0.1 | 0.5 | GO:0070761 | pre-snoRNP complex(GO:0070761) |
| 0.1 | 0.5 | GO:0070545 | PeBoW complex(GO:0070545) |
| 0.1 | 0.3 | GO:0032419 | extrinsic component of lysosome membrane(GO:0032419) |
| 0.1 | 1.8 | GO:0005890 | sodium:potassium-exchanging ATPase complex(GO:0005890) |
| 0.1 | 0.6 | GO:0005956 | protein kinase CK2 complex(GO:0005956) |
| 0.1 | 0.7 | GO:0016272 | prefoldin complex(GO:0016272) |
| 0.1 | 1.5 | GO:0033010 | paranodal junction(GO:0033010) |
| 0.1 | 0.4 | GO:0001405 | presequence translocase-associated import motor(GO:0001405) |
| 0.1 | 2.7 | GO:0097381 | photoreceptor disc membrane(GO:0097381) |
| 0.1 | 0.3 | GO:0098843 | postsynaptic endocytic zone(GO:0098843) |
| 0.1 | 2.1 | GO:0005671 | Ada2/Gcn5/Ada3 transcription activator complex(GO:0005671) |
| 0.1 | 1.8 | GO:1990454 | L-type voltage-gated calcium channel complex(GO:1990454) |
| 0.1 | 2.5 | GO:0031143 | pseudopodium(GO:0031143) |
| 0.1 | 0.2 | GO:0044609 | DBIRD complex(GO:0044609) |
| 0.1 | 1.1 | GO:0097136 | Bcl-2 family protein complex(GO:0097136) |
| 0.1 | 0.7 | GO:0033269 | internode region of axon(GO:0033269) |
| 0.1 | 1.2 | GO:0042599 | lamellar body(GO:0042599) |
| 0.1 | 0.9 | GO:0005642 | annulate lamellae(GO:0005642) |
| 0.1 | 0.8 | GO:0036157 | outer dynein arm(GO:0036157) |
| 0.1 | 1.9 | GO:0043205 | microfibril(GO:0001527) fibril(GO:0043205) |
| 0.1 | 4.7 | GO:0002102 | podosome(GO:0002102) |
| 0.1 | 0.3 | GO:0070044 | synaptobrevin 2-SNAP-25-syntaxin-1a complex(GO:0070044) |
| 0.1 | 4.3 | GO:0005891 | voltage-gated calcium channel complex(GO:0005891) |
| 0.1 | 0.7 | GO:0032133 | chromosome passenger complex(GO:0032133) |
| 0.1 | 0.3 | GO:0034669 | integrin alpha4-beta7 complex(GO:0034669) |
| 0.1 | 0.8 | GO:0071541 | eukaryotic translation initiation factor 3 complex, eIF3m(GO:0071541) |
| 0.1 | 0.3 | GO:0008043 | intracellular ferritin complex(GO:0008043) ferritin complex(GO:0070288) |
| 0.1 | 0.2 | GO:0097165 | nuclear stress granule(GO:0097165) |
| 0.1 | 0.2 | GO:1990730 | VCP-NSFL1C complex(GO:1990730) |
| 0.1 | 0.3 | GO:0097059 | CNTFR-CLCF1 complex(GO:0097059) |
| 0.1 | 0.6 | GO:0043203 | axon hillock(GO:0043203) |
| 0.1 | 2.3 | GO:0016234 | inclusion body(GO:0016234) |
| 0.1 | 2.0 | GO:0001518 | voltage-gated sodium channel complex(GO:0001518) |
| 0.1 | 0.5 | GO:0005687 | U4 snRNP(GO:0005687) |
| 0.1 | 6.5 | GO:0045095 | keratin filament(GO:0045095) |
| 0.1 | 2.7 | GO:0002080 | acrosomal membrane(GO:0002080) |
| 0.1 | 0.2 | GO:0048269 | methionine adenosyltransferase complex(GO:0048269) |
| 0.1 | 4.1 | GO:0031941 | filamentous actin(GO:0031941) |
| 0.1 | 1.0 | GO:0002199 | zona pellucida receptor complex(GO:0002199) |
| 0.1 | 0.4 | GO:0070381 | endosome to plasma membrane transport vesicle(GO:0070381) |
| 0.1 | 0.9 | GO:0044292 | dendrite terminus(GO:0044292) |
| 0.1 | 0.6 | GO:0031428 | box C/D snoRNP complex(GO:0031428) |
| 0.1 | 0.2 | GO:0016938 | kinesin I complex(GO:0016938) |
| 0.1 | 0.2 | GO:0097636 | intrinsic component of autophagosome membrane(GO:0097636) integral component of autophagosome membrane(GO:0097637) |
| 0.1 | 1.6 | GO:0036038 | MKS complex(GO:0036038) |
| 0.1 | 1.0 | GO:0036057 | filtration diaphragm(GO:0036056) slit diaphragm(GO:0036057) |
| 0.1 | 0.6 | GO:0097425 | smooth endoplasmic reticulum membrane(GO:0030868) smooth endoplasmic reticulum part(GO:0097425) |
| 0.1 | 1.9 | GO:0005614 | interstitial matrix(GO:0005614) |
| 0.1 | 0.5 | GO:0030688 | preribosome, small subunit precursor(GO:0030688) |
| 0.1 | 0.6 | GO:0035985 | senescence-associated heterochromatin focus(GO:0035985) |
| 0.1 | 1.1 | GO:0033391 | chromatoid body(GO:0033391) |
| 0.1 | 0.7 | GO:0042587 | glycogen granule(GO:0042587) |
| 0.1 | 0.3 | GO:0065010 | extracellular membrane-bounded organelle(GO:0065010) |
| 0.1 | 4.8 | GO:0015030 | Cajal body(GO:0015030) |
| 0.1 | 0.5 | GO:0060091 | kinocilium(GO:0060091) |
| 0.1 | 0.4 | GO:0030485 | smooth muscle contractile fiber(GO:0030485) |
| 0.1 | 0.3 | GO:0035517 | PR-DUB complex(GO:0035517) |
| 0.1 | 0.2 | GO:0033011 | perinuclear theca(GO:0033011) |
| 0.1 | 0.6 | GO:0030870 | Mre11 complex(GO:0030870) |
| 0.1 | 0.4 | GO:0070695 | FHF complex(GO:0070695) |
| 0.1 | 0.4 | GO:0090533 | cation-transporting ATPase complex(GO:0090533) |
| 0.1 | 0.2 | GO:1990716 | axonemal central apparatus(GO:1990716) |
| 0.1 | 0.4 | GO:1990037 | Lewy body core(GO:1990037) |
| 0.1 | 1.7 | GO:0030687 | preribosome, large subunit precursor(GO:0030687) |
| 0.1 | 0.2 | GO:0030895 | apolipoprotein B mRNA editing enzyme complex(GO:0030895) |
| 0.1 | 0.8 | GO:0005686 | U2 snRNP(GO:0005686) |
| 0.1 | 1.3 | GO:0031235 | intrinsic component of the cytoplasmic side of the plasma membrane(GO:0031235) |
| 0.1 | 0.6 | GO:0005787 | signal peptidase complex(GO:0005787) |
| 0.1 | 0.9 | GO:0005915 | zonula adherens(GO:0005915) |
| 0.1 | 0.8 | GO:0016013 | syntrophin complex(GO:0016013) |
| 0.1 | 0.3 | GO:0005826 | actomyosin contractile ring(GO:0005826) |
| 0.1 | 1.0 | GO:0032433 | filopodium tip(GO:0032433) |
| 0.1 | 2.4 | GO:0000159 | protein phosphatase type 2A complex(GO:0000159) |
| 0.1 | 0.7 | GO:0016342 | catenin complex(GO:0016342) |
| 0.1 | 1.7 | GO:0030057 | desmosome(GO:0030057) |
| 0.1 | 0.3 | GO:1990031 | pinceau fiber(GO:1990031) |
| 0.1 | 1.0 | GO:0043194 | axon initial segment(GO:0043194) |
| 0.1 | 3.0 | GO:0034707 | chloride channel complex(GO:0034707) |
| 0.1 | 0.5 | GO:0008282 | ATP-sensitive potassium channel complex(GO:0008282) |
| 0.1 | 0.2 | GO:0070701 | mucus layer(GO:0070701) |
| 0.1 | 2.6 | GO:0030673 | axolemma(GO:0030673) |
| 0.1 | 0.6 | GO:0071438 | invadopodium membrane(GO:0071438) |
| 0.1 | 0.3 | GO:0030934 | anchoring collagen complex(GO:0030934) |
| 0.1 | 0.6 | GO:0070187 | telosome(GO:0070187) |
| 0.1 | 0.2 | GO:0042272 | nuclear RNA export factor complex(GO:0042272) |
| 0.1 | 0.5 | GO:0000220 | vacuolar proton-transporting V-type ATPase, V0 domain(GO:0000220) |
| 0.1 | 0.5 | GO:0097225 | sperm midpiece(GO:0097225) |
| 0.1 | 1.5 | GO:0030684 | preribosome(GO:0030684) |
| 0.1 | 0.4 | GO:0097486 | multivesicular body lumen(GO:0097486) |
| 0.1 | 0.4 | GO:0005587 | collagen type IV trimer(GO:0005587) |
| 0.1 | 2.8 | GO:0031594 | neuromuscular junction(GO:0031594) |
| 0.0 | 1.2 | GO:0001891 | phagocytic cup(GO:0001891) |
| 0.0 | 0.2 | GO:0072534 | perineuronal net(GO:0072534) |
| 0.0 | 0.3 | GO:0019907 | cyclin-dependent protein kinase activating kinase holoenzyme complex(GO:0019907) |
| 0.0 | 0.7 | GO:0001520 | outer dense fiber(GO:0001520) |
| 0.0 | 1.2 | GO:0044453 | nuclear membrane part(GO:0044453) |
| 0.0 | 0.3 | GO:0032584 | growth cone membrane(GO:0032584) |
| 0.0 | 0.1 | GO:1990682 | CSF1-CSF1R complex(GO:1990682) |
| 0.0 | 0.4 | GO:0000938 | GARP complex(GO:0000938) |
| 0.0 | 1.0 | GO:0030056 | hemidesmosome(GO:0030056) |
| 0.0 | 1.1 | GO:0005922 | connexon complex(GO:0005922) |
| 0.0 | 0.3 | GO:0089701 | U2AF(GO:0089701) |
| 0.0 | 0.2 | GO:0035841 | new growing cell tip(GO:0035841) |
| 0.0 | 0.4 | GO:0097422 | tubular endosome(GO:0097422) |
| 0.0 | 4.1 | GO:0010494 | cytoplasmic stress granule(GO:0010494) |
| 0.0 | 0.5 | GO:1990907 | beta-catenin-TCF complex(GO:1990907) |
| 0.0 | 0.7 | GO:0005833 | hemoglobin complex(GO:0005833) |
| 0.0 | 0.4 | GO:0000974 | Prp19 complex(GO:0000974) |
| 0.0 | 0.4 | GO:0002193 | MAML1-RBP-Jkappa- ICN1 complex(GO:0002193) |
| 0.0 | 0.3 | GO:0070436 | Grb2-EGFR complex(GO:0070436) |
| 0.0 | 0.5 | GO:0030061 | mitochondrial crista(GO:0030061) |
| 0.0 | 1.4 | GO:0042101 | T cell receptor complex(GO:0042101) |
| 0.0 | 0.6 | GO:0090543 | Flemming body(GO:0090543) |
| 0.0 | 0.2 | GO:0045272 | plasma membrane respiratory chain complex I(GO:0045272) |
| 0.0 | 8.0 | GO:0005578 | proteinaceous extracellular matrix(GO:0005578) |
| 0.0 | 0.3 | GO:0033179 | proton-transporting V-type ATPase, V0 domain(GO:0033179) |
| 0.0 | 0.3 | GO:0016600 | flotillin complex(GO:0016600) |
| 0.0 | 0.8 | GO:0001741 | XY body(GO:0001741) |
| 0.0 | 0.0 | GO:0070195 | growth hormone receptor complex(GO:0070195) |
| 0.0 | 1.0 | GO:0030867 | rough endoplasmic reticulum membrane(GO:0030867) |
| 0.0 | 0.3 | GO:0034706 | sodium channel complex(GO:0034706) |
| 0.0 | 0.4 | GO:0044352 | pinosome(GO:0044352) macropinosome(GO:0044354) |
| 0.0 | 0.1 | GO:0030906 | retromer, cargo-selective complex(GO:0030906) |
| 0.0 | 0.4 | GO:0097550 | transcriptional preinitiation complex(GO:0097550) |
| 0.0 | 0.1 | GO:0034455 | t-UTP complex(GO:0034455) |
| 0.0 | 0.4 | GO:0071682 | endocytic vesicle lumen(GO:0071682) |
| 0.0 | 1.0 | GO:0031011 | Ino80 complex(GO:0031011) DNA helicase complex(GO:0033202) |
| 0.0 | 0.7 | GO:0005885 | Arp2/3 protein complex(GO:0005885) |
| 0.0 | 0.5 | GO:0035748 | myelin sheath abaxonal region(GO:0035748) |
| 0.0 | 0.2 | GO:0000942 | condensed nuclear chromosome outer kinetochore(GO:0000942) |
| 0.0 | 0.1 | GO:0005900 | oncostatin-M receptor complex(GO:0005900) |
| 0.0 | 0.3 | GO:0032777 | Piccolo NuA4 histone acetyltransferase complex(GO:0032777) |
| 0.0 | 0.1 | GO:0031085 | BLOC-3 complex(GO:0031085) |
| 0.0 | 0.4 | GO:0070449 | elongin complex(GO:0070449) |
| 0.0 | 0.3 | GO:1990726 | Lsm1-7-Pat1 complex(GO:1990726) |
| 0.0 | 0.2 | GO:0071012 | catalytic step 1 spliceosome(GO:0071012) |
| 0.0 | 0.2 | GO:0043564 | Ku70:Ku80 complex(GO:0043564) |
| 0.0 | 0.1 | GO:0008275 | gamma-tubulin small complex(GO:0008275) |
| 0.0 | 0.9 | GO:0031083 | BLOC-1 complex(GO:0031083) |
| 0.0 | 0.2 | GO:0030891 | VCB complex(GO:0030891) |
| 0.0 | 0.1 | GO:0030956 | glutamyl-tRNA(Gln) amidotransferase complex(GO:0030956) |
| 0.0 | 3.6 | GO:0005913 | cell-cell adherens junction(GO:0005913) |
| 0.0 | 0.1 | GO:1990589 | ATF4-CREB1 transcription factor complex(GO:1990589) |
| 0.0 | 1.1 | GO:0097228 | sperm principal piece(GO:0097228) |
| 0.0 | 0.4 | GO:0000164 | protein phosphatase type 1 complex(GO:0000164) |
| 0.0 | 0.2 | GO:0000801 | central element(GO:0000801) |
| 0.0 | 0.6 | GO:0044613 | nuclear pore central transport channel(GO:0044613) |
| 0.0 | 0.2 | GO:0032010 | phagolysosome(GO:0032010) |
| 0.0 | 0.8 | GO:0005839 | proteasome core complex(GO:0005839) |
| 0.0 | 2.1 | GO:0005801 | cis-Golgi network(GO:0005801) |
| 0.0 | 0.3 | GO:0005827 | polar microtubule(GO:0005827) |
| 0.0 | 0.4 | GO:0030991 | intraciliary transport particle A(GO:0030991) |
| 0.0 | 0.2 | GO:0071014 | post-mRNA release spliceosomal complex(GO:0071014) |
| 0.0 | 1.5 | GO:0032154 | cleavage furrow(GO:0032154) cell surface furrow(GO:0097610) |
| 0.0 | 0.4 | GO:0008541 | proteasome regulatory particle, lid subcomplex(GO:0008541) |
| 0.0 | 5.8 | GO:0031225 | anchored component of membrane(GO:0031225) |
| 0.0 | 0.3 | GO:0061574 | ASAP complex(GO:0061574) |
| 0.0 | 0.3 | GO:1990130 | Iml1 complex(GO:1990130) |
| 0.0 | 0.7 | GO:0045277 | respiratory chain complex IV(GO:0045277) |
| 0.0 | 0.7 | GO:0034045 | pre-autophagosomal structure membrane(GO:0034045) |
| 0.0 | 0.2 | GO:0044754 | autolysosome(GO:0044754) |
| 0.0 | 0.2 | GO:1903349 | omegasome membrane(GO:1903349) |
| 0.0 | 4.5 | GO:0008076 | voltage-gated potassium channel complex(GO:0008076) |
| 0.0 | 0.1 | GO:0005797 | Golgi medial cisterna(GO:0005797) |
| 0.0 | 0.2 | GO:0044327 | dendritic spine head(GO:0044327) |
| 0.0 | 0.2 | GO:0070852 | cell body fiber(GO:0070852) |
| 0.0 | 0.3 | GO:0001739 | sex chromatin(GO:0001739) |
| 0.0 | 0.6 | GO:0000145 | exocyst(GO:0000145) |
| 0.0 | 0.1 | GO:0031232 | extrinsic component of external side of plasma membrane(GO:0031232) |
| 0.0 | 5.7 | GO:0035770 | ribonucleoprotein granule(GO:0035770) |
| 0.0 | 0.3 | GO:0005638 | lamin filament(GO:0005638) |
| 0.0 | 0.9 | GO:0071782 | endoplasmic reticulum tubular network(GO:0071782) |
| 0.0 | 0.4 | GO:1990124 | messenger ribonucleoprotein complex(GO:1990124) |
| 0.0 | 0.4 | GO:0017146 | NMDA selective glutamate receptor complex(GO:0017146) |
| 0.0 | 0.1 | GO:0031905 | early endosome lumen(GO:0031905) |
| 0.0 | 0.3 | GO:0031464 | Cul4A-RING E3 ubiquitin ligase complex(GO:0031464) |
| 0.0 | 0.2 | GO:0036513 | Derlin-1 retrotranslocation complex(GO:0036513) |
| 0.0 | 0.2 | GO:0071439 | clathrin complex(GO:0071439) |
| 0.0 | 0.7 | GO:0032839 | dendrite cytoplasm(GO:0032839) |
| 0.0 | 0.1 | GO:0070435 | Shc-EGFR complex(GO:0070435) |
| 0.0 | 0.1 | GO:0043219 | lateral loop(GO:0043219) |
| 0.0 | 0.2 | GO:0033256 | I-kappaB/NF-kappaB complex(GO:0033256) |
| 0.0 | 0.9 | GO:0031233 | intrinsic component of external side of plasma membrane(GO:0031233) |
| 0.0 | 0.1 | GO:0097441 | basilar dendrite(GO:0097441) |
| 0.0 | 4.1 | GO:0043197 | dendritic spine(GO:0043197) |
| 0.0 | 1.5 | GO:0016235 | aggresome(GO:0016235) |
| 0.0 | 0.0 | GO:0035686 | sperm fibrous sheath(GO:0035686) |
| 0.0 | 0.3 | GO:0044295 | axonal growth cone(GO:0044295) |
| 0.0 | 4.3 | GO:0043209 | myelin sheath(GO:0043209) |
| 0.0 | 0.2 | GO:0000322 | storage vacuole(GO:0000322) |
| 0.0 | 0.1 | GO:0030893 | meiotic cohesin complex(GO:0030893) |
| 0.0 | 0.6 | GO:0035371 | microtubule plus-end(GO:0035371) |
| 0.0 | 0.5 | GO:0031312 | extrinsic component of organelle membrane(GO:0031312) |
| 0.0 | 0.3 | GO:0005852 | eukaryotic translation initiation factor 3 complex(GO:0005852) |
| 0.0 | 0.1 | GO:1990356 | sumoylated E2 ligase complex(GO:1990356) |
| 0.0 | 0.1 | GO:1990423 | RZZ complex(GO:1990423) |
| 0.0 | 0.5 | GO:0005868 | cytoplasmic dynein complex(GO:0005868) |
| 0.0 | 0.2 | GO:0005579 | membrane attack complex(GO:0005579) |
| 0.0 | 0.2 | GO:0045009 | melanosome membrane(GO:0033162) chitosome(GO:0045009) |
| 0.0 | 0.3 | GO:0097539 | ciliary transition fiber(GO:0097539) |
| 0.0 | 1.5 | GO:0043204 | perikaryon(GO:0043204) |
| 0.0 | 1.1 | GO:0005876 | spindle microtubule(GO:0005876) |
| 0.0 | 0.1 | GO:0000235 | astral microtubule(GO:0000235) aster(GO:0005818) |
| 0.0 | 8.7 | GO:0031965 | nuclear membrane(GO:0031965) |
| 0.0 | 2.4 | GO:0016605 | PML body(GO:0016605) |
| 0.0 | 0.2 | GO:0030897 | HOPS complex(GO:0030897) |
| 0.0 | 0.2 | GO:0031616 | spindle pole centrosome(GO:0031616) |
| 0.0 | 0.6 | GO:0005771 | multivesicular body(GO:0005771) |
| 0.0 | 0.2 | GO:0097427 | microtubule bundle(GO:0097427) |
| 0.0 | 0.7 | GO:0048786 | presynaptic active zone(GO:0048786) |
| 0.0 | 0.1 | GO:0005944 | phosphatidylinositol 3-kinase complex, class IB(GO:0005944) |
| 0.0 | 2.8 | GO:0055037 | recycling endosome(GO:0055037) |
| 0.0 | 34.4 | GO:0005615 | extracellular space(GO:0005615) |
| 0.0 | 0.0 | GO:0044305 | calyx of Held(GO:0044305) |
| 0.0 | 0.1 | GO:0019908 | nuclear cyclin-dependent protein kinase holoenzyme complex(GO:0019908) |
| 0.0 | 0.1 | GO:0036156 | inner dynein arm(GO:0036156) |
| 0.0 | 0.1 | GO:0005744 | mitochondrial inner membrane presequence translocase complex(GO:0005744) |
| 0.0 | 0.0 | GO:0000333 | telomerase catalytic core complex(GO:0000333) |
| 0.0 | 0.1 | GO:0001534 | radial spoke(GO:0001534) |
| 0.0 | 0.7 | GO:0005859 | muscle myosin complex(GO:0005859) |
| 0.0 | 0.1 | GO:0032279 | asymmetric synapse(GO:0032279) neuron to neuron synapse(GO:0098984) |
| 0.0 | 0.3 | GO:0016327 | apicolateral plasma membrane(GO:0016327) |
| 0.0 | 1.4 | GO:0032580 | Golgi cisterna membrane(GO:0032580) |
| 0.0 | 0.1 | GO:0032807 | DNA ligase IV complex(GO:0032807) |
| 0.0 | 1.2 | GO:0042470 | melanosome(GO:0042470) pigment granule(GO:0048770) |
| 0.0 | 0.2 | GO:0031528 | microvillus membrane(GO:0031528) |
| 0.0 | 0.7 | GO:0031526 | brush border membrane(GO:0031526) |
| 0.0 | 0.1 | GO:0097197 | tetraspanin-enriched microdomain(GO:0097197) |
| 0.0 | 1.2 | GO:0005758 | mitochondrial intermembrane space(GO:0005758) |
| 0.0 | 0.2 | GO:0005581 | collagen trimer(GO:0005581) |
| 0.0 | 0.1 | GO:0045252 | oxoglutarate dehydrogenase complex(GO:0045252) |
| 0.0 | 0.0 | GO:0060342 | photoreceptor inner segment membrane(GO:0060342) |
| 0.0 | 0.1 | GO:0002189 | ribose phosphate diphosphokinase complex(GO:0002189) |
| 0.0 | 0.1 | GO:0000812 | Swr1 complex(GO:0000812) |
| 0.0 | 0.3 | GO:0005665 | DNA-directed RNA polymerase II, core complex(GO:0005665) |
| 0.0 | 0.6 | GO:0005903 | brush border(GO:0005903) |
| 0.0 | 0.2 | GO:0005849 | mRNA cleavage factor complex(GO:0005849) |
Gene overrepresentation in molecular function category:
| Log-likelihood per target | Total log-likelihood | Term | Description |
|---|---|---|---|
| 1.4 | 4.2 | GO:0008859 | exoribonuclease II activity(GO:0008859) |
| 1.4 | 4.2 | GO:0031731 | CCR6 chemokine receptor binding(GO:0031731) |
| 1.3 | 5.2 | GO:0034041 | sterol-transporting ATPase activity(GO:0034041) |
| 1.3 | 7.6 | GO:0031962 | mineralocorticoid receptor binding(GO:0031962) |
| 0.6 | 2.6 | GO:0004909 | interleukin-1, Type I, activating receptor activity(GO:0004909) |
| 0.6 | 1.7 | GO:0002113 | interleukin-33 binding(GO:0002113) |
| 0.6 | 1.7 | GO:0030305 | heparanase activity(GO:0030305) |
| 0.6 | 2.2 | GO:0002114 | interleukin-33 receptor activity(GO:0002114) |
| 0.5 | 3.2 | GO:0031735 | CCR10 chemokine receptor binding(GO:0031735) |
| 0.5 | 2.5 | GO:0004965 | G-protein coupled GABA receptor activity(GO:0004965) |
| 0.5 | 1.5 | GO:0035248 | alpha-1,4-N-acetylgalactosaminyltransferase activity(GO:0035248) |
| 0.5 | 1.9 | GO:0004743 | pyruvate kinase activity(GO:0004743) |
| 0.5 | 1.4 | GO:0008384 | IkappaB kinase activity(GO:0008384) |
| 0.5 | 1.8 | GO:0047685 | amine sulfotransferase activity(GO:0047685) |
| 0.4 | 6.3 | GO:0001730 | 2'-5'-oligoadenylate synthetase activity(GO:0001730) |
| 0.4 | 1.2 | GO:0001596 | angiotensin type I receptor activity(GO:0001596) |
| 0.4 | 1.6 | GO:0070320 | inward rectifier potassium channel inhibitor activity(GO:0070320) |
| 0.4 | 4.7 | GO:0035374 | chondroitin sulfate binding(GO:0035374) |
| 0.4 | 1.5 | GO:0004487 | methylenetetrahydrofolate dehydrogenase (NAD+) activity(GO:0004487) |
| 0.4 | 1.5 | GO:0003953 | NAD+ nucleosidase activity(GO:0003953) |
| 0.4 | 1.1 | GO:0031687 | A2A adenosine receptor binding(GO:0031687) |
| 0.4 | 1.5 | GO:0015222 | serotonin transmembrane transporter activity(GO:0015222) |
| 0.4 | 1.5 | GO:0002046 | opsin binding(GO:0002046) |
| 0.4 | 3.6 | GO:0016286 | small conductance calcium-activated potassium channel activity(GO:0016286) |
| 0.3 | 2.4 | GO:0042296 | ISG15 transferase activity(GO:0042296) |
| 0.3 | 2.7 | GO:0008048 | calcium sensitive guanylate cyclase activator activity(GO:0008048) |
| 0.3 | 1.0 | GO:0008476 | protein-tyrosine sulfotransferase activity(GO:0008476) |
| 0.3 | 4.3 | GO:0045236 | CXCR chemokine receptor binding(GO:0045236) |
| 0.3 | 2.6 | GO:0038049 | transcription factor activity, ligand-activated RNA polymerase II transcription factor binding(GO:0038049) |
| 0.3 | 8.8 | GO:0097200 | cysteine-type endopeptidase activity involved in execution phase of apoptosis(GO:0097200) |
| 0.3 | 0.8 | GO:0010348 | lithium:proton antiporter activity(GO:0010348) |
| 0.3 | 0.8 | GO:0000253 | 3-keto sterol reductase activity(GO:0000253) |
| 0.3 | 3.0 | GO:0004931 | extracellular ATP-gated cation channel activity(GO:0004931) ATP-gated ion channel activity(GO:0035381) |
| 0.3 | 4.9 | GO:0031996 | thioesterase binding(GO:0031996) |
| 0.3 | 0.8 | GO:0050309 | glucose-6-phosphatase activity(GO:0004346) sugar-terminal-phosphatase activity(GO:0050309) |
| 0.3 | 0.8 | GO:0030156 | benzodiazepine receptor binding(GO:0030156) |
| 0.3 | 1.6 | GO:0004771 | sterol esterase activity(GO:0004771) |
| 0.3 | 1.3 | GO:0031728 | CCR3 chemokine receptor binding(GO:0031728) |
| 0.3 | 1.8 | GO:0050294 | steroid sulfotransferase activity(GO:0050294) |
| 0.3 | 5.1 | GO:0047372 | acylglycerol lipase activity(GO:0047372) |
| 0.3 | 2.5 | GO:0004969 | histamine receptor activity(GO:0004969) |
| 0.2 | 0.7 | GO:0010698 | acetyltransferase activator activity(GO:0010698) |
| 0.2 | 1.5 | GO:0004699 | calcium-independent protein kinase C activity(GO:0004699) |
| 0.2 | 1.0 | GO:0004117 | calmodulin-dependent cyclic-nucleotide phosphodiesterase activity(GO:0004117) |
| 0.2 | 1.2 | GO:0031544 | peptidyl-proline 3-dioxygenase activity(GO:0031544) |
| 0.2 | 3.1 | GO:0031014 | troponin T binding(GO:0031014) |
| 0.2 | 1.7 | GO:0086089 | voltage-gated potassium channel activity involved in atrial cardiac muscle cell action potential repolarization(GO:0086089) |
| 0.2 | 3.9 | GO:0008503 | benzodiazepine receptor activity(GO:0008503) |
| 0.2 | 2.3 | GO:0016721 | superoxide dismutase activity(GO:0004784) oxidoreductase activity, acting on superoxide radicals as acceptor(GO:0016721) |
| 0.2 | 0.7 | GO:0033878 | hormone-sensitive lipase activity(GO:0033878) |
| 0.2 | 1.1 | GO:0061513 | hexose phosphate transmembrane transporter activity(GO:0015119) organophosphate:inorganic phosphate antiporter activity(GO:0015315) hexose-phosphate:inorganic phosphate antiporter activity(GO:0015526) glucose 6-phosphate:inorganic phosphate antiporter activity(GO:0061513) |
| 0.2 | 1.1 | GO:0030298 | receptor signaling protein tyrosine kinase activator activity(GO:0030298) |
| 0.2 | 0.7 | GO:0004914 | interleukin-5 receptor activity(GO:0004914) |
| 0.2 | 3.1 | GO:0017034 | Rap guanyl-nucleotide exchange factor activity(GO:0017034) |
| 0.2 | 3.3 | GO:0005381 | iron ion transmembrane transporter activity(GO:0005381) |
| 0.2 | 4.1 | GO:0019870 | potassium channel inhibitor activity(GO:0019870) |
| 0.2 | 0.6 | GO:0008336 | gamma-butyrobetaine dioxygenase activity(GO:0008336) |
| 0.2 | 8.6 | GO:0005540 | hyaluronic acid binding(GO:0005540) |
| 0.2 | 0.6 | GO:0042007 | interleukin-18 binding(GO:0042007) |
| 0.2 | 1.0 | GO:0030620 | U2 snRNA binding(GO:0030620) |
| 0.2 | 2.1 | GO:0008046 | axon guidance receptor activity(GO:0008046) |
| 0.2 | 0.6 | GO:0003845 | 11-beta-hydroxysteroid dehydrogenase [NAD(P)] activity(GO:0003845) |
| 0.2 | 1.2 | GO:0042835 | BRE binding(GO:0042835) |
| 0.2 | 1.0 | GO:0005294 | neutral L-amino acid secondary active transmembrane transporter activity(GO:0005294) |
| 0.2 | 0.8 | GO:0038047 | beta-endorphin receptor activity(GO:0004979) morphine receptor activity(GO:0038047) |
| 0.2 | 0.6 | GO:0004582 | dolichyl-phosphate beta-D-mannosyltransferase activity(GO:0004582) |
| 0.2 | 1.8 | GO:0004687 | myosin light chain kinase activity(GO:0004687) |
| 0.2 | 5.8 | GO:0005549 | odorant binding(GO:0005549) |
| 0.2 | 0.6 | GO:0004056 | argininosuccinate lyase activity(GO:0004056) |
| 0.2 | 2.7 | GO:0031433 | telethonin binding(GO:0031433) |
| 0.2 | 0.7 | GO:0031727 | CCR2 chemokine receptor binding(GO:0031727) |
| 0.2 | 0.7 | GO:0047888 | fatty acid peroxidase activity(GO:0047888) |
| 0.2 | 0.5 | GO:0008457 | beta-galactosyl-N-acetylglucosaminylgalactosylglucosyl-ceramide beta-1,3-acetylglucosaminyltransferase activity(GO:0008457) lactosylceramide 1,3-N-acetyl-beta-D-glucosaminyltransferase activity(GO:0047256) |
| 0.2 | 0.5 | GO:0005260 | channel-conductance-controlling ATPase activity(GO:0005260) |
| 0.2 | 2.2 | GO:0030280 | structural constituent of epidermis(GO:0030280) |
| 0.2 | 0.5 | GO:0031896 | V2 vasopressin receptor binding(GO:0031896) |
| 0.2 | 2.5 | GO:0003796 | lysozyme activity(GO:0003796) |
| 0.2 | 4.8 | GO:0004298 | threonine-type endopeptidase activity(GO:0004298) threonine-type peptidase activity(GO:0070003) |
| 0.2 | 0.3 | GO:0004052 | arachidonate 12-lipoxygenase activity(GO:0004052) |
| 0.2 | 0.8 | GO:0004471 | malate dehydrogenase (decarboxylating) (NAD+) activity(GO:0004471) malate dehydrogenase (decarboxylating) (NADP+) activity(GO:0004473) |
| 0.2 | 0.8 | GO:0015433 | peptide antigen-transporting ATPase activity(GO:0015433) |
| 0.2 | 1.1 | GO:0004974 | leukotriene receptor activity(GO:0004974) |
| 0.2 | 0.5 | GO:0042947 | glucoside transmembrane transporter activity(GO:0042947) |
| 0.2 | 1.1 | GO:0001517 | N-acetylglucosamine 6-O-sulfotransferase activity(GO:0001517) |
| 0.2 | 0.5 | GO:0031862 | prostanoid receptor binding(GO:0031862) |
| 0.2 | 1.5 | GO:0043533 | inositol 1,3,4,5 tetrakisphosphate binding(GO:0043533) |
| 0.2 | 0.6 | GO:0042134 | rRNA primary transcript binding(GO:0042134) |
| 0.2 | 1.1 | GO:0004331 | fructose-2,6-bisphosphate 2-phosphatase activity(GO:0004331) |
| 0.1 | 1.2 | GO:0034513 | box H/ACA snoRNA binding(GO:0034513) |
| 0.1 | 1.8 | GO:0043995 | histone acetyltransferase activity (H4-K5 specific)(GO:0043995) histone acetyltransferase activity (H4-K8 specific)(GO:0043996) histone acetyltransferase activity (H4-K16 specific)(GO:0046972) |
| 0.1 | 3.1 | GO:0031005 | filamin binding(GO:0031005) |
| 0.1 | 1.0 | GO:0004045 | aminoacyl-tRNA hydrolase activity(GO:0004045) |
| 0.1 | 0.4 | GO:0090631 | pre-miRNA transporter activity(GO:0090631) |
| 0.1 | 0.4 | GO:0002094 | polyprenyltransferase activity(GO:0002094) |
| 0.1 | 0.4 | GO:0047315 | kynurenine-glyoxylate transaminase activity(GO:0047315) |
| 0.1 | 0.4 | GO:0004963 | follicle-stimulating hormone receptor activity(GO:0004963) |
| 0.1 | 0.4 | GO:0102008 | cytosolic dipeptidase activity(GO:0102008) |
| 0.1 | 1.0 | GO:0004499 | N,N-dimethylaniline monooxygenase activity(GO:0004499) |
| 0.1 | 1.4 | GO:0004634 | phosphopyruvate hydratase activity(GO:0004634) |
| 0.1 | 2.6 | GO:0086080 | protein binding involved in heterotypic cell-cell adhesion(GO:0086080) |
| 0.1 | 2.0 | GO:0015501 | glutamate:sodium symporter activity(GO:0015501) |
| 0.1 | 0.4 | GO:0030158 | protein xylosyltransferase activity(GO:0030158) |
| 0.1 | 0.6 | GO:0004769 | steroid delta-isomerase activity(GO:0004769) |
| 0.1 | 0.4 | GO:0034736 | sterol O-acyltransferase activity(GO:0004772) cholesterol O-acyltransferase activity(GO:0034736) |
| 0.1 | 2.6 | GO:0004089 | carbonate dehydratase activity(GO:0004089) |
| 0.1 | 0.5 | GO:0016212 | kynurenine-oxoglutarate transaminase activity(GO:0016212) kynurenine aminotransferase activity(GO:0036137) |
| 0.1 | 2.9 | GO:0052629 | phosphatidylinositol-3,5-bisphosphate 3-phosphatase activity(GO:0052629) |
| 0.1 | 0.5 | GO:0035939 | microsatellite binding(GO:0035939) |
| 0.1 | 0.3 | GO:0030226 | apolipoprotein receptor activity(GO:0030226) |
| 0.1 | 0.7 | GO:0019912 | cyclin-dependent protein kinase activating kinase activity(GO:0019912) |
| 0.1 | 0.4 | GO:0008502 | melatonin receptor activity(GO:0008502) |
| 0.1 | 0.5 | GO:0051765 | inositol tetrakisphosphate kinase activity(GO:0051765) |
| 0.1 | 1.0 | GO:0005332 | gamma-aminobutyric acid:sodium symporter activity(GO:0005332) |
| 0.1 | 1.3 | GO:0060072 | large conductance calcium-activated potassium channel activity(GO:0060072) |
| 0.1 | 2.7 | GO:0051400 | BH domain binding(GO:0051400) |
| 0.1 | 3.3 | GO:0017049 | GTP-Rho binding(GO:0017049) |
| 0.1 | 0.4 | GO:0004345 | glucose-6-phosphate dehydrogenase activity(GO:0004345) |
| 0.1 | 0.6 | GO:0061133 | endopeptidase activator activity(GO:0061133) |
| 0.1 | 0.6 | GO:0030346 | protein phosphatase 2B binding(GO:0030346) |
| 0.1 | 0.9 | GO:0051525 | NFAT protein binding(GO:0051525) |
| 0.1 | 0.4 | GO:0060422 | peptidyl-dipeptidase inhibitor activity(GO:0060422) |
| 0.1 | 0.6 | GO:0050816 | phosphothreonine binding(GO:0050816) |
| 0.1 | 0.9 | GO:0035662 | Toll-like receptor 4 binding(GO:0035662) |
| 0.1 | 3.7 | GO:0004012 | phospholipid-translocating ATPase activity(GO:0004012) |
| 0.1 | 4.6 | GO:0005164 | tumor necrosis factor receptor binding(GO:0005164) |
| 0.1 | 3.6 | GO:0031698 | beta-2 adrenergic receptor binding(GO:0031698) |
| 0.1 | 1.3 | GO:0035242 | protein-arginine omega-N asymmetric methyltransferase activity(GO:0035242) |
| 0.1 | 0.5 | GO:0047391 | alkylglycerophosphoethanolamine phosphodiesterase activity(GO:0047391) |
| 0.1 | 0.5 | GO:0070644 | vitamin D response element binding(GO:0070644) |
| 0.1 | 1.1 | GO:0003726 | double-stranded RNA adenosine deaminase activity(GO:0003726) |
| 0.1 | 0.2 | GO:0086007 | voltage-gated calcium channel activity involved in cardiac muscle cell action potential(GO:0086007) |
| 0.1 | 0.5 | GO:0004102 | choline O-acetyltransferase activity(GO:0004102) |
| 0.1 | 2.5 | GO:0015269 | calcium-activated potassium channel activity(GO:0015269) |
| 0.1 | 0.4 | GO:0070984 | SET domain binding(GO:0070984) |
| 0.1 | 0.9 | GO:0016907 | G-protein coupled acetylcholine receptor activity(GO:0016907) |
| 0.1 | 1.9 | GO:0004028 | 3-chloroallyl aldehyde dehydrogenase activity(GO:0004028) |
| 0.1 | 0.2 | GO:0031893 | vasopressin receptor binding(GO:0031893) |
| 0.1 | 0.7 | GO:0022850 | serotonin-gated cation channel activity(GO:0022850) |
| 0.1 | 0.8 | GO:0008109 | N-acetyllactosaminide beta-1,6-N-acetylglucosaminyltransferase activity(GO:0008109) |
| 0.1 | 1.3 | GO:0004000 | adenosine deaminase activity(GO:0004000) |
| 0.1 | 1.1 | GO:0004062 | aryl sulfotransferase activity(GO:0004062) |
| 0.1 | 1.6 | GO:0019864 | IgG binding(GO:0019864) |
| 0.1 | 0.3 | GO:0016497 | substance K receptor activity(GO:0016497) |
| 0.1 | 0.6 | GO:0004619 | bisphosphoglycerate mutase activity(GO:0004082) phosphoglycerate mutase activity(GO:0004619) 2,3-bisphosphoglycerate-dependent phosphoglycerate mutase activity(GO:0046538) |
| 0.1 | 0.7 | GO:0018685 | alkane 1-monooxygenase activity(GO:0018685) |
| 0.1 | 0.5 | GO:0070548 | glutamine-fructose-6-phosphate transaminase (isomerizing) activity(GO:0004360) L-glutamine aminotransferase activity(GO:0070548) |
| 0.1 | 0.3 | GO:0015057 | thrombin receptor activity(GO:0015057) |
| 0.1 | 1.9 | GO:0030881 | beta-2-microglobulin binding(GO:0030881) |
| 0.1 | 0.6 | GO:0016971 | flavin-linked sulfhydryl oxidase activity(GO:0016971) |
| 0.1 | 0.9 | GO:0015186 | L-glutamine transmembrane transporter activity(GO:0015186) |
| 0.1 | 0.3 | GO:0005017 | platelet-derived growth factor-activated receptor activity(GO:0005017) |
| 0.1 | 1.6 | GO:0086056 | voltage-gated calcium channel activity involved in AV node cell action potential(GO:0086056) |
| 0.1 | 2.9 | GO:0070628 | proteasome binding(GO:0070628) |
| 0.1 | 0.4 | GO:0004074 | biliverdin reductase activity(GO:0004074) |
| 0.1 | 3.8 | GO:0043394 | proteoglycan binding(GO:0043394) |
| 0.1 | 0.4 | GO:0098808 | mRNA cap binding(GO:0098808) |
| 0.1 | 0.6 | GO:0030060 | L-malate dehydrogenase activity(GO:0030060) |
| 0.1 | 0.9 | GO:0005314 | high-affinity glutamate transmembrane transporter activity(GO:0005314) |
| 0.1 | 0.5 | GO:0008525 | phosphatidylcholine transporter activity(GO:0008525) |
| 0.1 | 0.2 | GO:0004992 | platelet activating factor receptor activity(GO:0004992) |
| 0.1 | 3.1 | GO:0097109 | neuroligin family protein binding(GO:0097109) |
| 0.1 | 1.1 | GO:0015321 | sodium-dependent phosphate transmembrane transporter activity(GO:0015321) |
| 0.1 | 0.6 | GO:0034714 | type III transforming growth factor beta receptor binding(GO:0034714) |
| 0.1 | 0.3 | GO:0005333 | norepinephrine transmembrane transporter activity(GO:0005333) |
| 0.1 | 0.7 | GO:0042500 | aspartic endopeptidase activity, intramembrane cleaving(GO:0042500) |
| 0.1 | 1.0 | GO:0005237 | inhibitory extracellular ligand-gated ion channel activity(GO:0005237) |
| 0.1 | 1.3 | GO:0050700 | CARD domain binding(GO:0050700) |
| 0.1 | 2.3 | GO:0017128 | phospholipid scramblase activity(GO:0017128) |
| 0.1 | 0.4 | GO:0004660 | protein farnesyltransferase activity(GO:0004660) |
| 0.1 | 0.3 | GO:0061629 | RNA polymerase II sequence-specific DNA binding transcription factor binding(GO:0061629) |
| 0.1 | 0.3 | GO:0005137 | interleukin-5 receptor binding(GO:0005137) |
| 0.1 | 0.8 | GO:0004704 | NF-kappaB-inducing kinase activity(GO:0004704) |
| 0.1 | 1.4 | GO:0008199 | ferric iron binding(GO:0008199) |
| 0.1 | 0.4 | GO:0004667 | prostaglandin-D synthase activity(GO:0004667) |
| 0.1 | 0.5 | GO:0047288 | monosialoganglioside sialyltransferase activity(GO:0047288) |
| 0.1 | 0.3 | GO:0090541 | MIT domain binding(GO:0090541) |
| 0.1 | 1.2 | GO:0016176 | superoxide-generating NADPH oxidase activator activity(GO:0016176) |
| 0.1 | 0.9 | GO:0060002 | plus-end directed microfilament motor activity(GO:0060002) |
| 0.1 | 0.3 | GO:0000773 | phosphatidyl-N-methylethanolamine N-methyltransferase activity(GO:0000773) phosphatidylethanolamine N-methyltransferase activity(GO:0004608) phosphatidyl-N-dimethylethanolamine N-methyltransferase activity(GO:0080101) |
| 0.1 | 5.8 | GO:0017080 | sodium channel regulator activity(GO:0017080) |
| 0.1 | 2.1 | GO:0004185 | serine-type carboxypeptidase activity(GO:0004185) |
| 0.1 | 0.9 | GO:0019158 | glucokinase activity(GO:0004340) hexokinase activity(GO:0004396) fructokinase activity(GO:0008865) mannokinase activity(GO:0019158) |
| 0.1 | 0.3 | GO:0004040 | amidase activity(GO:0004040) |
| 0.1 | 0.6 | GO:0034511 | U3 snoRNA binding(GO:0034511) |
| 0.1 | 2.4 | GO:0042043 | neurexin family protein binding(GO:0042043) |
| 0.1 | 0.4 | GO:0052901 | polyamine oxidase activity(GO:0046592) spermine:oxygen oxidoreductase (spermidine-forming) activity(GO:0052901) |
| 0.1 | 0.3 | GO:0008988 | rRNA (adenine-N6-)-methyltransferase activity(GO:0008988) mRNA (2'-O-methyladenosine-N6-)-methyltransferase activity(GO:0016422) |
| 0.1 | 0.7 | GO:0048495 | Roundabout binding(GO:0048495) |
| 0.1 | 0.4 | GO:0051733 | ATP-dependent polydeoxyribonucleotide 5'-hydroxyl-kinase activity(GO:0046404) polydeoxyribonucleotide kinase activity(GO:0051733) ATP-dependent polynucleotide kinase activity(GO:0051734) |
| 0.1 | 0.4 | GO:0070326 | very-low-density lipoprotein particle receptor binding(GO:0070326) |
| 0.1 | 13.7 | GO:0004984 | olfactory receptor activity(GO:0004984) |
| 0.1 | 0.5 | GO:0008508 | bile acid:sodium symporter activity(GO:0008508) |
| 0.1 | 0.5 | GO:0005384 | manganese ion transmembrane transporter activity(GO:0005384) |
| 0.1 | 0.6 | GO:0061649 | ubiquitinated histone binding(GO:0061649) |
| 0.1 | 3.0 | GO:0016638 | oxidoreductase activity, acting on the CH-NH2 group of donors(GO:0016638) |
| 0.1 | 0.5 | GO:0004882 | androgen receptor activity(GO:0004882) |
| 0.1 | 0.5 | GO:0046923 | ER retention sequence binding(GO:0046923) |
| 0.1 | 0.5 | GO:0004826 | phenylalanine-tRNA ligase activity(GO:0004826) |
| 0.1 | 0.2 | GO:0030250 | cyclase activator activity(GO:0010853) guanylate cyclase activator activity(GO:0030250) |
| 0.1 | 0.6 | GO:0042608 | T cell receptor binding(GO:0042608) |
| 0.1 | 0.6 | GO:0008479 | queuine tRNA-ribosyltransferase activity(GO:0008479) |
| 0.1 | 0.8 | GO:0035727 | lysophosphatidic acid binding(GO:0035727) |
| 0.1 | 3.9 | GO:0051019 | mitogen-activated protein kinase binding(GO:0051019) |
| 0.1 | 0.3 | GO:0031780 | corticotropin hormone receptor binding(GO:0031780) type 5 melanocortin receptor binding(GO:0031783) |
| 0.1 | 0.3 | GO:0004766 | spermidine synthase activity(GO:0004766) |
| 0.1 | 0.9 | GO:0042301 | phosphate ion binding(GO:0042301) |
| 0.1 | 0.3 | GO:0008900 | hydrogen:potassium-exchanging ATPase activity(GO:0008900) |
| 0.1 | 0.3 | GO:0031013 | troponin I binding(GO:0031013) |
| 0.1 | 0.3 | GO:0047783 | steroid 11-beta-monooxygenase activity(GO:0004507) corticosterone 18-monooxygenase activity(GO:0047783) |
| 0.1 | 0.5 | GO:0004522 | ribonuclease A activity(GO:0004522) |
| 0.1 | 0.3 | GO:0005459 | UDP-galactose transmembrane transporter activity(GO:0005459) |
| 0.1 | 0.4 | GO:0047280 | nicotinamide phosphoribosyltransferase activity(GO:0047280) |
| 0.1 | 0.4 | GO:0005330 | dopamine:sodium symporter activity(GO:0005330) |
| 0.1 | 0.7 | GO:0004468 | lysine N-acetyltransferase activity, acting on acetyl phosphate as donor(GO:0004468) |
| 0.1 | 0.2 | GO:0005280 | hydrogen:amino acid symporter activity(GO:0005280) L-alanine transmembrane transporter activity(GO:0015180) alanine transmembrane transporter activity(GO:0022858) |
| 0.1 | 0.2 | GO:0048763 | calcium-induced calcium release activity(GO:0048763) |
| 0.1 | 0.2 | GO:0050571 | 1,5-anhydro-D-fructose reductase activity(GO:0050571) |
| 0.1 | 0.5 | GO:0031752 | D5 dopamine receptor binding(GO:0031752) |
| 0.1 | 1.5 | GO:0005068 | transmembrane receptor protein tyrosine kinase adaptor activity(GO:0005068) |
| 0.1 | 0.2 | GO:0000179 | rRNA (adenine-N6,N6-)-dimethyltransferase activity(GO:0000179) |
| 0.1 | 1.7 | GO:0005149 | interleukin-1 receptor binding(GO:0005149) |
| 0.1 | 0.2 | GO:0045322 | unmethylated CpG binding(GO:0045322) |
| 0.1 | 0.4 | GO:0004105 | choline-phosphate cytidylyltransferase activity(GO:0004105) |
| 0.1 | 0.3 | GO:0003963 | RNA-3'-phosphate cyclase activity(GO:0003963) |
| 0.1 | 0.2 | GO:0005128 | erythropoietin receptor binding(GO:0005128) |
| 0.1 | 0.3 | GO:0019107 | glycylpeptide N-tetradecanoyltransferase activity(GO:0004379) myristoyltransferase activity(GO:0019107) |
| 0.1 | 1.8 | GO:0008331 | high voltage-gated calcium channel activity(GO:0008331) |
| 0.1 | 0.7 | GO:0099580 | ion antiporter activity involved in regulation of postsynaptic membrane potential(GO:0099580) |
| 0.1 | 0.4 | GO:0015265 | urea channel activity(GO:0015265) |
| 0.1 | 0.6 | GO:1990050 | phosphatidic acid transporter activity(GO:1990050) |
| 0.1 | 0.4 | GO:0051120 | hepoxilin A3 synthase activity(GO:0051120) |
| 0.1 | 0.4 | GO:0016623 | oxidoreductase activity, acting on the aldehyde or oxo group of donors, oxygen as acceptor(GO:0016623) |
| 0.1 | 1.2 | GO:0038036 | sphingosine-1-phosphate receptor activity(GO:0038036) |
| 0.1 | 0.8 | GO:0070324 | thyroid hormone binding(GO:0070324) |
| 0.1 | 0.9 | GO:0042609 | CD4 receptor binding(GO:0042609) |
| 0.1 | 2.2 | GO:0005212 | structural constituent of eye lens(GO:0005212) |
| 0.1 | 0.3 | GO:0032408 | MutLbeta complex binding(GO:0032406) MutSbeta complex binding(GO:0032408) |
| 0.1 | 0.5 | GO:0015016 | [heparan sulfate]-glucosamine N-sulfotransferase activity(GO:0015016) |
| 0.1 | 1.7 | GO:0033038 | bitter taste receptor activity(GO:0033038) |
| 0.1 | 0.4 | GO:0045545 | syndecan binding(GO:0045545) |
| 0.1 | 1.8 | GO:0045295 | gamma-catenin binding(GO:0045295) |
| 0.1 | 1.3 | GO:0016423 | tRNA (guanine) methyltransferase activity(GO:0016423) |
| 0.1 | 0.1 | GO:0004711 | ribosomal protein S6 kinase activity(GO:0004711) |
| 0.1 | 0.5 | GO:0008454 | alpha-1,3-mannosylglycoprotein 4-beta-N-acetylglucosaminyltransferase activity(GO:0008454) |
| 0.1 | 0.5 | GO:0005134 | interleukin-2 receptor binding(GO:0005134) |
| 0.1 | 0.6 | GO:0003810 | protein-glutamine gamma-glutamyltransferase activity(GO:0003810) |
| 0.1 | 0.2 | GO:0047374 | methylumbelliferyl-acetate deacetylase activity(GO:0047374) |
| 0.1 | 0.4 | GO:0045134 | uridine-diphosphatase activity(GO:0045134) |
| 0.1 | 0.4 | GO:0003835 | beta-galactoside alpha-2,6-sialyltransferase activity(GO:0003835) |
| 0.1 | 0.3 | GO:0043855 | intracellular cyclic nucleotide activated cation channel activity(GO:0005221) cyclic nucleotide-gated ion channel activity(GO:0043855) |
| 0.1 | 0.3 | GO:0003945 | N-acetyllactosamine synthase activity(GO:0003945) |
| 0.1 | 0.3 | GO:0005148 | prolactin receptor binding(GO:0005148) |
| 0.1 | 0.9 | GO:0042975 | peroxisome proliferator activated receptor binding(GO:0042975) |
| 0.1 | 0.1 | GO:0050567 | glutaminyl-tRNA synthase (glutamine-hydrolyzing) activity(GO:0050567) |
| 0.1 | 0.2 | GO:0005497 | androgen binding(GO:0005497) |
| 0.1 | 0.8 | GO:0038132 | neuregulin binding(GO:0038132) |
| 0.1 | 1.0 | GO:0046790 | virion binding(GO:0046790) |
| 0.1 | 0.3 | GO:0004706 | JUN kinase kinase kinase activity(GO:0004706) |
| 0.1 | 0.2 | GO:0004488 | methenyltetrahydrofolate cyclohydrolase activity(GO:0004477) methylenetetrahydrofolate dehydrogenase (NADP+) activity(GO:0004488) |
| 0.1 | 3.5 | GO:0005547 | phosphatidylinositol-3,4,5-trisphosphate binding(GO:0005547) |
| 0.1 | 1.3 | GO:0017070 | U6 snRNA binding(GO:0017070) |
| 0.1 | 0.3 | GO:0016300 | tRNA (uracil) methyltransferase activity(GO:0016300) |
| 0.1 | 0.3 | GO:1901474 | thiamine transmembrane transporter activity(GO:0015234) azole transmembrane transporter activity(GO:1901474) |
| 0.1 | 1.0 | GO:0015271 | outward rectifier potassium channel activity(GO:0015271) |
| 0.1 | 1.1 | GO:0005344 | oxygen transporter activity(GO:0005344) |
| 0.1 | 0.2 | GO:0060175 | brain-derived neurotrophic factor-activated receptor activity(GO:0060175) |
| 0.1 | 1.4 | GO:0001965 | G-protein alpha-subunit binding(GO:0001965) |
| 0.1 | 10.6 | GO:0004222 | metalloendopeptidase activity(GO:0004222) |
| 0.1 | 0.6 | GO:0070567 | cytidylyltransferase activity(GO:0070567) |
| 0.1 | 0.3 | GO:0004852 | uroporphyrinogen-III synthase activity(GO:0004852) |
| 0.1 | 0.7 | GO:0031681 | G-protein beta-subunit binding(GO:0031681) |
| 0.1 | 0.3 | GO:0070576 | vitamin D 24-hydroxylase activity(GO:0070576) |
| 0.1 | 0.3 | GO:0004741 | [pyruvate dehydrogenase (lipoamide)] phosphatase activity(GO:0004741) |
| 0.1 | 0.5 | GO:0005047 | signal recognition particle binding(GO:0005047) |
| 0.1 | 4.8 | GO:0004712 | protein serine/threonine/tyrosine kinase activity(GO:0004712) |
| 0.1 | 0.4 | GO:0005416 | cation:amino acid symporter activity(GO:0005416) |
| 0.1 | 5.5 | GO:0050681 | androgen receptor binding(GO:0050681) |
| 0.1 | 0.2 | GO:0043891 | glyceraldehyde-3-phosphate dehydrogenase (NAD+) (phosphorylating) activity(GO:0004365) glyceraldehyde-3-phosphate dehydrogenase (NAD(P)+) (phosphorylating) activity(GO:0043891) |
| 0.1 | 0.4 | GO:0017098 | sulfonylurea receptor binding(GO:0017098) |
| 0.1 | 0.2 | GO:0004911 | interleukin-2 receptor activity(GO:0004911) interleukin-2 binding(GO:0019976) |
| 0.1 | 0.2 | GO:0005026 | transforming growth factor beta receptor activity, type II(GO:0005026) |
| 0.1 | 0.2 | GO:0098770 | FBXO family protein binding(GO:0098770) |
| 0.1 | 0.5 | GO:0010385 | double-stranded methylated DNA binding(GO:0010385) |
| 0.1 | 0.3 | GO:0005223 | intracellular cGMP activated cation channel activity(GO:0005223) |
| 0.1 | 0.7 | GO:0004568 | chitinase activity(GO:0004568) |
| 0.1 | 0.3 | GO:0004392 | heme oxygenase (decyclizing) activity(GO:0004392) |
| 0.1 | 0.2 | GO:0005350 | pyrimidine nucleobase transmembrane transporter activity(GO:0005350) pyrimidine- and adenine-specific:sodium symporter activity(GO:0015389) |
| 0.1 | 0.9 | GO:0042056 | chemoattractant activity(GO:0042056) |
| 0.1 | 0.9 | GO:0019957 | C-C chemokine binding(GO:0019957) |
| 0.1 | 1.3 | GO:0016832 | aldehyde-lyase activity(GO:0016832) |
| 0.1 | 0.2 | GO:0097677 | STAT family protein binding(GO:0097677) |
| 0.1 | 1.7 | GO:0005388 | calcium-transporting ATPase activity(GO:0005388) |
| 0.1 | 0.3 | GO:0004024 | alcohol dehydrogenase activity, zinc-dependent(GO:0004024) |
| 0.1 | 0.3 | GO:0008853 | exodeoxyribonuclease III activity(GO:0008853) |
| 0.1 | 1.7 | GO:0051537 | 2 iron, 2 sulfur cluster binding(GO:0051537) |
| 0.1 | 0.3 | GO:0030171 | voltage-gated proton channel activity(GO:0030171) |
| 0.1 | 0.4 | GO:0003846 | 2-acylglycerol O-acyltransferase activity(GO:0003846) |
| 0.1 | 0.4 | GO:0005078 | MAP-kinase scaffold activity(GO:0005078) |
| 0.1 | 1.5 | GO:0005248 | voltage-gated sodium channel activity(GO:0005248) voltage-gated ion channel activity involved in regulation of postsynaptic membrane potential(GO:1905030) |
| 0.1 | 0.2 | GO:0052739 | phosphatidylserine 1-acylhydrolase activity(GO:0052739) |
| 0.1 | 0.1 | GO:0008523 | sodium-dependent multivitamin transmembrane transporter activity(GO:0008523) |
| 0.1 | 0.3 | GO:0031435 | mitogen-activated protein kinase kinase kinase binding(GO:0031435) |
| 0.1 | 0.2 | GO:0016713 | oxidoreductase activity, acting on paired donors, with incorporation or reduction of molecular oxygen, reduced iron-sulfur protein as one donor, and incorporation of one atom of oxygen(GO:0016713) |
| 0.1 | 0.4 | GO:0060698 | endoribonuclease inhibitor activity(GO:0060698) |
| 0.1 | 0.4 | GO:0001165 | RNA polymerase I upstream control element sequence-specific DNA binding(GO:0001165) |
| 0.1 | 0.7 | GO:0017151 | DEAD/H-box RNA helicase binding(GO:0017151) |
| 0.1 | 1.3 | GO:0031434 | mitogen-activated protein kinase kinase binding(GO:0031434) |
| 0.1 | 1.6 | GO:0031489 | myosin V binding(GO:0031489) |
| 0.1 | 0.9 | GO:0004065 | arylsulfatase activity(GO:0004065) |
| 0.1 | 0.2 | GO:0061676 | importin-alpha family protein binding(GO:0061676) |
| 0.1 | 0.2 | GO:0034584 | piRNA binding(GO:0034584) |
| 0.1 | 1.8 | GO:0005104 | fibroblast growth factor receptor binding(GO:0005104) |
| 0.1 | 0.5 | GO:0030160 | GKAP/Homer scaffold activity(GO:0030160) |
| 0.1 | 1.2 | GO:0070566 | adenylyltransferase activity(GO:0070566) |
| 0.1 | 0.3 | GO:0017018 | myosin phosphatase activity(GO:0017018) |
| 0.1 | 1.9 | GO:0017147 | Wnt-protein binding(GO:0017147) |
| 0.1 | 0.2 | GO:0008745 | N-acetylmuramoyl-L-alanine amidase activity(GO:0008745) |
| 0.1 | 0.7 | GO:1990825 | sequence-specific mRNA binding(GO:1990825) |
| 0.1 | 0.1 | GO:0001032 | RNA polymerase III type 3 promoter DNA binding(GO:0001032) |
| 0.1 | 0.6 | GO:0004865 | protein serine/threonine phosphatase inhibitor activity(GO:0004865) |
| 0.1 | 0.5 | GO:0005432 | calcium:sodium antiporter activity(GO:0005432) |
| 0.1 | 0.3 | GO:0005168 | neurotrophin TRKA receptor binding(GO:0005168) |
| 0.1 | 0.6 | GO:0097322 | 7SK snRNA binding(GO:0097322) |
| 0.1 | 0.3 | GO:0031730 | CCR5 chemokine receptor binding(GO:0031730) |
| 0.1 | 3.7 | GO:0030374 | ligand-dependent nuclear receptor transcription coactivator activity(GO:0030374) |
| 0.1 | 0.2 | GO:0004339 | glucan 1,4-alpha-glucosidase activity(GO:0004339) |
| 0.1 | 0.3 | GO:0019798 | procollagen-proline dioxygenase activity(GO:0019798) |
| 0.1 | 0.4 | GO:0005052 | peroxisome matrix targeting signal-1 binding(GO:0005052) |
| 0.1 | 0.2 | GO:0070890 | L-ascorbate:sodium symporter activity(GO:0008520) L-ascorbic acid transporter activity(GO:0015229) sodium-dependent L-ascorbate transmembrane transporter activity(GO:0070890) |
| 0.0 | 0.4 | GO:0015277 | kainate selective glutamate receptor activity(GO:0015277) |
| 0.0 | 1.2 | GO:0022842 | leak channel activity(GO:0022840) narrow pore channel activity(GO:0022842) |
| 0.0 | 0.4 | GO:0032217 | riboflavin transporter activity(GO:0032217) |
| 0.0 | 1.1 | GO:0005234 | extracellular-glutamate-gated ion channel activity(GO:0005234) |
| 0.0 | 0.3 | GO:0004735 | pyrroline-5-carboxylate reductase activity(GO:0004735) |
| 0.0 | 0.7 | GO:0005007 | fibroblast growth factor-activated receptor activity(GO:0005007) |
| 0.0 | 0.2 | GO:0070051 | fibrinogen binding(GO:0070051) |
| 0.0 | 0.1 | GO:0033842 | N-acetyl-beta-glucosaminyl-glycoprotein 4-beta-N-acetylgalactosaminyltransferase activity(GO:0033842) |
| 0.0 | 0.2 | GO:0008142 | oxysterol binding(GO:0008142) |
| 0.0 | 0.5 | GO:0004128 | cytochrome-b5 reductase activity, acting on NAD(P)H(GO:0004128) |
| 0.0 | 0.2 | GO:0003938 | IMP dehydrogenase activity(GO:0003938) |
| 0.0 | 0.3 | GO:0023029 | MHC class Ib protein binding(GO:0023029) |
| 0.0 | 1.0 | GO:0005523 | tropomyosin binding(GO:0005523) |
| 0.0 | 0.3 | GO:0008310 | single-stranded DNA 3'-5' exodeoxyribonuclease activity(GO:0008310) |
| 0.0 | 0.2 | GO:0035473 | lipase binding(GO:0035473) |
| 0.0 | 0.1 | GO:0016608 | growth hormone-releasing hormone activity(GO:0016608) |
| 0.0 | 0.3 | GO:0047696 | beta-adrenergic receptor kinase activity(GO:0047696) |
| 0.0 | 0.3 | GO:0004594 | pantothenate kinase activity(GO:0004594) |
| 0.0 | 1.2 | GO:0005528 | macrolide binding(GO:0005527) FK506 binding(GO:0005528) |
| 0.0 | 0.2 | GO:0031694 | alpha-2A adrenergic receptor binding(GO:0031694) |
| 0.0 | 0.3 | GO:0004127 | cytidylate kinase activity(GO:0004127) |
| 0.0 | 1.3 | GO:0004435 | phosphatidylinositol phospholipase C activity(GO:0004435) |
| 0.0 | 0.7 | GO:0000774 | adenyl-nucleotide exchange factor activity(GO:0000774) |
| 0.0 | 0.8 | GO:0019841 | retinol binding(GO:0019841) |
| 0.0 | 0.4 | GO:0035259 | glucocorticoid receptor binding(GO:0035259) |
| 0.0 | 0.4 | GO:0030957 | Tat protein binding(GO:0030957) |
| 0.0 | 0.2 | GO:0061714 | methotrexate binding(GO:0051870) folic acid receptor activity(GO:0061714) |
| 0.0 | 0.2 | GO:0008422 | beta-glucosidase activity(GO:0008422) |
| 0.0 | 0.1 | GO:0098973 | structural constituent of synapse(GO:0098918) structural constituent of postsynaptic actin cytoskeleton(GO:0098973) |
| 0.0 | 0.3 | GO:0004430 | 1-phosphatidylinositol 4-kinase activity(GO:0004430) |
| 0.0 | 0.2 | GO:0035500 | MH2 domain binding(GO:0035500) MH1 domain binding(GO:0035501) |
| 0.0 | 0.2 | GO:0008184 | glycogen phosphorylase activity(GO:0008184) |
| 0.0 | 0.9 | GO:0051371 | muscle alpha-actinin binding(GO:0051371) |
| 0.0 | 0.9 | GO:0004143 | diacylglycerol kinase activity(GO:0004143) |
| 0.0 | 0.7 | GO:0005229 | intracellular calcium activated chloride channel activity(GO:0005229) |
| 0.0 | 0.5 | GO:0031995 | insulin-like growth factor II binding(GO:0031995) |
| 0.0 | 0.2 | GO:0003956 | NAD(P)+-protein-arginine ADP-ribosyltransferase activity(GO:0003956) |
| 0.0 | 0.5 | GO:0017162 | aryl hydrocarbon receptor binding(GO:0017162) |
| 0.0 | 0.4 | GO:0019103 | pyrimidine nucleotide binding(GO:0019103) |
| 0.0 | 1.3 | GO:0008143 | poly(A) binding(GO:0008143) |
| 0.0 | 0.3 | GO:0005324 | long-chain fatty acid transporter activity(GO:0005324) |
| 0.0 | 0.1 | GO:0070259 | tyrosyl-DNA phosphodiesterase activity(GO:0070259) |
| 0.0 | 0.2 | GO:0031208 | POZ domain binding(GO:0031208) |
| 0.0 | 1.0 | GO:0042605 | peptide antigen binding(GO:0042605) |
| 0.0 | 0.2 | GO:0010521 | telomerase inhibitor activity(GO:0010521) |
| 0.0 | 0.1 | GO:0008948 | oxaloacetate decarboxylase activity(GO:0008948) |
| 0.0 | 0.2 | GO:0031708 | endothelin B receptor binding(GO:0031708) |
| 0.0 | 0.5 | GO:0097493 | structural molecule activity conferring elasticity(GO:0097493) |
| 0.0 | 1.1 | GO:0005001 | transmembrane receptor protein tyrosine phosphatase activity(GO:0005001) transmembrane receptor protein phosphatase activity(GO:0019198) |
| 0.0 | 0.4 | GO:0004861 | cyclin-dependent protein serine/threonine kinase inhibitor activity(GO:0004861) |
| 0.0 | 0.3 | GO:0004459 | L-lactate dehydrogenase activity(GO:0004459) |
| 0.0 | 0.4 | GO:0097027 | ubiquitin-protein transferase activator activity(GO:0097027) |
| 0.0 | 0.2 | GO:0004758 | serine C-palmitoyltransferase activity(GO:0004758) C-palmitoyltransferase activity(GO:0016454) |
| 0.0 | 0.2 | GO:0060230 | lipoprotein lipase activator activity(GO:0060230) |
| 0.0 | 0.7 | GO:0008417 | fucosyltransferase activity(GO:0008417) |
| 0.0 | 0.4 | GO:0035925 | mRNA 3'-UTR AU-rich region binding(GO:0035925) |
| 0.0 | 0.3 | GO:0015562 | efflux transmembrane transporter activity(GO:0015562) |
| 0.0 | 0.0 | GO:0070506 | high-density lipoprotein particle receptor activity(GO:0070506) |
| 0.0 | 0.2 | GO:0070728 | leucine binding(GO:0070728) |
| 0.0 | 0.2 | GO:0070513 | death domain binding(GO:0070513) |
| 0.0 | 0.2 | GO:0003986 | acetyl-CoA hydrolase activity(GO:0003986) |
| 0.0 | 0.2 | GO:0035614 | snRNA stem-loop binding(GO:0035614) |
| 0.0 | 0.7 | GO:0032813 | tumor necrosis factor receptor superfamily binding(GO:0032813) |
| 0.0 | 0.1 | GO:0004878 | complement component C5a receptor activity(GO:0004878) |
| 0.0 | 0.6 | GO:0019911 | structural constituent of myelin sheath(GO:0019911) |
| 0.0 | 0.2 | GO:0070180 | large ribosomal subunit rRNA binding(GO:0070180) |
| 0.0 | 0.2 | GO:0031697 | beta-1 adrenergic receptor binding(GO:0031697) |
| 0.0 | 0.2 | GO:0016749 | 5-aminolevulinate synthase activity(GO:0003870) N-succinyltransferase activity(GO:0016749) |
| 0.0 | 0.1 | GO:0004060 | arylamine N-acetyltransferase activity(GO:0004060) |
| 0.0 | 1.1 | GO:0000049 | tRNA binding(GO:0000049) |
| 0.0 | 1.3 | GO:0030371 | translation repressor activity(GO:0030371) |
| 0.0 | 0.9 | GO:0030506 | ankyrin binding(GO:0030506) |
| 0.0 | 0.4 | GO:0016015 | morphogen activity(GO:0016015) |
| 0.0 | 0.2 | GO:0004630 | phospholipase D activity(GO:0004630) |
| 0.0 | 0.1 | GO:0019959 | interleukin-8 binding(GO:0019959) |
| 0.0 | 0.8 | GO:0017091 | AU-rich element binding(GO:0017091) |
| 0.0 | 0.9 | GO:0008190 | eukaryotic initiation factor 4E binding(GO:0008190) |
| 0.0 | 0.1 | GO:1990763 | RNA polymerase II transcription coactivator binding(GO:0001225) arrestin family protein binding(GO:1990763) |
| 0.0 | 0.1 | GO:0004307 | ethanolaminephosphotransferase activity(GO:0004307) |
| 0.0 | 0.1 | GO:0019534 | toxin transporter activity(GO:0019534) |
| 0.0 | 0.1 | GO:0008160 | protein tyrosine phosphatase activator activity(GO:0008160) |
| 0.0 | 0.3 | GO:0001025 | RNA polymerase III transcription factor binding(GO:0001025) |
| 0.0 | 0.4 | GO:0046965 | retinoid X receptor binding(GO:0046965) |
| 0.0 | 0.2 | GO:0031403 | lithium ion binding(GO:0031403) |
| 0.0 | 0.2 | GO:0004910 | interleukin-1, Type II, blocking receptor activity(GO:0004910) |
| 0.0 | 0.3 | GO:0043023 | ribosomal large subunit binding(GO:0043023) |
| 0.0 | 0.3 | GO:0015349 | thyroid hormone transmembrane transporter activity(GO:0015349) |
| 0.0 | 0.5 | GO:0045504 | dynein heavy chain binding(GO:0045504) |
| 0.0 | 0.2 | GO:0015199 | amino-acid betaine transmembrane transporter activity(GO:0015199) carnitine transmembrane transporter activity(GO:0015226) |
| 0.0 | 0.1 | GO:0005011 | macrophage colony-stimulating factor receptor activity(GO:0005011) |
| 0.0 | 0.2 | GO:0004167 | dopachrome isomerase activity(GO:0004167) |
| 0.0 | 0.3 | GO:0035251 | UDP-glucosyltransferase activity(GO:0035251) |
| 0.0 | 2.2 | GO:0050840 | extracellular matrix binding(GO:0050840) |
| 0.0 | 0.2 | GO:0008321 | Ral guanyl-nucleotide exchange factor activity(GO:0008321) |
| 0.0 | 0.1 | GO:0033695 | oxidoreductase activity, acting on CH or CH2 groups, quinone or similar compound as acceptor(GO:0033695) caffeine oxidase activity(GO:0034875) |
| 0.0 | 0.7 | GO:0008195 | phosphatidate phosphatase activity(GO:0008195) |
| 0.0 | 0.1 | GO:0004609 | phosphatidylserine decarboxylase activity(GO:0004609) |
| 0.0 | 0.3 | GO:0005328 | neurotransmitter:sodium symporter activity(GO:0005328) |
| 0.0 | 0.7 | GO:0038191 | neuropilin binding(GO:0038191) |
| 0.0 | 0.8 | GO:0050811 | GABA receptor binding(GO:0050811) |
| 0.0 | 0.2 | GO:0050501 | hyaluronan synthase activity(GO:0050501) |
| 0.0 | 0.3 | GO:0070740 | tubulin-glutamic acid ligase activity(GO:0070740) |
| 0.0 | 0.4 | GO:0032050 | clathrin heavy chain binding(GO:0032050) |
| 0.0 | 0.2 | GO:0030292 | protein tyrosine kinase inhibitor activity(GO:0030292) |
| 0.0 | 0.5 | GO:0008301 | DNA binding, bending(GO:0008301) |
| 0.0 | 0.1 | GO:0004415 | hyalurononglucosaminidase activity(GO:0004415) |
| 0.0 | 0.1 | GO:0004925 | prolactin receptor activity(GO:0004925) |
| 0.0 | 0.2 | GO:0099583 | neurotransmitter receptor activity involved in regulation of postsynaptic cytosolic calcium ion concentration(GO:0099583) |
| 0.0 | 0.5 | GO:0005176 | ErbB-2 class receptor binding(GO:0005176) |
| 0.0 | 0.3 | GO:0015101 | organic cation transmembrane transporter activity(GO:0015101) |
| 0.0 | 2.0 | GO:0017112 | Rab guanyl-nucleotide exchange factor activity(GO:0017112) |
| 0.0 | 0.1 | GO:0036033 | mediator complex binding(GO:0036033) |
| 0.0 | 0.4 | GO:1901611 | phosphatidylglycerol binding(GO:1901611) cardiolipin binding(GO:1901612) |
| 0.0 | 0.2 | GO:0035005 | 1-phosphatidylinositol-4-phosphate 3-kinase activity(GO:0035005) |
| 0.0 | 1.1 | GO:0046875 | ephrin receptor binding(GO:0046875) |
| 0.0 | 1.1 | GO:0031624 | ubiquitin conjugating enzyme binding(GO:0031624) |
| 0.0 | 0.7 | GO:0008569 | ATP-dependent microtubule motor activity, minus-end-directed(GO:0008569) |
| 0.0 | 0.5 | GO:0016917 | GABA-A receptor activity(GO:0004890) GABA receptor activity(GO:0016917) |
| 0.0 | 0.1 | GO:0004616 | phosphogluconate dehydrogenase (decarboxylating) activity(GO:0004616) |
| 0.0 | 0.1 | GO:0071207 | histone pre-mRNA stem-loop binding(GO:0071207) |
| 0.0 | 0.2 | GO:0019237 | centromeric DNA binding(GO:0019237) |
| 0.0 | 0.1 | GO:0005462 | UDP-N-acetylglucosamine transmembrane transporter activity(GO:0005462) |
| 0.0 | 0.1 | GO:1990430 | extracellular matrix protein binding(GO:1990430) |
| 0.0 | 1.3 | GO:0008139 | nuclear localization sequence binding(GO:0008139) |
| 0.0 | 0.1 | GO:0008294 | calcium- and calmodulin-responsive adenylate cyclase activity(GO:0008294) |
| 0.0 | 0.1 | GO:0004803 | transposase activity(GO:0004803) |
| 0.0 | 0.1 | GO:0050510 | N-acetylgalactosaminyl-proteoglycan 3-beta-glucuronosyltransferase activity(GO:0050510) |
| 0.0 | 0.6 | GO:0070006 | metalloaminopeptidase activity(GO:0070006) |
| 0.0 | 0.4 | GO:0051393 | alpha-actinin binding(GO:0051393) |
| 0.0 | 0.1 | GO:0061752 | telomeric repeat-containing RNA binding(GO:0061752) |
| 0.0 | 0.8 | GO:0046961 | ATPase activity, coupled to transmembrane movement of ions, rotational mechanism(GO:0044769) proton-transporting ATPase activity, rotational mechanism(GO:0046961) |
| 0.0 | 0.2 | GO:0032190 | acrosin binding(GO:0032190) |
| 0.0 | 0.2 | GO:0004977 | melanocortin receptor activity(GO:0004977) |
| 0.0 | 0.2 | GO:0015307 | drug:proton antiporter activity(GO:0015307) |
| 0.0 | 0.7 | GO:0005487 | nucleocytoplasmic transporter activity(GO:0005487) |
| 0.0 | 0.4 | GO:0008391 | arachidonic acid monooxygenase activity(GO:0008391) arachidonic acid epoxygenase activity(GO:0008392) |
| 0.0 | 0.2 | GO:0008269 | JAK pathway signal transduction adaptor activity(GO:0008269) |
| 0.0 | 0.3 | GO:0008474 | palmitoyl-(protein) hydrolase activity(GO:0008474) palmitoyl hydrolase activity(GO:0098599) |
| 0.0 | 0.1 | GO:0102007 | lactonohydrolase activity(GO:0046573) acyl-L-homoserine-lactone lactonohydrolase activity(GO:0102007) |
| 0.0 | 0.1 | GO:0005436 | sodium:phosphate symporter activity(GO:0005436) |
| 0.0 | 0.2 | GO:0042289 | MHC class II protein binding(GO:0042289) |
| 0.0 | 0.7 | GO:0071889 | 14-3-3 protein binding(GO:0071889) |
| 0.0 | 0.1 | GO:0004341 | gluconolactonase activity(GO:0004341) |
| 0.0 | 0.1 | GO:0070573 | metallodipeptidase activity(GO:0070573) |
| 0.0 | 0.5 | GO:0008510 | sodium:bicarbonate symporter activity(GO:0008510) |
| 0.0 | 0.4 | GO:0043495 | protein anchor(GO:0043495) |
| 0.0 | 0.2 | GO:0010859 | calcium-dependent cysteine-type endopeptidase inhibitor activity(GO:0010859) |
| 0.0 | 0.3 | GO:0008429 | phosphatidylethanolamine binding(GO:0008429) |
| 0.0 | 0.1 | GO:0046848 | hydroxyapatite binding(GO:0046848) |
| 0.0 | 0.5 | GO:0001222 | transcription corepressor binding(GO:0001222) |
| 0.0 | 0.1 | GO:0016724 | ferroxidase activity(GO:0004322) oxidoreductase activity, oxidizing metal ions, oxygen as acceptor(GO:0016724) |
| 0.0 | 0.1 | GO:0050220 | prostaglandin-E synthase activity(GO:0050220) |
| 0.0 | 0.4 | GO:0048018 | receptor agonist activity(GO:0048018) |
| 0.0 | 0.3 | GO:0016861 | intramolecular oxidoreductase activity, interconverting aldoses and ketoses(GO:0016861) |
| 0.0 | 0.1 | GO:0032296 | ribonuclease III activity(GO:0004525) double-stranded RNA-specific ribonuclease activity(GO:0032296) |
| 0.0 | 0.4 | GO:0005225 | volume-sensitive anion channel activity(GO:0005225) |
| 0.0 | 1.0 | GO:0005080 | protein kinase C binding(GO:0005080) |
| 0.0 | 0.1 | GO:0043398 | HLH domain binding(GO:0043398) |
| 0.0 | 0.3 | GO:0070492 | oligosaccharide binding(GO:0070492) |
| 0.0 | 0.1 | GO:0004800 | thyroxine 5'-deiodinase activity(GO:0004800) |
| 0.0 | 0.1 | GO:0042284 | sphingolipid delta-4 desaturase activity(GO:0042284) |
| 0.0 | 0.0 | GO:0061628 | H3K27me3 modified histone binding(GO:0061628) |
| 0.0 | 0.2 | GO:0050786 | RAGE receptor binding(GO:0050786) |
| 0.0 | 0.3 | GO:0034185 | apolipoprotein binding(GO:0034185) |
| 0.0 | 0.8 | GO:0044183 | protein binding involved in protein folding(GO:0044183) |
| 0.0 | 0.1 | GO:1990239 | steroid hormone binding(GO:1990239) |
| 0.0 | 0.1 | GO:0004629 | phospholipase C activity(GO:0004629) |
| 0.0 | 0.1 | GO:0004597 | peptide-aspartate beta-dioxygenase activity(GO:0004597) |
| 0.0 | 0.1 | GO:0070735 | protein-glycine ligase activity(GO:0070735) |
| 0.0 | 0.4 | GO:0001055 | RNA polymerase II activity(GO:0001055) |
| 0.0 | 0.7 | GO:0047555 | 3',5'-cyclic-GMP phosphodiesterase activity(GO:0047555) |
| 0.0 | 0.1 | GO:0004305 | ethanolamine kinase activity(GO:0004305) |
| 0.0 | 0.1 | GO:0033857 | diphosphoinositol-pentakisphosphate kinase activity(GO:0033857) |
| 0.0 | 0.2 | GO:0044548 | S100 protein binding(GO:0044548) |
| 0.0 | 0.3 | GO:0047429 | nucleoside-triphosphate diphosphatase activity(GO:0047429) |
| 0.0 | 1.8 | GO:0001618 | virus receptor activity(GO:0001618) |
| 0.0 | 0.1 | GO:0015272 | ATP-activated inward rectifier potassium channel activity(GO:0015272) |
| 0.0 | 0.1 | GO:0030619 | U1 snRNA binding(GO:0030619) |
| 0.0 | 3.9 | GO:0005125 | cytokine activity(GO:0005125) |
| 0.0 | 0.4 | GO:0008353 | RNA polymerase II carboxy-terminal domain kinase activity(GO:0008353) |
| 0.0 | 0.2 | GO:0016500 | protein-hormone receptor activity(GO:0016500) |
| 0.0 | 0.1 | GO:0004886 | 9-cis retinoic acid receptor activity(GO:0004886) |
| 0.0 | 0.3 | GO:0017017 | MAP kinase tyrosine/serine/threonine phosphatase activity(GO:0017017) |
| 0.0 | 0.6 | GO:0071855 | neuropeptide receptor binding(GO:0071855) |
| 0.0 | 0.5 | GO:0102391 | decanoate--CoA ligase activity(GO:0102391) |
| 0.0 | 0.1 | GO:0071558 | histone demethylase activity (H3-K27 specific)(GO:0071558) |
| 0.0 | 1.8 | GO:0043021 | ribonucleoprotein complex binding(GO:0043021) |
| 0.0 | 0.1 | GO:0004090 | carbonyl reductase (NADPH) activity(GO:0004090) |
| 0.0 | 0.3 | GO:0030247 | pattern binding(GO:0001871) polysaccharide binding(GO:0030247) |
| 0.0 | 0.7 | GO:0070412 | R-SMAD binding(GO:0070412) |
| 0.0 | 0.2 | GO:0015125 | bile acid transmembrane transporter activity(GO:0015125) |
| 0.0 | 0.2 | GO:0004726 | non-membrane spanning protein tyrosine phosphatase activity(GO:0004726) |
| 0.0 | 0.9 | GO:0061650 | ubiquitin-like protein conjugating enzyme activity(GO:0061650) |
| 0.0 | 0.2 | GO:0017056 | structural constituent of nuclear pore(GO:0017056) |
| 0.0 | 0.3 | GO:0017160 | Ral GTPase binding(GO:0017160) |
| 0.0 | 8.7 | GO:0030695 | GTPase regulator activity(GO:0030695) |
| 0.0 | 0.1 | GO:0001515 | opioid peptide activity(GO:0001515) |
| 0.0 | 0.4 | GO:0019789 | SUMO transferase activity(GO:0019789) |
| 0.0 | 0.2 | GO:0051880 | G-quadruplex DNA binding(GO:0051880) |
| 0.0 | 0.1 | GO:0050733 | RS domain binding(GO:0050733) |
| 0.0 | 0.1 | GO:0004418 | hydroxymethylbilane synthase activity(GO:0004418) |
| 0.0 | 0.4 | GO:0016881 | acid-amino acid ligase activity(GO:0016881) |
| 0.0 | 0.1 | GO:0004591 | oxoglutarate dehydrogenase (succinyl-transferring) activity(GO:0004591) |
| 0.0 | 4.5 | GO:0004252 | serine-type endopeptidase activity(GO:0004252) |
| 0.0 | 0.2 | GO:0016868 | intramolecular transferase activity, phosphotransferases(GO:0016868) |
| 0.0 | 0.0 | GO:0030550 | acetylcholine receptor inhibitor activity(GO:0030550) |
| 0.0 | 0.0 | GO:0043560 | insulin receptor substrate binding(GO:0043560) |
| 0.0 | 1.5 | GO:0000979 | RNA polymerase II core promoter sequence-specific DNA binding(GO:0000979) |
| 0.0 | 0.7 | GO:0005253 | anion channel activity(GO:0005253) |
| 0.0 | 0.3 | GO:0004535 | poly(A)-specific ribonuclease activity(GO:0004535) |
| 0.0 | 0.2 | GO:0030274 | LIM domain binding(GO:0030274) |
| 0.0 | 0.8 | GO:0050699 | WW domain binding(GO:0050699) |
| 0.0 | 0.1 | GO:0052796 | exo-alpha-(2->3)-sialidase activity(GO:0052794) exo-alpha-(2->6)-sialidase activity(GO:0052795) exo-alpha-(2->8)-sialidase activity(GO:0052796) |
| 0.0 | 0.1 | GO:0000064 | L-ornithine transmembrane transporter activity(GO:0000064) |
| 0.0 | 0.2 | GO:0015279 | store-operated calcium channel activity(GO:0015279) |
| 0.0 | 0.3 | GO:0003906 | DNA-(apurinic or apyrimidinic site) lyase activity(GO:0003906) |
| 0.0 | 1.5 | GO:0005267 | potassium channel activity(GO:0005267) |
| 0.0 | 0.6 | GO:0032266 | phosphatidylinositol-3-phosphate binding(GO:0032266) |
| 0.0 | 1.3 | GO:0004722 | protein serine/threonine phosphatase activity(GO:0004722) |
| 0.0 | 0.2 | GO:0008271 | secondary active sulfate transmembrane transporter activity(GO:0008271) |
| 0.0 | 0.3 | GO:0030676 | Rac guanyl-nucleotide exchange factor activity(GO:0030676) |
| 0.0 | 0.0 | GO:0004939 | beta-adrenergic receptor activity(GO:0004939) norepinephrine binding(GO:0051380) |
| 0.0 | 0.0 | GO:0019862 | IgA binding(GO:0019862) |
| 0.0 | 0.1 | GO:0005412 | glucose:sodium symporter activity(GO:0005412) |
| 0.0 | 0.0 | GO:0019834 | phospholipase A2 inhibitor activity(GO:0019834) |
| 0.0 | 0.1 | GO:0030628 | pre-mRNA 3'-splice site binding(GO:0030628) |
| 0.0 | 0.1 | GO:0015187 | glycine transmembrane transporter activity(GO:0015187) |
| 0.0 | 0.1 | GO:0001665 | alpha-N-acetylgalactosaminide alpha-2,6-sialyltransferase activity(GO:0001665) |
| 0.0 | 1.8 | GO:0004867 | serine-type endopeptidase inhibitor activity(GO:0004867) |
| 0.0 | 0.2 | GO:0009931 | calcium-dependent protein serine/threonine kinase activity(GO:0009931) |
| 0.0 | 0.1 | GO:0033765 | 3-oxo-5-alpha-steroid 4-dehydrogenase activity(GO:0003865) steroid dehydrogenase activity, acting on the CH-CH group of donors(GO:0033765) cholestenone 5-alpha-reductase activity(GO:0047751) |
| 0.0 | 0.0 | GO:0008480 | sarcosine dehydrogenase activity(GO:0008480) |
| 0.0 | 0.0 | GO:0051731 | polynucleotide 5'-hydroxyl-kinase activity(GO:0051731) |
| 0.0 | 0.2 | GO:0070273 | phosphatidylinositol-4-phosphate binding(GO:0070273) |
| 0.0 | 0.1 | GO:0031531 | thyrotropin-releasing hormone receptor binding(GO:0031531) |
| 0.0 | 0.2 | GO:0030159 | receptor signaling complex scaffold activity(GO:0030159) |
| 0.0 | 0.2 | GO:0015095 | magnesium ion transmembrane transporter activity(GO:0015095) |
| 0.0 | 0.1 | GO:0008453 | alanine-glyoxylate transaminase activity(GO:0008453) |
| 0.0 | 0.2 | GO:0005109 | frizzled binding(GO:0005109) |
| 0.0 | 0.0 | GO:0047223 | beta-1,3-galactosyl-O-glycosyl-glycoprotein beta-1,3-N-acetylglucosaminyltransferase activity(GO:0047223) |
| 0.0 | 0.1 | GO:0005343 | organic acid:sodium symporter activity(GO:0005343) |
| 0.0 | 3.9 | GO:0003924 | GTPase activity(GO:0003924) |
| 0.0 | 0.2 | GO:0098641 | cadherin binding involved in cell-cell adhesion(GO:0098641) |
| 0.0 | 0.0 | GO:0004958 | prostaglandin F receptor activity(GO:0004958) |
| 0.0 | 0.4 | GO:0008188 | neuropeptide receptor activity(GO:0008188) |
| 0.0 | 0.1 | GO:0033743 | peptide-methionine (R)-S-oxide reductase activity(GO:0033743) |
| 0.0 | 0.1 | GO:0016884 | carbon-nitrogen ligase activity, with glutamine as amido-N-donor(GO:0016884) |
| 0.0 | 0.1 | GO:0008889 | glycerophosphodiester phosphodiesterase activity(GO:0008889) |
| 0.0 | 0.0 | GO:0080023 | 3R-hydroxyacyl-CoA dehydratase activity(GO:0080023) |
| 0.0 | 0.1 | GO:0001851 | complement component C3b binding(GO:0001851) |
| 0.0 | 0.7 | GO:0003707 | steroid hormone receptor activity(GO:0003707) |
Gene overrepresentation in curated gene sets: canonical pathways category:
| Log-likelihood per target | Total log-likelihood | Term | Description |
|---|---|---|---|
| 0.3 | 0.6 | PID S1P S1P3 PATHWAY | S1P3 pathway |
| 0.3 | 19.1 | PID HIV NEF PATHWAY | HIV-1 Nef: Negative effector of Fas and TNF-alpha |
| 0.3 | 0.8 | ST PAC1 RECEPTOR PATHWAY | PAC1 Receptor Pathway |
| 0.2 | 4.7 | PID IL5 PATHWAY | IL5-mediated signaling events |
| 0.2 | 7.3 | PID IL1 PATHWAY | IL1-mediated signaling events |
| 0.2 | 17.9 | PID TGFBR PATHWAY | TGF-beta receptor signaling |
| 0.2 | 4.8 | SA MMP CYTOKINE CONNECTION | Cytokines can induce activation of matrix metalloproteinases, which degrade extracellular matrix. |
| 0.2 | 3.6 | ST TUMOR NECROSIS FACTOR PATHWAY | Tumor Necrosis Factor Pathway. |
| 0.1 | 4.6 | SIG IL4RECEPTOR IN B LYPHOCYTES | Genes related to IL4 rceptor signaling in B lymphocytes |
| 0.1 | 3.8 | SA G1 AND S PHASES | Cdk2, 4, and 6 bind cyclin D in G1, while cdk2/cyclin E promotes the G1/S transition. |
| 0.1 | 1.7 | PID PDGFRA PATHWAY | PDGFR-alpha signaling pathway |
| 0.1 | 0.7 | SIG BCR SIGNALING PATHWAY | Members of the BCR signaling pathway |
| 0.1 | 4.8 | PID IL8 CXCR2 PATHWAY | IL8- and CXCR2-mediated signaling events |
| 0.1 | 0.2 | PID IFNG PATHWAY | IFN-gamma pathway |
| 0.1 | 0.7 | PID S1P META PATHWAY | Sphingosine 1-phosphate (S1P) pathway |
| 0.1 | 2.2 | PID NFKAPPAB ATYPICAL PATHWAY | Atypical NF-kappaB pathway |
| 0.1 | 0.2 | PID ALK2 PATHWAY | ALK2 signaling events |
| 0.1 | 1.1 | PID HIF1A PATHWAY | Hypoxic and oxygen homeostasis regulation of HIF-1-alpha |
| 0.1 | 2.2 | PID ARF 3PATHWAY | Arf1 pathway |
| 0.1 | 9.5 | PID AP1 PATHWAY | AP-1 transcription factor network |
| 0.1 | 3.3 | PID IL12 STAT4 PATHWAY | IL12 signaling mediated by STAT4 |
| 0.1 | 0.7 | SIG PIP3 SIGNALING IN B LYMPHOCYTES | Genes related to PIP3 signaling in B lymphocytes |
| 0.1 | 0.8 | PID TCR RAS PATHWAY | Ras signaling in the CD4+ TCR pathway |
| 0.1 | 0.3 | PID AR NONGENOMIC PATHWAY | Nongenotropic Androgen signaling |
| 0.1 | 1.3 | PID P38 ALPHA BETA PATHWAY | Regulation of p38-alpha and p38-beta |
| 0.1 | 3.5 | PID DELTA NP63 PATHWAY | Validated transcriptional targets of deltaNp63 isoforms |
| 0.1 | 0.2 | ST MYOCYTE AD PATHWAY | Myocyte Adrenergic Pathway is a specific case of the generalized Adrenergic Pathway. |
| 0.1 | 2.7 | PID AMB2 NEUTROPHILS PATHWAY | amb2 Integrin signaling |
| 0.1 | 0.3 | PID AVB3 INTEGRIN PATHWAY | Integrins in angiogenesis |
| 0.1 | 2.9 | PID RHOA PATHWAY | RhoA signaling pathway |
| 0.1 | 2.3 | PID TXA2PATHWAY | Thromboxane A2 receptor signaling |
| 0.1 | 24.6 | NABA SECRETED FACTORS | Genes encoding secreted soluble factors |
| 0.1 | 1.3 | ST GAQ PATHWAY | G alpha q Pathway |
| 0.1 | 4.7 | PID TELOMERASE PATHWAY | Regulation of Telomerase |
| 0.1 | 0.6 | PID AVB3 OPN PATHWAY | Osteopontin-mediated events |
| 0.1 | 1.5 | PID NFKAPPAB CANONICAL PATHWAY | Canonical NF-kappaB pathway |
| 0.1 | 2.7 | PID AJDISS 2PATHWAY | Posttranslational regulation of adherens junction stability and dissassembly |
| 0.0 | 1.3 | ST WNT CA2 CYCLIC GMP PATHWAY | Wnt/Ca2+/cyclic GMP signaling. |
| 0.0 | 1.0 | PID PI3KCI PATHWAY | Class I PI3K signaling events |
| 0.0 | 0.4 | ST JAK STAT PATHWAY | Jak-STAT Pathway |
| 0.0 | 1.0 | PID CIRCADIAN PATHWAY | Circadian rhythm pathway |
| 0.0 | 13.7 | NABA ECM REGULATORS | Genes encoding enzymes and their regulators involved in the remodeling of the extracellular matrix |
| 0.0 | 1.9 | NABA PROTEOGLYCANS | Genes encoding proteoglycans |
| 0.0 | 0.8 | PID EPHRINB REV PATHWAY | Ephrin B reverse signaling |
| 0.0 | 0.5 | PID MET PATHWAY | Signaling events mediated by Hepatocyte Growth Factor Receptor (c-Met) |
| 0.0 | 1.1 | PID NFAT 3PATHWAY | Role of Calcineurin-dependent NFAT signaling in lymphocytes |
| 0.0 | 0.6 | PID ERBB1 DOWNSTREAM PATHWAY | ErbB1 downstream signaling |
| 0.0 | 0.4 | PID UPA UPAR PATHWAY | Urokinase-type plasminogen activator (uPA) and uPAR-mediated signaling |
| 0.0 | 1.0 | PID FRA PATHWAY | Validated transcriptional targets of AP1 family members Fra1 and Fra2 |
| 0.0 | 2.1 | PID AURORA B PATHWAY | Aurora B signaling |
| 0.0 | 0.6 | PID P38 MK2 PATHWAY | p38 signaling mediated by MAPKAP kinases |
| 0.0 | 0.9 | PID INSULIN GLUCOSE PATHWAY | Insulin-mediated glucose transport |
| 0.0 | 0.1 | PID TCPTP PATHWAY | Signaling events mediated by TCPTP |
| 0.0 | 0.3 | SA PROGRAMMED CELL DEATH | Programmed cell death, or apoptosis, eliminates damaged or unneeded cells. |
| 0.0 | 0.2 | PID SYNDECAN 1 PATHWAY | Syndecan-1-mediated signaling events |
| 0.0 | 0.1 | PID ERB GENOMIC PATHWAY | Validated nuclear estrogen receptor beta network |
| 0.0 | 1.8 | PID INTEGRIN3 PATHWAY | Beta3 integrin cell surface interactions |
| 0.0 | 1.1 | PID RAS PATHWAY | Regulation of Ras family activation |
| 0.0 | 0.3 | PID ATM PATHWAY | ATM pathway |
| 0.0 | 0.3 | SIG PIP3 SIGNALING IN CARDIAC MYOCTES | Genes related to PIP3 signaling in cardiac myocytes |
| 0.0 | 0.5 | ST JNK MAPK PATHWAY | JNK MAPK Pathway |
| 0.0 | 0.2 | PID SYNDECAN 4 PATHWAY | Syndecan-4-mediated signaling events |
| 0.0 | 0.4 | ST DIFFERENTIATION PATHWAY IN PC12 CELLS | Differentiation Pathway in PC12 Cells; this is a specific case of PAC1 Receptor Pathway. |
| 0.0 | 1.1 | PID ATR PATHWAY | ATR signaling pathway |
| 0.0 | 0.4 | PID VEGFR1 2 PATHWAY | Signaling events mediated by VEGFR1 and VEGFR2 |
| 0.0 | 2.2 | PID CDC42 PATHWAY | CDC42 signaling events |
| 0.0 | 0.1 | PID EPHA2 FWD PATHWAY | EPHA2 forward signaling |
| 0.0 | 0.1 | PID CXCR4 PATHWAY | CXCR4-mediated signaling events |
| 0.0 | 0.9 | PID RAC1 REG PATHWAY | Regulation of RAC1 activity |
| 0.0 | 0.9 | PID FOXO PATHWAY | FoxO family signaling |
| 0.0 | 0.3 | PID SYNDECAN 3 PATHWAY | Syndecan-3-mediated signaling events |
| 0.0 | 0.1 | PID WNT CANONICAL PATHWAY | Canonical Wnt signaling pathway |
| 0.0 | 0.3 | SIG CHEMOTAXIS | Genes related to chemotaxis |
| 0.0 | 0.3 | PID ATF2 PATHWAY | ATF-2 transcription factor network |
| 0.0 | 1.6 | PID NOTCH PATHWAY | Notch signaling pathway |
| 0.0 | 0.2 | ST INTEGRIN SIGNALING PATHWAY | Integrin Signaling Pathway |
| 0.0 | 0.5 | SIG INSULIN RECEPTOR PATHWAY IN CARDIAC MYOCYTES | Genes related to the insulin receptor pathway |
| 0.0 | 0.2 | PID ENDOTHELIN PATHWAY | Endothelins |
| 0.0 | 0.4 | PID MYC PATHWAY | C-MYC pathway |
| 0.0 | 0.1 | ST PHOSPHOINOSITIDE 3 KINASE PATHWAY | PI3K Pathway |
| 0.0 | 0.1 | PID TRAIL PATHWAY | TRAIL signaling pathway |
| 0.0 | 0.5 | PID WNT NONCANONICAL PATHWAY | Noncanonical Wnt signaling pathway |
| 0.0 | 0.1 | PID PI3KCI AKT PATHWAY | Class I PI3K signaling events mediated by Akt |
| 0.0 | 0.9 | ST FAS SIGNALING PATHWAY | Fas Signaling Pathway |
| 0.0 | 0.6 | PID HIF1 TFPATHWAY | HIF-1-alpha transcription factor network |
| 0.0 | 0.4 | PID CONE PATHWAY | Visual signal transduction: Cones |
| 0.0 | 0.2 | ST T CELL SIGNAL TRANSDUCTION | T Cell Signal Transduction |
| 0.0 | 0.3 | PID A6B1 A6B4 INTEGRIN PATHWAY | a6b1 and a6b4 Integrin signaling |
| 0.0 | 0.2 | PID ECADHERIN NASCENT AJ PATHWAY | E-cadherin signaling in the nascent adherens junction |
| 0.0 | 0.4 | PID LIS1 PATHWAY | Lissencephaly gene (LIS1) in neuronal migration and development |
| 0.0 | 0.2 | PID NCADHERIN PATHWAY | N-cadherin signaling events |
| 0.0 | 0.3 | PID PRL SIGNALING EVENTS PATHWAY | Signaling events mediated by PRL |
| 0.0 | 0.5 | PID LKB1 PATHWAY | LKB1 signaling events |
Gene overrepresentation in curated gene sets: REACTOME pathways category:
| Log-likelihood per target | Total log-likelihood | Term | Description |
|---|---|---|---|
| 0.4 | 4.9 | REACTOME ENDOSOMAL VACUOLAR PATHWAY | Genes involved in Endosomal/Vacuolar pathway |
| 0.3 | 7.0 | REACTOME HYALURONAN UPTAKE AND DEGRADATION | Genes involved in Hyaluronan uptake and degradation |
| 0.3 | 1.3 | REACTOME SEMA3A PLEXIN REPULSION SIGNALING BY INHIBITING INTEGRIN ADHESION | Genes involved in SEMA3A-Plexin repulsion signaling by inhibiting Integrin adhesion |
| 0.2 | 8.6 | REACTOME SIGNALING BY NODAL | Genes involved in Signaling by NODAL |
| 0.2 | 7.3 | REACTOME EXTRINSIC PATHWAY FOR APOPTOSIS | Genes involved in Extrinsic Pathway for Apoptosis |
| 0.2 | 5.4 | REACTOME HDL MEDIATED LIPID TRANSPORT | Genes involved in HDL-mediated lipid transport |
| 0.2 | 0.6 | REACTOME ELEVATION OF CYTOSOLIC CA2 LEVELS | Genes involved in Elevation of cytosolic Ca2+ levels |
| 0.2 | 8.5 | REACTOME EFFECTS OF PIP2 HYDROLYSIS | Genes involved in Effects of PIP2 hydrolysis |
| 0.2 | 5.8 | REACTOME IL RECEPTOR SHC SIGNALING | Genes involved in Interleukin receptor SHC signaling |
| 0.2 | 3.0 | REACTOME IL 7 SIGNALING | Genes involved in Interleukin-7 signaling |
| 0.2 | 4.3 | REACTOME CYTOSOLIC SULFONATION OF SMALL MOLECULES | Genes involved in Cytosolic sulfonation of small molecules |
| 0.2 | 17.6 | REACTOME INTERFERON ALPHA BETA SIGNALING | Genes involved in Interferon alpha/beta signaling |
| 0.2 | 0.6 | REACTOME LATENT INFECTION OF HOMO SAPIENS WITH MYCOBACTERIUM TUBERCULOSIS | Genes involved in Latent infection of Homo sapiens with Mycobacterium tuberculosis |
| 0.2 | 3.5 | REACTOME ACTIVATION OF RAC | Genes involved in Activation of Rac |
| 0.2 | 2.1 | REACTOME P75NTR RECRUITS SIGNALLING COMPLEXES | Genes involved in p75NTR recruits signalling complexes |
| 0.2 | 3.2 | REACTOME NOD1 2 SIGNALING PATHWAY | Genes involved in NOD1/2 Signaling Pathway |
| 0.2 | 0.5 | REACTOME SIGNALING BY FGFR3 MUTANTS | Genes involved in Signaling by FGFR3 mutants |
| 0.2 | 2.6 | REACTOME REVERSIBLE HYDRATION OF CARBON DIOXIDE | Genes involved in Reversible Hydration of Carbon Dioxide |
| 0.2 | 0.6 | REACTOME DOWNSTREAM TCR SIGNALING | Genes involved in Downstream TCR signaling |
| 0.1 | 1.8 | REACTOME RECEPTOR LIGAND BINDING INITIATES THE SECOND PROTEOLYTIC CLEAVAGE OF NOTCH RECEPTOR | Genes involved in Receptor-ligand binding initiates the second proteolytic cleavage of Notch receptor |
| 0.1 | 2.4 | REACTOME DOWNSTREAM SIGNAL TRANSDUCTION | Genes involved in Downstream signal transduction |
| 0.1 | 9.5 | REACTOME CHEMOKINE RECEPTORS BIND CHEMOKINES | Genes involved in Chemokine receptors bind chemokines |
| 0.1 | 4.0 | REACTOME CRMPS IN SEMA3A SIGNALING | Genes involved in CRMPs in Sema3A signaling |
| 0.1 | 2.9 | REACTOME DARPP 32 EVENTS | Genes involved in DARPP-32 events |
| 0.1 | 2.8 | REACTOME SYNTHESIS SECRETION AND DEACYLATION OF GHRELIN | Genes involved in Synthesis, Secretion, and Deacylation of Ghrelin |
| 0.1 | 1.3 | REACTOME ACTIVATED TAK1 MEDIATES P38 MAPK ACTIVATION | Genes involved in activated TAK1 mediates p38 MAPK activation |
| 0.1 | 0.4 | REACTOME THROMBIN SIGNALLING THROUGH PROTEINASE ACTIVATED RECEPTORS PARS | Genes involved in Thrombin signalling through proteinase activated receptors (PARs) |
| 0.1 | 18.2 | REACTOME OLFACTORY SIGNALING PATHWAY | Genes involved in Olfactory Signaling Pathway |
| 0.1 | 6.1 | REACTOME IL1 SIGNALING | Genes involved in Interleukin-1 signaling |
| 0.1 | 1.8 | REACTOME TRAF3 DEPENDENT IRF ACTIVATION PATHWAY | Genes involved in TRAF3-dependent IRF activation pathway |
| 0.1 | 4.9 | REACTOME ADHERENS JUNCTIONS INTERACTIONS | Genes involved in Adherens junctions interactions |
| 0.1 | 2.4 | REACTOME CLASS C 3 METABOTROPIC GLUTAMATE PHEROMONE RECEPTORS | Genes involved in Class C/3 (Metabotropic glutamate/pheromone receptors) |
| 0.1 | 1.2 | REACTOME COPI MEDIATED TRANSPORT | Genes involved in COPI Mediated Transport |
| 0.1 | 6.0 | REACTOME ION TRANSPORT BY P TYPE ATPASES | Genes involved in Ion transport by P-type ATPases |
| 0.1 | 2.9 | REACTOME INSULIN SYNTHESIS AND PROCESSING | Genes involved in Insulin Synthesis and Processing |
| 0.1 | 1.5 | REACTOME SYNTHESIS OF SUBSTRATES IN N GLYCAN BIOSYTHESIS | Genes involved in Synthesis of substrates in N-glycan biosythesis |
| 0.1 | 0.9 | REACTOME ER PHAGOSOME PATHWAY | Genes involved in ER-Phagosome pathway |
| 0.1 | 0.4 | REACTOME HYALURONAN METABOLISM | Genes involved in Hyaluronan metabolism |
| 0.1 | 2.3 | REACTOME REGULATION OF INSULIN LIKE GROWTH FACTOR IGF ACTIVITY BY INSULIN LIKE GROWTH FACTOR BINDING PROTEINS IGFBPS | Genes involved in Regulation of Insulin-like Growth Factor (IGF) Activity by Insulin-like Growth Factor Binding Proteins (IGFBPs) |
| 0.1 | 7.1 | REACTOME ACTIVATION OF NF KAPPAB IN B CELLS | Genes involved in Activation of NF-kappaB in B Cells |
| 0.1 | 1.3 | REACTOME HORMONE LIGAND BINDING RECEPTORS | Genes involved in Hormone ligand-binding receptors |
| 0.1 | 0.9 | REACTOME MEMBRANE BINDING AND TARGETTING OF GAG PROTEINS | Genes involved in Membrane binding and targetting of GAG proteins |
| 0.1 | 1.3 | REACTOME EGFR DOWNREGULATION | Genes involved in EGFR downregulation |
| 0.1 | 0.3 | REACTOME SHC1 EVENTS IN EGFR SIGNALING | Genes involved in SHC1 events in EGFR signaling |
| 0.1 | 2.8 | REACTOME NA CL DEPENDENT NEUROTRANSMITTER TRANSPORTERS | Genes involved in Na+/Cl- dependent neurotransmitter transporters |
| 0.1 | 1.4 | REACTOME TRANSPORT OF ORGANIC ANIONS | Genes involved in Transport of organic anions |
| 0.1 | 1.8 | REACTOME ARMS MEDIATED ACTIVATION | Genes involved in ARMS-mediated activation |
| 0.1 | 3.6 | REACTOME AMINE LIGAND BINDING RECEPTORS | Genes involved in Amine ligand-binding receptors |
| 0.1 | 0.7 | REACTOME HORMONE SENSITIVE LIPASE HSL MEDIATED TRIACYLGLYCEROL HYDROLYSIS | Genes involved in Hormone-sensitive lipase (HSL)-mediated triacylglycerol hydrolysis |
| 0.1 | 0.4 | REACTOME RECYCLING PATHWAY OF L1 | Genes involved in Recycling pathway of L1 |
| 0.1 | 4.1 | REACTOME SMOOTH MUSCLE CONTRACTION | Genes involved in Smooth Muscle Contraction |
| 0.1 | 1.0 | REACTOME SPRY REGULATION OF FGF SIGNALING | Genes involved in Spry regulation of FGF signaling |
| 0.1 | 0.7 | REACTOME PLATELET CALCIUM HOMEOSTASIS | Genes involved in Platelet calcium homeostasis |
| 0.1 | 2.8 | REACTOME ASSOCIATION OF TRIC CCT WITH TARGET PROTEINS DURING BIOSYNTHESIS | Genes involved in Association of TriC/CCT with target proteins during biosynthesis |
| 0.1 | 0.4 | REACTOME IL 2 SIGNALING | Genes involved in Interleukin-2 signaling |
| 0.1 | 2.8 | REACTOME CGMP EFFECTS | Genes involved in cGMP effects |
| 0.1 | 1.3 | REACTOME SYNTHESIS OF PE | Genes involved in Synthesis of PE |
| 0.1 | 1.1 | REACTOME TGF BETA RECEPTOR SIGNALING IN EMT EPITHELIAL TO MESENCHYMAL TRANSITION | Genes involved in TGF-beta receptor signaling in EMT (epithelial to mesenchymal transition) |
| 0.1 | 0.6 | REACTOME PACKAGING OF TELOMERE ENDS | Genes involved in Packaging Of Telomere Ends |
| 0.1 | 0.6 | REACTOME SIGNALING BY PDGF | Genes involved in Signaling by PDGF |
| 0.1 | 0.6 | REACTOME SEMA3A PAK DEPENDENT AXON REPULSION | Genes involved in Sema3A PAK dependent Axon repulsion |
| 0.1 | 0.9 | REACTOME YAP1 AND WWTR1 TAZ STIMULATED GENE EXPRESSION | Genes involved in YAP1- and WWTR1 (TAZ)-stimulated gene expression |
| 0.1 | 2.8 | REACTOME GLYCOLYSIS | Genes involved in Glycolysis |
| 0.1 | 1.9 | REACTOME ACTIVATION OF GENES BY ATF4 | Genes involved in Activation of Genes by ATF4 |
| 0.1 | 1.2 | REACTOME RETROGRADE NEUROTROPHIN SIGNALLING | Genes involved in Retrograde neurotrophin signalling |
| 0.1 | 1.2 | REACTOME NEPHRIN INTERACTIONS | Genes involved in Nephrin interactions |
| 0.1 | 0.3 | REACTOME RAP1 SIGNALLING | Genes involved in Rap1 signalling |
| 0.1 | 0.6 | REACTOME REGULATION OF INSULIN SECRETION BY ACETYLCHOLINE | Genes involved in Regulation of Insulin Secretion by Acetylcholine |
| 0.1 | 1.2 | REACTOME MRNA DECAY BY 5 TO 3 EXORIBONUCLEASE | Genes involved in mRNA Decay by 5' to 3' Exoribonuclease |
| 0.1 | 1.3 | REACTOME N GLYCAN ANTENNAE ELONGATION | Genes involved in N-Glycan antennae elongation |
| 0.1 | 0.5 | REACTOME PREFOLDIN MEDIATED TRANSFER OF SUBSTRATE TO CCT TRIC | Genes involved in Prefoldin mediated transfer of substrate to CCT/TriC |
| 0.1 | 0.9 | REACTOME FORMATION OF TUBULIN FOLDING INTERMEDIATES BY CCT TRIC | Genes involved in Formation of tubulin folding intermediates by CCT/TriC |
| 0.1 | 2.4 | REACTOME INTRINSIC PATHWAY FOR APOPTOSIS | Genes involved in Intrinsic Pathway for Apoptosis |
| 0.1 | 0.2 | REACTOME DESTABILIZATION OF MRNA BY TRISTETRAPROLIN TTP | Genes involved in Destabilization of mRNA by Tristetraprolin (TTP) |
| 0.0 | 1.1 | REACTOME GLUCURONIDATION | Genes involved in Glucuronidation |
| 0.0 | 1.6 | REACTOME METAL ION SLC TRANSPORTERS | Genes involved in Metal ion SLC transporters |
| 0.0 | 3.6 | REACTOME VOLTAGE GATED POTASSIUM CHANNELS | Genes involved in Voltage gated Potassium channels |
| 0.0 | 4.0 | REACTOME POTASSIUM CHANNELS | Genes involved in Potassium Channels |
| 0.0 | 0.2 | REACTOME APC C CDH1 MEDIATED DEGRADATION OF CDC20 AND OTHER APC C CDH1 TARGETED PROTEINS IN LATE MITOSIS EARLY G1 | Genes involved in APC/C:Cdh1 mediated degradation of Cdc20 and other APC/C:Cdh1 targeted proteins in late mitosis/early G1 |
| 0.0 | 0.8 | REACTOME THE NLRP3 INFLAMMASOME | Genes involved in The NLRP3 inflammasome |
| 0.0 | 1.2 | REACTOME HS GAG DEGRADATION | Genes involved in HS-GAG degradation |
| 0.0 | 1.8 | REACTOME INTERACTION BETWEEN L1 AND ANKYRINS | Genes involved in Interaction between L1 and Ankyrins |
| 0.0 | 0.6 | REACTOME NEF MEDIATED DOWNREGULATION OF MHC CLASS I COMPLEX CELL SURFACE EXPRESSION | Genes involved in Nef mediated downregulation of MHC class I complex cell surface expression |
| 0.0 | 1.6 | REACTOME OXYGEN DEPENDENT PROLINE HYDROXYLATION OF HYPOXIA INDUCIBLE FACTOR ALPHA | Genes involved in Oxygen-dependent Proline Hydroxylation of Hypoxia-inducible Factor Alpha |
| 0.0 | 0.5 | REACTOME TRYPTOPHAN CATABOLISM | Genes involved in Tryptophan catabolism |
| 0.0 | 3.6 | REACTOME AMINO ACID AND OLIGOPEPTIDE SLC TRANSPORTERS | Genes involved in Amino acid and oligopeptide SLC transporters |
| 0.0 | 2.2 | REACTOME ION CHANNEL TRANSPORT | Genes involved in Ion channel transport |
| 0.0 | 0.9 | REACTOME FGFR4 LIGAND BINDING AND ACTIVATION | Genes involved in FGFR4 ligand binding and activation |
| 0.0 | 0.9 | REACTOME INTRINSIC PATHWAY | Genes involved in Intrinsic Pathway |
| 0.0 | 1.2 | REACTOME DOWNREGULATION OF TGF BETA RECEPTOR SIGNALING | Genes involved in Downregulation of TGF-beta receptor signaling |
| 0.0 | 0.2 | REACTOME AMINE COMPOUND SLC TRANSPORTERS | Genes involved in Amine compound SLC transporters |
| 0.0 | 1.0 | REACTOME PD1 SIGNALING | Genes involved in PD-1 signaling |
| 0.0 | 1.4 | REACTOME P75 NTR RECEPTOR MEDIATED SIGNALLING | Genes involved in p75 NTR receptor-mediated signalling |
| 0.0 | 0.7 | REACTOME XENOBIOTICS | Genes involved in Xenobiotics |
| 0.0 | 0.5 | REACTOME MICRORNA MIRNA BIOGENESIS | Genes involved in MicroRNA (miRNA) Biogenesis |
| 0.0 | 1.1 | REACTOME SEMA4D INDUCED CELL MIGRATION AND GROWTH CONE COLLAPSE | Genes involved in Sema4D induced cell migration and growth-cone collapse |
| 0.0 | 0.6 | REACTOME TRAFFICKING AND PROCESSING OF ENDOSOMAL TLR | Genes involved in Trafficking and processing of endosomal TLR |
| 0.0 | 0.3 | REACTOME PI3K EVENTS IN ERBB4 SIGNALING | Genes involved in PI3K events in ERBB4 signaling |
| 0.0 | 0.9 | REACTOME BASIGIN INTERACTIONS | Genes involved in Basigin interactions |
| 0.0 | 0.4 | REACTOME P38MAPK EVENTS | Genes involved in p38MAPK events |
| 0.0 | 0.5 | REACTOME OPSINS | Genes involved in Opsins |
| 0.0 | 0.7 | REACTOME AKT PHOSPHORYLATES TARGETS IN THE CYTOSOL | Genes involved in AKT phosphorylates targets in the cytosol |
| 0.0 | 1.8 | REACTOME IRON UPTAKE AND TRANSPORT | Genes involved in Iron uptake and transport |
| 0.0 | 0.7 | REACTOME METABOLISM OF POLYAMINES | Genes involved in Metabolism of polyamines |
| 0.0 | 1.6 | REACTOME INTERFERON GAMMA SIGNALING | Genes involved in Interferon gamma signaling |
| 0.0 | 0.5 | REACTOME RECRUITMENT OF NUMA TO MITOTIC CENTROSOMES | Genes involved in Recruitment of NuMA to mitotic centrosomes |
| 0.0 | 0.2 | REACTOME REGULATION OF HYPOXIA INDUCIBLE FACTOR HIF BY OXYGEN | Genes involved in Regulation of Hypoxia-inducible Factor (HIF) by Oxygen |
| 0.0 | 0.7 | REACTOME SHC1 EVENTS IN ERBB4 SIGNALING | Genes involved in SHC1 events in ERBB4 signaling |
| 0.0 | 1.0 | REACTOME CIRCADIAN REPRESSION OF EXPRESSION BY REV ERBA | Genes involved in Circadian Repression of Expression by REV-ERBA |
| 0.0 | 1.3 | REACTOME SMAD2 SMAD3 SMAD4 HETEROTRIMER REGULATES TRANSCRIPTION | Genes involved in SMAD2/SMAD3:SMAD4 heterotrimer regulates transcription |
| 0.0 | 1.3 | REACTOME METABOLISM OF STEROID HORMONES AND VITAMINS A AND D | Genes involved in Metabolism of steroid hormones and vitamins A and D |
| 0.0 | 2.9 | REACTOME MHC CLASS II ANTIGEN PRESENTATION | Genes involved in MHC class II antigen presentation |
| 0.0 | 0.7 | REACTOME EICOSANOID LIGAND BINDING RECEPTORS | Genes involved in Eicosanoid ligand-binding receptors |
| 0.0 | 0.4 | REACTOME PASSIVE TRANSPORT BY AQUAPORINS | Genes involved in Passive Transport by Aquaporins |
| 0.0 | 1.4 | REACTOME STRIATED MUSCLE CONTRACTION | Genes involved in Striated Muscle Contraction |
| 0.0 | 0.1 | REACTOME TRANSPORT OF MATURE TRANSCRIPT TO CYTOPLASM | Genes involved in Transport of Mature Transcript to Cytoplasm |
| 0.0 | 0.8 | REACTOME IONOTROPIC ACTIVITY OF KAINATE RECEPTORS | Genes involved in Ionotropic activity of Kainate Receptors |
| 0.0 | 0.7 | REACTOME NEGATIVE REGULATORS OF RIG I MDA5 SIGNALING | Genes involved in Negative regulators of RIG-I/MDA5 signaling |
| 0.0 | 0.1 | REACTOME SCF BETA TRCP MEDIATED DEGRADATION OF EMI1 | Genes involved in SCF-beta-TrCP mediated degradation of Emi1 |
| 0.0 | 5.3 | REACTOME CLASS A1 RHODOPSIN LIKE RECEPTORS | Genes involved in Class A/1 (Rhodopsin-like receptors) |
| 0.0 | 0.4 | REACTOME ACTIVATED NOTCH1 TRANSMITS SIGNAL TO THE NUCLEUS | Genes involved in Activated NOTCH1 Transmits Signal to the Nucleus |
| 0.0 | 1.0 | REACTOME PTM GAMMA CARBOXYLATION HYPUSINE FORMATION AND ARYLSULFATASE ACTIVATION | Genes involved in PTM: gamma carboxylation, hypusine formation and arylsulfatase activation |
| 0.0 | 0.6 | REACTOME REGULATION OF BETA CELL DEVELOPMENT | Genes involved in Regulation of beta-cell development |
| 0.0 | 1.5 | REACTOME MITOCHONDRIAL PROTEIN IMPORT | Genes involved in Mitochondrial Protein Import |
| 0.0 | 0.4 | REACTOME CD28 DEPENDENT PI3K AKT SIGNALING | Genes involved in CD28 dependent PI3K/Akt signaling |
| 0.0 | 4.4 | REACTOME SIGNALING BY RHO GTPASES | Genes involved in Signaling by Rho GTPases |
| 0.0 | 0.1 | REACTOME TRANSPORT OF GLUCOSE AND OTHER SUGARS BILE SALTS AND ORGANIC ACIDS METAL IONS AND AMINE COMPOUNDS | Genes involved in Transport of glucose and other sugars, bile salts and organic acids, metal ions and amine compounds |
| 0.0 | 0.3 | REACTOME GLUCOSE TRANSPORT | Genes involved in Glucose transport |
| 0.0 | 0.4 | REACTOME ACYL CHAIN REMODELLING OF PI | Genes involved in Acyl chain remodelling of PI |
| 0.0 | 0.4 | REACTOME HS GAG BIOSYNTHESIS | Genes involved in HS-GAG biosynthesis |
| 0.0 | 0.1 | REACTOME FGFR2C LIGAND BINDING AND ACTIVATION | Genes involved in FGFR2c ligand binding and activation |
| 0.0 | 0.1 | REACTOME N GLYCAN ANTENNAE ELONGATION IN THE MEDIAL TRANS GOLGI | Genes involved in N-glycan antennae elongation in the medial/trans-Golgi |
| 0.0 | 0.4 | REACTOME REGULATION OF COMPLEMENT CASCADE | Genes involved in Regulation of Complement cascade |
| 0.0 | 0.1 | REACTOME REGULATION OF KIT SIGNALING | Genes involved in Regulation of KIT signaling |
| 0.0 | 0.4 | REACTOME SIGNAL REGULATORY PROTEIN SIRP FAMILY INTERACTIONS | Genes involved in Signal regulatory protein (SIRP) family interactions |
| 0.0 | 1.5 | REACTOME CELL JUNCTION ORGANIZATION | Genes involved in Cell junction organization |
| 0.0 | 0.3 | REACTOME INTEGRATION OF PROVIRUS | Genes involved in Integration of provirus |
| 0.0 | 0.3 | REACTOME CYCLIN E ASSOCIATED EVENTS DURING G1 S TRANSITION | Genes involved in Cyclin E associated events during G1/S transition |
| 0.0 | 0.1 | REACTOME CREB PHOSPHORYLATION THROUGH THE ACTIVATION OF RAS | Genes involved in CREB phosphorylation through the activation of Ras |
| 0.0 | 0.2 | REACTOME TRAFFICKING OF GLUR2 CONTAINING AMPA RECEPTORS | Genes involved in Trafficking of GluR2-containing AMPA receptors |
| 0.0 | 0.1 | REACTOME CYCLIN A B1 ASSOCIATED EVENTS DURING G2 M TRANSITION | Genes involved in Cyclin A/B1 associated events during G2/M transition |
| 0.0 | 0.3 | REACTOME GAP JUNCTION ASSEMBLY | Genes involved in Gap junction assembly |
| 0.0 | 0.1 | REACTOME PEPTIDE HORMONE BIOSYNTHESIS | Genes involved in Peptide hormone biosynthesis |
| 0.0 | 0.4 | REACTOME G1 PHASE | Genes involved in G1 Phase |
| 0.0 | 0.2 | REACTOME PURINE RIBONUCLEOSIDE MONOPHOSPHATE BIOSYNTHESIS | Genes involved in Purine ribonucleoside monophosphate biosynthesis |
| 0.0 | 0.2 | REACTOME ABACAVIR TRANSPORT AND METABOLISM | Genes involved in Abacavir transport and metabolism |
| 0.0 | 0.9 | REACTOME COLLAGEN FORMATION | Genes involved in Collagen formation |
| 0.0 | 0.0 | REACTOME CONVERSION FROM APC C CDC20 TO APC C CDH1 IN LATE ANAPHASE | Genes involved in Conversion from APC/C:Cdc20 to APC/C:Cdh1 in late anaphase |
| 0.0 | 0.2 | REACTOME SRP DEPENDENT COTRANSLATIONAL PROTEIN TARGETING TO MEMBRANE | Genes involved in SRP-dependent cotranslational protein targeting to membrane |