Project
Inflammatory response time course, HUVEC (Wada, 2009)
Navigation
Downloads
Results for GATA5
Z-value: 0.55
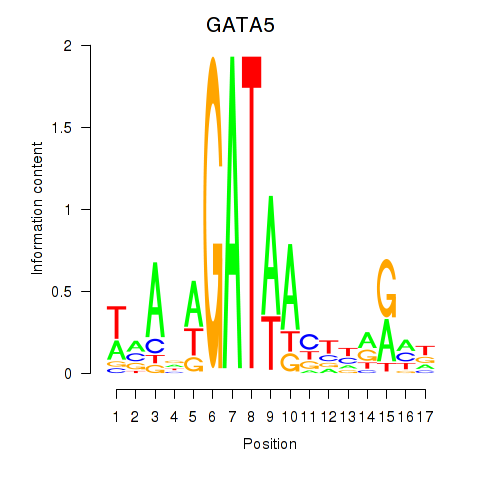
Motif logo
Transcription factors associated with GATA5
| Gene Symbol | Gene ID | Gene Info |
|---|---|---|
|
GATA5
|
ENSG00000130700.7 | GATA5 |
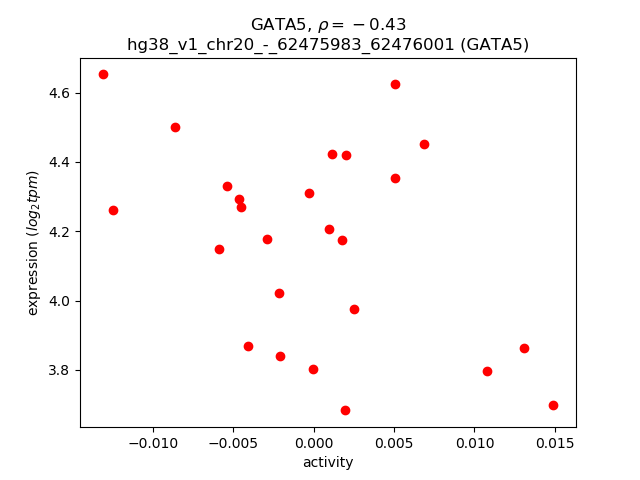
Activity-expression correlation:
| Gene | Promoter | Pearson corr. coef. | P-value | Plot |
|---|---|---|---|---|
| GATA5 | hg38_v1_chr20_-_62475983_62476001 | -0.43 | 3.4e-02 | Click! |
Activity profile of GATA5 motif
Sorted Z-values of GATA5 motif
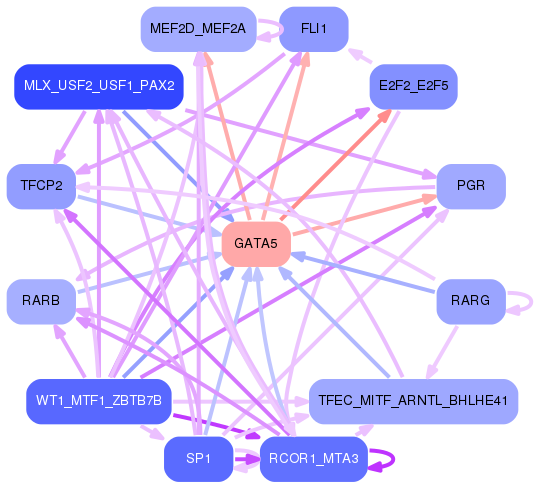
Network of associatons between targets according to the STRING database.

First level regulatory network of GATA5
| Promoter | Score | Transcript | Gene | Gene Info |
|---|---|---|---|---|
| chr4_+_73740541 | 2.08 |
ENST00000401931.1
ENST00000307407.8 |
CXCL8
|
C-X-C motif chemokine ligand 8 |
| chr15_+_88635626 | 1.16 |
ENST00000379224.10
|
ISG20
|
interferon stimulated exonuclease gene 20 |
| chr4_+_141636923 | 1.02 |
ENST00000529613.5
|
IL15
|
interleukin 15 |
| chr7_-_93148345 | 0.88 |
ENST00000437805.5
ENST00000446959.5 ENST00000439952.5 ENST00000414791.5 ENST00000446033.1 ENST00000411955.5 ENST00000318238.9 |
SAMD9L
|
sterile alpha motif domain containing 9 like |
| chr2_+_201132928 | 0.87 |
ENST00000462763.5
|
CFLAR
|
CASP8 and FADD like apoptosis regulator |
| chr2_+_201132872 | 0.83 |
ENST00000470178.6
|
CFLAR
|
CASP8 and FADD like apoptosis regulator |
| chr2_+_201132769 | 0.83 |
ENST00000494258.5
|
CFLAR
|
CASP8 and FADD like apoptosis regulator |
| chr6_+_29396555 | 0.83 |
ENST00000623183.1
|
OR12D2
|
olfactory receptor family 12 subfamily D member 2 |
| chr8_+_85187650 | 0.81 |
ENST00000517476.5
ENST00000521429.5 |
E2F5
|
E2F transcription factor 5 |
| chr2_+_201132958 | 0.70 |
ENST00000479953.6
ENST00000340870.6 |
CFLAR
|
CASP8 and FADD like apoptosis regulator |
| chr1_-_120054225 | 0.67 |
ENST00000602566.6
|
NOTCH2
|
notch receptor 2 |
| chr2_-_223945322 | 0.65 |
ENST00000233055.9
|
WDFY1
|
WD repeat and FYVE domain containing 1 |
| chr6_-_169250825 | 0.59 |
ENST00000676869.1
ENST00000676760.1 |
THBS2
|
thrombospondin 2 |
| chr7_+_134646845 | 0.59 |
ENST00000344924.8
|
BPGM
|
bisphosphoglycerate mutase |
| chr7_+_134646798 | 0.57 |
ENST00000418040.5
ENST00000393132.2 |
BPGM
|
bisphosphoglycerate mutase |
| chr1_+_21570303 | 0.54 |
ENST00000374830.2
|
ALPL
|
alkaline phosphatase, biomineralization associated |
| chr18_+_58362467 | 0.43 |
ENST00000675101.1
|
NEDD4L
|
NEDD4 like E3 ubiquitin protein ligase |
| chr19_+_42076129 | 0.42 |
ENST00000359044.5
|
ZNF574
|
zinc finger protein 574 |
| chr3_-_108058361 | 0.42 |
ENST00000398258.7
|
CD47
|
CD47 molecule |
| chr11_-_101129706 | 0.42 |
ENST00000534013.5
|
PGR
|
progesterone receptor |
| chr6_-_130956371 | 0.42 |
ENST00000639623.1
ENST00000525193.5 ENST00000527659.5 |
EPB41L2
|
erythrocyte membrane protein band 4.1 like 2 |
| chr1_+_206635703 | 0.41 |
ENST00000649163.1
|
DYRK3
|
dual specificity tyrosine phosphorylation regulated kinase 3 |
| chr15_+_99566066 | 0.40 |
ENST00000557942.5
|
MEF2A
|
myocyte enhancer factor 2A |
| chr15_+_99565950 | 0.39 |
ENST00000557785.5
ENST00000558049.5 ENST00000449277.6 |
MEF2A
|
myocyte enhancer factor 2A |
| chr21_+_34364003 | 0.39 |
ENST00000290310.4
|
KCNE2
|
potassium voltage-gated channel subfamily E regulatory subunit 2 |
| chr15_+_99565921 | 0.38 |
ENST00000558812.5
ENST00000338042.10 |
MEF2A
|
myocyte enhancer factor 2A |
| chr22_+_18527802 | 0.38 |
ENST00000612978.5
|
TMEM191B
|
transmembrane protein 191B |
| chr2_+_102311502 | 0.38 |
ENST00000404917.6
ENST00000410040.5 |
IL1RL1
IL18R1
|
interleukin 1 receptor like 1 interleukin 18 receptor 1 |
| chr1_+_206635573 | 0.37 |
ENST00000367108.7
|
DYRK3
|
dual specificity tyrosine phosphorylation regulated kinase 3 |
| chr11_+_128693887 | 0.35 |
ENST00000281428.12
|
FLI1
|
Fli-1 proto-oncogene, ETS transcription factor |
| chr6_-_33322803 | 0.35 |
ENST00000446511.1
ENST00000446403.1 ENST00000374542.10 ENST00000266000.10 ENST00000414083.6 ENST00000620164.4 |
DAXX
|
death domain associated protein |
| chr20_+_44582549 | 0.34 |
ENST00000372886.6
|
PKIG
|
cAMP-dependent protein kinase inhibitor gamma |
| chr3_-_108222362 | 0.34 |
ENST00000492106.1
|
IFT57
|
intraflagellar transport 57 |
| chr1_+_171485520 | 0.33 |
ENST00000647382.2
ENST00000392078.7 ENST00000367742.7 ENST00000338920.8 |
PRRC2C
|
proline rich coiled-coil 2C |
| chr6_+_42050876 | 0.32 |
ENST00000465926.5
ENST00000482432.1 |
TAF8
|
TATA-box binding protein associated factor 8 |
| chr9_-_35650902 | 0.32 |
ENST00000259608.8
ENST00000618781.1 |
SIT1
|
signaling threshold regulating transmembrane adaptor 1 |
| chr10_+_102152169 | 0.31 |
ENST00000405356.5
|
NOLC1
|
nucleolar and coiled-body phosphoprotein 1 |
| chr8_+_27771942 | 0.31 |
ENST00000523566.5
|
ESCO2
|
establishment of sister chromatid cohesion N-acetyltransferase 2 |
| chr17_+_20073538 | 0.31 |
ENST00000681116.1
ENST00000680572.1 ENST00000680604.1 ENST00000681875.1 ENST00000679058.1 |
SPECC1
|
sperm antigen with calponin homology and coiled-coil domains 1 |
| chr10_-_91909476 | 0.30 |
ENST00000311575.6
|
FGFBP3
|
fibroblast growth factor binding protein 3 |
| chr3_+_141426108 | 0.29 |
ENST00000441582.2
ENST00000510726.1 |
ZBTB38
|
zinc finger and BTB domain containing 38 |
| chr4_-_163332589 | 0.28 |
ENST00000296533.3
ENST00000509586.5 ENST00000504391.5 ENST00000512819.1 |
NPY1R
|
neuropeptide Y receptor Y1 |
| chr8_-_140800535 | 0.26 |
ENST00000521986.5
ENST00000523539.5 |
PTK2
|
protein tyrosine kinase 2 |
| chr6_+_29395631 | 0.26 |
ENST00000642051.1
|
OR12D2
|
olfactory receptor family 12 subfamily D member 2 |
| chr1_-_150697128 | 0.25 |
ENST00000427665.1
ENST00000271732.8 |
GOLPH3L
|
golgi phosphoprotein 3 like |
| chr20_-_45705019 | 0.24 |
ENST00000330523.9
ENST00000335769.2 |
WFDC10B
|
WAP four-disulfide core domain 10B |
| chr5_+_148063971 | 0.24 |
ENST00000398454.5
ENST00000359874.7 ENST00000508733.5 ENST00000256084.8 |
SPINK5
|
serine peptidase inhibitor Kazal type 5 |
| chrX_+_11759604 | 0.23 |
ENST00000649602.1
ENST00000650215.1 ENST00000649685.1 ENST00000649649.1 ENST00000380693.8 ENST00000380692.7 ENST00000650628.1 ENST00000649851.1 ENST00000421368.3 |
MSL3
|
MSL complex subunit 3 |
| chr5_+_38445539 | 0.22 |
ENST00000397210.7
ENST00000506135.5 ENST00000508131.5 |
EGFLAM
|
EGF like, fibronectin type III and laminin G domains |
| chrX_+_30243715 | 0.22 |
ENST00000378981.8
ENST00000397550.6 |
MAGEB1
|
MAGE family member B1 |
| chr19_+_35748549 | 0.22 |
ENST00000301159.14
|
LIN37
|
lin-37 DREAM MuvB core complex component |
| chr10_+_94402486 | 0.22 |
ENST00000225235.5
|
TBC1D12
|
TBC1 domain family member 12 |
| chr12_-_44875647 | 0.21 |
ENST00000395487.6
|
NELL2
|
neural EGFL like 2 |
| chr11_+_56176618 | 0.21 |
ENST00000312298.1
|
OR5J2
|
olfactory receptor family 5 subfamily J member 2 |
| chr2_+_29113989 | 0.21 |
ENST00000404424.5
|
CLIP4
|
CAP-Gly domain containing linker protein family member 4 |
| chr4_-_64409444 | 0.21 |
ENST00000381210.8
ENST00000507440.5 |
TECRL
|
trans-2,3-enoyl-CoA reductase like |
| chr12_-_44876294 | 0.20 |
ENST00000429094.7
ENST00000551601.5 ENST00000549027.5 ENST00000452445.6 |
NELL2
|
neural EGFL like 2 |
| chr13_+_101489940 | 0.20 |
ENST00000376162.7
|
ITGBL1
|
integrin subunit beta like 1 |
| chr18_-_24311495 | 0.19 |
ENST00000357041.8
|
OSBPL1A
|
oxysterol binding protein like 1A |
| chr16_+_56451513 | 0.18 |
ENST00000562150.5
ENST00000561646.5 ENST00000566157.6 ENST00000568397.1 |
OGFOD1
|
2-oxoglutarate and iron dependent oxygenase domain containing 1 |
| chrX_+_105948429 | 0.18 |
ENST00000540278.1
|
NRK
|
Nik related kinase |
| chr20_-_25623945 | 0.18 |
ENST00000304788.4
|
NANP
|
N-acetylneuraminic acid phosphatase |
| chr13_+_31739542 | 0.17 |
ENST00000380314.2
|
RXFP2
|
relaxin family peptide receptor 2 |
| chr13_+_31739520 | 0.17 |
ENST00000298386.7
|
RXFP2
|
relaxin family peptide receptor 2 |
| chr8_-_23854796 | 0.17 |
ENST00000290271.7
|
STC1
|
stanniocalcin 1 |
| chr9_+_89318492 | 0.16 |
ENST00000375807.8
ENST00000339901.8 |
SECISBP2
|
SECIS binding protein 2 |
| chr4_+_154563003 | 0.16 |
ENST00000302068.9
ENST00000509493.1 |
FGB
|
fibrinogen beta chain |
| chr6_+_29111560 | 0.16 |
ENST00000377169.2
|
OR2J3
|
olfactory receptor family 2 subfamily J member 3 |
| chr12_-_130839230 | 0.15 |
ENST00000392373.7
ENST00000261653.10 |
STX2
|
syntaxin 2 |
| chr11_-_61967127 | 0.15 |
ENST00000532601.1
|
FTH1
|
ferritin heavy chain 1 |
| chr2_-_208190001 | 0.15 |
ENST00000451346.5
ENST00000341287.9 |
C2orf80
|
chromosome 2 open reading frame 80 |
| chr2_-_127884860 | 0.15 |
ENST00000393001.1
|
AMMECR1L
|
AMMECR1 like |
| chr19_-_44304968 | 0.15 |
ENST00000591609.1
ENST00000589799.5 ENST00000291182.9 ENST00000650576.1 ENST00000589248.5 |
ZNF235
|
zinc finger protein 235 |
| chr2_-_49154433 | 0.15 |
ENST00000454032.5
ENST00000304421.8 |
FSHR
|
follicle stimulating hormone receptor |
| chr1_+_202462730 | 0.14 |
ENST00000290419.9
ENST00000491336.5 |
PPP1R12B
|
protein phosphatase 1 regulatory subunit 12B |
| chrM_+_12329 | 0.14 |
ENST00000361567.2
|
MT-ND5
|
mitochondrially encoded NADH:ubiquinone oxidoreductase core subunit 5 |
| chr1_+_224183197 | 0.14 |
ENST00000323699.9
|
DEGS1
|
delta 4-desaturase, sphingolipid 1 |
| chr1_+_23743153 | 0.14 |
ENST00000418390.6
|
ELOA
|
elongin A |
| chr17_-_15598797 | 0.14 |
ENST00000354433.7
|
CDRT1
|
CMT1A duplicated region transcript 1 |
| chr1_+_248231417 | 0.14 |
ENST00000641868.1
|
OR2M4
|
olfactory receptor family 2 subfamily M member 4 |
| chr13_-_46182136 | 0.14 |
ENST00000323076.7
|
LCP1
|
lymphocyte cytosolic protein 1 |
| chr14_-_91946989 | 0.14 |
ENST00000556154.5
|
FBLN5
|
fibulin 5 |
| chr1_-_100178215 | 0.13 |
ENST00000370138.1
ENST00000370137.6 ENST00000342895.7 ENST00000620882.4 |
LRRC39
|
leucine rich repeat containing 39 |
| chr11_-_101129806 | 0.13 |
ENST00000325455.10
ENST00000617858.4 ENST00000619228.2 |
PGR
|
progesterone receptor |
| chr10_+_35195124 | 0.13 |
ENST00000487763.5
ENST00000473940.5 ENST00000488328.5 ENST00000356917.9 |
CREM
|
cAMP responsive element modulator |
| chr18_-_72865680 | 0.13 |
ENST00000397929.5
|
NETO1
|
neuropilin and tolloid like 1 |
| chr1_+_86468902 | 0.13 |
ENST00000394711.2
|
CLCA1
|
chloride channel accessory 1 |
| chr13_+_76948500 | 0.12 |
ENST00000377462.6
|
ACOD1
|
aconitate decarboxylase 1 |
| chr17_+_64449037 | 0.12 |
ENST00000615220.4
ENST00000619286.5 ENST00000612535.4 ENST00000616498.4 |
MILR1
|
mast cell immunoglobulin like receptor 1 |
| chr15_+_76336755 | 0.12 |
ENST00000290759.9
|
ISL2
|
ISL LIM homeobox 2 |
| chr7_+_136868622 | 0.12 |
ENST00000680005.1
ENST00000445907.6 |
CHRM2
|
cholinergic receptor muscarinic 2 |
| chr5_+_132060648 | 0.12 |
ENST00000296870.3
|
IL3
|
interleukin 3 |
| chr17_-_59707404 | 0.12 |
ENST00000393038.3
|
PTRH2
|
peptidyl-tRNA hydrolase 2 |
| chr4_+_145625992 | 0.12 |
ENST00000541599.5
|
MMAA
|
metabolism of cobalamin associated A |
| chr18_+_63775395 | 0.12 |
ENST00000398019.7
|
SERPINB7
|
serpin family B member 7 |
| chr1_-_17119435 | 0.12 |
ENST00000375481.1
ENST00000375486.9 |
PADI2
|
peptidyl arginine deiminase 2 |
| chr10_+_7703340 | 0.12 |
ENST00000429820.5
ENST00000379587.4 |
ITIH2
|
inter-alpha-trypsin inhibitor heavy chain 2 |
| chrX_+_78945332 | 0.12 |
ENST00000544091.1
ENST00000171757.3 |
P2RY10
|
P2Y receptor family member 10 |
| chr19_-_36489553 | 0.12 |
ENST00000392170.7
|
ZNF566
|
zinc finger protein 566 |
| chr11_+_30231000 | 0.12 |
ENST00000254122.8
ENST00000533718.2 ENST00000417547.1 |
FSHB
|
follicle stimulating hormone subunit beta |
| chr19_-_36489435 | 0.11 |
ENST00000434377.6
ENST00000424129.7 ENST00000452939.6 ENST00000427002.2 |
ZNF566
|
zinc finger protein 566 |
| chr4_-_47981535 | 0.11 |
ENST00000402813.9
|
CNGA1
|
cyclic nucleotide gated channel subunit alpha 1 |
| chr3_-_185923893 | 0.11 |
ENST00000259043.11
|
TRA2B
|
transformer 2 beta homolog |
| chr13_-_108218293 | 0.10 |
ENST00000405925.2
|
LIG4
|
DNA ligase 4 |
| chr4_+_109912877 | 0.10 |
ENST00000265171.10
ENST00000509793.5 ENST00000652245.1 |
EGF
|
epidermal growth factor |
| chr2_-_49154507 | 0.10 |
ENST00000406846.7
|
FSHR
|
follicle stimulating hormone receptor |
| chr6_-_134950081 | 0.10 |
ENST00000367847.2
ENST00000265605.7 ENST00000367845.6 |
ALDH8A1
|
aldehyde dehydrogenase 8 family member A1 |
| chr17_+_47831608 | 0.10 |
ENST00000269025.9
|
LRRC46
|
leucine rich repeat containing 46 |
| chr21_-_28885347 | 0.10 |
ENST00000303775.10
ENST00000351429.7 |
N6AMT1
|
N-6 adenine-specific DNA methyltransferase 1 |
| chr7_+_142670734 | 0.09 |
ENST00000390398.3
|
TRBV25-1
|
T cell receptor beta variable 25-1 |
| chr3_+_119186716 | 0.09 |
ENST00000460625.1
|
UPK1B
|
uroplakin 1B |
| chr11_+_124183219 | 0.09 |
ENST00000641351.2
|
OR10D3
|
olfactory receptor family 10 subfamily D member 3 |
| chr6_-_154356735 | 0.09 |
ENST00000367220.8
ENST00000265198.8 ENST00000520261.1 |
IPCEF1
|
interaction protein for cytohesin exchange factors 1 |
| chr9_+_2110354 | 0.09 |
ENST00000634772.1
|
SMARCA2
|
SWI/SNF related, matrix associated, actin dependent regulator of chromatin, subfamily a, member 2 |
| chr3_+_138621225 | 0.09 |
ENST00000479848.1
|
FAIM
|
Fas apoptotic inhibitory molecule |
| chr15_-_34336749 | 0.09 |
ENST00000397707.6
ENST00000560611.5 |
SLC12A6
|
solute carrier family 12 member 6 |
| chr19_-_36489854 | 0.09 |
ENST00000493391.6
|
ZNF566
|
zinc finger protein 566 |
| chr4_-_99657820 | 0.09 |
ENST00000511828.2
|
C4orf54
|
chromosome 4 open reading frame 54 |
| chr19_-_55599493 | 0.09 |
ENST00000221665.5
ENST00000592585.1 |
FIZ1
|
FLT3 interacting zinc finger 1 |
| chr3_+_138621207 | 0.08 |
ENST00000464668.5
|
FAIM
|
Fas apoptotic inhibitory molecule |
| chr20_+_45629717 | 0.08 |
ENST00000372643.4
|
WFDC10A
|
WAP four-disulfide core domain 10A |
| chr15_+_84237586 | 0.08 |
ENST00000512109.1
|
GOLGA6L4
|
golgin A6 family like 4 |
| chr22_-_28711931 | 0.08 |
ENST00000434810.5
ENST00000456369.5 |
CHEK2
|
checkpoint kinase 2 |
| chr12_+_57488059 | 0.08 |
ENST00000628866.2
ENST00000262027.10 |
MARS1
|
methionyl-tRNA synthetase 1 |
| chr12_+_71686473 | 0.08 |
ENST00000549735.5
|
TMEM19
|
transmembrane protein 19 |
| chr9_-_90642791 | 0.08 |
ENST00000375765.5
ENST00000636786.1 |
DIRAS2
|
DIRAS family GTPase 2 |
| chr18_-_3874751 | 0.07 |
ENST00000515196.6
ENST00000534970.5 |
DLGAP1
|
DLG associated protein 1 |
| chr7_-_143647646 | 0.07 |
ENST00000636941.1
|
TCAF2C
|
TRPM8 channel associated factor 2C |
| chr17_-_4786354 | 0.07 |
ENST00000328739.6
ENST00000441199.2 ENST00000416307.6 |
VMO1
|
vitelline membrane outer layer 1 homolog |
| chr1_-_88891496 | 0.07 |
ENST00000448623.5
ENST00000370500.10 ENST00000418217.1 |
GTF2B
|
general transcription factor IIB |
| chr11_+_62270150 | 0.07 |
ENST00000525380.1
ENST00000227918.3 |
SCGB2A2
|
secretoglobin family 2A member 2 |
| chr20_-_50958520 | 0.07 |
ENST00000371588.10
ENST00000371584.9 ENST00000413082.1 ENST00000371582.8 |
DPM1
|
dolichyl-phosphate mannosyltransferase subunit 1, catalytic |
| chr12_-_8650529 | 0.07 |
ENST00000543467.5
|
MFAP5
|
microfibril associated protein 5 |
| chr18_-_43277482 | 0.07 |
ENST00000255224.8
ENST00000590752.5 ENST00000596867.1 |
SYT4
|
synaptotagmin 4 |
| chr1_+_103617427 | 0.07 |
ENST00000423678.2
ENST00000414303.7 |
AMY2A
|
amylase alpha 2A |
| chr11_+_18412292 | 0.06 |
ENST00000541669.6
ENST00000280704.8 |
LDHC
|
lactate dehydrogenase C |
| chr3_+_172039556 | 0.06 |
ENST00000415807.7
ENST00000421757.5 |
FNDC3B
|
fibronectin type III domain containing 3B |
| chr14_+_20455968 | 0.06 |
ENST00000438886.1
|
APEX1
|
apurinic/apyrimidinic endodeoxyribonuclease 1 |
| chrM_+_10055 | 0.06 |
ENST00000361227.2
|
MT-ND3
|
mitochondrially encoded NADH:ubiquinone oxidoreductase core subunit 3 |
| chr1_+_236394268 | 0.06 |
ENST00000334232.9
|
EDARADD
|
EDAR associated death domain |
| chr15_+_82262781 | 0.06 |
ENST00000566205.1
ENST00000339465.5 ENST00000569120.1 ENST00000682753.1 ENST00000566861.5 ENST00000565432.1 |
SAXO2
|
stabilizer of axonemal microtubules 2 |
| chr2_+_181985846 | 0.05 |
ENST00000682840.1
ENST00000409137.7 ENST00000280295.7 |
PPP1R1C
|
protein phosphatase 1 regulatory inhibitor subunit 1C |
| chr5_+_140882116 | 0.05 |
ENST00000289272.3
ENST00000409494.5 ENST00000617769.1 |
PCDHA13
|
protocadherin alpha 13 |
| chr3_+_44874606 | 0.05 |
ENST00000296125.9
|
TGM4
|
transglutaminase 4 |
| chr5_-_159099909 | 0.05 |
ENST00000313708.11
|
EBF1
|
EBF transcription factor 1 |
| chr2_-_178451094 | 0.05 |
ENST00000677981.1
ENST00000678845.1 ENST00000677689.1 ENST00000325748.9 ENST00000678775.1 |
PRKRA
|
protein activator of interferon induced protein kinase EIF2AK2 |
| chr18_+_13612614 | 0.05 |
ENST00000586765.1
ENST00000677910.1 |
LDLRAD4
|
low density lipoprotein receptor class A domain containing 4 |
| chr7_+_142760398 | 0.05 |
ENST00000632998.1
|
PRSS2
|
serine protease 2 |
| chr12_+_53097656 | 0.05 |
ENST00000301464.4
|
IGFBP6
|
insulin like growth factor binding protein 6 |
| chr1_-_26900437 | 0.05 |
ENST00000361720.10
|
GPATCH3
|
G-patch domain containing 3 |
| chr1_+_248095184 | 0.05 |
ENST00000358120.3
ENST00000641893.1 |
OR2L13
|
olfactory receptor family 2 subfamily L member 13 |
| chrX_+_80420466 | 0.05 |
ENST00000308293.5
|
TENT5D
|
terminal nucleotidyltransferase 5D |
| chr11_+_119334511 | 0.05 |
ENST00000311413.5
|
RNF26
|
ring finger protein 26 |
| chr18_+_13611764 | 0.05 |
ENST00000585931.5
|
LDLRAD4
|
low density lipoprotein receptor class A domain containing 4 |
| chr5_-_148654522 | 0.05 |
ENST00000377888.8
|
HTR4
|
5-hydroxytryptamine receptor 4 |
| chr8_+_131939865 | 0.04 |
ENST00000520362.5
ENST00000519656.1 |
EFR3A
|
EFR3 homolog A |
| chr8_+_24440930 | 0.04 |
ENST00000441335.6
ENST00000175238.10 ENST00000380789.5 |
ADAM7
|
ADAM metallopeptidase domain 7 |
| chr5_+_163503075 | 0.04 |
ENST00000280969.9
|
MAT2B
|
methionine adenosyltransferase 2B |
| chr8_+_7495892 | 0.04 |
ENST00000355602.3
|
DEFB107B
|
defensin beta 107B |
| chr9_+_104094557 | 0.03 |
ENST00000374787.7
|
SMC2
|
structural maintenance of chromosomes 2 |
| chr11_-_85665077 | 0.03 |
ENST00000527447.2
|
CREBZF
|
CREB/ATF bZIP transcription factor |
| chr4_+_47485268 | 0.03 |
ENST00000273859.8
ENST00000504445.1 |
ATP10D
|
ATPase phospholipid transporting 10D (putative) |
| chr14_-_106154113 | 0.03 |
ENST00000390603.2
|
IGHV3-15
|
immunoglobulin heavy variable 3-15 |
| chr17_+_43171187 | 0.03 |
ENST00000542611.5
ENST00000590996.6 ENST00000589872.1 |
NBR1
|
NBR1 autophagy cargo receptor |
| chr11_+_122862303 | 0.03 |
ENST00000533709.1
|
CRTAM
|
cytotoxic and regulatory T cell molecule |
| chr20_-_45579326 | 0.03 |
ENST00000357199.8
|
WFDC8
|
WAP four-disulfide core domain 8 |
| chr20_-_45579277 | 0.03 |
ENST00000289953.3
|
WFDC8
|
WAP four-disulfide core domain 8 |
| chr7_-_87059639 | 0.03 |
ENST00000450689.7
|
ELAPOR2
|
endosome-lysosome associated apoptosis and autophagy regulator family member 2 |
| chr9_-_6645712 | 0.03 |
ENST00000321612.8
|
GLDC
|
glycine decarboxylase |
| chr5_-_159099745 | 0.03 |
ENST00000517373.1
|
EBF1
|
EBF transcription factor 1 |
| chr4_-_99435134 | 0.03 |
ENST00000476959.5
ENST00000482593.5 |
ADH7
|
alcohol dehydrogenase 7 (class IV), mu or sigma polypeptide |
| chr16_-_68015911 | 0.03 |
ENST00000574912.1
|
DPEP2NB
|
DPEP2 neighbor |
| chr6_-_159044980 | 0.03 |
ENST00000367066.8
|
TAGAP
|
T cell activation RhoGTPase activating protein |
| chr4_-_69653223 | 0.02 |
ENST00000286604.8
ENST00000505512.1 ENST00000514019.1 |
UGT2A1
|
UDP glucuronosyltransferase family 2 member A1 complex locus |
| chr6_+_46793379 | 0.02 |
ENST00000230588.9
ENST00000611727.2 |
MEP1A
|
meprin A subunit alpha |
| chr4_+_70195719 | 0.02 |
ENST00000683306.1
|
ODAM
|
odontogenic, ameloblast associated |
| chrX_+_101390824 | 0.02 |
ENST00000427805.6
ENST00000614077.4 |
RPL36A
|
ribosomal protein L36a |
| chr17_-_76551174 | 0.02 |
ENST00000589145.1
|
CYGB
|
cytoglobin |
| chr4_-_46389351 | 0.02 |
ENST00000503806.5
ENST00000356504.5 ENST00000514090.5 ENST00000506961.5 |
GABRA2
|
gamma-aminobutyric acid type A receptor subunit alpha2 |
| chrX_+_46912276 | 0.02 |
ENST00000424392.5
ENST00000611250.4 |
JADE3
|
jade family PHD finger 3 |
| chr2_+_61905646 | 0.02 |
ENST00000311832.5
|
COMMD1
|
copper metabolism domain containing 1 |
| chr14_+_50872098 | 0.02 |
ENST00000353130.5
|
ABHD12B
|
abhydrolase domain containing 12B |
| chr1_+_115029823 | 0.02 |
ENST00000256592.3
|
TSHB
|
thyroid stimulating hormone subunit beta |
| chr8_+_40153475 | 0.02 |
ENST00000315792.5
|
TCIM
|
transcriptional and immune response regulator |
| chr11_-_26722051 | 0.02 |
ENST00000396005.8
|
SLC5A12
|
solute carrier family 5 member 12 |
| chr5_-_59356962 | 0.02 |
ENST00000405755.6
|
PDE4D
|
phosphodiesterase 4D |
| chr2_-_217842154 | 0.02 |
ENST00000446688.5
|
TNS1
|
tensin 1 |
| chr5_-_159099684 | 0.02 |
ENST00000380654.8
|
EBF1
|
EBF transcription factor 1 |
| chr2_+_165294031 | 0.01 |
ENST00000283256.10
|
SCN2A
|
sodium voltage-gated channel alpha subunit 2 |
| chr13_+_29428603 | 0.01 |
ENST00000380808.6
|
MTUS2
|
microtubule associated scaffold protein 2 |
| chr6_-_109440504 | 0.01 |
ENST00000520723.5
ENST00000518648.1 ENST00000417394.6 ENST00000521072.7 |
PPIL6
|
peptidylprolyl isomerase like 6 |
| chr9_-_120477354 | 0.01 |
ENST00000416449.5
|
CDK5RAP2
|
CDK5 regulatory subunit associated protein 2 |
| chr10_+_5048748 | 0.01 |
ENST00000602997.5
ENST00000439082.7 |
AKR1C3
|
aldo-keto reductase family 1 member C3 |
| chr1_+_248097276 | 0.01 |
ENST00000641714.1
|
OR2L13
|
olfactory receptor family 2 subfamily L member 13 |
| chr17_-_4786433 | 0.01 |
ENST00000354194.4
|
VMO1
|
vitelline membrane outer layer 1 homolog |
| chr10_+_18400562 | 0.01 |
ENST00000377315.5
ENST00000650685.1 |
CACNB2
|
calcium voltage-gated channel auxiliary subunit beta 2 |
| chr11_-_4697831 | 0.01 |
ENST00000641159.1
ENST00000396950.4 ENST00000532598.1 |
OR51C1P
OR51E2
|
olfactory receptor family 51 subfamily C member 1 pseudogene olfactory receptor family 51 subfamily E member 2 |
| chr7_+_142749465 | 0.01 |
ENST00000486171.5
ENST00000619214.4 ENST00000311737.12 |
PRSS1
|
serine protease 1 |
| chr19_+_35329161 | 0.01 |
ENST00000341773.10
ENST00000600131.5 ENST00000595780.5 ENST00000597916.5 ENST00000593867.5 ENST00000600424.5 ENST00000599811.5 ENST00000536635.6 ENST00000085219.10 ENST00000544992.6 ENST00000419549.6 |
CD22
|
CD22 molecule |
| chr11_+_4704782 | 0.01 |
ENST00000380390.6
|
MMP26
|
matrix metallopeptidase 26 |
Gene Ontology Analysis
Gene overrepresentation in biological process category:
| Log-likelihood per target | Total log-likelihood | Term | Description |
|---|---|---|---|
| 0.3 | 1.0 | GO:0045062 | extrathymic T cell selection(GO:0045062) |
| 0.3 | 3.2 | GO:1903943 | regulation of hepatocyte apoptotic process(GO:1903943) negative regulation of hepatocyte apoptotic process(GO:1903944) |
| 0.3 | 1.2 | GO:0000738 | DNA catabolic process, exonucleolytic(GO:0000738) |
| 0.2 | 1.2 | GO:0043456 | regulation of pentose-phosphate shunt(GO:0043456) |
| 0.2 | 0.4 | GO:1901979 | regulation of inward rectifier potassium channel activity(GO:1901979) |
| 0.2 | 2.1 | GO:2000535 | regulation of entry of bacterium into host cell(GO:2000535) |
| 0.2 | 0.5 | GO:0071529 | cementum mineralization(GO:0071529) |
| 0.2 | 1.2 | GO:0055005 | ventricular cardiac myofibril assembly(GO:0055005) |
| 0.1 | 0.8 | GO:0035617 | stress granule disassembly(GO:0035617) |
| 0.1 | 0.5 | GO:0060748 | tertiary branching involved in mammary gland duct morphogenesis(GO:0060748) |
| 0.1 | 0.2 | GO:0001545 | primary ovarian follicle growth(GO:0001545) |
| 0.1 | 0.7 | GO:0034141 | positive regulation of toll-like receptor 3 signaling pathway(GO:0034141) |
| 0.1 | 0.9 | GO:0034058 | endosomal vesicle fusion(GO:0034058) |
| 0.1 | 0.1 | GO:0002760 | positive regulation of antimicrobial humoral response(GO:0002760) |
| 0.1 | 0.3 | GO:0034421 | post-translational protein acetylation(GO:0034421) |
| 0.1 | 0.2 | GO:0060723 | spongiotrophoblast cell proliferation(GO:0060720) regulation of spongiotrophoblast cell proliferation(GO:0060721) cell proliferation involved in embryonic placenta development(GO:0060722) regulation of cell proliferation involved in embryonic placenta development(GO:0060723) |
| 0.1 | 0.2 | GO:0006045 | N-acetylglucosamine biosynthetic process(GO:0006045) glucosamine-containing compound biosynthetic process(GO:1901073) |
| 0.1 | 0.3 | GO:1903936 | cellular response to sodium arsenite(GO:1903936) |
| 0.0 | 0.4 | GO:0035655 | interleukin-18-mediated signaling pathway(GO:0035655) |
| 0.0 | 0.3 | GO:0007000 | nucleolus organization(GO:0007000) |
| 0.0 | 0.1 | GO:0021524 | visceral motor neuron differentiation(GO:0021524) |
| 0.0 | 0.7 | GO:0002315 | marginal zone B cell differentiation(GO:0002315) |
| 0.0 | 0.2 | GO:1903575 | cornified envelope assembly(GO:1903575) |
| 0.0 | 0.4 | GO:2001288 | positive regulation of caveolin-mediated endocytosis(GO:2001288) |
| 0.0 | 0.2 | GO:0002784 | regulation of antimicrobial peptide production(GO:0002784) regulation of antibacterial peptide production(GO:0002786) |
| 0.0 | 0.1 | GO:0009236 | cobalamin biosynthetic process(GO:0009236) |
| 0.0 | 0.1 | GO:0036414 | protein citrullination(GO:0018101) histone citrullination(GO:0036414) negative regulation of lymphocyte chemotaxis(GO:1901624) |
| 0.0 | 0.1 | GO:1903926 | signal transduction involved in intra-S DNA damage checkpoint(GO:0072428) response to bisphenol A(GO:1903925) cellular response to bisphenol A(GO:1903926) |
| 0.0 | 0.1 | GO:1900127 | positive regulation of hyaluronan biosynthetic process(GO:1900127) |
| 0.0 | 0.4 | GO:0070050 | neuron cellular homeostasis(GO:0070050) |
| 0.0 | 0.1 | GO:2000312 | regulation of kainate selective glutamate receptor activity(GO:2000312) |
| 0.0 | 0.1 | GO:0090362 | positive regulation of platelet-derived growth factor production(GO:0090362) |
| 0.0 | 0.3 | GO:0045743 | positive regulation of fibroblast growth factor receptor signaling pathway(GO:0045743) |
| 0.0 | 0.3 | GO:0048194 | Golgi vesicle budding(GO:0048194) |
| 0.0 | 0.4 | GO:1904776 | regulation of protein localization to cell cortex(GO:1904776) positive regulation of protein localization to cell cortex(GO:1904778) |
| 0.0 | 0.3 | GO:0001833 | inner cell mass cell proliferation(GO:0001833) |
| 0.0 | 0.2 | GO:0043152 | induction of bacterial agglutination(GO:0043152) |
| 0.0 | 0.1 | GO:2000210 | positive regulation of anoikis(GO:2000210) |
| 0.0 | 0.1 | GO:0097698 | telomere maintenance via base-excision repair(GO:0097698) |
| 0.0 | 0.1 | GO:0042699 | follicle-stimulating hormone signaling pathway(GO:0042699) |
| 0.0 | 0.2 | GO:0006880 | intracellular sequestering of iron ion(GO:0006880) sequestering of iron ion(GO:0097577) |
| 0.0 | 0.3 | GO:2000480 | negative regulation of cAMP-dependent protein kinase activity(GO:2000480) |
| 0.0 | 0.1 | GO:0033152 | immunoglobulin V(D)J recombination(GO:0033152) |
| 0.0 | 0.1 | GO:1904798 | positive regulation of core promoter binding(GO:1904798) |
| 0.0 | 0.1 | GO:0019249 | lactate biosynthetic process(GO:0019249) |
| 0.0 | 0.3 | GO:0051964 | negative regulation of synapse assembly(GO:0051964) |
| 0.0 | 0.1 | GO:0007197 | adenylate cyclase-inhibiting G-protein coupled acetylcholine receptor signaling pathway(GO:0007197) |
| 0.0 | 0.3 | GO:0008228 | opsonization(GO:0008228) |
| 0.0 | 0.2 | GO:0006449 | regulation of translational termination(GO:0006449) |
| 0.0 | 0.2 | GO:0001886 | endothelial cell morphogenesis(GO:0001886) |
| 0.0 | 0.2 | GO:2000623 | regulation of nuclear-transcribed mRNA catabolic process, nonsense-mediated decay(GO:2000622) negative regulation of nuclear-transcribed mRNA catabolic process, nonsense-mediated decay(GO:2000623) |
| 0.0 | 0.1 | GO:0042539 | hypotonic salinity response(GO:0042539) cellular hypotonic salinity response(GO:0071477) |
| 0.0 | 0.3 | GO:0035855 | megakaryocyte development(GO:0035855) |
| 0.0 | 0.1 | GO:0019348 | dolichol metabolic process(GO:0019348) |
| 0.0 | 0.1 | GO:0048251 | elastic fiber assembly(GO:0048251) |
| 0.0 | 0.1 | GO:0042905 | 9-cis-retinoic acid biosynthetic process(GO:0042904) 9-cis-retinoic acid metabolic process(GO:0042905) |
| 0.0 | 0.2 | GO:0019800 | peptide cross-linking via chondroitin 4-sulfate glycosaminoglycan(GO:0019800) |
| 0.0 | 0.3 | GO:0001556 | oocyte maturation(GO:0001556) |
| 0.0 | 0.3 | GO:0060972 | left/right pattern formation(GO:0060972) |
Gene overrepresentation in cellular component category:
| Log-likelihood per target | Total log-likelihood | Term | Description |
|---|---|---|---|
| 0.1 | 3.2 | GO:0031265 | CD95 death-inducing signaling complex(GO:0031265) |
| 0.1 | 0.5 | GO:0065010 | extracellular membrane-bounded organelle(GO:0065010) |
| 0.0 | 0.2 | GO:0008043 | intracellular ferritin complex(GO:0008043) ferritin complex(GO:0070288) |
| 0.0 | 0.2 | GO:0097209 | epidermal lamellar body(GO:0097209) |
| 0.0 | 0.2 | GO:0072487 | MSL complex(GO:0072487) |
| 0.0 | 0.3 | GO:0044292 | dendrite terminus(GO:0044292) |
| 0.0 | 0.1 | GO:0033185 | dolichol-phosphate-mannose synthase complex(GO:0033185) |
| 0.0 | 0.1 | GO:0032127 | dense core granule membrane(GO:0032127) |
| 0.0 | 0.1 | GO:0032807 | DNA ligase IV complex(GO:0032807) |
| 0.0 | 0.3 | GO:0031618 | nuclear pericentric heterochromatin(GO:0031618) |
| 0.0 | 1.5 | GO:0015030 | Cajal body(GO:0015030) |
| 0.0 | 0.1 | GO:0032280 | symmetric synapse(GO:0032280) |
| 0.0 | 0.1 | GO:0071953 | elastic fiber(GO:0071953) |
| 0.0 | 0.2 | GO:0005577 | fibrinogen complex(GO:0005577) |
| 0.0 | 0.0 | GO:0048269 | methionine adenosyltransferase complex(GO:0048269) |
| 0.0 | 0.1 | GO:0070449 | elongin complex(GO:0070449) |
| 0.0 | 1.0 | GO:0010494 | cytoplasmic stress granule(GO:0010494) |
Gene overrepresentation in molecular function category:
| Log-likelihood per target | Total log-likelihood | Term | Description |
|---|---|---|---|
| 0.4 | 1.2 | GO:0008859 | exoribonuclease II activity(GO:0008859) |
| 0.2 | 1.2 | GO:0046538 | bisphosphoglycerate mutase activity(GO:0004082) phosphoglycerate mutase activity(GO:0004619) 2,3-bisphosphoglycerate-dependent phosphoglycerate mutase activity(GO:0046538) |
| 0.1 | 2.1 | GO:0045236 | CXCR chemokine receptor binding(GO:0045236) |
| 0.1 | 0.4 | GO:0042008 | interleukin-18 receptor activity(GO:0042008) |
| 0.1 | 3.2 | GO:0097200 | cysteine-type endopeptidase activity involved in execution phase of apoptosis(GO:0097200) |
| 0.1 | 0.3 | GO:0001601 | peptide YY receptor activity(GO:0001601) |
| 0.1 | 0.2 | GO:0004963 | follicle-stimulating hormone receptor activity(GO:0004963) |
| 0.1 | 0.5 | GO:0004035 | alkaline phosphatase activity(GO:0004035) |
| 0.1 | 0.7 | GO:0038049 | transcription factor activity, ligand-activated RNA polymerase II transcription factor binding(GO:0038049) |
| 0.0 | 0.1 | GO:0042284 | sphingolipid delta-4 desaturase activity(GO:0042284) |
| 0.0 | 0.1 | GO:0005135 | interleukin-3 receptor binding(GO:0005135) |
| 0.0 | 0.3 | GO:0004468 | lysine N-acetyltransferase activity, acting on acetyl phosphate as donor(GO:0004468) |
| 0.0 | 0.4 | GO:0042731 | PH domain binding(GO:0042731) |
| 0.0 | 0.2 | GO:0031544 | peptidyl-proline 3-dioxygenase activity(GO:0031544) |
| 0.0 | 0.4 | GO:0070053 | thrombospondin receptor activity(GO:0070053) |
| 0.0 | 0.3 | GO:0001042 | RNA polymerase I core binding(GO:0001042) |
| 0.0 | 0.1 | GO:0004668 | protein-arginine deiminase activity(GO:0004668) |
| 0.0 | 0.4 | GO:1902282 | voltage-gated potassium channel activity involved in ventricular cardiac muscle cell action potential repolarization(GO:1902282) |
| 0.0 | 0.1 | GO:0004582 | dolichyl-phosphate beta-D-mannosyltransferase activity(GO:0004582) |
| 0.0 | 0.1 | GO:0030348 | syntaxin-3 binding(GO:0030348) |
| 0.0 | 0.1 | GO:0004556 | alpha-amylase activity(GO:0004556) |
| 0.0 | 0.2 | GO:0035368 | selenocysteine insertion sequence binding(GO:0035368) |
| 0.0 | 0.1 | GO:1990763 | arrestin family protein binding(GO:1990763) |
| 0.0 | 1.1 | GO:0035035 | histone acetyltransferase binding(GO:0035035) |
| 0.0 | 0.3 | GO:0032183 | SUMO binding(GO:0032183) |
| 0.0 | 0.3 | GO:0016500 | protein-hormone receptor activity(GO:0016500) |
| 0.0 | 0.2 | GO:0004322 | ferroxidase activity(GO:0004322) oxidoreductase activity, oxidizing metal ions, oxygen as acceptor(GO:0016724) |
| 0.0 | 0.4 | GO:0019871 | sodium channel inhibitor activity(GO:0019871) |
| 0.0 | 0.7 | GO:0005545 | 1-phosphatidylinositol binding(GO:0005545) |
| 0.0 | 0.1 | GO:0004045 | aminoacyl-tRNA hydrolase activity(GO:0004045) |
| 0.0 | 0.1 | GO:0008311 | double-stranded DNA 3'-5' exodeoxyribonuclease activity(GO:0008311) |
| 0.0 | 0.1 | GO:0003910 | DNA ligase (ATP) activity(GO:0003910) |
| 0.0 | 0.3 | GO:0004862 | cAMP-dependent protein kinase inhibitor activity(GO:0004862) |
| 0.0 | 0.3 | GO:0008432 | JUN kinase binding(GO:0008432) |
Gene overrepresentation in curated gene sets: canonical pathways category:
| Log-likelihood per target | Total log-likelihood | Term | Description |
|---|---|---|---|
| 0.1 | 3.2 | SA FAS SIGNALING | The TNF-type receptor Fas induces apoptosis on ligand binding. |
| 0.0 | 0.5 | PID ANTHRAX PATHWAY | Cellular roles of Anthrax toxin |
| 0.0 | 1.2 | PID P38 ALPHA BETA DOWNSTREAM PATHWAY | Signaling mediated by p38-alpha and p38-beta |
Gene overrepresentation in curated gene sets: REACTOME pathways category:
| Log-likelihood per target | Total log-likelihood | Term | Description |
|---|---|---|---|
| 0.1 | 3.2 | REACTOME EXTRINSIC PATHWAY FOR APOPTOSIS | Genes involved in Extrinsic Pathway for Apoptosis |
| 0.0 | 0.7 | REACTOME RECEPTOR LIGAND BINDING INITIATES THE SECOND PROTEOLYTIC CLEAVAGE OF NOTCH RECEPTOR | Genes involved in Receptor-ligand binding initiates the second proteolytic cleavage of Notch receptor |
| 0.0 | 1.0 | REACTOME G0 AND EARLY G1 | Genes involved in G0 and Early G1 |
| 0.0 | 0.4 | REACTOME HORMONE LIGAND BINDING RECEPTORS | Genes involved in Hormone ligand-binding receptors |
| 0.0 | 1.2 | REACTOME ERK MAPK TARGETS | Genes involved in ERK/MAPK targets |
| 0.0 | 0.7 | REACTOME SIGNAL REGULATORY PROTEIN SIRP FAMILY INTERACTIONS | Genes involved in Signal regulatory protein (SIRP) family interactions |
| 0.0 | 1.2 | REACTOME INTERFERON ALPHA BETA SIGNALING | Genes involved in Interferon alpha/beta signaling |