Project
Inflammatory response time course, HUVEC (Wada, 2009)
Navigation
Downloads
Results for GLIS1
Z-value: 0.11
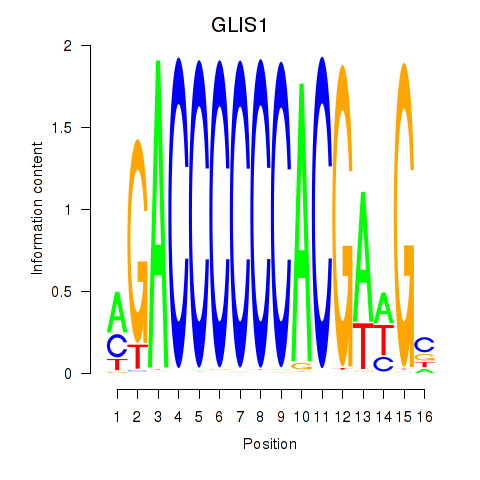
Motif logo
Transcription factors associated with GLIS1
| Gene Symbol | Gene ID | Gene Info |
|---|---|---|
|
GLIS1
|
ENSG00000174332.5 | GLIS1 |
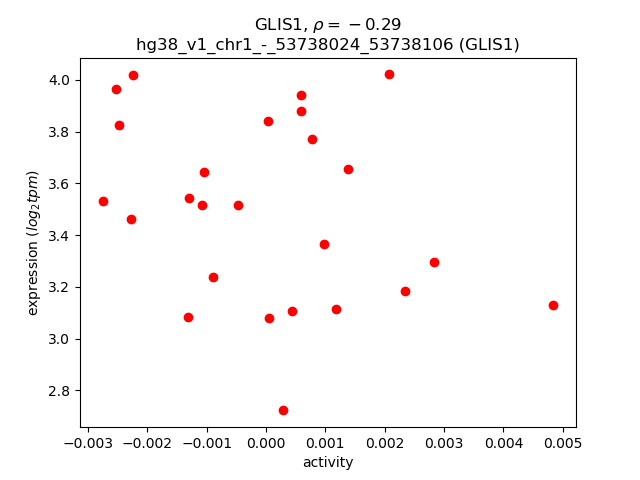
Activity-expression correlation:
| Gene | Promoter | Pearson corr. coef. | P-value | Plot |
|---|---|---|---|---|
| GLIS1 | hg38_v1_chr1_-_53738024_53738106 | -0.29 | 1.5e-01 | Click! |
Activity profile of GLIS1 motif
Sorted Z-values of GLIS1 motif
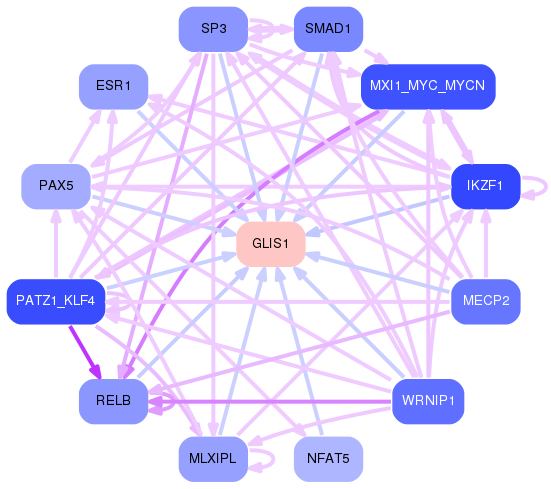
Network of associatons between targets according to the STRING database.

First level regulatory network of GLIS1
| Promoter | Score | Transcript | Gene | Gene Info |
|---|---|---|---|---|
| chr7_+_107044689 | 0.38 |
ENST00000265717.5
|
PRKAR2B
|
protein kinase cAMP-dependent type II regulatory subunit beta |
| chr16_+_58025745 | 0.11 |
ENST00000219271.4
|
MMP15
|
matrix metallopeptidase 15 |
| chr11_+_68903849 | 0.10 |
ENST00000675615.1
ENST00000255078.8 |
IGHMBP2
|
immunoglobulin mu DNA binding protein 2 |
| chr11_-_68903796 | 0.08 |
ENST00000362034.7
|
MRPL21
|
mitochondrial ribosomal protein L21 |
| chr18_+_11751467 | 0.05 |
ENST00000535121.5
|
GNAL
|
G protein subunit alpha L |
| chr19_-_49325181 | 0.05 |
ENST00000454748.7
ENST00000335875.9 ENST00000598828.1 |
SLC6A16
|
solute carrier family 6 member 16 |
| chr18_+_11751494 | 0.05 |
ENST00000269162.9
|
GNAL
|
G protein subunit alpha L |
| chr18_-_63158208 | 0.05 |
ENST00000678301.1
|
BCL2
|
BCL2 apoptosis regulator |
| chr19_-_41959266 | 0.01 |
ENST00000600292.5
ENST00000601078.5 ENST00000601891.5 ENST00000222008.11 |
RABAC1
|
Rab acceptor 1 |
Gene Ontology Analysis
Gene overrepresentation in biological process category:
| Log-likelihood per target | Total log-likelihood | Term | Description |
|---|---|---|---|
| 0.1 | 0.4 | GO:0097338 | response to clozapine(GO:0097338) |
| 0.0 | 0.0 | GO:0043375 | negative regulation of cellular pH reduction(GO:0032848) CD8-positive, alpha-beta T cell lineage commitment(GO:0043375) negative regulation of retinal cell programmed cell death(GO:0046671) |
Gene overrepresentation in cellular component category:
| Log-likelihood per target | Total log-likelihood | Term | Description |
|---|---|---|---|
| 0.0 | 0.4 | GO:0005952 | cAMP-dependent protein kinase complex(GO:0005952) |
Gene overrepresentation in molecular function category:
| Log-likelihood per target | Total log-likelihood | Term | Description |
|---|---|---|---|
| 0.0 | 0.4 | GO:0008603 | cAMP-dependent protein kinase regulator activity(GO:0008603) |
| 0.0 | 0.1 | GO:0043141 | ATP-dependent 5'-3' DNA helicase activity(GO:0043141) |
Gene overrepresentation in curated gene sets: REACTOME pathways category:
| Log-likelihood per target | Total log-likelihood | Term | Description |
|---|---|---|---|
| 0.0 | 0.1 | REACTOME ADENYLATE CYCLASE ACTIVATING PATHWAY | Genes involved in Adenylate cyclase activating pathway |
| 0.0 | 0.4 | REACTOME PKA MEDIATED PHOSPHORYLATION OF CREB | Genes involved in PKA-mediated phosphorylation of CREB |