Project
Inflammatory response time course, HUVEC (Wada, 2009)
Navigation
Downloads
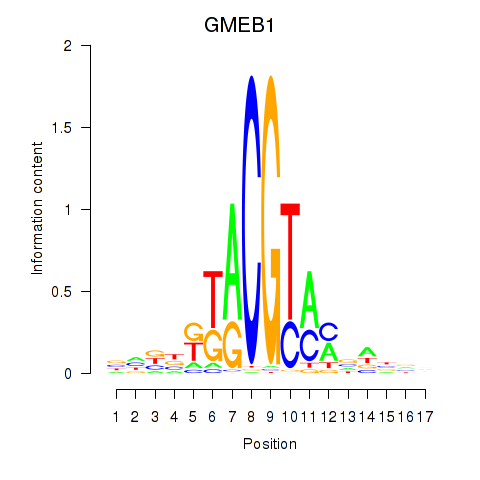
Results for GMEB1
Z-value: 1.18
Motif logo
Transcription factors associated with GMEB1
| Gene Symbol | Gene ID | Gene Info |
|---|---|---|
|
GMEB1
|
ENSG00000162419.13 | GMEB1 |
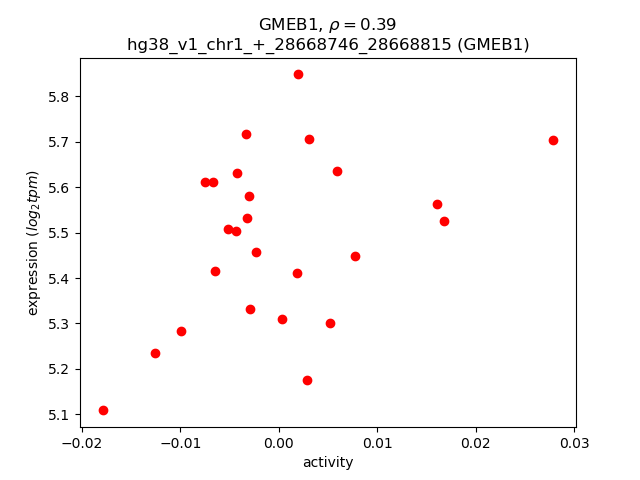
Activity-expression correlation:
| Gene | Promoter | Pearson corr. coef. | P-value | Plot |
|---|---|---|---|---|
| GMEB1 | hg38_v1_chr1_+_28668746_28668815 | 0.39 | 5.2e-02 | Click! |
Activity profile of GMEB1 motif
Sorted Z-values of GMEB1 motif
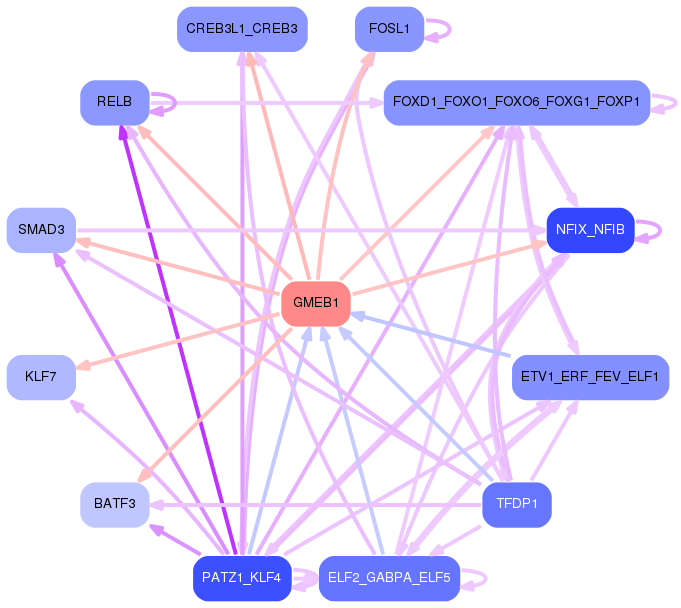
Network of associatons between targets according to the STRING database.

First level regulatory network of GMEB1
Gene Ontology Analysis
Gene overrepresentation in biological process category:
| Log-likelihood per target | Total log-likelihood | Term | Description |
|---|---|---|---|
| 1.7 | 5.2 | GO:0046967 | cytosol to ER transport(GO:0046967) |
| 0.7 | 2.6 | GO:0000738 | DNA catabolic process, exonucleolytic(GO:0000738) |
| 0.6 | 2.6 | GO:0046900 | tetrahydrofolylpolyglutamate metabolic process(GO:0046900) |
| 0.6 | 8.4 | GO:0046940 | nucleoside monophosphate phosphorylation(GO:0046940) |
| 0.6 | 1.9 | GO:0046521 | sphingoid catabolic process(GO:0046521) |
| 0.6 | 1.7 | GO:0048250 | mitochondrial iron ion transport(GO:0048250) |
| 0.5 | 1.9 | GO:0034093 | positive regulation of maintenance of sister chromatid cohesion(GO:0034093) positive regulation of maintenance of mitotic sister chromatid cohesion(GO:0034184) |
| 0.4 | 2.6 | GO:0035617 | stress granule disassembly(GO:0035617) |
| 0.4 | 1.1 | GO:0097477 | lateral motor column neuron migration(GO:0097477) |
| 0.4 | 1.1 | GO:0007057 | spindle assembly involved in female meiosis I(GO:0007057) |
| 0.4 | 1.1 | GO:2000276 | negative regulation of oxidative phosphorylation uncoupler activity(GO:2000276) |
| 0.4 | 1.8 | GO:1901503 | ether lipid biosynthetic process(GO:0008611) glycerol ether biosynthetic process(GO:0046504) ether biosynthetic process(GO:1901503) |
| 0.3 | 1.4 | GO:1904924 | negative regulation of mitophagy in response to mitochondrial depolarization(GO:1904924) |
| 0.3 | 2.9 | GO:0038110 | interleukin-2-mediated signaling pathway(GO:0038110) |
| 0.3 | 2.2 | GO:0036018 | cellular response to erythropoietin(GO:0036018) |
| 0.3 | 0.3 | GO:2000793 | cell proliferation involved in heart valve development(GO:2000793) |
| 0.3 | 1.2 | GO:0009236 | cobalamin biosynthetic process(GO:0009236) |
| 0.3 | 1.7 | GO:0007296 | vitellogenesis(GO:0007296) |
| 0.3 | 0.8 | GO:1901994 | meiotic cell cycle phase transition(GO:0044771) regulation of meiotic cell cycle phase transition(GO:1901993) negative regulation of meiotic cell cycle phase transition(GO:1901994) |
| 0.3 | 0.8 | GO:1901536 | regulation of DNA demethylation(GO:1901535) negative regulation of DNA demethylation(GO:1901536) |
| 0.3 | 1.1 | GO:0070981 | L-asparagine biosynthetic process(GO:0070981) L-asparagine metabolic process(GO:0070982) |
| 0.3 | 1.9 | GO:0006990 | positive regulation of transcription from RNA polymerase II promoter involved in unfolded protein response(GO:0006990) |
| 0.3 | 1.3 | GO:0003068 | age-dependent response to oxidative stress(GO:0001306) age-dependent response to reactive oxygen species(GO:0001315) regulation of systemic arterial blood pressure by acetylcholine(GO:0003068) vasodilation by acetylcholine involved in regulation of systemic arterial blood pressure(GO:0003069) regulation of systemic arterial blood pressure by neurotransmitter(GO:0003070) age-dependent general metabolic decline(GO:0007571) |
| 0.3 | 2.0 | GO:0014916 | regulation of lung blood pressure(GO:0014916) |
| 0.2 | 2.0 | GO:0002457 | T cell antigen processing and presentation(GO:0002457) |
| 0.2 | 1.5 | GO:2000418 | positive regulation of eosinophil migration(GO:2000418) |
| 0.2 | 1.2 | GO:0009212 | dTTP biosynthetic process(GO:0006235) pyrimidine deoxyribonucleoside triphosphate biosynthetic process(GO:0009212) |
| 0.2 | 2.5 | GO:0031119 | tRNA pseudouridine synthesis(GO:0031119) |
| 0.2 | 2.2 | GO:0002480 | antigen processing and presentation of exogenous peptide antigen via MHC class I, TAP-independent(GO:0002480) |
| 0.2 | 1.3 | GO:0021564 | regulation of systemic arterial blood pressure by baroreceptor feedback(GO:0003025) vagus nerve development(GO:0021564) |
| 0.2 | 1.3 | GO:0007079 | mitotic chromosome movement towards spindle pole(GO:0007079) |
| 0.2 | 0.8 | GO:0003342 | proepicardium development(GO:0003342) septum transversum development(GO:0003343) |
| 0.2 | 0.8 | GO:0006272 | leading strand elongation(GO:0006272) |
| 0.2 | 0.6 | GO:0051877 | pigment granule aggregation in cell center(GO:0051877) |
| 0.2 | 0.9 | GO:0006177 | GMP biosynthetic process(GO:0006177) |
| 0.2 | 1.2 | GO:0051754 | meiotic sister chromatid cohesion, centromeric(GO:0051754) |
| 0.2 | 0.5 | GO:0090176 | microtubule cytoskeleton organization involved in establishment of planar polarity(GO:0090176) |
| 0.2 | 0.7 | GO:1905224 | clathrin-coated pit assembly(GO:1905224) |
| 0.2 | 0.7 | GO:0046947 | hydroxylysine metabolic process(GO:0046946) hydroxylysine biosynthetic process(GO:0046947) |
| 0.2 | 2.5 | GO:0035457 | cellular response to interferon-alpha(GO:0035457) |
| 0.2 | 0.7 | GO:0072717 | cellular response to actinomycin D(GO:0072717) |
| 0.2 | 0.5 | GO:0000964 | mitochondrial RNA 5'-end processing(GO:0000964) |
| 0.2 | 0.8 | GO:0099590 | neurotransmitter receptor internalization(GO:0099590) |
| 0.2 | 0.6 | GO:2000393 | negative regulation of lamellipodium morphogenesis(GO:2000393) |
| 0.2 | 1.4 | GO:2001206 | positive regulation of osteoclast development(GO:2001206) |
| 0.2 | 0.6 | GO:1903288 | positive regulation of potassium ion import(GO:1903288) |
| 0.2 | 1.5 | GO:0035694 | mitochondrial protein catabolic process(GO:0035694) |
| 0.1 | 0.9 | GO:0006041 | glucosamine metabolic process(GO:0006041) |
| 0.1 | 0.7 | GO:0046116 | queuosine biosynthetic process(GO:0008616) queuosine metabolic process(GO:0046116) |
| 0.1 | 1.0 | GO:0006154 | adenosine catabolic process(GO:0006154) inosine biosynthetic process(GO:0046103) |
| 0.1 | 0.7 | GO:0043128 | regulation of 1-phosphatidylinositol 4-kinase activity(GO:0043126) positive regulation of 1-phosphatidylinositol 4-kinase activity(GO:0043128) |
| 0.1 | 0.6 | GO:0009957 | epidermal cell fate specification(GO:0009957) |
| 0.1 | 0.9 | GO:2000234 | positive regulation of ribosome biogenesis(GO:0090070) positive regulation of rRNA processing(GO:2000234) |
| 0.1 | 0.7 | GO:0071934 | thiamine transmembrane transport(GO:0071934) |
| 0.1 | 1.4 | GO:0070212 | protein poly-ADP-ribosylation(GO:0070212) |
| 0.1 | 0.8 | GO:1903936 | cellular response to sodium arsenite(GO:1903936) |
| 0.1 | 0.3 | GO:0018963 | phthalate metabolic process(GO:0018963) |
| 0.1 | 0.4 | GO:0031393 | negative regulation of prostaglandin biosynthetic process(GO:0031393) |
| 0.1 | 1.5 | GO:0006657 | CDP-choline pathway(GO:0006657) |
| 0.1 | 0.7 | GO:0032713 | negative regulation of interleukin-4 production(GO:0032713) |
| 0.1 | 0.4 | GO:0002071 | glandular epithelial cell maturation(GO:0002071) |
| 0.1 | 0.4 | GO:1903939 | negative regulation of histone H3-K9 dimethylation(GO:1900110) regulation of TORC2 signaling(GO:1903939) |
| 0.1 | 0.7 | GO:0061762 | CAMKK-AMPK signaling cascade(GO:0061762) |
| 0.1 | 0.5 | GO:1902528 | regulation of protein linear polyubiquitination(GO:1902528) positive regulation of protein linear polyubiquitination(GO:1902530) |
| 0.1 | 0.4 | GO:0009438 | methylglyoxal metabolic process(GO:0009438) |
| 0.1 | 1.0 | GO:0090166 | Golgi disassembly(GO:0090166) |
| 0.1 | 0.4 | GO:0090271 | positive regulation of fibroblast growth factor production(GO:0090271) |
| 0.1 | 0.4 | GO:0035281 | pre-miRNA export from nucleus(GO:0035281) |
| 0.1 | 0.4 | GO:0006393 | termination of mitochondrial transcription(GO:0006393) |
| 0.1 | 0.4 | GO:0007518 | myoblast fate determination(GO:0007518) |
| 0.1 | 0.4 | GO:0031959 | mineralocorticoid receptor signaling pathway(GO:0031959) positive regulation of skeletal muscle satellite cell proliferation(GO:1902724) positive regulation of growth factor dependent skeletal muscle satellite cell proliferation(GO:1902728) |
| 0.1 | 0.8 | GO:0051970 | negative regulation of transmission of nerve impulse(GO:0051970) |
| 0.1 | 0.5 | GO:0000961 | negative regulation of mitochondrial RNA catabolic process(GO:0000961) |
| 0.1 | 0.9 | GO:1900748 | positive regulation of vascular endothelial growth factor signaling pathway(GO:1900748) |
| 0.1 | 0.5 | GO:0051866 | general adaptation syndrome(GO:0051866) |
| 0.1 | 0.5 | GO:2000687 | negative regulation of rubidium ion transport(GO:2000681) negative regulation of rubidium ion transmembrane transporter activity(GO:2000687) |
| 0.1 | 1.2 | GO:0071394 | cellular response to testosterone stimulus(GO:0071394) |
| 0.1 | 0.6 | GO:0010836 | negative regulation of protein ADP-ribosylation(GO:0010836) |
| 0.1 | 0.4 | GO:0002268 | follicular dendritic cell differentiation(GO:0002268) |
| 0.1 | 0.9 | GO:0007506 | gonadal mesoderm development(GO:0007506) |
| 0.1 | 0.3 | GO:0021526 | medial motor column neuron differentiation(GO:0021526) |
| 0.1 | 0.5 | GO:0097056 | selenocysteinyl-tRNA(Sec) biosynthetic process(GO:0097056) |
| 0.1 | 0.8 | GO:0006003 | fructose 2,6-bisphosphate metabolic process(GO:0006003) |
| 0.1 | 3.3 | GO:0003351 | epithelial cilium movement(GO:0003351) sperm capacitation(GO:0048240) |
| 0.1 | 0.6 | GO:1903435 | positive regulation of constitutive secretory pathway(GO:1903435) |
| 0.1 | 0.4 | GO:0034239 | macrophage fusion(GO:0034238) regulation of macrophage fusion(GO:0034239) positive regulation of macrophage fusion(GO:0034241) |
| 0.1 | 0.4 | GO:0061073 | ciliary body morphogenesis(GO:0061073) |
| 0.1 | 0.6 | GO:0051708 | intracellular transport of viral protein in host cell(GO:0019060) symbiont intracellular protein transport in host(GO:0030581) intracellular protein transport in other organism involved in symbiotic interaction(GO:0051708) |
| 0.1 | 0.4 | GO:0046166 | glyceraldehyde-3-phosphate biosynthetic process(GO:0046166) |
| 0.1 | 0.3 | GO:0006391 | transcription initiation from mitochondrial promoter(GO:0006391) |
| 0.1 | 0.3 | GO:0002769 | natural killer cell inhibitory signaling pathway(GO:0002769) |
| 0.1 | 0.4 | GO:1900085 | negative regulation of peptidyl-tyrosine autophosphorylation(GO:1900085) negative regulation of inward rectifier potassium channel activity(GO:1903609) |
| 0.1 | 0.8 | GO:0035879 | plasma membrane lactate transport(GO:0035879) |
| 0.1 | 0.3 | GO:0006059 | hexitol metabolic process(GO:0006059) |
| 0.1 | 0.4 | GO:0048073 | regulation of eye pigmentation(GO:0048073) |
| 0.1 | 1.1 | GO:0002934 | desmosome organization(GO:0002934) |
| 0.1 | 1.3 | GO:1904869 | regulation of protein localization to Cajal body(GO:1904869) positive regulation of protein localization to Cajal body(GO:1904871) |
| 0.1 | 0.3 | GO:0019858 | cytosine metabolic process(GO:0019858) |
| 0.1 | 1.8 | GO:0048742 | regulation of skeletal muscle fiber development(GO:0048742) |
| 0.1 | 0.8 | GO:0031444 | slow-twitch skeletal muscle fiber contraction(GO:0031444) |
| 0.1 | 0.1 | GO:2001184 | positive regulation of interleukin-12 secretion(GO:2001184) |
| 0.1 | 0.3 | GO:0033313 | meiotic cell cycle checkpoint(GO:0033313) |
| 0.1 | 0.3 | GO:0048808 | male genitalia morphogenesis(GO:0048808) male anatomical structure morphogenesis(GO:0090598) |
| 0.1 | 0.9 | GO:0051013 | microtubule severing(GO:0051013) |
| 0.1 | 1.3 | GO:0060033 | anatomical structure regression(GO:0060033) |
| 0.1 | 0.2 | GO:0044205 | 'de novo' UMP biosynthetic process(GO:0044205) |
| 0.1 | 0.3 | GO:1903774 | positive regulation of viral budding via host ESCRT complex(GO:1903774) |
| 0.1 | 0.8 | GO:0061732 | mitochondrial acetyl-CoA biosynthetic process from pyruvate(GO:0061732) |
| 0.1 | 0.3 | GO:1900154 | regulation of bone trabecula formation(GO:1900154) negative regulation of bone trabecula formation(GO:1900155) |
| 0.1 | 0.9 | GO:0006526 | arginine biosynthetic process(GO:0006526) |
| 0.1 | 2.8 | GO:0043011 | myeloid dendritic cell differentiation(GO:0043011) |
| 0.1 | 0.4 | GO:0006287 | base-excision repair, gap-filling(GO:0006287) |
| 0.1 | 0.3 | GO:2000435 | regulation of protein neddylation(GO:2000434) negative regulation of protein neddylation(GO:2000435) |
| 0.1 | 2.3 | GO:0031581 | hemidesmosome assembly(GO:0031581) |
| 0.1 | 0.3 | GO:0015808 | L-alanine transport(GO:0015808) |
| 0.1 | 0.3 | GO:0006045 | N-acetylglucosamine biosynthetic process(GO:0006045) glucosamine-containing compound biosynthetic process(GO:1901073) |
| 0.1 | 0.9 | GO:0000012 | single strand break repair(GO:0000012) |
| 0.1 | 0.2 | GO:0006267 | pre-replicative complex assembly involved in nuclear cell cycle DNA replication(GO:0006267) pre-replicative complex assembly(GO:0036388) pre-replicative complex assembly involved in cell cycle DNA replication(GO:1902299) |
| 0.1 | 0.3 | GO:0043605 | cellular amide catabolic process(GO:0043605) |
| 0.1 | 0.4 | GO:0071034 | CUT catabolic process(GO:0071034) CUT metabolic process(GO:0071043) |
| 0.1 | 0.2 | GO:0048560 | establishment of anatomical structure orientation(GO:0048560) |
| 0.1 | 0.3 | GO:0030200 | heparan sulfate proteoglycan catabolic process(GO:0030200) |
| 0.1 | 0.5 | GO:0007000 | nucleolus organization(GO:0007000) |
| 0.1 | 1.0 | GO:0015693 | magnesium ion transport(GO:0015693) |
| 0.1 | 1.6 | GO:0006206 | pyrimidine nucleobase metabolic process(GO:0006206) |
| 0.1 | 2.5 | GO:0030214 | hyaluronan catabolic process(GO:0030214) |
| 0.1 | 0.4 | GO:0038170 | somatostatin receptor signaling pathway(GO:0038169) somatostatin signaling pathway(GO:0038170) |
| 0.1 | 0.3 | GO:1902775 | mitochondrial large ribosomal subunit assembly(GO:1902775) |
| 0.1 | 0.2 | GO:1901355 | response to rapamycin(GO:1901355) |
| 0.1 | 0.5 | GO:0033216 | ferric iron import(GO:0033216) ferric iron import into cell(GO:0097461) ferric iron import across plasma membrane(GO:0098706) |
| 0.1 | 0.3 | GO:0090156 | negative regulation of sphingolipid biosynthetic process(GO:0090155) cellular sphingolipid homeostasis(GO:0090156) negative regulation of ceramide biosynthetic process(GO:1900060) |
| 0.1 | 0.4 | GO:0097411 | hypoxia-inducible factor-1alpha signaling pathway(GO:0097411) |
| 0.1 | 0.8 | GO:0035845 | photoreceptor cell outer segment organization(GO:0035845) retinal cone cell differentiation(GO:0042670) retinal cone cell development(GO:0046549) |
| 0.1 | 0.2 | GO:0046452 | dihydrofolate metabolic process(GO:0046452) |
| 0.1 | 0.5 | GO:0090074 | negative regulation of protein homodimerization activity(GO:0090074) |
| 0.1 | 0.7 | GO:0017182 | peptidyl-diphthamide metabolic process(GO:0017182) peptidyl-diphthamide biosynthetic process from peptidyl-histidine(GO:0017183) |
| 0.1 | 1.1 | GO:0032329 | serine transport(GO:0032329) |
| 0.1 | 0.2 | GO:0060382 | regulation of DNA strand elongation(GO:0060382) |
| 0.1 | 0.7 | GO:0010756 | positive regulation of plasminogen activation(GO:0010756) |
| 0.1 | 0.2 | GO:0021503 | neural fold bending(GO:0021503) |
| 0.1 | 0.5 | GO:0048539 | bone marrow development(GO:0048539) |
| 0.1 | 0.4 | GO:0000727 | double-strand break repair via break-induced replication(GO:0000727) |
| 0.1 | 0.2 | GO:0001732 | formation of cytoplasmic translation initiation complex(GO:0001732) |
| 0.1 | 0.1 | GO:0014042 | positive regulation of neuron maturation(GO:0014042) |
| 0.1 | 0.4 | GO:0060988 | lipid tube assembly(GO:0060988) |
| 0.1 | 0.6 | GO:1901552 | positive regulation of endothelial cell development(GO:1901552) positive regulation of establishment of endothelial barrier(GO:1903142) |
| 0.1 | 0.2 | GO:1902905 | positive regulation of fibril organization(GO:1902905) |
| 0.1 | 1.0 | GO:0000478 | endonucleolytic cleavage involved in rRNA processing(GO:0000478) |
| 0.1 | 1.0 | GO:0032625 | interleukin-21 production(GO:0032625) interleukin-21 secretion(GO:0072619) |
| 0.1 | 0.5 | GO:0002098 | tRNA wobble uridine modification(GO:0002098) |
| 0.1 | 0.2 | GO:1903722 | regulation of centriole elongation(GO:1903722) |
| 0.1 | 0.1 | GO:0048859 | formation of anatomical boundary(GO:0048859) |
| 0.1 | 1.3 | GO:0071294 | cellular response to zinc ion(GO:0071294) |
| 0.1 | 0.5 | GO:0043696 | dedifferentiation(GO:0043696) cell dedifferentiation(GO:0043697) |
| 0.1 | 1.0 | GO:0006089 | lactate metabolic process(GO:0006089) |
| 0.1 | 0.1 | GO:1903348 | positive regulation of bicellular tight junction assembly(GO:1903348) |
| 0.1 | 0.1 | GO:0010847 | regulation of chromatin assembly(GO:0010847) |
| 0.1 | 1.5 | GO:0000462 | maturation of SSU-rRNA from tricistronic rRNA transcript (SSU-rRNA, 5.8S rRNA, LSU-rRNA)(GO:0000462) |
| 0.1 | 1.0 | GO:0006002 | fructose 6-phosphate metabolic process(GO:0006002) |
| 0.1 | 1.1 | GO:0031573 | intra-S DNA damage checkpoint(GO:0031573) |
| 0.1 | 0.8 | GO:0019317 | fucose catabolic process(GO:0019317) L-fucose metabolic process(GO:0042354) L-fucose catabolic process(GO:0042355) |
| 0.1 | 0.1 | GO:0009138 | pyrimidine nucleoside diphosphate metabolic process(GO:0009138) |
| 0.1 | 0.4 | GO:0031860 | telomeric 3' overhang formation(GO:0031860) |
| 0.1 | 0.5 | GO:1902037 | negative regulation of hematopoietic stem cell differentiation(GO:1902037) |
| 0.1 | 0.2 | GO:0090290 | positive regulation of osteoclast proliferation(GO:0090290) |
| 0.1 | 0.3 | GO:0048254 | snoRNA localization(GO:0048254) |
| 0.1 | 0.2 | GO:0072344 | rescue of stalled ribosome(GO:0072344) |
| 0.1 | 0.4 | GO:0006620 | posttranslational protein targeting to membrane(GO:0006620) |
| 0.1 | 0.4 | GO:0052405 | negative regulation by host of symbiont molecular function(GO:0052405) |
| 0.1 | 0.2 | GO:0071596 | ubiquitin-dependent protein catabolic process via the N-end rule pathway(GO:0071596) |
| 0.1 | 0.4 | GO:0035995 | detection of muscle stretch(GO:0035995) |
| 0.1 | 0.6 | GO:0000491 | small nucleolar ribonucleoprotein complex assembly(GO:0000491) |
| 0.1 | 0.3 | GO:0002357 | defense response to tumor cell(GO:0002357) |
| 0.1 | 0.2 | GO:0070681 | glutaminyl-tRNAGln biosynthesis via transamidation(GO:0070681) |
| 0.1 | 0.5 | GO:0048280 | vesicle fusion with Golgi apparatus(GO:0048280) |
| 0.1 | 0.7 | GO:0030490 | maturation of SSU-rRNA(GO:0030490) |
| 0.1 | 0.6 | GO:0019919 | peptidyl-arginine methylation, to asymmetrical-dimethyl arginine(GO:0019919) |
| 0.1 | 0.5 | GO:0090160 | Golgi to lysosome transport(GO:0090160) |
| 0.1 | 0.2 | GO:1902869 | regulation of amacrine cell differentiation(GO:1902869) |
| 0.1 | 0.3 | GO:0061760 | antifungal innate immune response(GO:0061760) |
| 0.1 | 0.2 | GO:0045876 | positive regulation of sister chromatid cohesion(GO:0045876) |
| 0.0 | 0.0 | GO:1903625 | negative regulation of DNA catabolic process(GO:1903625) |
| 0.0 | 0.1 | GO:0002025 | vasodilation by norepinephrine-epinephrine involved in regulation of systemic arterial blood pressure(GO:0002025) |
| 0.0 | 0.1 | GO:0015788 | UDP-N-acetylglucosamine transport(GO:0015788) UDP-N-acetylglucosamine transmembrane transport(GO:1990569) |
| 0.0 | 0.2 | GO:0030961 | peptidyl-arginine hydroxylation(GO:0030961) |
| 0.0 | 0.5 | GO:1990034 | calcium ion export from cell(GO:1990034) |
| 0.0 | 0.2 | GO:0097039 | protein linear polyubiquitination(GO:0097039) |
| 0.0 | 0.2 | GO:0097680 | double-strand break repair via classical nonhomologous end joining(GO:0097680) |
| 0.0 | 0.1 | GO:0001546 | preantral ovarian follicle growth(GO:0001546) multi-layer follicle stage(GO:0048162) |
| 0.0 | 0.1 | GO:0001842 | neural fold formation(GO:0001842) |
| 0.0 | 0.3 | GO:0015811 | L-cystine transport(GO:0015811) |
| 0.0 | 0.4 | GO:1901164 | negative regulation of trophoblast cell migration(GO:1901164) |
| 0.0 | 0.6 | GO:0021540 | corpus callosum morphogenesis(GO:0021540) |
| 0.0 | 0.8 | GO:0034244 | negative regulation of transcription elongation from RNA polymerase II promoter(GO:0034244) |
| 0.0 | 0.4 | GO:0006189 | 'de novo' IMP biosynthetic process(GO:0006189) |
| 0.0 | 0.0 | GO:0071955 | recycling endosome to Golgi transport(GO:0071955) |
| 0.0 | 0.4 | GO:0043951 | negative regulation of cAMP-mediated signaling(GO:0043951) |
| 0.0 | 0.3 | GO:2000210 | positive regulation of anoikis(GO:2000210) |
| 0.0 | 0.5 | GO:0046951 | ketone body biosynthetic process(GO:0046951) |
| 0.0 | 0.9 | GO:0060712 | spongiotrophoblast layer development(GO:0060712) |
| 0.0 | 0.1 | GO:0006579 | amino-acid betaine catabolic process(GO:0006579) |
| 0.0 | 0.1 | GO:0033152 | immunoglobulin V(D)J recombination(GO:0033152) |
| 0.0 | 0.2 | GO:0071894 | histone H2B conserved C-terminal lysine ubiquitination(GO:0071894) |
| 0.0 | 0.3 | GO:0006627 | protein processing involved in protein targeting to mitochondrion(GO:0006627) |
| 0.0 | 0.2 | GO:1903070 | negative regulation of ER-associated ubiquitin-dependent protein catabolic process(GO:1903070) |
| 0.0 | 0.9 | GO:1902083 | negative regulation of peptidyl-cysteine S-nitrosylation(GO:1902083) |
| 0.0 | 0.2 | GO:0051684 | maintenance of Golgi location(GO:0051684) |
| 0.0 | 0.1 | GO:0060739 | bud outgrowth involved in lung branching(GO:0060447) mesenchymal-epithelial cell signaling involved in prostate gland development(GO:0060739) |
| 0.0 | 0.3 | GO:0014050 | negative regulation of glutamate secretion(GO:0014050) |
| 0.0 | 0.2 | GO:0007406 | negative regulation of neuroblast proliferation(GO:0007406) |
| 0.0 | 0.0 | GO:0060516 | primary prostatic bud elongation(GO:0060516) |
| 0.0 | 0.6 | GO:0071257 | cellular response to electrical stimulus(GO:0071257) |
| 0.0 | 0.7 | GO:0051964 | negative regulation of synapse assembly(GO:0051964) |
| 0.0 | 2.1 | GO:0006699 | bile acid biosynthetic process(GO:0006699) |
| 0.0 | 0.2 | GO:0035407 | histone H3-T11 phosphorylation(GO:0035407) |
| 0.0 | 0.2 | GO:0060011 | Sertoli cell proliferation(GO:0060011) |
| 0.0 | 0.2 | GO:0098904 | regulation of AV node cell action potential(GO:0098904) |
| 0.0 | 1.9 | GO:2000272 | negative regulation of receptor activity(GO:2000272) |
| 0.0 | 0.1 | GO:1990770 | positive regulation of eating behavior(GO:1904000) regulation of small intestine smooth muscle contraction(GO:1904347) positive regulation of small intestine smooth muscle contraction(GO:1904349) small intestine smooth muscle contraction(GO:1990770) |
| 0.0 | 1.0 | GO:0032201 | telomere maintenance via semi-conservative replication(GO:0032201) |
| 0.0 | 0.8 | GO:0002281 | macrophage activation involved in immune response(GO:0002281) |
| 0.0 | 1.0 | GO:0050901 | leukocyte tethering or rolling(GO:0050901) |
| 0.0 | 1.2 | GO:1903206 | negative regulation of hydrogen peroxide-induced cell death(GO:1903206) |
| 0.0 | 0.2 | GO:0002904 | positive regulation of B cell apoptotic process(GO:0002904) |
| 0.0 | 0.3 | GO:0002943 | tRNA dihydrouridine synthesis(GO:0002943) |
| 0.0 | 0.6 | GO:0006828 | manganese ion transport(GO:0006828) |
| 0.0 | 0.9 | GO:0032515 | negative regulation of phosphoprotein phosphatase activity(GO:0032515) |
| 0.0 | 0.2 | GO:0060157 | urinary bladder development(GO:0060157) |
| 0.0 | 0.4 | GO:0010739 | positive regulation of protein kinase A signaling(GO:0010739) |
| 0.0 | 0.3 | GO:0006203 | dGTP catabolic process(GO:0006203) |
| 0.0 | 0.4 | GO:0060052 | neurofilament cytoskeleton organization(GO:0060052) |
| 0.0 | 0.3 | GO:0021943 | formation of radial glial scaffolds(GO:0021943) |
| 0.0 | 0.9 | GO:0007171 | activation of transmembrane receptor protein tyrosine kinase activity(GO:0007171) |
| 0.0 | 0.3 | GO:0071361 | cellular response to ethanol(GO:0071361) |
| 0.0 | 0.5 | GO:0016576 | histone dephosphorylation(GO:0016576) |
| 0.0 | 0.2 | GO:0051025 | negative regulation of mRNA cleavage(GO:0031438) negative regulation of immunoglobulin secretion(GO:0051025) negative regulation of mRNA endonucleolytic cleavage involved in unfolded protein response(GO:1904721) |
| 0.0 | 0.6 | GO:0034199 | activation of protein kinase A activity(GO:0034199) |
| 0.0 | 0.1 | GO:0002317 | plasma cell differentiation(GO:0002317) |
| 0.0 | 0.3 | GO:0061052 | negative regulation of cell growth involved in cardiac muscle cell development(GO:0061052) |
| 0.0 | 0.2 | GO:2001271 | negative regulation of cysteine-type endopeptidase activity involved in execution phase of apoptosis(GO:2001271) |
| 0.0 | 0.2 | GO:0044034 | negative stranded viral RNA replication(GO:0039689) multi-organism biosynthetic process(GO:0044034) |
| 0.0 | 0.8 | GO:0006744 | ubiquinone biosynthetic process(GO:0006744) quinone biosynthetic process(GO:1901663) |
| 0.0 | 0.0 | GO:0036245 | cellular response to menadione(GO:0036245) |
| 0.0 | 0.1 | GO:0019348 | dolichol metabolic process(GO:0019348) |
| 0.0 | 0.1 | GO:0006049 | UDP-N-acetylglucosamine catabolic process(GO:0006049) |
| 0.0 | 0.3 | GO:0051121 | hepoxilin metabolic process(GO:0051121) hepoxilin biosynthetic process(GO:0051122) |
| 0.0 | 0.4 | GO:0090344 | negative regulation of cell aging(GO:0090344) |
| 0.0 | 0.7 | GO:0035493 | SNARE complex assembly(GO:0035493) |
| 0.0 | 0.4 | GO:0000290 | deadenylation-dependent decapping of nuclear-transcribed mRNA(GO:0000290) |
| 0.0 | 0.1 | GO:0014878 | response to electrical stimulus involved in regulation of muscle adaptation(GO:0014878) |
| 0.0 | 0.2 | GO:0016926 | protein desumoylation(GO:0016926) |
| 0.0 | 0.1 | GO:1902613 | regulation of anti-Mullerian hormone signaling pathway(GO:1902612) negative regulation of anti-Mullerian hormone signaling pathway(GO:1902613) anti-Mullerian hormone signaling pathway(GO:1990262) |
| 0.0 | 0.3 | GO:0046598 | positive regulation of viral entry into host cell(GO:0046598) |
| 0.0 | 0.1 | GO:0010793 | regulation of mRNA export from nucleus(GO:0010793) regulation of ribonucleoprotein complex localization(GO:2000197) |
| 0.0 | 0.3 | GO:0046498 | S-adenosylhomocysteine metabolic process(GO:0046498) |
| 0.0 | 0.2 | GO:0097428 | protein maturation by iron-sulfur cluster transfer(GO:0097428) |
| 0.0 | 0.1 | GO:0003245 | cardiac muscle tissue growth involved in heart morphogenesis(GO:0003245) |
| 0.0 | 0.1 | GO:1990022 | RNA polymerase II complex import to nucleus(GO:0044376) RNA polymerase III complex localization to nucleus(GO:1990022) |
| 0.0 | 0.1 | GO:0036265 | RNA (guanine-N7)-methylation(GO:0036265) rRNA (guanine-N7)-methylation(GO:0070476) |
| 0.0 | 0.8 | GO:0030488 | tRNA methylation(GO:0030488) |
| 0.0 | 0.6 | GO:0003334 | keratinocyte development(GO:0003334) |
| 0.0 | 0.1 | GO:2001013 | epithelial cell proliferation involved in renal tubule morphogenesis(GO:2001013) |
| 0.0 | 0.5 | GO:2000480 | negative regulation of cAMP-dependent protein kinase activity(GO:2000480) |
| 0.0 | 0.3 | GO:1903944 | regulation of hepatocyte apoptotic process(GO:1903943) negative regulation of hepatocyte apoptotic process(GO:1903944) |
| 0.0 | 0.3 | GO:0045059 | positive thymic T cell selection(GO:0045059) |
| 0.0 | 0.7 | GO:0000470 | maturation of LSU-rRNA(GO:0000470) |
| 0.0 | 1.0 | GO:0030261 | chromosome condensation(GO:0030261) |
| 0.0 | 1.3 | GO:1903146 | regulation of mitophagy(GO:1903146) |
| 0.0 | 0.1 | GO:0046292 | formaldehyde metabolic process(GO:0046292) |
| 0.0 | 0.2 | GO:0010792 | DNA double-strand break processing involved in repair via single-strand annealing(GO:0010792) |
| 0.0 | 0.1 | GO:0045065 | cytotoxic T cell differentiation(GO:0045065) |
| 0.0 | 0.0 | GO:0090234 | regulation of kinetochore assembly(GO:0090234) |
| 0.0 | 0.4 | GO:0048070 | regulation of developmental pigmentation(GO:0048070) |
| 0.0 | 0.2 | GO:1902412 | regulation of mitotic cytokinesis(GO:1902412) |
| 0.0 | 0.2 | GO:2000254 | regulation of male germ cell proliferation(GO:2000254) |
| 0.0 | 0.6 | GO:0070816 | phosphorylation of RNA polymerase II C-terminal domain(GO:0070816) |
| 0.0 | 0.3 | GO:0090400 | stress-induced premature senescence(GO:0090400) |
| 0.0 | 0.9 | GO:0046856 | phosphatidylinositol dephosphorylation(GO:0046856) |
| 0.0 | 0.1 | GO:0035063 | nuclear speck organization(GO:0035063) |
| 0.0 | 0.7 | GO:0097150 | neuronal stem cell population maintenance(GO:0097150) |
| 0.0 | 0.8 | GO:0042347 | negative regulation of NF-kappaB import into nucleus(GO:0042347) |
| 0.0 | 0.6 | GO:0007213 | G-protein coupled acetylcholine receptor signaling pathway(GO:0007213) |
| 0.0 | 0.2 | GO:0035970 | peptidyl-threonine dephosphorylation(GO:0035970) |
| 0.0 | 0.1 | GO:0032057 | negative regulation of translational initiation in response to stress(GO:0032057) |
| 0.0 | 0.2 | GO:0002759 | regulation of antimicrobial humoral response(GO:0002759) |
| 0.0 | 0.2 | GO:0000212 | meiotic spindle organization(GO:0000212) |
| 0.0 | 0.8 | GO:0009303 | rRNA transcription(GO:0009303) |
| 0.0 | 0.2 | GO:1900112 | regulation of histone H3-K9 trimethylation(GO:1900112) |
| 0.0 | 0.1 | GO:0021551 | central nervous system morphogenesis(GO:0021551) cardiac muscle tissue regeneration(GO:0061026) |
| 0.0 | 0.2 | GO:1902166 | negative regulation of intrinsic apoptotic signaling pathway in response to DNA damage by p53 class mediator(GO:1902166) |
| 0.0 | 0.2 | GO:0071963 | establishment or maintenance of cell polarity regulating cell shape(GO:0071963) |
| 0.0 | 0.1 | GO:0007060 | male meiosis chromosome segregation(GO:0007060) |
| 0.0 | 0.1 | GO:0015783 | GDP-fucose transport(GO:0015783) purine nucleotide-sugar transport(GO:0036079) |
| 0.0 | 0.3 | GO:0048875 | chemical homeostasis within a tissue(GO:0048875) |
| 0.0 | 0.2 | GO:0071763 | nuclear membrane organization(GO:0071763) |
| 0.0 | 0.2 | GO:1902570 | protein localization to nucleolus(GO:1902570) |
| 0.0 | 0.1 | GO:0045007 | depurination(GO:0045007) |
| 0.0 | 0.2 | GO:0000972 | transcription-dependent tethering of RNA polymerase II gene DNA at nuclear periphery(GO:0000972) |
| 0.0 | 0.1 | GO:0072061 | inner medullary collecting duct development(GO:0072061) |
| 0.0 | 0.2 | GO:0021637 | trigeminal nerve morphogenesis(GO:0021636) trigeminal nerve structural organization(GO:0021637) semaphorin-plexin signaling pathway involved in axon guidance(GO:1902287) |
| 0.0 | 0.7 | GO:0070584 | mitochondrion morphogenesis(GO:0070584) |
| 0.0 | 0.4 | GO:0000717 | nucleotide-excision repair, DNA duplex unwinding(GO:0000717) |
| 0.0 | 0.2 | GO:0007252 | I-kappaB phosphorylation(GO:0007252) |
| 0.0 | 0.2 | GO:0060075 | regulation of resting membrane potential(GO:0060075) |
| 0.0 | 0.2 | GO:0002084 | protein depalmitoylation(GO:0002084) |
| 0.0 | 0.1 | GO:0071816 | tail-anchored membrane protein insertion into ER membrane(GO:0071816) protein localization to cytosolic proteasome complex(GO:1904327) protein localization to cytosolic proteasome complex involved in ERAD pathway(GO:1904379) |
| 0.0 | 0.0 | GO:0033024 | mast cell homeostasis(GO:0033023) mast cell apoptotic process(GO:0033024) regulation of mast cell apoptotic process(GO:0033025) |
| 0.0 | 0.2 | GO:1903546 | receptor localization to nonmotile primary cilium(GO:0097500) protein localization to photoreceptor outer segment(GO:1903546) |
| 0.0 | 0.5 | GO:0030208 | dermatan sulfate biosynthetic process(GO:0030208) |
| 0.0 | 0.0 | GO:0002669 | positive regulation of T cell anergy(GO:0002669) positive regulation of lymphocyte anergy(GO:0002913) |
| 0.0 | 0.1 | GO:0035022 | positive regulation of Rac protein signal transduction(GO:0035022) |
| 0.0 | 0.0 | GO:0007343 | egg activation(GO:0007343) |
| 0.0 | 0.1 | GO:0033031 | regulation of neutrophil apoptotic process(GO:0033029) positive regulation of neutrophil apoptotic process(GO:0033031) |
| 0.0 | 0.4 | GO:0006337 | nucleosome disassembly(GO:0006337) |
| 0.0 | 0.5 | GO:0006490 | oligosaccharide-lipid intermediate biosynthetic process(GO:0006490) |
| 0.0 | 0.1 | GO:0019805 | quinolinate biosynthetic process(GO:0019805) |
| 0.0 | 0.1 | GO:0001920 | negative regulation of receptor recycling(GO:0001920) |
| 0.0 | 0.4 | GO:0071850 | mitotic cell cycle arrest(GO:0071850) |
| 0.0 | 0.0 | GO:1904430 | negative regulation of t-circle formation(GO:1904430) |
| 0.0 | 0.1 | GO:0061511 | centriole elongation(GO:0061511) |
| 0.0 | 0.4 | GO:0016973 | poly(A)+ mRNA export from nucleus(GO:0016973) |
| 0.0 | 0.1 | GO:0022007 | neural plate elongation(GO:0014022) convergent extension involved in neural plate elongation(GO:0022007) |
| 0.0 | 0.1 | GO:0015015 | heparan sulfate proteoglycan biosynthetic process, enzymatic modification(GO:0015015) |
| 0.0 | 0.6 | GO:0043029 | T cell homeostasis(GO:0043029) |
| 0.0 | 0.1 | GO:0035986 | senescence-associated heterochromatin focus assembly(GO:0035986) |
| 0.0 | 0.8 | GO:0036297 | interstrand cross-link repair(GO:0036297) |
| 0.0 | 0.2 | GO:0032264 | IMP biosynthetic process(GO:0006188) IMP salvage(GO:0032264) |
| 0.0 | 0.4 | GO:0030828 | positive regulation of cGMP biosynthetic process(GO:0030828) |
| 0.0 | 0.1 | GO:0061589 | calcium activated phosphatidylserine scrambling(GO:0061589) |
| 0.0 | 0.1 | GO:0051182 | coenzyme transport(GO:0051182) |
| 0.0 | 0.2 | GO:0030091 | protein repair(GO:0030091) |
| 0.0 | 0.1 | GO:0046015 | regulation of transcription by glucose(GO:0046015) |
| 0.0 | 0.6 | GO:0006379 | mRNA cleavage(GO:0006379) |
| 0.0 | 0.2 | GO:0060059 | embryonic retina morphogenesis in camera-type eye(GO:0060059) |
| 0.0 | 0.1 | GO:1902231 | positive regulation of intrinsic apoptotic signaling pathway in response to DNA damage(GO:1902231) |
| 0.0 | 0.2 | GO:0070131 | positive regulation of mitochondrial translation(GO:0070131) |
| 0.0 | 0.1 | GO:0042796 | snRNA transcription from RNA polymerase III promoter(GO:0042796) |
| 0.0 | 0.9 | GO:0000413 | protein peptidyl-prolyl isomerization(GO:0000413) |
| 0.0 | 0.2 | GO:0051382 | kinetochore assembly(GO:0051382) |
| 0.0 | 0.3 | GO:0090286 | cytoskeletal anchoring at nuclear membrane(GO:0090286) |
| 0.0 | 0.1 | GO:0034773 | histone H4-K20 trimethylation(GO:0034773) |
| 0.0 | 0.2 | GO:0046784 | viral mRNA export from host cell nucleus(GO:0046784) |
| 0.0 | 0.1 | GO:0090050 | positive regulation of cell migration involved in sprouting angiogenesis(GO:0090050) |
| 0.0 | 0.7 | GO:0010591 | regulation of lamellipodium assembly(GO:0010591) |
| 0.0 | 0.1 | GO:0006226 | dUMP biosynthetic process(GO:0006226) |
| 0.0 | 0.1 | GO:0010724 | regulation of definitive erythrocyte differentiation(GO:0010724) |
| 0.0 | 2.2 | GO:0090630 | activation of GTPase activity(GO:0090630) |
| 0.0 | 0.0 | GO:0030860 | regulation of polarized epithelial cell differentiation(GO:0030860) |
| 0.0 | 1.0 | GO:0015701 | bicarbonate transport(GO:0015701) |
| 0.0 | 0.2 | GO:0010917 | negative regulation of mitochondrial membrane potential(GO:0010917) |
| 0.0 | 0.4 | GO:0044804 | nucleophagy(GO:0044804) |
| 0.0 | 0.3 | GO:0030150 | protein import into mitochondrial matrix(GO:0030150) |
| 0.0 | 0.2 | GO:0001682 | tRNA 5'-leader removal(GO:0001682) |
| 0.0 | 0.1 | GO:1990564 | protein polyufmylation(GO:1990564) protein K69-linked ufmylation(GO:1990592) |
| 0.0 | 4.6 | GO:0002244 | hematopoietic progenitor cell differentiation(GO:0002244) |
| 0.0 | 0.6 | GO:2001222 | regulation of neuron migration(GO:2001222) |
| 0.0 | 2.0 | GO:0007030 | Golgi organization(GO:0007030) |
| 0.0 | 0.2 | GO:0090204 | protein localization to nuclear pore(GO:0090204) |
| 0.0 | 0.1 | GO:0019885 | antigen processing and presentation of endogenous peptide antigen(GO:0002483) antigen processing and presentation of endogenous peptide antigen via MHC class I(GO:0019885) |
| 0.0 | 0.1 | GO:0032971 | regulation of muscle filament sliding(GO:0032971) |
| 0.0 | 1.9 | GO:0006415 | translational termination(GO:0006415) |
| 0.0 | 0.8 | GO:0034198 | cellular response to amino acid starvation(GO:0034198) |
| 0.0 | 0.1 | GO:0043328 | protein targeting to vacuole involved in ubiquitin-dependent protein catabolic process via the multivesicular body sorting pathway(GO:0043328) |
| 0.0 | 0.2 | GO:0098719 | sodium ion import across plasma membrane(GO:0098719) sodium ion import into cell(GO:1990118) |
| 0.0 | 0.1 | GO:0006013 | mannose metabolic process(GO:0006013) |
| 0.0 | 0.3 | GO:0006400 | tRNA modification(GO:0006400) |
| 0.0 | 0.3 | GO:0046069 | cGMP catabolic process(GO:0046069) |
| 0.0 | 0.3 | GO:0032211 | negative regulation of telomere maintenance via telomerase(GO:0032211) |
| 0.0 | 0.7 | GO:0010501 | RNA secondary structure unwinding(GO:0010501) |
| 0.0 | 0.1 | GO:0006616 | SRP-dependent cotranslational protein targeting to membrane, translocation(GO:0006616) |
| 0.0 | 0.5 | GO:0003341 | cilium movement(GO:0003341) |
| 0.0 | 0.1 | GO:0050859 | negative regulation of B cell receptor signaling pathway(GO:0050859) |
| 0.0 | 0.1 | GO:0003215 | cardiac right ventricle morphogenesis(GO:0003215) |
| 0.0 | 0.1 | GO:0060158 | phospholipase C-activating dopamine receptor signaling pathway(GO:0060158) |
| 0.0 | 0.4 | GO:0042104 | positive regulation of activated T cell proliferation(GO:0042104) |
| 0.0 | 0.1 | GO:0051103 | DNA ligation involved in DNA repair(GO:0051103) |
| 0.0 | 0.3 | GO:0060394 | negative regulation of pathway-restricted SMAD protein phosphorylation(GO:0060394) |
| 0.0 | 1.0 | GO:0006901 | vesicle coating(GO:0006901) |
| 0.0 | 0.0 | GO:0034154 | toll-like receptor 7 signaling pathway(GO:0034154) |
| 0.0 | 0.1 | GO:0048625 | myoblast fate commitment(GO:0048625) |
| 0.0 | 0.1 | GO:0034214 | protein hexamerization(GO:0034214) |
| 0.0 | 0.2 | GO:0071243 | cellular response to arsenic-containing substance(GO:0071243) |
| 0.0 | 0.3 | GO:0045776 | negative regulation of blood pressure(GO:0045776) |
| 0.0 | 0.1 | GO:0006108 | malate metabolic process(GO:0006108) |
| 0.0 | 0.1 | GO:0043923 | positive regulation by host of viral transcription(GO:0043923) |
| 0.0 | 0.2 | GO:0006044 | N-acetylglucosamine metabolic process(GO:0006044) |
| 0.0 | 0.1 | GO:0033182 | regulation of histone ubiquitination(GO:0033182) |
| 0.0 | 0.3 | GO:0030947 | regulation of vascular endothelial growth factor receptor signaling pathway(GO:0030947) |
| 0.0 | 0.1 | GO:0080009 | mRNA methylation(GO:0080009) |
| 0.0 | 0.1 | GO:1900745 | positive regulation of p38MAPK cascade(GO:1900745) |
| 0.0 | 0.2 | GO:0042574 | retinal metabolic process(GO:0042574) |
| 0.0 | 0.4 | GO:0045187 | regulation of circadian sleep/wake cycle, sleep(GO:0045187) |
| 0.0 | 0.1 | GO:0061099 | negative regulation of protein tyrosine kinase activity(GO:0061099) |
| 0.0 | 0.1 | GO:1903069 | regulation of ER-associated ubiquitin-dependent protein catabolic process(GO:1903069) |
| 0.0 | 0.1 | GO:2000270 | negative regulation of fibroblast apoptotic process(GO:2000270) |
| 0.0 | 0.0 | GO:0018106 | peptidyl-histidine phosphorylation(GO:0018106) |
| 0.0 | 0.1 | GO:0070233 | negative regulation of T cell apoptotic process(GO:0070233) |
| 0.0 | 0.2 | GO:0006471 | protein ADP-ribosylation(GO:0006471) |
| 0.0 | 0.1 | GO:0097201 | negative regulation of transcription from RNA polymerase II promoter in response to stress(GO:0097201) |
| 0.0 | 0.9 | GO:0001895 | retina homeostasis(GO:0001895) |
| 0.0 | 0.2 | GO:0006228 | GTP biosynthetic process(GO:0006183) UTP biosynthetic process(GO:0006228) |
| 0.0 | 0.9 | GO:0010923 | negative regulation of phosphatase activity(GO:0010923) |
| 0.0 | 0.2 | GO:0021978 | telencephalon regionalization(GO:0021978) |
| 0.0 | 0.2 | GO:0043457 | regulation of cellular respiration(GO:0043457) |
| 0.0 | 0.8 | GO:0006890 | retrograde vesicle-mediated transport, Golgi to ER(GO:0006890) |
| 0.0 | 0.0 | GO:0043504 | mitochondrial DNA repair(GO:0043504) |
| 0.0 | 0.1 | GO:1990573 | potassium ion import across plasma membrane(GO:1990573) |
| 0.0 | 0.3 | GO:0006359 | regulation of transcription from RNA polymerase III promoter(GO:0006359) |
| 0.0 | 0.2 | GO:0044065 | regulation of respiratory system process(GO:0044065) |
| 0.0 | 0.2 | GO:0009223 | pyrimidine deoxyribonucleotide catabolic process(GO:0009223) |
Gene overrepresentation in cellular component category:
| Log-likelihood per target | Total log-likelihood | Term | Description |
|---|---|---|---|
| 0.8 | 3.3 | GO:0097229 | sperm end piece(GO:0097229) |
| 0.7 | 5.2 | GO:0042825 | TAP complex(GO:0042825) |
| 0.6 | 1.7 | GO:0034753 | nuclear aryl hydrocarbon receptor complex(GO:0034753) |
| 0.4 | 2.1 | GO:0035061 | interchromatin granule(GO:0035061) |
| 0.4 | 1.1 | GO:0005753 | mitochondrial proton-transporting ATP synthase complex(GO:0005753) proton-transporting ATP synthase complex(GO:0045259) |
| 0.4 | 1.1 | GO:0030689 | Noc complex(GO:0030689) |
| 0.3 | 2.3 | GO:0005610 | laminin-5 complex(GO:0005610) |
| 0.3 | 1.6 | GO:0071942 | XPC complex(GO:0071942) |
| 0.3 | 0.8 | GO:0001674 | female germ cell nucleus(GO:0001674) |
| 0.2 | 1.3 | GO:1990393 | 3M complex(GO:1990393) |
| 0.2 | 0.8 | GO:0000438 | core TFIIH complex portion of holo TFIIH complex(GO:0000438) |
| 0.2 | 2.2 | GO:0042612 | MHC class I protein complex(GO:0042612) |
| 0.2 | 0.6 | GO:0097545 | radial spoke(GO:0001534) axonemal outer doublet(GO:0097545) |
| 0.2 | 0.8 | GO:1990879 | CST complex(GO:1990879) |
| 0.2 | 0.9 | GO:0045160 | myosin I complex(GO:0045160) |
| 0.2 | 1.4 | GO:0070761 | pre-snoRNP complex(GO:0070761) |
| 0.2 | 3.6 | GO:0036038 | MKS complex(GO:0036038) |
| 0.2 | 0.8 | GO:0070557 | PCNA-p21 complex(GO:0070557) |
| 0.2 | 0.8 | GO:0043625 | delta DNA polymerase complex(GO:0043625) |
| 0.2 | 0.3 | GO:0032444 | activin responsive factor complex(GO:0032444) |
| 0.1 | 1.9 | GO:0033256 | I-kappaB/NF-kappaB complex(GO:0033256) |
| 0.1 | 0.4 | GO:1990298 | mitotic checkpoint complex(GO:0033597) bub1-bub3 complex(GO:1990298) |
| 0.1 | 1.3 | GO:0071144 | SMAD2-SMAD3 protein complex(GO:0071144) |
| 0.1 | 0.4 | GO:0031085 | BLOC-3 complex(GO:0031085) |
| 0.1 | 0.4 | GO:0060987 | lipid tube(GO:0060987) |
| 0.1 | 0.8 | GO:0070545 | PeBoW complex(GO:0070545) |
| 0.1 | 0.9 | GO:0034388 | Pwp2p-containing subcomplex of 90S preribosome(GO:0034388) |
| 0.1 | 0.6 | GO:0031074 | nucleocytoplasmic shuttling complex(GO:0031074) |
| 0.1 | 0.8 | GO:0005658 | alpha DNA polymerase:primase complex(GO:0005658) |
| 0.1 | 0.8 | GO:0032021 | NELF complex(GO:0032021) |
| 0.1 | 1.2 | GO:0070852 | cell body fiber(GO:0070852) |
| 0.1 | 2.2 | GO:0097038 | perinuclear endoplasmic reticulum(GO:0097038) |
| 0.1 | 0.3 | GO:0036194 | muscle cell projection(GO:0036194) muscle cell projection membrane(GO:0036195) |
| 0.1 | 1.6 | GO:0000940 | condensed chromosome outer kinetochore(GO:0000940) |
| 0.1 | 0.3 | GO:0005745 | m-AAA complex(GO:0005745) |
| 0.1 | 1.8 | GO:0061700 | GATOR2 complex(GO:0061700) |
| 0.1 | 0.3 | GO:0030678 | mitochondrial ribonuclease P complex(GO:0030678) |
| 0.1 | 0.7 | GO:0098559 | cytoplasmic side of early endosome membrane(GO:0098559) |
| 0.1 | 0.5 | GO:0032311 | angiogenin-PRI complex(GO:0032311) |
| 0.1 | 0.4 | GO:0048179 | activin receptor complex(GO:0048179) |
| 0.1 | 0.8 | GO:0072487 | MSL complex(GO:0072487) |
| 0.1 | 0.2 | GO:0036387 | nuclear pre-replicative complex(GO:0005656) pre-replicative complex(GO:0036387) |
| 0.1 | 0.5 | GO:0005945 | 6-phosphofructokinase complex(GO:0005945) |
| 0.1 | 0.3 | GO:1990423 | RZZ complex(GO:1990423) |
| 0.1 | 0.4 | GO:0031262 | Ndc80 complex(GO:0031262) |
| 0.1 | 1.4 | GO:0035631 | CD40 receptor complex(GO:0035631) |
| 0.1 | 1.1 | GO:0002199 | zona pellucida receptor complex(GO:0002199) |
| 0.1 | 0.2 | GO:0034455 | t-UTP complex(GO:0034455) |
| 0.1 | 0.3 | GO:0005873 | plus-end kinesin complex(GO:0005873) |
| 0.1 | 1.0 | GO:0008278 | cohesin complex(GO:0008278) |
| 0.1 | 0.3 | GO:0072534 | perineuronal net(GO:0072534) |
| 0.1 | 0.8 | GO:0070449 | elongin complex(GO:0070449) |
| 0.1 | 0.8 | GO:0045254 | pyruvate dehydrogenase complex(GO:0045254) |
| 0.1 | 0.3 | GO:0005742 | mitochondrial outer membrane translocase complex(GO:0005742) |
| 0.1 | 0.8 | GO:0000235 | astral microtubule(GO:0000235) aster(GO:0005818) |
| 0.1 | 1.5 | GO:0000242 | pericentriolar material(GO:0000242) |
| 0.1 | 0.3 | GO:0035339 | SPOTS complex(GO:0035339) |
| 0.1 | 0.6 | GO:0043190 | ATP-binding cassette (ABC) transporter complex(GO:0043190) |
| 0.1 | 0.9 | GO:0008074 | guanylate cyclase complex, soluble(GO:0008074) |
| 0.1 | 0.3 | GO:0001652 | granular component(GO:0001652) |
| 0.1 | 0.2 | GO:0030956 | glutamyl-tRNA(Gln) amidotransferase complex(GO:0030956) |
| 0.1 | 0.3 | GO:0043564 | Ku70:Ku80 complex(GO:0043564) |
| 0.1 | 0.3 | GO:0032807 | DNA ligase IV complex(GO:0032807) |
| 0.1 | 0.3 | GO:1990726 | Lsm1-7-Pat1 complex(GO:1990726) |
| 0.0 | 1.6 | GO:0005779 | integral component of peroxisomal membrane(GO:0005779) intrinsic component of peroxisomal membrane(GO:0031231) |
| 0.0 | 0.3 | GO:0032437 | cuticular plate(GO:0032437) |
| 0.0 | 0.1 | GO:0071598 | neuronal ribonucleoprotein granule(GO:0071598) |
| 0.0 | 0.6 | GO:0033093 | Weibel-Palade body(GO:0033093) |
| 0.0 | 1.6 | GO:0071564 | npBAF complex(GO:0071564) |
| 0.0 | 0.2 | GO:0001405 | presequence translocase-associated import motor(GO:0001405) |
| 0.0 | 0.6 | GO:0000137 | Golgi cis cisterna(GO:0000137) |
| 0.0 | 0.1 | GO:0035370 | UBC13-UEV1A complex(GO:0035370) |
| 0.0 | 0.2 | GO:0031838 | haptoglobin-hemoglobin complex(GO:0031838) |
| 0.0 | 0.5 | GO:0044327 | dendritic spine head(GO:0044327) |
| 0.0 | 0.4 | GO:0000015 | phosphopyruvate hydratase complex(GO:0000015) |
| 0.0 | 0.2 | GO:0071797 | LUBAC complex(GO:0071797) |
| 0.0 | 0.6 | GO:0044292 | dendrite terminus(GO:0044292) |
| 0.0 | 2.3 | GO:0042645 | nucleoid(GO:0009295) mitochondrial nucleoid(GO:0042645) |
| 0.0 | 0.8 | GO:0005861 | troponin complex(GO:0005861) |
| 0.0 | 0.1 | GO:0097637 | intrinsic component of autophagosome membrane(GO:0097636) integral component of autophagosome membrane(GO:0097637) |
| 0.0 | 0.8 | GO:0000786 | nucleosome(GO:0000786) |
| 0.0 | 0.5 | GO:0030897 | HOPS complex(GO:0030897) |
| 0.0 | 1.0 | GO:0005614 | interstitial matrix(GO:0005614) |
| 0.0 | 0.3 | GO:0005744 | mitochondrial inner membrane presequence translocase complex(GO:0005744) |
| 0.0 | 1.6 | GO:0035861 | site of double-strand break(GO:0035861) |
| 0.0 | 2.0 | GO:0032420 | stereocilium(GO:0032420) |
| 0.0 | 0.2 | GO:0031417 | NatC complex(GO:0031417) |
| 0.0 | 0.3 | GO:0016272 | prefoldin complex(GO:0016272) |
| 0.0 | 0.3 | GO:0019907 | cyclin-dependent protein kinase activating kinase holoenzyme complex(GO:0019907) |
| 0.0 | 0.4 | GO:0019773 | proteasome core complex, alpha-subunit complex(GO:0019773) |
| 0.0 | 0.2 | GO:0000172 | ribonuclease MRP complex(GO:0000172) |
| 0.0 | 0.9 | GO:0031143 | pseudopodium(GO:0031143) |
| 0.0 | 0.6 | GO:0005890 | sodium:potassium-exchanging ATPase complex(GO:0005890) |
| 0.0 | 1.0 | GO:0005868 | cytoplasmic dynein complex(GO:0005868) |
| 0.0 | 0.3 | GO:0034464 | BBSome(GO:0034464) |
| 0.0 | 0.3 | GO:0005672 | transcription factor TFIIA complex(GO:0005672) |
| 0.0 | 0.3 | GO:0042788 | polysomal ribosome(GO:0042788) |
| 0.0 | 2.2 | GO:0015030 | Cajal body(GO:0015030) |
| 0.0 | 0.5 | GO:0032040 | small-subunit processome(GO:0032040) |
| 0.0 | 0.8 | GO:0031307 | integral component of mitochondrial outer membrane(GO:0031307) |
| 0.0 | 1.0 | GO:0030057 | desmosome(GO:0030057) |
| 0.0 | 0.4 | GO:0034098 | VCP-NPL4-UFD1 AAA ATPase complex(GO:0034098) |
| 0.0 | 0.9 | GO:0005719 | nuclear euchromatin(GO:0005719) |
| 0.0 | 0.2 | GO:0030688 | preribosome, small subunit precursor(GO:0030688) |
| 0.0 | 0.3 | GO:0097413 | Lewy body(GO:0097413) |
| 0.0 | 0.2 | GO:0000796 | condensin complex(GO:0000796) |
| 0.0 | 0.1 | GO:1990730 | VCP-NSFL1C complex(GO:1990730) |
| 0.0 | 0.1 | GO:0005863 | striated muscle myosin thick filament(GO:0005863) |
| 0.0 | 0.6 | GO:0000346 | transcription export complex(GO:0000346) |
| 0.0 | 0.2 | GO:0005785 | signal recognition particle receptor complex(GO:0005785) |
| 0.0 | 0.1 | GO:0033553 | rDNA heterochromatin(GO:0033553) |
| 0.0 | 0.6 | GO:0034045 | pre-autophagosomal structure membrane(GO:0034045) |
| 0.0 | 0.1 | GO:0005947 | mitochondrial alpha-ketoglutarate dehydrogenase complex(GO:0005947) |
| 0.0 | 0.2 | GO:0035032 | phosphatidylinositol 3-kinase complex, class III(GO:0035032) |
| 0.0 | 0.7 | GO:0035371 | microtubule plus-end(GO:0035371) |
| 0.0 | 0.4 | GO:0030686 | 90S preribosome(GO:0030686) |
| 0.0 | 0.2 | GO:0008385 | IkappaB kinase complex(GO:0008385) |
| 0.0 | 0.2 | GO:0005638 | lamin filament(GO:0005638) |
| 0.0 | 2.9 | GO:0035578 | azurophil granule lumen(GO:0035578) |
| 0.0 | 0.2 | GO:0008290 | F-actin capping protein complex(GO:0008290) |
| 0.0 | 0.1 | GO:0045293 | MIS complex(GO:0036396) mRNA editing complex(GO:0045293) |
| 0.0 | 0.1 | GO:0033185 | dolichol-phosphate-mannose synthase complex(GO:0033185) |
| 0.0 | 0.2 | GO:0005787 | signal peptidase complex(GO:0005787) |
| 0.0 | 0.2 | GO:0031931 | TORC1 complex(GO:0031931) |
| 0.0 | 2.2 | GO:0072686 | mitotic spindle(GO:0072686) |
| 0.0 | 0.3 | GO:0033010 | paranodal junction(GO:0033010) |
| 0.0 | 0.1 | GO:0072379 | BAT3 complex(GO:0071818) ER membrane insertion complex(GO:0072379) |
| 0.0 | 0.2 | GO:0036157 | outer dynein arm(GO:0036157) |
| 0.0 | 0.3 | GO:0000407 | pre-autophagosomal structure(GO:0000407) |
| 0.0 | 0.1 | GO:0005797 | Golgi medial cisterna(GO:0005797) |
| 0.0 | 0.1 | GO:0031515 | tRNA (m1A) methyltransferase complex(GO:0031515) |
| 0.0 | 0.2 | GO:0008541 | proteasome regulatory particle, lid subcomplex(GO:0008541) |
| 0.0 | 0.1 | GO:0000814 | ESCRT II complex(GO:0000814) |
| 0.0 | 2.0 | GO:0005761 | organellar ribosome(GO:0000313) mitochondrial ribosome(GO:0005761) |
| 0.0 | 0.3 | GO:0000813 | ESCRT I complex(GO:0000813) |
| 0.0 | 0.2 | GO:0017146 | NMDA selective glutamate receptor complex(GO:0017146) |
| 0.0 | 0.1 | GO:0016013 | syntrophin complex(GO:0016013) |
| 0.0 | 0.2 | GO:0031595 | nuclear proteasome complex(GO:0031595) |
| 0.0 | 1.2 | GO:0005834 | heterotrimeric G-protein complex(GO:0005834) |
| 0.0 | 0.1 | GO:0008537 | proteasome activator complex(GO:0008537) |
| 0.0 | 0.1 | GO:0071821 | FANCM-MHF complex(GO:0071821) |
| 0.0 | 0.4 | GO:0030684 | preribosome(GO:0030684) |
| 0.0 | 0.1 | GO:0000839 | Hrd1p ubiquitin ligase ERAD-L complex(GO:0000839) |
| 0.0 | 0.3 | GO:0000800 | lateral element(GO:0000800) |
| 0.0 | 0.3 | GO:0070971 | endoplasmic reticulum exit site(GO:0070971) |
| 0.0 | 2.3 | GO:0031234 | extrinsic component of cytoplasmic side of plasma membrane(GO:0031234) |
| 0.0 | 0.2 | GO:0014701 | junctional sarcoplasmic reticulum membrane(GO:0014701) |
| 0.0 | 0.2 | GO:0034709 | methylosome(GO:0034709) |
| 0.0 | 0.3 | GO:0031265 | CD95 death-inducing signaling complex(GO:0031265) |
| 0.0 | 0.1 | GO:0033186 | CAF-1 complex(GO:0033186) |
| 0.0 | 0.1 | GO:0098642 | network-forming collagen trimer(GO:0098642) collagen network(GO:0098645) |
| 0.0 | 0.1 | GO:0071664 | beta-catenin-TCF7L2 complex(GO:0070369) catenin-TCF7L2 complex(GO:0071664) |
| 0.0 | 2.7 | GO:0005923 | bicellular tight junction(GO:0005923) |
| 0.0 | 0.1 | GO:0000811 | GINS complex(GO:0000811) |
| 0.0 | 3.1 | GO:0030018 | Z disc(GO:0030018) |
| 0.0 | 0.3 | GO:0030285 | integral component of synaptic vesicle membrane(GO:0030285) intrinsic component of synaptic vesicle membrane(GO:0098563) |
| 0.0 | 0.1 | GO:0001939 | female pronucleus(GO:0001939) |
| 0.0 | 0.1 | GO:0036398 | TCR signalosome(GO:0036398) |
| 0.0 | 1.7 | GO:0030016 | myofibril(GO:0030016) |
| 0.0 | 0.3 | GO:0030904 | retromer complex(GO:0030904) |
| 0.0 | 0.2 | GO:0030867 | rough endoplasmic reticulum membrane(GO:0030867) |
| 0.0 | 0.4 | GO:0031304 | intrinsic component of mitochondrial inner membrane(GO:0031304) integral component of mitochondrial inner membrane(GO:0031305) |
| 0.0 | 0.1 | GO:0070847 | core mediator complex(GO:0070847) |
| 0.0 | 0.2 | GO:0002116 | semaphorin receptor complex(GO:0002116) |
| 0.0 | 0.3 | GO:1990124 | messenger ribonucleoprotein complex(GO:1990124) |
| 0.0 | 0.1 | GO:0070522 | ERCC4-ERCC1 complex(GO:0070522) |
| 0.0 | 0.7 | GO:0045171 | intercellular bridge(GO:0045171) |
| 0.0 | 0.1 | GO:0005832 | chaperonin-containing T-complex(GO:0005832) |
| 0.0 | 1.1 | GO:0030134 | ER to Golgi transport vesicle(GO:0030134) |
| 0.0 | 0.1 | GO:0071541 | eukaryotic translation initiation factor 3 complex, eIF3m(GO:0071541) |
| 0.0 | 0.1 | GO:0097433 | dense body(GO:0097433) |
Gene overrepresentation in molecular function category:
| Log-likelihood per target | Total log-likelihood | Term | Description |
|---|---|---|---|
| 1.6 | 7.9 | GO:0046899 | nucleoside triphosphate adenylate kinase activity(GO:0046899) |
| 0.9 | 2.6 | GO:0008859 | exoribonuclease II activity(GO:0008859) |
| 0.8 | 7.4 | GO:0046978 | TAP binding(GO:0046977) TAP1 binding(GO:0046978) |
| 0.6 | 1.9 | GO:0030550 | acetylcholine receptor inhibitor activity(GO:0030550) |
| 0.5 | 1.6 | GO:0016154 | thymidine phosphorylase activity(GO:0009032) pyrimidine-nucleoside phosphorylase activity(GO:0016154) |
| 0.4 | 1.5 | GO:0004307 | diacylglycerol cholinephosphotransferase activity(GO:0004142) ethanolaminephosphotransferase activity(GO:0004307) |
| 0.4 | 1.8 | GO:0080019 | fatty-acyl-CoA reductase (alcohol-forming) activity(GO:0080019) |
| 0.3 | 1.0 | GO:0098640 | integrin binding involved in cell-matrix adhesion(GO:0098640) |
| 0.3 | 2.6 | GO:0031730 | CCR5 chemokine receptor binding(GO:0031730) |
| 0.3 | 1.9 | GO:0017050 | sphinganine kinase activity(GO:0008481) D-erythro-sphingosine kinase activity(GO:0017050) |
| 0.3 | 0.8 | GO:0030337 | DNA polymerase processivity factor activity(GO:0030337) |
| 0.3 | 1.3 | GO:0043515 | kinetochore binding(GO:0043515) |
| 0.3 | 1.8 | GO:0004045 | aminoacyl-tRNA hydrolase activity(GO:0004045) |
| 0.2 | 0.5 | GO:0070095 | fructose-6-phosphate binding(GO:0070095) |
| 0.2 | 0.7 | GO:0015403 | thiamine uptake transmembrane transporter activity(GO:0015403) |
| 0.2 | 0.9 | GO:0003938 | IMP dehydrogenase activity(GO:0003938) |
| 0.2 | 1.1 | GO:0070326 | very-low-density lipoprotein particle receptor binding(GO:0070326) |
| 0.2 | 1.3 | GO:0031962 | mineralocorticoid receptor binding(GO:0031962) |
| 0.2 | 1.2 | GO:0000404 | heteroduplex DNA loop binding(GO:0000404) |
| 0.2 | 1.0 | GO:0004066 | asparagine synthase (glutamine-hydrolyzing) activity(GO:0004066) |
| 0.2 | 0.6 | GO:0008294 | calcium- and calmodulin-responsive adenylate cyclase activity(GO:0008294) |
| 0.2 | 0.7 | GO:0033765 | 3-oxo-5-alpha-steroid 4-dehydrogenase activity(GO:0003865) steroid dehydrogenase activity, acting on the CH-CH group of donors(GO:0033765) cholestenone 5-alpha-reductase activity(GO:0047751) |
| 0.2 | 0.7 | GO:0033823 | procollagen-lysine 5-dioxygenase activity(GO:0008475) procollagen glucosyltransferase activity(GO:0033823) |
| 0.2 | 1.4 | GO:0070728 | leucine binding(GO:0070728) |
| 0.2 | 1.2 | GO:0004459 | L-lactate dehydrogenase activity(GO:0004459) |
| 0.2 | 0.5 | GO:0004566 | beta-glucuronidase activity(GO:0004566) |
| 0.2 | 2.1 | GO:0032453 | histone demethylase activity (H3-K4 specific)(GO:0032453) |
| 0.2 | 2.7 | GO:0031996 | thioesterase binding(GO:0031996) |
| 0.1 | 1.5 | GO:0004565 | beta-galactosidase activity(GO:0004565) |
| 0.1 | 0.3 | GO:0050211 | procollagen galactosyltransferase activity(GO:0050211) |
| 0.1 | 2.6 | GO:0009982 | pseudouridine synthase activity(GO:0009982) |
| 0.1 | 1.3 | GO:0016721 | superoxide dismutase activity(GO:0004784) oxidoreductase activity, acting on superoxide radicals as acceptor(GO:0016721) |
| 0.1 | 0.5 | GO:0047757 | chondroitin-glucuronate 5-epimerase activity(GO:0047757) |
| 0.1 | 1.7 | GO:0046870 | cadmium ion binding(GO:0046870) |
| 0.1 | 0.5 | GO:0098770 | FBXO family protein binding(GO:0098770) |
| 0.1 | 0.8 | GO:0003873 | 6-phosphofructo-2-kinase activity(GO:0003873) |
| 0.1 | 0.6 | GO:0016774 | phosphotransferase activity, carboxyl group as acceptor(GO:0016774) |
| 0.1 | 0.4 | GO:0008893 | guanosine-3',5'-bis(diphosphate) 3'-diphosphatase activity(GO:0008893) diphosphoric monoester hydrolase activity(GO:0016794) |
| 0.1 | 0.4 | GO:0090631 | pre-miRNA transporter activity(GO:0090631) |
| 0.1 | 0.4 | GO:0070259 | tyrosyl-DNA phosphodiesterase activity(GO:0070259) |
| 0.1 | 0.5 | GO:0004419 | hydroxymethylglutaryl-CoA lyase activity(GO:0004419) |
| 0.1 | 0.5 | GO:0051733 | ATP-dependent polydeoxyribonucleotide 5'-hydroxyl-kinase activity(GO:0046404) polydeoxyribonucleotide kinase activity(GO:0051733) ATP-dependent polynucleotide kinase activity(GO:0051734) |
| 0.1 | 0.5 | GO:0004360 | glutamine-fructose-6-phosphate transaminase (isomerizing) activity(GO:0004360) |
| 0.1 | 1.5 | GO:1990825 | sequence-specific mRNA binding(GO:1990825) |
| 0.1 | 0.6 | GO:0005119 | smoothened binding(GO:0005119) hedgehog family protein binding(GO:0097108) |
| 0.1 | 0.3 | GO:0015173 | aromatic amino acid transmembrane transporter activity(GO:0015173) |
| 0.1 | 2.1 | GO:0016018 | cyclosporin A binding(GO:0016018) |
| 0.1 | 0.5 | GO:0033906 | hyaluronoglucuronidase activity(GO:0033906) |
| 0.1 | 0.4 | GO:0004739 | pyruvate dehydrogenase (acetyl-transferring) activity(GO:0004739) |
| 0.1 | 0.7 | GO:0008479 | queuine tRNA-ribosyltransferase activity(GO:0008479) |
| 0.1 | 0.6 | GO:0070004 | cysteine-type carboxypeptidase activity(GO:0016807) cysteine-type exopeptidase activity(GO:0070004) |
| 0.1 | 0.9 | GO:0070740 | tubulin-glutamic acid ligase activity(GO:0070740) |
| 0.1 | 0.8 | GO:0044547 | DNA topoisomerase binding(GO:0044547) |
| 0.1 | 0.4 | GO:0005136 | interleukin-4 receptor binding(GO:0005136) |
| 0.1 | 0.4 | GO:0070320 | inward rectifier potassium channel inhibitor activity(GO:0070320) |
| 0.1 | 0.3 | GO:0070336 | flap-structured DNA binding(GO:0070336) |
| 0.1 | 0.5 | GO:0061676 | importin-alpha family protein binding(GO:0061676) |
| 0.1 | 0.7 | GO:0016427 | tRNA (cytosine) methyltransferase activity(GO:0016427) |
| 0.1 | 0.5 | GO:0016971 | flavin-linked sulfhydryl oxidase activity(GO:0016971) |
| 0.1 | 0.3 | GO:0004056 | argininosuccinate lyase activity(GO:0004056) |
| 0.1 | 2.2 | GO:0035497 | cAMP response element binding(GO:0035497) |
| 0.1 | 0.3 | GO:0004052 | arachidonate 12-lipoxygenase activity(GO:0004052) |
| 0.1 | 0.6 | GO:0004430 | 1-phosphatidylinositol 4-kinase activity(GO:0004430) |
| 0.1 | 0.6 | GO:0009019 | tRNA (guanine-N1-)-methyltransferase activity(GO:0009019) |
| 0.1 | 0.5 | GO:0008823 | cupric reductase activity(GO:0008823) ferric-chelate reductase (NADPH) activity(GO:0052851) |
| 0.1 | 2.4 | GO:0008242 | omega peptidase activity(GO:0008242) |
| 0.1 | 0.8 | GO:0031685 | adenosine receptor binding(GO:0031685) |
| 0.1 | 1.5 | GO:0031681 | G-protein beta-subunit binding(GO:0031681) |
| 0.1 | 0.8 | GO:1990948 | ligase inhibitor activity(GO:0055104) ubiquitin ligase inhibitor activity(GO:1990948) |
| 0.1 | 0.5 | GO:0051032 | nucleic acid transmembrane transporter activity(GO:0051032) RNA transmembrane transporter activity(GO:0051033) |
| 0.1 | 0.7 | GO:0019238 | cyclohydrolase activity(GO:0019238) |
| 0.1 | 0.3 | GO:0097677 | STAT family protein binding(GO:0097677) |
| 0.1 | 0.2 | GO:0005483 | soluble NSF attachment protein activity(GO:0005483) |
| 0.1 | 0.7 | GO:0038036 | sphingosine-1-phosphate receptor activity(GO:0038036) |
| 0.1 | 0.5 | GO:0001515 | opioid peptide activity(GO:0001515) |
| 0.1 | 0.4 | GO:0004994 | somatostatin receptor activity(GO:0004994) |
| 0.1 | 0.4 | GO:0004905 | type I interferon receptor activity(GO:0004905) |
| 0.1 | 0.4 | GO:0004666 | prostaglandin-endoperoxide synthase activity(GO:0004666) arachidonate 15-lipoxygenase activity(GO:0050473) |
| 0.1 | 0.4 | GO:0050833 | pyruvate transmembrane transporter activity(GO:0050833) |
| 0.1 | 0.7 | GO:0043813 | phosphatidylinositol-3,5-bisphosphate 5-phosphatase activity(GO:0043813) |
| 0.1 | 0.3 | GO:0035539 | 8-oxo-7,8-dihydroguanosine triphosphate pyrophosphatase activity(GO:0008413) 8-oxo-7,8-dihydrodeoxyguanosine triphosphate pyrophosphatase activity(GO:0035539) |
| 0.1 | 0.1 | GO:0003953 | NAD+ nucleosidase activity(GO:0003953) |
| 0.1 | 0.8 | GO:0070087 | chromo shadow domain binding(GO:0070087) |
| 0.1 | 0.8 | GO:0016861 | intramolecular oxidoreductase activity, interconverting aldoses and ketoses(GO:0016861) |
| 0.1 | 0.8 | GO:0015129 | lactate transmembrane transporter activity(GO:0015129) |
| 0.1 | 0.7 | GO:0008428 | ribonuclease inhibitor activity(GO:0008428) |
| 0.1 | 1.4 | GO:0008353 | RNA polymerase II carboxy-terminal domain kinase activity(GO:0008353) |
| 0.1 | 0.4 | GO:0016361 | activin receptor activity, type I(GO:0016361) |
| 0.1 | 0.4 | GO:0004740 | pyruvate dehydrogenase (acetyl-transferring) kinase activity(GO:0004740) |
| 0.1 | 0.8 | GO:0005078 | MAP-kinase scaffold activity(GO:0005078) |
| 0.1 | 0.2 | GO:0004967 | glucagon receptor activity(GO:0004967) |
| 0.1 | 0.5 | GO:0035174 | histone serine kinase activity(GO:0035174) |
| 0.1 | 0.2 | GO:0004102 | choline O-acetyltransferase activity(GO:0004102) |
| 0.1 | 0.8 | GO:0031014 | troponin T binding(GO:0031014) |
| 0.1 | 0.2 | GO:0016649 | electron-transferring-flavoprotein dehydrogenase activity(GO:0004174) oxidoreductase activity, acting on the CH-NH group of donors, quinone or similar compound as acceptor(GO:0016649) |
| 0.1 | 0.3 | GO:0005220 | inositol 1,4,5-trisphosphate-sensitive calcium-release channel activity(GO:0005220) |
| 0.1 | 0.2 | GO:0034046 | poly(G) binding(GO:0034046) |
| 0.1 | 1.6 | GO:0017160 | Ral GTPase binding(GO:0017160) |
| 0.1 | 0.3 | GO:0003909 | DNA ligase activity(GO:0003909) |
| 0.1 | 0.4 | GO:0001165 | RNA polymerase I upstream control element sequence-specific DNA binding(GO:0001165) |
| 0.1 | 1.9 | GO:0001671 | ATPase activator activity(GO:0001671) |
| 0.1 | 0.4 | GO:0005143 | interleukin-12 receptor binding(GO:0005143) |
| 0.1 | 0.4 | GO:1990050 | phosphatidic acid transporter activity(GO:1990050) |
| 0.1 | 0.2 | GO:0050567 | glutaminyl-tRNA synthase (glutamine-hydrolyzing) activity(GO:0050567) |
| 0.1 | 0.2 | GO:0003863 | alpha-ketoacid dehydrogenase activity(GO:0003826) 3-methyl-2-oxobutanoate dehydrogenase (2-methylpropanoyl-transferring) activity(GO:0003863) |
| 0.1 | 0.2 | GO:0070139 | ubiquitin-like protein-specific endopeptidase activity(GO:0070137) SUMO-specific endopeptidase activity(GO:0070139) |
| 0.1 | 1.2 | GO:0008510 | sodium:bicarbonate symporter activity(GO:0008510) |
| 0.1 | 0.6 | GO:0035242 | protein-arginine omega-N asymmetric methyltransferase activity(GO:0035242) |
| 0.0 | 0.1 | GO:0051380 | beta-adrenergic receptor activity(GO:0004939) norepinephrine binding(GO:0051380) |
| 0.0 | 0.1 | GO:0005462 | UDP-N-acetylglucosamine transmembrane transporter activity(GO:0005462) |
| 0.0 | 1.9 | GO:0005540 | hyaluronic acid binding(GO:0005540) |
| 0.0 | 0.6 | GO:0070679 | inositol 1,4,5 trisphosphate binding(GO:0070679) |
| 0.0 | 0.2 | GO:0098808 | mRNA cap binding(GO:0098808) |
| 0.0 | 1.0 | GO:0043047 | single-stranded telomeric DNA binding(GO:0043047) |
| 0.0 | 1.0 | GO:0015095 | magnesium ion transmembrane transporter activity(GO:0015095) |
| 0.0 | 0.1 | GO:0000386 | second spliceosomal transesterification activity(GO:0000386) |
| 0.0 | 0.4 | GO:0050145 | nucleoside phosphate kinase activity(GO:0050145) |
| 0.0 | 0.4 | GO:0004176 | ATP-dependent peptidase activity(GO:0004176) |
| 0.0 | 0.2 | GO:0048763 | calcium-induced calcium release activity(GO:0048763) |
| 0.0 | 0.9 | GO:0005161 | platelet-derived growth factor receptor binding(GO:0005161) |
| 0.0 | 0.4 | GO:0010997 | anaphase-promoting complex binding(GO:0010997) |
| 0.0 | 0.2 | GO:0017002 | activin-activated receptor activity(GO:0017002) |
| 0.0 | 0.7 | GO:1990459 | transferrin receptor binding(GO:1990459) |
| 0.0 | 0.1 | GO:0008457 | beta-galactosyl-N-acetylglucosaminylgalactosylglucosyl-ceramide beta-1,3-acetylglucosaminyltransferase activity(GO:0008457) lactosylceramide 1,3-N-acetyl-beta-D-glucosaminyltransferase activity(GO:0047256) |
| 0.0 | 0.1 | GO:0004605 | phosphatidate cytidylyltransferase activity(GO:0004605) |
| 0.0 | 0.2 | GO:0005502 | 11-cis retinal binding(GO:0005502) |
| 0.0 | 0.1 | GO:0050571 | 1,5-anhydro-D-fructose reductase activity(GO:0050571) |
| 0.0 | 0.2 | GO:0004583 | dolichyl-phosphate-glucose-glycolipid alpha-glucosyltransferase activity(GO:0004583) |
| 0.0 | 0.2 | GO:0008192 | RNA guanylyltransferase activity(GO:0008192) |
| 0.0 | 0.5 | GO:0004300 | enoyl-CoA hydratase activity(GO:0004300) |
| 0.0 | 0.5 | GO:0016494 | C-X-C chemokine receptor activity(GO:0016494) |
| 0.0 | 0.3 | GO:0003956 | NAD(P)+-protein-arginine ADP-ribosyltransferase activity(GO:0003956) |
| 0.0 | 0.4 | GO:0004634 | phosphopyruvate hydratase activity(GO:0004634) |
| 0.0 | 0.2 | GO:0017108 | 5'-flap endonuclease activity(GO:0017108) |
| 0.0 | 3.1 | GO:0004712 | protein serine/threonine/tyrosine kinase activity(GO:0004712) |
| 0.0 | 0.5 | GO:0042975 | peroxisome proliferator activated receptor binding(GO:0042975) |
| 0.0 | 0.2 | GO:0035402 | histone kinase activity (H3-T11 specific)(GO:0035402) |
| 0.0 | 0.9 | GO:0032183 | SUMO binding(GO:0032183) |
| 0.0 | 0.6 | GO:0016290 | palmitoyl-CoA hydrolase activity(GO:0016290) |
| 0.0 | 0.2 | GO:0016882 | cyclo-ligase activity(GO:0016882) |
| 0.0 | 0.7 | GO:0043225 | anion transmembrane-transporting ATPase activity(GO:0043225) |
| 0.0 | 0.3 | GO:0051575 | 5'-deoxyribose-5-phosphate lyase activity(GO:0051575) |
| 0.0 | 1.4 | GO:0003950 | NAD+ ADP-ribosyltransferase activity(GO:0003950) |
| 0.0 | 0.1 | GO:0000026 | alpha-1,2-mannosyltransferase activity(GO:0000026) |
| 0.0 | 0.1 | GO:0032408 | MutLbeta complex binding(GO:0032406) MutSbeta complex binding(GO:0032408) |
| 0.0 | 0.2 | GO:0045134 | uridine-diphosphatase activity(GO:0045134) |
| 0.0 | 0.1 | GO:0004741 | [pyruvate dehydrogenase (lipoamide)] phosphatase activity(GO:0004741) |
| 0.0 | 0.3 | GO:0017150 | tRNA dihydrouridine synthase activity(GO:0017150) |
| 0.0 | 0.6 | GO:0052629 | phosphatidylinositol-3,5-bisphosphate 3-phosphatase activity(GO:0052629) |
| 0.0 | 0.1 | GO:0072345 | NAADP-sensitive calcium-release channel activity(GO:0072345) |
| 0.0 | 0.3 | GO:0015184 | L-cystine transmembrane transporter activity(GO:0015184) |
| 0.0 | 0.1 | GO:0016422 | mRNA (2'-O-methyladenosine-N6-)-methyltransferase activity(GO:0016422) |
| 0.0 | 0.2 | GO:0008467 | [heparan sulfate]-glucosamine 3-sulfotransferase 1 activity(GO:0008467) |
| 0.0 | 0.3 | GO:0001042 | RNA polymerase I core binding(GO:0001042) |
| 0.0 | 0.9 | GO:0031489 | myosin V binding(GO:0031489) |
| 0.0 | 0.3 | GO:0030160 | GKAP/Homer scaffold activity(GO:0030160) |
| 0.0 | 0.1 | GO:0071987 | WD40-repeat domain binding(GO:0071987) |
| 0.0 | 0.2 | GO:0031752 | D5 dopamine receptor binding(GO:0031752) |
| 0.0 | 0.3 | GO:0005047 | signal recognition particle binding(GO:0005047) |
| 0.0 | 0.4 | GO:0004383 | guanylate cyclase activity(GO:0004383) |
| 0.0 | 0.2 | GO:0004525 | ribonuclease III activity(GO:0004525) double-stranded RNA-specific ribonuclease activity(GO:0032296) |
| 0.0 | 0.1 | GO:0046997 | oxidoreductase activity, acting on the CH-NH group of donors, flavin as acceptor(GO:0046997) |
| 0.0 | 0.1 | GO:0004132 | dCMP deaminase activity(GO:0004132) |
| 0.0 | 0.8 | GO:0004859 | phospholipase inhibitor activity(GO:0004859) |
| 0.0 | 0.4 | GO:0019103 | pyrimidine nucleotide binding(GO:0019103) |
| 0.0 | 0.1 | GO:0004345 | glucose-6-phosphate dehydrogenase activity(GO:0004345) |
| 0.0 | 0.3 | GO:0043199 | sulfate binding(GO:0043199) |
| 0.0 | 0.1 | GO:0003827 | alpha-1,3-mannosylglycoprotein 2-beta-N-acetylglucosaminyltransferase activity(GO:0003827) |
| 0.0 | 0.3 | GO:0004032 | alditol:NADP+ 1-oxidoreductase activity(GO:0004032) |
| 0.0 | 0.2 | GO:0010484 | H3 histone acetyltransferase activity(GO:0010484) |
| 0.0 | 0.5 | GO:0008179 | adenylate cyclase binding(GO:0008179) |
| 0.0 | 0.1 | GO:0005151 | interleukin-1, Type II receptor binding(GO:0005151) |
| 0.0 | 1.4 | GO:0004115 | 3',5'-cyclic-AMP phosphodiesterase activity(GO:0004115) |
| 0.0 | 0.3 | GO:0043176 | amine binding(GO:0043176) serotonin binding(GO:0051378) |
| 0.0 | 0.2 | GO:0016884 | carbon-nitrogen ligase activity, with glutamine as amido-N-donor(GO:0016884) |
| 0.0 | 0.3 | GO:0004969 | histamine receptor activity(GO:0004969) |
| 0.0 | 0.4 | GO:0031433 | telethonin binding(GO:0031433) |
| 0.0 | 0.2 | GO:0047696 | beta-adrenergic receptor kinase activity(GO:0047696) |
| 0.0 | 0.2 | GO:1990226 | histone methyltransferase binding(GO:1990226) |
| 0.0 | 0.3 | GO:0097322 | 7SK snRNA binding(GO:0097322) |
| 0.0 | 0.2 | GO:0030292 | protein tyrosine kinase inhibitor activity(GO:0030292) |
| 0.0 | 0.3 | GO:0046920 | alpha-(1->3)-fucosyltransferase activity(GO:0046920) |
| 0.0 | 0.4 | GO:0048156 | tau protein binding(GO:0048156) |
| 0.0 | 0.2 | GO:0001517 | N-acetylglucosamine 6-O-sulfotransferase activity(GO:0001517) |
| 0.0 | 0.1 | GO:0051185 | coenzyme transporter activity(GO:0051185) |
| 0.0 | 0.7 | GO:0051010 | microtubule plus-end binding(GO:0051010) |
| 0.0 | 0.1 | GO:0009383 | rRNA (cytosine-C5-)-methyltransferase activity(GO:0009383) |
| 0.0 | 0.1 | GO:0010861 | thyroid hormone receptor activator activity(GO:0010861) thyroid hormone receptor coactivator activity(GO:0030375) |
| 0.0 | 0.1 | GO:0016429 | tRNA (adenine-N1-)-methyltransferase activity(GO:0016429) |
| 0.0 | 0.5 | GO:0034452 | dynactin binding(GO:0034452) |
| 0.0 | 0.1 | GO:0035650 | AP-1 adaptor complex binding(GO:0035650) |
| 0.0 | 0.3 | GO:0047555 | 3',5'-cyclic-GMP phosphodiesterase activity(GO:0047555) |
| 0.0 | 0.8 | GO:0003887 | DNA-directed DNA polymerase activity(GO:0003887) |
| 0.0 | 0.3 | GO:0097371 | MDM2/MDM4 family protein binding(GO:0097371) |
| 0.0 | 0.6 | GO:0005521 | lamin binding(GO:0005521) |
| 0.0 | 0.1 | GO:0050220 | prostaglandin-E synthase activity(GO:0050220) |
| 0.0 | 0.4 | GO:0004143 | diacylglycerol kinase activity(GO:0004143) |
| 0.0 | 1.0 | GO:0015248 | sterol transporter activity(GO:0015248) |
| 0.0 | 0.3 | GO:0016015 | morphogen activity(GO:0016015) |
| 0.0 | 0.1 | GO:0005457 | GDP-fucose transmembrane transporter activity(GO:0005457) purine nucleotide-sugar transmembrane transporter activity(GO:0036080) |
| 0.0 | 0.6 | GO:0032794 | GTPase activating protein binding(GO:0032794) |
| 0.0 | 0.1 | GO:0055077 | gap junction hemi-channel activity(GO:0055077) |
| 0.0 | 0.1 | GO:0070644 | vitamin D response element binding(GO:0070644) |
| 0.0 | 0.2 | GO:0070699 | type II activin receptor binding(GO:0070699) |
| 0.0 | 1.1 | GO:0050699 | WW domain binding(GO:0050699) |
| 0.0 | 0.1 | GO:0008670 | 2,4-dienoyl-CoA reductase (NADPH) activity(GO:0008670) |
| 0.0 | 0.2 | GO:0033743 | peptide-methionine (R)-S-oxide reductase activity(GO:0033743) |
| 0.0 | 0.5 | GO:0051371 | muscle alpha-actinin binding(GO:0051371) |
| 0.0 | 0.1 | GO:0097027 | ubiquitin-protein transferase activator activity(GO:0097027) |
| 0.0 | 0.1 | GO:0004874 | aryl hydrocarbon receptor activity(GO:0004874) |
| 0.0 | 0.1 | GO:0004582 | dolichyl-phosphate beta-D-mannosyltransferase activity(GO:0004582) |
| 0.0 | 0.2 | GO:1990239 | steroid hormone binding(GO:1990239) |
| 0.0 | 0.7 | GO:0030332 | cyclin binding(GO:0030332) |
| 0.0 | 0.2 | GO:0003876 | AMP deaminase activity(GO:0003876) adenosine-phosphate deaminase activity(GO:0047623) |
| 0.0 | 0.1 | GO:0005166 | neurotrophin p75 receptor binding(GO:0005166) |
| 0.0 | 0.5 | GO:0004862 | cAMP-dependent protein kinase inhibitor activity(GO:0004862) |
| 0.0 | 0.6 | GO:0019198 | transmembrane receptor protein tyrosine phosphatase activity(GO:0005001) transmembrane receptor protein phosphatase activity(GO:0019198) |
| 0.0 | 0.6 | GO:0042605 | peptide antigen binding(GO:0042605) |
| 0.0 | 0.3 | GO:0030275 | LRR domain binding(GO:0030275) |
| 0.0 | 0.2 | GO:0036402 | proteasome-activating ATPase activity(GO:0036402) |
| 0.0 | 0.3 | GO:0001094 | TFIID-class transcription factor binding(GO:0001094) |
| 0.0 | 1.3 | GO:0030374 | ligand-dependent nuclear receptor transcription coactivator activity(GO:0030374) |
| 0.0 | 0.1 | GO:0016520 | growth hormone-releasing hormone receptor activity(GO:0016520) |
| 0.0 | 0.1 | GO:0004137 | deoxycytidine kinase activity(GO:0004137) |
| 0.0 | 3.8 | GO:0017124 | SH3 domain binding(GO:0017124) |
| 0.0 | 0.6 | GO:0044183 | protein binding involved in protein folding(GO:0044183) |
| 0.0 | 0.2 | GO:0004526 | ribonuclease P activity(GO:0004526) |
| 0.0 | 5.3 | GO:0061630 | ubiquitin protein ligase activity(GO:0061630) |
| 0.0 | 0.2 | GO:0043495 | protein anchor(GO:0043495) |
| 0.0 | 0.2 | GO:0015386 | potassium:proton antiporter activity(GO:0015386) |
| 0.0 | 0.2 | GO:0008474 | palmitoyl-(protein) hydrolase activity(GO:0008474) palmitoyl hydrolase activity(GO:0098599) |
| 0.0 | 7.4 | GO:0005096 | GTPase activator activity(GO:0005096) |
| 0.0 | 0.2 | GO:0003680 | AT DNA binding(GO:0003680) |
| 0.0 | 0.3 | GO:0010314 | phosphatidylinositol-5-phosphate binding(GO:0010314) |
| 0.0 | 0.3 | GO:0043014 | alpha-tubulin binding(GO:0043014) |
| 0.0 | 0.2 | GO:0008266 | poly(U) RNA binding(GO:0008266) |
| 0.0 | 0.1 | GO:0045545 | syndecan binding(GO:0045545) |
| 0.0 | 0.4 | GO:0016881 | acid-amino acid ligase activity(GO:0016881) |
| 0.0 | 0.1 | GO:0047374 | methylumbelliferyl-acetate deacetylase activity(GO:0047374) |
| 0.0 | 0.1 | GO:0032795 | heterotrimeric G-protein binding(GO:0032795) |
| 0.0 | 0.2 | GO:0042974 | retinoic acid receptor binding(GO:0042974) |
| 0.0 | 0.0 | GO:0070984 | SET domain binding(GO:0070984) |
| 0.0 | 0.4 | GO:0008494 | translation activator activity(GO:0008494) |
| 0.0 | 0.1 | GO:0086089 | voltage-gated potassium channel activity involved in atrial cardiac muscle cell action potential repolarization(GO:0086089) |
| 0.0 | 0.2 | GO:0010181 | FMN binding(GO:0010181) |
| 0.0 | 0.3 | GO:0008432 | JUN kinase binding(GO:0008432) |
| 0.0 | 0.1 | GO:0030060 | L-malate dehydrogenase activity(GO:0030060) |
| 0.0 | 0.6 | GO:0031492 | nucleosomal DNA binding(GO:0031492) |
| 0.0 | 0.1 | GO:0016435 | rRNA (guanine) methyltransferase activity(GO:0016435) |
| 0.0 | 0.2 | GO:0042731 | PH domain binding(GO:0042731) |
| 0.0 | 0.4 | GO:0004298 | threonine-type endopeptidase activity(GO:0004298) threonine-type peptidase activity(GO:0070003) |
| 0.0 | 0.1 | GO:0004449 | isocitrate dehydrogenase (NAD+) activity(GO:0004449) |
| 0.0 | 0.1 | GO:0042799 | histone methyltransferase activity (H4-K20 specific)(GO:0042799) |
| 0.0 | 0.4 | GO:0070742 | C2H2 zinc finger domain binding(GO:0070742) |
| 0.0 | 0.1 | GO:0061659 | ubiquitin-like protein ligase activity(GO:0061659) |
| 0.0 | 0.5 | GO:0048487 | beta-tubulin binding(GO:0048487) |
| 0.0 | 0.1 | GO:0017128 | phospholipid scramblase activity(GO:0017128) |
| 0.0 | 0.3 | GO:0042162 | telomeric DNA binding(GO:0042162) |
| 0.0 | 0.2 | GO:0016594 | glycine binding(GO:0016594) |
| 0.0 | 0.2 | GO:0017017 | MAP kinase tyrosine/serine/threonine phosphatase activity(GO:0017017) |
| 0.0 | 0.4 | GO:0000983 | transcription factor activity, RNA polymerase II core promoter sequence-specific(GO:0000983) |
| 0.0 | 0.1 | GO:0000774 | adenyl-nucleotide exchange factor activity(GO:0000774) |
| 0.0 | 0.1 | GO:0001135 | transcription factor activity, RNA polymerase II transcription factor recruiting(GO:0001135) |
| 0.0 | 0.1 | GO:0002151 | G-quadruplex RNA binding(GO:0002151) |
| 0.0 | 0.1 | GO:0036310 | annealing helicase activity(GO:0036310) |
| 0.0 | 0.7 | GO:0004683 | calmodulin-dependent protein kinase activity(GO:0004683) |
| 0.0 | 0.7 | GO:0001076 | transcription factor activity, RNA polymerase II transcription factor binding(GO:0001076) |
| 0.0 | 3.8 | GO:0019787 | ubiquitin-like protein transferase activity(GO:0019787) |
| 0.0 | 0.8 | GO:0001191 | transcriptional repressor activity, RNA polymerase II transcription factor binding(GO:0001191) |
| 0.0 | 0.6 | GO:0050681 | androgen receptor binding(GO:0050681) |
| 0.0 | 0.4 | GO:0001103 | RNA polymerase II repressing transcription factor binding(GO:0001103) |
| 0.0 | 0.1 | GO:0015450 | P-P-bond-hydrolysis-driven protein transmembrane transporter activity(GO:0015450) |
| 0.0 | 0.0 | GO:0030350 | iron-responsive element binding(GO:0030350) |
| 0.0 | 0.2 | GO:0070182 | DNA polymerase binding(GO:0070182) |
| 0.0 | 0.1 | GO:0004473 | malic enzyme activity(GO:0004470) malate dehydrogenase (decarboxylating) (NAD+) activity(GO:0004471) malate dehydrogenase (decarboxylating) (NADP+) activity(GO:0004473) |
| 0.0 | 0.1 | GO:0019966 | interleukin-1 binding(GO:0019966) |
| 0.0 | 1.0 | GO:0008013 | beta-catenin binding(GO:0008013) |
| 0.0 | 0.8 | GO:0048306 | calcium-dependent protein binding(GO:0048306) |
| 0.0 | 3.7 | GO:0003714 | transcription corepressor activity(GO:0003714) |
| 0.0 | 0.3 | GO:0005184 | neuropeptide hormone activity(GO:0005184) |
| 0.0 | 0.1 | GO:0070181 | small ribosomal subunit rRNA binding(GO:0070181) |
| 0.0 | 0.1 | GO:0004861 | cyclin-dependent protein serine/threonine kinase inhibitor activity(GO:0004861) |
| 0.0 | 0.6 | GO:0031593 | polyubiquitin binding(GO:0031593) |
Gene overrepresentation in curated gene sets: canonical pathways category:
| Log-likelihood per target | Total log-likelihood | Term | Description |
|---|---|---|---|
| 0.2 | 2.9 | ST IL 13 PATHWAY | Interleukin 13 (IL-13) Pathway |
| 0.1 | 1.8 | PID INTEGRIN4 PATHWAY | Alpha6 beta4 integrin-ligand interactions |
| 0.1 | 2.8 | PID S1P META PATHWAY | Sphingosine 1-phosphate (S1P) pathway |
| 0.1 | 0.3 | PID S1P S1P4 PATHWAY | S1P4 pathway |
| 0.1 | 0.1 | SIG BCR SIGNALING PATHWAY | Members of the BCR signaling pathway |
| 0.1 | 1.3 | PID INTEGRIN5 PATHWAY | Beta5 beta6 beta7 and beta8 integrin cell surface interactions |
| 0.1 | 1.4 | SIG CD40PATHWAYMAP | Genes related to CD40 signaling |
| 0.1 | 4.8 | PID INTEGRIN A4B1 PATHWAY | Alpha4 beta1 integrin signaling events |
| 0.0 | 3.8 | PID PLK1 PATHWAY | PLK1 signaling events |
| 0.0 | 1.5 | PID DNA PK PATHWAY | DNA-PK pathway in nonhomologous end joining |
| 0.0 | 1.9 | PID LIS1 PATHWAY | Lissencephaly gene (LIS1) in neuronal migration and development |
| 0.0 | 2.4 | ST P38 MAPK PATHWAY | p38 MAPK Pathway |
| 0.0 | 2.2 | PID CD40 PATHWAY | CD40/CD40L signaling |
| 0.0 | 0.4 | ST TYPE I INTERFERON PATHWAY | Type I Interferon (alpha/beta IFN) Pathway |
| 0.0 | 0.4 | PID S1P S1P1 PATHWAY | S1P1 pathway |
| 0.0 | 1.9 | PID ATR PATHWAY | ATR signaling pathway |
| 0.0 | 4.0 | PID HIF1 TFPATHWAY | HIF-1-alpha transcription factor network |
| 0.0 | 2.0 | ST G ALPHA I PATHWAY | G alpha i Pathway |
| 0.0 | 0.6 | PID LPA4 PATHWAY | LPA4-mediated signaling events |
| 0.0 | 2.4 | PID P73PATHWAY | p73 transcription factor network |
| 0.0 | 0.4 | PID PDGFRA PATHWAY | PDGFR-alpha signaling pathway |
| 0.0 | 0.1 | PID S1P S1P2 PATHWAY | S1P2 pathway |
| 0.0 | 5.4 | PID P53 DOWNSTREAM PATHWAY | Direct p53 effectors |
| 0.0 | 1.6 | PID IL12 2PATHWAY | IL12-mediated signaling events |
| 0.0 | 1.2 | PID RHOA PATHWAY | RhoA signaling pathway |
| 0.0 | 0.9 | PID P53 REGULATION PATHWAY | p53 pathway |
| 0.0 | 0.6 | PID ARF 3PATHWAY | Arf1 pathway |
| 0.0 | 0.8 | PID TCR CALCIUM PATHWAY | Calcium signaling in the CD4+ TCR pathway |
| 0.0 | 1.0 | PID FOXM1 PATHWAY | FOXM1 transcription factor network |
| 0.0 | 1.3 | PID FOXO PATHWAY | FoxO family signaling |
| 0.0 | 0.6 | PID HEDGEHOG 2PATHWAY | Signaling events mediated by the Hedgehog family |
| 0.0 | 0.5 | PID ATM PATHWAY | ATM pathway |
| 0.0 | 1.0 | PID LKB1 PATHWAY | LKB1 signaling events |
| 0.0 | 0.6 | PID WNT SIGNALING PATHWAY | Wnt signaling network |
| 0.0 | 0.1 | PID BETA CATENIN DEG PATHWAY | Degradation of beta catenin |
| 0.0 | 0.1 | ST INTERFERON GAMMA PATHWAY | Interferon gamma pathway. |
| 0.0 | 0.3 | SA FAS SIGNALING | The TNF-type receptor Fas induces apoptosis on ligand binding. |
| 0.0 | 1.0 | PID VEGFR1 2 PATHWAY | Signaling events mediated by VEGFR1 and VEGFR2 |
| 0.0 | 0.6 | PID AR TF PATHWAY | Regulation of Androgen receptor activity |
| 0.0 | 0.3 | PID IL23 PATHWAY | IL23-mediated signaling events |
| 0.0 | 1.1 | PID E2F PATHWAY | E2F transcription factor network |
| 0.0 | 0.5 | NABA BASEMENT MEMBRANES | Genes encoding structural components of basement membranes |
| 0.0 | 0.2 | PID CXCR4 PATHWAY | CXCR4-mediated signaling events |
Gene overrepresentation in curated gene sets: REACTOME pathways category:
| Log-likelihood per target | Total log-likelihood | Term | Description |
|---|---|---|---|
| 0.2 | 6.6 | REACTOME ANTIGEN PRESENTATION FOLDING ASSEMBLY AND PEPTIDE LOADING OF CLASS I MHC | Genes involved in Antigen Presentation: Folding, assembly and peptide loading of class I MHC |
| 0.2 | 2.9 | REACTOME IL 6 SIGNALING | Genes involved in Interleukin-6 signaling |
| 0.2 | 2.3 | REACTOME REMOVAL OF THE FLAP INTERMEDIATE FROM THE C STRAND | Genes involved in Removal of the Flap Intermediate from the C-strand |
| 0.1 | 0.8 | REACTOME PROCESSIVE SYNTHESIS ON THE LAGGING STRAND | Genes involved in Processive synthesis on the lagging strand |
| 0.1 | 1.8 | REACTOME PYRIMIDINE CATABOLISM | Genes involved in Pyrimidine catabolism |
| 0.1 | 3.6 | REACTOME SIGNALING BY NODAL | Genes involved in Signaling by NODAL |
| 0.1 | 1.3 | REACTOME PURINE RIBONUCLEOSIDE MONOPHOSPHATE BIOSYNTHESIS | Genes involved in Purine ribonucleoside monophosphate biosynthesis |
| 0.1 | 2.9 | REACTOME PYRUVATE METABOLISM | Genes involved in Pyruvate metabolism |
| 0.1 | 1.8 | REACTOME HYALURONAN UPTAKE AND DEGRADATION | Genes involved in Hyaluronan uptake and degradation |
| 0.1 | 3.2 | REACTOME ASSOCIATION OF TRIC CCT WITH TARGET PROTEINS DURING BIOSYNTHESIS | Genes involved in Association of TriC/CCT with target proteins during biosynthesis |
| 0.1 | 1.5 | REACTOME SYNTHESIS OF PE | Genes involved in Synthesis of PE |
| 0.1 | 1.0 | REACTOME SYNTHESIS OF SUBSTRATES IN N GLYCAN BIOSYTHESIS | Genes involved in Synthesis of substrates in N-glycan biosythesis |
| 0.1 | 1.5 | REACTOME G1 S SPECIFIC TRANSCRIPTION | Genes involved in G1/S-Specific Transcription |
| 0.0 | 2.9 | REACTOME GLYCOLYSIS | Genes involved in Glycolysis |
| 0.0 | 4.7 | REACTOME INTERFERON ALPHA BETA SIGNALING | Genes involved in Interferon alpha/beta signaling |
| 0.0 | 1.5 | REACTOME SIGNAL REGULATORY PROTEIN SIRP FAMILY INTERACTIONS | Genes involved in Signal regulatory protein (SIRP) family interactions |
| 0.0 | 0.7 | REACTOME ANDROGEN BIOSYNTHESIS | Genes involved in Androgen biosynthesis |
| 0.0 | 1.0 | REACTOME CYCLIN A B1 ASSOCIATED EVENTS DURING G2 M TRANSITION | Genes involved in Cyclin A/B1 associated events during G2/M transition |
| 0.0 | 0.2 | REACTOME ROLE OF SECOND MESSENGERS IN NETRIN1 SIGNALING | Genes involved in Role of second messengers in netrin-1 signaling |
| 0.0 | 1.6 | REACTOME BASIGIN INTERACTIONS | Genes involved in Basigin interactions |
| 0.0 | 0.2 | REACTOME ACETYLCHOLINE NEUROTRANSMITTER RELEASE CYCLE | Genes involved in Acetylcholine Neurotransmitter Release Cycle |
| 0.0 | 0.5 | REACTOME P38MAPK EVENTS | Genes involved in p38MAPK events |
| 0.0 | 0.6 | REACTOME ADENYLATE CYCLASE ACTIVATING PATHWAY | Genes involved in Adenylate cyclase activating pathway |
| 0.0 | 1.5 | REACTOME SYNTHESIS OF PIPS AT THE PLASMA MEMBRANE | Genes involved in Synthesis of PIPs at the plasma membrane |
| 0.0 | 1.1 | REACTOME PEROXISOMAL LIPID METABOLISM | Genes involved in Peroxisomal lipid metabolism |
| 0.0 | 0.3 | REACTOME ELEVATION OF CYTOSOLIC CA2 LEVELS | Genes involved in Elevation of cytosolic Ca2+ levels |
| 0.0 | 2.6 | REACTOME CELL SURFACE INTERACTIONS AT THE VASCULAR WALL | Genes involved in Cell surface interactions at the vascular wall |
| 0.0 | 0.3 | REACTOME RAF MAP KINASE CASCADE | Genes involved in RAF/MAP kinase cascade |
| 0.0 | 0.5 | REACTOME ROLE OF DCC IN REGULATING APOPTOSIS | Genes involved in Role of DCC in regulating apoptosis |
| 0.0 | 1.2 | REACTOME ACTIVATION OF ATR IN RESPONSE TO REPLICATION STRESS | Genes involved in Activation of ATR in response to replication stress |
| 0.0 | 0.5 | REACTOME INTEGRATION OF PROVIRUS | Genes involved in Integration of provirus |
| 0.0 | 0.5 | REACTOME MRNA DECAY BY 5 TO 3 EXORIBONUCLEASE | Genes involved in mRNA Decay by 5' to 3' Exoribonuclease |
| 0.0 | 0.1 | REACTOME ER PHAGOSOME PATHWAY | Genes involved in ER-Phagosome pathway |
| 0.0 | 0.5 | REACTOME DSCAM INTERACTIONS | Genes involved in DSCAM interactions |
| 0.0 | 0.8 | REACTOME AMINO ACID SYNTHESIS AND INTERCONVERSION TRANSAMINATION | Genes involved in Amino acid synthesis and interconversion (transamination) |
| 0.0 | 0.6 | REACTOME PROCESSING OF INTRONLESS PRE MRNAS | Genes involved in Processing of Intronless Pre-mRNAs |
| 0.0 | 0.3 | REACTOME MEMBRANE BINDING AND TARGETTING OF GAG PROTEINS | Genes involved in Membrane binding and targetting of GAG proteins |
| 0.0 | 0.5 | REACTOME BIOSYNTHESIS OF THE N GLYCAN PRECURSOR DOLICHOL LIPID LINKED OLIGOSACCHARIDE LLO AND TRANSFER TO A NASCENT PROTEIN | Genes involved in Biosynthesis of the N-glycan precursor (dolichol lipid-linked oligosaccharide, LLO) and transfer to a nascent protein |
| 0.0 | 0.7 | REACTOME REGULATION OF AMPK ACTIVITY VIA LKB1 | Genes involved in Regulation of AMPK activity via LKB1 |
| 0.0 | 0.1 | REACTOME IRAK1 RECRUITS IKK COMPLEX | Genes involved in IRAK1 recruits IKK complex |
| 0.0 | 0.5 | REACTOME TETRAHYDROBIOPTERIN BH4 SYNTHESIS RECYCLING SALVAGE AND REGULATION | Genes involved in Tetrahydrobiopterin (BH4) synthesis, recycling, salvage and regulation |
| 0.0 | 0.3 | REACTOME RECRUITMENT OF NUMA TO MITOTIC CENTROSOMES | Genes involved in Recruitment of NuMA to mitotic centrosomes |
| 0.0 | 0.3 | REACTOME SEROTONIN RECEPTORS | Genes involved in Serotonin receptors |
| 0.0 | 0.5 | REACTOME DESTABILIZATION OF MRNA BY BRF1 | Genes involved in Destabilization of mRNA by Butyrate Response Factor 1 (BRF1) |
| 0.0 | 0.4 | REACTOME CYCLIN E ASSOCIATED EVENTS DURING G1 S TRANSITION | Genes involved in Cyclin E associated events during G1/S transition |
| 0.0 | 0.2 | REACTOME PHOSPHOLIPASE C MEDIATED CASCADE | Genes involved in Phospholipase C-mediated cascade |
| 0.0 | 0.5 | REACTOME AKT PHOSPHORYLATES TARGETS IN THE CYTOSOL | Genes involved in AKT phosphorylates targets in the cytosol |
| 0.0 | 0.1 | REACTOME ADVANCED GLYCOSYLATION ENDPRODUCT RECEPTOR SIGNALING | Genes involved in Advanced glycosylation endproduct receptor signaling |
| 0.0 | 0.2 | REACTOME REGULATION OF IFNG SIGNALING | Genes involved in Regulation of IFNG signaling |
| 0.0 | 1.9 | REACTOME IMMUNOREGULATORY INTERACTIONS BETWEEN A LYMPHOID AND A NON LYMPHOID CELL | Genes involved in Immunoregulatory interactions between a Lymphoid and a non-Lymphoid cell |
| 0.0 | 0.4 | REACTOME PYRIMIDINE METABOLISM | Genes involved in Pyrimidine metabolism |
| 0.0 | 0.9 | REACTOME REGULATION OF MITOTIC CELL CYCLE | Genes involved in Regulation of mitotic cell cycle |
| 0.0 | 0.5 | REACTOME CRMPS IN SEMA3A SIGNALING | Genes involved in CRMPs in Sema3A signaling |
| 0.0 | 0.5 | REACTOME FORMATION OF INCISION COMPLEX IN GG NER | Genes involved in Formation of incision complex in GG-NER |
| 0.0 | 0.9 | REACTOME INTERFERON GAMMA SIGNALING | Genes involved in Interferon gamma signaling |
| 0.0 | 0.1 | REACTOME THROMBOXANE SIGNALLING THROUGH TP RECEPTOR | Genes involved in Thromboxane signalling through TP receptor |
| 0.0 | 2.4 | REACTOME CELL JUNCTION ORGANIZATION | Genes involved in Cell junction organization |
| 0.0 | 0.7 | REACTOME TAK1 ACTIVATES NFKB BY PHOSPHORYLATION AND ACTIVATION OF IKKS COMPLEX | Genes involved in TAK1 activates NFkB by phosphorylation and activation of IKKs complex |
| 0.0 | 0.5 | REACTOME MICRORNA MIRNA BIOGENESIS | Genes involved in MicroRNA (miRNA) Biogenesis |
| 0.0 | 0.1 | REACTOME VIF MEDIATED DEGRADATION OF APOBEC3G | Genes involved in Vif-mediated degradation of APOBEC3G |
| 0.0 | 1.4 | REACTOME ACTIVATION OF NF KAPPAB IN B CELLS | Genes involved in Activation of NF-kappaB in B Cells |
| 0.0 | 4.0 | REACTOME SIGNALING BY RHO GTPASES | Genes involved in Signaling by Rho GTPases |
| 0.0 | 0.2 | REACTOME N GLYCAN TRIMMING IN THE ER AND CALNEXIN CALRETICULIN CYCLE | Genes involved in N-glycan trimming in the ER and Calnexin/Calreticulin cycle |
| 0.0 | 0.5 | REACTOME G1 PHASE | Genes involved in G1 Phase |
| 0.0 | 0.2 | REACTOME PURINE CATABOLISM | Genes involved in Purine catabolism |
| 0.0 | 0.3 | REACTOME PURINE SALVAGE | Genes involved in Purine salvage |
| 0.0 | 0.4 | REACTOME INSULIN SYNTHESIS AND PROCESSING | Genes involved in Insulin Synthesis and Processing |
| 0.0 | 0.7 | REACTOME NITRIC OXIDE STIMULATES GUANYLATE CYCLASE | Genes involved in Nitric oxide stimulates guanylate cyclase |
| 0.0 | 3.5 | REACTOME G ALPHA I SIGNALLING EVENTS | Genes involved in G alpha (i) signalling events |
| 0.0 | 1.0 | REACTOME ACTIVATION OF CHAPERONE GENES BY XBP1S | Genes involved in Activation of Chaperone Genes by XBP1(S) |
| 0.0 | 0.0 | REACTOME ASPARAGINE N LINKED GLYCOSYLATION | Genes involved in Asparagine N-linked glycosylation |
| 0.0 | 0.1 | REACTOME DNA STRAND ELONGATION | Genes involved in DNA strand elongation |
| 0.0 | 0.2 | REACTOME G ALPHA1213 SIGNALLING EVENTS | Genes involved in G alpha (12/13) signalling events |
| 0.0 | 0.0 | REACTOME NOREPINEPHRINE NEUROTRANSMITTER RELEASE CYCLE | Genes involved in Norepinephrine Neurotransmitter Release Cycle |
| 0.0 | 0.2 | REACTOME DESTABILIZATION OF MRNA BY AUF1 HNRNP D0 | Genes involved in Destabilization of mRNA by AUF1 (hnRNP D0) |
| 0.0 | 0.2 | REACTOME DOPAMINE NEUROTRANSMITTER RELEASE CYCLE | Genes involved in Dopamine Neurotransmitter Release Cycle |
| 0.0 | 0.3 | REACTOME STEROID HORMONES | Genes involved in Steroid hormones |
| 0.0 | 0.8 | REACTOME STRIATED MUSCLE CONTRACTION | Genes involved in Striated Muscle Contraction |
| 0.0 | 0.2 | REACTOME MTORC1 MEDIATED SIGNALLING | Genes involved in mTORC1-mediated signalling |
| 0.0 | 0.2 | REACTOME HS GAG BIOSYNTHESIS | Genes involved in HS-GAG biosynthesis |
| 0.0 | 0.3 | REACTOME DOWNREGULATION OF TGF BETA RECEPTOR SIGNALING | Genes involved in Downregulation of TGF-beta receptor signaling |
| 0.0 | 1.2 | REACTOME G ALPHA S SIGNALLING EVENTS | Genes involved in G alpha (s) signalling events |