Project
Inflammatory response time course, HUVEC (Wada, 2009)
Navigation
Downloads
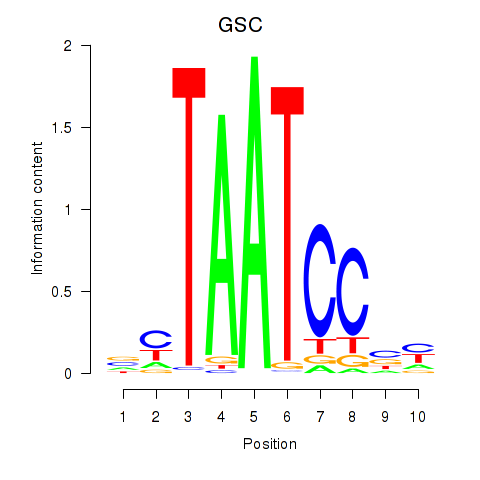
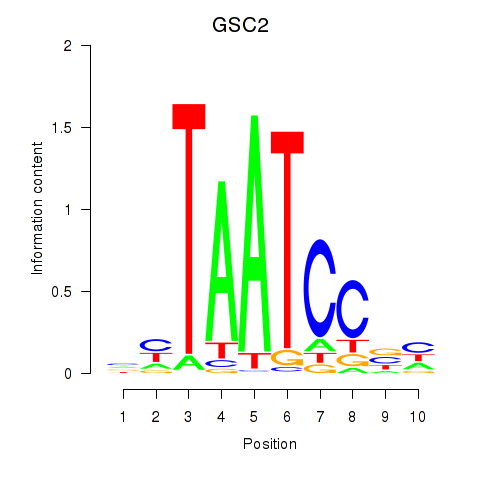
Results for GSC_GSC2
Z-value: 0.57
Motif logo
Transcription factors associated with GSC_GSC2
| Gene Symbol | Gene ID | Gene Info |
|---|---|---|
|
GSC
|
ENSG00000133937.5 | GSC |
|
GSC2
|
ENSG00000063515.3 | GSC2 |
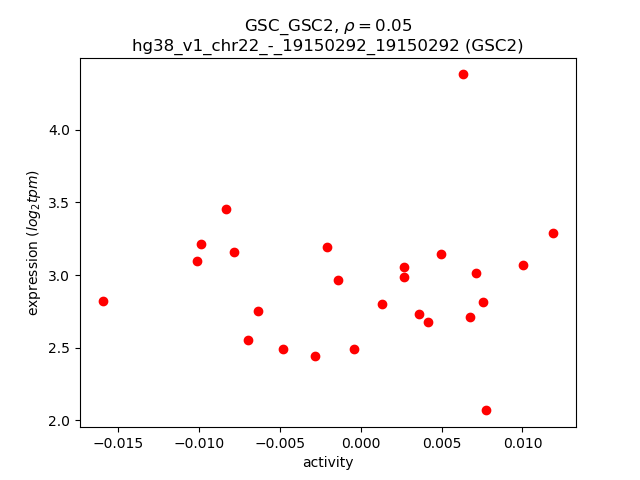
Activity-expression correlation:
| Gene | Promoter | Pearson corr. coef. | P-value | Plot |
|---|---|---|---|---|
| GSC | hg38_v1_chr14_-_94770102_94770130 | 0.22 | 2.9e-01 | Click! |
| GSC2 | hg38_v1_chr22_-_19150292_19150292 | 0.05 | 8.1e-01 | Click! |
Activity profile of GSC_GSC2 motif
Sorted Z-values of GSC_GSC2 motif
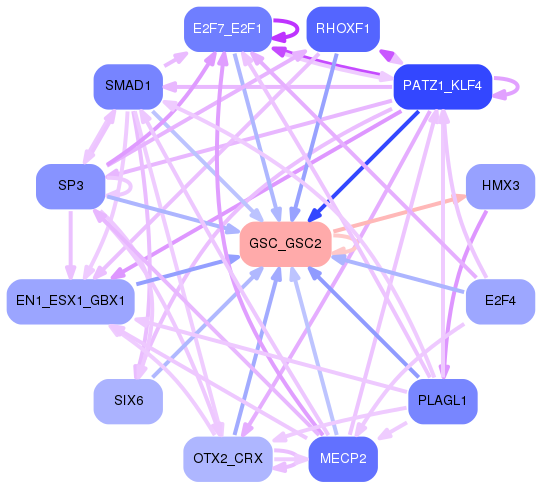
Network of associatons between targets according to the STRING database.

First level regulatory network of GSC_GSC2
| Promoter | Score | Transcript | Gene | Gene Info |
|---|---|---|---|---|
| chr17_-_55511434 | 0.76 |
ENST00000636752.1
|
SMIM36
|
small integral membrane protein 36 |
| chr19_+_2476118 | 0.63 |
ENST00000215631.9
ENST00000587345.1 |
GADD45B
|
growth arrest and DNA damage inducible beta |
| chr8_+_69466617 | 0.63 |
ENST00000525061.5
ENST00000260128.8 ENST00000458141.6 |
SULF1
|
sulfatase 1 |
| chr2_-_55269038 | 0.60 |
ENST00000417363.5
ENST00000412530.1 ENST00000366137.6 ENST00000420637.5 |
MTIF2
|
mitochondrial translational initiation factor 2 |
| chr17_+_4740005 | 0.58 |
ENST00000269289.10
|
ZMYND15
|
zinc finger MYND-type containing 15 |
| chr17_+_4740042 | 0.58 |
ENST00000592813.5
|
ZMYND15
|
zinc finger MYND-type containing 15 |
| chr2_-_70553440 | 0.57 |
ENST00000450929.5
|
TGFA
|
transforming growth factor alpha |
| chr12_+_6840800 | 0.57 |
ENST00000541978.5
ENST00000229264.8 ENST00000435982.6 |
GNB3
|
G protein subunit beta 3 |
| chr17_+_4739791 | 0.56 |
ENST00000433935.6
|
ZMYND15
|
zinc finger MYND-type containing 15 |
| chrX_+_136197020 | 0.54 |
ENST00000370676.7
|
FHL1
|
four and a half LIM domains 1 |
| chr12_+_14973020 | 0.54 |
ENST00000266395.3
|
PDE6H
|
phosphodiesterase 6H |
| chr17_-_4739866 | 0.52 |
ENST00000574412.6
ENST00000293778.12 |
CXCL16
|
C-X-C motif chemokine ligand 16 |
| chrX_-_10620419 | 0.43 |
ENST00000380782.6
|
MID1
|
midline 1 |
| chr2_+_188291994 | 0.43 |
ENST00000409927.5
ENST00000409805.5 |
GULP1
|
GULP PTB domain containing engulfment adaptor 1 |
| chrX_-_10620534 | 0.39 |
ENST00000317552.9
|
MID1
|
midline 1 |
| chr5_+_54517706 | 0.38 |
ENST00000326277.5
ENST00000381410.5 ENST00000343017.11 |
SNX18
|
sorting nexin 18 |
| chr10_+_123135938 | 0.38 |
ENST00000357878.7
|
HMX3
|
H6 family homeobox 3 |
| chr12_-_1918473 | 0.38 |
ENST00000586184.5
ENST00000587995.5 ENST00000585732.1 |
CACNA2D4
|
calcium voltage-gated channel auxiliary subunit alpha2delta 4 |
| chr4_+_125314918 | 0.37 |
ENST00000674496.2
ENST00000394329.9 |
FAT4
|
FAT atypical cadherin 4 |
| chr4_+_153222402 | 0.37 |
ENST00000676335.1
ENST00000675146.1 |
TRIM2
|
tripartite motif containing 2 |
| chr4_+_153222307 | 0.35 |
ENST00000675899.1
ENST00000675611.1 ENST00000674872.1 ENST00000676167.1 |
TRIM2
|
tripartite motif containing 2 |
| chr17_-_40703744 | 0.34 |
ENST00000264651.3
|
KRT24
|
keratin 24 |
| chr9_+_113536497 | 0.34 |
ENST00000462143.5
|
RGS3
|
regulator of G protein signaling 3 |
| chr1_+_162381703 | 0.31 |
ENST00000458626.4
|
C1orf226
|
chromosome 1 open reading frame 226 |
| chr15_+_75647877 | 0.30 |
ENST00000308527.6
|
SNX33
|
sorting nexin 33 |
| chr5_+_173889337 | 0.30 |
ENST00000520867.5
ENST00000334035.9 |
CPEB4
|
cytoplasmic polyadenylation element binding protein 4 |
| chr11_-_62984690 | 0.28 |
ENST00000421062.2
ENST00000458333.6 |
SLC22A6
|
solute carrier family 22 member 6 |
| chr14_-_100568070 | 0.27 |
ENST00000557378.6
ENST00000443071.6 ENST00000637646.1 |
BEGAIN
|
brain enriched guanylate kinase associated |
| chr1_+_113979460 | 0.26 |
ENST00000320334.5
|
OLFML3
|
olfactomedin like 3 |
| chr1_+_113979391 | 0.26 |
ENST00000393300.6
ENST00000369551.5 |
OLFML3
|
olfactomedin like 3 |
| chr10_-_125028061 | 0.26 |
ENST00000309035.11
|
CTBP2
|
C-terminal binding protein 2 |
| chrX_-_24647091 | 0.26 |
ENST00000356768.8
|
PCYT1B
|
phosphate cytidylyltransferase 1, choline, beta |
| chr4_-_146521891 | 0.23 |
ENST00000394059.8
ENST00000502607.1 ENST00000335472.12 ENST00000432059.6 |
SLC10A7
|
solute carrier family 10 member 7 |
| chr1_+_180928133 | 0.22 |
ENST00000367587.1
|
KIAA1614
|
KIAA1614 |
| chr2_-_29074515 | 0.22 |
ENST00000331664.6
|
PCARE
|
photoreceptor cilium actin regulator |
| chr6_-_35512863 | 0.22 |
ENST00000428978.1
ENST00000614066.4 ENST00000322263.8 |
TULP1
|
TUB like protein 1 |
| chr9_+_2015186 | 0.21 |
ENST00000357248.8
ENST00000450198.6 ENST00000634287.1 |
SMARCA2
|
SWI/SNF related, matrix associated, actin dependent regulator of chromatin, subfamily a, member 2 |
| chr9_+_12693327 | 0.21 |
ENST00000388918.10
|
TYRP1
|
tyrosinase related protein 1 |
| chr10_-_102418748 | 0.21 |
ENST00000020673.6
|
PSD
|
pleckstrin and Sec7 domain containing |
| chr6_+_35342535 | 0.21 |
ENST00000360694.8
ENST00000418635.6 ENST00000448077.6 |
PPARD
|
peroxisome proliferator activated receptor delta |
| chr16_+_81238682 | 0.21 |
ENST00000258168.7
ENST00000564552.1 |
BCO1
|
beta-carotene oxygenase 1 |
| chr4_-_101347492 | 0.20 |
ENST00000394854.8
|
PPP3CA
|
protein phosphatase 3 catalytic subunit alpha |
| chr18_-_43277482 | 0.20 |
ENST00000255224.8
ENST00000590752.5 ENST00000596867.1 |
SYT4
|
synaptotagmin 4 |
| chr14_-_100568475 | 0.20 |
ENST00000553553.6
|
BEGAIN
|
brain enriched guanylate kinase associated |
| chr6_+_130018565 | 0.19 |
ENST00000361794.7
ENST00000526087.5 ENST00000533560.5 |
L3MBTL3
|
L3MBTL histone methyl-lysine binding protein 3 |
| chr11_-_63015831 | 0.19 |
ENST00000430500.6
ENST00000336232.7 |
SLC22A8
|
solute carrier family 22 member 8 |
| chr1_+_156147350 | 0.19 |
ENST00000435124.5
ENST00000633494.1 |
SEMA4A
|
semaphorin 4A |
| chr12_+_57522801 | 0.18 |
ENST00000355673.8
ENST00000546632.1 ENST00000549623.1 |
MBD6
|
methyl-CpG binding domain protein 6 |
| chr17_+_50834581 | 0.18 |
ENST00000426127.1
|
WFIKKN2
|
WAP, follistatin/kazal, immunoglobulin, kunitz and netrin domain containing 2 |
| chr13_-_61427849 | 0.18 |
ENST00000409186.1
ENST00000472649.2 |
ENSG00000197991.11
LINC02339
|
novel protein long intergenic non-protein coding RNA 2339 |
| chr9_+_2015335 | 0.17 |
ENST00000636559.1
ENST00000349721.8 |
SMARCA2
|
SWI/SNF related, matrix associated, actin dependent regulator of chromatin, subfamily a, member 2 |
| chr4_+_169620509 | 0.17 |
ENST00000347613.8
|
CLCN3
|
chloride voltage-gated channel 3 |
| chr12_-_96400067 | 0.17 |
ENST00000542666.5
|
CDK17
|
cyclin dependent kinase 17 |
| chr19_+_39196956 | 0.17 |
ENST00000339852.5
|
NCCRP1
|
NCCRP1, F-box associated domain containing |
| chr11_-_119346655 | 0.17 |
ENST00000360167.4
|
MFRP
|
membrane frizzled-related protein |
| chr10_-_125161019 | 0.17 |
ENST00000411419.6
|
CTBP2
|
C-terminal binding protein 2 |
| chr1_-_21279520 | 0.17 |
ENST00000357071.8
|
ECE1
|
endothelin converting enzyme 1 |
| chr21_+_34668986 | 0.16 |
ENST00000349499.3
|
CLIC6
|
chloride intracellular channel 6 |
| chr5_-_115626161 | 0.15 |
ENST00000282382.8
|
TMED7-TICAM2
|
TMED7-TICAM2 readthrough |
| chr8_+_54616078 | 0.15 |
ENST00000220676.2
|
RP1
|
RP1 axonemal microtubule associated |
| chr1_+_16921923 | 0.15 |
ENST00000375541.10
|
CROCC
|
ciliary rootlet coiled-coil, rootletin |
| chr17_+_70104848 | 0.15 |
ENST00000392670.5
|
KCNJ16
|
potassium inwardly rectifying channel subfamily J member 16 |
| chr6_+_34466059 | 0.15 |
ENST00000620693.4
ENST00000244458.7 ENST00000374043.6 |
PACSIN1
|
protein kinase C and casein kinase substrate in neurons 1 |
| chr13_-_94479671 | 0.15 |
ENST00000377028.10
ENST00000446125.1 |
DCT
|
dopachrome tautomerase |
| chr9_-_42129125 | 0.15 |
ENST00000617422.4
ENST00000612828.4 ENST00000341990.8 ENST00000377561.7 ENST00000276974.7 |
CNTNAP3B
|
contactin associated protein family member 3B |
| chr1_+_244653081 | 0.15 |
ENST00000263831.11
ENST00000302550.16 |
DESI2
|
desumoylating isopeptidase 2 |
| chr11_+_76445001 | 0.14 |
ENST00000533988.5
ENST00000524490.5 ENST00000334736.7 ENST00000533972.5 |
EMSY
|
EMSY transcriptional repressor, BRCA2 interacting |
| chr4_+_169620527 | 0.14 |
ENST00000360642.7
ENST00000512813.5 ENST00000513761.6 |
CLCN3
|
chloride voltage-gated channel 3 |
| chr16_+_57976435 | 0.14 |
ENST00000290871.10
ENST00000441824.4 |
TEPP
|
testis, prostate and placenta expressed |
| chr16_-_57971121 | 0.13 |
ENST00000251102.13
|
CNGB1
|
cyclic nucleotide gated channel subunit beta 1 |
| chr22_-_30471986 | 0.13 |
ENST00000401751.5
ENST00000402286.5 ENST00000403066.5 ENST00000215812.9 |
SEC14L3
|
SEC14 like lipid binding 3 |
| chr18_-_26863187 | 0.13 |
ENST00000440832.7
|
AQP4
|
aquaporin 4 |
| chr1_-_146021724 | 0.13 |
ENST00000475797.1
ENST00000497365.5 ENST00000336751.11 ENST00000634927.1 ENST00000421822.2 |
HJV
|
hemojuvelin BMP co-receptor |
| chrX_+_136196750 | 0.12 |
ENST00000539015.5
|
FHL1
|
four and a half LIM domains 1 |
| chr5_+_140401860 | 0.12 |
ENST00000532219.5
ENST00000394722.7 |
ANKHD1-EIF4EBP3
ANKHD1
|
ANKHD1-EIF4EBP3 readthrough ankyrin repeat and KH domain containing 1 |
| chr2_+_191276885 | 0.12 |
ENST00000392316.5
|
MYO1B
|
myosin IB |
| chr4_+_56908094 | 0.12 |
ENST00000622863.4
ENST00000514063.2 ENST00000638187.2 ENST00000616975.5 ENST00000640343.2 |
REST
|
RE1 silencing transcription factor |
| chr22_-_29267965 | 0.12 |
ENST00000216085.12
|
RHBDD3
|
rhomboid domain containing 3 |
| chr17_+_40309161 | 0.11 |
ENST00000254066.10
|
RARA
|
retinoic acid receptor alpha |
| chrX_+_136197039 | 0.11 |
ENST00000370683.6
|
FHL1
|
four and a half LIM domains 1 |
| chr18_+_34710307 | 0.11 |
ENST00000679796.1
|
DTNA
|
dystrobrevin alpha |
| chr16_-_29863117 | 0.11 |
ENST00000566113.5
ENST00000569956.5 ENST00000570016.5 ENST00000219789.11 |
CDIPT
|
CDP-diacylglycerol--inositol 3-phosphatidyltransferase |
| chr11_-_67523396 | 0.11 |
ENST00000353903.9
ENST00000294288.5 |
CABP2
|
calcium binding protein 2 |
| chr17_-_19748341 | 0.11 |
ENST00000395555.7
|
ALDH3A1
|
aldehyde dehydrogenase 3 family member A1 |
| chr1_+_244051275 | 0.11 |
ENST00000358704.4
|
ZBTB18
|
zinc finger and BTB domain containing 18 |
| chr5_+_140401808 | 0.11 |
ENST00000616482.4
ENST00000297183.10 ENST00000360839.7 ENST00000421134.5 ENST00000394723.7 ENST00000511151.5 |
ANKHD1
|
ankyrin repeat and KH domain containing 1 |
| chr10_-_61001430 | 0.11 |
ENST00000357917.4
|
RHOBTB1
|
Rho related BTB domain containing 1 |
| chr3_-_98522514 | 0.11 |
ENST00000503004.5
ENST00000506575.1 ENST00000513452.5 ENST00000515620.5 |
CLDND1
|
claudin domain containing 1 |
| chr17_-_19748285 | 0.11 |
ENST00000570414.1
ENST00000225740.11 |
ALDH3A1
|
aldehyde dehydrogenase 3 family member A1 |
| chr19_+_3708378 | 0.11 |
ENST00000541714.7
ENST00000539908.6 |
TJP3
|
tight junction protein 3 |
| chr17_-_19748355 | 0.11 |
ENST00000494157.6
|
ALDH3A1
|
aldehyde dehydrogenase 3 family member A1 |
| chr3_+_133038366 | 0.10 |
ENST00000321871.11
ENST00000393130.7 ENST00000514894.5 ENST00000512662.5 |
TMEM108
|
transmembrane protein 108 |
| chr2_+_119759875 | 0.10 |
ENST00000263708.7
|
PTPN4
|
protein tyrosine phosphatase non-receptor type 4 |
| chr7_-_120857124 | 0.10 |
ENST00000441017.5
ENST00000424710.5 ENST00000433758.5 |
TSPAN12
|
tetraspanin 12 |
| chrX_+_41447322 | 0.10 |
ENST00000378220.2
ENST00000342595.2 |
NYX
|
nyctalopin |
| chr1_+_160343375 | 0.10 |
ENST00000294785.10
ENST00000421914.5 ENST00000438008.5 |
NCSTN
|
nicastrin |
| chr11_-_82845734 | 0.10 |
ENST00000681883.1
ENST00000680040.1 ENST00000681432.1 |
PRCP
|
prolylcarboxypeptidase |
| chr12_-_96400365 | 0.10 |
ENST00000261211.8
ENST00000543119.6 |
CDK17
|
cyclin dependent kinase 17 |
| chr7_-_105269007 | 0.10 |
ENST00000357311.7
|
SRPK2
|
SRSF protein kinase 2 |
| chr22_+_29268316 | 0.09 |
ENST00000414183.6
ENST00000333395.10 ENST00000455726.5 ENST00000332035.10 |
EWSR1
|
EWS RNA binding protein 1 |
| chr2_-_61017174 | 0.09 |
ENST00000407787.5
ENST00000398658.2 |
PUS10
|
pseudouridine synthase 10 |
| chr11_-_82846128 | 0.09 |
ENST00000679809.1
ENST00000680186.1 ENST00000681592.1 |
PRCP
|
prolylcarboxypeptidase |
| chr4_-_101347471 | 0.09 |
ENST00000323055.10
ENST00000512215.5 |
PPP3CA
|
protein phosphatase 3 catalytic subunit alpha |
| chr5_-_147081428 | 0.09 |
ENST00000394413.7
|
PPP2R2B
|
protein phosphatase 2 regulatory subunit Bbeta |
| chr1_-_160343235 | 0.08 |
ENST00000368069.7
ENST00000241704.8 ENST00000647683.1 ENST00000649787.1 |
COPA
|
COPI coat complex subunit alpha |
| chr3_-_65597886 | 0.08 |
ENST00000460329.6
|
MAGI1
|
membrane associated guanylate kinase, WW and PDZ domain containing 1 |
| chr14_-_21098848 | 0.08 |
ENST00000556174.5
ENST00000554478.5 ENST00000553980.1 ENST00000421093.6 |
ZNF219
|
zinc finger protein 219 |
| chr7_+_117020191 | 0.08 |
ENST00000434836.5
ENST00000393443.5 ENST00000465133.5 ENST00000477742.5 ENST00000393444.7 ENST00000393447.8 |
ST7
|
suppression of tumorigenicity 7 |
| chr4_-_110636963 | 0.08 |
ENST00000394595.8
|
PITX2
|
paired like homeodomain 2 |
| chr19_-_48044037 | 0.08 |
ENST00000293255.3
|
CABP5
|
calcium binding protein 5 |
| chr3_-_49021045 | 0.08 |
ENST00000440857.5
|
DALRD3
|
DALR anticodon binding domain containing 3 |
| chr4_+_56907876 | 0.08 |
ENST00000640168.2
ENST00000309042.12 |
REST
|
RE1 silencing transcription factor |
| chr8_-_80080816 | 0.08 |
ENST00000520527.5
ENST00000517427.5 ENST00000379097.7 ENST00000448733.3 |
TPD52
|
tumor protein D52 |
| chr3_+_130560334 | 0.08 |
ENST00000358511.10
|
COL6A6
|
collagen type VI alpha 6 chain |
| chr16_-_69339493 | 0.08 |
ENST00000562595.5
ENST00000615447.1 ENST00000306875.10 ENST00000562081.2 |
COG8
|
component of oligomeric golgi complex 8 |
| chr7_-_98252117 | 0.08 |
ENST00000420697.1
ENST00000415086.5 ENST00000447648.7 |
TECPR1
|
tectonin beta-propeller repeat containing 1 |
| chr5_+_141213919 | 0.08 |
ENST00000341948.6
|
PCDHB13
|
protocadherin beta 13 |
| chr18_-_72865680 | 0.08 |
ENST00000397929.5
|
NETO1
|
neuropilin and tolloid like 1 |
| chr1_+_197268222 | 0.08 |
ENST00000367400.8
ENST00000638467.1 ENST00000367399.6 |
CRB1
|
crumbs cell polarity complex component 1 |
| chr19_-_51034993 | 0.08 |
ENST00000684732.1
|
KLK12
|
kallikrein related peptidase 12 |
| chr14_+_51860632 | 0.07 |
ENST00000555472.5
ENST00000556766.5 |
GNG2
|
G protein subunit gamma 2 |
| chr3_-_193554799 | 0.07 |
ENST00000295548.3
|
ATP13A4
|
ATPase 13A4 |
| chr11_-_70717994 | 0.07 |
ENST00000659264.1
|
SHANK2
|
SH3 and multiple ankyrin repeat domains 2 |
| chrX_+_101078861 | 0.07 |
ENST00000372930.5
|
TMEM35A
|
transmembrane protein 35A |
| chr15_+_58138368 | 0.07 |
ENST00000219919.9
ENST00000536493.1 |
AQP9
|
aquaporin 9 |
| chr12_-_54981838 | 0.07 |
ENST00000316577.12
|
TESPA1
|
thymocyte expressed, positive selection associated 1 |
| chr17_-_9905248 | 0.07 |
ENST00000226193.6
|
RCVRN
|
recoverin |
| chr11_-_47176851 | 0.07 |
ENST00000629231.2
ENST00000526342.5 ENST00000528444.5 ENST00000530596.5 ENST00000525398.5 ENST00000524782.6 ENST00000527927.5 ENST00000525314.5 |
ARFGAP2
|
ADP ribosylation factor GTPase activating protein 2 |
| chr6_-_35512882 | 0.07 |
ENST00000229771.11
|
TULP1
|
TUB like protein 1 |
| chr1_-_113905020 | 0.07 |
ENST00000432415.5
ENST00000369571.2 ENST00000256658.8 ENST00000369564.5 |
AP4B1
|
adaptor related protein complex 4 subunit beta 1 |
| chr22_-_19150292 | 0.07 |
ENST00000086933.3
|
GSC2
|
goosecoid homeobox 2 |
| chr7_-_155533837 | 0.07 |
ENST00000406197.5
ENST00000321736.5 |
CNPY1
|
canopy FGF signaling regulator 1 |
| chr15_-_31161157 | 0.07 |
ENST00000542188.5
|
TRPM1
|
transient receptor potential cation channel subfamily M member 1 |
| chr16_-_23510389 | 0.07 |
ENST00000562117.1
ENST00000567468.5 ENST00000562944.5 ENST00000309859.8 |
GGA2
|
golgi associated, gamma adaptin ear containing, ARF binding protein 2 |
| chr12_-_1918639 | 0.07 |
ENST00000382722.10
|
CACNA2D4
|
calcium voltage-gated channel auxiliary subunit alpha2delta 4 |
| chr5_-_149944744 | 0.07 |
ENST00000255266.10
ENST00000617647.4 ENST00000613228.1 |
PDE6A
|
phosphodiesterase 6A |
| chr14_-_24081928 | 0.06 |
ENST00000396995.1
|
NRL
|
neural retina leucine zipper |
| chrX_-_24647300 | 0.06 |
ENST00000379144.7
|
PCYT1B
|
phosphate cytidylyltransferase 1, choline, beta |
| chr22_-_38084093 | 0.06 |
ENST00000681075.1
|
SLC16A8
|
solute carrier family 16 member 8 |
| chr14_-_24081986 | 0.06 |
ENST00000560550.1
|
NRL
|
neural retina leucine zipper |
| chr11_-_65857543 | 0.06 |
ENST00000534784.1
|
CFL1
|
cofilin 1 |
| chr6_-_41163103 | 0.06 |
ENST00000373122.8
ENST00000373113.8 |
TREM2
|
triggering receptor expressed on myeloid cells 2 |
| chr2_+_127418420 | 0.06 |
ENST00000234071.8
ENST00000429925.5 ENST00000442644.5 |
PROC
|
protein C, inactivator of coagulation factors Va and VIIIa |
| chr9_+_17135017 | 0.06 |
ENST00000380641.4
ENST00000380647.8 |
CNTLN
|
centlein |
| chr2_-_65432591 | 0.06 |
ENST00000356388.9
|
SPRED2
|
sprouty related EVH1 domain containing 2 |
| chr5_+_161848112 | 0.06 |
ENST00000393943.10
|
GABRA1
|
gamma-aminobutyric acid type A receptor subunit alpha1 |
| chr18_+_8717371 | 0.06 |
ENST00000359865.7
|
MTCL1
|
microtubule crosslinking factor 1 |
| chr10_-_75109085 | 0.06 |
ENST00000607131.5
|
DUSP13
|
dual specificity phosphatase 13 |
| chr19_-_12723925 | 0.05 |
ENST00000425528.6
ENST00000589337.5 ENST00000588216.5 |
TNPO2
|
transportin 2 |
| chr2_-_55296361 | 0.05 |
ENST00000647547.1
|
CCDC88A
|
coiled-coil domain containing 88A |
| chr5_-_16738341 | 0.05 |
ENST00000515803.5
|
MYO10
|
myosin X |
| chr17_-_4903088 | 0.05 |
ENST00000649488.2
|
CHRNE
|
cholinergic receptor nicotinic epsilon subunit |
| chr11_-_62984957 | 0.05 |
ENST00000377871.7
ENST00000360421.9 |
SLC22A6
|
solute carrier family 22 member 6 |
| chr14_+_21317535 | 0.05 |
ENST00000382933.8
|
RPGRIP1
|
RPGR interacting protein 1 |
| chr4_-_75902444 | 0.05 |
ENST00000286719.12
|
PPEF2
|
protein phosphatase with EF-hand domain 2 |
| chr6_+_35342614 | 0.05 |
ENST00000337400.6
ENST00000311565.4 |
PPARD
|
peroxisome proliferator activated receptor delta |
| chr5_+_161848314 | 0.05 |
ENST00000437025.6
|
GABRA1
|
gamma-aminobutyric acid type A receptor subunit alpha1 |
| chr14_+_30577752 | 0.05 |
ENST00000547532.5
ENST00000555429.1 |
G2E3
|
G2/M-phase specific E3 ubiquitin protein ligase |
| chr15_+_96333111 | 0.05 |
ENST00000453270.2
|
NR2F2
|
nuclear receptor subfamily 2 group F member 2 |
| chr1_-_11858935 | 0.05 |
ENST00000376468.4
|
NPPB
|
natriuretic peptide B |
| chr12_+_80707625 | 0.05 |
ENST00000228641.4
|
MYF6
|
myogenic factor 6 |
| chr15_-_31101707 | 0.05 |
ENST00000397795.6
ENST00000256552.11 ENST00000559179.2 |
TRPM1
|
transient receptor potential cation channel subfamily M member 1 |
| chr3_+_123067016 | 0.05 |
ENST00000316218.12
|
PDIA5
|
protein disulfide isomerase family A member 5 |
| chr19_-_42427379 | 0.04 |
ENST00000244289.9
|
LIPE
|
lipase E, hormone sensitive type |
| chr1_+_165543992 | 0.04 |
ENST00000294818.2
|
LRRC52
|
leucine rich repeat containing 52 |
| chr4_+_70028452 | 0.04 |
ENST00000530128.5
ENST00000381057.3 ENST00000673563.1 |
HTN3
|
histatin 3 |
| chr11_-_65857763 | 0.04 |
ENST00000531407.5
|
CFL1
|
cofilin 1 |
| chr19_+_7914823 | 0.04 |
ENST00000565886.2
|
TGFBR3L
|
transforming growth factor beta receptor 3 like |
| chr12_-_13095664 | 0.04 |
ENST00000337630.10
ENST00000545699.1 |
GSG1
|
germ cell associated 1 |
| chr16_-_275908 | 0.04 |
ENST00000359740.6
ENST00000316163.9 ENST00000397770.8 |
RGS11
|
regulator of G protein signaling 11 |
| chr10_-_48274567 | 0.04 |
ENST00000636244.1
ENST00000374201.8 |
FRMPD2
|
FERM and PDZ domain containing 2 |
| chr9_+_100442271 | 0.04 |
ENST00000502978.1
|
MSANTD3-TMEFF1
|
MSANTD3-TMEFF1 readthrough |
| chr17_+_45241067 | 0.04 |
ENST00000587489.5
|
FMNL1
|
formin like 1 |
| chr22_+_22162155 | 0.04 |
ENST00000390284.2
|
IGLV4-60
|
immunoglobulin lambda variable 4-60 |
| chr19_-_51034840 | 0.04 |
ENST00000529888.5
|
KLK12
|
kallikrein related peptidase 12 |
| chr10_-_92243246 | 0.04 |
ENST00000412050.8
ENST00000614585.4 |
CPEB3
|
cytoplasmic polyadenylation element binding protein 3 |
| chr1_+_113905156 | 0.04 |
ENST00000650596.1
|
DCLRE1B
|
DNA cross-link repair 1B |
| chr1_+_18630839 | 0.04 |
ENST00000420770.7
|
PAX7
|
paired box 7 |
| chrX_+_12137409 | 0.04 |
ENST00000672010.1
|
FRMPD4
|
FERM and PDZ domain containing 4 |
| chr3_-_193554952 | 0.03 |
ENST00000392443.7
|
ATP13A4
|
ATPase 13A4 |
| chr19_-_51034892 | 0.03 |
ENST00000319590.8
ENST00000250351.4 |
KLK12
|
kallikrein related peptidase 12 |
| chr1_-_201171545 | 0.03 |
ENST00000367333.6
|
TMEM9
|
transmembrane protein 9 |
| chr2_-_174634566 | 0.03 |
ENST00000392547.6
|
WIPF1
|
WAS/WASL interacting protein family member 1 |
| chr15_+_86079863 | 0.03 |
ENST00000614907.3
ENST00000441037.7 |
AGBL1
|
ATP/GTP binding protein like 1 |
| chrX_-_21658324 | 0.03 |
ENST00000379499.3
|
KLHL34
|
kelch like family member 34 |
| chr2_+_120013068 | 0.03 |
ENST00000443902.6
ENST00000263713.10 |
EPB41L5
|
erythrocyte membrane protein band 4.1 like 5 |
| chr19_-_49057730 | 0.03 |
ENST00000684222.1
ENST00000596965.5 |
CGB7
|
chorionic gonadotropin subunit beta 7 |
| chr15_+_64151706 | 0.03 |
ENST00000325881.9
|
SNX22
|
sorting nexin 22 |
| chr7_+_138797952 | 0.03 |
ENST00000397602.7
ENST00000442682.7 ENST00000458494.1 ENST00000413208.1 |
TMEM213
|
transmembrane protein 213 |
| chrX_+_66162663 | 0.03 |
ENST00000519389.6
|
HEPH
|
hephaestin |
| chrM_+_8489 | 0.03 |
ENST00000361899.2
|
MT-ATP6
|
mitochondrially encoded ATP synthase membrane subunit 6 |
| chr3_+_4680617 | 0.03 |
ENST00000648212.1
|
ITPR1
|
inositol 1,4,5-trisphosphate receptor type 1 |
| chrX_-_110440218 | 0.03 |
ENST00000372057.1
ENST00000372054.3 |
AMMECR1
GNG5P2
|
AMMECR nuclear protein 1 G protein subunit gamma 5 pseudogene 2 |
| chr7_+_130207847 | 0.03 |
ENST00000297819.4
|
SSMEM1
|
serine rich single-pass membrane protein 1 |
| chr19_+_45498439 | 0.02 |
ENST00000451287.7
|
PPM1N
|
protein phosphatase, Mg2+/Mn2+ dependent 1N (putative) |
| chr11_-_65857007 | 0.02 |
ENST00000527344.5
|
CFL1
|
cofilin 1 |
| chrX_-_6228835 | 0.02 |
ENST00000381095.8
|
NLGN4X
|
neuroligin 4 X-linked |
| chr3_-_54928044 | 0.02 |
ENST00000273286.6
|
LRTM1
|
leucine rich repeats and transmembrane domains 1 |
| chr10_+_50990864 | 0.02 |
ENST00000401604.8
|
PRKG1
|
protein kinase cGMP-dependent 1 |
| chr22_-_30289607 | 0.02 |
ENST00000404953.7
|
CASTOR1
|
cytosolic arginine sensor for mTORC1 subunit 1 |
Gene Ontology Analysis
Gene overrepresentation in biological process category:
| Log-likelihood per target | Total log-likelihood | Term | Description |
|---|---|---|---|
| 0.2 | 0.6 | GO:0014846 | esophagus smooth muscle contraction(GO:0014846) |
| 0.2 | 0.5 | GO:0070124 | mitochondrial translational initiation(GO:0070124) |
| 0.1 | 0.4 | GO:0072137 | condensed mesenchymal cell proliferation(GO:0072137) |
| 0.1 | 0.3 | GO:1905205 | positive regulation of connective tissue replacement(GO:1905205) |
| 0.1 | 0.2 | GO:2000797 | amniotic stem cell differentiation(GO:0097086) negative regulation of dense core granule biogenesis(GO:2000706) negative regulation of mesenchymal stem cell differentiation(GO:2000740) regulation of amniotic stem cell differentiation(GO:2000797) negative regulation of amniotic stem cell differentiation(GO:2000798) |
| 0.1 | 0.3 | GO:0015742 | alpha-ketoglutarate transport(GO:0015742) |
| 0.1 | 0.3 | GO:0048388 | endosomal lumen acidification(GO:0048388) |
| 0.1 | 0.8 | GO:0035372 | protein localization to microtubule(GO:0035372) |
| 0.1 | 0.2 | GO:0016119 | carotene metabolic process(GO:0016119) |
| 0.0 | 0.7 | GO:0036089 | cleavage furrow formation(GO:0036089) |
| 0.0 | 0.4 | GO:0048386 | positive regulation of retinoic acid receptor signaling pathway(GO:0048386) |
| 0.0 | 0.2 | GO:1903566 | positive regulation of protein localization to cilium(GO:1903566) |
| 0.0 | 0.2 | GO:0010814 | substance P catabolic process(GO:0010814) calcitonin catabolic process(GO:0010816) endothelin maturation(GO:0034959) |
| 0.0 | 0.4 | GO:2000288 | positive regulation of myoblast proliferation(GO:2000288) |
| 0.0 | 0.3 | GO:0097500 | receptor localization to nonmotile primary cilium(GO:0097500) |
| 0.0 | 0.3 | GO:0006657 | CDP-choline pathway(GO:0006657) |
| 0.0 | 0.5 | GO:0045741 | positive regulation of epidermal growth factor-activated receptor activity(GO:0045741) |
| 0.0 | 0.1 | GO:0060010 | Sertoli cell fate commitment(GO:0060010) |
| 0.0 | 0.1 | GO:0045872 | positive regulation of rhodopsin gene expression(GO:0045872) |
| 0.0 | 0.6 | GO:1900745 | positive regulation of p38MAPK cascade(GO:1900745) |
| 0.0 | 0.3 | GO:0035845 | photoreceptor cell outer segment organization(GO:0035845) |
| 0.0 | 0.2 | GO:0002353 | kinin cascade(GO:0002254) plasma kallikrein-kinin cascade(GO:0002353) |
| 0.0 | 0.2 | GO:0031339 | negative regulation of vesicle fusion(GO:0031339) |
| 0.0 | 0.5 | GO:0010818 | T cell chemotaxis(GO:0010818) |
| 0.0 | 0.1 | GO:0044537 | regulation of circulating fibrinogen levels(GO:0044537) |
| 0.0 | 0.3 | GO:2000766 | negative regulation of cytoplasmic translation(GO:2000766) |
| 0.0 | 0.1 | GO:2000771 | regulation of unidimensional cell growth(GO:0051510) negative regulation of unidimensional cell growth(GO:0051511) establishment of cell polarity regulating cell shape(GO:0071964) regulation of establishment or maintenance of cell polarity regulating cell shape(GO:2000769) positive regulation of establishment or maintenance of cell polarity regulating cell shape(GO:2000771) regulation of establishment of cell polarity regulating cell shape(GO:2000782) positive regulation of establishment of cell polarity regulating cell shape(GO:2000784) positive regulation of barbed-end actin filament capping(GO:2000814) |
| 0.0 | 0.1 | GO:0015855 | canalicular bile acid transport(GO:0015722) pyrimidine nucleobase transport(GO:0015855) purine nucleobase transmembrane transport(GO:1904823) |
| 0.0 | 0.1 | GO:0010387 | COP9 signalosome assembly(GO:0010387) |
| 0.0 | 0.2 | GO:1900378 | positive regulation of melanin biosynthetic process(GO:0048023) positive regulation of secondary metabolite biosynthetic process(GO:1900378) |
| 0.0 | 0.1 | GO:0035063 | nuclear speck organization(GO:0035063) |
| 0.0 | 0.1 | GO:0006420 | arginyl-tRNA aminoacylation(GO:0006420) |
| 0.0 | 0.1 | GO:2000312 | regulation of kainate selective glutamate receptor activity(GO:2000312) |
| 0.0 | 0.1 | GO:0021847 | ventricular zone neuroblast division(GO:0021847) |
| 0.0 | 0.2 | GO:0043249 | erythrocyte maturation(GO:0043249) |
| 0.0 | 0.0 | GO:0009956 | radial pattern formation(GO:0009956) |
| 0.0 | 0.5 | GO:0045745 | positive regulation of G-protein coupled receptor protein signaling pathway(GO:0045745) |
| 0.0 | 0.0 | GO:0002588 | positive regulation of antigen processing and presentation of peptide or polysaccharide antigen via MHC class II(GO:0002582) positive regulation of antigen processing and presentation of peptide antigen(GO:0002585) positive regulation of antigen processing and presentation of peptide antigen via MHC class II(GO:0002588) |
| 0.0 | 0.1 | GO:0051388 | positive regulation of neurotrophin TRK receptor signaling pathway(GO:0051388) |
| 0.0 | 0.1 | GO:0032815 | negative regulation of natural killer cell activation(GO:0032815) |
| 0.0 | 0.7 | GO:0071377 | cellular response to glucagon stimulus(GO:0071377) |
| 0.0 | 2.1 | GO:0007286 | spermatid development(GO:0007286) |
Gene overrepresentation in cellular component category:
| Log-likelihood per target | Total log-likelihood | Term | Description |
|---|---|---|---|
| 0.1 | 0.2 | GO:0032127 | dense core granule membrane(GO:0032127) |
| 0.0 | 0.2 | GO:0031302 | intrinsic component of endosome membrane(GO:0031302) |
| 0.0 | 0.3 | GO:0005955 | calcineurin complex(GO:0005955) |
| 0.0 | 0.4 | GO:0097470 | ribbon synapse(GO:0097470) |
| 0.0 | 0.1 | GO:0070765 | gamma-secretase complex(GO:0070765) |
| 0.0 | 0.3 | GO:1990124 | messenger ribonucleoprotein complex(GO:1990124) |
| 0.0 | 0.6 | GO:0001917 | photoreceptor inner segment(GO:0001917) |
Gene overrepresentation in molecular function category:
| Log-likelihood per target | Total log-likelihood | Term | Description |
|---|---|---|---|
| 0.1 | 0.6 | GO:0008449 | N-acetylglucosamine-6-sulfatase activity(GO:0008449) |
| 0.1 | 0.3 | GO:0072320 | volume-sensitive chloride channel activity(GO:0072320) |
| 0.1 | 0.3 | GO:0004105 | choline-phosphate cytidylyltransferase activity(GO:0004105) |
| 0.1 | 0.4 | GO:0030267 | hydroxypyruvate reductase activity(GO:0016618) glyoxylate reductase (NADP) activity(GO:0030267) |
| 0.1 | 0.3 | GO:0018479 | benzaldehyde dehydrogenase (NAD+) activity(GO:0018479) |
| 0.0 | 0.2 | GO:0030348 | syntaxin-3 binding(GO:0030348) |
| 0.0 | 0.3 | GO:0033192 | calmodulin-dependent protein phosphatase activity(GO:0033192) |
| 0.0 | 0.1 | GO:0004167 | dopachrome isomerase activity(GO:0004167) |
| 0.0 | 0.1 | GO:0005222 | intracellular cAMP activated cation channel activity(GO:0005222) |
| 0.0 | 0.5 | GO:0043024 | ribosomal small subunit binding(GO:0043024) |
| 0.0 | 0.3 | GO:0015143 | urate transmembrane transporter activity(GO:0015143) salt transmembrane transporter activity(GO:1901702) |
| 0.0 | 0.1 | GO:0005275 | amine transmembrane transporter activity(GO:0005275) |
| 0.0 | 0.6 | GO:0047555 | 3',5'-cyclic-GMP phosphodiesterase activity(GO:0047555) |
| 0.0 | 0.5 | GO:0005041 | low-density lipoprotein receptor activity(GO:0005041) |
| 0.0 | 0.1 | GO:0004814 | arginine-tRNA ligase activity(GO:0004814) |
| 0.0 | 0.0 | GO:0033878 | hormone-sensitive lipase activity(GO:0033878) |
| 0.0 | 0.1 | GO:0005173 | stem cell factor receptor binding(GO:0005173) |
| 0.0 | 0.1 | GO:0044323 | retinoic acid-responsive element binding(GO:0044323) |
| 0.0 | 0.1 | GO:1904315 | neurotransmitter receptor activity involved in regulation of postsynaptic membrane potential(GO:0099529) transmitter-gated ion channel activity involved in regulation of postsynaptic membrane potential(GO:1904315) |
| 0.0 | 0.1 | GO:0017169 | CDP-alcohol phosphatidyltransferase activity(GO:0017169) |
Gene overrepresentation in curated gene sets: canonical pathways category:
| Log-likelihood per target | Total log-likelihood | Term | Description |
|---|---|---|---|
| 0.0 | 0.9 | PID CONE PATHWAY | Visual signal transduction: Cones |
| 0.0 | 0.6 | PID P38 MKK3 6PATHWAY | p38 MAPK signaling pathway |
| 0.0 | 0.5 | PID ERBB NETWORK PATHWAY | ErbB receptor signaling network |
Gene overrepresentation in curated gene sets: REACTOME pathways category:
| Log-likelihood per target | Total log-likelihood | Term | Description |
|---|---|---|---|
| 0.0 | 0.5 | REACTOME ORGANIC CATION ANION ZWITTERION TRANSPORT | Genes involved in Organic cation/anion/zwitterion transport |
| 0.0 | 0.6 | REACTOME G BETA GAMMA SIGNALLING THROUGH PLC BETA | Genes involved in G beta:gamma signalling through PLC beta |
| 0.0 | 0.2 | REACTOME PASSIVE TRANSPORT BY AQUAPORINS | Genes involved in Passive Transport by Aquaporins |