Project
Inflammatory response time course, HUVEC (Wada, 2009)
Navigation
Downloads
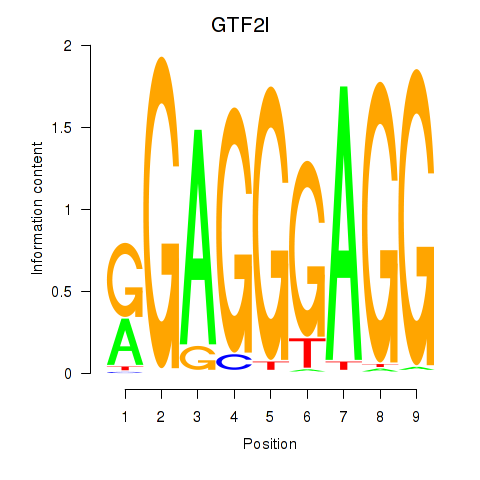
Results for GTF2I
Z-value: 1.76
Motif logo
Transcription factors associated with GTF2I
| Gene Symbol | Gene ID | Gene Info |
|---|---|---|
|
GTF2I
|
ENSG00000263001.7 | GTF2I |
Activity-expression correlation:
| Gene | Promoter | Pearson corr. coef. | P-value | Plot |
|---|---|---|---|---|
| GTF2I | hg38_v1_chr7_+_74657745_74657793 | 0.79 | 2.9e-06 | Click! |
Activity profile of GTF2I motif
Sorted Z-values of GTF2I motif
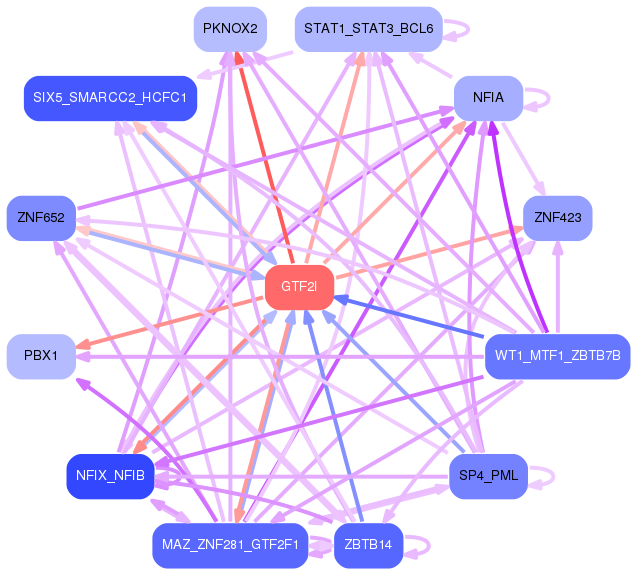
Network of associatons between targets according to the STRING database.

First level regulatory network of GTF2I
Gene Ontology Analysis
Gene overrepresentation in biological process category:
| Log-likelihood per target | Total log-likelihood | Term | Description |
|---|---|---|---|
| 1.6 | 4.7 | GO:0046725 | negative regulation by virus of viral protein levels in host cell(GO:0046725) negative regulation of metanephric nephron tubule epithelial cell differentiation(GO:0072308) |
| 1.6 | 4.7 | GO:0030185 | nitric oxide transport(GO:0030185) cerebrospinal fluid secretion(GO:0033326) cellular response to mercury ion(GO:0071288) proximal convoluted tubule development(GO:0072019) metanephric proximal convoluted tubule development(GO:0072229) |
| 1.5 | 4.6 | GO:0071893 | apoptotic process involved in endocardial cushion morphogenesis(GO:0003277) intermediate mesoderm morphogenesis(GO:0048390) intermediate mesoderm formation(GO:0048391) intermediate mesodermal cell differentiation(GO:0048392) regulation of cardiac muscle fiber development(GO:0055018) positive regulation of cardiac muscle fiber development(GO:0055020) bud dilation involved in lung branching(GO:0060503) BMP signaling pathway involved in ureter morphogenesis(GO:0061149) renal system segmentation(GO:0061150) BMP signaling pathway involved in renal system segmentation(GO:0061151) pulmonary artery endothelial tube morphogenesis(GO:0061155) regulation of transcription from RNA polymerase II promoter involved in mesonephros development(GO:0061216) BMP signaling pathway involved in nephric duct formation(GO:0071893) negative regulation of branch elongation involved in ureteric bud branching(GO:0072096) negative regulation of branch elongation involved in ureteric bud branching by BMP signaling pathway(GO:0072097) anterior/posterior pattern specification involved in ureteric bud development(GO:0072099) specification of ureteric bud anterior/posterior symmetry(GO:0072100) specification of ureteric bud anterior/posterior symmetry by BMP signaling pathway(GO:0072101) ureter epithelial cell differentiation(GO:0072192) negative regulation of mesenchymal cell proliferation involved in ureter development(GO:0072200) positive regulation of cell proliferation involved in outflow tract morphogenesis(GO:1901964) cardiac jelly development(GO:1905072) regulation of metanephric S-shaped body morphogenesis(GO:2000004) negative regulation of metanephric S-shaped body morphogenesis(GO:2000005) regulation of metanephric comma-shaped body morphogenesis(GO:2000006) negative regulation of metanephric comma-shaped body morphogenesis(GO:2000007) |
| 1.5 | 16.1 | GO:2000795 | negative regulation of epithelial cell proliferation involved in lung morphogenesis(GO:2000795) |
| 1.4 | 4.1 | GO:0007037 | vacuolar phosphate transport(GO:0007037) positive regulation of mitotic cell cycle DNA replication(GO:1903465) positive regulation of parathyroid hormone secretion(GO:2000830) |
| 1.4 | 4.1 | GO:0072209 | metanephric mesangial cell differentiation(GO:0072209) metanephric glomerular mesangial cell differentiation(GO:0072254) |
| 1.0 | 3.1 | GO:0021793 | chemorepulsion of branchiomotor axon(GO:0021793) |
| 0.9 | 3.5 | GO:0072137 | condensed mesenchymal cell proliferation(GO:0072137) |
| 0.8 | 5.9 | GO:1905123 | regulation of glucosylceramidase activity(GO:1905123) |
| 0.8 | 4.1 | GO:0043988 | histone H3-S28 phosphorylation(GO:0043988) |
| 0.8 | 2.4 | GO:0050928 | negative regulation of positive chemotaxis(GO:0050928) |
| 0.8 | 3.1 | GO:1905205 | positive regulation of connective tissue replacement(GO:1905205) |
| 0.8 | 2.3 | GO:0043049 | hepatocyte cell migration(GO:0002194) otic placode formation(GO:0043049) branching involved in pancreas morphogenesis(GO:0061114) acinar cell differentiation(GO:0090425) positive regulation of forebrain neuron differentiation(GO:2000979) |
| 0.7 | 3.7 | GO:0093001 | glycolysis from storage polysaccharide through glucose-1-phosphate(GO:0093001) |
| 0.7 | 3.5 | GO:0018076 | N-terminal peptidyl-lysine acetylation(GO:0018076) |
| 0.6 | 2.5 | GO:0061357 | positive regulation of Wnt protein secretion(GO:0061357) |
| 0.6 | 20.7 | GO:0010669 | epithelial structure maintenance(GO:0010669) |
| 0.6 | 2.4 | GO:0035261 | external genitalia morphogenesis(GO:0035261) |
| 0.6 | 0.6 | GO:0060994 | regulation of transcription from RNA polymerase II promoter involved in kidney development(GO:0060994) |
| 0.5 | 1.6 | GO:0070662 | erythropoietin-mediated signaling pathway(GO:0038162) mast cell proliferation(GO:0070662) |
| 0.5 | 2.1 | GO:0007181 | transforming growth factor beta receptor complex assembly(GO:0007181) |
| 0.4 | 1.8 | GO:0003409 | optic cup structural organization(GO:0003409) |
| 0.4 | 2.6 | GO:0090116 | C-5 methylation of cytosine(GO:0090116) |
| 0.4 | 1.7 | GO:0032765 | positive regulation of mast cell cytokine production(GO:0032765) |
| 0.4 | 1.2 | GO:0015817 | histidine transport(GO:0015817) L-histidine transmembrane transport(GO:0089709) L-histidine transport(GO:1902024) L-arginine transmembrane transport(GO:1903400) |
| 0.4 | 2.3 | GO:0060399 | positive regulation of growth hormone receptor signaling pathway(GO:0060399) |
| 0.4 | 1.8 | GO:0071802 | negative regulation of podosome assembly(GO:0071802) |
| 0.4 | 2.2 | GO:1901906 | diadenosine polyphosphate catabolic process(GO:0015961) diphosphoinositol polyphosphate metabolic process(GO:0071543) diadenosine pentaphosphate metabolic process(GO:1901906) diadenosine pentaphosphate catabolic process(GO:1901907) diadenosine hexaphosphate metabolic process(GO:1901908) diadenosine hexaphosphate catabolic process(GO:1901909) adenosine 5'-(hexahydrogen pentaphosphate) metabolic process(GO:1901910) adenosine 5'-(hexahydrogen pentaphosphate) catabolic process(GO:1901911) |
| 0.4 | 1.1 | GO:1901675 | negative regulation of histone H3-K27 acetylation(GO:1901675) |
| 0.3 | 2.0 | GO:0008218 | bioluminescence(GO:0008218) |
| 0.3 | 1.0 | GO:0060032 | notochord regression(GO:0060032) |
| 0.3 | 1.3 | GO:0003273 | cell migration involved in endocardial cushion formation(GO:0003273) |
| 0.3 | 2.5 | GO:0035583 | sequestering of TGFbeta in extracellular matrix(GO:0035583) |
| 0.3 | 2.2 | GO:0060282 | positive regulation of oocyte development(GO:0060282) |
| 0.3 | 1.5 | GO:0042986 | positive regulation of amyloid precursor protein biosynthetic process(GO:0042986) |
| 0.3 | 0.9 | GO:0090118 | receptor-mediated endocytosis of low-density lipoprotein particle involved in cholesterol transport(GO:0090118) |
| 0.3 | 2.6 | GO:0060244 | negative regulation of cell proliferation involved in contact inhibition(GO:0060244) |
| 0.3 | 3.7 | GO:0042373 | vitamin K metabolic process(GO:0042373) |
| 0.3 | 2.2 | GO:0045586 | regulation of gamma-delta T cell differentiation(GO:0045586) |
| 0.3 | 1.1 | GO:0006172 | ADP biosynthetic process(GO:0006172) purine deoxyribonucleoside diphosphate biosynthetic process(GO:0009183) |
| 0.3 | 0.8 | GO:0045925 | positive regulation of female receptivity(GO:0045925) |
| 0.3 | 0.8 | GO:2001045 | negative regulation of integrin-mediated signaling pathway(GO:2001045) |
| 0.3 | 3.1 | GO:0048625 | myoblast fate commitment(GO:0048625) |
| 0.3 | 2.1 | GO:0048386 | positive regulation of retinoic acid receptor signaling pathway(GO:0048386) |
| 0.3 | 3.1 | GO:0051918 | negative regulation of fibrinolysis(GO:0051918) |
| 0.3 | 0.8 | GO:0002416 | IgG immunoglobulin transcytosis in epithelial cells mediated by FcRn immunoglobulin receptor(GO:0002416) |
| 0.2 | 0.7 | GO:1902462 | mesenchymal stem cell proliferation(GO:0097168) regulation of mesenchymal stem cell proliferation(GO:1902460) positive regulation of mesenchymal stem cell proliferation(GO:1902462) |
| 0.2 | 0.7 | GO:0061445 | endocardial cell fate commitment(GO:0060957) endocardial cushion cell fate commitment(GO:0061445) |
| 0.2 | 0.7 | GO:0044725 | chromatin reprogramming in the zygote(GO:0044725) |
| 0.2 | 0.7 | GO:1904017 | cellular response to Thyroglobulin triiodothyronine(GO:1904017) |
| 0.2 | 4.1 | GO:1901725 | regulation of histone deacetylase activity(GO:1901725) |
| 0.2 | 6.0 | GO:0009650 | UV protection(GO:0009650) |
| 0.2 | 1.6 | GO:0098706 | ferric iron import into cell(GO:0097461) ferric iron import across plasma membrane(GO:0098706) |
| 0.2 | 0.9 | GO:0034670 | chemotaxis to arachidonic acid(GO:0034670) response to arachidonic acid(GO:1904550) |
| 0.2 | 0.7 | GO:1904897 | regulation of hepatic stellate cell proliferation(GO:1904897) positive regulation of hepatic stellate cell proliferation(GO:1904899) hepatic stellate cell proliferation(GO:1990922) |
| 0.2 | 5.9 | GO:0097094 | craniofacial suture morphogenesis(GO:0097094) |
| 0.2 | 1.5 | GO:0070560 | protein secretion by platelet(GO:0070560) |
| 0.2 | 0.6 | GO:0071206 | establishment of protein localization to juxtaparanode region of axon(GO:0071206) |
| 0.2 | 1.3 | GO:0035426 | extracellular matrix-cell signaling(GO:0035426) |
| 0.2 | 1.1 | GO:0007386 | compartment pattern specification(GO:0007386) |
| 0.2 | 8.2 | GO:0016578 | histone deubiquitination(GO:0016578) |
| 0.2 | 1.0 | GO:1902268 | negative regulation of polyamine transmembrane transport(GO:1902268) |
| 0.2 | 1.9 | GO:0070294 | renal sodium ion absorption(GO:0070294) |
| 0.2 | 1.0 | GO:0032485 | Ral protein signal transduction(GO:0032484) regulation of Ral protein signal transduction(GO:0032485) |
| 0.2 | 0.8 | GO:0061086 | negative regulation of histone H3-K27 methylation(GO:0061086) |
| 0.2 | 0.6 | GO:0097274 | urea homeostasis(GO:0097274) |
| 0.2 | 1.8 | GO:0000395 | mRNA 5'-splice site recognition(GO:0000395) |
| 0.2 | 0.4 | GO:0038091 | VEGF-activated platelet-derived growth factor receptor signaling pathway(GO:0038086) positive regulation of cell proliferation by VEGF-activated platelet derived growth factor receptor signaling pathway(GO:0038091) |
| 0.2 | 0.6 | GO:0070358 | actin polymerization-dependent cell motility(GO:0070358) |
| 0.2 | 2.0 | GO:0060158 | phospholipase C-activating dopamine receptor signaling pathway(GO:0060158) |
| 0.2 | 0.6 | GO:1900169 | regulation of glucocorticoid mediated signaling pathway(GO:1900169) |
| 0.2 | 0.7 | GO:0021634 | optic nerve formation(GO:0021634) optic chiasma development(GO:0061360) regulation of optic nerve formation(GO:2000595) positive regulation of optic nerve formation(GO:2000597) |
| 0.2 | 5.7 | GO:0035162 | embryonic hemopoiesis(GO:0035162) |
| 0.2 | 0.5 | GO:0035494 | SNARE complex disassembly(GO:0035494) |
| 0.2 | 0.5 | GO:1990926 | short-term synaptic potentiation(GO:1990926) |
| 0.2 | 1.8 | GO:0034350 | regulation of glial cell apoptotic process(GO:0034350) negative regulation of glial cell apoptotic process(GO:0034351) |
| 0.2 | 1.6 | GO:2000620 | innate vocalization behavior(GO:0098582) positive regulation of histone H4-K16 acetylation(GO:2000620) |
| 0.2 | 4.1 | GO:0040015 | negative regulation of multicellular organism growth(GO:0040015) |
| 0.2 | 1.1 | GO:0010025 | wax biosynthetic process(GO:0010025) wax metabolic process(GO:0010166) |
| 0.2 | 0.5 | GO:0034653 | diterpenoid catabolic process(GO:0016103) retinoic acid catabolic process(GO:0034653) |
| 0.2 | 1.0 | GO:0051621 | negative regulation of dopamine uptake involved in synaptic transmission(GO:0051585) norepinephrine uptake(GO:0051620) regulation of norepinephrine uptake(GO:0051621) negative regulation of norepinephrine uptake(GO:0051622) negative regulation of catecholamine uptake involved in synaptic transmission(GO:0051945) regulation of glutathione peroxidase activity(GO:1903282) positive regulation of glutathione peroxidase activity(GO:1903284) positive regulation of hydrogen peroxide catabolic process(GO:1903285) positive regulation of peroxidase activity(GO:2000470) |
| 0.2 | 0.5 | GO:0001544 | initiation of primordial ovarian follicle growth(GO:0001544) |
| 0.2 | 0.2 | GO:0016539 | intein-mediated protein splicing(GO:0016539) protein splicing(GO:0030908) |
| 0.2 | 0.2 | GO:0060738 | epithelial-mesenchymal signaling involved in prostate gland development(GO:0060738) |
| 0.2 | 1.8 | GO:0002191 | cap-dependent translational initiation(GO:0002191) |
| 0.2 | 0.5 | GO:0002368 | B cell cytokine production(GO:0002368) protein import into mitochondrial intermembrane space(GO:0045041) |
| 0.2 | 0.8 | GO:0016480 | negative regulation of transcription from RNA polymerase III promoter(GO:0016480) |
| 0.2 | 2.2 | GO:0038063 | collagen-activated tyrosine kinase receptor signaling pathway(GO:0038063) |
| 0.2 | 3.7 | GO:0070208 | protein heterotrimerization(GO:0070208) |
| 0.2 | 0.6 | GO:0034445 | regulation of plasma lipoprotein particle oxidation(GO:0034444) negative regulation of plasma lipoprotein particle oxidation(GO:0034445) |
| 0.1 | 1.2 | GO:0007185 | transmembrane receptor protein tyrosine phosphatase signaling pathway(GO:0007185) |
| 0.1 | 1.2 | GO:0034773 | histone H4-K20 trimethylation(GO:0034773) |
| 0.1 | 0.9 | GO:1903377 | negative regulation of oxidative stress-induced neuron intrinsic apoptotic signaling pathway(GO:1903377) |
| 0.1 | 2.6 | GO:0071688 | striated muscle myosin thick filament assembly(GO:0071688) |
| 0.1 | 0.9 | GO:0070836 | plasma membrane raft assembly(GO:0044854) plasma membrane raft organization(GO:0044857) caveola assembly(GO:0070836) |
| 0.1 | 2.3 | GO:0035563 | positive regulation of chromatin binding(GO:0035563) |
| 0.1 | 0.6 | GO:0000415 | negative regulation of histone H3-K36 methylation(GO:0000415) negative regulation of histone H3-K4 methylation(GO:0051572) |
| 0.1 | 14.5 | GO:0006369 | termination of RNA polymerase II transcription(GO:0006369) |
| 0.1 | 0.7 | GO:0040030 | regulation of molecular function, epigenetic(GO:0040030) |
| 0.1 | 1.0 | GO:0071557 | histone H3-K27 demethylation(GO:0071557) |
| 0.1 | 0.4 | GO:2000176 | pro-T cell differentiation(GO:0002572) regulation of pro-T cell differentiation(GO:2000174) positive regulation of pro-T cell differentiation(GO:2000176) |
| 0.1 | 0.5 | GO:1900737 | regulation of proteinase activated receptor activity(GO:1900276) negative regulation of phospholipase C-activating G-protein coupled receptor signaling pathway(GO:1900737) |
| 0.1 | 0.9 | GO:0000821 | regulation of arginine metabolic process(GO:0000821) |
| 0.1 | 0.4 | GO:0002528 | regulation of vascular permeability involved in acute inflammatory response(GO:0002528) |
| 0.1 | 1.5 | GO:0007168 | receptor guanylyl cyclase signaling pathway(GO:0007168) |
| 0.1 | 0.5 | GO:0021569 | rhombomere 3 development(GO:0021569) |
| 0.1 | 1.2 | GO:0060355 | positive regulation of cell adhesion molecule production(GO:0060355) |
| 0.1 | 0.5 | GO:0033484 | nitric oxide homeostasis(GO:0033484) |
| 0.1 | 0.4 | GO:0061056 | sclerotome development(GO:0061056) |
| 0.1 | 1.6 | GO:0043983 | histone H4-K12 acetylation(GO:0043983) |
| 0.1 | 0.4 | GO:1905051 | regulation of base-excision repair(GO:1905051) positive regulation of base-excision repair(GO:1905053) |
| 0.1 | 0.6 | GO:2000676 | positive regulation of type B pancreatic cell apoptotic process(GO:2000676) |
| 0.1 | 0.6 | GO:0032487 | regulation of Rap protein signal transduction(GO:0032487) |
| 0.1 | 0.6 | GO:0015688 | iron chelate transport(GO:0015688) siderophore transport(GO:0015891) |
| 0.1 | 0.3 | GO:1900239 | phenotypic switching(GO:0036166) regulation of phenotypic switching(GO:1900239) |
| 0.1 | 0.5 | GO:0060596 | mammary placode formation(GO:0060596) |
| 0.1 | 0.3 | GO:0014846 | esophagus smooth muscle contraction(GO:0014846) |
| 0.1 | 2.2 | GO:0042789 | mRNA transcription from RNA polymerase II promoter(GO:0042789) |
| 0.1 | 0.2 | GO:0002032 | desensitization of G-protein coupled receptor protein signaling pathway by arrestin(GO:0002032) |
| 0.1 | 0.3 | GO:1901899 | positive regulation of relaxation of cardiac muscle(GO:1901899) |
| 0.1 | 0.1 | GO:0021539 | subthalamus development(GO:0021539) |
| 0.1 | 1.0 | GO:1900246 | positive regulation of RIG-I signaling pathway(GO:1900246) |
| 0.1 | 1.3 | GO:0021694 | cerebellar Purkinje cell layer formation(GO:0021694) cerebellar Purkinje cell differentiation(GO:0021702) |
| 0.1 | 1.1 | GO:1901525 | negative regulation of macromitophagy(GO:1901525) |
| 0.1 | 0.4 | GO:0002384 | hepatic immune response(GO:0002384) |
| 0.1 | 0.1 | GO:1900194 | negative regulation of oocyte maturation(GO:1900194) |
| 0.1 | 1.3 | GO:0000733 | DNA strand renaturation(GO:0000733) |
| 0.1 | 0.3 | GO:0015917 | aminophospholipid transport(GO:0015917) |
| 0.1 | 0.6 | GO:0000255 | allantoin metabolic process(GO:0000255) |
| 0.1 | 0.4 | GO:0070973 | protein localization to endoplasmic reticulum exit site(GO:0070973) |
| 0.1 | 0.3 | GO:1902683 | regulation of receptor localization to synapse(GO:1902683) |
| 0.1 | 0.3 | GO:0060266 | negative regulation of respiratory burst involved in inflammatory response(GO:0060266) |
| 0.1 | 1.2 | GO:0044829 | positive regulation by host of viral genome replication(GO:0044829) |
| 0.1 | 0.8 | GO:0032057 | negative regulation of translational initiation in response to stress(GO:0032057) |
| 0.1 | 1.2 | GO:0033623 | regulation of integrin activation(GO:0033623) |
| 0.1 | 0.2 | GO:1903595 | positive regulation of histamine secretion by mast cell(GO:1903595) |
| 0.1 | 0.4 | GO:0070940 | dephosphorylation of RNA polymerase II C-terminal domain(GO:0070940) |
| 0.1 | 0.5 | GO:0051138 | positive regulation of NK T cell differentiation(GO:0051138) |
| 0.1 | 1.3 | GO:0030050 | vesicle transport along actin filament(GO:0030050) |
| 0.1 | 0.3 | GO:1903778 | protein localization to vacuolar membrane(GO:1903778) |
| 0.1 | 0.5 | GO:0014886 | transition between slow and fast fiber(GO:0014886) |
| 0.1 | 0.5 | GO:0019087 | transformation of host cell by virus(GO:0019087) |
| 0.1 | 0.3 | GO:0035441 | cell migration involved in vasculogenesis(GO:0035441) |
| 0.1 | 2.0 | GO:0072189 | ureter development(GO:0072189) |
| 0.1 | 0.4 | GO:0050823 | peptide stabilization(GO:0050822) peptide antigen stabilization(GO:0050823) |
| 0.1 | 1.8 | GO:1904778 | regulation of protein localization to cell cortex(GO:1904776) positive regulation of protein localization to cell cortex(GO:1904778) |
| 0.1 | 0.4 | GO:0021699 | cerebellum maturation(GO:0021590) cerebellar Purkinje cell layer maturation(GO:0021691) cerebellar cortex maturation(GO:0021699) |
| 0.1 | 1.3 | GO:0070863 | positive regulation of protein exit from endoplasmic reticulum(GO:0070863) |
| 0.1 | 2.0 | GO:0043555 | regulation of translation in response to stress(GO:0043555) |
| 0.1 | 0.2 | GO:0002072 | optic cup morphogenesis involved in camera-type eye development(GO:0002072) |
| 0.1 | 0.4 | GO:0090235 | regulation of metaphase plate congression(GO:0090235) |
| 0.1 | 0.3 | GO:0015993 | L-ascorbic acid transport(GO:0015882) molecular hydrogen transport(GO:0015993) transepithelial L-ascorbic acid transport(GO:0070904) |
| 0.1 | 0.5 | GO:0032483 | regulation of Rab protein signal transduction(GO:0032483) |
| 0.1 | 0.3 | GO:0090038 | negative regulation of protein kinase C signaling(GO:0090038) |
| 0.1 | 0.7 | GO:0035021 | negative regulation of Rac protein signal transduction(GO:0035021) |
| 0.1 | 1.5 | GO:0006048 | UDP-N-acetylglucosamine biosynthetic process(GO:0006048) |
| 0.1 | 0.4 | GO:1901350 | cell-cell signaling involved in cell-cell junction organization(GO:1901350) |
| 0.1 | 1.1 | GO:0031580 | membrane raft polarization(GO:0001766) membrane raft distribution(GO:0031580) |
| 0.1 | 0.3 | GO:1902309 | negative regulation of peptidyl-serine dephosphorylation(GO:1902309) |
| 0.1 | 0.4 | GO:0010748 | regulation of plasma membrane long-chain fatty acid transport(GO:0010746) negative regulation of plasma membrane long-chain fatty acid transport(GO:0010748) |
| 0.1 | 0.5 | GO:0002803 | positive regulation of antimicrobial peptide production(GO:0002225) positive regulation of antibacterial peptide production(GO:0002803) |
| 0.1 | 0.3 | GO:2000546 | positive regulation of cell chemotaxis to fibroblast growth factor(GO:1904849) positive regulation of endothelial cell chemotaxis to fibroblast growth factor(GO:2000546) |
| 0.1 | 0.3 | GO:0006663 | platelet activating factor biosynthetic process(GO:0006663) |
| 0.1 | 1.4 | GO:0002043 | blood vessel endothelial cell proliferation involved in sprouting angiogenesis(GO:0002043) |
| 0.1 | 0.3 | GO:0009439 | cyanate metabolic process(GO:0009439) cyanate catabolic process(GO:0009440) |
| 0.1 | 0.4 | GO:2000672 | negative regulation of motor neuron apoptotic process(GO:2000672) |
| 0.1 | 0.4 | GO:1901097 | negative regulation of autophagosome maturation(GO:1901097) |
| 0.1 | 0.7 | GO:0034723 | DNA replication-dependent nucleosome assembly(GO:0006335) DNA replication-dependent nucleosome organization(GO:0034723) |
| 0.1 | 0.2 | GO:0046416 | D-amino acid metabolic process(GO:0046416) |
| 0.1 | 0.9 | GO:0090336 | positive regulation of brown fat cell differentiation(GO:0090336) |
| 0.1 | 0.7 | GO:0018230 | peptidyl-L-cysteine S-palmitoylation(GO:0018230) peptidyl-S-diacylglycerol-L-cysteine biosynthetic process from peptidyl-cysteine(GO:0018231) |
| 0.1 | 0.2 | GO:1904907 | negative regulation of maintenance of sister chromatid cohesion(GO:0034092) negative regulation of maintenance of mitotic sister chromatid cohesion(GO:0034183) maintenance of mitotic sister chromatid cohesion, telomeric(GO:0099403) mitotic sister chromatid cohesion, telomeric(GO:0099404) regulation of maintenance of mitotic sister chromatid cohesion, telomeric(GO:1904907) negative regulation of maintenance of mitotic sister chromatid cohesion, telomeric(GO:1904908) |
| 0.1 | 0.6 | GO:0002329 | pre-B cell differentiation(GO:0002329) |
| 0.1 | 0.5 | GO:0075071 | autophagy of host cells involved in interaction with symbiont(GO:0075044) autophagy involved in symbiotic interaction(GO:0075071) |
| 0.1 | 0.7 | GO:0098700 | neurotransmitter loading into synaptic vesicle(GO:0098700) |
| 0.1 | 1.2 | GO:0070389 | chaperone cofactor-dependent protein refolding(GO:0070389) |
| 0.1 | 0.4 | GO:0014004 | microglia differentiation(GO:0014004) microglia development(GO:0014005) |
| 0.1 | 0.7 | GO:0032534 | regulation of microvillus assembly(GO:0032534) |
| 0.1 | 0.6 | GO:0008626 | granzyme-mediated apoptotic signaling pathway(GO:0008626) |
| 0.1 | 3.0 | GO:0000083 | regulation of transcription involved in G1/S transition of mitotic cell cycle(GO:0000083) |
| 0.1 | 0.5 | GO:0071964 | regulation of unidimensional cell growth(GO:0051510) negative regulation of unidimensional cell growth(GO:0051511) establishment of cell polarity regulating cell shape(GO:0071964) regulation of establishment or maintenance of cell polarity regulating cell shape(GO:2000769) positive regulation of establishment or maintenance of cell polarity regulating cell shape(GO:2000771) regulation of establishment of cell polarity regulating cell shape(GO:2000782) positive regulation of establishment of cell polarity regulating cell shape(GO:2000784) positive regulation of barbed-end actin filament capping(GO:2000814) |
| 0.1 | 0.4 | GO:0048341 | paraxial mesoderm formation(GO:0048341) |
| 0.1 | 7.4 | GO:0006911 | phagocytosis, engulfment(GO:0006911) |
| 0.1 | 0.2 | GO:0018057 | peptidyl-lysine oxidation(GO:0018057) |
| 0.1 | 1.4 | GO:0070734 | histone H3-K27 methylation(GO:0070734) |
| 0.1 | 0.2 | GO:0042412 | taurine biosynthetic process(GO:0042412) |
| 0.1 | 0.7 | GO:0051005 | negative regulation of lipoprotein lipase activity(GO:0051005) |
| 0.1 | 0.3 | GO:0015742 | alpha-ketoglutarate transport(GO:0015742) |
| 0.1 | 0.9 | GO:0007042 | lysosomal lumen acidification(GO:0007042) |
| 0.1 | 0.1 | GO:0019065 | receptor-mediated endocytosis of virus by host cell(GO:0019065) endocytosis involved in viral entry into host cell(GO:0075509) |
| 0.1 | 0.3 | GO:0006344 | maintenance of chromatin silencing(GO:0006344) |
| 0.1 | 0.7 | GO:0042426 | choline catabolic process(GO:0042426) |
| 0.1 | 0.5 | GO:0030421 | defecation(GO:0030421) |
| 0.1 | 1.8 | GO:0036150 | phosphatidylserine acyl-chain remodeling(GO:0036150) |
| 0.1 | 0.2 | GO:0021764 | amygdala development(GO:0021764) |
| 0.1 | 1.6 | GO:0006293 | nucleotide-excision repair, preincision complex stabilization(GO:0006293) |
| 0.1 | 0.2 | GO:0002424 | T cell mediated immune response to tumor cell(GO:0002424) regulation of T cell mediated immune response to tumor cell(GO:0002840) |
| 0.1 | 0.3 | GO:0031630 | regulation of synaptic vesicle fusion to presynaptic membrane(GO:0031630) |
| 0.1 | 0.6 | GO:0050847 | progesterone receptor signaling pathway(GO:0050847) |
| 0.1 | 0.2 | GO:1903758 | positive regulation of dendritic spine maintenance(GO:1902952) regulation of transcription from RNA polymerase II promoter by histone modification(GO:1903756) negative regulation of transcription from RNA polymerase II promoter by histone modification(GO:1903758) |
| 0.1 | 0.7 | GO:0032876 | negative regulation of DNA endoreduplication(GO:0032876) |
| 0.1 | 0.4 | GO:1902723 | negative regulation of skeletal muscle cell proliferation(GO:0014859) negative regulation of skeletal muscle satellite cell proliferation(GO:1902723) |
| 0.1 | 2.7 | GO:0007190 | activation of adenylate cyclase activity(GO:0007190) |
| 0.1 | 0.4 | GO:0048050 | post-embryonic eye morphogenesis(GO:0048050) |
| 0.1 | 0.7 | GO:0006930 | substrate-dependent cell migration, cell extension(GO:0006930) |
| 0.1 | 0.3 | GO:0021902 | commitment of neuronal cell to specific neuron type in forebrain(GO:0021902) |
| 0.1 | 0.6 | GO:1904321 | response to forskolin(GO:1904321) cellular response to forskolin(GO:1904322) |
| 0.1 | 0.2 | GO:2000255 | negative regulation of male germ cell proliferation(GO:2000255) |
| 0.1 | 0.3 | GO:0046963 | 3'-phosphoadenosine 5'-phosphosulfate transport(GO:0046963) 3'-phospho-5'-adenylyl sulfate transmembrane transport(GO:1902559) |
| 0.1 | 0.3 | GO:0002371 | dendritic cell cytokine production(GO:0002371) |
| 0.1 | 0.7 | GO:0070327 | thyroid hormone transport(GO:0070327) |
| 0.1 | 0.3 | GO:0030174 | regulation of DNA-dependent DNA replication initiation(GO:0030174) |
| 0.1 | 0.9 | GO:0090331 | negative regulation of platelet aggregation(GO:0090331) |
| 0.1 | 0.6 | GO:0007217 | tachykinin receptor signaling pathway(GO:0007217) |
| 0.1 | 0.1 | GO:0055096 | lipoprotein particle mediated signaling(GO:0055095) low-density lipoprotein particle mediated signaling(GO:0055096) |
| 0.1 | 1.0 | GO:0010839 | negative regulation of keratinocyte proliferation(GO:0010839) |
| 0.1 | 1.8 | GO:0030252 | growth hormone secretion(GO:0030252) |
| 0.1 | 1.3 | GO:0043518 | negative regulation of DNA damage response, signal transduction by p53 class mediator(GO:0043518) |
| 0.1 | 0.6 | GO:0030578 | PML body organization(GO:0030578) |
| 0.1 | 0.2 | GO:1990785 | response to water-immersion restraint stress(GO:1990785) |
| 0.1 | 0.1 | GO:0046010 | positive regulation of circadian sleep/wake cycle, non-REM sleep(GO:0046010) |
| 0.1 | 1.4 | GO:1901663 | ubiquinone biosynthetic process(GO:0006744) quinone biosynthetic process(GO:1901663) |
| 0.1 | 0.4 | GO:0033211 | adiponectin-activated signaling pathway(GO:0033211) |
| 0.1 | 0.3 | GO:0097498 | endothelial tube lumen extension(GO:0097498) |
| 0.1 | 0.6 | GO:0006662 | glycerol ether metabolic process(GO:0006662) |
| 0.1 | 0.8 | GO:0021796 | cerebral cortex regionalization(GO:0021796) |
| 0.1 | 0.8 | GO:2000574 | regulation of microtubule motor activity(GO:2000574) |
| 0.1 | 3.3 | GO:1904837 | beta-catenin-TCF complex assembly(GO:1904837) |
| 0.1 | 1.1 | GO:0034356 | NAD biosynthesis via nicotinamide riboside salvage pathway(GO:0034356) |
| 0.1 | 0.1 | GO:1902954 | regulation of early endosome to recycling endosome transport(GO:1902954) |
| 0.1 | 0.2 | GO:0099590 | neurotransmitter receptor internalization(GO:0099590) |
| 0.1 | 0.6 | GO:0051661 | maintenance of centrosome location(GO:0051661) |
| 0.0 | 0.1 | GO:2000051 | negative regulation of non-canonical Wnt signaling pathway(GO:2000051) |
| 0.0 | 0.3 | GO:0032237 | activation of store-operated calcium channel activity(GO:0032237) positive regulation of store-operated calcium channel activity(GO:1901341) |
| 0.0 | 0.2 | GO:1900224 | positive regulation of nodal signaling pathway involved in determination of lateral mesoderm left/right asymmetry(GO:1900224) |
| 0.0 | 0.3 | GO:0045541 | negative regulation of cholesterol biosynthetic process(GO:0045541) negative regulation of cholesterol metabolic process(GO:0090206) |
| 0.0 | 0.2 | GO:0061588 | calcium activated phospholipid scrambling(GO:0061588) calcium activated phosphatidylcholine scrambling(GO:0061590) calcium activated galactosylceramide scrambling(GO:0061591) |
| 0.0 | 0.1 | GO:0051030 | snRNA transport(GO:0051030) |
| 0.0 | 0.5 | GO:0010499 | proteasomal ubiquitin-independent protein catabolic process(GO:0010499) |
| 0.0 | 0.4 | GO:0035879 | plasma membrane lactate transport(GO:0035879) |
| 0.0 | 0.3 | GO:0060011 | Sertoli cell proliferation(GO:0060011) |
| 0.0 | 0.5 | GO:0007256 | activation of JNKK activity(GO:0007256) |
| 0.0 | 0.5 | GO:0033299 | secretion of lysosomal enzymes(GO:0033299) |
| 0.0 | 0.2 | GO:0035726 | common myeloid progenitor cell proliferation(GO:0035726) |
| 0.0 | 0.5 | GO:0018095 | protein polyglutamylation(GO:0018095) |
| 0.0 | 0.4 | GO:0042659 | regulation of cell fate specification(GO:0042659) |
| 0.0 | 0.4 | GO:2000270 | negative regulation of fibroblast apoptotic process(GO:2000270) |
| 0.0 | 0.1 | GO:0040009 | regulation of growth rate(GO:0040009) |
| 0.0 | 1.0 | GO:0046341 | CDP-diacylglycerol metabolic process(GO:0046341) |
| 0.0 | 0.2 | GO:0060010 | Sertoli cell fate commitment(GO:0060010) |
| 0.0 | 0.7 | GO:0071285 | cellular response to lithium ion(GO:0071285) |
| 0.0 | 0.1 | GO:0036304 | umbilical cord morphogenesis(GO:0036304) umbilical cord development(GO:0061027) |
| 0.0 | 0.3 | GO:0045079 | negative regulation of chemokine biosynthetic process(GO:0045079) |
| 0.0 | 1.3 | GO:1901687 | glutathione derivative metabolic process(GO:1901685) glutathione derivative biosynthetic process(GO:1901687) |
| 0.0 | 1.8 | GO:0046329 | negative regulation of JNK cascade(GO:0046329) |
| 0.0 | 0.3 | GO:0050872 | white fat cell differentiation(GO:0050872) |
| 0.0 | 0.1 | GO:1904562 | phosphatidylinositol 5-phosphate metabolic process(GO:1904562) |
| 0.0 | 0.5 | GO:1900029 | positive regulation of ruffle assembly(GO:1900029) |
| 0.0 | 1.3 | GO:0043044 | ATP-dependent chromatin remodeling(GO:0043044) |
| 0.0 | 0.4 | GO:0034244 | negative regulation of transcription elongation from RNA polymerase II promoter(GO:0034244) |
| 0.0 | 0.3 | GO:1902659 | regulation of glucose mediated signaling pathway(GO:1902659) |
| 0.0 | 0.6 | GO:0035898 | parathyroid hormone secretion(GO:0035898) regulation of parathyroid hormone secretion(GO:2000828) |
| 0.0 | 1.2 | GO:0030207 | chondroitin sulfate catabolic process(GO:0030207) |
| 0.0 | 0.3 | GO:0042276 | error-prone translesion synthesis(GO:0042276) |
| 0.0 | 0.5 | GO:0030903 | notochord development(GO:0030903) |
| 0.0 | 0.2 | GO:0000379 | tRNA-type intron splice site recognition and cleavage(GO:0000379) |
| 0.0 | 0.7 | GO:0051823 | regulation of synapse structural plasticity(GO:0051823) |
| 0.0 | 0.3 | GO:0090168 | Golgi reassembly(GO:0090168) |
| 0.0 | 0.0 | GO:2000301 | negative regulation of synaptic vesicle exocytosis(GO:2000301) |
| 0.0 | 0.1 | GO:0097032 | mitochondrial electron transport, succinate to ubiquinone(GO:0006121) respiratory chain complex II assembly(GO:0034552) mitochondrial respiratory chain complex II assembly(GO:0034553) mitochondrial respiratory chain complex II biogenesis(GO:0097032) |
| 0.0 | 0.1 | GO:0071350 | interleukin-15-mediated signaling pathway(GO:0035723) cellular response to interleukin-15(GO:0071350) |
| 0.0 | 8.6 | GO:0065004 | protein-DNA complex assembly(GO:0065004) |
| 0.0 | 1.8 | GO:0032467 | positive regulation of cytokinesis(GO:0032467) |
| 0.0 | 0.5 | GO:0007258 | JUN phosphorylation(GO:0007258) |
| 0.0 | 0.4 | GO:0007379 | segment specification(GO:0007379) |
| 0.0 | 0.5 | GO:0044320 | cellular response to leptin stimulus(GO:0044320) |
| 0.0 | 0.2 | GO:1904579 | response to thapsigargin(GO:1904578) cellular response to thapsigargin(GO:1904579) |
| 0.0 | 0.2 | GO:0070278 | extracellular matrix constituent secretion(GO:0070278) |
| 0.0 | 0.3 | GO:0006655 | phosphatidylglycerol biosynthetic process(GO:0006655) cardiolipin biosynthetic process(GO:0032049) |
| 0.0 | 0.0 | GO:1900154 | regulation of bone trabecula formation(GO:1900154) negative regulation of bone trabecula formation(GO:1900155) |
| 0.0 | 0.6 | GO:0001867 | complement activation, lectin pathway(GO:0001867) |
| 0.0 | 0.0 | GO:2001271 | regulation of cysteine-type endopeptidase activity involved in execution phase of apoptosis(GO:2001270) negative regulation of cysteine-type endopeptidase activity involved in execution phase of apoptosis(GO:2001271) |
| 0.0 | 1.2 | GO:0009081 | branched-chain amino acid metabolic process(GO:0009081) branched-chain amino acid catabolic process(GO:0009083) |
| 0.0 | 0.1 | GO:1903715 | regulation of aerobic respiration(GO:1903715) |
| 0.0 | 0.1 | GO:0072385 | minus-end-directed organelle transport along microtubule(GO:0072385) |
| 0.0 | 0.2 | GO:0032417 | regulation of sodium:proton antiporter activity(GO:0032415) positive regulation of sodium:proton antiporter activity(GO:0032417) negative regulation of calcineurin-NFAT signaling cascade(GO:0070885) |
| 0.0 | 0.8 | GO:0039529 | RIG-I signaling pathway(GO:0039529) |
| 0.0 | 0.1 | GO:0007113 | endomitotic cell cycle(GO:0007113) |
| 0.0 | 1.1 | GO:0008053 | mitochondrial fusion(GO:0008053) |
| 0.0 | 0.7 | GO:0007342 | fusion of sperm to egg plasma membrane(GO:0007342) |
| 0.0 | 1.3 | GO:0045599 | negative regulation of fat cell differentiation(GO:0045599) |
| 0.0 | 0.1 | GO:0090283 | regulation of protein glycosylation in Golgi(GO:0090283) |
| 0.0 | 0.2 | GO:0006420 | arginyl-tRNA aminoacylation(GO:0006420) |
| 0.0 | 0.2 | GO:1900425 | negative regulation of defense response to bacterium(GO:1900425) |
| 0.0 | 0.3 | GO:0030949 | positive regulation of vascular endothelial growth factor receptor signaling pathway(GO:0030949) |
| 0.0 | 0.5 | GO:0006296 | nucleotide-excision repair, DNA incision, 5'-to lesion(GO:0006296) |
| 0.0 | 0.4 | GO:0014894 | response to muscle inactivity involved in regulation of muscle adaptation(GO:0014877) response to denervation involved in regulation of muscle adaptation(GO:0014894) |
| 0.0 | 0.4 | GO:0032957 | inositol trisphosphate metabolic process(GO:0032957) |
| 0.0 | 0.3 | GO:0000101 | sulfur amino acid transport(GO:0000101) |
| 0.0 | 0.4 | GO:0031915 | positive regulation of synaptic plasticity(GO:0031915) |
| 0.0 | 0.2 | GO:0070164 | negative regulation of adiponectin secretion(GO:0070164) |
| 0.0 | 0.2 | GO:0006003 | fructose 2,6-bisphosphate metabolic process(GO:0006003) |
| 0.0 | 0.7 | GO:0048535 | lymph node development(GO:0048535) |
| 0.0 | 0.1 | GO:0090131 | mesenchyme migration(GO:0090131) |
| 0.0 | 0.5 | GO:0035886 | vascular smooth muscle cell differentiation(GO:0035886) |
| 0.0 | 0.2 | GO:0001765 | membrane raft assembly(GO:0001765) |
| 0.0 | 0.9 | GO:0050819 | negative regulation of coagulation(GO:0050819) |
| 0.0 | 0.2 | GO:0060897 | neural plate anterior/posterior regionalization(GO:0021999) neural plate regionalization(GO:0060897) |
| 0.0 | 0.1 | GO:0050916 | sensory perception of sweet taste(GO:0050916) |
| 0.0 | 0.5 | GO:0000052 | citrulline metabolic process(GO:0000052) |
| 0.0 | 1.0 | GO:0006301 | postreplication repair(GO:0006301) |
| 0.0 | 0.1 | GO:0036149 | phosphatidylinositol acyl-chain remodeling(GO:0036149) |
| 0.0 | 0.5 | GO:0035584 | calcium-mediated signaling using intracellular calcium source(GO:0035584) |
| 0.0 | 1.0 | GO:0030513 | positive regulation of BMP signaling pathway(GO:0030513) |
| 0.0 | 0.5 | GO:0043984 | histone H4-K16 acetylation(GO:0043984) |
| 0.0 | 0.7 | GO:2000114 | regulation of establishment of cell polarity(GO:2000114) |
| 0.0 | 0.3 | GO:0070050 | neuron cellular homeostasis(GO:0070050) |
| 0.0 | 0.1 | GO:0003095 | pressure natriuresis(GO:0003095) |
| 0.0 | 0.2 | GO:0030311 | poly-N-acetyllactosamine biosynthetic process(GO:0030311) |
| 0.0 | 0.1 | GO:2000721 | positive regulation of transcription from RNA polymerase II promoter involved in smooth muscle cell differentiation(GO:2000721) |
| 0.0 | 0.2 | GO:1904936 | cerebral cortex GABAergic interneuron migration(GO:0021853) interneuron migration(GO:1904936) |
| 0.0 | 0.1 | GO:0060684 | epithelial-mesenchymal cell signaling(GO:0060684) |
| 0.0 | 5.1 | GO:0007156 | homophilic cell adhesion via plasma membrane adhesion molecules(GO:0007156) |
| 0.0 | 0.6 | GO:0002021 | response to dietary excess(GO:0002021) |
| 0.0 | 1.2 | GO:0010761 | fibroblast migration(GO:0010761) |
| 0.0 | 0.1 | GO:1904806 | regulation of protein oxidation(GO:1904806) positive regulation of protein oxidation(GO:1904808) |
| 0.0 | 2.1 | GO:0030574 | collagen catabolic process(GO:0030574) |
| 0.0 | 0.2 | GO:0010890 | positive regulation of sequestering of triglyceride(GO:0010890) |
| 0.0 | 1.1 | GO:0006409 | tRNA export from nucleus(GO:0006409) tRNA-containing ribonucleoprotein complex export from nucleus(GO:0071431) |
| 0.0 | 0.5 | GO:0036109 | alpha-linolenic acid metabolic process(GO:0036109) linoleic acid metabolic process(GO:0043651) |
| 0.0 | 0.2 | GO:0090051 | negative regulation of cell migration involved in sprouting angiogenesis(GO:0090051) |
| 0.0 | 0.2 | GO:0006621 | protein retention in ER lumen(GO:0006621) |
| 0.0 | 0.2 | GO:0007567 | parturition(GO:0007567) |
| 0.0 | 0.2 | GO:0000050 | urea cycle(GO:0000050) |
| 0.0 | 1.2 | GO:0070206 | protein trimerization(GO:0070206) |
| 0.0 | 1.0 | GO:0045589 | regulation of regulatory T cell differentiation(GO:0045589) |
| 0.0 | 0.2 | GO:0021930 | cell proliferation in hindbrain(GO:0021534) cell proliferation in external granule layer(GO:0021924) cerebellar granule cell precursor proliferation(GO:0021930) |
| 0.0 | 0.3 | GO:0008090 | retrograde axonal transport(GO:0008090) |
| 0.0 | 0.6 | GO:0019511 | peptidyl-proline hydroxylation(GO:0019511) |
| 0.0 | 0.1 | GO:0044794 | positive regulation by host of viral process(GO:0044794) |
| 0.0 | 1.3 | GO:0046839 | phospholipid dephosphorylation(GO:0046839) |
| 0.0 | 0.5 | GO:0010971 | positive regulation of G2/M transition of mitotic cell cycle(GO:0010971) |
| 0.0 | 0.2 | GO:1990440 | positive regulation of transcription from RNA polymerase II promoter in response to endoplasmic reticulum stress(GO:1990440) |
| 0.0 | 0.0 | GO:0061502 | early endosome to recycling endosome transport(GO:0061502) |
| 0.0 | 0.6 | GO:0034453 | microtubule anchoring(GO:0034453) |
| 0.0 | 0.4 | GO:1902083 | negative regulation of peptidyl-cysteine S-nitrosylation(GO:1902083) |
| 0.0 | 0.5 | GO:0050995 | negative regulation of lipid catabolic process(GO:0050995) |
| 0.0 | 0.1 | GO:1902109 | negative regulation of mitochondrial membrane permeability involved in apoptotic process(GO:1902109) |
| 0.0 | 0.4 | GO:0097320 | membrane tubulation(GO:0097320) |
| 0.0 | 0.4 | GO:0046475 | glycerophospholipid catabolic process(GO:0046475) |
| 0.0 | 0.1 | GO:0043568 | positive regulation of insulin-like growth factor receptor signaling pathway(GO:0043568) |
| 0.0 | 1.7 | GO:0006446 | regulation of translational initiation(GO:0006446) |
| 0.0 | 1.7 | GO:0060218 | hematopoietic stem cell differentiation(GO:0060218) |
| 0.0 | 0.1 | GO:0045602 | negative regulation of endothelial cell differentiation(GO:0045602) |
| 0.0 | 0.7 | GO:0000188 | inactivation of MAPK activity(GO:0000188) |
| 0.0 | 0.2 | GO:0001953 | negative regulation of cell-matrix adhesion(GO:0001953) |
| 0.0 | 0.2 | GO:0032025 | response to cobalt ion(GO:0032025) |
| 0.0 | 0.6 | GO:1903170 | negative regulation of calcium ion transmembrane transport(GO:1903170) |
| 0.0 | 0.7 | GO:0035329 | hippo signaling(GO:0035329) |
| 0.0 | 0.1 | GO:2000427 | positive regulation of apoptotic cell clearance(GO:2000427) |
| 0.0 | 0.7 | GO:0048384 | retinoic acid receptor signaling pathway(GO:0048384) |
| 0.0 | 0.1 | GO:0002318 | myeloid progenitor cell differentiation(GO:0002318) |
| 0.0 | 1.2 | GO:0060071 | Wnt signaling pathway, planar cell polarity pathway(GO:0060071) |
| 0.0 | 0.9 | GO:0035735 | intraciliary transport involved in cilium morphogenesis(GO:0035735) |
| 0.0 | 0.2 | GO:0030091 | protein repair(GO:0030091) |
| 0.0 | 0.0 | GO:1904693 | midbrain morphogenesis(GO:1904693) |
| 0.0 | 0.4 | GO:0051084 | 'de novo' posttranslational protein folding(GO:0051084) |
| 0.0 | 0.5 | GO:0016180 | snRNA processing(GO:0016180) |
| 0.0 | 0.6 | GO:0032728 | positive regulation of interferon-beta production(GO:0032728) |
| 0.0 | 0.1 | GO:0038169 | somatostatin receptor signaling pathway(GO:0038169) somatostatin signaling pathway(GO:0038170) |
| 0.0 | 0.8 | GO:0050798 | activated T cell proliferation(GO:0050798) |
| 0.0 | 0.8 | GO:1990090 | cellular response to nerve growth factor stimulus(GO:1990090) |
| 0.0 | 0.1 | GO:0008215 | spermine metabolic process(GO:0008215) |
| 0.0 | 0.2 | GO:1903012 | positive regulation of bone development(GO:1903012) |
| 0.0 | 0.3 | GO:0042753 | positive regulation of circadian rhythm(GO:0042753) |
| 0.0 | 0.1 | GO:0021521 | ventral spinal cord interneuron specification(GO:0021521) cell fate specification involved in pattern specification(GO:0060573) |
| 0.0 | 0.0 | GO:0010643 | cell communication by chemical coupling(GO:0010643) |
| 0.0 | 0.3 | GO:0045663 | positive regulation of myoblast differentiation(GO:0045663) |
| 0.0 | 3.7 | GO:0031032 | actomyosin structure organization(GO:0031032) |
| 0.0 | 3.5 | GO:0043123 | positive regulation of I-kappaB kinase/NF-kappaB signaling(GO:0043123) |
| 0.0 | 1.2 | GO:0022617 | extracellular matrix disassembly(GO:0022617) |
| 0.0 | 0.1 | GO:0051446 | positive regulation of meiotic cell cycle(GO:0051446) |
| 0.0 | 0.6 | GO:0071377 | cellular response to glucagon stimulus(GO:0071377) |
| 0.0 | 0.3 | GO:0002755 | MyD88-dependent toll-like receptor signaling pathway(GO:0002755) |
| 0.0 | 0.2 | GO:0038007 | netrin-activated signaling pathway(GO:0038007) |
| 0.0 | 0.3 | GO:0042994 | cytoplasmic sequestering of transcription factor(GO:0042994) |
| 0.0 | 1.1 | GO:0008625 | extrinsic apoptotic signaling pathway via death domain receptors(GO:0008625) |
| 0.0 | 0.1 | GO:0046073 | dTMP biosynthetic process(GO:0006231) dTMP metabolic process(GO:0046073) |
| 0.0 | 0.1 | GO:0070935 | 3'-UTR-mediated mRNA stabilization(GO:0070935) |
| 0.0 | 0.4 | GO:0005980 | glycogen catabolic process(GO:0005980) |
| 0.0 | 0.2 | GO:0032060 | bleb assembly(GO:0032060) |
| 0.0 | 0.1 | GO:0086053 | AV node cell to bundle of His cell communication by electrical coupling(GO:0086053) |
| 0.0 | 0.2 | GO:0015693 | magnesium ion transport(GO:0015693) |
| 0.0 | 0.2 | GO:0032757 | positive regulation of interleukin-8 production(GO:0032757) |
| 0.0 | 0.1 | GO:0010961 | cellular magnesium ion homeostasis(GO:0010961) |
| 0.0 | 0.1 | GO:0032700 | negative regulation of interleukin-17 production(GO:0032700) |
| 0.0 | 0.0 | GO:0032927 | positive regulation of activin receptor signaling pathway(GO:0032927) |
| 0.0 | 1.0 | GO:0090502 | RNA phosphodiester bond hydrolysis, endonucleolytic(GO:0090502) |
| 0.0 | 0.0 | GO:0043335 | protein unfolding(GO:0043335) |
| 0.0 | 0.1 | GO:0007076 | mitotic chromosome condensation(GO:0007076) |
| 0.0 | 0.1 | GO:0035518 | histone H2A monoubiquitination(GO:0035518) |
| 0.0 | 0.2 | GO:0045880 | positive regulation of smoothened signaling pathway(GO:0045880) |
Gene overrepresentation in cellular component category:
| Log-likelihood per target | Total log-likelihood | Term | Description |
|---|---|---|---|
| 1.2 | 4.7 | GO:0020003 | symbiont-containing vacuole(GO:0020003) |
| 0.6 | 3.7 | GO:0005945 | 6-phosphofructokinase complex(GO:0005945) |
| 0.6 | 15.5 | GO:0044300 | cerebellar mossy fiber(GO:0044300) |
| 0.6 | 3.5 | GO:0042272 | nuclear RNA export factor complex(GO:0042272) |
| 0.5 | 3.1 | GO:0000125 | PCAF complex(GO:0000125) |
| 0.5 | 7.6 | GO:0000124 | SAGA complex(GO:0000124) |
| 0.4 | 1.1 | GO:0072563 | endothelial microparticle(GO:0072563) |
| 0.4 | 3.2 | GO:0071953 | elastic fiber(GO:0071953) |
| 0.4 | 2.1 | GO:0034673 | inhibin-betaglycan-ActRII complex(GO:0034673) |
| 0.3 | 1.4 | GO:1990851 | Wnt-Frizzled-LRP5/6 complex(GO:1990851) |
| 0.3 | 1.0 | GO:0032116 | SMC loading complex(GO:0032116) |
| 0.3 | 0.9 | GO:1990666 | PCSK9-LDLR complex(GO:1990666) |
| 0.3 | 3.1 | GO:0005955 | calcineurin complex(GO:0005955) |
| 0.3 | 1.6 | GO:1990393 | 3M complex(GO:1990393) |
| 0.2 | 3.1 | GO:0070369 | beta-catenin-TCF7L2 complex(GO:0070369) |
| 0.2 | 2.3 | GO:0016589 | NURF complex(GO:0016589) |
| 0.2 | 3.0 | GO:0002116 | semaphorin receptor complex(GO:0002116) |
| 0.2 | 0.6 | GO:0070195 | growth hormone receptor complex(GO:0070195) |
| 0.2 | 0.8 | GO:0097629 | extrinsic component of omegasome membrane(GO:0097629) |
| 0.2 | 0.6 | GO:0097545 | axonemal outer doublet(GO:0097545) |
| 0.2 | 0.9 | GO:1990589 | ATF4-CREB1 transcription factor complex(GO:1990589) |
| 0.2 | 0.7 | GO:0070032 | synaptobrevin 2-SNAP-25-syntaxin-1a-complexin I complex(GO:0070032) |
| 0.2 | 1.2 | GO:0070554 | synaptobrevin 2-SNAP-25-syntaxin-3-complexin complex(GO:0070554) |
| 0.2 | 1.2 | GO:0005947 | mitochondrial alpha-ketoglutarate dehydrogenase complex(GO:0005947) |
| 0.2 | 0.5 | GO:0097135 | cyclin E2-CDK2 complex(GO:0097135) |
| 0.2 | 11.4 | GO:0045171 | intercellular bridge(GO:0045171) |
| 0.2 | 0.6 | GO:0044307 | dendritic branch(GO:0044307) |
| 0.2 | 0.8 | GO:0048179 | activin receptor complex(GO:0048179) |
| 0.2 | 0.6 | GO:0005595 | collagen type XII trimer(GO:0005595) |
| 0.2 | 0.6 | GO:0034365 | discoidal high-density lipoprotein particle(GO:0034365) |
| 0.1 | 1.3 | GO:0005587 | collagen type IV trimer(GO:0005587) |
| 0.1 | 0.5 | GO:0072517 | viral factory(GO:0039713) cytoplasmic viral factory(GO:0039714) host cell viral assembly compartment(GO:0072517) |
| 0.1 | 0.5 | GO:0071149 | TEAD-2-YAP complex(GO:0071149) |
| 0.1 | 2.2 | GO:0016281 | eukaryotic translation initiation factor 4F complex(GO:0016281) |
| 0.1 | 1.4 | GO:0051286 | cell tip(GO:0051286) |
| 0.1 | 0.2 | GO:1990590 | ATF1-ATF4 transcription factor complex(GO:1990590) |
| 0.1 | 0.3 | GO:0031084 | BLOC-2 complex(GO:0031084) |
| 0.1 | 0.2 | GO:0002193 | MAML1-RBP-Jkappa- ICN1 complex(GO:0002193) |
| 0.1 | 1.6 | GO:0070776 | H3 histone acetyltransferase complex(GO:0070775) MOZ/MORF histone acetyltransferase complex(GO:0070776) |
| 0.1 | 0.3 | GO:0071062 | alphav-beta3 integrin-vitronectin complex(GO:0071062) |
| 0.1 | 2.3 | GO:0043205 | microfibril(GO:0001527) fibril(GO:0043205) |
| 0.1 | 3.4 | GO:0016327 | apicolateral plasma membrane(GO:0016327) |
| 0.1 | 0.8 | GO:0005851 | eukaryotic translation initiation factor 2B complex(GO:0005851) |
| 0.1 | 0.2 | GO:0014802 | terminal cisterna(GO:0014802) |
| 0.1 | 0.9 | GO:0042406 | extrinsic component of endoplasmic reticulum membrane(GO:0042406) |
| 0.1 | 1.5 | GO:0097470 | ribbon synapse(GO:0097470) |
| 0.1 | 0.5 | GO:0043625 | delta DNA polymerase complex(GO:0043625) |
| 0.1 | 2.1 | GO:0010369 | chromocenter(GO:0010369) |
| 0.1 | 2.6 | GO:0035327 | transcriptionally active chromatin(GO:0035327) |
| 0.1 | 0.4 | GO:0005896 | interleukin-6 receptor complex(GO:0005896) |
| 0.1 | 3.4 | GO:0031092 | platelet alpha granule membrane(GO:0031092) |
| 0.1 | 1.5 | GO:0031095 | platelet dense tubular network membrane(GO:0031095) |
| 0.1 | 0.8 | GO:0001940 | male pronucleus(GO:0001940) |
| 0.1 | 0.9 | GO:0000439 | core TFIIH complex(GO:0000439) |
| 0.1 | 16.0 | GO:0016363 | nuclear matrix(GO:0016363) |
| 0.1 | 2.8 | GO:0030057 | desmosome(GO:0030057) |
| 0.1 | 1.4 | GO:0008074 | guanylate cyclase complex, soluble(GO:0008074) |
| 0.1 | 0.6 | GO:0032777 | Piccolo NuA4 histone acetyltransferase complex(GO:0032777) |
| 0.1 | 0.4 | GO:0032044 | DSIF complex(GO:0032044) |
| 0.1 | 38.3 | GO:0005667 | transcription factor complex(GO:0005667) |
| 0.1 | 8.7 | GO:0005581 | collagen trimer(GO:0005581) |
| 0.1 | 0.5 | GO:0031464 | Cul4A-RING E3 ubiquitin ligase complex(GO:0031464) |
| 0.1 | 0.8 | GO:0016600 | flotillin complex(GO:0016600) |
| 0.1 | 0.6 | GO:0042824 | MHC class I peptide loading complex(GO:0042824) |
| 0.1 | 0.5 | GO:0097209 | epidermal lamellar body(GO:0097209) |
| 0.1 | 0.4 | GO:0002079 | inner acrosomal membrane(GO:0002079) |
| 0.1 | 0.7 | GO:0016593 | Cdc73/Paf1 complex(GO:0016593) |
| 0.1 | 2.2 | GO:0005697 | telomerase holoenzyme complex(GO:0005697) |
| 0.1 | 0.6 | GO:0031465 | Cul4B-RING E3 ubiquitin ligase complex(GO:0031465) |
| 0.1 | 0.3 | GO:0016035 | zeta DNA polymerase complex(GO:0016035) |
| 0.1 | 0.2 | GO:0031933 | telomeric heterochromatin(GO:0031933) |
| 0.1 | 2.4 | GO:0030140 | trans-Golgi network transport vesicle(GO:0030140) |
| 0.1 | 3.6 | GO:0033017 | sarcoplasmic reticulum membrane(GO:0033017) |
| 0.1 | 0.5 | GO:0046696 | lipopolysaccharide receptor complex(GO:0046696) |
| 0.1 | 0.3 | GO:0090571 | RNA polymerase II transcription repressor complex(GO:0090571) |
| 0.0 | 0.4 | GO:0072487 | MSL complex(GO:0072487) |
| 0.0 | 0.3 | GO:0005915 | zonula adherens(GO:0005915) |
| 0.0 | 1.3 | GO:0031307 | integral component of mitochondrial outer membrane(GO:0031307) |
| 0.0 | 0.3 | GO:0031673 | H zone(GO:0031673) |
| 0.0 | 0.6 | GO:0030008 | TRAPP complex(GO:0030008) |
| 0.0 | 0.4 | GO:0005964 | phosphorylase kinase complex(GO:0005964) |
| 0.0 | 1.1 | GO:0031231 | integral component of peroxisomal membrane(GO:0005779) intrinsic component of peroxisomal membrane(GO:0031231) |
| 0.0 | 4.2 | GO:0030864 | cortical actin cytoskeleton(GO:0030864) |
| 0.0 | 1.5 | GO:0016514 | SWI/SNF complex(GO:0016514) |
| 0.0 | 1.4 | GO:0032839 | dendrite cytoplasm(GO:0032839) |
| 0.0 | 5.7 | GO:0043202 | lysosomal lumen(GO:0043202) |
| 0.0 | 1.1 | GO:0016581 | NuRD complex(GO:0016581) CHD-type complex(GO:0090545) |
| 0.0 | 0.4 | GO:0044666 | MLL3/4 complex(GO:0044666) |
| 0.0 | 0.1 | GO:0035517 | PR-DUB complex(GO:0035517) |
| 0.0 | 1.2 | GO:0034451 | centriolar satellite(GO:0034451) |
| 0.0 | 0.3 | GO:0032584 | growth cone membrane(GO:0032584) |
| 0.0 | 0.2 | GO:0000214 | tRNA-intron endonuclease complex(GO:0000214) |
| 0.0 | 0.8 | GO:0032982 | myosin filament(GO:0032982) |
| 0.0 | 0.9 | GO:0042629 | mast cell granule(GO:0042629) |
| 0.0 | 0.5 | GO:0036020 | endolysosome membrane(GO:0036020) |
| 0.0 | 0.1 | GO:0008537 | proteasome activator complex(GO:0008537) |
| 0.0 | 0.5 | GO:0032045 | guanyl-nucleotide exchange factor complex(GO:0032045) |
| 0.0 | 0.4 | GO:0032039 | integrator complex(GO:0032039) |
| 0.0 | 0.8 | GO:0097546 | ciliary base(GO:0097546) |
| 0.0 | 0.5 | GO:0031588 | nucleotide-activated protein kinase complex(GO:0031588) |
| 0.0 | 0.2 | GO:0098839 | postsynaptic density membrane(GO:0098839) |
| 0.0 | 0.7 | GO:0030904 | retromer complex(GO:0030904) |
| 0.0 | 0.4 | GO:0080008 | Cul4-RING E3 ubiquitin ligase complex(GO:0080008) |
| 0.0 | 0.5 | GO:0005614 | interstitial matrix(GO:0005614) |
| 0.0 | 0.2 | GO:0042105 | alpha-beta T cell receptor complex(GO:0042105) |
| 0.0 | 0.6 | GO:0030863 | cortical cytoskeleton(GO:0030863) |
| 0.0 | 1.2 | GO:0000123 | histone acetyltransferase complex(GO:0000123) |
| 0.0 | 0.1 | GO:0030485 | smooth muscle contractile fiber(GO:0030485) |
| 0.0 | 0.6 | GO:0044224 | juxtaparanode region of axon(GO:0044224) |
| 0.0 | 5.1 | GO:0005788 | endoplasmic reticulum lumen(GO:0005788) |
| 0.0 | 0.1 | GO:0070436 | Grb2-EGFR complex(GO:0070436) |
| 0.0 | 0.7 | GO:0008023 | transcription elongation factor complex(GO:0008023) |
| 0.0 | 0.1 | GO:0031501 | mannosyltransferase complex(GO:0031501) |
| 0.0 | 0.2 | GO:0072546 | ER membrane protein complex(GO:0072546) |
| 0.0 | 0.8 | GO:0002102 | podosome(GO:0002102) |
| 0.0 | 0.5 | GO:0035145 | exon-exon junction complex(GO:0035145) |
| 0.0 | 2.3 | GO:0001650 | fibrillar center(GO:0001650) |
| 0.0 | 0.4 | GO:0005868 | cytoplasmic dynein complex(GO:0005868) |
| 0.0 | 0.1 | GO:0017101 | aminoacyl-tRNA synthetase multienzyme complex(GO:0017101) |
| 0.0 | 0.8 | GO:0016235 | aggresome(GO:0016235) |
| 0.0 | 1.0 | GO:0005834 | heterotrimeric G-protein complex(GO:0005834) |
| 0.0 | 1.0 | GO:0031463 | Cul3-RING ubiquitin ligase complex(GO:0031463) |
| 0.0 | 1.1 | GO:0005796 | Golgi lumen(GO:0005796) |
| 0.0 | 0.4 | GO:0005921 | gap junction(GO:0005921) |
| 0.0 | 0.0 | GO:0005968 | Rab-protein geranylgeranyltransferase complex(GO:0005968) |
| 0.0 | 0.2 | GO:0043218 | compact myelin(GO:0043218) |
| 0.0 | 0.8 | GO:0005871 | kinesin complex(GO:0005871) |
| 0.0 | 0.1 | GO:0070381 | endosome to plasma membrane transport vesicle(GO:0070381) |
| 0.0 | 0.2 | GO:0031362 | anchored component of external side of plasma membrane(GO:0031362) |
| 0.0 | 0.2 | GO:0005751 | mitochondrial respiratory chain complex IV(GO:0005751) |
| 0.0 | 0.1 | GO:0045275 | mitochondrial respiratory chain complex III(GO:0005750) respiratory chain complex III(GO:0045275) |
Gene overrepresentation in molecular function category:
| Log-likelihood per target | Total log-likelihood | Term | Description |
|---|---|---|---|
| 1.6 | 20.6 | GO:0030274 | LIM domain binding(GO:0030274) |
| 0.9 | 4.7 | GO:0005223 | intracellular cGMP activated cation channel activity(GO:0005223) |
| 0.7 | 2.2 | GO:0004119 | cGMP-inhibited cyclic-nucleotide phosphodiesterase activity(GO:0004119) |
| 0.6 | 1.9 | GO:0005135 | erythropoietin receptor binding(GO:0005128) interleukin-3 receptor binding(GO:0005135) |
| 0.6 | 2.5 | GO:0016524 | latrotoxin receptor activity(GO:0016524) |
| 0.6 | 4.8 | GO:0008269 | JAK pathway signal transduction adaptor activity(GO:0008269) |
| 0.6 | 2.3 | GO:0031826 | type 2A serotonin receptor binding(GO:0031826) |
| 0.5 | 3.8 | GO:0034046 | poly(G) binding(GO:0034046) |
| 0.5 | 3.7 | GO:0047057 | oxidoreductase activity, acting on the CH-OH group of donors, disulfide as acceptor(GO:0016900) vitamin-K-epoxide reductase (warfarin-sensitive) activity(GO:0047057) |
| 0.5 | 2.5 | GO:0050436 | microfibril binding(GO:0050436) |
| 0.5 | 3.7 | GO:0003872 | 6-phosphofructokinase activity(GO:0003872) |
| 0.5 | 1.4 | GO:1904928 | coreceptor activity involved in canonical Wnt signaling pathway(GO:1904928) |
| 0.4 | 2.2 | GO:0047179 | platelet-activating factor acetyltransferase activity(GO:0047179) |
| 0.4 | 2.6 | GO:0003886 | DNA (cytosine-5-)-methyltransferase activity(GO:0003886) |
| 0.4 | 1.7 | GO:0008427 | calcium-dependent protein kinase inhibitor activity(GO:0008427) |
| 0.4 | 2.6 | GO:0050659 | N-acetylgalactosamine 4-sulfate 6-O-sulfotransferase activity(GO:0050659) |
| 0.4 | 3.3 | GO:0004468 | lysine N-acetyltransferase activity, acting on acetyl phosphate as donor(GO:0004468) |
| 0.4 | 1.2 | GO:0005289 | high-affinity basic amino acid transmembrane transporter activity(GO:0005287) high-affinity arginine transmembrane transporter activity(GO:0005289) high-affinity lysine transmembrane transporter activity(GO:0005292) |
| 0.4 | 1.2 | GO:0003863 | alpha-ketoacid dehydrogenase activity(GO:0003826) 3-methyl-2-oxobutanoate dehydrogenase (2-methylpropanoyl-transferring) activity(GO:0003863) |
| 0.4 | 3.9 | GO:0043199 | sulfate binding(GO:0043199) |
| 0.4 | 2.2 | GO:0052847 | endopolyphosphatase activity(GO:0000298) diphosphoinositol-polyphosphate diphosphatase activity(GO:0008486) bis(5'-adenosyl)-hexaphosphatase activity(GO:0034431) bis(5'-adenosyl)-pentaphosphatase activity(GO:0034432) inositol diphosphate tetrakisphosphate diphosphatase activity(GO:0052840) inositol bisdiphosphate tetrakisphosphate diphosphatase activity(GO:0052841) inositol diphosphate pentakisphosphate diphosphatase activity(GO:0052842) inositol-1-diphosphate-2,3,4,5,6-pentakisphosphate diphosphatase activity(GO:0052843) inositol-3-diphosphate-1,2,4,5,6-pentakisphosphate diphosphatase activity(GO:0052844) inositol-5-diphosphate-1,2,3,4,6-pentakisphosphate diphosphatase activity(GO:0052845) inositol-1,5-bisdiphosphate-2,3,4,6-tetrakisphosphate 1-diphosphatase activity(GO:0052846) inositol-1,5-bisdiphosphate-2,3,4,6-tetrakisphosphate 5-diphosphatase activity(GO:0052847) inositol-3,5-bisdiphosphate-2,3,4,6-tetrakisphosphate 5-diphosphatase activity(GO:0052848) |
| 0.4 | 4.3 | GO:0005114 | type II transforming growth factor beta receptor binding(GO:0005114) |
| 0.3 | 4.4 | GO:0070700 | BMP receptor binding(GO:0070700) |
| 0.3 | 1.6 | GO:0005087 | Ran guanyl-nucleotide exchange factor activity(GO:0005087) |
| 0.3 | 2.9 | GO:0033192 | calmodulin-dependent protein phosphatase activity(GO:0033192) |
| 0.3 | 1.8 | GO:0004699 | calcium-independent protein kinase C activity(GO:0004699) |
| 0.3 | 2.1 | GO:0030267 | hydroxypyruvate reductase activity(GO:0016618) glyoxylate reductase (NADP) activity(GO:0030267) |
| 0.3 | 0.8 | GO:0005275 | amine transmembrane transporter activity(GO:0005275) |
| 0.3 | 1.6 | GO:0008823 | cupric reductase activity(GO:0008823) ferric-chelate reductase (NADPH) activity(GO:0052851) |
| 0.3 | 2.7 | GO:0046974 | histone methyltransferase activity (H3-K9 specific)(GO:0046974) |
| 0.3 | 1.3 | GO:0016941 | natriuretic peptide receptor activity(GO:0016941) |
| 0.3 | 0.8 | GO:0098640 | integrin binding involved in cell-matrix adhesion(GO:0098640) |
| 0.3 | 1.5 | GO:0043522 | leucine zipper domain binding(GO:0043522) |
| 0.3 | 3.3 | GO:0003720 | telomerase activity(GO:0003720) RNA-directed DNA polymerase activity(GO:0003964) |
| 0.2 | 5.2 | GO:0001011 | transcription factor activity, sequence-specific DNA binding, RNA polymerase recruiting(GO:0001011) transcription factor activity, TFIIB-class binding(GO:0001087) |
| 0.2 | 0.7 | GO:0072590 | N-acetyl-L-aspartate-L-glutamate ligase activity(GO:0072590) |
| 0.2 | 3.6 | GO:0005007 | fibroblast growth factor-activated receptor activity(GO:0005007) |
| 0.2 | 0.7 | GO:0043035 | chromatin insulator sequence binding(GO:0043035) |
| 0.2 | 0.7 | GO:0010698 | acetyltransferase activator activity(GO:0010698) |
| 0.2 | 1.3 | GO:0042392 | sphingosine-1-phosphate phosphatase activity(GO:0042392) |
| 0.2 | 1.1 | GO:0008113 | peptide-methionine (S)-S-oxide reductase activity(GO:0008113) |
| 0.2 | 1.1 | GO:0080019 | fatty-acyl-CoA reductase (alcohol-forming) activity(GO:0080019) |
| 0.2 | 1.0 | GO:0008073 | ornithine decarboxylase inhibitor activity(GO:0008073) |
| 0.2 | 2.3 | GO:0050692 | DBD domain binding(GO:0050692) |
| 0.2 | 1.2 | GO:0004522 | ribonuclease A activity(GO:0004522) |
| 0.2 | 4.8 | GO:0070016 | armadillo repeat domain binding(GO:0070016) |
| 0.2 | 0.8 | GO:0005163 | nerve growth factor receptor binding(GO:0005163) |
| 0.2 | 1.3 | GO:0008142 | oxysterol binding(GO:0008142) |
| 0.2 | 0.8 | GO:0019770 | IgG receptor activity(GO:0019770) |
| 0.2 | 1.1 | GO:0038062 | protein tyrosine kinase collagen receptor activity(GO:0038062) |
| 0.2 | 0.5 | GO:0005483 | soluble NSF attachment protein activity(GO:0005483) |
| 0.2 | 4.2 | GO:0019871 | sodium channel inhibitor activity(GO:0019871) |
| 0.2 | 0.5 | GO:0010861 | thyroid hormone receptor activator activity(GO:0010861) thyroid hormone receptor coactivator activity(GO:0030375) |
| 0.2 | 0.5 | GO:0008401 | retinoic acid 4-hydroxylase activity(GO:0008401) |
| 0.2 | 1.0 | GO:0060961 | phospholipase D inhibitor activity(GO:0060961) |
| 0.2 | 1.0 | GO:0036033 | mediator complex binding(GO:0036033) |
| 0.2 | 2.6 | GO:0001075 | transcription factor activity, RNA polymerase II core promoter sequence-specific binding involved in preinitiation complex assembly(GO:0001075) |
| 0.2 | 2.1 | GO:0097100 | supercoiled DNA binding(GO:0097100) |
| 0.2 | 3.3 | GO:0017154 | semaphorin receptor activity(GO:0017154) |
| 0.2 | 1.0 | GO:0005534 | galactose binding(GO:0005534) |
| 0.2 | 0.9 | GO:1990763 | arrestin family protein binding(GO:1990763) |
| 0.2 | 0.8 | GO:0005105 | type 1 fibroblast growth factor receptor binding(GO:0005105) |
| 0.2 | 2.9 | GO:0008179 | adenylate cyclase binding(GO:0008179) |
| 0.1 | 0.4 | GO:0070119 | ciliary neurotrophic factor binding(GO:0070119) |
| 0.1 | 0.7 | GO:0070579 | methylcytosine dioxygenase activity(GO:0070579) |
| 0.1 | 0.4 | GO:0052856 | NADHX epimerase activity(GO:0052856) NADPHX epimerase activity(GO:0052857) |
| 0.1 | 0.4 | GO:0055100 | adiponectin binding(GO:0055100) |
| 0.1 | 0.6 | GO:0019797 | procollagen-proline 3-dioxygenase activity(GO:0019797) |
| 0.1 | 1.4 | GO:0048039 | ubiquinone binding(GO:0048039) |
| 0.1 | 0.7 | GO:0047280 | nicotinamide phosphoribosyltransferase activity(GO:0047280) |
| 0.1 | 2.5 | GO:0004887 | thyroid hormone receptor activity(GO:0004887) |
| 0.1 | 1.0 | GO:0071558 | histone demethylase activity (H3-K27 specific)(GO:0071558) |
| 0.1 | 1.1 | GO:0047522 | 13-prostaglandin reductase activity(GO:0036132) 15-oxoprostaglandin 13-oxidase activity(GO:0047522) |
| 0.1 | 0.4 | GO:0005017 | platelet-derived growth factor-activated receptor activity(GO:0005017) |
| 0.1 | 0.4 | GO:0052726 | inositol tetrakisphosphate 1-kinase activity(GO:0047325) inositol-1,3,4-trisphosphate 6-kinase activity(GO:0052725) inositol-1,3,4-trisphosphate 5-kinase activity(GO:0052726) inositol-1,3,4,5,6-pentakisphosphate 1-phosphatase activity(GO:0052825) inositol-1,3,4,6-tetrakisphosphate 6-phosphatase activity(GO:0052830) inositol-1,3,4,6-tetrakisphosphate 1-phosphatase activity(GO:0052831) inositol-3,4,6-trisphosphate 1-kinase activity(GO:0052835) |
| 0.1 | 0.5 | GO:0016215 | stearoyl-CoA 9-desaturase activity(GO:0004768) acyl-CoA desaturase activity(GO:0016215) |
| 0.1 | 1.2 | GO:0070569 | uridylyltransferase activity(GO:0070569) |
| 0.1 | 0.7 | GO:0003998 | acylphosphatase activity(GO:0003998) |
| 0.1 | 0.4 | GO:0008267 | poly-glutamine tract binding(GO:0008267) |
| 0.1 | 0.7 | GO:0010465 | nerve growth factor receptor activity(GO:0010465) |
| 0.1 | 1.3 | GO:0036310 | annealing helicase activity(GO:0036310) |
| 0.1 | 0.7 | GO:0043208 | glycosphingolipid binding(GO:0043208) |
| 0.1 | 0.3 | GO:0015140 | malate transmembrane transporter activity(GO:0015140) |
| 0.1 | 1.9 | GO:0008140 | cAMP response element binding protein binding(GO:0008140) |
| 0.1 | 4.0 | GO:0000983 | transcription factor activity, RNA polymerase II core promoter sequence-specific(GO:0000983) |
| 0.1 | 0.3 | GO:0016784 | 3-mercaptopyruvate sulfurtransferase activity(GO:0016784) |
| 0.1 | 2.0 | GO:0005024 | transforming growth factor beta-activated receptor activity(GO:0005024) |
| 0.1 | 4.6 | GO:0003785 | actin monomer binding(GO:0003785) |
| 0.1 | 0.5 | GO:0004706 | JUN kinase kinase kinase activity(GO:0004706) |
| 0.1 | 0.9 | GO:0032050 | low-density lipoprotein particle binding(GO:0030169) clathrin heavy chain binding(GO:0032050) |
| 0.1 | 2.6 | GO:0097493 | structural molecule activity conferring elasticity(GO:0097493) |
| 0.1 | 1.0 | GO:0004565 | beta-galactosidase activity(GO:0004565) |
| 0.1 | 0.9 | GO:0042301 | phosphate ion binding(GO:0042301) |
| 0.1 | 0.6 | GO:0047696 | beta-adrenergic receptor kinase activity(GO:0047696) |
| 0.1 | 0.7 | GO:0015349 | thyroid hormone transmembrane transporter activity(GO:0015349) |
| 0.1 | 0.3 | GO:0008520 | L-ascorbate:sodium symporter activity(GO:0008520) sodium-dependent multivitamin transmembrane transporter activity(GO:0008523) L-ascorbic acid transporter activity(GO:0015229) sodium-dependent L-ascorbate transmembrane transporter activity(GO:0070890) |
| 0.1 | 2.4 | GO:0031852 | mu-type opioid receptor binding(GO:0031852) |
| 0.1 | 2.3 | GO:0070006 | metalloaminopeptidase activity(GO:0070006) |
| 0.1 | 1.3 | GO:0001206 | transcriptional repressor activity, RNA polymerase II distal enhancer sequence-specific binding(GO:0001206) |
| 0.1 | 0.7 | GO:0016403 | dimethylargininase activity(GO:0016403) |
| 0.1 | 1.1 | GO:0042608 | T cell receptor binding(GO:0042608) |
| 0.1 | 0.5 | GO:0034186 | apolipoprotein A-I binding(GO:0034186) |
| 0.1 | 0.2 | GO:0000403 | Y-form DNA binding(GO:0000403) |
| 0.1 | 0.8 | GO:0017169 | CDP-alcohol phosphatidyltransferase activity(GO:0017169) |
| 0.1 | 0.2 | GO:0036361 | L-serine ammonia-lyase activity(GO:0003941) racemase and epimerase activity, acting on amino acids and derivatives(GO:0016855) racemase activity, acting on amino acids and derivatives(GO:0036361) amino-acid racemase activity(GO:0047661) |
| 0.1 | 0.5 | GO:0031871 | proteinase activated receptor binding(GO:0031871) |
| 0.1 | 0.3 | GO:0005169 | neurotrophin TRKB receptor binding(GO:0005169) |
| 0.1 | 1.2 | GO:0019911 | structural constituent of myelin sheath(GO:0019911) |
| 0.1 | 0.2 | GO:0004958 | prostaglandin F receptor activity(GO:0004958) |
| 0.1 | 0.2 | GO:0015616 | DNA translocase activity(GO:0015616) |
| 0.1 | 0.4 | GO:0015433 | peptide antigen-transporting ATPase activity(GO:0015433) |
| 0.1 | 1.9 | GO:0070330 | aromatase activity(GO:0070330) |
| 0.1 | 0.9 | GO:0019870 | potassium channel inhibitor activity(GO:0019870) |
| 0.1 | 0.2 | GO:0004874 | aryl hydrocarbon receptor activity(GO:0004874) |
| 0.1 | 0.8 | GO:1990247 | N6-methyladenosine-containing RNA binding(GO:1990247) |
| 0.1 | 0.3 | GO:0050815 | phosphoserine binding(GO:0050815) |
| 0.1 | 0.3 | GO:0008449 | N-acetylglucosamine-6-sulfatase activity(GO:0008449) |
| 0.1 | 0.8 | GO:0042731 | PH domain binding(GO:0042731) |
| 0.1 | 0.6 | GO:0043237 | laminin-1 binding(GO:0043237) |
| 0.1 | 0.2 | GO:0004782 | sulfinoalanine decarboxylase activity(GO:0004782) |
| 0.1 | 0.9 | GO:0015174 | basic amino acid transmembrane transporter activity(GO:0015174) |
| 0.1 | 1.0 | GO:0004017 | adenylate kinase activity(GO:0004017) |
| 0.1 | 2.4 | GO:0008327 | methyl-CpG binding(GO:0008327) |
| 0.1 | 2.6 | GO:0043027 | cysteine-type endopeptidase inhibitor activity involved in apoptotic process(GO:0043027) |
| 0.1 | 0.2 | GO:0047223 | beta-1,3-galactosyl-O-glycosyl-glycoprotein beta-1,3-N-acetylglucosaminyltransferase activity(GO:0047223) |
| 0.1 | 4.8 | GO:0030374 | ligand-dependent nuclear receptor transcription coactivator activity(GO:0030374) |
| 0.1 | 0.2 | GO:0005046 | KDEL sequence binding(GO:0005046) |
| 0.1 | 10.4 | GO:0003697 | single-stranded DNA binding(GO:0003697) |
| 0.1 | 0.7 | GO:0005072 | transforming growth factor beta receptor, cytoplasmic mediator activity(GO:0005072) |
| 0.1 | 0.8 | GO:0000774 | adenyl-nucleotide exchange factor activity(GO:0000774) |
| 0.1 | 0.2 | GO:0004723 | calcium-dependent protein serine/threonine phosphatase activity(GO:0004723) |
| 0.1 | 0.7 | GO:0001223 | transcription coactivator binding(GO:0001223) |
| 0.1 | 1.9 | GO:0005545 | 1-phosphatidylinositol binding(GO:0005545) |
| 0.1 | 2.7 | GO:0001102 | RNA polymerase II activating transcription factor binding(GO:0001102) |
| 0.1 | 0.3 | GO:0046964 | 3'-phosphoadenosine 5'-phosphosulfate transmembrane transporter activity(GO:0046964) |
| 0.1 | 0.7 | GO:0030020 | extracellular matrix structural constituent conferring tensile strength(GO:0030020) |
| 0.1 | 2.1 | GO:0030676 | Rac guanyl-nucleotide exchange factor activity(GO:0030676) |
| 0.1 | 4.4 | GO:0005044 | scavenger receptor activity(GO:0005044) |
| 0.1 | 0.2 | GO:0016428 | tRNA (cytosine-5-)-methyltransferase activity(GO:0016428) |
| 0.1 | 5.2 | GO:0008094 | DNA-dependent ATPase activity(GO:0008094) |
| 0.1 | 1.4 | GO:0008190 | eukaryotic initiation factor 4E binding(GO:0008190) |
| 0.1 | 0.7 | GO:0000182 | rDNA binding(GO:0000182) |
| 0.1 | 1.7 | GO:0005001 | transmembrane receptor protein tyrosine phosphatase activity(GO:0005001) transmembrane receptor protein phosphatase activity(GO:0019198) |
| 0.1 | 0.5 | GO:0050431 | transforming growth factor beta binding(GO:0050431) |
| 0.1 | 5.8 | GO:0000979 | RNA polymerase II core promoter sequence-specific DNA binding(GO:0000979) |
| 0.0 | 0.8 | GO:0017017 | MAP kinase tyrosine/serine/threonine phosphatase activity(GO:0017017) |
| 0.0 | 0.3 | GO:0004366 | glycerol-3-phosphate O-acyltransferase activity(GO:0004366) |
| 0.0 | 0.3 | GO:0030172 | troponin C binding(GO:0030172) |
| 0.0 | 1.0 | GO:0048156 | tau protein binding(GO:0048156) |
| 0.0 | 0.1 | GO:0004584 | dolichyl-phosphate-mannose-glycolipid alpha-mannosyltransferase activity(GO:0004584) |
| 0.0 | 18.5 | GO:0001077 | transcriptional activator activity, RNA polymerase II core promoter proximal region sequence-specific binding(GO:0001077) |
| 0.0 | 0.1 | GO:0030272 | 5-formyltetrahydrofolate cyclo-ligase activity(GO:0030272) |
| 0.0 | 0.3 | GO:0001165 | RNA polymerase I upstream control element sequence-specific DNA binding(GO:0001165) |
| 0.0 | 0.6 | GO:0017034 | Rap guanyl-nucleotide exchange factor activity(GO:0017034) |
| 0.0 | 0.2 | GO:0035497 | cAMP response element binding(GO:0035497) |
| 0.0 | 0.4 | GO:1903763 | gap junction channel activity involved in cell communication by electrical coupling(GO:1903763) |
| 0.0 | 0.6 | GO:0005347 | adenine nucleotide transmembrane transporter activity(GO:0000295) purine ribonucleotide transmembrane transporter activity(GO:0005346) ATP transmembrane transporter activity(GO:0005347) ADP transmembrane transporter activity(GO:0015217) |
| 0.0 | 1.6 | GO:0017075 | syntaxin-1 binding(GO:0017075) |
| 0.0 | 1.1 | GO:0070300 | phosphatidic acid binding(GO:0070300) |
| 0.0 | 0.4 | GO:0004689 | phosphorylase kinase activity(GO:0004689) |
| 0.0 | 0.5 | GO:0016500 | protein-hormone receptor activity(GO:0016500) |
| 0.0 | 0.4 | GO:0008420 | CTD phosphatase activity(GO:0008420) |
| 0.0 | 0.3 | GO:0015220 | choline transmembrane transporter activity(GO:0015220) |
| 0.0 | 0.1 | GO:0017129 | triglyceride binding(GO:0017129) |
| 0.0 | 0.7 | GO:0016175 | superoxide-generating NADPH oxidase activity(GO:0016175) |
| 0.0 | 0.5 | GO:0030957 | Tat protein binding(GO:0030957) |
| 0.0 | 0.5 | GO:0004705 | JUN kinase activity(GO:0004705) SAP kinase activity(GO:0016909) |
| 0.0 | 0.3 | GO:0003854 | 3-beta-hydroxy-delta5-steroid dehydrogenase activity(GO:0003854) |
| 0.0 | 0.1 | GO:0097371 | MDM2/MDM4 family protein binding(GO:0097371) |
| 0.0 | 0.3 | GO:0000099 | sulfur amino acid transmembrane transporter activity(GO:0000099) |
| 0.0 | 0.3 | GO:0051425 | PTB domain binding(GO:0051425) |
| 0.0 | 0.7 | GO:0004707 | MAP kinase activity(GO:0004707) |
| 0.0 | 0.2 | GO:0016520 | growth hormone-releasing hormone receptor activity(GO:0016520) |
| 0.0 | 0.2 | GO:0001849 | complement component C1q binding(GO:0001849) |
| 0.0 | 0.5 | GO:0004679 | AMP-activated protein kinase activity(GO:0004679) |
| 0.0 | 1.0 | GO:0008266 | poly(U) RNA binding(GO:0008266) |
| 0.0 | 0.2 | GO:0004814 | arginine-tRNA ligase activity(GO:0004814) |
| 0.0 | 0.2 | GO:0008443 | phosphofructokinase activity(GO:0008443) |
| 0.0 | 0.4 | GO:0015129 | lactate transmembrane transporter activity(GO:0015129) |
| 0.0 | 1.6 | GO:0004364 | glutathione transferase activity(GO:0004364) |
| 0.0 | 0.2 | GO:0016813 | hydrolase activity, acting on carbon-nitrogen (but not peptide) bonds, in linear amidines(GO:0016813) |
| 0.0 | 0.5 | GO:0035615 | clathrin adaptor activity(GO:0035615) endocytic adaptor activity(GO:0098748) |
| 0.0 | 0.2 | GO:1990446 | U1 snRNP binding(GO:1990446) |
| 0.0 | 0.4 | GO:0005078 | MAP-kinase scaffold activity(GO:0005078) |
| 0.0 | 0.6 | GO:0034450 | ubiquitin-ubiquitin ligase activity(GO:0034450) |
| 0.0 | 0.3 | GO:0019784 | NEDD8-specific protease activity(GO:0019784) |
| 0.0 | 0.2 | GO:0033743 | peptide-methionine (R)-S-oxide reductase activity(GO:0033743) |
| 0.0 | 1.3 | GO:0030544 | Hsp70 protein binding(GO:0030544) |
| 0.0 | 0.1 | GO:0018685 | alkane 1-monooxygenase activity(GO:0018685) |
| 0.0 | 0.2 | GO:0015277 | kainate selective glutamate receptor activity(GO:0015277) |
| 0.0 | 2.0 | GO:0005548 | phospholipid transporter activity(GO:0005548) |
| 0.0 | 0.1 | GO:1990460 | leptin receptor binding(GO:1990460) |
| 0.0 | 0.1 | GO:0000773 | phosphatidyl-N-methylethanolamine N-methyltransferase activity(GO:0000773) phosphatidylethanolamine N-methyltransferase activity(GO:0004608) phosphatidyl-N-dimethylethanolamine N-methyltransferase activity(GO:0080101) |
| 0.0 | 0.2 | GO:0090599 | alpha-glucosidase activity(GO:0090599) |
| 0.0 | 0.1 | GO:0004132 | dCMP deaminase activity(GO:0004132) |
| 0.0 | 0.4 | GO:0017166 | vinculin binding(GO:0017166) |
| 0.0 | 0.4 | GO:0004089 | carbonate dehydratase activity(GO:0004089) |
| 0.0 | 0.2 | GO:0070324 | thyroid hormone binding(GO:0070324) |
| 0.0 | 0.1 | GO:0042289 | MHC class II protein binding(GO:0042289) |
| 0.0 | 0.1 | GO:0010484 | H3 histone acetyltransferase activity(GO:0010484) |
| 0.0 | 0.2 | GO:0030306 | ADP-ribosylation factor binding(GO:0030306) |
| 0.0 | 1.1 | GO:0005547 | phosphatidylinositol-3,4,5-trisphosphate binding(GO:0005547) |
| 0.0 | 0.2 | GO:0004198 | calcium-dependent cysteine-type endopeptidase activity(GO:0004198) |
| 0.0 | 0.2 | GO:0000213 | tRNA-intron endonuclease activity(GO:0000213) |
| 0.0 | 0.2 | GO:0035612 | AP-2 adaptor complex binding(GO:0035612) |
| 0.0 | 0.2 | GO:0016176 | superoxide-generating NADPH oxidase activator activity(GO:0016176) |
| 0.0 | 0.7 | GO:0008574 | ATP-dependent microtubule motor activity, plus-end-directed(GO:0008574) |
| 0.0 | 0.7 | GO:0070840 | dynein complex binding(GO:0070840) |
| 0.0 | 0.2 | GO:0051766 | inositol-1,4,5-trisphosphate 3-kinase activity(GO:0008440) inositol trisphosphate kinase activity(GO:0051766) |
| 0.0 | 1.8 | GO:0005201 | extracellular matrix structural constituent(GO:0005201) |
| 0.0 | 0.2 | GO:0072542 | protein phosphatase activator activity(GO:0072542) |
| 0.0 | 0.4 | GO:0005537 | mannose binding(GO:0005537) |
| 0.0 | 0.2 | GO:0097322 | 7SK snRNA binding(GO:0097322) |
| 0.0 | 0.3 | GO:0004439 | phosphatidylinositol-4,5-bisphosphate 5-phosphatase activity(GO:0004439) |
| 0.0 | 0.0 | GO:0016361 | activin receptor activity, type I(GO:0016361) |
| 0.0 | 0.1 | GO:0045131 | pre-mRNA branch point binding(GO:0045131) |
| 0.0 | 0.1 | GO:0005042 | netrin receptor activity(GO:0005042) |
| 0.0 | 0.5 | GO:0015299 | solute:proton antiporter activity(GO:0015299) |
| 0.0 | 1.3 | GO:0003743 | translation initiation factor activity(GO:0003743) |
| 0.0 | 0.1 | GO:0001601 | peptide YY receptor activity(GO:0001601) |
| 0.0 | 0.9 | GO:0004402 | histone acetyltransferase activity(GO:0004402) |
| 0.0 | 0.1 | GO:0019788 | NEDD8 transferase activity(GO:0019788) |
| 0.0 | 16.7 | GO:0005509 | calcium ion binding(GO:0005509) |
| 0.0 | 0.1 | GO:0008432 | JUN kinase binding(GO:0008432) |
| 0.0 | 0.5 | GO:0003887 | DNA-directed DNA polymerase activity(GO:0003887) |
| 0.0 | 0.1 | GO:0072349 | modified amino acid transmembrane transporter activity(GO:0072349) |
| 0.0 | 0.3 | GO:0017134 | fibroblast growth factor binding(GO:0017134) |
| 0.0 | 0.1 | GO:0070740 | protein-glutamic acid ligase activity(GO:0070739) tubulin-glutamic acid ligase activity(GO:0070740) |
| 0.0 | 0.1 | GO:0016681 | ubiquinol-cytochrome-c reductase activity(GO:0008121) oxidoreductase activity, acting on diphenols and related substances as donors(GO:0016679) oxidoreductase activity, acting on diphenols and related substances as donors, cytochrome as acceptor(GO:0016681) |
| 0.0 | 0.4 | GO:0008527 | taste receptor activity(GO:0008527) |
| 0.0 | 0.1 | GO:0004994 | somatostatin receptor activity(GO:0004994) |
| 0.0 | 0.2 | GO:0008494 | translation activator activity(GO:0008494) |
| 0.0 | 0.7 | GO:0003684 | damaged DNA binding(GO:0003684) |
| 0.0 | 0.3 | GO:0016805 | dipeptidase activity(GO:0016805) |
| 0.0 | 1.3 | GO:0004197 | cysteine-type endopeptidase activity(GO:0004197) |
| 0.0 | 0.4 | GO:0034237 | protein kinase A regulatory subunit binding(GO:0034237) |
| 0.0 | 0.9 | GO:0017112 | Rab guanyl-nucleotide exchange factor activity(GO:0017112) |
| 0.0 | 0.5 | GO:0005184 | neuropeptide hormone activity(GO:0005184) |
| 0.0 | 0.1 | GO:0003988 | acetyl-CoA C-acyltransferase activity(GO:0003988) |
| 0.0 | 0.1 | GO:0005152 | interleukin-1 receptor antagonist activity(GO:0005152) |
| 0.0 | 0.4 | GO:0004181 | metallocarboxypeptidase activity(GO:0004181) |
| 0.0 | 0.1 | GO:0047144 | 2-acylglycerol-3-phosphate O-acyltransferase activity(GO:0047144) |
| 0.0 | 0.2 | GO:0004579 | dolichyl-diphosphooligosaccharide-protein glycotransferase activity(GO:0004579) |
| 0.0 | 0.4 | GO:0004622 | lysophospholipase activity(GO:0004622) |
| 0.0 | 3.2 | GO:0030246 | carbohydrate binding(GO:0030246) |
| 0.0 | 0.4 | GO:0048027 | mRNA 5'-UTR binding(GO:0048027) |
| 0.0 | 0.1 | GO:0004666 | prostaglandin-endoperoxide synthase activity(GO:0004666) |
| 0.0 | 1.6 | GO:0051082 | unfolded protein binding(GO:0051082) |
| 0.0 | 0.8 | GO:0035064 | methylated histone binding(GO:0035064) |
| 0.0 | 0.0 | GO:0004157 | dihydropyrimidinase activity(GO:0004157) |
| 0.0 | 0.2 | GO:0070410 | co-SMAD binding(GO:0070410) |
| 0.0 | 0.1 | GO:0043184 | vascular endothelial growth factor receptor 2 binding(GO:0043184) |
Gene overrepresentation in curated gene sets: canonical pathways category:
| Log-likelihood per target | Total log-likelihood | Term | Description |
|---|---|---|---|
| 0.3 | 4.7 | ST TYPE I INTERFERON PATHWAY | Type I Interferon (alpha/beta IFN) Pathway |
| 0.2 | 18.8 | PID HNF3A PATHWAY | FOXA1 transcription factor network |
| 0.2 | 1.3 | ST IL 13 PATHWAY | Interleukin 13 (IL-13) Pathway |
| 0.2 | 4.8 | PID LPA4 PATHWAY | LPA4-mediated signaling events |
| 0.2 | 2.2 | ST PAC1 RECEPTOR PATHWAY | PAC1 Receptor Pathway |
| 0.1 | 0.4 | ST STAT3 PATHWAY | STAT3 Pathway |
| 0.1 | 5.1 | ST WNT CA2 CYCLIC GMP PATHWAY | Wnt/Ca2+/cyclic GMP signaling. |
| 0.1 | 5.6 | PID SYNDECAN 2 PATHWAY | Syndecan-2-mediated signaling events |
| 0.1 | 3.6 | PID HDAC CLASSIII PATHWAY | Signaling events mediated by HDAC Class III |
| 0.1 | 4.7 | PID SYNDECAN 4 PATHWAY | Syndecan-4-mediated signaling events |
| 0.1 | 3.9 | PID TCR CALCIUM PATHWAY | Calcium signaling in the CD4+ TCR pathway |
| 0.1 | 8.9 | PID AR PATHWAY | Coregulation of Androgen receptor activity |
| 0.1 | 1.6 | PID REELIN PATHWAY | Reelin signaling pathway |
| 0.1 | 5.8 | PID AP1 PATHWAY | AP-1 transcription factor network |
| 0.1 | 2.1 | PID EPHB FWD PATHWAY | EPHB forward signaling |
| 0.1 | 7.0 | PID CMYB PATHWAY | C-MYB transcription factor network |
| 0.1 | 3.6 | PID ARF6 PATHWAY | Arf6 signaling events |
| 0.1 | 1.9 | PID TOLL ENDOGENOUS PATHWAY | Endogenous TLR signaling |
| 0.1 | 3.7 | PID IL2 1PATHWAY | IL2-mediated signaling events |
| 0.1 | 0.5 | SA FAS SIGNALING | The TNF-type receptor Fas induces apoptosis on ligand binding. |
| 0.1 | 0.4 | PID NEPHRIN NEPH1 PATHWAY | Nephrin/Neph1 signaling in the kidney podocyte |
| 0.1 | 1.8 | PID ANGIOPOIETIN RECEPTOR PATHWAY | Angiopoietin receptor Tie2-mediated signaling |
| 0.1 | 0.6 | PID HDAC CLASSII PATHWAY | Signaling events mediated by HDAC Class II |
| 0.0 | 4.4 | PID REG GR PATHWAY | Glucocorticoid receptor regulatory network |
| 0.0 | 1.9 | PID LIS1 PATHWAY | Lissencephaly gene (LIS1) in neuronal migration and development |
| 0.0 | 0.3 | SA CASPASE CASCADE | Apoptosis is mediated by caspases, cysteine proteases arranged in a proteolytic cascade. |
| 0.0 | 2.6 | NABA BASEMENT MEMBRANES | Genes encoding structural components of basement membranes |
| 0.0 | 1.6 | PID ALPHA SYNUCLEIN PATHWAY | Alpha-synuclein signaling |
| 0.0 | 0.7 | PID NECTIN PATHWAY | Nectin adhesion pathway |
| 0.0 | 1.0 | ST GA12 PATHWAY | G alpha 12 Pathway |
| 0.0 | 0.9 | PID P38 ALPHA BETA PATHWAY | Regulation of p38-alpha and p38-beta |
| 0.0 | 0.4 | PID ERBB NETWORK PATHWAY | ErbB receptor signaling network |
| 0.0 | 2.7 | WNT SIGNALING | Genes related to Wnt-mediated signal transduction |
| 0.0 | 1.2 | PID PI3K PLC TRK PATHWAY | Trk receptor signaling mediated by PI3K and PLC-gamma |
| 0.0 | 0.5 | PID THROMBIN PAR1 PATHWAY | PAR1-mediated thrombin signaling events |
| 0.0 | 8.6 | NABA ECM AFFILIATED | Genes encoding proteins affiliated structurally or functionally to extracellular matrix proteins |
| 0.0 | 3.2 | PID CASPASE PATHWAY | Caspase cascade in apoptosis |
| 0.0 | 0.7 | PID PI3KCI PATHWAY | Class I PI3K signaling events |
| 0.0 | 2.1 | PID PLK1 PATHWAY | PLK1 signaling events |
| 0.0 | 1.3 | PID TXA2PATHWAY | Thromboxane A2 receptor signaling |
| 0.0 | 0.7 | PID ARF 3PATHWAY | Arf1 pathway |
| 0.0 | 0.8 | PID FRA PATHWAY | Validated transcriptional targets of AP1 family members Fra1 and Fra2 |
| 0.0 | 7.5 | NABA ECM GLYCOPROTEINS | Genes encoding structural ECM glycoproteins |
| 0.0 | 0.5 | PID HES HEY PATHWAY | Notch-mediated HES/HEY network |
| 0.0 | 0.3 | PID ECADHERIN KERATINOCYTE PATHWAY | E-cadherin signaling in keratinocytes |
| 0.0 | 3.2 | PID MYC REPRESS PATHWAY | Validated targets of C-MYC transcriptional repression |
| 0.0 | 1.3 | PID PS1 PATHWAY | Presenilin action in Notch and Wnt signaling |
| 0.0 | 1.5 | PID AURORA B PATHWAY | Aurora B signaling |
| 0.0 | 0.2 | PID ARF6 DOWNSTREAM PATHWAY | Arf6 downstream pathway |
| 0.0 | 0.4 | PID ALK2 PATHWAY | ALK2 signaling events |
| 0.0 | 0.7 | PID AR TF PATHWAY | Regulation of Androgen receptor activity |
| 0.0 | 0.2 | PID EPHRINB REV PATHWAY | Ephrin B reverse signaling |
| 0.0 | 2.1 | PID MYC ACTIV PATHWAY | Validated targets of C-MYC transcriptional activation |
| 0.0 | 0.3 | PID IL8 CXCR2 PATHWAY | IL8- and CXCR2-mediated signaling events |
| 0.0 | 1.3 | PID ERA GENOMIC PATHWAY | Validated nuclear estrogen receptor alpha network |
| 0.0 | 1.1 | PID BETA CATENIN NUC PATHWAY | Regulation of nuclear beta catenin signaling and target gene transcription |
| 0.0 | 0.1 | PID PDGFRA PATHWAY | PDGFR-alpha signaling pathway |
| 0.0 | 0.2 | SA REG CASCADE OF CYCLIN EXPR | Expression of cyclins regulates progression through the cell cycle by activating cyclin-dependent kinases. |
| 0.0 | 0.1 | PID ERBB4 PATHWAY | ErbB4 signaling events |
| 0.0 | 0.7 | PID FCER1 PATHWAY | Fc-epsilon receptor I signaling in mast cells |
| 0.0 | 0.5 | PID SYNDECAN 1 PATHWAY | Syndecan-1-mediated signaling events |
| 0.0 | 0.1 | PID ER NONGENOMIC PATHWAY | Plasma membrane estrogen receptor signaling |
| 0.0 | 0.1 | SIG REGULATION OF THE ACTIN CYTOSKELETON BY RHO GTPASES | Genes related to regulation of the actin cytoskeleton |
| 0.0 | 0.8 | PID TGFBR PATHWAY | TGF-beta receptor signaling |
| 0.0 | 0.3 | PID NFAT TFPATHWAY | Calcineurin-regulated NFAT-dependent transcription in lymphocytes |
Gene overrepresentation in curated gene sets: REACTOME pathways category:
| Log-likelihood per target | Total log-likelihood | Term | Description |
|---|---|---|---|
| 0.4 | 16.1 | REACTOME RNA POL III TRANSCRIPTION TERMINATION | Genes involved in RNA Polymerase III Transcription Termination |
| 0.3 | 4.7 | REACTOME PASSIVE TRANSPORT BY AQUAPORINS | Genes involved in Passive Transport by Aquaporins |
| 0.3 | 4.9 | REACTOME IL 6 SIGNALING | Genes involved in Interleukin-6 signaling |
| 0.2 | 7.1 | REACTOME RNA POL I TRANSCRIPTION INITIATION | Genes involved in RNA Polymerase I Transcription Initiation |
| 0.2 | 4.2 | REACTOME SIGNALING BY ACTIVATED POINT MUTANTS OF FGFR1 | Genes involved in Signaling by activated point mutants of FGFR1 |
| 0.2 | 3.1 | REACTOME COMMON PATHWAY | Genes involved in Common Pathway |
| 0.2 | 0.5 | REACTOME SIGNALING BY FGFR3 MUTANTS | Genes involved in Signaling by FGFR3 mutants |
| 0.1 | 5.8 | REACTOME GROWTH HORMONE RECEPTOR SIGNALING | Genes involved in Growth hormone receptor signaling |
| 0.1 | 7.4 | REACTOME RECYCLING PATHWAY OF L1 | Genes involved in Recycling pathway of L1 |
| 0.1 | 1.5 | REACTOME APOBEC3G MEDIATED RESISTANCE TO HIV1 INFECTION | Genes involved in APOBEC3G mediated resistance to HIV-1 infection |
| 0.1 | 5.1 | REACTOME CREB PHOSPHORYLATION THROUGH THE ACTIVATION OF CAMKII | Genes involved in CREB phosphorylation through the activation of CaMKII |
| 0.1 | 1.0 | REACTOME REGULATION OF ORNITHINE DECARBOXYLASE ODC | Genes involved in Regulation of ornithine decarboxylase (ODC) |
| 0.1 | 1.8 | REACTOME MTORC1 MEDIATED SIGNALLING | Genes involved in mTORC1-mediated signalling |
| 0.1 | 2.9 | REACTOME CELL EXTRACELLULAR MATRIX INTERACTIONS | Genes involved in Cell-extracellular matrix interactions |
| 0.1 | 1.6 | REACTOME REGULATION OF KIT SIGNALING | Genes involved in Regulation of KIT signaling |
| 0.1 | 1.2 | REACTOME ACTIVATION OF CHAPERONE GENES BY ATF6 ALPHA | Genes involved in Activation of Chaperone Genes by ATF6-alpha |
| 0.1 | 5.1 | REACTOME MYOGENESIS | Genes involved in Myogenesis |
| 0.1 | 2.4 | REACTOME ADP SIGNALLING THROUGH P2RY1 | Genes involved in ADP signalling through P2Y purinoceptor 1 |
| 0.1 | 0.5 | REACTOME ALPHA LINOLENIC ACID ALA METABOLISM | Genes involved in alpha-linolenic acid (ALA) metabolism |
| 0.1 | 2.4 | REACTOME DEGRADATION OF THE EXTRACELLULAR MATRIX | Genes involved in Degradation of the extracellular matrix |
| 0.1 | 1.0 | REACTOME P53 DEPENDENT G1 DNA DAMAGE RESPONSE | Genes involved in p53-Dependent G1 DNA Damage Response |
| 0.0 | 0.6 | REACTOME CREATION OF C4 AND C2 ACTIVATORS | Genes involved in Creation of C4 and C2 activators |
| 0.0 | 2.8 | REACTOME MEIOTIC SYNAPSIS | Genes involved in Meiotic Synapsis |
| 0.0 | 1.2 | REACTOME CS DS DEGRADATION | Genes involved in CS/DS degradation |
| 0.0 | 0.6 | REACTOME REGULATION OF MRNA STABILITY BY PROTEINS THAT BIND AU RICH ELEMENTS | Genes involved in Regulation of mRNA Stability by Proteins that Bind AU-rich Elements |
| 0.0 | 2.3 | REACTOME G ALPHA Z SIGNALLING EVENTS | Genes involved in G alpha (z) signalling events |
| 0.0 | 1.2 | REACTOME BRANCHED CHAIN AMINO ACID CATABOLISM | Genes involved in Branched-chain amino acid catabolism |
| 0.0 | 0.9 | REACTOME CHYLOMICRON MEDIATED LIPID TRANSPORT | Genes involved in Chylomicron-mediated lipid transport |
| 0.0 | 0.9 | REACTOME TIE2 SIGNALING | Genes involved in Tie2 Signaling |
| 0.0 | 0.8 | REACTOME HS GAG DEGRADATION | Genes involved in HS-GAG degradation |
| 0.0 | 0.6 | REACTOME FORMATION OF INCISION COMPLEX IN GG NER | Genes involved in Formation of incision complex in GG-NER |
| 0.0 | 1.3 | REACTOME GABA SYNTHESIS RELEASE REUPTAKE AND DEGRADATION | Genes involved in GABA synthesis, release, reuptake and degradation |
| 0.0 | 0.3 | REACTOME SIGNAL ATTENUATION | Genes involved in Signal attenuation |
| 0.0 | 2.2 | REACTOME CROSS PRESENTATION OF SOLUBLE EXOGENOUS ANTIGENS ENDOSOMES | Genes involved in Cross-presentation of soluble exogenous antigens (endosomes) |
| 0.0 | 1.1 | REACTOME PEROXISOMAL LIPID METABOLISM | Genes involved in Peroxisomal lipid metabolism |
| 0.0 | 0.5 | REACTOME REMOVAL OF THE FLAP INTERMEDIATE FROM THE C STRAND | Genes involved in Removal of the Flap Intermediate from the C-strand |
| 0.0 | 3.2 | REACTOME IMMUNOREGULATORY INTERACTIONS BETWEEN A LYMPHOID AND A NON LYMPHOID CELL | Genes involved in Immunoregulatory interactions between a Lymphoid and a non-Lymphoid cell |
| 0.0 | 0.7 | REACTOME NETRIN1 SIGNALING | Genes involved in Netrin-1 signaling |
| 0.0 | 1.1 | REACTOME REGULATION OF GLUCOKINASE BY GLUCOKINASE REGULATORY PROTEIN | Genes involved in Regulation of Glucokinase by Glucokinase Regulatory Protein |
| 0.0 | 1.3 | REACTOME GLUTATHIONE CONJUGATION | Genes involved in Glutathione conjugation |
| 0.0 | 0.1 | REACTOME BINDING AND ENTRY OF HIV VIRION | Genes involved in Binding and entry of HIV virion |
| 0.0 | 0.3 | REACTOME THE ROLE OF NEF IN HIV1 REPLICATION AND DISEASE PATHOGENESIS | Genes involved in The role of Nef in HIV-1 replication and disease pathogenesis |
| 0.0 | 0.8 | REACTOME SIGNALING BY HIPPO | Genes involved in Signaling by Hippo |
| 0.0 | 0.5 | REACTOME ACTIVATION OF THE AP1 FAMILY OF TRANSCRIPTION FACTORS | Genes involved in Activation of the AP-1 family of transcription factors |
| 0.0 | 2.2 | REACTOME NRAGE SIGNALS DEATH THROUGH JNK | Genes involved in NRAGE signals death through JNK |
| 0.0 | 1.0 | REACTOME TRAFFICKING OF AMPA RECEPTORS | Genes involved in Trafficking of AMPA receptors |
| 0.0 | 0.4 | REACTOME TGF BETA RECEPTOR SIGNALING IN EMT EPITHELIAL TO MESENCHYMAL TRANSITION | Genes involved in TGF-beta receptor signaling in EMT (epithelial to mesenchymal transition) |
| 0.0 | 1.0 | REACTOME TRAF6 MEDIATED IRF7 ACTIVATION | Genes involved in TRAF6 mediated IRF7 activation |
| 0.0 | 0.4 | REACTOME ACTIVATION OF BH3 ONLY PROTEINS | Genes involved in Activation of BH3-only proteins |
| 0.0 | 0.0 | REACTOME VIF MEDIATED DEGRADATION OF APOBEC3G | Genes involved in Vif-mediated degradation of APOBEC3G |
| 0.0 | 1.1 | REACTOME SMAD2 SMAD3 SMAD4 HETEROTRIMER REGULATES TRANSCRIPTION | Genes involved in SMAD2/SMAD3:SMAD4 heterotrimer regulates transcription |
| 0.0 | 0.8 | REACTOME NOTCH1 INTRACELLULAR DOMAIN REGULATES TRANSCRIPTION | Genes involved in NOTCH1 Intracellular Domain Regulates Transcription |
| 0.0 | 2.2 | REACTOME NUCLEAR RECEPTOR TRANSCRIPTION PATHWAY | Genes involved in Nuclear Receptor transcription pathway |
| 0.0 | 0.5 | REACTOME SIGNAL REGULATORY PROTEIN SIRP FAMILY INTERACTIONS | Genes involved in Signal regulatory protein (SIRP) family interactions |
| 0.0 | 0.3 | REACTOME ACTIVATION OF NMDA RECEPTOR UPON GLUTAMATE BINDING AND POSTSYNAPTIC EVENTS | Genes involved in Activation of NMDA receptor upon glutamate binding and postsynaptic events |
| 0.0 | 0.3 | REACTOME IONOTROPIC ACTIVITY OF KAINATE RECEPTORS | Genes involved in Ionotropic activity of Kainate Receptors |
| 0.0 | 0.5 | REACTOME TRAF6 MEDIATED NFKB ACTIVATION | Genes involved in TRAF6 mediated NF-kB activation |
| 0.0 | 0.4 | REACTOME GLYCOGEN BREAKDOWN GLYCOGENOLYSIS | Genes involved in Glycogen breakdown (glycogenolysis) |
| 0.0 | 0.4 | REACTOME BILE SALT AND ORGANIC ANION SLC TRANSPORTERS | Genes involved in Bile salt and organic anion SLC transporters |
| 0.0 | 0.1 | REACTOME BASIGIN INTERACTIONS | Genes involved in Basigin interactions |
| 0.0 | 0.7 | REACTOME KINESINS | Genes involved in Kinesins |
| 0.0 | 1.7 | REACTOME TRANS GOLGI NETWORK VESICLE BUDDING | Genes involved in trans-Golgi Network Vesicle Budding |
| 0.0 | 0.1 | REACTOME PROLACTIN RECEPTOR SIGNALING | Genes involved in Prolactin receptor signaling |
| 0.0 | 0.4 | REACTOME FORMATION OF THE HIV1 EARLY ELONGATION COMPLEX | Genes involved in Formation of the HIV-1 Early Elongation Complex |
| 0.0 | 0.5 | REACTOME RAP1 SIGNALLING | Genes involved in Rap1 signalling |
| 0.0 | 0.1 | REACTOME INITIAL TRIGGERING OF COMPLEMENT | Genes involved in Initial triggering of complement |
| 0.0 | 1.0 | REACTOME O LINKED GLYCOSYLATION OF MUCINS | Genes involved in O-linked glycosylation of mucins |
| 0.0 | 0.2 | REACTOME SLBP DEPENDENT PROCESSING OF REPLICATION DEPENDENT HISTONE PRE MRNAS | Genes involved in SLBP Dependent Processing of Replication-Dependent Histone Pre-mRNAs |
| 0.0 | 0.5 | REACTOME CASPASE MEDIATED CLEAVAGE OF CYTOSKELETAL PROTEINS | Genes involved in Caspase-mediated cleavage of cytoskeletal proteins |
| 0.0 | 1.1 | REACTOME EXTRACELLULAR MATRIX ORGANIZATION | Genes involved in Extracellular matrix organization |
| 0.0 | 0.5 | REACTOME SYNTHESIS AND INTERCONVERSION OF NUCLEOTIDE DI AND TRIPHOSPHATES | Genes involved in Synthesis and interconversion of nucleotide di- and triphosphates |
| 0.0 | 0.2 | REACTOME CALNEXIN CALRETICULIN CYCLE | Genes involved in Calnexin/calreticulin cycle |
| 0.0 | 0.2 | REACTOME REGULATION OF RHEB GTPASE ACTIVITY BY AMPK | Genes involved in Regulation of Rheb GTPase activity by AMPK |
| 0.0 | 0.1 | REACTOME METABOLISM OF POLYAMINES | Genes involved in Metabolism of polyamines |
| 0.0 | 0.1 | REACTOME PLATELET SENSITIZATION BY LDL | Genes involved in Platelet sensitization by LDL |
| 0.0 | 0.9 | REACTOME LOSS OF NLP FROM MITOTIC CENTROSOMES | Genes involved in Loss of Nlp from mitotic centrosomes |
| 0.0 | 0.1 | REACTOME SYNTHESIS OF BILE ACIDS AND BILE SALTS VIA 24 HYDROXYCHOLESTEROL | Genes involved in Synthesis of bile acids and bile salts via 24-hydroxycholesterol |
| 0.0 | 0.3 | REACTOME SYNTHESIS OF GLYCOSYLPHOSPHATIDYLINOSITOL GPI | Genes involved in Synthesis of glycosylphosphatidylinositol (GPI) |
| 0.0 | 0.3 | REACTOME SEMA3A PAK DEPENDENT AXON REPULSION | Genes involved in Sema3A PAK dependent Axon repulsion |
| 0.0 | 0.2 | REACTOME HYALURONAN UPTAKE AND DEGRADATION | Genes involved in Hyaluronan uptake and degradation |