Project
Inflammatory response time course, HUVEC (Wada, 2009)
Navigation
Downloads
Results for HDX
Z-value: 0.39
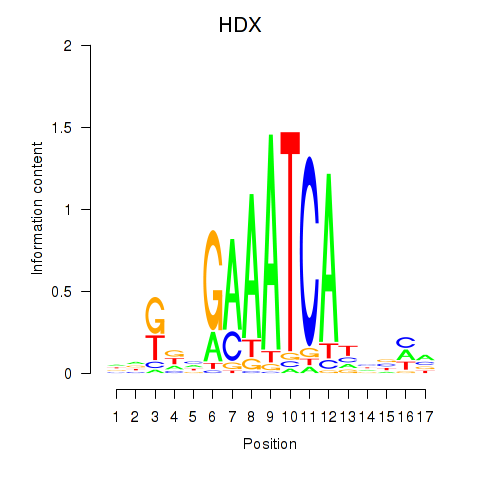
Motif logo
Transcription factors associated with HDX
| Gene Symbol | Gene ID | Gene Info |
|---|---|---|
|
HDX
|
ENSG00000165259.14 | HDX |
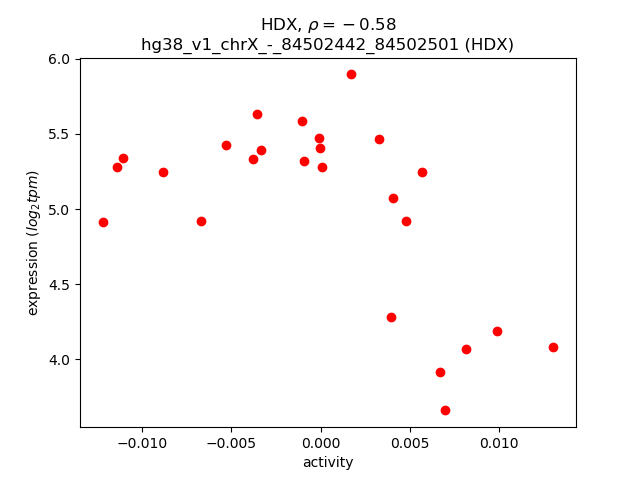
Activity-expression correlation:
| Gene | Promoter | Pearson corr. coef. | P-value | Plot |
|---|---|---|---|---|
| HDX | hg38_v1_chrX_-_84502442_84502501 | -0.58 | 2.4e-03 | Click! |
Activity profile of HDX motif
Sorted Z-values of HDX motif
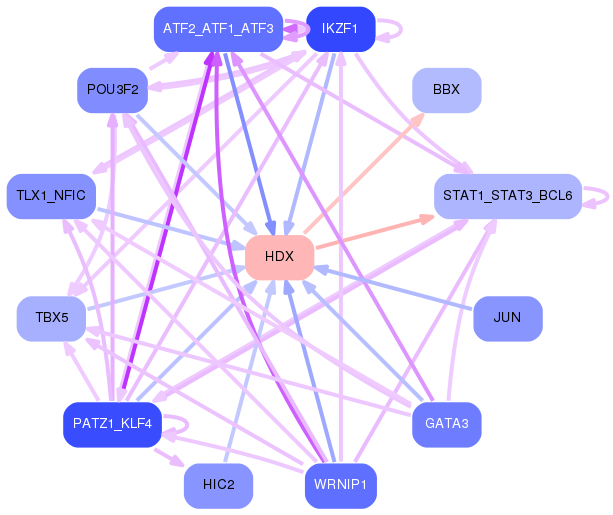
Network of associatons between targets according to the STRING database.

First level regulatory network of HDX
| Promoter | Score | Transcript | Gene | Gene Info |
|---|---|---|---|---|
| chr9_+_6215786 | 2.87 |
ENST00000417746.6
ENST00000682010.1 |
IL33
|
interleukin 33 |
| chr1_+_84164370 | 1.96 |
ENST00000446538.5
ENST00000610703.4 ENST00000370682.7 ENST00000394838.6 ENST00000432111.5 |
PRKACB
|
protein kinase cAMP-activated catalytic subunit beta |
| chr7_+_80135694 | 1.41 |
ENST00000457358.7
|
GNAI1
|
G protein subunit alpha i1 |
| chr1_+_47023659 | 1.26 |
ENST00000371901.4
|
CYP4X1
|
cytochrome P450 family 4 subfamily X member 1 |
| chr2_-_191020960 | 1.16 |
ENST00000432058.1
|
STAT1
|
signal transducer and activator of transcription 1 |
| chr3_-_165837412 | 0.68 |
ENST00000479451.5
ENST00000488954.1 ENST00000264381.8 |
BCHE
|
butyrylcholinesterase |
| chr1_+_84164684 | 0.55 |
ENST00000370680.5
|
PRKACB
|
protein kinase cAMP-activated catalytic subunit beta |
| chr19_-_57974527 | 0.42 |
ENST00000314391.3
|
C19orf18
|
chromosome 19 open reading frame 18 |
| chr3_+_107523026 | 0.40 |
ENST00000416476.6
|
BBX
|
BBX high mobility group box domain containing |
| chr5_-_135954962 | 0.35 |
ENST00000522943.5
ENST00000514447.2 ENST00000274507.6 |
LECT2
|
leukocyte cell derived chemotaxin 2 |
| chr5_-_35230332 | 0.33 |
ENST00000504500.5
|
PRLR
|
prolactin receptor |
| chr11_+_9664061 | 0.28 |
ENST00000447399.6
ENST00000318950.11 |
SWAP70
|
switching B cell complex subunit SWAP70 |
| chr2_+_169069537 | 0.28 |
ENST00000428522.5
ENST00000450153.1 ENST00000674881.1 ENST00000421653.5 |
DHRS9
|
dehydrogenase/reductase 9 |
| chr3_+_107522936 | 0.23 |
ENST00000415149.6
ENST00000402543.5 ENST00000325805.13 ENST00000427402.5 |
BBX
|
BBX high mobility group box domain containing |
| chr22_+_40044802 | 0.23 |
ENST00000441751.5
ENST00000301923.13 |
TNRC6B
|
trinucleotide repeat containing adaptor 6B |
| chr5_+_140786291 | 0.22 |
ENST00000394633.7
|
PCDHA1
|
protocadherin alpha 1 |
| chr19_+_36111151 | 0.22 |
ENST00000633214.1
ENST00000585332.3 |
OVOL3
|
ovo like zinc finger 3 |
| chr3_+_54123452 | 0.18 |
ENST00000620722.4
ENST00000490478.5 |
CACNA2D3
|
calcium voltage-gated channel auxiliary subunit alpha2delta 3 |
| chr1_-_48400826 | 0.17 |
ENST00000371841.1
|
SPATA6
|
spermatogenesis associated 6 |
| chr7_+_142800957 | 0.17 |
ENST00000466254.1
|
TRBC2
|
T cell receptor beta constant 2 |
| chr6_+_32969345 | 0.16 |
ENST00000678250.1
|
BRD2
|
bromodomain containing 2 |
| chr1_-_110519175 | 0.15 |
ENST00000369771.4
|
KCNA10
|
potassium voltage-gated channel subfamily A member 10 |
| chr2_+_127646145 | 0.12 |
ENST00000486700.2
ENST00000272644.7 |
GPR17
|
G protein-coupled receptor 17 |
| chr20_-_37158904 | 0.10 |
ENST00000417458.5
|
MROH8
|
maestro heat like repeat family member 8 |
| chr1_-_169711603 | 0.08 |
ENST00000236147.6
ENST00000650983.1 |
SELL
|
selectin L |
| chr2_+_127645864 | 0.07 |
ENST00000544369.5
|
GPR17
|
G protein-coupled receptor 17 |
| chr19_-_41428730 | 0.07 |
ENST00000321702.2
|
B3GNT8
|
UDP-GlcNAc:betaGal beta-1,3-N-acetylglucosaminyltransferase 8 |
| chr1_-_205422050 | 0.05 |
ENST00000367153.9
|
LEMD1
|
LEM domain containing 1 |
| chrX_+_55623400 | 0.05 |
ENST00000339140.5
|
FOXR2
|
forkhead box R2 |
| chr12_-_118359639 | 0.05 |
ENST00000541786.5
ENST00000419821.6 ENST00000541878.5 |
TAOK3
|
TAO kinase 3 |
| chr1_+_62597510 | 0.04 |
ENST00000371129.4
|
ANGPTL3
|
angiopoietin like 3 |
| chr12_+_56763316 | 0.03 |
ENST00000322165.1
|
HSD17B6
|
hydroxysteroid 17-beta dehydrogenase 6 |
| chr7_+_129368123 | 0.02 |
ENST00000460109.5
ENST00000474594.5 |
AHCYL2
|
adenosylhomocysteinase like 2 |
| chr2_+_112977998 | 0.02 |
ENST00000259205.5
ENST00000376489.6 |
IL36G
|
interleukin 36 gamma |
| chr8_+_109086585 | 0.00 |
ENST00000518632.2
|
TRHR
|
thyrotropin releasing hormone receptor |
Gene Ontology Analysis
Gene overrepresentation in biological process category:
| Log-likelihood per target | Total log-likelihood | Term | Description |
|---|---|---|---|
| 0.5 | 2.9 | GO:0002282 | microglial cell activation involved in immune response(GO:0002282) macrophage proliferation(GO:0061517) microglial cell proliferation(GO:0061518) |
| 0.4 | 1.2 | GO:0072308 | negative regulation by virus of viral protein levels in host cell(GO:0046725) negative regulation of metanephric nephron tubule epithelial cell differentiation(GO:0072308) |
| 0.4 | 2.5 | GO:0097338 | response to clozapine(GO:0097338) |
| 0.2 | 0.7 | GO:0014016 | neuroblast differentiation(GO:0014016) |
| 0.1 | 1.4 | GO:1904321 | response to forskolin(GO:1904321) cellular response to forskolin(GO:1904322) |
| 0.1 | 0.3 | GO:1902309 | negative regulation of peptidyl-serine dephosphorylation(GO:1902309) |
| 0.1 | 0.3 | GO:0038161 | prolactin signaling pathway(GO:0038161) |
| 0.0 | 0.3 | GO:0042904 | 9-cis-retinoic acid biosynthetic process(GO:0042904) 9-cis-retinoic acid metabolic process(GO:0042905) |
| 0.0 | 0.2 | GO:0002862 | negative regulation of inflammatory response to antigenic stimulus(GO:0002862) |
| 0.0 | 0.2 | GO:0035278 | miRNA mediated inhibition of translation(GO:0035278) negative regulation of translation, ncRNA-mediated(GO:0040033) regulation of translation, ncRNA-mediated(GO:0045974) |
| 0.0 | 0.1 | GO:0030311 | poly-N-acetyllactosamine biosynthetic process(GO:0030311) |
Gene overrepresentation in cellular component category:
| Log-likelihood per target | Total log-likelihood | Term | Description |
|---|---|---|---|
| 0.1 | 2.5 | GO:0005952 | cAMP-dependent protein kinase complex(GO:0005952) |
| 0.1 | 0.2 | GO:0097224 | sperm connecting piece(GO:0097224) |
| 0.0 | 0.7 | GO:0005641 | nuclear envelope lumen(GO:0005641) |
| 0.0 | 1.4 | GO:0099738 | cell cortex region(GO:0099738) |
Gene overrepresentation in molecular function category:
| Log-likelihood per target | Total log-likelihood | Term | Description |
|---|---|---|---|
| 0.2 | 0.7 | GO:0003990 | acetylcholinesterase activity(GO:0003990) |
| 0.2 | 2.5 | GO:0004691 | cAMP-dependent protein kinase activity(GO:0004691) |
| 0.1 | 1.4 | GO:0031821 | G-protein coupled serotonin receptor binding(GO:0031821) |
| 0.1 | 0.3 | GO:0004925 | prolactin receptor activity(GO:0004925) |
| 0.0 | 1.3 | GO:0070330 | aromatase activity(GO:0070330) |
| 0.0 | 0.3 | GO:0047035 | testosterone dehydrogenase (NAD+) activity(GO:0047035) |
| 0.0 | 1.2 | GO:0005164 | tumor necrosis factor receptor binding(GO:0005164) |
| 0.0 | 0.1 | GO:0016262 | protein N-acetylglucosaminyltransferase activity(GO:0016262) |
| 0.0 | 0.2 | GO:0032027 | myosin light chain binding(GO:0032027) |
| 0.0 | 0.1 | GO:0043208 | glycosphingolipid binding(GO:0043208) |
| 0.0 | 0.2 | GO:0043855 | intracellular cyclic nucleotide activated cation channel activity(GO:0005221) cyclic nucleotide-gated ion channel activity(GO:0043855) |
Gene overrepresentation in curated gene sets: canonical pathways category:
| Log-likelihood per target | Total log-likelihood | Term | Description |
|---|---|---|---|
| 0.1 | 1.2 | ST TYPE I INTERFERON PATHWAY | Type I Interferon (alpha/beta IFN) Pathway |
| 0.0 | 1.4 | PID S1P S1P4 PATHWAY | S1P4 pathway |
| 0.0 | 2.5 | PID IL3 PATHWAY | IL3-mediated signaling events |
Gene overrepresentation in curated gene sets: REACTOME pathways category:
| Log-likelihood per target | Total log-likelihood | Term | Description |
|---|---|---|---|
| 0.1 | 1.4 | REACTOME ADENYLATE CYCLASE INHIBITORY PATHWAY | Genes involved in Adenylate cyclase inhibitory pathway |
| 0.1 | 2.5 | REACTOME PKA MEDIATED PHOSPHORYLATION OF CREB | Genes involved in PKA-mediated phosphorylation of CREB |
| 0.1 | 1.2 | REACTOME IL 6 SIGNALING | Genes involved in Interleukin-6 signaling |
| 0.0 | 0.7 | REACTOME SYNTHESIS SECRETION AND DEACYLATION OF GHRELIN | Genes involved in Synthesis, Secretion, and Deacylation of Ghrelin |
| 0.0 | 0.3 | REACTOME PROLACTIN RECEPTOR SIGNALING | Genes involved in Prolactin receptor signaling |