Project
Inflammatory response time course, HUVEC (Wada, 2009)
Navigation
Downloads
Results for IRF6_IRF4_IRF5
Z-value: 2.01
Motif logo
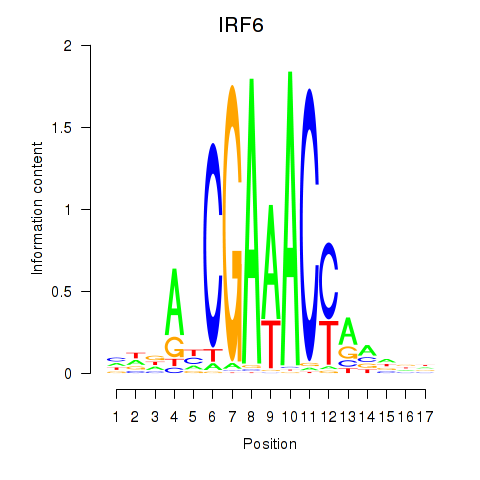
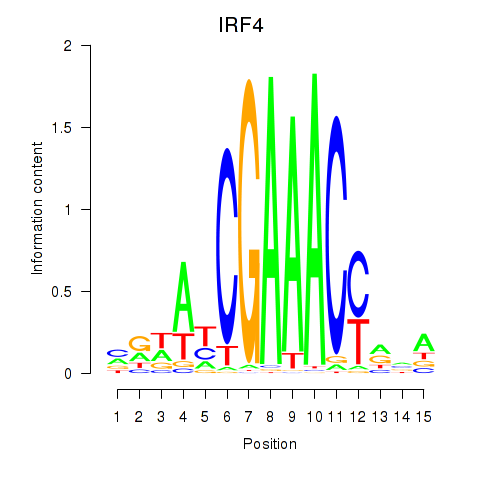
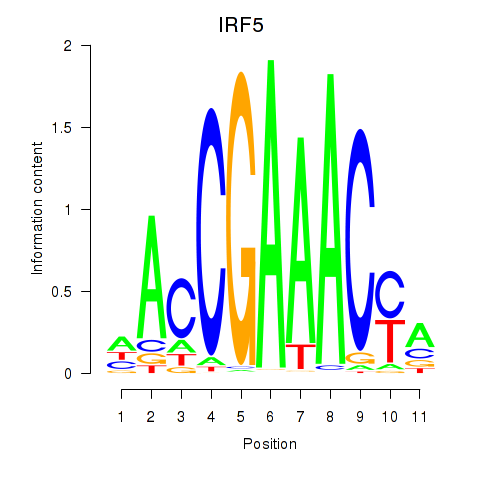
Transcription factors associated with IRF6_IRF4_IRF5
| Gene Symbol | Gene ID | Gene Info |
|---|---|---|
|
IRF6
|
ENSG00000117595.12 | IRF6 |
|
IRF4
|
ENSG00000137265.15 | IRF4 |
|
IRF5
|
ENSG00000128604.20 | IRF5 |
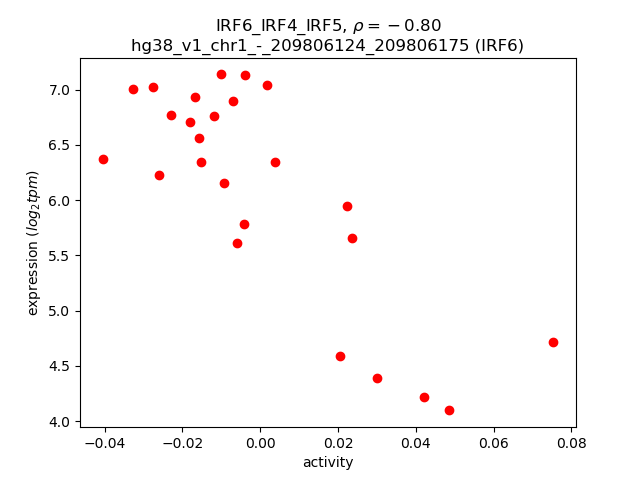
Activity-expression correlation:
| Gene | Promoter | Pearson corr. coef. | P-value | Plot |
|---|---|---|---|---|
| IRF6 | hg38_v1_chr1_-_209806124_209806175 | -0.80 | 1.7e-06 | Click! |
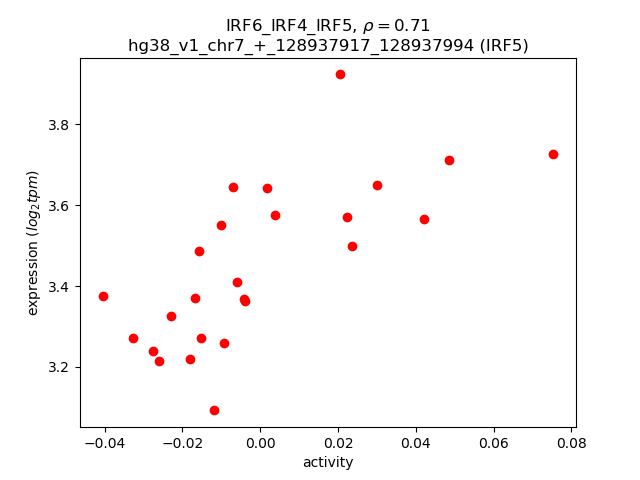
| IRF5 | hg38_v1_chr7_+_128937917_128937994 | 0.71 | 7.1e-05 | Click! |
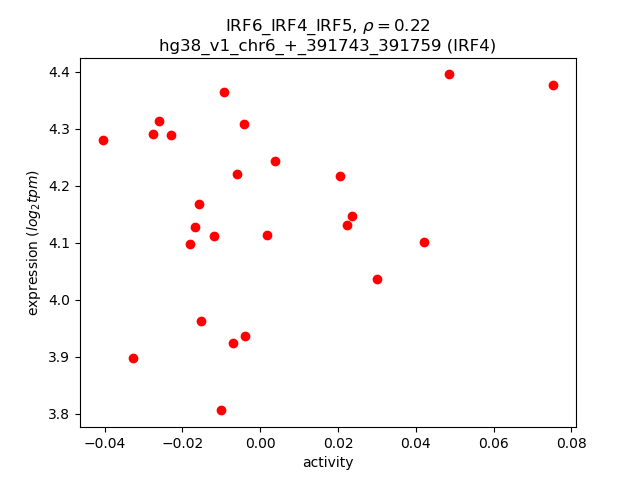
| IRF4 | hg38_v1_chr6_+_391743_391759 | 0.22 | 2.9e-01 | Click! |
Activity profile of IRF6_IRF4_IRF5 motif
Sorted Z-values of IRF6_IRF4_IRF5 motif
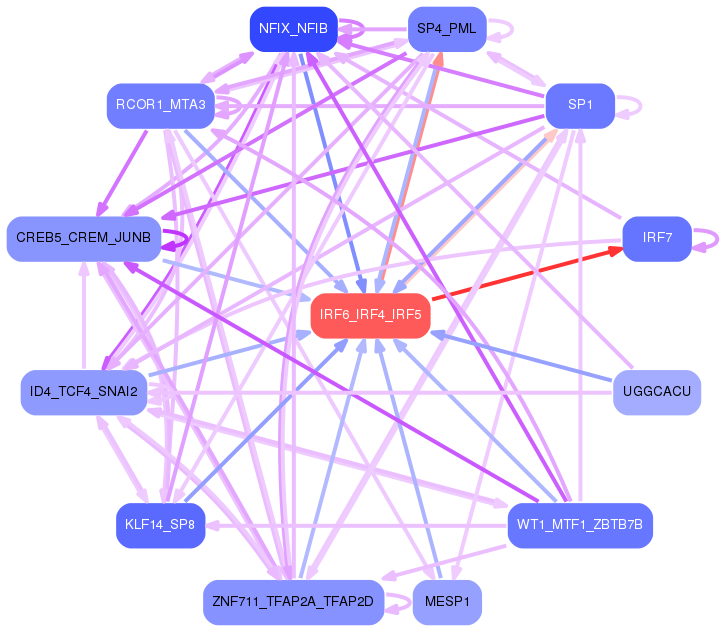
Network of associatons between targets according to the STRING database.

First level regulatory network of IRF6_IRF4_IRF5
Gene Ontology Analysis
Gene overrepresentation in biological process category:
| Log-likelihood per target | Total log-likelihood | Term | Description |
|---|---|---|---|
| 4.9 | 98.7 | GO:0003374 | dynamin polymerization involved in membrane fission(GO:0003373) dynamin polymerization involved in mitochondrial fission(GO:0003374) |
| 4.9 | 14.7 | GO:0046072 | dUDP biosynthetic process(GO:0006227) dTDP biosynthetic process(GO:0006233) pyrimidine nucleoside diphosphate biosynthetic process(GO:0009139) pyrimidine deoxyribonucleoside diphosphate metabolic process(GO:0009196) pyrimidine deoxyribonucleoside diphosphate biosynthetic process(GO:0009197) dTDP metabolic process(GO:0046072) dUDP metabolic process(GO:0046077) |
| 3.0 | 35.8 | GO:0060700 | regulation of ribonuclease activity(GO:0060700) |
| 2.4 | 14.5 | GO:0034124 | regulation of MyD88-dependent toll-like receptor signaling pathway(GO:0034124) |
| 2.3 | 7.0 | GO:0048250 | mitochondrial iron ion transport(GO:0048250) |
| 2.1 | 6.4 | GO:0032831 | regulation of CD4-positive, CD25-positive, alpha-beta regulatory T cell differentiation(GO:0032829) positive regulation of CD4-positive, CD25-positive, alpha-beta regulatory T cell differentiation(GO:0032831) negative regulation of CD4-positive, alpha-beta T cell proliferation(GO:2000562) |
| 1.7 | 8.7 | GO:0034343 | type III interferon production(GO:0034343) regulation of type III interferon production(GO:0034344) |
| 1.6 | 16.1 | GO:0070212 | protein poly-ADP-ribosylation(GO:0070212) |
| 1.5 | 9.2 | GO:0034165 | positive regulation of toll-like receptor 9 signaling pathway(GO:0034165) |
| 1.2 | 7.3 | GO:2001180 | negative regulation of interleukin-10 secretion(GO:2001180) |
| 0.8 | 8.1 | GO:0032020 | ISG15-protein conjugation(GO:0032020) |
| 0.8 | 7.7 | GO:0045345 | positive regulation of MHC class I biosynthetic process(GO:0045345) |
| 0.7 | 2.2 | GO:0002428 | antigen processing and presentation of peptide antigen via MHC class Ib(GO:0002428) |
| 0.7 | 2.1 | GO:0045085 | negative regulation of interleukin-2 biosynthetic process(GO:0045085) |
| 0.6 | 3.2 | GO:0071409 | cellular response to cycloheximide(GO:0071409) |
| 0.6 | 3.1 | GO:1900245 | positive regulation of MDA-5 signaling pathway(GO:1900245) |
| 0.6 | 2.3 | GO:0043311 | positive regulation of eosinophil degranulation(GO:0043311) positive regulation of eosinophil activation(GO:1902568) |
| 0.6 | 5.2 | GO:0006659 | phosphatidylserine biosynthetic process(GO:0006659) |
| 0.4 | 2.7 | GO:0052572 | response to immune response of other organism involved in symbiotic interaction(GO:0052564) response to host immune response(GO:0052572) |
| 0.3 | 2.2 | GO:0048549 | endosome localization(GO:0032439) positive regulation of pinocytosis(GO:0048549) |
| 0.3 | 1.4 | GO:0010513 | positive regulation of phosphatidylinositol biosynthetic process(GO:0010513) |
| 0.3 | 0.9 | GO:0000964 | mitochondrial RNA 5'-end processing(GO:0000964) rRNA import into mitochondrion(GO:0035928) |
| 0.3 | 1.7 | GO:0060368 | regulation of Fc receptor mediated stimulatory signaling pathway(GO:0060368) |
| 0.3 | 4.3 | GO:1902222 | L-phenylalanine metabolic process(GO:0006558) L-phenylalanine catabolic process(GO:0006559) erythrose 4-phosphate/phosphoenolpyruvate family amino acid metabolic process(GO:1902221) erythrose 4-phosphate/phosphoenolpyruvate family amino acid catabolic process(GO:1902222) |
| 0.3 | 0.8 | GO:0045715 | negative regulation of low-density lipoprotein particle receptor biosynthetic process(GO:0045715) |
| 0.3 | 9.9 | GO:0035456 | response to interferon-beta(GO:0035456) |
| 0.2 | 1.0 | GO:0032913 | B cell receptor transport within lipid bilayer(GO:0032595) B cell receptor transport into membrane raft(GO:0032597) protein transport out of membrane raft(GO:0032599) chemokine receptor transport out of membrane raft(GO:0032600) negative regulation of transforming growth factor beta3 production(GO:0032913) chemokine receptor transport within lipid bilayer(GO:0033606) |
| 0.2 | 2.3 | GO:0071492 | cellular response to UV-A(GO:0071492) |
| 0.2 | 1.3 | GO:1900369 | negative regulation of RNA interference(GO:1900369) |
| 0.2 | 0.9 | GO:0050823 | peptide stabilization(GO:0050822) peptide antigen stabilization(GO:0050823) |
| 0.2 | 3.2 | GO:1902004 | positive regulation of beta-amyloid formation(GO:1902004) |
| 0.2 | 2.1 | GO:0072592 | oxygen metabolic process(GO:0072592) |
| 0.2 | 3.8 | GO:0006957 | complement activation, alternative pathway(GO:0006957) |
| 0.2 | 5.3 | GO:0032897 | negative regulation of viral transcription(GO:0032897) |
| 0.2 | 0.5 | GO:0071962 | mitotic sister chromatid cohesion, centromeric(GO:0071962) |
| 0.1 | 0.7 | GO:2000051 | negative regulation of non-canonical Wnt signaling pathway(GO:2000051) |
| 0.1 | 0.4 | GO:0072107 | regulation of ureteric bud formation(GO:0072106) positive regulation of ureteric bud formation(GO:0072107) |
| 0.1 | 0.6 | GO:1904383 | response to sodium phosphate(GO:1904383) |
| 0.1 | 1.0 | GO:0030259 | lipid glycosylation(GO:0030259) |
| 0.1 | 0.7 | GO:0043606 | histidine catabolic process to glutamate and formamide(GO:0019556) histidine catabolic process to glutamate and formate(GO:0019557) formamide metabolic process(GO:0043606) |
| 0.1 | 0.9 | GO:0007000 | nucleolus organization(GO:0007000) |
| 0.1 | 0.8 | GO:0051182 | coenzyme transport(GO:0051182) |
| 0.1 | 0.5 | GO:0009447 | putrescine catabolic process(GO:0009447) |
| 0.1 | 0.5 | GO:0090156 | cellular sphingolipid homeostasis(GO:0090156) |
| 0.1 | 0.9 | GO:0035616 | histone H2B conserved C-terminal lysine deubiquitination(GO:0035616) |
| 0.1 | 1.8 | GO:0035455 | response to interferon-alpha(GO:0035455) |
| 0.1 | 0.5 | GO:0014734 | skeletal muscle hypertrophy(GO:0014734) |
| 0.1 | 0.8 | GO:0051754 | meiotic sister chromatid cohesion, centromeric(GO:0051754) |
| 0.1 | 0.3 | GO:0006667 | sphinganine metabolic process(GO:0006667) |
| 0.1 | 2.3 | GO:0072643 | interferon-gamma secretion(GO:0072643) |
| 0.1 | 0.3 | GO:0030573 | bile acid catabolic process(GO:0030573) |
| 0.1 | 1.0 | GO:0071798 | response to prostaglandin D(GO:0071798) cellular response to prostaglandin D stimulus(GO:0071799) |
| 0.1 | 1.8 | GO:0097201 | negative regulation of transcription from RNA polymerase II promoter in response to stress(GO:0097201) |
| 0.1 | 1.3 | GO:0006787 | porphyrin-containing compound catabolic process(GO:0006787) tetrapyrrole catabolic process(GO:0033015) heme catabolic process(GO:0042167) pigment catabolic process(GO:0046149) |
| 0.1 | 0.5 | GO:0008628 | hormone-mediated apoptotic signaling pathway(GO:0008628) |
| 0.1 | 0.3 | GO:1904694 | negative regulation of vascular smooth muscle contraction(GO:1904694) |
| 0.1 | 0.5 | GO:1900383 | regulation of synaptic plasticity by receptor localization to synapse(GO:1900383) |
| 0.1 | 0.8 | GO:0048312 | intracellular distribution of mitochondria(GO:0048312) |
| 0.1 | 1.0 | GO:0009414 | response to water deprivation(GO:0009414) |
| 0.1 | 4.3 | GO:0045071 | negative regulation of viral genome replication(GO:0045071) |
| 0.1 | 0.6 | GO:1904798 | positive regulation of core promoter binding(GO:1904798) |
| 0.1 | 0.7 | GO:0006189 | 'de novo' IMP biosynthetic process(GO:0006189) |
| 0.1 | 1.1 | GO:0051964 | negative regulation of synapse assembly(GO:0051964) |
| 0.1 | 2.5 | GO:0010390 | histone monoubiquitination(GO:0010390) |
| 0.1 | 0.8 | GO:0014894 | response to muscle inactivity involved in regulation of muscle adaptation(GO:0014877) response to denervation involved in regulation of muscle adaptation(GO:0014894) |
| 0.1 | 0.2 | GO:1900239 | phenotypic switching(GO:0036166) regulation of phenotypic switching(GO:1900239) |
| 0.1 | 0.2 | GO:0033082 | regulation of extrathymic T cell differentiation(GO:0033082) sebum secreting cell proliferation(GO:1990654) |
| 0.1 | 1.6 | GO:0009226 | nucleotide-sugar biosynthetic process(GO:0009226) |
| 0.1 | 0.2 | GO:0035407 | histone H3-T11 phosphorylation(GO:0035407) |
| 0.1 | 1.2 | GO:0000920 | cell separation after cytokinesis(GO:0000920) |
| 0.0 | 2.2 | GO:0070207 | protein homotrimerization(GO:0070207) |
| 0.0 | 0.7 | GO:0032968 | positive regulation of transcription elongation from RNA polymerase II promoter(GO:0032968) |
| 0.0 | 1.9 | GO:0060338 | regulation of type I interferon-mediated signaling pathway(GO:0060338) |
| 0.0 | 1.0 | GO:0006123 | mitochondrial electron transport, cytochrome c to oxygen(GO:0006123) |
| 0.0 | 0.3 | GO:0090308 | maintenance of DNA methylation(GO:0010216) regulation of methylation-dependent chromatin silencing(GO:0090308) |
| 0.0 | 0.4 | GO:0061732 | mitochondrial acetyl-CoA biosynthetic process from pyruvate(GO:0061732) |
| 0.0 | 1.3 | GO:0060337 | type I interferon signaling pathway(GO:0060337) cellular response to type I interferon(GO:0071357) |
| 0.0 | 1.0 | GO:2000001 | regulation of DNA damage checkpoint(GO:2000001) |
| 0.0 | 0.3 | GO:0002430 | complement receptor mediated signaling pathway(GO:0002430) |
| 0.0 | 0.6 | GO:0030150 | protein import into mitochondrial matrix(GO:0030150) |
| 0.0 | 0.1 | GO:0031161 | phosphatidylinositol catabolic process(GO:0031161) |
| 0.0 | 0.6 | GO:0032695 | negative regulation of interleukin-12 production(GO:0032695) |
| 0.0 | 0.1 | GO:0033634 | positive regulation of cell-cell adhesion mediated by integrin(GO:0033634) |
| 0.0 | 3.6 | GO:0010508 | positive regulation of autophagy(GO:0010508) |
| 0.0 | 0.5 | GO:0006776 | vitamin A metabolic process(GO:0006776) |
| 0.0 | 1.7 | GO:0036075 | endochondral ossification(GO:0001958) replacement ossification(GO:0036075) |
| 0.0 | 1.8 | GO:0042982 | amyloid precursor protein metabolic process(GO:0042982) |
| 0.0 | 0.5 | GO:0051127 | positive regulation of actin nucleation(GO:0051127) |
| 0.0 | 0.2 | GO:0007079 | mitotic chromosome movement towards spindle pole(GO:0007079) |
| 0.0 | 0.2 | GO:2001199 | negative regulation of dendritic cell differentiation(GO:2001199) |
| 0.0 | 0.2 | GO:0072402 | response to cell cycle checkpoint signaling(GO:0072396) response to DNA integrity checkpoint signaling(GO:0072402) response to DNA damage checkpoint signaling(GO:0072423) |
| 0.0 | 0.1 | GO:0071109 | superior temporal gyrus development(GO:0071109) |
| 0.0 | 0.3 | GO:0090168 | Golgi reassembly(GO:0090168) |
| 0.0 | 0.2 | GO:1903026 | negative regulation of RNA polymerase II regulatory region sequence-specific DNA binding(GO:1903026) |
| 0.0 | 0.3 | GO:0060982 | coronary artery morphogenesis(GO:0060982) |
| 0.0 | 0.6 | GO:0097150 | neuronal stem cell population maintenance(GO:0097150) |
| 0.0 | 0.2 | GO:0042574 | retinal metabolic process(GO:0042574) |
| 0.0 | 0.9 | GO:0018023 | peptidyl-lysine trimethylation(GO:0018023) |
| 0.0 | 1.2 | GO:0030212 | hyaluronan metabolic process(GO:0030212) |
| 0.0 | 0.9 | GO:0030866 | cortical actin cytoskeleton organization(GO:0030866) |
| 0.0 | 0.6 | GO:0032728 | positive regulation of interferon-beta production(GO:0032728) |
| 0.0 | 1.7 | GO:0036498 | IRE1-mediated unfolded protein response(GO:0036498) |
| 0.0 | 0.1 | GO:0043553 | negative regulation of phosphatidylinositol 3-kinase activity(GO:0043553) |
| 0.0 | 0.2 | GO:0001682 | tRNA 5'-leader removal(GO:0001682) |
| 0.0 | 0.3 | GO:0032516 | positive regulation of phosphoprotein phosphatase activity(GO:0032516) |
| 0.0 | 0.2 | GO:0070934 | CRD-mediated mRNA stabilization(GO:0070934) |
| 0.0 | 0.2 | GO:0006450 | regulation of translational fidelity(GO:0006450) |
| 0.0 | 0.3 | GO:1901663 | ubiquinone biosynthetic process(GO:0006744) quinone biosynthetic process(GO:1901663) |
| 0.0 | 0.8 | GO:0051205 | protein insertion into membrane(GO:0051205) |
| 0.0 | 0.4 | GO:0032201 | telomere maintenance via semi-conservative replication(GO:0032201) |
| 0.0 | 0.2 | GO:0043383 | negative T cell selection(GO:0043383) |
| 0.0 | 0.6 | GO:0043171 | peptide catabolic process(GO:0043171) |
| 0.0 | 0.2 | GO:0007250 | activation of NF-kappaB-inducing kinase activity(GO:0007250) |
| 0.0 | 0.1 | GO:0070257 | positive regulation of mucus secretion(GO:0070257) |
Gene overrepresentation in cellular component category:
| Log-likelihood per target | Total log-likelihood | Term | Description |
|---|---|---|---|
| 0.9 | 8.3 | GO:0042406 | extrinsic component of endoplasmic reticulum membrane(GO:0042406) |
| 0.6 | 1.7 | GO:0005600 | collagen type XIII trimer(GO:0005600) transmembrane collagen trimer(GO:0030936) |
| 0.5 | 1.4 | GO:0097232 | lamellar body membrane(GO:0097232) alveolar lamellar body membrane(GO:0097233) |
| 0.4 | 2.7 | GO:0042825 | TAP complex(GO:0042825) |
| 0.3 | 4.3 | GO:0008385 | IkappaB kinase complex(GO:0008385) |
| 0.3 | 0.8 | GO:0034686 | integrin alphav-beta8 complex(GO:0034686) |
| 0.2 | 2.3 | GO:1990316 | ATG1/ULK1 kinase complex(GO:1990316) |
| 0.2 | 1.0 | GO:0071008 | U2-type post-mRNA release spliceosomal complex(GO:0071008) |
| 0.2 | 1.3 | GO:0044530 | supraspliceosomal complex(GO:0044530) |
| 0.2 | 2.2 | GO:0044352 | pinosome(GO:0044352) macropinosome(GO:0044354) |
| 0.2 | 2.1 | GO:0070449 | elongin complex(GO:0070449) |
| 0.2 | 94.7 | GO:0031965 | nuclear membrane(GO:0031965) |
| 0.2 | 0.8 | GO:0035339 | SPOTS complex(GO:0035339) |
| 0.2 | 1.0 | GO:0032299 | ribonuclease H2 complex(GO:0032299) |
| 0.2 | 0.8 | GO:0000942 | condensed nuclear chromosome outer kinetochore(GO:0000942) |
| 0.1 | 7.9 | GO:0005643 | nuclear pore(GO:0005643) |
| 0.1 | 0.7 | GO:0097425 | smooth endoplasmic reticulum membrane(GO:0030868) smooth endoplasmic reticulum part(GO:0097425) |
| 0.1 | 9.2 | GO:0005811 | lipid particle(GO:0005811) |
| 0.1 | 2.5 | GO:0031143 | pseudopodium(GO:0031143) |
| 0.1 | 0.4 | GO:0008622 | epsilon DNA polymerase complex(GO:0008622) |
| 0.1 | 0.9 | GO:0000137 | Golgi cis cisterna(GO:0000137) |
| 0.1 | 0.9 | GO:0042788 | polysomal ribosome(GO:0042788) |
| 0.1 | 0.5 | GO:0031415 | NatA complex(GO:0031415) |
| 0.1 | 4.4 | GO:0015030 | Cajal body(GO:0015030) |
| 0.1 | 0.6 | GO:0097550 | transcriptional preinitiation complex(GO:0097550) |
| 0.0 | 0.9 | GO:0005736 | DNA-directed RNA polymerase I complex(GO:0005736) |
| 0.0 | 1.0 | GO:0045277 | respiratory chain complex IV(GO:0045277) |
| 0.0 | 0.3 | GO:0042612 | MHC class I protein complex(GO:0042612) |
| 0.0 | 0.6 | GO:0000815 | ESCRT III complex(GO:0000815) |
| 0.0 | 2.4 | GO:0030173 | integral component of Golgi membrane(GO:0030173) |
| 0.0 | 0.6 | GO:0005666 | DNA-directed RNA polymerase III complex(GO:0005666) |
| 0.0 | 1.0 | GO:0031362 | anchored component of external side of plasma membrane(GO:0031362) |
| 0.0 | 0.4 | GO:0005785 | signal recognition particle receptor complex(GO:0005785) |
| 0.0 | 0.4 | GO:0045254 | pyruvate dehydrogenase complex(GO:0045254) |
| 0.0 | 0.2 | GO:0097452 | GAIT complex(GO:0097452) |
| 0.0 | 0.4 | GO:0005744 | mitochondrial inner membrane presequence translocase complex(GO:0005744) |
| 0.0 | 6.8 | GO:0072562 | blood microparticle(GO:0072562) |
| 0.0 | 2.1 | GO:0035577 | azurophil granule membrane(GO:0035577) |
| 0.0 | 0.1 | GO:0032798 | Swi5-Sfr1 complex(GO:0032798) |
| 0.0 | 0.3 | GO:0036056 | filtration diaphragm(GO:0036056) slit diaphragm(GO:0036057) |
| 0.0 | 0.2 | GO:0005655 | nucleolar ribonuclease P complex(GO:0005655) |
| 0.0 | 0.2 | GO:0030893 | meiotic cohesin complex(GO:0030893) |
| 0.0 | 1.6 | GO:0032580 | Golgi cisterna membrane(GO:0032580) |
| 0.0 | 0.6 | GO:0071564 | npBAF complex(GO:0071564) |
| 0.0 | 0.1 | GO:0005968 | Rab-protein geranylgeranyltransferase complex(GO:0005968) |
| 0.0 | 0.2 | GO:0000940 | condensed chromosome outer kinetochore(GO:0000940) |
| 0.0 | 36.0 | GO:0005739 | mitochondrion(GO:0005739) |
| 0.0 | 0.3 | GO:0090544 | BAF-type complex(GO:0090544) |
| 0.0 | 5.2 | GO:0031012 | extracellular matrix(GO:0031012) |
| 0.0 | 0.1 | GO:0033010 | paranodal junction(GO:0033010) |
| 0.0 | 3.0 | GO:0005802 | trans-Golgi network(GO:0005802) |
| 0.0 | 2.3 | GO:0044306 | neuron projection terminus(GO:0044306) |
| 0.0 | 0.1 | GO:0005832 | chaperonin-containing T-complex(GO:0005832) |
| 0.0 | 2.2 | GO:0005840 | ribosome(GO:0005840) |
| 0.0 | 2.6 | GO:0045111 | intermediate filament cytoskeleton(GO:0045111) |
| 0.0 | 18.9 | GO:0005615 | extracellular space(GO:0005615) |
Gene overrepresentation in molecular function category:
| Log-likelihood per target | Total log-likelihood | Term | Description |
|---|---|---|---|
| 4.9 | 14.7 | GO:0004798 | thymidylate kinase activity(GO:0004798) |
| 2.4 | 35.8 | GO:0001730 | 2'-5'-oligoadenylate synthetase activity(GO:0001730) |
| 1.4 | 4.3 | GO:0001716 | L-amino-acid oxidase activity(GO:0001716) |
| 1.1 | 6.4 | GO:0048030 | disaccharide binding(GO:0048030) |
| 1.0 | 6.9 | GO:0042296 | ISG15 transferase activity(GO:0042296) |
| 0.6 | 17.3 | GO:0070403 | NAD+ binding(GO:0070403) |
| 0.5 | 2.7 | GO:0015433 | peptide antigen-transporting ATPase activity(GO:0015433) |
| 0.5 | 3.2 | GO:0004534 | 5'-3' exoribonuclease activity(GO:0004534) |
| 0.5 | 7.0 | GO:0005381 | iron ion transmembrane transporter activity(GO:0005381) |
| 0.5 | 2.7 | GO:0004694 | eukaryotic translation initiation factor 2alpha kinase activity(GO:0004694) |
| 0.4 | 2.1 | GO:0004471 | malate dehydrogenase (decarboxylating) (NAD+) activity(GO:0004471) malate dehydrogenase (decarboxylating) (NADP+) activity(GO:0004473) |
| 0.4 | 8.3 | GO:0032183 | SUMO binding(GO:0032183) |
| 0.3 | 2.3 | GO:0015057 | thrombin receptor activity(GO:0015057) |
| 0.3 | 1.0 | GO:0004958 | prostaglandin F receptor activity(GO:0004958) |
| 0.3 | 1.3 | GO:0004074 | biliverdin reductase activity(GO:0004074) |
| 0.3 | 2.1 | GO:0042289 | MHC class II protein binding(GO:0042289) |
| 0.3 | 5.2 | GO:0042609 | CD4 receptor binding(GO:0042609) |
| 0.3 | 6.8 | GO:0070006 | metalloaminopeptidase activity(GO:0070006) |
| 0.2 | 97.7 | GO:0008017 | microtubule binding(GO:0008017) |
| 0.2 | 7.9 | GO:0005031 | tumor necrosis factor-activated receptor activity(GO:0005031) death receptor activity(GO:0005035) |
| 0.2 | 0.9 | GO:0034046 | poly(G) binding(GO:0034046) |
| 0.2 | 0.8 | GO:0031849 | olfactory receptor binding(GO:0031849) |
| 0.2 | 0.8 | GO:0051185 | coenzyme transporter activity(GO:0051185) |
| 0.2 | 4.9 | GO:0003950 | NAD+ ADP-ribosyltransferase activity(GO:0003950) |
| 0.2 | 4.4 | GO:0000339 | RNA cap binding(GO:0000339) |
| 0.2 | 2.4 | GO:0031386 | protein tag(GO:0031386) |
| 0.2 | 0.8 | GO:1990430 | extracellular matrix protein binding(GO:1990430) |
| 0.2 | 0.5 | GO:0052858 | peptidyl-lysine N-acetyltransferase activity, acting on acetyl phosphate as donor(GO:0052858) |
| 0.2 | 9.3 | GO:0051539 | 4 iron, 4 sulfur cluster binding(GO:0051539) |
| 0.1 | 0.9 | GO:0061649 | ubiquitinated histone binding(GO:0061649) |
| 0.1 | 0.7 | GO:0016882 | cyclo-ligase activity(GO:0016882) |
| 0.1 | 0.7 | GO:0005502 | 11-cis retinal binding(GO:0005502) |
| 0.1 | 1.4 | GO:0043176 | amine binding(GO:0043176) serotonin binding(GO:0051378) |
| 0.1 | 3.8 | GO:0001848 | complement binding(GO:0001848) |
| 0.1 | 11.8 | GO:0003725 | double-stranded RNA binding(GO:0003725) |
| 0.1 | 0.4 | GO:0004739 | pyruvate dehydrogenase (acetyl-transferring) activity(GO:0004739) |
| 0.1 | 1.0 | GO:0004523 | RNA-DNA hybrid ribonuclease activity(GO:0004523) |
| 0.1 | 0.3 | GO:0004982 | N-formyl peptide receptor activity(GO:0004982) |
| 0.1 | 0.3 | GO:0004758 | serine C-palmitoyltransferase activity(GO:0004758) C-palmitoyltransferase activity(GO:0016454) |
| 0.1 | 0.1 | GO:0004663 | protein geranylgeranyltransferase activity(GO:0004661) Rab geranylgeranyltransferase activity(GO:0004663) |
| 0.1 | 8.0 | GO:0000979 | RNA polymerase II core promoter sequence-specific DNA binding(GO:0000979) |
| 0.1 | 0.4 | GO:0015450 | P-P-bond-hydrolysis-driven protein transmembrane transporter activity(GO:0015450) |
| 0.1 | 1.5 | GO:0034236 | protein kinase A catalytic subunit binding(GO:0034236) |
| 0.1 | 0.2 | GO:0000035 | acyl binding(GO:0000035) |
| 0.1 | 22.2 | GO:0030246 | carbohydrate binding(GO:0030246) |
| 0.1 | 0.6 | GO:0001056 | RNA polymerase III activity(GO:0001056) |
| 0.1 | 0.4 | GO:0005047 | signal recognition particle binding(GO:0005047) |
| 0.1 | 0.2 | GO:0035402 | histone kinase activity (H3-T11 specific)(GO:0035402) |
| 0.0 | 0.9 | GO:0001054 | RNA polymerase I activity(GO:0001054) |
| 0.0 | 1.3 | GO:0005521 | lamin binding(GO:0005521) |
| 0.0 | 0.4 | GO:0002161 | aminoacyl-tRNA editing activity(GO:0002161) |
| 0.0 | 0.3 | GO:0042608 | T cell receptor binding(GO:0042608) |
| 0.0 | 0.3 | GO:0050294 | steroid sulfotransferase activity(GO:0050294) |
| 0.0 | 0.5 | GO:0032027 | myosin light chain binding(GO:0032027) |
| 0.0 | 0.1 | GO:0008988 | rRNA (adenine-N6-)-methyltransferase activity(GO:0008988) |
| 0.0 | 1.0 | GO:0008376 | acetylgalactosaminyltransferase activity(GO:0008376) |
| 0.0 | 0.3 | GO:0003726 | double-stranded RNA adenosine deaminase activity(GO:0003726) |
| 0.0 | 0.8 | GO:0008432 | JUN kinase binding(GO:0008432) |
| 0.0 | 0.3 | GO:0035252 | UDP-xylosyltransferase activity(GO:0035252) xylosyltransferase activity(GO:0042285) |
| 0.0 | 2.5 | GO:0017112 | Rab guanyl-nucleotide exchange factor activity(GO:0017112) |
| 0.0 | 0.2 | GO:0036033 | mediator complex binding(GO:0036033) |
| 0.0 | 0.8 | GO:0052629 | phosphatidylinositol-3,5-bisphosphate 3-phosphatase activity(GO:0052629) |
| 0.0 | 0.2 | GO:0046975 | histone methyltransferase activity (H3-K36 specific)(GO:0046975) |
| 0.0 | 2.4 | GO:0030374 | ligand-dependent nuclear receptor transcription coactivator activity(GO:0030374) |
| 0.0 | 0.3 | GO:0008046 | axon guidance receptor activity(GO:0008046) |
| 0.0 | 1.0 | GO:0004129 | cytochrome-c oxidase activity(GO:0004129) heme-copper terminal oxidase activity(GO:0015002) oxidoreductase activity, acting on a heme group of donors, oxygen as acceptor(GO:0016676) |
| 0.0 | 0.6 | GO:0046966 | thyroid hormone receptor binding(GO:0046966) |
| 0.0 | 27.9 | GO:0008270 | zinc ion binding(GO:0008270) |
| 0.0 | 1.0 | GO:0030296 | protein tyrosine kinase activator activity(GO:0030296) |
| 0.0 | 1.6 | GO:0001540 | beta-amyloid binding(GO:0001540) |
| 0.0 | 0.1 | GO:0002162 | dystroglycan binding(GO:0002162) |
| 0.0 | 0.2 | GO:0004526 | ribonuclease P activity(GO:0004526) |
| 0.0 | 1.1 | GO:0016279 | protein-lysine N-methyltransferase activity(GO:0016279) |
| 0.0 | 1.6 | GO:0004843 | thiol-dependent ubiquitin-specific protease activity(GO:0004843) |
| 0.0 | 0.2 | GO:0003680 | AT DNA binding(GO:0003680) |
| 0.0 | 0.4 | GO:0003887 | DNA-directed DNA polymerase activity(GO:0003887) |
| 0.0 | 0.1 | GO:0052833 | inositol monophosphate 1-phosphatase activity(GO:0008934) inositol monophosphate 3-phosphatase activity(GO:0052832) inositol monophosphate 4-phosphatase activity(GO:0052833) inositol monophosphate phosphatase activity(GO:0052834) |
| 0.0 | 1.0 | GO:0004004 | ATP-dependent RNA helicase activity(GO:0004004) RNA-dependent ATPase activity(GO:0008186) |
| 0.0 | 0.4 | GO:0031434 | mitogen-activated protein kinase kinase binding(GO:0031434) |
| 0.0 | 0.0 | GO:0004332 | fructose-bisphosphate aldolase activity(GO:0004332) |
| 0.0 | 0.3 | GO:0004535 | poly(A)-specific ribonuclease activity(GO:0004535) |
| 0.0 | 2.5 | GO:0017137 | Rab GTPase binding(GO:0017137) |
| 0.0 | 5.8 | GO:0004842 | ubiquitin-protein transferase activity(GO:0004842) |
| 0.0 | 0.5 | GO:0046875 | ephrin receptor binding(GO:0046875) |
Gene overrepresentation in curated gene sets: canonical pathways category:
| Log-likelihood per target | Total log-likelihood | Term | Description |
|---|---|---|---|
| 0.1 | 7.0 | ST GA12 PATHWAY | G alpha 12 Pathway |
| 0.1 | 3.4 | SIG PIP3 SIGNALING IN B LYMPHOCYTES | Genes related to PIP3 signaling in B lymphocytes |
| 0.1 | 6.6 | PID MYC PATHWAY | C-MYC pathway |
| 0.1 | 30.4 | NABA ECM AFFILIATED | Genes encoding proteins affiliated structurally or functionally to extracellular matrix proteins |
| 0.1 | 1.3 | SIG PIP3 SIGNALING IN CARDIAC MYOCTES | Genes related to PIP3 signaling in cardiac myocytes |
| 0.1 | 6.0 | PID CD8 TCR DOWNSTREAM PATHWAY | Downstream signaling in naïve CD8+ T cells |
| 0.1 | 9.4 | PID SMAD2 3NUCLEAR PATHWAY | Regulation of nuclear SMAD2/3 signaling |
| 0.0 | 0.8 | PID INTEGRIN5 PATHWAY | Beta5 beta6 beta7 and beta8 integrin cell surface interactions |
| 0.0 | 1.7 | NABA COLLAGENS | Genes encoding collagen proteins |
| 0.0 | 1.5 | PID CD8 TCR PATHWAY | TCR signaling in naïve CD8+ T cells |
| 0.0 | 0.2 | SA G2 AND M PHASES | Cdc25 activates the cdc2/cyclin B complex to induce the G2/M transition. |
| 0.0 | 1.3 | PID A6B1 A6B4 INTEGRIN PATHWAY | a6b1 and a6b4 Integrin signaling |
| 0.0 | 0.5 | PID INTEGRIN A9B1 PATHWAY | Alpha9 beta1 integrin signaling events |
| 0.0 | 0.8 | PID AURORA B PATHWAY | Aurora B signaling |
| 0.0 | 0.4 | ST ERK1 ERK2 MAPK PATHWAY | ERK1/ERK2 MAPK Pathway |
| 0.0 | 0.3 | PID NECTIN PATHWAY | Nectin adhesion pathway |
Gene overrepresentation in curated gene sets: REACTOME pathways category:
| Log-likelihood per target | Total log-likelihood | Term | Description |
|---|---|---|---|
| 1.4 | 163.3 | REACTOME INTERFERON ALPHA BETA SIGNALING | Genes involved in Interferon alpha/beta signaling |
| 0.5 | 8.0 | REACTOME TRAF3 DEPENDENT IRF ACTIVATION PATHWAY | Genes involved in TRAF3-dependent IRF activation pathway |
| 0.2 | 3.8 | REACTOME INITIAL TRIGGERING OF COMPLEMENT | Genes involved in Initial triggering of complement |
| 0.1 | 7.4 | REACTOME NEGATIVE REGULATORS OF RIG I MDA5 SIGNALING | Genes involved in Negative regulators of RIG-I/MDA5 signaling |
| 0.1 | 3.2 | REACTOME DESTABILIZATION OF MRNA BY BRF1 | Genes involved in Destabilization of mRNA by Butyrate Response Factor 1 (BRF1) |
| 0.1 | 1.4 | REACTOME SEROTONIN RECEPTORS | Genes involved in Serotonin receptors |
| 0.1 | 7.2 | REACTOME INTERFERON GAMMA SIGNALING | Genes involved in Interferon gamma signaling |
| 0.1 | 1.5 | REACTOME PHOSPHORYLATION OF CD3 AND TCR ZETA CHAINS | Genes involved in Phosphorylation of CD3 and TCR zeta chains |
| 0.1 | 1.8 | REACTOME ANTIGEN PRESENTATION FOLDING ASSEMBLY AND PEPTIDE LOADING OF CLASS I MHC | Genes involved in Antigen Presentation: Folding, assembly and peptide loading of class I MHC |
| 0.1 | 1.0 | REACTOME PROSTANOID LIGAND RECEPTORS | Genes involved in Prostanoid ligand receptors |
| 0.1 | 0.8 | REACTOME PECAM1 INTERACTIONS | Genes involved in PECAM1 interactions |
| 0.1 | 0.7 | REACTOME N GLYCAN TRIMMING IN THE ER AND CALNEXIN CALRETICULIN CYCLE | Genes involved in N-glycan trimming in the ER and Calnexin/Calreticulin cycle |
| 0.0 | 0.7 | REACTOME PURINE RIBONUCLEOSIDE MONOPHOSPHATE BIOSYNTHESIS | Genes involved in Purine ribonucleoside monophosphate biosynthesis |
| 0.0 | 0.8 | REACTOME SYNTHESIS OF PIPS AT THE LATE ENDOSOME MEMBRANE | Genes involved in Synthesis of PIPs at the late endosome membrane |
| 0.0 | 1.3 | REACTOME METABOLISM OF PORPHYRINS | Genes involved in Metabolism of porphyrins |
| 0.0 | 0.6 | REACTOME RNA POL III CHAIN ELONGATION | Genes involved in RNA Polymerase III Chain Elongation |
| 0.0 | 2.7 | REACTOME ANTIVIRAL MECHANISM BY IFN STIMULATED GENES | Genes involved in Antiviral mechanism by IFN-stimulated genes |
| 0.0 | 1.7 | REACTOME COLLAGEN FORMATION | Genes involved in Collagen formation |
| 0.0 | 0.8 | REACTOME SIGNAL REGULATORY PROTEIN SIRP FAMILY INTERACTIONS | Genes involved in Signal regulatory protein (SIRP) family interactions |
| 0.0 | 0.9 | REACTOME RNA POL I TRANSCRIPTION TERMINATION | Genes involved in RNA Polymerase I Transcription Termination |
| 0.0 | 0.5 | REACTOME METABOLISM OF POLYAMINES | Genes involved in Metabolism of polyamines |
| 0.0 | 0.4 | REACTOME REGULATION OF PYRUVATE DEHYDROGENASE PDH COMPLEX | Genes involved in Regulation of pyruvate dehydrogenase (PDH) complex |
| 0.0 | 0.7 | REACTOME CIRCADIAN REPRESSION OF EXPRESSION BY REV ERBA | Genes involved in Circadian Repression of Expression by REV-ERBA |
| 0.0 | 0.3 | REACTOME DESTABILIZATION OF MRNA BY KSRP | Genes involved in Destabilization of mRNA by KSRP |
| 0.0 | 0.4 | REACTOME MITOCHONDRIAL TRNA AMINOACYLATION | Genes involved in Mitochondrial tRNA aminoacylation |
| 0.0 | 0.6 | REACTOME ENDOSOMAL SORTING COMPLEX REQUIRED FOR TRANSPORT ESCRT | Genes involved in Endosomal Sorting Complex Required For Transport (ESCRT) |
| 0.0 | 1.2 | REACTOME ACTIVATION OF CHAPERONE GENES BY XBP1S | Genes involved in Activation of Chaperone Genes by XBP1(S) |
| 0.0 | 0.8 | REACTOME TRANSPORT OF VITAMINS NUCLEOSIDES AND RELATED MOLECULES | Genes involved in Transport of vitamins, nucleosides, and related molecules |
| 0.0 | 0.3 | REACTOME CYTOSOLIC SULFONATION OF SMALL MOLECULES | Genes involved in Cytosolic sulfonation of small molecules |
| 0.0 | 0.2 | REACTOME DESTABILIZATION OF MRNA BY AUF1 HNRNP D0 | Genes involved in Destabilization of mRNA by AUF1 (hnRNP D0) |
| 0.0 | 0.2 | REACTOME G2 M DNA DAMAGE CHECKPOINT | Genes involved in G2/M DNA damage checkpoint |
| 0.0 | 0.5 | REACTOME TIGHT JUNCTION INTERACTIONS | Genes involved in Tight junction interactions |
| 0.0 | 2.4 | REACTOME PEPTIDE LIGAND BINDING RECEPTORS | Genes involved in Peptide ligand-binding receptors |