|
chr21_+_41426590
Show fit
|
60.76 |
ENST00000679543.1
ENST00000680364.1
|
MX1
|
MX dynamin like GTPase 1
|
|
chr2_-_6865901
Show fit
|
44.74 |
ENST00000256722.10
|
CMPK2
|
cytidine/uridine monophosphate kinase 2
|
|
chr4_-_76023489
Show fit
|
39.63 |
ENST00000306602.3
|
CXCL10
|
C-X-C motif chemokine ligand 10
|
|
chr21_+_41426197
Show fit
|
36.39 |
ENST00000680942.1
ENST00000288383.11
ENST00000679386.1
|
MX1
|
MX dynamin like GTPase 1
|
|
chr21_+_41426031
Show fit
|
34.95 |
ENST00000455164.6
ENST00000681849.1
ENST00000679705.1
ENST00000424365.6
|
MX1
|
MX dynamin like GTPase 1
|
|
chr17_+_6756035
Show fit
|
32.78 |
ENST00000361842.8
ENST00000574907.5
|
XAF1
|
XIAP associated factor 1
|
|
chr21_+_41426168
Show fit
|
32.06 |
ENST00000681266.1
ENST00000417963.6
|
MX1
|
MX dynamin like GTPase 1
|
|
chr21_+_41426232
Show fit
|
30.36 |
ENST00000398598.8
ENST00000681896.1
ENST00000680629.1
ENST00000680760.1
ENST00000680176.1
ENST00000680776.1
ENST00000681607.1
ENST00000680536.1
|
MX1
|
MX dynamin like GTPase 1
|
|
chr21_+_41426289
Show fit
|
30.13 |
ENST00000679408.1
ENST00000681039.1
ENST00000681671.1
|
MX1
|
MX dynamin like GTPase 1
|
|
chr12_+_112906949
Show fit
|
23.56 |
ENST00000679971.1
ENST00000675868.2
ENST00000550883.2
ENST00000553152.2
ENST00000202917.10
ENST00000679467.1
ENST00000680659.1
ENST00000540589.3
ENST00000552526.2
ENST00000681228.1
ENST00000680934.1
ENST00000681700.1
ENST00000679987.1
|
OAS1
|
2'-5'-oligoadenylate synthetase 1
|
|
chr12_+_112906777
Show fit
|
23.51 |
ENST00000452357.7
ENST00000445409.7
|
OAS1
|
2'-5'-oligoadenylate synthetase 1
|
|
chr13_-_42992165
Show fit
|
23.37 |
ENST00000398762.7
ENST00000313640.11
ENST00000313624.12
|
EPSTI1
|
epithelial stromal interaction 1
|
|
chr12_+_112907006
Show fit
|
23.33 |
ENST00000680455.1
ENST00000551241.6
ENST00000550689.2
ENST00000679841.1
ENST00000679494.1
ENST00000553185.2
|
OAS1
|
2'-5'-oligoadenylate synthetase 1
|
|
chr17_+_6755834
Show fit
|
22.74 |
ENST00000346752.8
|
XAF1
|
XIAP associated factor 1
|
|
chr3_-_122564232
Show fit
|
19.93 |
ENST00000471785.5
ENST00000466126.1
|
PARP9
|
poly(ADP-ribose) polymerase family member 9
|
|
chr3_-_122564577
Show fit
|
19.48 |
ENST00000477522.6
ENST00000360356.6
|
PARP9
|
poly(ADP-ribose) polymerase family member 9
|
|
chr1_+_78649818
Show fit
|
17.97 |
ENST00000370747.9
ENST00000438486.1
|
IFI44
|
interferon induced protein 44
|
|
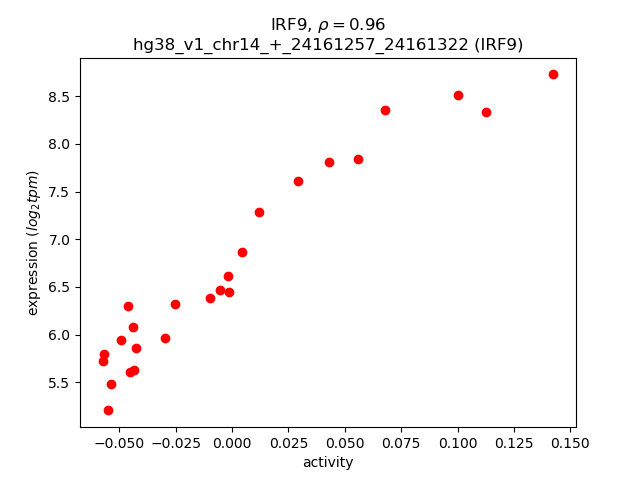
chr14_+_24161257
Show fit
|
17.41 |
ENST00000396864.8
ENST00000557894.5
ENST00000559284.5
ENST00000560275.5
|
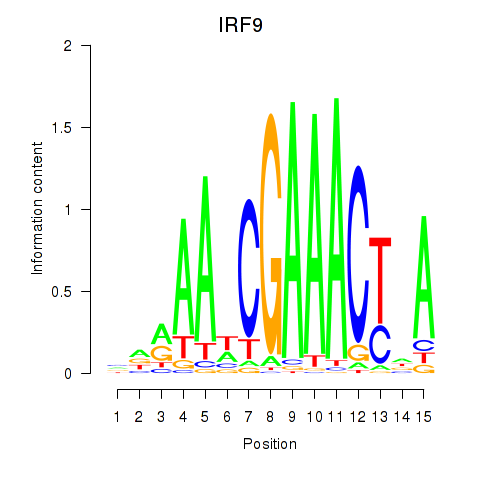
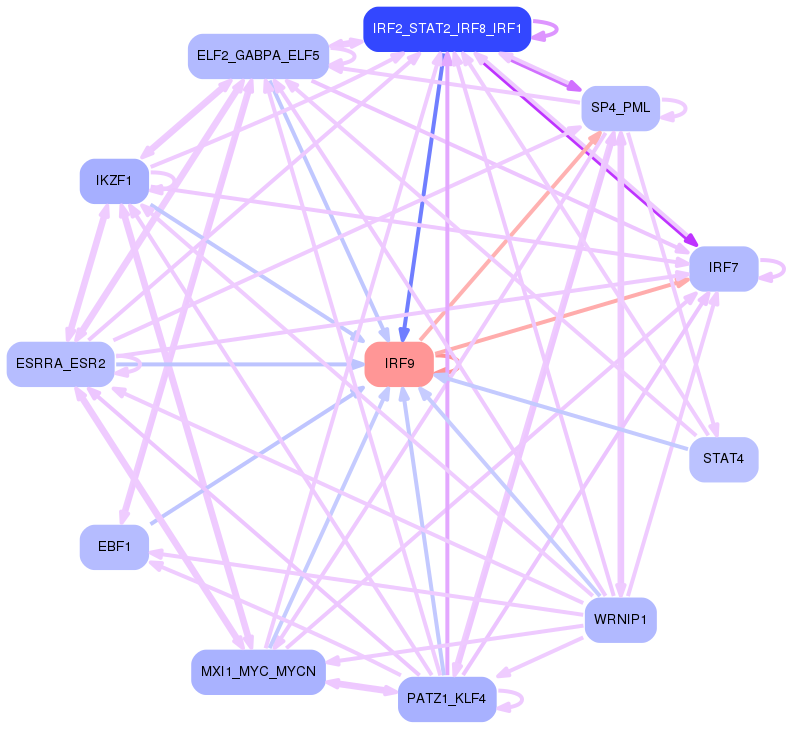
IRF9
|
interferon regulatory factor 9
|
|
chr12_+_112938523
Show fit
|
17.12 |
ENST00000679483.1
ENST00000679493.1
|
OAS3
|
2'-5'-oligoadenylate synthetase 3
|
|
chr12_+_112938284
Show fit
|
16.87 |
ENST00000681346.1
|
OAS3
|
2'-5'-oligoadenylate synthetase 3
|
|
chr1_-_150765785
Show fit
|
16.34 |
ENST00000680311.1
ENST00000681728.1
ENST00000680288.1
|
CTSS
|
cathepsin S
|
|
chr6_-_81752671
Show fit
|
16.20 |
ENST00000320172.11
ENST00000369754.7
ENST00000369756.3
|
TENT5A
|
terminal nucleotidyltransferase 5A
|
|
chr11_-_60952067
Show fit
|
15.91 |
ENST00000681275.1
|
SLC15A3
|
solute carrier family 15 member 3
|
|
chr21_+_41361999
Show fit
|
15.75 |
ENST00000436410.5
ENST00000435611.6
ENST00000330714.8
|
MX2
|
MX dynamin like GTPase 2
|
|
chr1_-_150765735
Show fit
|
15.58 |
ENST00000679898.1
ENST00000448301.7
ENST00000680664.1
ENST00000679512.1
ENST00000368985.8
ENST00000679582.1
|
CTSS
|
cathepsin S
|
|
chr2_+_6865557
Show fit
|
15.30 |
ENST00000680607.1
ENST00000680320.1
ENST00000442639.6
|
RSAD2
|
radical S-adenosyl methionine domain containing 2
|
|
chr3_+_122564327
Show fit
|
14.60 |
ENST00000296161.9
ENST00000383661.3
|
DTX3L
|
deltex E3 ubiquitin ligase 3L
|
|
chr9_+_5510492
Show fit
|
14.34 |
ENST00000397747.5
|
PDCD1LG2
|
programmed cell death 1 ligand 2
|
|
chr10_+_89332484
Show fit
|
13.86 |
ENST00000371811.4
ENST00000680037.1
ENST00000679583.1
ENST00000679897.1
|
IFIT3
|
interferon induced protein with tetratricopeptide repeats 3
|
|
chr6_-_32838727
Show fit
|
13.32 |
ENST00000652259.1
ENST00000374897.4
ENST00000620123.4
ENST00000452392.2
|
TAP2
ENSG00000250264.1
|
transporter 2, ATP binding cassette subfamily B member
novel protein, TAP2-HLA-DOB readthrough
|
|
chr3_+_122680802
Show fit
|
13.18 |
ENST00000474629.7
|
PARP14
|
poly(ADP-ribose) polymerase family member 14
|
|
chr11_-_60952134
Show fit
|
13.05 |
ENST00000679573.1
ENST00000681882.1
ENST00000681951.1
ENST00000227880.8
|
SLC15A3
|
solute carrier family 15 member 3
|
|
chr3_-_122564253
Show fit
|
12.62 |
ENST00000492382.5
ENST00000682323.1
ENST00000462315.5
|
PARP9
|
poly(ADP-ribose) polymerase family member 9
|
|
chr2_-_162318475
Show fit
|
12.02 |
ENST00000648433.1
|
IFIH1
|
interferon induced with helicase C domain 1
|
|
chr17_-_42112674
Show fit
|
11.69 |
ENST00000251642.8
ENST00000591220.5
|
DHX58
|
DExH-box helicase 58
|
|
chr11_-_60952559
Show fit
|
11.65 |
ENST00000538739.2
|
SLC15A3
|
solute carrier family 15 member 3
|
|
chr10_-_5978022
Show fit
|
11.30 |
ENST00000525219.6
|
IL15RA
|
interleukin 15 receptor subunit alpha
|
|
chr22_+_18150162
Show fit
|
10.89 |
ENST00000215794.8
|
USP18
|
ubiquitin specific peptidase 18
|
|
chr10_+_89414555
Show fit
|
10.19 |
ENST00000371795.5
ENST00000681422.1
|
IFIT5
|
interferon induced protein with tetratricopeptide repeats 5
|
|
chr12_+_112938422
Show fit
|
10.15 |
ENST00000680044.1
ENST00000680966.1
ENST00000548514.2
ENST00000681497.1
ENST00000551007.1
ENST00000228928.12
ENST00000680438.1
ENST00000681147.1
ENST00000679354.1
ENST00000681085.1
ENST00000680161.1
|
OAS3
|
2'-5'-oligoadenylate synthetase 3
|
|
chr11_-_615570
Show fit
|
10.07 |
ENST00000649187.1
ENST00000647801.1
ENST00000397566.5
ENST00000397570.5
|
IRF7
|
interferon regulatory factor 7
|
|
chr11_-_4393650
Show fit
|
9.15 |
ENST00000254436.8
|
TRIM21
|
tripartite motif containing 21
|
|
chr2_+_6877768
Show fit
|
8.62 |
ENST00000382040.4
|
RSAD2
|
radical S-adenosyl methionine domain containing 2
|
|
chr15_+_73994667
Show fit
|
8.47 |
ENST00000395135.7
|
PML
|
PML nuclear body scaffold
|
|
chr15_+_73994694
Show fit
|
8.30 |
ENST00000268058.8
ENST00000395132.6
ENST00000268059.10
ENST00000354026.10
ENST00000565898.5
ENST00000569477.5
ENST00000569965.5
ENST00000567543.5
ENST00000436891.7
ENST00000435786.6
ENST00000564428.5
ENST00000359928.8
|
PML
|
PML nuclear body scaffold
|
|
chr11_-_615921
Show fit
|
7.81 |
ENST00000348655.11
ENST00000525445.6
ENST00000330243.9
|
IRF7
|
interferon regulatory factor 7
|
|
chr13_+_49496355
Show fit
|
7.57 |
ENST00000496612.5
ENST00000357596.7
ENST00000485919.5
ENST00000442195.5
|
PHF11
|
PHD finger protein 11
|
|
chr11_-_57567617
Show fit
|
7.44 |
ENST00000287156.9
|
UBE2L6
|
ubiquitin conjugating enzyme E2 L6
|
|
chr7_-_140062841
Show fit
|
7.41 |
ENST00000263549.8
|
PARP12
|
poly(ADP-ribose) polymerase family member 12
|
|
chr13_+_49495941
Show fit
|
7.39 |
ENST00000378319.8
ENST00000496623.5
ENST00000426879.5
|
PHF11
|
PHD finger protein 11
|
|
chr4_-_168318770
Show fit
|
7.04 |
ENST00000680771.1
ENST00000514995.2
|
DDX60
|
DExD/H-box helicase 60
|
|
chr2_-_219387784
Show fit
|
6.81 |
ENST00000520694.6
|
DNPEP
|
aspartyl aminopeptidase
|
|
chr4_-_168318743
Show fit
|
6.44 |
ENST00000393743.8
|
DDX60
|
DExD/H-box helicase 60
|
|
chr2_-_106194286
Show fit
|
6.40 |
ENST00000409501.7
ENST00000441952.5
ENST00000457835.5
ENST00000483426.5
ENST00000283148.12
|
UXS1
|
UDP-glucuronate decarboxylase 1
|
|
chr15_+_73994777
Show fit
|
6.34 |
ENST00000563500.5
|
PML
|
PML nuclear body scaffold
|
|
chr7_+_101085464
Show fit
|
6.29 |
ENST00000306085.11
ENST00000412507.1
|
TRIM56
|
tripartite motif containing 56
|
|
chr17_+_27631148
Show fit
|
6.16 |
ENST00000313648.10
ENST00000395473.7
ENST00000577392.5
ENST00000584661.5
|
LGALS9
|
galectin 9
|
|
chr5_-_95961830
Show fit
|
6.02 |
ENST00000513343.1
ENST00000237853.9
|
ELL2
|
elongation factor for RNA polymerase II 2
|
|
chr6_-_33314386
Show fit
|
5.97 |
ENST00000456592.3
|
TAPBP
|
TAP binding protein
|
|
chr1_+_1013485
Show fit
|
5.65 |
ENST00000649529.1
|
ISG15
|
ISG15 ubiquitin like modifier
|
|
chr1_+_112674416
Show fit
|
5.48 |
ENST00000413052.6
ENST00000369645.5
|
MOV10
|
Mov10 RISC complex RNA helicase
|
|
chr12_-_121039204
Show fit
|
5.46 |
ENST00000620239.5
|
OASL
|
2'-5'-oligoadenylate synthetase like
|
|
chr12_-_121039236
Show fit
|
5.25 |
ENST00000257570.9
|
OASL
|
2'-5'-oligoadenylate synthetase like
|
|
chr2_-_219387881
Show fit
|
5.20 |
ENST00000322176.11
ENST00000273075.9
|
DNPEP
|
aspartyl aminopeptidase
|
|
chr1_+_112674722
Show fit
|
5.04 |
ENST00000357443.2
|
MOV10
|
Mov10 RISC complex RNA helicase
|
|
chr12_-_121039156
Show fit
|
4.94 |
ENST00000339275.10
|
OASL
|
2'-5'-oligoadenylate synthetase like
|
|
chr1_+_112674649
Show fit
|
4.91 |
ENST00000369644.5
|
MOV10
|
Mov10 RISC complex RNA helicase
|
|
chr16_-_74700786
Show fit
|
4.68 |
ENST00000306247.11
ENST00000575686.1
|
MLKL
|
mixed lineage kinase domain like pseudokinase
|
|
chr4_-_168480477
Show fit
|
4.29 |
ENST00000514748.5
ENST00000512371.1
ENST00000505890.5
ENST00000682922.1
ENST00000511577.5
|
DDX60L
|
DExD/H-box 60 like
|
|
chr3_-_142448060
Show fit
|
4.22 |
ENST00000264951.8
|
XRN1
|
5'-3' exoribonuclease 1
|
|
chr3_-_142448028
Show fit
|
4.14 |
ENST00000392981.7
|
XRN1
|
5'-3' exoribonuclease 1
|
|
chr17_+_43211835
Show fit
|
4.08 |
ENST00000588693.5
ENST00000588659.5
ENST00000541594.5
ENST00000536052.5
ENST00000612339.4
|
TMEM106A
|
transmembrane protein 106A
|
|
chr9_+_99906646
Show fit
|
4.02 |
ENST00000259400.11
ENST00000531035.5
ENST00000525640.5
ENST00000534052.1
ENST00000526607.1
|
STX17
|
syntaxin 17
|
|
chr2_-_151289613
Show fit
|
3.85 |
ENST00000243346.10
|
NMI
|
N-myc and STAT interactor
|
|
chr1_-_154608140
Show fit
|
3.80 |
ENST00000529168.2
ENST00000368474.9
ENST00000680305.1
ENST00000648231.2
|
ADAR
|
adenosine deaminase RNA specific
|
|
chr20_-_49278034
Show fit
|
3.79 |
ENST00000371744.5
ENST00000396105.6
ENST00000371752.5
|
ZNFX1
|
zinc finger NFX1-type containing 1
|
|
chr11_-_86672419
Show fit
|
3.64 |
ENST00000524826.7
ENST00000532471.1
|
ME3
|
malic enzyme 3
|
|
chr4_+_186069144
Show fit
|
3.55 |
ENST00000513189.1
ENST00000296795.8
|
TLR3
|
toll like receptor 3
|
|
chr11_-_86672114
Show fit
|
3.22 |
ENST00000393324.7
|
ME3
|
malic enzyme 3
|
|
chr11_-_86672630
Show fit
|
3.15 |
ENST00000543262.5
|
ME3
|
malic enzyme 3
|
|
chr6_-_33314055
Show fit
|
3.12 |
ENST00000434618.7
|
TAPBP
|
TAP binding protein
|
|
chr6_+_125919210
Show fit
|
3.07 |
ENST00000438495.6
|
NCOA7
|
nuclear receptor coactivator 7
|
|
chr6_+_125919296
Show fit
|
3.05 |
ENST00000444128.2
|
NCOA7
|
nuclear receptor coactivator 7
|
|
chr3_-_121660892
Show fit
|
3.02 |
ENST00000428394.6
ENST00000314583.8
|
HCLS1
|
hematopoietic cell-specific Lyn substrate 1
|
|
chr12_+_6772512
Show fit
|
2.98 |
ENST00000441671.6
ENST00000203629.3
|
LAG3
|
lymphocyte activating 3
|
|
chr10_+_113679523
Show fit
|
2.71 |
ENST00000345633.8
ENST00000614447.4
ENST00000369321.6
|
CASP7
|
caspase 7
|
|
chr17_-_4263847
Show fit
|
2.68 |
ENST00000570535.5
ENST00000574367.5
ENST00000341657.9
|
ANKFY1
|
ankyrin repeat and FYVE domain containing 1
|
|
chr10_+_113679839
Show fit
|
2.67 |
ENST00000369318.8
ENST00000369315.5
|
CASP7
|
caspase 7
|
|
chr17_+_80260826
Show fit
|
2.59 |
ENST00000508628.6
ENST00000582970.5
ENST00000319921.4
|
RNF213
|
ring finger protein 213
|
|
chr18_-_28036585
Show fit
|
2.55 |
ENST00000399380.7
|
CDH2
|
cadherin 2
|
|
chr1_+_156082563
Show fit
|
2.47 |
ENST00000368301.6
|
LMNA
|
lamin A/C
|
|
chr12_-_121038967
Show fit
|
2.38 |
ENST00000680620.1
ENST00000679655.1
ENST00000543677.2
|
OASL
|
2'-5'-oligoadenylate synthetase like
|
|
chr2_-_55693817
Show fit
|
2.29 |
ENST00000625249.1
ENST00000447944.7
|
PNPT1
|
polyribonucleotide nucleotidyltransferase 1
|
|
chr9_-_32526185
Show fit
|
2.25 |
ENST00000379883.3
ENST00000379868.6
ENST00000679859.1
|
DDX58
|
DExD/H-box helicase 58
|
|
chr7_+_134866831
Show fit
|
2.24 |
ENST00000435928.1
|
CALD1
|
caldesmon 1
|
|
chr3_-_142448004
Show fit
|
2.04 |
ENST00000463916.5
|
XRN1
|
5'-3' exoribonuclease 1
|
|
chr8_-_143986425
Show fit
|
1.97 |
ENST00000313059.9
ENST00000524918.5
ENST00000313028.12
ENST00000525773.5
|
PARP10
|
poly(ADP-ribose) polymerase family member 10
|
|
chr3_+_187368367
Show fit
|
1.78 |
ENST00000259030.3
|
RTP4
|
receptor transporter protein 4
|
|
chr10_+_89301932
Show fit
|
1.72 |
ENST00000371826.4
ENST00000679755.1
|
IFIT2
|
interferon induced protein with tetratricopeptide repeats 2
|
|
chr9_+_72149424
Show fit
|
1.63 |
ENST00000358399.8
ENST00000376986.5
|
GDA
|
guanine deaminase
|
|
chr4_+_37891060
Show fit
|
1.55 |
ENST00000261439.9
ENST00000508802.5
ENST00000402522.1
|
TBC1D1
|
TBC1 domain family member 1
|
|
chr16_+_28950807
Show fit
|
1.54 |
ENST00000564978.5
ENST00000320805.8
|
NFATC2IP
|
nuclear factor of activated T cells 2 interacting protein
|
|
chr6_+_37433197
Show fit
|
1.38 |
ENST00000455891.5
ENST00000373451.9
|
CMTR1
|
cap methyltransferase 1
|
|
chr2_-_37156942
Show fit
|
1.37 |
ENST00000680273.1
ENST00000233057.9
ENST00000679979.1
ENST00000679507.1
ENST00000681463.1
ENST00000395127.6
|
EIF2AK2
|
eukaryotic translation initiation factor 2 alpha kinase 2
|
|
chr3_-_71581540
Show fit
|
1.27 |
ENST00000650068.1
|
FOXP1
|
forkhead box P1
|
|
chr9_+_72149351
Show fit
|
1.26 |
ENST00000238018.8
|
GDA
|
guanine deaminase
|
|
chr3_-_45995807
Show fit
|
1.21 |
ENST00000535325.5
ENST00000296137.7
|
FYCO1
|
FYVE and coiled-coil domain autophagy adaptor 1
|
|
chr9_-_83978429
Show fit
|
1.17 |
ENST00000351839.7
|
HNRNPK
|
heterogeneous nuclear ribonucleoprotein K
|
|
chr18_-_69956924
Show fit
|
1.16 |
ENST00000581982.5
ENST00000280200.8
|
CD226
|
CD226 molecule
|
|
chr6_+_106098933
Show fit
|
1.06 |
ENST00000369089.3
|
PRDM1
|
PR/SET domain 1
|
|
chr2_-_37157093
Show fit
|
1.05 |
ENST00000681507.1
|
EIF2AK2
|
eukaryotic translation initiation factor 2 alpha kinase 2
|
|
chr3_-_146544538
Show fit
|
0.95 |
ENST00000462666.5
|
PLSCR1
|
phospholipid scramblase 1
|
|
chr14_-_56810448
Show fit
|
0.90 |
ENST00000339475.10
ENST00000555006.5
ENST00000672264.2
ENST00000554559.5
ENST00000555804.1
|
OTX2
|
orthodenticle homeobox 2
|
|
chr2_-_162318613
Show fit
|
0.78 |
ENST00000649979.2
ENST00000421365.2
|
IFIH1
|
interferon induced with helicase C domain 1
|
|
chr3_-_146544850
Show fit
|
0.75 |
ENST00000472349.1
|
PLSCR1
|
phospholipid scramblase 1
|
|
chr19_-_17405554
Show fit
|
0.60 |
ENST00000252593.7
|
BST2
|
bone marrow stromal cell antigen 2
|
|
chr20_+_62804794
Show fit
|
0.56 |
ENST00000290291.10
|
OGFR
|
opioid growth factor receptor
|
|
chr17_+_40140500
Show fit
|
0.54 |
ENST00000264645.12
|
CASC3
|
CASC3 exon junction complex subunit
|
|
chr14_-_56810380
Show fit
|
0.44 |
ENST00000672125.1
ENST00000673481.1
|
OTX2
|
orthodenticle homeobox 2
|
|
chr3_-_167734510
Show fit
|
0.41 |
ENST00000475915.6
ENST00000462725.6
ENST00000461494.5
|
PDCD10
|
programmed cell death 10
|
|
chr9_-_21995301
Show fit
|
0.34 |
ENST00000498628.6
|
CDKN2A
|
cyclin dependent kinase inhibitor 2A
|
|
chr3_-_146544701
Show fit
|
0.26 |
ENST00000487389.5
|
PLSCR1
|
phospholipid scramblase 1
|
|
chr4_+_88457110
Show fit
|
0.22 |
ENST00000264350.8
|
HERC5
|
HECT and RLD domain containing E3 ubiquitin protein ligase 5
|
|
chr6_-_33314247
Show fit
|
0.16 |
ENST00000475304.5
ENST00000489157.5
|
TAPBP
|
TAP binding protein
|
|
chr3_-_146544636
Show fit
|
0.11 |
ENST00000486631.5
|
PLSCR1
|
phospholipid scramblase 1
|
|
chrX_-_49002197
Show fit
|
0.10 |
ENST00000622231.1
ENST00000617369.4
ENST00000593475.5
ENST00000622599.4
|
GRIPAP1
|
GRIP1 associated protein 1
|
|
chr1_-_161631032
Show fit
|
0.10 |
ENST00000534776.1
ENST00000613418.4
ENST00000614870.4
|
FCGR3B
|
Fc fragment of IgG receptor IIIb
|
|
chr19_-_12696581
Show fit
|
0.09 |
ENST00000587955.1
ENST00000393261.8
|
FBXW9
|
F-box and WD repeat domain containing 9
|
