| 1.8 |
5.3 |
GO:1901420 |
negative regulation of response to alcohol(GO:1901420) |
| 1.3 |
3.9 |
GO:1903892 |
negative regulation of ATF6-mediated unfolded protein response(GO:1903892) |
| 1.1 |
5.3 |
GO:2000690 |
negative regulation of cardioblast differentiation(GO:0051892) regulation of cardiac muscle cell myoblast differentiation(GO:2000690) negative regulation of cardiac muscle cell myoblast differentiation(GO:2000691) |
| 1.0 |
3.8 |
GO:0018008 |
N-terminal peptidyl-glycine N-myristoylation(GO:0018008) |
| 0.8 |
2.5 |
GO:0032877 |
positive regulation of DNA endoreduplication(GO:0032877) |
| 0.8 |
3.2 |
GO:1904381 |
Golgi apparatus mannose trimming(GO:1904381) |
| 0.8 |
2.3 |
GO:0071931 |
positive regulation of transcription involved in G1/S transition of mitotic cell cycle(GO:0071931) |
| 0.8 |
1.5 |
GO:1905053 |
regulation of base-excision repair(GO:1905051) positive regulation of base-excision repair(GO:1905053) |
| 0.7 |
2.2 |
GO:1904761 |
negative regulation of myofibroblast differentiation(GO:1904761) |
| 0.7 |
2.8 |
GO:1904428 |
negative regulation of tubulin deacetylation(GO:1904428) |
| 0.7 |
2.1 |
GO:0031550 |
positive regulation of brain-derived neurotrophic factor receptor signaling pathway(GO:0031550) |
| 0.7 |
2.1 |
GO:0021503 |
neural fold bending(GO:0021503) |
| 0.7 |
2.7 |
GO:1905205 |
positive regulation of connective tissue replacement(GO:1905205) |
| 0.7 |
2.0 |
GO:0015938 |
coenzyme A catabolic process(GO:0015938) nucleoside bisphosphate catabolic process(GO:0033869) ribonucleoside bisphosphate catabolic process(GO:0034031) purine nucleoside bisphosphate catabolic process(GO:0034034) |
| 0.6 |
1.9 |
GO:0045608 |
negative regulation of auditory receptor cell differentiation(GO:0045608) |
| 0.6 |
1.8 |
GO:1902809 |
regulation of skeletal muscle fiber differentiation(GO:1902809) |
| 0.6 |
2.3 |
GO:0031161 |
phosphatidylinositol catabolic process(GO:0031161) |
| 0.6 |
1.7 |
GO:0046292 |
formaldehyde metabolic process(GO:0046292) |
| 0.6 |
0.6 |
GO:0007113 |
endomitotic cell cycle(GO:0007113) |
| 0.6 |
0.6 |
GO:0033484 |
nitric oxide homeostasis(GO:0033484) |
| 0.6 |
1.7 |
GO:0036048 |
protein demalonylation(GO:0036046) peptidyl-lysine demalonylation(GO:0036047) protein desuccinylation(GO:0036048) peptidyl-lysine desuccinylation(GO:0036049) protein deglutarylation(GO:0061698) peptidyl-lysine deglutarylation(GO:0061699) |
| 0.5 |
2.2 |
GO:0021816 |
extension of a leading process involved in cell motility in cerebral cortex radial glia guided migration(GO:0021816) |
| 0.5 |
1.6 |
GO:0061445 |
endocardial cell fate commitment(GO:0060957) endocardial cushion cell fate commitment(GO:0061445) |
| 0.5 |
0.5 |
GO:0038161 |
prolactin signaling pathway(GO:0038161) |
| 0.5 |
1.6 |
GO:0051793 |
medium-chain fatty acid catabolic process(GO:0051793) |
| 0.5 |
4.2 |
GO:1902231 |
positive regulation of intrinsic apoptotic signaling pathway in response to DNA damage(GO:1902231) |
| 0.5 |
1.6 |
GO:0060599 |
lateral sprouting involved in mammary gland duct morphogenesis(GO:0060599) |
| 0.5 |
2.1 |
GO:1903294 |
regulation of glutamate secretion, neurotransmission(GO:1903294) positive regulation of glutamate secretion, neurotransmission(GO:1903296) |
| 0.5 |
1.5 |
GO:0001188 |
RNA polymerase I transcriptional preinitiation complex assembly(GO:0001188) RNA polymerase I transcriptional preinitiation complex assembly at the promoter for the nuclear large rRNA transcript(GO:0001189) |
| 0.5 |
2.5 |
GO:0048496 |
maintenance of organ identity(GO:0048496) |
| 0.5 |
2.0 |
GO:0007386 |
compartment pattern specification(GO:0007386) |
| 0.5 |
2.9 |
GO:0061687 |
detoxification of inorganic compound(GO:0061687) |
| 0.5 |
6.6 |
GO:0021853 |
cerebral cortex GABAergic interneuron migration(GO:0021853) interneuron migration(GO:1904936) |
| 0.5 |
1.8 |
GO:0021571 |
rhombomere 5 development(GO:0021571) central nervous system segmentation(GO:0035283) brain segmentation(GO:0035284) |
| 0.5 |
1.4 |
GO:0006393 |
termination of mitochondrial transcription(GO:0006393) |
| 0.4 |
1.3 |
GO:0097156 |
fasciculation of motor neuron axon(GO:0097156) |
| 0.4 |
1.3 |
GO:0046603 |
negative regulation of mitotic centrosome separation(GO:0046603) |
| 0.4 |
0.4 |
GO:0070318 |
positive regulation of G0 to G1 transition(GO:0070318) |
| 0.4 |
2.5 |
GO:0006021 |
inositol biosynthetic process(GO:0006021) |
| 0.4 |
2.1 |
GO:0098904 |
regulation of AV node cell action potential(GO:0098904) |
| 0.4 |
2.5 |
GO:0038016 |
insulin receptor internalization(GO:0038016) |
| 0.4 |
5.0 |
GO:0085020 |
protein K6-linked ubiquitination(GO:0085020) |
| 0.4 |
1.2 |
GO:1905072 |
apoptotic process involved in endocardial cushion morphogenesis(GO:0003277) intermediate mesoderm morphogenesis(GO:0048390) intermediate mesoderm formation(GO:0048391) intermediate mesodermal cell differentiation(GO:0048392) regulation of cardiac muscle fiber development(GO:0055018) positive regulation of cardiac muscle fiber development(GO:0055020) bud dilation involved in lung branching(GO:0060503) BMP signaling pathway involved in ureter morphogenesis(GO:0061149) renal system segmentation(GO:0061150) BMP signaling pathway involved in renal system segmentation(GO:0061151) pulmonary artery endothelial tube morphogenesis(GO:0061155) regulation of transcription from RNA polymerase II promoter involved in mesonephros development(GO:0061216) BMP signaling pathway involved in nephric duct formation(GO:0071893) negative regulation of branch elongation involved in ureteric bud branching(GO:0072096) negative regulation of branch elongation involved in ureteric bud branching by BMP signaling pathway(GO:0072097) anterior/posterior pattern specification involved in ureteric bud development(GO:0072099) specification of ureteric bud anterior/posterior symmetry(GO:0072100) specification of ureteric bud anterior/posterior symmetry by BMP signaling pathway(GO:0072101) ureter epithelial cell differentiation(GO:0072192) negative regulation of mesenchymal cell proliferation involved in ureter development(GO:0072200) positive regulation of cell proliferation involved in outflow tract morphogenesis(GO:1901964) cardiac jelly development(GO:1905072) regulation of metanephric S-shaped body morphogenesis(GO:2000004) negative regulation of metanephric S-shaped body morphogenesis(GO:2000005) regulation of metanephric comma-shaped body morphogenesis(GO:2000006) negative regulation of metanephric comma-shaped body morphogenesis(GO:2000007) |
| 0.4 |
1.2 |
GO:0001579 |
medium-chain fatty acid transport(GO:0001579) |
| 0.4 |
1.6 |
GO:0006169 |
adenosine salvage(GO:0006169) dATP biosynthetic process(GO:0006175) |
| 0.4 |
2.8 |
GO:0018103 |
protein C-linked glycosylation(GO:0018103) peptidyl-tryptophan modification(GO:0018211) protein C-linked glycosylation via tryptophan(GO:0018317) protein C-linked glycosylation via 2'-alpha-mannosyl-L-tryptophan(GO:0018406) |
| 0.4 |
1.2 |
GO:0046725 |
negative regulation by virus of viral protein levels in host cell(GO:0046725) negative regulation of metanephric nephron tubule epithelial cell differentiation(GO:0072308) |
| 0.4 |
2.7 |
GO:0033132 |
negative regulation of glucokinase activity(GO:0033132) negative regulation of hexokinase activity(GO:1903300) |
| 0.4 |
1.9 |
GO:0010621 |
negative regulation of transcription by transcription factor localization(GO:0010621) |
| 0.4 |
2.6 |
GO:0098706 |
ferric iron import into cell(GO:0097461) ferric iron import across plasma membrane(GO:0098706) |
| 0.4 |
9.4 |
GO:1902894 |
negative regulation of pri-miRNA transcription from RNA polymerase II promoter(GO:1902894) |
| 0.4 |
0.4 |
GO:0010693 |
negative regulation of alkaline phosphatase activity(GO:0010693) |
| 0.4 |
1.1 |
GO:0043000 |
Golgi to plasma membrane CFTR protein transport(GO:0043000) |
| 0.4 |
2.9 |
GO:0097350 |
neutrophil clearance(GO:0097350) |
| 0.4 |
1.1 |
GO:0060152 |
peroxisome localization(GO:0060151) microtubule-based peroxisome localization(GO:0060152) |
| 0.4 |
2.5 |
GO:0006269 |
DNA replication, synthesis of RNA primer(GO:0006269) |
| 0.4 |
0.7 |
GO:0040009 |
regulation of growth rate(GO:0040009) |
| 0.3 |
1.4 |
GO:0061343 |
cell adhesion involved in heart morphogenesis(GO:0061343) |
| 0.3 |
1.0 |
GO:1904868 |
telomerase catalytic core complex assembly(GO:1904868) regulation of telomerase catalytic core complex assembly(GO:1904882) positive regulation of telomerase catalytic core complex assembly(GO:1904884) |
| 0.3 |
0.7 |
GO:0046086 |
adenosine biosynthetic process(GO:0046086) |
| 0.3 |
1.0 |
GO:0042662 |
negative regulation of mesodermal cell fate specification(GO:0042662) |
| 0.3 |
1.0 |
GO:0035026 |
leading edge cell differentiation(GO:0035026) |
| 0.3 |
2.0 |
GO:0006574 |
valine catabolic process(GO:0006574) |
| 0.3 |
1.4 |
GO:0006663 |
platelet activating factor biosynthetic process(GO:0006663) |
| 0.3 |
2.0 |
GO:0045409 |
negative regulation of interleukin-6 biosynthetic process(GO:0045409) |
| 0.3 |
1.0 |
GO:0006499 |
N-terminal protein myristoylation(GO:0006499) |
| 0.3 |
1.0 |
GO:1902683 |
regulation of receptor localization to synapse(GO:1902683) |
| 0.3 |
1.3 |
GO:0045607 |
regulation of auditory receptor cell differentiation(GO:0045607) regulation of mechanoreceptor differentiation(GO:0045631) regulation of inner ear receptor cell differentiation(GO:2000980) |
| 0.3 |
1.7 |
GO:0060800 |
regulation of cell differentiation involved in embryonic placenta development(GO:0060800) |
| 0.3 |
2.0 |
GO:0006535 |
cysteine biosynthetic process from serine(GO:0006535) |
| 0.3 |
1.0 |
GO:0006272 |
leading strand elongation(GO:0006272) |
| 0.3 |
1.0 |
GO:0036451 |
cap mRNA methylation(GO:0036451) |
| 0.3 |
2.0 |
GO:0060214 |
endocardium formation(GO:0060214) |
| 0.3 |
1.6 |
GO:0090118 |
receptor-mediated endocytosis of low-density lipoprotein particle involved in cholesterol transport(GO:0090118) |
| 0.3 |
1.3 |
GO:2000393 |
negative regulation of lamellipodium morphogenesis(GO:2000393) |
| 0.3 |
1.3 |
GO:0005986 |
sucrose biosynthetic process(GO:0005986) |
| 0.3 |
1.0 |
GO:0090271 |
positive regulation of fibroblast growth factor production(GO:0090271) |
| 0.3 |
1.0 |
GO:0009085 |
lysine biosynthetic process(GO:0009085) lysine biosynthetic process via aminoadipic acid(GO:0019878) |
| 0.3 |
1.3 |
GO:0006669 |
sphinganine-1-phosphate biosynthetic process(GO:0006669) |
| 0.3 |
1.9 |
GO:1904179 |
regulation of adipose tissue development(GO:1904177) positive regulation of adipose tissue development(GO:1904179) |
| 0.3 |
0.3 |
GO:0051582 |
positive regulation of neurotransmitter uptake(GO:0051582) positive regulation of dopamine uptake involved in synaptic transmission(GO:0051586) positive regulation of catecholamine uptake involved in synaptic transmission(GO:0051944) |
| 0.3 |
1.5 |
GO:0018076 |
N-terminal peptidyl-lysine acetylation(GO:0018076) |
| 0.3 |
2.4 |
GO:0060398 |
regulation of growth hormone receptor signaling pathway(GO:0060398) |
| 0.3 |
1.2 |
GO:0031064 |
negative regulation of histone deacetylation(GO:0031064) |
| 0.3 |
0.9 |
GO:0007309 |
oocyte construction(GO:0007308) oocyte axis specification(GO:0007309) oocyte anterior/posterior axis specification(GO:0007314) pole plasm assembly(GO:0007315) maternal determination of anterior/posterior axis, embryo(GO:0008358) P granule organization(GO:0030719) |
| 0.3 |
1.5 |
GO:1901093 |
regulation of protein tetramerization(GO:1901090) negative regulation of protein tetramerization(GO:1901091) regulation of protein homotetramerization(GO:1901093) negative regulation of protein homotetramerization(GO:1901094) |
| 0.3 |
0.9 |
GO:0009197 |
dUDP biosynthetic process(GO:0006227) dTDP biosynthetic process(GO:0006233) pyrimidine nucleoside diphosphate biosynthetic process(GO:0009139) pyrimidine deoxyribonucleoside diphosphate metabolic process(GO:0009196) pyrimidine deoxyribonucleoside diphosphate biosynthetic process(GO:0009197) dTDP metabolic process(GO:0046072) dUDP metabolic process(GO:0046077) |
| 0.3 |
2.4 |
GO:0003172 |
primary heart field specification(GO:0003138) sinoatrial valve development(GO:0003172) sinoatrial valve morphogenesis(GO:0003185) |
| 0.3 |
0.3 |
GO:1905006 |
negative regulation of epithelial to mesenchymal transition involved in endocardial cushion formation(GO:1905006) |
| 0.3 |
2.7 |
GO:1902109 |
negative regulation of mitochondrial membrane permeability involved in apoptotic process(GO:1902109) |
| 0.3 |
1.8 |
GO:0032483 |
regulation of Rab protein signal transduction(GO:0032483) |
| 0.3 |
0.9 |
GO:2001016 |
positive regulation of skeletal muscle cell differentiation(GO:2001016) |
| 0.3 |
1.2 |
GO:1990166 |
protein localization to site of double-strand break(GO:1990166) |
| 0.3 |
0.9 |
GO:0072720 |
response to dithiothreitol(GO:0072720) |
| 0.3 |
1.7 |
GO:0009644 |
response to high light intensity(GO:0009644) |
| 0.3 |
0.9 |
GO:0010746 |
regulation of plasma membrane long-chain fatty acid transport(GO:0010746) negative regulation of plasma membrane long-chain fatty acid transport(GO:0010748) |
| 0.3 |
2.0 |
GO:0097428 |
protein maturation by iron-sulfur cluster transfer(GO:0097428) |
| 0.3 |
2.8 |
GO:0098881 |
exocytic insertion of neurotransmitter receptor to plasma membrane(GO:0098881) exocytic insertion of neurotransmitter receptor to postsynaptic membrane(GO:0098967) |
| 0.3 |
0.8 |
GO:2000740 |
amniotic stem cell differentiation(GO:0097086) negative regulation of dense core granule biogenesis(GO:2000706) negative regulation of mesenchymal stem cell differentiation(GO:2000740) regulation of amniotic stem cell differentiation(GO:2000797) negative regulation of amniotic stem cell differentiation(GO:2000798) |
| 0.3 |
6.1 |
GO:0002115 |
store-operated calcium entry(GO:0002115) |
| 0.3 |
0.8 |
GO:0072019 |
nitric oxide transport(GO:0030185) proximal convoluted tubule development(GO:0072019) metanephric proximal convoluted tubule development(GO:0072229) |
| 0.3 |
0.8 |
GO:1990519 |
pyrimidine nucleotide transport(GO:0006864) mitochondrial pyrimidine nucleotide import(GO:1990519) |
| 0.3 |
0.5 |
GO:0036292 |
DNA rewinding(GO:0036292) |
| 0.3 |
1.1 |
GO:1904980 |
positive regulation of endosome organization(GO:1904980) |
| 0.3 |
1.1 |
GO:0008078 |
mesodermal cell migration(GO:0008078) |
| 0.3 |
0.5 |
GO:1902256 |
apoptotic process involved in outflow tract morphogenesis(GO:0003275) regulation of apoptotic process involved in outflow tract morphogenesis(GO:1902256) |
| 0.3 |
1.6 |
GO:0043987 |
histone H3-S10 phosphorylation(GO:0043987) |
| 0.3 |
0.8 |
GO:0070124 |
mitochondrial translational initiation(GO:0070124) |
| 0.3 |
0.3 |
GO:1903383 |
neuron intrinsic apoptotic signaling pathway in response to hydrogen peroxide(GO:0036482) positive regulation of mitochondrial electron transport, NADH to ubiquinone(GO:1902958) regulation of hydrogen peroxide-induced neuron intrinsic apoptotic signaling pathway(GO:1903383) negative regulation of hydrogen peroxide-induced neuron intrinsic apoptotic signaling pathway(GO:1903384) |
| 0.3 |
0.5 |
GO:0034165 |
positive regulation of toll-like receptor 9 signaling pathway(GO:0034165) |
| 0.3 |
1.6 |
GO:0045629 |
negative regulation of T-helper 2 cell differentiation(GO:0045629) |
| 0.3 |
0.5 |
GO:0090234 |
regulation of kinetochore assembly(GO:0090234) |
| 0.3 |
0.8 |
GO:0048560 |
establishment of anatomical structure orientation(GO:0048560) |
| 0.3 |
1.0 |
GO:0033306 |
phytol metabolic process(GO:0033306) fatty alcohol metabolic process(GO:1903173) |
| 0.3 |
1.8 |
GO:0086017 |
Purkinje myocyte action potential(GO:0086017) membrane depolarization during Purkinje myocyte cell action potential(GO:0086047) |
| 0.3 |
4.6 |
GO:0070986 |
left/right axis specification(GO:0070986) |
| 0.3 |
2.3 |
GO:0000733 |
DNA strand renaturation(GO:0000733) |
| 0.3 |
1.3 |
GO:0070562 |
regulation of vitamin D receptor signaling pathway(GO:0070562) |
| 0.3 |
1.8 |
GO:0016584 |
nucleosome positioning(GO:0016584) |
| 0.3 |
0.8 |
GO:0038162 |
erythropoietin-mediated signaling pathway(GO:0038162) |
| 0.3 |
0.8 |
GO:0018312 |
peptidyl-serine ADP-ribosylation(GO:0018312) |
| 0.3 |
0.8 |
GO:0033386 |
geranylgeranyl diphosphate metabolic process(GO:0033385) geranylgeranyl diphosphate biosynthetic process(GO:0033386) |
| 0.3 |
1.3 |
GO:0071163 |
DNA replication preinitiation complex assembly(GO:0071163) |
| 0.3 |
4.3 |
GO:0001574 |
ganglioside biosynthetic process(GO:0001574) |
| 0.3 |
1.8 |
GO:0097114 |
NMDA glutamate receptor clustering(GO:0097114) |
| 0.2 |
0.7 |
GO:1901069 |
guanosine-containing compound catabolic process(GO:1901069) |
| 0.2 |
1.0 |
GO:2000983 |
regulation of ATP citrate synthase activity(GO:2000983) negative regulation of ATP citrate synthase activity(GO:2000984) |
| 0.2 |
8.9 |
GO:0060065 |
uterus development(GO:0060065) |
| 0.2 |
1.0 |
GO:0032792 |
negative regulation of CREB transcription factor activity(GO:0032792) |
| 0.2 |
1.7 |
GO:0043461 |
proton-transporting ATP synthase complex assembly(GO:0043461) proton-transporting ATP synthase complex biogenesis(GO:0070272) |
| 0.2 |
0.5 |
GO:0060823 |
canonical Wnt signaling pathway involved in neural plate anterior/posterior pattern formation(GO:0060823) |
| 0.2 |
1.2 |
GO:0031291 |
Ran protein signal transduction(GO:0031291) |
| 0.2 |
0.7 |
GO:0007225 |
patched ligand maturation(GO:0007225) signal maturation(GO:0035638) |
| 0.2 |
0.7 |
GO:0021718 |
superior olivary nucleus development(GO:0021718) superior olivary nucleus maturation(GO:0021722) |
| 0.2 |
0.7 |
GO:0071988 |
regulation of spindle elongation(GO:0032887) regulation of mitotic spindle elongation(GO:0032888) anastral spindle assembly(GO:0055048) protein localization to spindle pole body(GO:0071988) regulation of protein localization to spindle pole body(GO:1902363) positive regulation of protein localization to spindle pole body(GO:1902365) positive regulation of mitotic spindle elongation(GO:1902846) |
| 0.2 |
3.6 |
GO:1904776 |
regulation of protein localization to cell cortex(GO:1904776) positive regulation of protein localization to cell cortex(GO:1904778) |
| 0.2 |
0.2 |
GO:2000646 |
positive regulation of receptor catabolic process(GO:2000646) |
| 0.2 |
0.5 |
GO:0036123 |
histone H3-K9 dimethylation(GO:0036123) |
| 0.2 |
1.4 |
GO:0033274 |
response to vitamin B2(GO:0033274) heterochromatin maintenance(GO:0070829) |
| 0.2 |
0.5 |
GO:0070495 |
regulation of thrombin receptor signaling pathway(GO:0070494) negative regulation of thrombin receptor signaling pathway(GO:0070495) |
| 0.2 |
0.2 |
GO:0060268 |
negative regulation of respiratory burst(GO:0060268) |
| 0.2 |
0.7 |
GO:1904582 |
regulation of intracellular mRNA localization(GO:1904580) positive regulation of intracellular mRNA localization(GO:1904582) |
| 0.2 |
0.2 |
GO:0072237 |
metanephric proximal tubule development(GO:0072237) |
| 0.2 |
2.1 |
GO:0038026 |
reelin-mediated signaling pathway(GO:0038026) |
| 0.2 |
1.2 |
GO:0019075 |
virus maturation(GO:0019075) |
| 0.2 |
1.4 |
GO:0006543 |
glutamine catabolic process(GO:0006543) |
| 0.2 |
0.7 |
GO:0043396 |
corticotropin-releasing hormone secretion(GO:0043396) regulation of corticotropin-releasing hormone secretion(GO:0043397) |
| 0.2 |
0.9 |
GO:1903758 |
regulation of transcription from RNA polymerase II promoter by histone modification(GO:1903756) negative regulation of transcription from RNA polymerase II promoter by histone modification(GO:1903758) |
| 0.2 |
1.6 |
GO:0016139 |
glycoside catabolic process(GO:0016139) |
| 0.2 |
0.7 |
GO:0046452 |
dihydrofolate metabolic process(GO:0046452) |
| 0.2 |
0.9 |
GO:0060938 |
cardiac fibroblast cell differentiation(GO:0060935) cardiac fibroblast cell development(GO:0060936) epicardium-derived cardiac fibroblast cell differentiation(GO:0060938) epicardium-derived cardiac fibroblast cell development(GO:0060939) |
| 0.2 |
0.9 |
GO:0051866 |
general adaptation syndrome(GO:0051866) |
| 0.2 |
0.7 |
GO:0006059 |
hexitol metabolic process(GO:0006059) |
| 0.2 |
1.8 |
GO:0032803 |
regulation of low-density lipoprotein particle receptor catabolic process(GO:0032803) |
| 0.2 |
2.7 |
GO:0098535 |
de novo centriole assembly(GO:0098535) |
| 0.2 |
1.5 |
GO:0033591 |
response to L-ascorbic acid(GO:0033591) |
| 0.2 |
1.3 |
GO:0019509 |
L-methionine biosynthetic process from methylthioadenosine(GO:0019509) |
| 0.2 |
1.7 |
GO:0060591 |
chondroblast differentiation(GO:0060591) |
| 0.2 |
0.7 |
GO:0043012 |
regulation of fusion of sperm to egg plasma membrane(GO:0043012) |
| 0.2 |
0.6 |
GO:0098746 |
fast, calcium ion-dependent exocytosis of neurotransmitter(GO:0098746) |
| 0.2 |
0.4 |
GO:1903059 |
regulation of protein lipidation(GO:1903059) |
| 0.2 |
0.6 |
GO:0051877 |
pigment granule aggregation in cell center(GO:0051877) |
| 0.2 |
0.2 |
GO:0090149 |
mitochondrial membrane fission(GO:0090149) |
| 0.2 |
0.8 |
GO:0007228 |
positive regulation of hh target transcription factor activity(GO:0007228) |
| 0.2 |
0.4 |
GO:0072194 |
kidney smooth muscle tissue development(GO:0072194) |
| 0.2 |
0.6 |
GO:1990022 |
RNA polymerase II complex import to nucleus(GO:0044376) RNA polymerase III complex localization to nucleus(GO:1990022) |
| 0.2 |
0.2 |
GO:0039689 |
negative stranded viral RNA replication(GO:0039689) multi-organism biosynthetic process(GO:0044034) |
| 0.2 |
0.6 |
GO:0044205 |
'de novo' UMP biosynthetic process(GO:0044205) |
| 0.2 |
0.6 |
GO:0060382 |
regulation of DNA strand elongation(GO:0060382) |
| 0.2 |
0.6 |
GO:0003186 |
tricuspid valve morphogenesis(GO:0003186) |
| 0.2 |
0.6 |
GO:0061300 |
cerebellum vasculature development(GO:0061300) |
| 0.2 |
0.8 |
GO:0015910 |
peroxisomal long-chain fatty acid import(GO:0015910) |
| 0.2 |
0.8 |
GO:0070837 |
dehydroascorbic acid transport(GO:0070837) |
| 0.2 |
0.2 |
GO:0002036 |
regulation of L-glutamate transport(GO:0002036) |
| 0.2 |
0.4 |
GO:0070459 |
prolactin secretion(GO:0070459) |
| 0.2 |
0.6 |
GO:0002538 |
arachidonic acid metabolite production involved in inflammatory response(GO:0002538) leukotriene production involved in inflammatory response(GO:0002540) |
| 0.2 |
2.6 |
GO:0043983 |
histone H4-K12 acetylation(GO:0043983) |
| 0.2 |
0.2 |
GO:1900063 |
regulation of peroxisome organization(GO:1900063) |
| 0.2 |
0.6 |
GO:0006097 |
glyoxylate cycle(GO:0006097) |
| 0.2 |
1.2 |
GO:0010032 |
meiotic chromosome condensation(GO:0010032) |
| 0.2 |
2.0 |
GO:0005981 |
regulation of glycogen catabolic process(GO:0005981) |
| 0.2 |
1.0 |
GO:0038108 |
negative regulation of appetite by leptin-mediated signaling pathway(GO:0038108) |
| 0.2 |
0.6 |
GO:0044771 |
meiotic cell cycle phase transition(GO:0044771) regulation of meiotic cell cycle phase transition(GO:1901993) negative regulation of meiotic cell cycle phase transition(GO:1901994) |
| 0.2 |
0.2 |
GO:0071409 |
cellular response to cycloheximide(GO:0071409) |
| 0.2 |
0.4 |
GO:0072144 |
renal interstitial fibroblast development(GO:0072141) mesangial cell development(GO:0072143) glomerular mesangial cell development(GO:0072144) |
| 0.2 |
1.8 |
GO:0046836 |
glycolipid transport(GO:0046836) |
| 0.2 |
1.4 |
GO:0036484 |
trunk segmentation(GO:0035290) trunk neural crest cell migration(GO:0036484) ventral trunk neural crest cell migration(GO:0036486) |
| 0.2 |
0.8 |
GO:0070213 |
protein auto-ADP-ribosylation(GO:0070213) |
| 0.2 |
0.6 |
GO:1903691 |
positive regulation of wound healing, spreading of epidermal cells(GO:1903691) |
| 0.2 |
1.6 |
GO:0034316 |
negative regulation of Arp2/3 complex-mediated actin nucleation(GO:0034316) |
| 0.2 |
0.4 |
GO:1901979 |
regulation of inward rectifier potassium channel activity(GO:1901979) |
| 0.2 |
1.0 |
GO:1902361 |
mitochondrial pyruvate transport(GO:0006850) mitochondrial pyruvate transmembrane transport(GO:1902361) |
| 0.2 |
1.4 |
GO:0075071 |
autophagy of host cells involved in interaction with symbiont(GO:0075044) autophagy involved in symbiotic interaction(GO:0075071) |
| 0.2 |
4.1 |
GO:0070914 |
UV-damage excision repair(GO:0070914) |
| 0.2 |
0.6 |
GO:0006498 |
N-terminal protein lipidation(GO:0006498) |
| 0.2 |
0.6 |
GO:0097274 |
urea homeostasis(GO:0097274) |
| 0.2 |
1.7 |
GO:0070236 |
negative regulation of activation-induced cell death of T cells(GO:0070236) |
| 0.2 |
0.6 |
GO:0010760 |
negative regulation of macrophage chemotaxis(GO:0010760) |
| 0.2 |
0.2 |
GO:0042231 |
interleukin-13 biosynthetic process(GO:0042231) |
| 0.2 |
0.6 |
GO:0060168 |
positive regulation of adenosine receptor signaling pathway(GO:0060168) |
| 0.2 |
1.3 |
GO:0010726 |
positive regulation of hydrogen peroxide metabolic process(GO:0010726) |
| 0.2 |
2.1 |
GO:0060136 |
embryonic process involved in female pregnancy(GO:0060136) |
| 0.2 |
1.3 |
GO:0098728 |
germ-line stem cell division(GO:0042078) male germ-line stem cell asymmetric division(GO:0048133) germline stem cell asymmetric division(GO:0098728) |
| 0.2 |
1.1 |
GO:0035063 |
nuclear speck organization(GO:0035063) |
| 0.2 |
0.9 |
GO:0010637 |
negative regulation of mitochondrial fusion(GO:0010637) |
| 0.2 |
1.9 |
GO:1901525 |
negative regulation of macromitophagy(GO:1901525) |
| 0.2 |
2.1 |
GO:2000576 |
positive regulation of microtubule motor activity(GO:2000576) |
| 0.2 |
0.4 |
GO:0036091 |
positive regulation of transcription from RNA polymerase II promoter in response to oxidative stress(GO:0036091) |
| 0.2 |
1.8 |
GO:0098908 |
regulation of neuronal action potential(GO:0098908) |
| 0.2 |
0.9 |
GO:0046056 |
dADP metabolic process(GO:0046056) |
| 0.2 |
3.8 |
GO:0033540 |
fatty acid beta-oxidation using acyl-CoA oxidase(GO:0033540) |
| 0.2 |
1.5 |
GO:0071492 |
cellular response to UV-A(GO:0071492) |
| 0.2 |
0.2 |
GO:0051097 |
negative regulation of helicase activity(GO:0051097) |
| 0.2 |
0.4 |
GO:0031536 |
positive regulation of exit from mitosis(GO:0031536) |
| 0.2 |
3.8 |
GO:0036148 |
phosphatidylglycerol acyl-chain remodeling(GO:0036148) |
| 0.2 |
0.5 |
GO:0090365 |
regulation of mRNA modification(GO:0090365) |
| 0.2 |
1.6 |
GO:0010265 |
SCF complex assembly(GO:0010265) |
| 0.2 |
0.5 |
GO:0060448 |
dichotomous subdivision of terminal units involved in lung branching(GO:0060448) |
| 0.2 |
0.7 |
GO:1900737 |
regulation of proteinase activated receptor activity(GO:1900276) negative regulation of phospholipase C-activating G-protein coupled receptor signaling pathway(GO:1900737) |
| 0.2 |
0.9 |
GO:0006701 |
progesterone biosynthetic process(GO:0006701) |
| 0.2 |
2.8 |
GO:0035269 |
protein O-linked mannosylation(GO:0035269) |
| 0.2 |
0.5 |
GO:0098759 |
response to interleukin-8(GO:0098758) cellular response to interleukin-8(GO:0098759) |
| 0.2 |
1.4 |
GO:0001957 |
intramembranous ossification(GO:0001957) direct ossification(GO:0036072) |
| 0.2 |
0.9 |
GO:0046963 |
3'-phosphoadenosine 5'-phosphosulfate transport(GO:0046963) 3'-phospho-5'-adenylyl sulfate transmembrane transport(GO:1902559) |
| 0.2 |
0.7 |
GO:0061086 |
negative regulation of histone H3-K27 methylation(GO:0061086) |
| 0.2 |
0.5 |
GO:2000562 |
negative regulation of CD4-positive, alpha-beta T cell proliferation(GO:2000562) |
| 0.2 |
0.5 |
GO:0042938 |
dipeptide transport(GO:0042938) |
| 0.2 |
0.5 |
GO:0002415 |
immunoglobulin transcytosis in epithelial cells mediated by polymeric immunoglobulin receptor(GO:0002415) |
| 0.2 |
0.2 |
GO:0006668 |
sphinganine-1-phosphate metabolic process(GO:0006668) |
| 0.2 |
1.0 |
GO:0051697 |
protein delipidation(GO:0051697) |
| 0.2 |
0.2 |
GO:0007231 |
osmosensory signaling pathway(GO:0007231) |
| 0.2 |
0.2 |
GO:0097676 |
histone H3-K36 dimethylation(GO:0097676) |
| 0.2 |
1.0 |
GO:0046092 |
deoxycytidine metabolic process(GO:0046092) |
| 0.2 |
0.2 |
GO:0051126 |
negative regulation of actin nucleation(GO:0051126) |
| 0.2 |
0.5 |
GO:1902309 |
negative regulation of peptidyl-serine dephosphorylation(GO:1902309) |
| 0.2 |
0.3 |
GO:1990535 |
neuron projection maintenance(GO:1990535) |
| 0.2 |
0.3 |
GO:0035494 |
SNARE complex disassembly(GO:0035494) |
| 0.2 |
0.7 |
GO:0060708 |
spongiotrophoblast differentiation(GO:0060708) |
| 0.2 |
0.7 |
GO:0060296 |
regulation of cilium movement involved in cell motility(GO:0060295) regulation of cilium beat frequency involved in ciliary motility(GO:0060296) regulation of cilium-dependent cell motility(GO:1902019) |
| 0.2 |
2.2 |
GO:0032025 |
response to cobalt ion(GO:0032025) |
| 0.2 |
1.7 |
GO:0006657 |
CDP-choline pathway(GO:0006657) |
| 0.2 |
1.8 |
GO:0031936 |
negative regulation of chromatin silencing(GO:0031936) |
| 0.2 |
0.8 |
GO:0093001 |
glycolytic process through glucose-1-phosphate(GO:0061622) glycolysis from storage polysaccharide through glucose-1-phosphate(GO:0093001) |
| 0.2 |
2.0 |
GO:0042492 |
gamma-delta T cell differentiation(GO:0042492) |
| 0.2 |
0.2 |
GO:0060596 |
mammary gland formation(GO:0060592) mammary placode formation(GO:0060596) |
| 0.2 |
2.8 |
GO:0006450 |
regulation of translational fidelity(GO:0006450) |
| 0.2 |
0.7 |
GO:0051562 |
negative regulation of mitochondrial calcium ion concentration(GO:0051562) |
| 0.2 |
0.5 |
GO:0042727 |
flavin-containing compound biosynthetic process(GO:0042727) |
| 0.2 |
0.6 |
GO:0048627 |
myoblast development(GO:0048627) |
| 0.2 |
3.7 |
GO:0016254 |
preassembly of GPI anchor in ER membrane(GO:0016254) |
| 0.2 |
1.8 |
GO:1902414 |
protein localization to cell junction(GO:1902414) |
| 0.2 |
2.7 |
GO:0070389 |
chaperone cofactor-dependent protein refolding(GO:0070389) |
| 0.2 |
0.3 |
GO:0098971 |
anterograde dendritic transport of neurotransmitter receptor complex(GO:0098971) |
| 0.2 |
2.4 |
GO:2000507 |
positive regulation of energy homeostasis(GO:2000507) |
| 0.2 |
0.8 |
GO:0014886 |
transition between slow and fast fiber(GO:0014886) |
| 0.2 |
0.8 |
GO:0044565 |
dendritic cell proliferation(GO:0044565) |
| 0.2 |
2.7 |
GO:0060736 |
prostate gland growth(GO:0060736) |
| 0.2 |
0.6 |
GO:0006083 |
acetate metabolic process(GO:0006083) |
| 0.2 |
1.3 |
GO:0050859 |
negative regulation of B cell receptor signaling pathway(GO:0050859) |
| 0.2 |
0.5 |
GO:0046081 |
dUTP metabolic process(GO:0046080) dUTP catabolic process(GO:0046081) |
| 0.2 |
1.1 |
GO:1900112 |
regulation of histone H3-K9 trimethylation(GO:1900112) |
| 0.2 |
1.3 |
GO:0016557 |
peroxisome membrane biogenesis(GO:0016557) |
| 0.2 |
0.5 |
GO:0048633 |
positive regulation of skeletal muscle tissue growth(GO:0048633) |
| 0.2 |
0.2 |
GO:0006113 |
fermentation(GO:0006113) regulation of fermentation(GO:0043465) |
| 0.2 |
0.3 |
GO:0016999 |
antibiotic metabolic process(GO:0016999) |
| 0.2 |
7.8 |
GO:0035735 |
intraciliary transport involved in cilium morphogenesis(GO:0035735) |
| 0.2 |
0.5 |
GO:0070358 |
actin polymerization-dependent cell motility(GO:0070358) |
| 0.2 |
0.8 |
GO:0046167 |
glycerol-3-phosphate biosynthetic process(GO:0046167) |
| 0.2 |
1.1 |
GO:0003215 |
cardiac right ventricle morphogenesis(GO:0003215) |
| 0.2 |
0.3 |
GO:0030950 |
establishment or maintenance of actin cytoskeleton polarity(GO:0030950) |
| 0.2 |
0.2 |
GO:0072425 |
signal transduction involved in G2 DNA damage checkpoint(GO:0072425) signal transduction involved in mitotic G2 DNA damage checkpoint(GO:0072434) |
| 0.2 |
4.1 |
GO:1901663 |
ubiquinone biosynthetic process(GO:0006744) quinone biosynthetic process(GO:1901663) |
| 0.2 |
1.7 |
GO:0048739 |
cardiac muscle fiber development(GO:0048739) |
| 0.2 |
0.5 |
GO:0009258 |
10-formyltetrahydrofolate catabolic process(GO:0009258) |
| 0.2 |
0.5 |
GO:0051228 |
mitotic spindle disassembly(GO:0051228) spindle disassembly(GO:0051230) |
| 0.2 |
0.5 |
GO:0002023 |
reduction of food intake in response to dietary excess(GO:0002023) |
| 0.2 |
4.4 |
GO:0015838 |
amino-acid betaine transport(GO:0015838) |
| 0.2 |
0.5 |
GO:0042412 |
taurine biosynthetic process(GO:0042412) |
| 0.2 |
2.4 |
GO:1902373 |
negative regulation of mRNA catabolic process(GO:1902373) |
| 0.2 |
0.8 |
GO:0098838 |
reduced folate transmembrane transport(GO:0098838) |
| 0.2 |
0.5 |
GO:0036333 |
hepatocyte homeostasis(GO:0036333) response to tetrachloromethane(GO:1904772) |
| 0.1 |
0.6 |
GO:0002188 |
translation reinitiation(GO:0002188) |
| 0.1 |
1.8 |
GO:0051096 |
regulation of helicase activity(GO:0051095) positive regulation of helicase activity(GO:0051096) |
| 0.1 |
3.7 |
GO:0007250 |
activation of NF-kappaB-inducing kinase activity(GO:0007250) |
| 0.1 |
0.4 |
GO:1900195 |
positive regulation of oocyte maturation(GO:1900195) |
| 0.1 |
1.3 |
GO:2000371 |
regulation of DNA topoisomerase (ATP-hydrolyzing) activity(GO:2000371) positive regulation of DNA topoisomerase (ATP-hydrolyzing) activity(GO:2000373) |
| 0.1 |
1.0 |
GO:0035973 |
aggrephagy(GO:0035973) |
| 0.1 |
0.6 |
GO:0060849 |
radial pattern formation(GO:0009956) regulation of transcription involved in lymphatic endothelial cell fate commitment(GO:0060849) |
| 0.1 |
0.4 |
GO:1903937 |
response to acrylamide(GO:1903937) |
| 0.1 |
0.7 |
GO:0019464 |
glycine catabolic process(GO:0006546) glycine decarboxylation via glycine cleavage system(GO:0019464) |
| 0.1 |
0.4 |
GO:0030327 |
prenylated protein catabolic process(GO:0030327) |
| 0.1 |
0.4 |
GO:0060032 |
notochord regression(GO:0060032) |
| 0.1 |
0.4 |
GO:0060689 |
cell differentiation involved in salivary gland development(GO:0060689) |
| 0.1 |
2.6 |
GO:0031115 |
negative regulation of microtubule polymerization(GO:0031115) |
| 0.1 |
0.3 |
GO:0090035 |
regulation of chaperone-mediated protein complex assembly(GO:0090034) positive regulation of chaperone-mediated protein complex assembly(GO:0090035) |
| 0.1 |
1.6 |
GO:0060613 |
fat pad development(GO:0060613) |
| 0.1 |
0.6 |
GO:0001839 |
neural plate morphogenesis(GO:0001839) |
| 0.1 |
0.4 |
GO:0042989 |
sequestering of actin monomers(GO:0042989) |
| 0.1 |
0.6 |
GO:1904154 |
positive regulation of retrograde protein transport, ER to cytosol(GO:1904154) |
| 0.1 |
0.3 |
GO:0031547 |
brain-derived neurotrophic factor receptor signaling pathway(GO:0031547) |
| 0.1 |
1.2 |
GO:0060267 |
positive regulation of respiratory burst(GO:0060267) |
| 0.1 |
0.4 |
GO:0043973 |
histone H3-K4 acetylation(GO:0043973) |
| 0.1 |
1.0 |
GO:1900262 |
regulation of DNA-directed DNA polymerase activity(GO:1900262) positive regulation of DNA-directed DNA polymerase activity(GO:1900264) |
| 0.1 |
0.6 |
GO:0070221 |
sulfide oxidation(GO:0019418) sulfide oxidation, using sulfide:quinone oxidoreductase(GO:0070221) |
| 0.1 |
0.1 |
GO:0090230 |
regulation of centromere complex assembly(GO:0090230) |
| 0.1 |
0.1 |
GO:0034759 |
regulation of iron ion transport(GO:0034756) regulation of iron ion transmembrane transport(GO:0034759) response to iron ion starvation(GO:1990641) |
| 0.1 |
0.6 |
GO:0030037 |
actin filament reorganization involved in cell cycle(GO:0030037) |
| 0.1 |
2.8 |
GO:0072662 |
protein targeting to peroxisome(GO:0006625) protein localization to peroxisome(GO:0072662) establishment of protein localization to peroxisome(GO:0072663) |
| 0.1 |
1.1 |
GO:0021678 |
third ventricle development(GO:0021678) |
| 0.1 |
0.6 |
GO:0009405 |
pathogenesis(GO:0009405) |
| 0.1 |
1.1 |
GO:0006398 |
mRNA 3'-end processing by stem-loop binding and cleavage(GO:0006398) |
| 0.1 |
0.1 |
GO:0036510 |
trimming of terminal mannose on C branch(GO:0036510) |
| 0.1 |
0.3 |
GO:0003150 |
muscular septum morphogenesis(GO:0003150) |
| 0.1 |
0.8 |
GO:0006432 |
phenylalanyl-tRNA aminoacylation(GO:0006432) |
| 0.1 |
0.1 |
GO:1904386 |
response to thyroxine(GO:0097068) response to L-phenylalanine derivative(GO:1904386) |
| 0.1 |
0.4 |
GO:0070317 |
negative regulation of G0 to G1 transition(GO:0070317) |
| 0.1 |
1.1 |
GO:0035021 |
negative regulation of Rac protein signal transduction(GO:0035021) |
| 0.1 |
0.6 |
GO:0034552 |
respiratory chain complex II assembly(GO:0034552) mitochondrial respiratory chain complex II assembly(GO:0034553) mitochondrial respiratory chain complex II biogenesis(GO:0097032) |
| 0.1 |
0.7 |
GO:0045048 |
protein insertion into ER membrane(GO:0045048) |
| 0.1 |
0.4 |
GO:0017198 |
N-terminal peptidyl-serine acetylation(GO:0017198) N-terminal peptidyl-glutamic acid acetylation(GO:0018002) peptidyl-serine acetylation(GO:0030920) |
| 0.1 |
1.1 |
GO:1901187 |
regulation of ephrin receptor signaling pathway(GO:1901187) |
| 0.1 |
0.1 |
GO:0032902 |
nerve growth factor production(GO:0032902) |
| 0.1 |
0.5 |
GO:0051151 |
negative regulation of smooth muscle cell differentiation(GO:0051151) |
| 0.1 |
0.5 |
GO:0006288 |
base-excision repair, DNA ligation(GO:0006288) |
| 0.1 |
0.7 |
GO:2000664 |
positive regulation of interleukin-5 secretion(GO:2000664) |
| 0.1 |
2.0 |
GO:2000774 |
positive regulation of cellular senescence(GO:2000774) |
| 0.1 |
0.7 |
GO:0097327 |
response to antineoplastic agent(GO:0097327) |
| 0.1 |
0.5 |
GO:0071596 |
ubiquitin-dependent protein catabolic process via the N-end rule pathway(GO:0071596) |
| 0.1 |
0.4 |
GO:0030974 |
thiamine pyrophosphate transport(GO:0030974) |
| 0.1 |
1.6 |
GO:0030091 |
protein repair(GO:0030091) |
| 0.1 |
2.0 |
GO:0045003 |
DNA recombinase assembly(GO:0000730) double-strand break repair via synthesis-dependent strand annealing(GO:0045003) |
| 0.1 |
0.4 |
GO:0070859 |
positive regulation of bile acid biosynthetic process(GO:0070859) positive regulation of bile acid metabolic process(GO:1904253) |
| 0.1 |
0.1 |
GO:0007521 |
muscle cell fate determination(GO:0007521) |
| 0.1 |
1.5 |
GO:0001955 |
blood vessel maturation(GO:0001955) |
| 0.1 |
0.8 |
GO:0070940 |
dephosphorylation of RNA polymerase II C-terminal domain(GO:0070940) |
| 0.1 |
1.1 |
GO:0042713 |
sperm ejaculation(GO:0042713) |
| 0.1 |
0.7 |
GO:0008616 |
queuosine biosynthetic process(GO:0008616) queuosine metabolic process(GO:0046116) |
| 0.1 |
0.7 |
GO:0071955 |
recycling endosome to Golgi transport(GO:0071955) |
| 0.1 |
0.8 |
GO:0045002 |
double-strand break repair via single-strand annealing(GO:0045002) |
| 0.1 |
0.1 |
GO:0097119 |
postsynaptic density protein 95 clustering(GO:0097119) |
| 0.1 |
0.8 |
GO:0098707 |
ferrous iron import into cell(GO:0097460) ferrous iron import across plasma membrane(GO:0098707) |
| 0.1 |
0.3 |
GO:0002513 |
tolerance induction to self antigen(GO:0002513) |
| 0.1 |
1.5 |
GO:1903025 |
regulation of RNA polymerase II regulatory region sequence-specific DNA binding(GO:1903025) |
| 0.1 |
0.5 |
GO:0046379 |
extracellular polysaccharide biosynthetic process(GO:0045226) extracellular polysaccharide metabolic process(GO:0046379) |
| 0.1 |
0.4 |
GO:2001153 |
regulation of renal water transport(GO:2001151) positive regulation of renal water transport(GO:2001153) |
| 0.1 |
0.9 |
GO:0014050 |
negative regulation of glutamate secretion(GO:0014050) |
| 0.1 |
3.9 |
GO:0000185 |
activation of MAPKKK activity(GO:0000185) |
| 0.1 |
0.3 |
GO:0007057 |
spindle assembly involved in female meiosis I(GO:0007057) |
| 0.1 |
0.5 |
GO:1900747 |
negative regulation of vascular endothelial growth factor signaling pathway(GO:1900747) |
| 0.1 |
1.7 |
GO:1904896 |
ESCRT complex disassembly(GO:1904896) ESCRT III complex disassembly(GO:1904903) |
| 0.1 |
0.9 |
GO:0070537 |
histone H2A K63-linked deubiquitination(GO:0070537) |
| 0.1 |
0.5 |
GO:0043504 |
mitochondrial DNA repair(GO:0043504) |
| 0.1 |
0.8 |
GO:0014057 |
positive regulation of acetylcholine secretion, neurotransmission(GO:0014057) |
| 0.1 |
5.8 |
GO:0036297 |
interstrand cross-link repair(GO:0036297) |
| 0.1 |
0.5 |
GO:2000342 |
negative regulation of chemokine (C-X-C motif) ligand 2 production(GO:2000342) |
| 0.1 |
0.4 |
GO:0031340 |
positive regulation of vesicle fusion(GO:0031340) |
| 0.1 |
0.5 |
GO:0097498 |
endothelial tube lumen extension(GO:0097498) |
| 0.1 |
0.5 |
GO:0015772 |
disaccharide transport(GO:0015766) sucrose transport(GO:0015770) oligosaccharide transport(GO:0015772) |
| 0.1 |
0.4 |
GO:1902960 |
regulation of choline O-acetyltransferase activity(GO:1902769) positive regulation of choline O-acetyltransferase activity(GO:1902771) negative regulation of tau-protein kinase activity(GO:1902948) positive regulation of early endosome to recycling endosome transport(GO:1902955) negative regulation of aspartic-type endopeptidase activity involved in amyloid precursor protein catabolic process(GO:1902960) negative regulation of neurofibrillary tangle assembly(GO:1902997) negative regulation of aspartic-type peptidase activity(GO:1905246) |
| 0.1 |
0.4 |
GO:0034729 |
histone H3-K79 methylation(GO:0034729) |
| 0.1 |
0.4 |
GO:0072402 |
response to cell cycle checkpoint signaling(GO:0072396) response to DNA integrity checkpoint signaling(GO:0072402) response to DNA damage checkpoint signaling(GO:0072423) |
| 0.1 |
0.5 |
GO:0007097 |
nuclear migration(GO:0007097) |
| 0.1 |
0.5 |
GO:0097069 |
cellular response to thyroxine stimulus(GO:0097069) cellular response to L-phenylalanine derivative(GO:1904387) |
| 0.1 |
1.0 |
GO:0032525 |
somite rostral/caudal axis specification(GO:0032525) |
| 0.1 |
0.3 |
GO:1902617 |
response to fluoride(GO:1902617) |
| 0.1 |
2.5 |
GO:0045898 |
regulation of RNA polymerase II transcriptional preinitiation complex assembly(GO:0045898) |
| 0.1 |
0.4 |
GO:0033967 |
box C/D snoRNA 3'-end processing(GO:0000494) box C/D snoRNA metabolic process(GO:0033967) box C/D snoRNA processing(GO:0034963) histone glutamine methylation(GO:1990258) |
| 0.1 |
0.9 |
GO:0070278 |
extracellular matrix constituent secretion(GO:0070278) |
| 0.1 |
2.5 |
GO:0033617 |
mitochondrial respiratory chain complex IV assembly(GO:0033617) |
| 0.1 |
0.5 |
GO:0010643 |
cell communication by chemical coupling(GO:0010643) |
| 0.1 |
1.0 |
GO:0032049 |
cardiolipin biosynthetic process(GO:0032049) |
| 0.1 |
0.2 |
GO:0060463 |
lung lobe development(GO:0060462) lung lobe morphogenesis(GO:0060463) |
| 0.1 |
0.2 |
GO:0006550 |
isoleucine catabolic process(GO:0006550) |
| 0.1 |
0.4 |
GO:0033364 |
mast cell secretory granule organization(GO:0033364) |
| 0.1 |
0.4 |
GO:0070315 |
G1 to G0 transition involved in cell differentiation(GO:0070315) |
| 0.1 |
1.0 |
GO:0060158 |
phospholipase C-activating dopamine receptor signaling pathway(GO:0060158) |
| 0.1 |
1.1 |
GO:1900028 |
negative regulation of ruffle assembly(GO:1900028) |
| 0.1 |
0.5 |
GO:1904448 |
negative regulation of gamma-aminobutyric acid secretion(GO:0014053) aspartate secretion(GO:0061528) regulation of aspartate secretion(GO:1904448) positive regulation of aspartate secretion(GO:1904450) |
| 0.1 |
0.7 |
GO:0000727 |
double-strand break repair via break-induced replication(GO:0000727) |
| 0.1 |
0.4 |
GO:0048936 |
peripheral nervous system neuron axonogenesis(GO:0048936) |
| 0.1 |
2.2 |
GO:0035563 |
positive regulation of chromatin binding(GO:0035563) |
| 0.1 |
2.9 |
GO:0032897 |
negative regulation of viral transcription(GO:0032897) |
| 0.1 |
0.2 |
GO:0030505 |
inorganic diphosphate transport(GO:0030505) |
| 0.1 |
0.4 |
GO:1901475 |
pyruvate transport(GO:0006848) pyruvate transmembrane transport(GO:1901475) |
| 0.1 |
0.2 |
GO:0097187 |
dentinogenesis(GO:0097187) |
| 0.1 |
1.4 |
GO:0098734 |
macromolecule depalmitoylation(GO:0098734) |
| 0.1 |
1.4 |
GO:0051152 |
positive regulation of smooth muscle cell differentiation(GO:0051152) |
| 0.1 |
0.4 |
GO:0032487 |
regulation of Rap protein signal transduction(GO:0032487) |
| 0.1 |
0.5 |
GO:0072137 |
condensed mesenchymal cell proliferation(GO:0072137) |
| 0.1 |
0.6 |
GO:0060179 |
male mating behavior(GO:0060179) |
| 0.1 |
0.5 |
GO:0046909 |
intermembrane transport(GO:0046909) protein transport from ciliary membrane to plasma membrane(GO:1903445) |
| 0.1 |
0.5 |
GO:1903412 |
response to bile acid(GO:1903412) |
| 0.1 |
1.3 |
GO:0042985 |
negative regulation of amyloid precursor protein biosynthetic process(GO:0042985) |
| 0.1 |
2.5 |
GO:0072189 |
ureter development(GO:0072189) |
| 0.1 |
0.2 |
GO:0031630 |
regulation of synaptic vesicle fusion to presynaptic membrane(GO:0031630) |
| 0.1 |
0.5 |
GO:0034163 |
regulation of toll-like receptor 9 signaling pathway(GO:0034163) negative regulation of toll-like receptor 9 signaling pathway(GO:0034164) |
| 0.1 |
0.5 |
GO:0060449 |
bud elongation involved in lung branching(GO:0060449) |
| 0.1 |
1.5 |
GO:0038203 |
TORC2 signaling(GO:0038203) |
| 0.1 |
2.2 |
GO:0007084 |
mitotic nuclear envelope reassembly(GO:0007084) |
| 0.1 |
1.9 |
GO:0000050 |
urea cycle(GO:0000050) |
| 0.1 |
0.1 |
GO:0033683 |
nucleotide-excision repair, DNA incision(GO:0033683) |
| 0.1 |
0.8 |
GO:0018026 |
peptidyl-lysine monomethylation(GO:0018026) |
| 0.1 |
0.3 |
GO:0009086 |
methionine biosynthetic process(GO:0009086) |
| 0.1 |
0.2 |
GO:1904379 |
protein localization to cytosolic proteasome complex(GO:1904327) protein localization to cytosolic proteasome complex involved in ERAD pathway(GO:1904379) |
| 0.1 |
0.3 |
GO:0015847 |
putrescine transport(GO:0015847) |
| 0.1 |
0.2 |
GO:0090240 |
positive regulation of histone H4 acetylation(GO:0090240) |
| 0.1 |
0.7 |
GO:0010757 |
negative regulation of plasminogen activation(GO:0010757) |
| 0.1 |
0.3 |
GO:0001546 |
preantral ovarian follicle growth(GO:0001546) multi-layer follicle stage(GO:0048162) |
| 0.1 |
0.3 |
GO:0072156 |
distal tubule morphogenesis(GO:0072156) |
| 0.1 |
0.7 |
GO:1902897 |
regulation of postsynaptic density protein 95 clustering(GO:1902897) |
| 0.1 |
0.5 |
GO:0055011 |
atrial cardiac muscle cell differentiation(GO:0055011) atrial cardiac muscle cell development(GO:0055014) |
| 0.1 |
0.3 |
GO:0014813 |
skeletal muscle satellite cell commitment(GO:0014813) |
| 0.1 |
0.3 |
GO:0006740 |
NADPH regeneration(GO:0006740) |
| 0.1 |
0.7 |
GO:0072383 |
plus-end-directed vesicle transport along microtubule(GO:0072383) |
| 0.1 |
0.3 |
GO:0021965 |
spinal cord ventral commissure morphogenesis(GO:0021965) |
| 0.1 |
0.1 |
GO:1900673 |
olefin metabolic process(GO:1900673) |
| 0.1 |
5.9 |
GO:0050650 |
chondroitin sulfate proteoglycan biosynthetic process(GO:0050650) |
| 0.1 |
1.5 |
GO:0015074 |
DNA integration(GO:0015074) |
| 0.1 |
0.7 |
GO:0035507 |
regulation of myosin-light-chain-phosphatase activity(GO:0035507) |
| 0.1 |
1.1 |
GO:0032876 |
negative regulation of DNA endoreduplication(GO:0032876) |
| 0.1 |
0.3 |
GO:0006421 |
asparaginyl-tRNA aminoacylation(GO:0006421) |
| 0.1 |
0.2 |
GO:0019249 |
lactate biosynthetic process(GO:0019249) |
| 0.1 |
0.1 |
GO:0060995 |
cell-cell signaling involved in kidney development(GO:0060995) Wnt signaling pathway involved in kidney development(GO:0061289) canonical Wnt signaling pathway involved in metanephric kidney development(GO:0061290) cell-cell signaling involved in metanephros development(GO:0072204) |
| 0.1 |
0.4 |
GO:0032290 |
peripheral nervous system myelin formation(GO:0032290) |
| 0.1 |
0.6 |
GO:0080154 |
regulation of fertilization(GO:0080154) |
| 0.1 |
0.2 |
GO:0007144 |
female meiosis I(GO:0007144) |
| 0.1 |
0.7 |
GO:0090206 |
negative regulation of cholesterol biosynthetic process(GO:0045541) negative regulation of cholesterol metabolic process(GO:0090206) |
| 0.1 |
0.5 |
GO:0006420 |
arginyl-tRNA aminoacylation(GO:0006420) |
| 0.1 |
0.7 |
GO:0035610 |
protein side chain deglutamylation(GO:0035610) |
| 0.1 |
0.7 |
GO:0021997 |
neural plate axis specification(GO:0021997) |
| 0.1 |
1.2 |
GO:0050667 |
homocysteine metabolic process(GO:0050667) |
| 0.1 |
0.9 |
GO:0033227 |
dsRNA transport(GO:0033227) |
| 0.1 |
1.1 |
GO:2001032 |
regulation of double-strand break repair via nonhomologous end joining(GO:2001032) |
| 0.1 |
0.1 |
GO:2000506 |
negative regulation of energy homeostasis(GO:2000506) |
| 0.1 |
1.1 |
GO:2000601 |
positive regulation of Arp2/3 complex-mediated actin nucleation(GO:2000601) |
| 0.1 |
0.2 |
GO:0015891 |
iron chelate transport(GO:0015688) siderophore transport(GO:0015891) |
| 0.1 |
0.3 |
GO:0003408 |
optic cup formation involved in camera-type eye development(GO:0003408) |
| 0.1 |
0.5 |
GO:0032485 |
Ral protein signal transduction(GO:0032484) regulation of Ral protein signal transduction(GO:0032485) |
| 0.1 |
0.3 |
GO:2000302 |
positive regulation of synaptic vesicle exocytosis(GO:2000302) |
| 0.1 |
0.1 |
GO:0097477 |
lateral motor column neuron migration(GO:0097477) |
| 0.1 |
0.3 |
GO:0009786 |
regulation of asymmetric cell division(GO:0009786) |
| 0.1 |
0.2 |
GO:1904048 |
regulation of spontaneous neurotransmitter secretion(GO:1904048) negative regulation of spontaneous neurotransmitter secretion(GO:1904049) |
| 0.1 |
0.6 |
GO:1904978 |
regulation of endosome organization(GO:1904978) |
| 0.1 |
0.1 |
GO:0071930 |
negative regulation of transcription involved in G1/S transition of mitotic cell cycle(GO:0071930) |
| 0.1 |
0.5 |
GO:0090042 |
tubulin deacetylation(GO:0090042) |
| 0.1 |
0.3 |
GO:0099557 |
trans-synaptic signaling by trans-synaptic complex(GO:0099545) trans-synaptic signaling by trans-synaptic complex, modulating synaptic transmission(GO:0099557) |
| 0.1 |
0.4 |
GO:0000717 |
nucleotide-excision repair, DNA duplex unwinding(GO:0000717) |
| 0.1 |
0.5 |
GO:0046543 |
development of secondary female sexual characteristics(GO:0046543) |
| 0.1 |
2.7 |
GO:0042276 |
error-prone translesion synthesis(GO:0042276) |
| 0.1 |
1.3 |
GO:0006564 |
L-serine biosynthetic process(GO:0006564) |
| 0.1 |
1.5 |
GO:0031061 |
negative regulation of histone methylation(GO:0031061) |
| 0.1 |
0.3 |
GO:0030221 |
basophil differentiation(GO:0030221) |
| 0.1 |
1.2 |
GO:0006265 |
DNA topological change(GO:0006265) |
| 0.1 |
0.7 |
GO:0051195 |
negative regulation of glycolytic process(GO:0045820) negative regulation of cofactor metabolic process(GO:0051195) negative regulation of coenzyme metabolic process(GO:0051198) |
| 0.1 |
0.1 |
GO:0051142 |
regulation of NK T cell proliferation(GO:0051140) positive regulation of NK T cell proliferation(GO:0051142) |
| 0.1 |
0.3 |
GO:2001287 |
negative regulation of caveolin-mediated endocytosis(GO:2001287) |
| 0.1 |
1.1 |
GO:0000447 |
endonucleolytic cleavage in ITS1 to separate SSU-rRNA from 5.8S rRNA and LSU-rRNA from tricistronic rRNA transcript (SSU-rRNA, 5.8S rRNA, LSU-rRNA)(GO:0000447) |
| 0.1 |
0.9 |
GO:0032264 |
IMP salvage(GO:0032264) |
| 0.1 |
0.4 |
GO:0044313 |
protein K6-linked deubiquitination(GO:0044313) |
| 0.1 |
0.5 |
GO:0050428 |
purine ribonucleoside bisphosphate biosynthetic process(GO:0034036) 3'-phosphoadenosine 5'-phosphosulfate biosynthetic process(GO:0050428) |
| 0.1 |
0.7 |
GO:0017062 |
respiratory chain complex III assembly(GO:0017062) mitochondrial respiratory chain complex III assembly(GO:0034551) |
| 0.1 |
0.3 |
GO:0034395 |
regulation of transcription from RNA polymerase II promoter in response to iron(GO:0034395) |
| 0.1 |
0.3 |
GO:0019483 |
beta-alanine biosynthetic process(GO:0019483) |
| 0.1 |
4.9 |
GO:0005978 |
glycogen biosynthetic process(GO:0005978) glucan biosynthetic process(GO:0009250) |
| 0.1 |
0.3 |
GO:0006555 |
methionine metabolic process(GO:0006555) |
| 0.1 |
0.7 |
GO:0046600 |
negative regulation of centriole replication(GO:0046600) |
| 0.1 |
0.3 |
GO:0070681 |
glutaminyl-tRNAGln biosynthesis via transamidation(GO:0070681) |
| 0.1 |
0.3 |
GO:0006667 |
sphinganine metabolic process(GO:0006667) |
| 0.1 |
0.3 |
GO:0009635 |
response to herbicide(GO:0009635) |
| 0.1 |
0.6 |
GO:0010533 |
regulation of activation of Janus kinase activity(GO:0010533) |
| 0.1 |
0.3 |
GO:0038193 |
thromboxane A2 signaling pathway(GO:0038193) |
| 0.1 |
2.1 |
GO:0050965 |
detection of temperature stimulus involved in sensory perception(GO:0050961) detection of temperature stimulus involved in sensory perception of pain(GO:0050965) |
| 0.1 |
1.2 |
GO:0042407 |
cristae formation(GO:0042407) |
| 0.1 |
0.4 |
GO:0023016 |
signal transduction by trans-phosphorylation(GO:0023016) |
| 0.1 |
0.9 |
GO:0006572 |
tyrosine catabolic process(GO:0006572) |
| 0.1 |
0.3 |
GO:0061763 |
multivesicular body-lysosome fusion(GO:0061763) |
| 0.1 |
0.9 |
GO:0006264 |
mitochondrial DNA replication(GO:0006264) |
| 0.1 |
0.2 |
GO:0002232 |
leukocyte chemotaxis involved in inflammatory response(GO:0002232) |
| 0.1 |
0.5 |
GO:0032377 |
regulation of intracellular lipid transport(GO:0032377) regulation of intracellular sterol transport(GO:0032380) regulation of intracellular cholesterol transport(GO:0032383) |
| 0.1 |
0.7 |
GO:0035694 |
mitochondrial protein catabolic process(GO:0035694) |
| 0.1 |
0.5 |
GO:0032790 |
ribosome disassembly(GO:0032790) |
| 0.1 |
1.0 |
GO:0021942 |
radial glia guided migration of Purkinje cell(GO:0021942) |
| 0.1 |
0.2 |
GO:0032415 |
regulation of sodium:proton antiporter activity(GO:0032415) |
| 0.1 |
1.6 |
GO:0042420 |
dopamine catabolic process(GO:0042420) |
| 0.1 |
0.8 |
GO:0061302 |
smooth muscle cell-matrix adhesion(GO:0061302) |
| 0.1 |
0.5 |
GO:1902498 |
regulation of protein autoubiquitination(GO:1902498) |
| 0.1 |
1.2 |
GO:0016127 |
cholesterol catabolic process(GO:0006707) sterol catabolic process(GO:0016127) |
| 0.1 |
0.2 |
GO:0035234 |
ectopic germ cell programmed cell death(GO:0035234) |
| 0.1 |
1.0 |
GO:0034983 |
peptidyl-lysine deacetylation(GO:0034983) |
| 0.1 |
0.1 |
GO:0071072 |
negative regulation of phospholipid biosynthetic process(GO:0071072) |
| 0.1 |
0.2 |
GO:0018214 |
peptidyl-glutamic acid carboxylation(GO:0017187) protein carboxylation(GO:0018214) |
| 0.1 |
0.9 |
GO:0042659 |
regulation of cell fate specification(GO:0042659) |
| 0.1 |
0.3 |
GO:0031247 |
actin rod assembly(GO:0031247) |
| 0.1 |
0.8 |
GO:0019236 |
response to pheromone(GO:0019236) |
| 0.1 |
0.3 |
GO:0010986 |
positive regulation of lipoprotein particle clearance(GO:0010986) |
| 0.1 |
0.3 |
GO:0006781 |
succinyl-CoA pathway(GO:0006781) |
| 0.1 |
0.3 |
GO:1904017 |
cellular response to Thyroglobulin triiodothyronine(GO:1904017) |
| 0.1 |
0.3 |
GO:0071460 |
cellular response to cell-matrix adhesion(GO:0071460) |
| 0.1 |
0.1 |
GO:0016488 |
sesquiterpenoid metabolic process(GO:0006714) sesquiterpenoid catabolic process(GO:0016107) farnesol metabolic process(GO:0016487) farnesol catabolic process(GO:0016488) |
| 0.1 |
0.2 |
GO:0051956 |
negative regulation of amino acid transport(GO:0051956) |
| 0.1 |
1.1 |
GO:0016446 |
somatic hypermutation of immunoglobulin genes(GO:0016446) |
| 0.1 |
0.5 |
GO:0050915 |
sensory perception of sour taste(GO:0050915) |
| 0.1 |
0.6 |
GO:0061091 |
regulation of phospholipid translocation(GO:0061091) positive regulation of phospholipid translocation(GO:0061092) |
| 0.1 |
0.4 |
GO:0097411 |
hypoxia-inducible factor-1alpha signaling pathway(GO:0097411) |
| 0.1 |
0.4 |
GO:1990637 |
response to prolactin(GO:1990637) |
| 0.1 |
0.4 |
GO:0048505 |
regulation of development, heterochronic(GO:0040034) regulation of timing of cell differentiation(GO:0048505) |
| 0.1 |
0.3 |
GO:0090526 |
regulation of gluconeogenesis involved in cellular glucose homeostasis(GO:0090526) |
| 0.1 |
0.4 |
GO:1904977 |
lymphatic endothelial cell migration(GO:1904977) |
| 0.1 |
0.5 |
GO:0042851 |
L-alanine metabolic process(GO:0042851) L-alanine catabolic process(GO:0042853) |
| 0.1 |
1.3 |
GO:0006295 |
nucleotide-excision repair, DNA incision, 3'-to lesion(GO:0006295) |
| 0.1 |
0.8 |
GO:0019388 |
galactose catabolic process(GO:0019388) |
| 0.1 |
0.4 |
GO:0030242 |
pexophagy(GO:0030242) |
| 0.1 |
0.6 |
GO:0032971 |
regulation of muscle filament sliding(GO:0032971) |
| 0.1 |
1.9 |
GO:0014733 |
regulation of skeletal muscle adaptation(GO:0014733) |
| 0.1 |
0.2 |
GO:0035990 |
tendon cell differentiation(GO:0035990) tendon formation(GO:0035992) |
| 0.1 |
0.4 |
GO:0061739 |
protein lipidation involved in autophagosome assembly(GO:0061739) |
| 0.1 |
0.3 |
GO:0003032 |
detection of oxygen(GO:0003032) |
| 0.1 |
0.3 |
GO:0060364 |
subpallium cell proliferation in forebrain(GO:0022012) lateral ganglionic eminence cell proliferation(GO:0022018) frontal suture morphogenesis(GO:0060364) lambdoid suture morphogenesis(GO:0060366) sagittal suture morphogenesis(GO:0060367) anterior semicircular canal development(GO:0060873) lateral semicircular canal development(GO:0060875) |
| 0.1 |
0.3 |
GO:0060394 |
negative regulation of pathway-restricted SMAD protein phosphorylation(GO:0060394) |
| 0.1 |
0.6 |
GO:0060352 |
cell adhesion molecule production(GO:0060352) |
| 0.1 |
0.8 |
GO:0008063 |
Toll signaling pathway(GO:0008063) |
| 0.1 |
0.3 |
GO:0042137 |
sequestering of neurotransmitter(GO:0042137) |
| 0.1 |
0.7 |
GO:0002087 |
regulation of respiratory gaseous exchange by neurological system process(GO:0002087) |
| 0.1 |
0.4 |
GO:1905097 |
regulation of guanyl-nucleotide exchange factor activity(GO:1905097) regulation of Rho guanyl-nucleotide exchange factor activity(GO:2001106) |
| 0.1 |
0.3 |
GO:1902268 |
negative regulation of polyamine transmembrane transport(GO:1902268) |
| 0.1 |
0.6 |
GO:0019673 |
GDP-mannose metabolic process(GO:0019673) |
| 0.1 |
0.1 |
GO:0046602 |
regulation of mitotic centrosome separation(GO:0046602) |
| 0.1 |
1.4 |
GO:0030046 |
parallel actin filament bundle assembly(GO:0030046) |
| 0.1 |
0.2 |
GO:0035372 |
protein localization to microtubule(GO:0035372) |
| 0.1 |
0.5 |
GO:0002725 |
negative regulation of T cell cytokine production(GO:0002725) |
| 0.1 |
0.3 |
GO:0061304 |
retinal blood vessel morphogenesis(GO:0061304) |
| 0.1 |
0.5 |
GO:0051182 |
coenzyme transport(GO:0051182) |
| 0.1 |
0.2 |
GO:1904844 |
response to L-glutamine(GO:1904844) cellular response to L-glutamine(GO:1904845) |
| 0.1 |
0.5 |
GO:0032445 |
fructose transport(GO:0015755) fructose import(GO:0032445) carbohydrate import into cell(GO:0097319) carbohydrate import across plasma membrane(GO:0098704) fructose import across plasma membrane(GO:1990539) |
| 0.1 |
0.3 |
GO:0090285 |
negative regulation of protein glycosylation in Golgi(GO:0090285) |
| 0.1 |
1.1 |
GO:0010459 |
negative regulation of heart rate(GO:0010459) |
| 0.1 |
0.3 |
GO:2000969 |
positive regulation of alpha-amino-3-hydroxy-5-methyl-4-isoxazole propionate selective glutamate receptor activity(GO:2000969) |
| 0.1 |
0.8 |
GO:0070673 |
response to interleukin-18(GO:0070673) |
| 0.1 |
0.9 |
GO:0018095 |
protein polyglutamylation(GO:0018095) |
| 0.1 |
0.3 |
GO:0000414 |
regulation of histone H3-K36 methylation(GO:0000414) |
| 0.1 |
1.0 |
GO:0060019 |
radial glial cell differentiation(GO:0060019) |
| 0.1 |
0.6 |
GO:0015798 |
myo-inositol transport(GO:0015798) |
| 0.1 |
0.8 |
GO:0006116 |
NADH oxidation(GO:0006116) |
| 0.1 |
0.3 |
GO:0007079 |
mitotic chromosome movement towards spindle pole(GO:0007079) |
| 0.1 |
0.5 |
GO:2000505 |
regulation of energy homeostasis(GO:2000505) |
| 0.1 |
0.8 |
GO:0070475 |
rRNA base methylation(GO:0070475) |
| 0.1 |
0.3 |
GO:0001868 |
regulation of complement activation, lectin pathway(GO:0001868) negative regulation of complement activation, lectin pathway(GO:0001869) |
| 0.1 |
0.7 |
GO:0072564 |
blood microparticle formation(GO:0072564) regulation of blood microparticle formation(GO:2000332) positive regulation of blood microparticle formation(GO:2000334) |
| 0.1 |
0.8 |
GO:0060346 |
bone trabecula formation(GO:0060346) |
| 0.1 |
0.7 |
GO:0018344 |
protein geranylgeranylation(GO:0018344) |
| 0.1 |
0.7 |
GO:0003084 |
positive regulation of systemic arterial blood pressure(GO:0003084) |
| 0.1 |
1.2 |
GO:0010990 |
regulation of SMAD protein complex assembly(GO:0010990) negative regulation of SMAD protein complex assembly(GO:0010991) |
| 0.1 |
0.7 |
GO:0001887 |
selenium compound metabolic process(GO:0001887) |
| 0.1 |
0.3 |
GO:0045906 |
negative regulation of vasoconstriction(GO:0045906) negative regulation of vascular smooth muscle contraction(GO:1904694) |
| 0.1 |
0.1 |
GO:0006642 |
triglyceride mobilization(GO:0006642) |
| 0.1 |
0.2 |
GO:2001045 |
negative regulation of integrin-mediated signaling pathway(GO:2001045) |
| 0.1 |
2.3 |
GO:0016180 |
snRNA processing(GO:0016180) |
| 0.1 |
2.8 |
GO:0060004 |
reflex(GO:0060004) |
| 0.1 |
0.9 |
GO:0033539 |
fatty acid beta-oxidation using acyl-CoA dehydrogenase(GO:0033539) |
| 0.1 |
0.1 |
GO:1903671 |
negative regulation of sprouting angiogenesis(GO:1903671) |
| 0.1 |
0.2 |
GO:0097021 |
lymphocyte migration into lymphoid organs(GO:0097021) |
| 0.1 |
0.1 |
GO:0035795 |
negative regulation of mitochondrial membrane permeability(GO:0035795) |
| 0.1 |
1.0 |
GO:0001778 |
plasma membrane repair(GO:0001778) |
| 0.1 |
1.0 |
GO:0098909 |
regulation of cardiac muscle cell action potential involved in regulation of contraction(GO:0098909) |
| 0.1 |
0.2 |
GO:0003064 |
regulation of heart rate by hormone(GO:0003064) |
| 0.1 |
0.2 |
GO:0072161 |
mesenchymal cell differentiation involved in kidney development(GO:0072161) mesenchymal cell differentiation involved in renal system development(GO:2001012) |
| 0.1 |
0.2 |
GO:0036233 |
glycine import(GO:0036233) |
| 0.1 |
0.2 |
GO:0035564 |
regulation of kidney size(GO:0035564) |
| 0.1 |
0.3 |
GO:0030423 |
targeting of mRNA for destruction involved in RNA interference(GO:0030423) |
| 0.1 |
0.2 |
GO:0000117 |
regulation of transcription involved in G2/M transition of mitotic cell cycle(GO:0000117) |
| 0.1 |
0.3 |
GO:0032765 |
regulation of mast cell cytokine production(GO:0032763) positive regulation of mast cell cytokine production(GO:0032765) |
| 0.1 |
0.3 |
GO:0010159 |
specification of organ position(GO:0010159) |
| 0.1 |
0.2 |
GO:0035691 |
macrophage migration inhibitory factor signaling pathway(GO:0035691) |
| 0.1 |
0.6 |
GO:0097338 |
response to clozapine(GO:0097338) |
| 0.1 |
0.9 |
GO:0006384 |
transcription initiation from RNA polymerase III promoter(GO:0006384) |
| 0.1 |
0.7 |
GO:0010993 |
regulation of ubiquitin homeostasis(GO:0010993) free ubiquitin chain polymerization(GO:0010994) |
| 0.1 |
0.1 |
GO:0052041 |
negative regulation by symbiont of host apoptotic process(GO:0033668) negative regulation by symbiont of host programmed cell death(GO:0052041) negative regulation by organism of programmed cell death in other organism involved in symbiotic interaction(GO:0052490) |
| 0.1 |
2.6 |
GO:0045737 |
positive regulation of cyclin-dependent protein serine/threonine kinase activity(GO:0045737) |
| 0.1 |
0.9 |
GO:0042373 |
vitamin K metabolic process(GO:0042373) |
| 0.1 |
0.3 |
GO:0001927 |
exocyst assembly(GO:0001927) |
| 0.1 |
1.3 |
GO:0018206 |
peptidyl-methionine modification(GO:0018206) |
| 0.1 |
0.9 |
GO:0090141 |
positive regulation of mitochondrial fission(GO:0090141) |
| 0.1 |
0.3 |
GO:0090188 |
negative regulation of pancreatic juice secretion(GO:0090188) |
| 0.1 |
0.2 |
GO:0044240 |
multicellular organism lipid catabolic process(GO:0044240) |
| 0.1 |
0.5 |
GO:0090649 |
response to oxygen-glucose deprivation(GO:0090649) cellular response to oxygen-glucose deprivation(GO:0090650) |
| 0.1 |
0.9 |
GO:0007143 |
female meiotic division(GO:0007143) |
| 0.1 |
1.1 |
GO:0070071 |
proton-transporting two-sector ATPase complex assembly(GO:0070071) |
| 0.1 |
0.3 |
GO:0007023 |
post-chaperonin tubulin folding pathway(GO:0007023) |
| 0.1 |
0.3 |
GO:0019285 |
glycine betaine biosynthetic process from choline(GO:0019285) glycine betaine metabolic process(GO:0031455) glycine betaine biosynthetic process(GO:0031456) |
| 0.1 |
0.2 |
GO:0038155 |
interleukin-23-mediated signaling pathway(GO:0038155) positive regulation of T-helper 17 cell lineage commitment(GO:2000330) |
| 0.1 |
0.2 |
GO:0006447 |
regulation of translational initiation by iron(GO:0006447) |
| 0.1 |
0.3 |
GO:0070973 |
protein localization to endoplasmic reticulum exit site(GO:0070973) |
| 0.1 |
0.7 |
GO:1903361 |
protein localization to basolateral plasma membrane(GO:1903361) |
| 0.1 |
0.1 |
GO:0046021 |
regulation of transcription from RNA polymerase II promoter, mitotic(GO:0046021) |
| 0.1 |
0.1 |
GO:0071630 |
nucleus-associated proteasomal ubiquitin-dependent protein catabolic process(GO:0071630) |
| 0.1 |
0.2 |
GO:0051661 |
maintenance of centrosome location(GO:0051661) |
| 0.1 |
0.2 |
GO:0021793 |
chemorepulsion of branchiomotor axon(GO:0021793) |
| 0.1 |
0.4 |
GO:0090219 |
negative regulation of lipid kinase activity(GO:0090219) |
| 0.1 |
0.1 |
GO:0052055 |
modulation by symbiont of host molecular function(GO:0052055) modulation of catalytic activity in other organism involved in symbiotic interaction(GO:0052203) modulation by host of symbiont catalytic activity(GO:0052422) |
| 0.1 |
0.5 |
GO:0070535 |
histone H2A K63-linked ubiquitination(GO:0070535) |
| 0.1 |
0.1 |
GO:0045964 |
positive regulation of catecholamine metabolic process(GO:0045915) positive regulation of dopamine metabolic process(GO:0045964) |
| 0.1 |
0.1 |
GO:0003099 |
positive regulation of the force of heart contraction by chemical signal(GO:0003099) |
| 0.1 |
2.8 |
GO:0007019 |
microtubule depolymerization(GO:0007019) |
| 0.1 |
0.2 |
GO:0010701 |
positive regulation of norepinephrine secretion(GO:0010701) |
| 0.1 |
0.2 |
GO:0070650 |
endoplasmic reticulum polarization(GO:0061163) actin filament bundle retrograde transport(GO:0061573) actin filament bundle distribution(GO:0070650) |
| 0.1 |
0.4 |
GO:0045006 |
DNA deamination(GO:0045006) |
| 0.1 |
0.2 |
GO:0090050 |
positive regulation of cell migration involved in sprouting angiogenesis(GO:0090050) |
| 0.1 |
0.1 |
GO:1900122 |
positive regulation of receptor binding(GO:1900122) |
| 0.1 |
0.6 |
GO:0006451 |
selenocysteine incorporation(GO:0001514) translational readthrough(GO:0006451) |
| 0.1 |
0.1 |
GO:0036369 |
transcription factor catabolic process(GO:0036369) |
| 0.1 |
2.0 |
GO:0006337 |
nucleosome disassembly(GO:0006337) |
| 0.1 |
0.6 |
GO:0007379 |
segment specification(GO:0007379) |
| 0.1 |
0.2 |
GO:1990569 |
UDP-N-acetylglucosamine transport(GO:0015788) UDP-N-acetylglucosamine transmembrane transport(GO:1990569) |
| 0.1 |
2.3 |
GO:0006363 |
termination of RNA polymerase I transcription(GO:0006363) |
| 0.1 |
0.4 |
GO:0016240 |
autophagosome docking(GO:0016240) |
| 0.1 |
0.5 |
GO:0001561 |
fatty acid alpha-oxidation(GO:0001561) |
| 0.1 |
0.1 |
GO:0046586 |
regulation of calcium-dependent cell-cell adhesion(GO:0046586) |
| 0.1 |
0.1 |
GO:0006566 |
threonine metabolic process(GO:0006566) |
| 0.1 |
0.2 |
GO:0050760 |
negative regulation of thymidylate synthase biosynthetic process(GO:0050760) |
| 0.1 |
0.3 |
GO:0006563 |
L-serine metabolic process(GO:0006563) |
| 0.1 |
1.0 |
GO:0002042 |
cell migration involved in sprouting angiogenesis(GO:0002042) |
| 0.1 |
0.6 |
GO:0097026 |
dendritic cell dendrite assembly(GO:0097026) |
| 0.1 |
0.1 |
GO:0018171 |
peptidyl-cysteine oxidation(GO:0018171) |
| 0.1 |
0.1 |
GO:0033129 |
positive regulation of histone phosphorylation(GO:0033129) |
| 0.1 |
0.3 |
GO:1904219 |
regulation of CDP-diacylglycerol-serine O-phosphatidyltransferase activity(GO:1904217) positive regulation of CDP-diacylglycerol-serine O-phosphatidyltransferase activity(GO:1904219) positive regulation of serine C-palmitoyltransferase activity(GO:1904222) |
| 0.1 |
0.9 |
GO:0018027 |
peptidyl-lysine dimethylation(GO:0018027) |
| 0.1 |
2.8 |
GO:0045494 |
photoreceptor cell maintenance(GO:0045494) |
| 0.1 |
0.5 |
GO:0006975 |
DNA damage induced protein phosphorylation(GO:0006975) |
| 0.1 |
0.4 |
GO:0002371 |
dendritic cell cytokine production(GO:0002371) |
| 0.1 |
0.4 |
GO:0051030 |
snRNA transport(GO:0051030) |
| 0.1 |
0.5 |
GO:0045654 |
positive regulation of megakaryocyte differentiation(GO:0045654) |
| 0.1 |
0.2 |
GO:0061580 |
colon epithelial cell migration(GO:0061580) |
| 0.1 |
0.3 |
GO:0030263 |
apoptotic chromosome condensation(GO:0030263) |
| 0.1 |
1.1 |
GO:0021930 |
cell proliferation in external granule layer(GO:0021924) cerebellar granule cell precursor proliferation(GO:0021930) |
| 0.1 |
0.2 |
GO:0033601 |
positive regulation of mammary gland epithelial cell proliferation(GO:0033601) |
| 0.1 |
0.4 |
GO:1902416 |
positive regulation of mRNA binding(GO:1902416) |
| 0.1 |
1.9 |
GO:0014850 |
response to muscle activity(GO:0014850) |
| 0.1 |
0.2 |
GO:0010216 |
maintenance of DNA methylation(GO:0010216) |
| 0.1 |
0.8 |
GO:0042574 |
retinal metabolic process(GO:0042574) |
| 0.1 |
0.3 |
GO:2000434 |
regulation of protein neddylation(GO:2000434) negative regulation of protein neddylation(GO:2000435) |
| 0.1 |
0.5 |
GO:0030421 |
defecation(GO:0030421) |
| 0.1 |
0.5 |
GO:0048672 |
positive regulation of collateral sprouting(GO:0048672) |
| 0.1 |
0.1 |
GO:0036324 |
vascular endothelial growth factor receptor-2 signaling pathway(GO:0036324) |
| 0.1 |
0.4 |
GO:0051012 |
microtubule sliding(GO:0051012) |
| 0.1 |
0.9 |
GO:0016075 |
rRNA catabolic process(GO:0016075) |
| 0.1 |
0.7 |
GO:0051451 |
myoblast migration(GO:0051451) |
| 0.1 |
0.1 |
GO:0002606 |
positive regulation of dendritic cell antigen processing and presentation(GO:0002606) |
| 0.1 |
0.3 |
GO:0046340 |
diacylglycerol catabolic process(GO:0046340) |
| 0.1 |
0.3 |
GO:0032510 |
endosome to lysosome transport via multivesicular body sorting pathway(GO:0032510) |
| 0.1 |
0.3 |
GO:0010430 |
fatty acid omega-oxidation(GO:0010430) |
| 0.1 |
0.3 |
GO:0042264 |
peptidyl-aspartic acid hydroxylation(GO:0042264) |
| 0.1 |
0.4 |
GO:2000781 |
positive regulation of double-strand break repair(GO:2000781) |
| 0.1 |
0.2 |
GO:0071033 |
nuclear retention of pre-mRNA at the site of transcription(GO:0071033) |
| 0.1 |
0.4 |
GO:0006188 |
IMP biosynthetic process(GO:0006188) |
| 0.1 |
0.8 |
GO:0071313 |
cellular response to caffeine(GO:0071313) |
| 0.1 |
0.1 |
GO:0061357 |
positive regulation of Wnt protein secretion(GO:0061357) |
| 0.1 |
0.4 |
GO:0036289 |
peptidyl-serine autophosphorylation(GO:0036289) |
| 0.1 |
0.3 |
GO:2000504 |
positive regulation of blood vessel remodeling(GO:2000504) |
| 0.1 |
2.0 |
GO:0032012 |
regulation of ARF protein signal transduction(GO:0032012) |
| 0.1 |
1.0 |
GO:1904714 |
regulation of chaperone-mediated autophagy(GO:1904714) |
| 0.1 |
0.8 |
GO:0030050 |
vesicle transport along actin filament(GO:0030050) |
| 0.1 |
0.5 |
GO:0007168 |
receptor guanylyl cyclase signaling pathway(GO:0007168) |
| 0.1 |
0.2 |
GO:0050992 |
dimethylallyl diphosphate biosynthetic process(GO:0050992) dimethylallyl diphosphate metabolic process(GO:0050993) |
| 0.1 |
0.3 |
GO:0070901 |
mitochondrial tRNA methylation(GO:0070901) |
| 0.1 |
0.3 |
GO:2000676 |
positive regulation of type B pancreatic cell apoptotic process(GO:2000676) |
| 0.1 |
0.1 |
GO:2000078 |
positive regulation of type B pancreatic cell development(GO:2000078) |
| 0.1 |
0.1 |
GO:0003162 |
atrioventricular node development(GO:0003162) |
| 0.1 |
1.5 |
GO:0030866 |
cortical actin cytoskeleton organization(GO:0030866) |
| 0.1 |
0.2 |
GO:0045625 |
regulation of T-helper 1 cell differentiation(GO:0045625) |
| 0.1 |
1.7 |
GO:0045747 |
positive regulation of Notch signaling pathway(GO:0045747) |
| 0.1 |
0.2 |
GO:0055062 |
phosphate ion homeostasis(GO:0055062) divalent inorganic anion homeostasis(GO:0072505) trivalent inorganic anion homeostasis(GO:0072506) |
| 0.1 |
0.4 |
GO:0023041 |
neuronal signal transduction(GO:0023041) |
| 0.1 |
0.7 |
GO:0071787 |
endoplasmic reticulum tubular network assembly(GO:0071787) |
| 0.1 |
0.2 |
GO:2000298 |
regulation of Rho-dependent protein serine/threonine kinase activity(GO:2000298) |
| 0.1 |
0.9 |
GO:0019371 |
cyclooxygenase pathway(GO:0019371) |
| 0.1 |
0.7 |
GO:0035745 |
T-helper 2 cell cytokine production(GO:0035745) |
| 0.1 |
0.2 |
GO:0035553 |
oxidative RNA demethylation(GO:0035513) oxidative single-stranded RNA demethylation(GO:0035553) |
| 0.1 |
0.1 |
GO:0003228 |
atrial cardiac muscle tissue development(GO:0003228) atrial cardiac muscle tissue morphogenesis(GO:0055009) |
| 0.1 |
0.4 |
GO:0015680 |
intracellular copper ion transport(GO:0015680) |
| 0.1 |
0.2 |
GO:2000255 |
negative regulation of male germ cell proliferation(GO:2000255) |
| 0.1 |
0.3 |
GO:0044878 |
abscission(GO:0009838) mitotic cytokinesis checkpoint(GO:0044878) |
| 0.1 |
0.2 |
GO:0042048 |
olfactory behavior(GO:0042048) |
| 0.1 |
0.2 |
GO:2000670 |
negative regulation of melanin biosynthetic process(GO:0048022) negative regulation of secondary metabolite biosynthetic process(GO:1900377) positive regulation of dendritic cell apoptotic process(GO:2000670) |
| 0.1 |
0.9 |
GO:0036120 |
cellular response to platelet-derived growth factor stimulus(GO:0036120) |
| 0.1 |
0.2 |
GO:0070345 |
negative regulation of fat cell proliferation(GO:0070345) |
| 0.1 |
0.2 |
GO:0019364 |
NADP catabolic process(GO:0006742) pyridine nucleotide catabolic process(GO:0019364) |
| 0.1 |
3.6 |
GO:0034260 |
negative regulation of GTPase activity(GO:0034260) |
| 0.1 |
0.1 |
GO:0051754 |
meiotic sister chromatid cohesion, centromeric(GO:0051754) |
| 0.1 |
0.2 |
GO:0006710 |
androgen catabolic process(GO:0006710) |
| 0.1 |
0.1 |
GO:0006533 |
aspartate catabolic process(GO:0006533) |
| 0.1 |
0.6 |
GO:1903441 |
protein localization to ciliary membrane(GO:1903441) |
| 0.1 |
0.7 |
GO:0044829 |
positive regulation by host of viral genome replication(GO:0044829) |
| 0.1 |
0.4 |
GO:0070987 |
error-free translesion synthesis(GO:0070987) |
| 0.1 |
0.1 |
GO:0098903 |
regulation of membrane repolarization during action potential(GO:0098903) |
| 0.1 |
0.5 |
GO:0042262 |
DNA protection(GO:0042262) |
| 0.1 |
1.1 |
GO:0035162 |
embryonic hemopoiesis(GO:0035162) |
| 0.1 |
1.7 |
GO:0006635 |
fatty acid beta-oxidation(GO:0006635) |
| 0.1 |
0.2 |
GO:0035743 |
CD4-positive, alpha-beta T cell cytokine production(GO:0035743) |
| 0.1 |
0.1 |
GO:0071494 |
cellular response to UV-C(GO:0071494) |
| 0.1 |
0.1 |
GO:0022027 |
interkinetic nuclear migration(GO:0022027) |
| 0.1 |
0.2 |
GO:0044806 |
G-quadruplex DNA unwinding(GO:0044806) |
| 0.1 |
0.2 |
GO:0006106 |
fumarate metabolic process(GO:0006106) |
| 0.1 |
0.2 |
GO:0002904 |
positive regulation of B cell apoptotic process(GO:0002904) |
| 0.1 |
0.5 |
GO:2000124 |
endocannabinoid signaling pathway(GO:0071926) regulation of endocannabinoid signaling pathway(GO:2000124) |
| 0.1 |
0.3 |
GO:0019086 |
late viral transcription(GO:0019086) |
| 0.1 |
0.8 |
GO:0006600 |
creatine metabolic process(GO:0006600) |
| 0.1 |
0.1 |
GO:0035634 |
response to stilbenoid(GO:0035634) |
| 0.1 |
0.9 |
GO:0040015 |
negative regulation of multicellular organism growth(GO:0040015) |
| 0.1 |
0.2 |
GO:0045144 |
meiotic sister chromatid segregation(GO:0045144) |
| 0.1 |
0.6 |
GO:0002043 |
blood vessel endothelial cell proliferation involved in sprouting angiogenesis(GO:0002043) |
| 0.1 |
0.2 |
GO:0008626 |
granzyme-mediated apoptotic signaling pathway(GO:0008626) |
| 0.1 |
0.5 |
GO:0072319 |
vesicle uncoating(GO:0072319) |
| 0.1 |
0.2 |
GO:0014707 |
branchiomeric skeletal muscle development(GO:0014707) |
| 0.1 |
0.6 |
GO:0070932 |
histone H3 deacetylation(GO:0070932) |
| 0.1 |
0.5 |
GO:0042226 |
interleukin-6 biosynthetic process(GO:0042226) |
| 0.1 |
0.6 |
GO:0044341 |
sodium-dependent phosphate transport(GO:0044341) |
| 0.1 |
0.2 |
GO:0097112 |
molybdenum incorporation into molybdenum-molybdopterin complex(GO:0018315) metal incorporation into metallo-molybdopterin complex(GO:0042040) glycine receptor clustering(GO:0072579) gamma-aminobutyric acid receptor clustering(GO:0097112) |
| 0.1 |
0.1 |
GO:0090119 |
vesicle-mediated cholesterol transport(GO:0090119) |
| 0.1 |
0.1 |
GO:0071338 |
submandibular salivary gland formation(GO:0060661) hair follicle cell proliferation(GO:0071335) regulation of hair follicle cell proliferation(GO:0071336) positive regulation of hair follicle cell proliferation(GO:0071338) |
| 0.1 |
1.2 |
GO:0050908 |
detection of light stimulus involved in visual perception(GO:0050908) detection of light stimulus involved in sensory perception(GO:0050962) |
| 0.1 |
0.1 |
GO:0000098 |
sulfur amino acid catabolic process(GO:0000098) |
| 0.1 |
1.1 |
GO:0031282 |
regulation of guanylate cyclase activity(GO:0031282) |
| 0.1 |
0.1 |
GO:0060160 |
negative regulation of dopamine receptor signaling pathway(GO:0060160) |
| 0.1 |
0.1 |
GO:1902474 |
positive regulation of protein localization to synapse(GO:1902474) |
| 0.1 |
0.7 |
GO:0090140 |
regulation of mitochondrial fission(GO:0090140) |
| 0.1 |
0.3 |
GO:0061740 |
protein targeting to lysosome involved in chaperone-mediated autophagy(GO:0061740) |
| 0.1 |
0.5 |
GO:0048702 |
embryonic neurocranium morphogenesis(GO:0048702) |
| 0.1 |
0.1 |
GO:0060157 |
urinary bladder development(GO:0060157) |
| 0.1 |
0.1 |
GO:0021569 |
rhombomere 3 development(GO:0021569) |
| 0.1 |
0.5 |
GO:1900004 |
negative regulation of serine-type endopeptidase activity(GO:1900004) negative regulation of serine-type peptidase activity(GO:1902572) |
| 0.1 |
0.3 |
GO:0019918 |
peptidyl-arginine methylation, to symmetrical-dimethyl arginine(GO:0019918) |
| 0.1 |
0.5 |
GO:0000715 |
nucleotide-excision repair, DNA damage recognition(GO:0000715) |
| 0.1 |
1.2 |
GO:0010603 |
regulation of cytoplasmic mRNA processing body assembly(GO:0010603) |
| 0.1 |
1.3 |
GO:0071539 |
protein localization to centrosome(GO:0071539) |
| 0.1 |
0.2 |
GO:0097056 |
selenocysteinyl-tRNA(Sec) biosynthetic process(GO:0097056) |
| 0.1 |
0.3 |
GO:0002318 |
myeloid progenitor cell differentiation(GO:0002318) |
| 0.1 |
0.5 |
GO:0070571 |
negative regulation of neuron projection regeneration(GO:0070571) |
| 0.1 |
0.2 |
GO:0001923 |
B-1 B cell differentiation(GO:0001923) |
| 0.1 |
0.6 |
GO:0097240 |
meiotic telomere tethering at nuclear periphery(GO:0044821) meiotic attachment of telomere to nuclear envelope(GO:0070197) chromosome attachment to the nuclear envelope(GO:0097240) |
| 0.1 |
0.2 |
GO:1905000 |
regulation of membrane repolarization during atrial cardiac muscle cell action potential(GO:1905000) |
| 0.1 |
0.6 |
GO:0009125 |
nucleoside monophosphate catabolic process(GO:0009125) |
| 0.1 |
0.6 |
GO:0019368 |
fatty acid elongation, saturated fatty acid(GO:0019367) fatty acid elongation, unsaturated fatty acid(GO:0019368) fatty acid elongation, monounsaturated fatty acid(GO:0034625) fatty acid elongation, polyunsaturated fatty acid(GO:0034626) |
| 0.1 |
0.6 |
GO:0010499 |
proteasomal ubiquitin-independent protein catabolic process(GO:0010499) |
| 0.1 |
0.3 |
GO:0022615 |
protein to membrane docking(GO:0022615) |
| 0.1 |
0.1 |
GO:0043652 |
engulfment of apoptotic cell(GO:0043652) |
| 0.1 |
0.4 |
GO:0045176 |
apical protein localization(GO:0045176) |
| 0.1 |
0.2 |
GO:0090235 |
regulation of metaphase plate congression(GO:0090235) |
| 0.1 |
0.9 |
GO:0007141 |
male meiosis I(GO:0007141) |
| 0.1 |
0.3 |
GO:0006013 |
mannose metabolic process(GO:0006013) |
| 0.1 |
0.5 |
GO:0000395 |
mRNA 5'-splice site recognition(GO:0000395) |
| 0.1 |
0.1 |
GO:0035407 |
histone H3-T11 phosphorylation(GO:0035407) |
| 0.1 |
0.2 |
GO:0010133 |
proline catabolic process to glutamate(GO:0010133) |
| 0.1 |
0.2 |
GO:0002528 |
regulation of vascular permeability involved in acute inflammatory response(GO:0002528) |
| 0.1 |
0.3 |
GO:0071874 |
response to norepinephrine(GO:0071873) cellular response to norepinephrine stimulus(GO:0071874) |
| 0.1 |
0.1 |
GO:0042414 |
epinephrine metabolic process(GO:0042414) epinephrine biosynthetic process(GO:0042418) |
| 0.1 |
0.2 |
GO:0070640 |
calcitriol biosynthetic process from calciol(GO:0036378) vitamin D3 metabolic process(GO:0070640) |
| 0.1 |
0.4 |
GO:0046465 |
dolichyl diphosphate biosynthetic process(GO:0006489) dolichyl diphosphate metabolic process(GO:0046465) |
| 0.1 |
0.9 |
GO:0034453 |
microtubule anchoring(GO:0034453) |
| 0.1 |
0.2 |
GO:1900226 |
negative regulation of NLRP3 inflammasome complex assembly(GO:1900226) |
| 0.1 |
0.7 |
GO:0001682 |
tRNA 5'-leader removal(GO:0001682) |
| 0.1 |
0.3 |
GO:0048642 |
negative regulation of skeletal muscle tissue development(GO:0048642) |
| 0.1 |
0.4 |
GO:1901621 |
negative regulation of smoothened signaling pathway involved in dorsal/ventral neural tube patterning(GO:1901621) |
| 0.1 |
0.3 |
GO:0006578 |
amino-acid betaine biosynthetic process(GO:0006578) |
| 0.1 |
0.6 |
GO:0090385 |
phagosome-lysosome fusion(GO:0090385) |
| 0.1 |
0.2 |
GO:0009757 |
hexose mediated signaling(GO:0009757) sugar mediated signaling pathway(GO:0010182) glucose mediated signaling pathway(GO:0010255) |
| 0.1 |
0.2 |
GO:0051695 |
actin filament uncapping(GO:0051695) |
| 0.1 |
0.2 |
GO:0001692 |
histamine metabolic process(GO:0001692) |
| 0.0 |
0.0 |
GO:0022417 |
protein maturation by protein folding(GO:0022417) |
| 0.0 |
0.3 |
GO:0001661 |
conditioned taste aversion(GO:0001661) |
| 0.0 |
0.5 |
GO:0033235 |
positive regulation of protein sumoylation(GO:0033235) |
| 0.0 |
0.1 |
GO:0035262 |
gonad morphogenesis(GO:0035262) |
| 0.0 |
0.2 |
GO:1901165 |
positive regulation of trophoblast cell migration(GO:1901165) |
| 0.0 |
0.1 |
GO:0046222 |
mycotoxin metabolic process(GO:0043385) aflatoxin metabolic process(GO:0046222) organic heteropentacyclic compound metabolic process(GO:1901376) |
| 0.0 |
0.2 |
GO:0060454 |
positive regulation of gastric acid secretion(GO:0060454) |
| 0.0 |
0.2 |
GO:0051388 |
positive regulation of neurotrophin TRK receptor signaling pathway(GO:0051388) |
| 0.0 |
0.2 |
GO:0009202 |
deoxyribonucleoside triphosphate biosynthetic process(GO:0009202) |
| 0.0 |
0.4 |
GO:0007207 |
adenylate cyclase-inhibiting G-protein coupled acetylcholine receptor signaling pathway(GO:0007197) phospholipase C-activating G-protein coupled acetylcholine receptor signaling pathway(GO:0007207) |
| 0.0 |
0.4 |
GO:0019323 |
pentose catabolic process(GO:0019323) |
| 0.0 |
0.1 |
GO:0006121 |
mitochondrial electron transport, succinate to ubiquinone(GO:0006121) |
| 0.0 |
0.1 |
GO:0035721 |
intraciliary retrograde transport(GO:0035721) |
| 0.0 |
0.8 |
GO:0032228 |
regulation of synaptic transmission, GABAergic(GO:0032228) |
| 0.0 |
0.9 |
GO:1904707 |
positive regulation of vascular smooth muscle cell proliferation(GO:1904707) |
| 0.0 |
0.8 |
GO:0006505 |
GPI anchor metabolic process(GO:0006505) |
| 0.0 |
1.1 |
GO:0046716 |
muscle cell cellular homeostasis(GO:0046716) |
| 0.0 |
0.1 |
GO:0070127 |
tRNA aminoacylation for mitochondrial protein translation(GO:0070127) |
| 0.0 |
0.1 |
GO:0014067 |
negative regulation of phosphatidylinositol 3-kinase signaling(GO:0014067) |
| 0.0 |
0.1 |
GO:0090071 |
negative regulation of ribosome biogenesis(GO:0090071) |
| 0.0 |
0.2 |
GO:0099590 |
neurotransmitter receptor internalization(GO:0099590) |
| 0.0 |
1.0 |
GO:0006646 |
phosphatidylethanolamine biosynthetic process(GO:0006646) |
| 0.0 |
0.2 |
GO:0061760 |
antifungal innate immune response(GO:0061760) |
| 0.0 |
2.6 |
GO:0044784 |
metaphase/anaphase transition of mitotic cell cycle(GO:0007091) metaphase/anaphase transition of cell cycle(GO:0044784) |
| 0.0 |
0.3 |
GO:0003360 |
brainstem development(GO:0003360) |
| 0.0 |
0.4 |
GO:0099639 |
endosome to plasma membrane protein transport(GO:0099638) neurotransmitter receptor transport, endosome to plasma membrane(GO:0099639) |
| 0.0 |
0.2 |
GO:0042073 |
intraciliary transport(GO:0042073) |
| 0.0 |
0.0 |
GO:0021539 |
subthalamus development(GO:0021539) |
| 0.0 |
0.1 |
GO:0010387 |
COP9 signalosome assembly(GO:0010387) |
| 0.0 |
0.9 |
GO:0070584 |
mitochondrion morphogenesis(GO:0070584) |
| 0.0 |
0.2 |
GO:0032286 |
central nervous system myelin maintenance(GO:0032286) |
| 0.0 |
0.7 |
GO:0009062 |
fatty acid catabolic process(GO:0009062) |
| 0.0 |
2.1 |
GO:0045762 |
positive regulation of adenylate cyclase activity(GO:0045762) |
| 0.0 |
0.3 |
GO:0035414 |
negative regulation of catenin import into nucleus(GO:0035414) |
| 0.0 |
0.1 |
GO:0090666 |
scaRNA localization to Cajal body(GO:0090666) |
| 0.0 |
0.0 |
GO:0060729 |
intestinal epithelial structure maintenance(GO:0060729) |
| 0.0 |
0.1 |
GO:1903301 |
positive regulation of glucokinase activity(GO:0033133) positive regulation of hexokinase activity(GO:1903301) |
| 0.0 |
0.2 |
GO:0046668 |
regulation of retinal cell programmed cell death(GO:0046668) |
| 0.0 |
0.1 |
GO:2000253 |
positive regulation of feeding behavior(GO:2000253) |
| 0.0 |
0.1 |
GO:0030047 |
actin modification(GO:0030047) |
| 0.0 |
0.3 |
GO:0030210 |
heparin metabolic process(GO:0030202) heparin biosynthetic process(GO:0030210) |
| 0.0 |
1.6 |
GO:0010633 |
negative regulation of epithelial cell migration(GO:0010633) |
| 0.0 |
0.1 |
GO:0039534 |
negative regulation of MDA-5 signaling pathway(GO:0039534) |
| 0.0 |
0.1 |
GO:0015817 |
histidine transport(GO:0015817) L-histidine transmembrane transport(GO:0089709) L-histidine transport(GO:1902024) |
| 0.0 |
0.5 |
GO:0035873 |
lactate transport(GO:0015727) lactate transmembrane transport(GO:0035873) |
| 0.0 |
0.3 |
GO:0043545 |
Mo-molybdopterin cofactor biosynthetic process(GO:0006777) Mo-molybdopterin cofactor metabolic process(GO:0019720) molybdopterin cofactor biosynthetic process(GO:0032324) molybdopterin cofactor metabolic process(GO:0043545) prosthetic group metabolic process(GO:0051189) |
| 0.0 |
0.2 |
GO:0035518 |
histone H2A monoubiquitination(GO:0035518) |
| 0.0 |
0.1 |
GO:0033693 |
neurofilament bundle assembly(GO:0033693) |
| 0.0 |
3.6 |
GO:0032981 |
NADH dehydrogenase complex assembly(GO:0010257) mitochondrial respiratory chain complex I assembly(GO:0032981) mitochondrial respiratory chain complex I biogenesis(GO:0097031) |
| 0.0 |
0.5 |
GO:0009313 |
oligosaccharide catabolic process(GO:0009313) |
| 0.0 |
0.2 |
GO:0070933 |
histone H4 deacetylation(GO:0070933) |
| 0.0 |
1.8 |
GO:0010738 |
regulation of protein kinase A signaling(GO:0010738) |
| 0.0 |
0.3 |
GO:0015793 |
glycerol transport(GO:0015793) |
| 0.0 |
0.0 |
GO:0060024 |
rhythmic synaptic transmission(GO:0060024) |
| 0.0 |
1.0 |
GO:2000811 |
negative regulation of anoikis(GO:2000811) |
| 0.0 |
0.7 |
GO:2000001 |
regulation of DNA damage checkpoint(GO:2000001) |
| 0.0 |
0.0 |
GO:0002644 |
negative regulation of tolerance induction(GO:0002644) |
| 0.0 |
0.3 |
GO:0042670 |
retinal cone cell differentiation(GO:0042670) retinal cone cell development(GO:0046549) |
| 0.0 |
8.2 |
GO:0031424 |
keratinization(GO:0031424) |
| 0.0 |
0.1 |
GO:0071317 |
cellular response to morphine(GO:0071315) cellular response to isoquinoline alkaloid(GO:0071317) |
| 0.0 |
0.3 |
GO:0046959 |
habituation(GO:0046959) |
| 0.0 |
0.2 |
GO:0044339 |
canonical Wnt signaling pathway involved in osteoblast differentiation(GO:0044339) |
| 0.0 |
0.3 |
GO:0006616 |
SRP-dependent cotranslational protein targeting to membrane, translocation(GO:0006616) |
| 0.0 |
0.1 |
GO:0035526 |
retrograde transport, plasma membrane to Golgi(GO:0035526) |
| 0.0 |
0.1 |
GO:0032455 |
nerve growth factor processing(GO:0032455) |
| 0.0 |
1.9 |
GO:0045143 |
homologous chromosome segregation(GO:0045143) |
| 0.0 |
0.2 |
GO:0000379 |
tRNA-type intron splice site recognition and cleavage(GO:0000379) |
| 0.0 |
0.5 |
GO:0032463 |
negative regulation of protein homooligomerization(GO:0032463) |
| 0.0 |
0.3 |
GO:0015867 |
ATP transport(GO:0015867) adenine nucleotide transport(GO:0051503) |
| 0.0 |
0.0 |
GO:1903626 |
positive regulation of DNA catabolic process(GO:1903626) |
| 0.0 |
0.1 |
GO:0045553 |
TRAIL biosynthetic process(GO:0045553) regulation of TRAIL biosynthetic process(GO:0045554) positive regulation of TRAIL biosynthetic process(GO:0045556) |
| 0.0 |
0.4 |
GO:0045605 |
negative regulation of epidermal cell differentiation(GO:0045605) |
| 0.0 |
0.4 |
GO:0010259 |
multicellular organism aging(GO:0010259) |
| 0.0 |
0.5 |
GO:0005980 |
glycogen catabolic process(GO:0005980) |
| 0.0 |
0.1 |
GO:0008628 |
hormone-mediated apoptotic signaling pathway(GO:0008628) |
| 0.0 |
0.2 |
GO:0033058 |
directional locomotion(GO:0033058) |
| 0.0 |
0.1 |
GO:0034427 |
nuclear-transcribed mRNA catabolic process, exonucleolytic, 3'-5'(GO:0034427) |
| 0.0 |
0.2 |
GO:0050651 |
dermatan sulfate biosynthetic process(GO:0030208) dermatan sulfate proteoglycan biosynthetic process(GO:0050651) |
| 0.0 |
0.2 |
GO:2000314 |
regulation of neural crest formation(GO:0090299) negative regulation of neural crest formation(GO:0090301) negative regulation of fibroblast growth factor receptor signaling pathway involved in neural plate anterior/posterior pattern formation(GO:2000314) |
| 0.0 |
0.1 |
GO:0042636 |
negative regulation of hair cycle(GO:0042636) |
| 0.0 |
0.1 |
GO:0050720 |
interleukin-1 beta biosynthetic process(GO:0050720) |
| 0.0 |
0.2 |
GO:1904354 |
negative regulation of telomere capping(GO:1904354) |
| 0.0 |
0.0 |
GO:0070370 |
heat acclimation(GO:0010286) cellular heat acclimation(GO:0070370) |
| 0.0 |
1.1 |
GO:0006283 |
transcription-coupled nucleotide-excision repair(GO:0006283) |
| 0.0 |
0.2 |
GO:0015705 |
iodide transport(GO:0015705) |
| 0.0 |
0.0 |
GO:0032224 |
positive regulation of synaptic transmission, cholinergic(GO:0032224) |
| 0.0 |
0.1 |
GO:0036518 |
chemorepulsion of dopaminergic neuron axon(GO:0036518) chemorepulsion of axon(GO:0061643) |
| 0.0 |
0.2 |
GO:0015853 |
adenine transport(GO:0015853) |
| 0.0 |
0.2 |
GO:0002329 |
pre-B cell differentiation(GO:0002329) |
| 0.0 |
0.2 |
GO:0097267 |
omega-hydroxylase P450 pathway(GO:0097267) |
| 0.0 |
0.3 |
GO:1903895 |
negative regulation of IRE1-mediated unfolded protein response(GO:1903895) |
| 0.0 |
0.5 |
GO:0031034 |
myosin filament assembly(GO:0031034) |
| 0.0 |
0.1 |
GO:0021759 |
globus pallidus development(GO:0021759) |
| 0.0 |
0.2 |
GO:0048388 |
endosomal lumen acidification(GO:0048388) |
| 0.0 |
0.3 |
GO:0006105 |
succinate metabolic process(GO:0006105) |
| 0.0 |
0.2 |
GO:1901202 |
negative regulation of extracellular matrix assembly(GO:1901202) |
| 0.0 |
0.2 |
GO:0043950 |
positive regulation of cAMP-mediated signaling(GO:0043950) |
| 0.0 |
0.1 |
GO:2000110 |
negative regulation of macrophage apoptotic process(GO:2000110) |
| 0.0 |
0.1 |
GO:0042369 |
vitamin D catabolic process(GO:0042369) |
| 0.0 |
0.1 |
GO:0071733 |
transcriptional activation by promoter-enhancer looping(GO:0071733) gene looping(GO:0090202) dsDNA loop formation(GO:0090579) |
| 0.0 |
0.1 |
GO:0015860 |
purine nucleoside transmembrane transport(GO:0015860) |
| 0.0 |
0.4 |
GO:1990034 |
calcium ion export from cell(GO:1990034) |
| 0.0 |
0.1 |
GO:0048386 |
positive regulation of retinoic acid receptor signaling pathway(GO:0048386) |
| 0.0 |
0.1 |
GO:0030961 |
peptidyl-arginine hydroxylation(GO:0030961) |
| 0.0 |
0.0 |
GO:0009181 |
purine nucleoside diphosphate catabolic process(GO:0009137) purine ribonucleoside diphosphate catabolic process(GO:0009181) |
| 0.0 |
0.1 |
GO:0099525 |
presynaptic dense core granule exocytosis(GO:0099525) |
| 0.0 |
1.1 |
GO:0042596 |
fear response(GO:0042596) |
| 0.0 |
0.3 |
GO:1904153 |
negative regulation of protein exit from endoplasmic reticulum(GO:0070862) negative regulation of retrograde protein transport, ER to cytosol(GO:1904153) |
| 0.0 |
0.1 |
GO:0019530 |
taurine metabolic process(GO:0019530) |
| 0.0 |
0.5 |
GO:0032802 |
low-density lipoprotein particle receptor catabolic process(GO:0032802) |
| 0.0 |
0.1 |
GO:0018032 |
protein amidation(GO:0018032) |
| 0.0 |
0.5 |
GO:0006488 |
dolichol-linked oligosaccharide biosynthetic process(GO:0006488) |
| 0.0 |
1.3 |
GO:0045599 |
negative regulation of fat cell differentiation(GO:0045599) |
| 0.0 |
0.0 |
GO:0046684 |
response to pyrethroid(GO:0046684) |
| 0.0 |
0.2 |
GO:0002021 |
response to dietary excess(GO:0002021) |
| 0.0 |
0.6 |
GO:0007095 |
mitotic G2 DNA damage checkpoint(GO:0007095) |
| 0.0 |
0.1 |
GO:0046639 |
negative regulation of alpha-beta T cell differentiation(GO:0046639) |
| 0.0 |
0.1 |
GO:0008065 |
establishment of blood-nerve barrier(GO:0008065) |
| 0.0 |
0.1 |
GO:0001956 |
positive regulation of neurotransmitter secretion(GO:0001956) |
| 0.0 |
0.0 |
GO:0072553 |
terminal button organization(GO:0072553) |
| 0.0 |
0.1 |
GO:0072365 |
regulation of cellular ketone metabolic process by negative regulation of transcription from RNA polymerase II promoter(GO:0072365) |
| 0.0 |
0.1 |
GO:0043416 |
regulation of skeletal muscle tissue regeneration(GO:0043416) |
| 0.0 |
0.1 |
GO:0007206 |
phospholipase C-activating G-protein coupled glutamate receptor signaling pathway(GO:0007206) |
| 0.0 |
0.2 |
GO:1902857 |
positive regulation of nonmotile primary cilium assembly(GO:1902857) |
| 0.0 |
0.2 |
GO:0033353 |
S-adenosylmethionine cycle(GO:0033353) |
| 0.0 |
0.0 |
GO:0019747 |
regulation of isoprenoid metabolic process(GO:0019747) |
| 0.0 |
0.1 |
GO:0007021 |
tubulin complex assembly(GO:0007021) |
| 0.0 |
0.4 |
GO:0021516 |
dorsal spinal cord development(GO:0021516) |
| 0.0 |
0.6 |
GO:0006388 |
tRNA splicing, via endonucleolytic cleavage and ligation(GO:0006388) |
| 0.0 |
0.2 |
GO:2000786 |
positive regulation of autophagosome assembly(GO:2000786) |
| 0.0 |
0.0 |
GO:0021626 |
hindbrain maturation(GO:0021578) central nervous system maturation(GO:0021626) |
| 0.0 |
0.7 |
GO:0035640 |
exploration behavior(GO:0035640) |
| 0.0 |
0.2 |
GO:0006177 |
GMP biosynthetic process(GO:0006177) |
| 0.0 |
0.3 |
GO:0070307 |
lens fiber cell development(GO:0070307) |
| 0.0 |
0.1 |
GO:0045041 |
protein import into mitochondrial intermembrane space(GO:0045041) |
| 0.0 |
0.4 |
GO:0052696 |
flavonoid glucuronidation(GO:0052696) xenobiotic glucuronidation(GO:0052697) |
| 0.0 |
0.1 |
GO:2000584 |
regulation of platelet-derived growth factor receptor-alpha signaling pathway(GO:2000583) negative regulation of platelet-derived growth factor receptor-alpha signaling pathway(GO:2000584) |
| 0.0 |
0.2 |
GO:1903564 |
regulation of protein localization to cilium(GO:1903564) positive regulation of protein localization to cilium(GO:1903566) |
| 0.0 |
0.2 |
GO:0030647 |
aminoglycoside antibiotic metabolic process(GO:0030647) |
| 0.0 |
0.1 |
GO:0014055 |
acetylcholine secretion, neurotransmission(GO:0014055) regulation of acetylcholine secretion, neurotransmission(GO:0014056) |
| 0.0 |
3.4 |
GO:0006334 |
nucleosome assembly(GO:0006334) |
| 0.0 |
0.3 |
GO:0051725 |
protein de-ADP-ribosylation(GO:0051725) |
| 0.0 |
0.8 |
GO:2000300 |
regulation of synaptic vesicle exocytosis(GO:2000300) |
| 0.0 |
0.1 |
GO:0044725 |
chromatin reprogramming in the zygote(GO:0044725) |
| 0.0 |
0.3 |
GO:0008340 |
determination of adult lifespan(GO:0008340) |
| 0.0 |
0.7 |
GO:0006895 |
Golgi to endosome transport(GO:0006895) |
| 0.0 |
0.3 |
GO:1901201 |
regulation of extracellular matrix assembly(GO:1901201) |
| 0.0 |
0.3 |
GO:0060973 |
cell migration involved in heart development(GO:0060973) |
| 0.0 |
0.8 |
GO:0031110 |
regulation of microtubule polymerization or depolymerization(GO:0031110) |
| 0.0 |
0.8 |
GO:0006465 |
signal peptide processing(GO:0006465) |
| 0.0 |
0.3 |
GO:0006528 |
asparagine metabolic process(GO:0006528) |
| 0.0 |
0.3 |
GO:0001767 |
establishment of lymphocyte polarity(GO:0001767) |
| 0.0 |
0.1 |
GO:0097502 |
mannosylation(GO:0097502) |
| 0.0 |
0.1 |
GO:0001878 |
response to yeast(GO:0001878) |
| 0.0 |
0.1 |
GO:0016102 |
retinoic acid biosynthetic process(GO:0002138) diterpenoid biosynthetic process(GO:0016102) |
| 0.0 |
0.1 |
GO:0048102 |
autophagic cell death(GO:0048102) |
| 0.0 |
0.3 |
GO:0051415 |
interphase microtubule nucleation by interphase microtubule organizing center(GO:0051415) microtubule nucleation by microtubule organizing center(GO:0051418) |
| 0.0 |
0.4 |
GO:1901072 |
glucosamine-containing compound catabolic process(GO:1901072) |
| 0.0 |
0.3 |
GO:0046951 |
ketone body biosynthetic process(GO:0046951) |
| 0.0 |
0.1 |
GO:1901159 |
glucuronate catabolic process(GO:0006064) glucuronate catabolic process to xylulose 5-phosphate(GO:0019640) xylulose 5-phosphate metabolic process(GO:0051167) xylulose 5-phosphate biosynthetic process(GO:1901159) |
| 0.0 |
0.1 |
GO:0002818 |
intracellular defense response(GO:0002818) |
| 0.0 |
0.1 |
GO:0072061 |
inner medullary collecting duct development(GO:0072061) |
| 0.0 |
0.2 |
GO:2000121 |
regulation of removal of superoxide radicals(GO:2000121) |
| 0.0 |
0.4 |
GO:0070911 |
global genome nucleotide-excision repair(GO:0070911) |
| 0.0 |
0.7 |
GO:0051123 |
RNA polymerase II transcriptional preinitiation complex assembly(GO:0051123) |
| 0.0 |
0.0 |
GO:0008615 |
pyridoxine metabolic process(GO:0008614) pyridoxine biosynthetic process(GO:0008615) vitamin B6 biosynthetic process(GO:0042819) |
| 0.0 |
0.1 |
GO:0034224 |
cellular response to zinc ion starvation(GO:0034224) |
| 0.0 |
0.2 |
GO:0060219 |
camera-type eye photoreceptor cell differentiation(GO:0060219) |
| 0.0 |
0.2 |
GO:0015015 |
heparan sulfate proteoglycan biosynthetic process, enzymatic modification(GO:0015015) |
| 0.0 |
0.3 |
GO:0000056 |
ribosomal small subunit export from nucleus(GO:0000056) |
| 0.0 |
0.0 |
GO:0035356 |
cellular triglyceride homeostasis(GO:0035356) |
| 0.0 |
0.1 |
GO:0031133 |
regulation of axon diameter(GO:0031133) |
| 0.0 |
0.4 |
GO:0001766 |
membrane raft polarization(GO:0001766) membrane raft distribution(GO:0031580) |
| 0.0 |
0.1 |
GO:0021910 |
smoothened signaling pathway involved in ventral spinal cord patterning(GO:0021910) |
| 0.0 |
0.0 |
GO:0009440 |
cyanate metabolic process(GO:0009439) cyanate catabolic process(GO:0009440) |
| 0.0 |
0.1 |
GO:0015014 |
heparan sulfate proteoglycan biosynthetic process, polysaccharide chain biosynthetic process(GO:0015014) |
| 0.0 |
0.1 |
GO:0050955 |
thermoception(GO:0050955) |
| 0.0 |
0.2 |
GO:0010764 |
negative regulation of fibroblast migration(GO:0010764) |
| 0.0 |
0.1 |
GO:0014052 |
regulation of gamma-aminobutyric acid secretion(GO:0014052) |
| 0.0 |
0.6 |
GO:0016024 |
CDP-diacylglycerol biosynthetic process(GO:0016024) |
| 0.0 |
0.1 |
GO:0007538 |
primary sex determination(GO:0007538) |
| 0.0 |
0.1 |
GO:0010731 |
protein glutathionylation(GO:0010731) regulation of protein glutathionylation(GO:0010732) negative regulation of protein glutathionylation(GO:0010734) |
| 0.0 |
0.7 |
GO:0050873 |
brown fat cell differentiation(GO:0050873) |
| 0.0 |
0.1 |
GO:0071422 |
succinate transport(GO:0015744) succinate transmembrane transport(GO:0071422) |
| 0.0 |
0.1 |
GO:0001794 |
type IIa hypersensitivity(GO:0001794) regulation of type IIa hypersensitivity(GO:0001796) type II hypersensitivity(GO:0002445) regulation of type II hypersensitivity(GO:0002892) |
| 0.0 |
0.1 |
GO:0014827 |
intestine smooth muscle contraction(GO:0014827) |
| 0.0 |
1.1 |
GO:0046037 |
GMP metabolic process(GO:0046037) |
| 0.0 |
0.2 |
GO:0006686 |
sphingomyelin biosynthetic process(GO:0006686) |
| 0.0 |
0.2 |
GO:0042428 |
serotonin metabolic process(GO:0042428) |
| 0.0 |
0.2 |
GO:0000972 |
transcription-dependent tethering of RNA polymerase II gene DNA at nuclear periphery(GO:0000972) |
| 0.0 |
0.5 |
GO:0033141 |
positive regulation of peptidyl-serine phosphorylation of STAT protein(GO:0033141) |
| 0.0 |
0.2 |
GO:0033564 |
anterior/posterior axon guidance(GO:0033564) |
| 0.0 |
0.1 |
GO:1904526 |
regulation of microtubule binding(GO:1904526) |
| 0.0 |
0.2 |
GO:0032100 |
positive regulation of response to food(GO:0032097) positive regulation of appetite(GO:0032100) |
| 0.0 |
0.1 |
GO:0046341 |
CDP-diacylglycerol metabolic process(GO:0046341) |
| 0.0 |
0.1 |
GO:0021960 |
anterior commissure morphogenesis(GO:0021960) |
| 0.0 |
0.1 |
GO:0002865 |
negative regulation of type IV hypersensitivity(GO:0001808) negative regulation of acute inflammatory response to antigenic stimulus(GO:0002865) negative regulation of hypersensitivity(GO:0002884) |
| 0.0 |
0.1 |
GO:0033629 |
negative regulation of cell adhesion mediated by integrin(GO:0033629) |
| 0.0 |
0.2 |
GO:0071236 |
cellular response to antibiotic(GO:0071236) |
| 0.0 |
1.0 |
GO:0014047 |
glutamate secretion(GO:0014047) |
| 0.0 |
0.1 |
GO:0000451 |
rRNA 2'-O-methylation(GO:0000451) |
| 0.0 |
0.6 |
GO:0045332 |
lipid translocation(GO:0034204) phospholipid translocation(GO:0045332) |
| 0.0 |
0.0 |
GO:0061146 |
Peyer's patch morphogenesis(GO:0061146) |
| 0.0 |
0.1 |
GO:0001845 |
phagolysosome assembly(GO:0001845) |
| 0.0 |
0.3 |
GO:0043039 |
tRNA aminoacylation(GO:0043039) |
| 0.0 |
0.1 |
GO:0060526 |
prostate glandular acinus morphogenesis(GO:0060526) prostate epithelial cord arborization involved in prostate glandular acinus morphogenesis(GO:0060527) |
| 0.0 |
0.1 |
GO:1904338 |
regulation of dopaminergic neuron differentiation(GO:1904338) |
| 0.0 |
0.2 |
GO:0048853 |
forebrain morphogenesis(GO:0048853) |
| 0.0 |
0.1 |
GO:0045955 |
negative regulation of calcium ion-dependent exocytosis(GO:0045955) |
| 0.0 |
0.7 |
GO:0043968 |
histone H2A acetylation(GO:0043968) |
| 0.0 |
0.3 |
GO:0097369 |
sodium ion import(GO:0097369) |
| 0.0 |
0.1 |
GO:0090675 |
intermicrovillar adhesion(GO:0090675) |
| 0.0 |
0.3 |
GO:0008209 |
androgen metabolic process(GO:0008209) |
| 0.0 |
0.4 |
GO:0007258 |
JUN phosphorylation(GO:0007258) |
| 0.0 |
0.0 |
GO:1901856 |
negative regulation of cellular respiration(GO:1901856) |
| 0.0 |
0.4 |
GO:0090286 |
cytoskeletal anchoring at nuclear membrane(GO:0090286) |
| 0.0 |
0.2 |
GO:1901661 |
quinone metabolic process(GO:1901661) |
| 0.0 |
0.7 |
GO:0030488 |
tRNA methylation(GO:0030488) |
| 0.0 |
0.1 |
GO:0015888 |
thiamine transport(GO:0015888) |
| 0.0 |
0.4 |
GO:0035988 |
chondrocyte proliferation(GO:0035988) |
| 0.0 |
0.9 |
GO:0006458 |
'de novo' protein folding(GO:0006458) |
| 0.0 |
0.2 |
GO:0002175 |
protein localization to paranode region of axon(GO:0002175) |
| 0.0 |
3.5 |
GO:0007051 |
spindle organization(GO:0007051) |
| 0.0 |
0.5 |
GO:0048026 |
positive regulation of mRNA splicing, via spliceosome(GO:0048026) |
| 0.0 |
0.1 |
GO:0007614 |
short-term memory(GO:0007614) |
| 0.0 |
0.1 |
GO:0030718 |
germ-line stem cell population maintenance(GO:0030718) |
| 0.0 |
0.5 |
GO:0050718 |
positive regulation of interleukin-1 beta secretion(GO:0050718) |
| 0.0 |
0.1 |
GO:2000809 |
positive regulation of synaptic vesicle clustering(GO:2000809) |
| 0.0 |
0.1 |
GO:0050916 |
sensory perception of sweet taste(GO:0050916) |
| 0.0 |
0.1 |
GO:0001880 |
Mullerian duct regression(GO:0001880) |
| 0.0 |
0.1 |
GO:0009447 |
putrescine catabolic process(GO:0009447) |
| 0.0 |
0.1 |
GO:0007099 |
centriole replication(GO:0007099) |
| 0.0 |
0.1 |
GO:0035606 |
peptidyl-cysteine S-trans-nitrosylation(GO:0035606) |
| 0.0 |
0.2 |
GO:0002710 |
negative regulation of T cell mediated immunity(GO:0002710) |
| 0.0 |
0.3 |
GO:0036150 |
phosphatidylserine acyl-chain remodeling(GO:0036150) |
| 0.0 |
0.3 |
GO:0045086 |
positive regulation of interleukin-2 biosynthetic process(GO:0045086) |
| 0.0 |
0.5 |
GO:0061003 |
positive regulation of dendritic spine morphogenesis(GO:0061003) |
| 0.0 |
0.1 |
GO:1904970 |
brush border assembly(GO:1904970) |
| 0.0 |
0.3 |
GO:1902455 |
negative regulation of stem cell population maintenance(GO:1902455) |
| 0.0 |
0.2 |
GO:0045721 |
negative regulation of gluconeogenesis(GO:0045721) |
| 0.0 |
0.1 |
GO:0002384 |
hepatic immune response(GO:0002384) |
| 0.0 |
0.6 |
GO:0006123 |
mitochondrial electron transport, cytochrome c to oxygen(GO:0006123) |
| 0.0 |
0.1 |
GO:0051684 |
maintenance of Golgi location(GO:0051684) |
| 0.0 |
0.2 |
GO:0035331 |
negative regulation of hippo signaling(GO:0035331) |
| 0.0 |
0.0 |
GO:1903721 |
regulation of I-kappaB phosphorylation(GO:1903719) positive regulation of I-kappaB phosphorylation(GO:1903721) |
| 0.0 |
0.1 |
GO:0010360 |
negative regulation of anion channel activity(GO:0010360) |
| 0.0 |
0.2 |
GO:0097039 |
protein linear polyubiquitination(GO:0097039) |
| 0.0 |
0.2 |
GO:0043584 |
nose development(GO:0043584) |
| 0.0 |
0.0 |
GO:0048842 |
positive regulation of axon extension involved in axon guidance(GO:0048842) |
| 0.0 |
0.1 |
GO:1990253 |
cellular response to leucine starvation(GO:1990253) |
| 0.0 |
0.2 |
GO:0061709 |
reticulophagy(GO:0061709) |
| 0.0 |
0.1 |
GO:0018057 |
peptidyl-lysine oxidation(GO:0018057) |
| 0.0 |
0.0 |
GO:0010982 |
negative regulation of very-low-density lipoprotein particle remodeling(GO:0010903) regulation of high-density lipoprotein particle clearance(GO:0010982) regulation of Cdc42 protein signal transduction(GO:0032489) negative regulation of cholesterol import(GO:0060621) negative regulation of sterol import(GO:2000910) |
| 0.0 |
0.1 |
GO:0007221 |
positive regulation of transcription of Notch receptor target(GO:0007221) |
| 0.0 |
0.1 |
GO:0007016 |
cytoskeletal anchoring at plasma membrane(GO:0007016) |
| 0.0 |
0.1 |
GO:0019805 |
quinolinate biosynthetic process(GO:0019805) |
| 0.0 |
0.0 |
GO:1903093 |
negative regulation of protein deubiquitination(GO:0090086) regulation of protein K48-linked deubiquitination(GO:1903093) negative regulation of protein K48-linked deubiquitination(GO:1903094) negative regulation of ubiquitin-specific protease activity(GO:2000157) |
| 0.0 |
0.0 |
GO:0042711 |
maternal behavior(GO:0042711) parental behavior(GO:0060746) |
| 0.0 |
0.1 |
GO:0001777 |
T cell homeostatic proliferation(GO:0001777) regulation of T cell homeostatic proliferation(GO:0046013) |
| 0.0 |
0.1 |
GO:1903593 |
regulation of histamine secretion by mast cell(GO:1903593) |
| 0.0 |
0.4 |
GO:0046597 |
negative regulation of viral entry into host cell(GO:0046597) |
| 0.0 |
0.2 |
GO:0060732 |
positive regulation of inositol phosphate biosynthetic process(GO:0060732) |
| 0.0 |
0.0 |
GO:0098828 |
positive regulation of inhibitory postsynaptic potential(GO:0097151) modulation of inhibitory postsynaptic potential(GO:0098828) |
| 0.0 |
0.6 |
GO:0033555 |
multicellular organismal response to stress(GO:0033555) |
| 0.0 |
0.0 |
GO:0050902 |
leukocyte adhesive activation(GO:0050902) |
| 0.0 |
0.0 |
GO:0032431 |
activation of phospholipase A2 activity(GO:0032431) |
| 0.0 |
0.1 |
GO:0014010 |
Schwann cell proliferation(GO:0014010) |
| 0.0 |
0.1 |
GO:0010890 |
positive regulation of sequestering of triglyceride(GO:0010890) |
| 0.0 |
0.2 |
GO:0032914 |
positive regulation of transforming growth factor beta1 production(GO:0032914) |
| 0.0 |
0.1 |
GO:0035810 |
positive regulation of urine volume(GO:0035810) |
| 0.0 |
0.1 |
GO:0090241 |
negative regulation of histone H4 acetylation(GO:0090241) |
| 0.0 |
0.5 |
GO:0016339 |
calcium-dependent cell-cell adhesion via plasma membrane cell adhesion molecules(GO:0016339) |
| 0.0 |
0.1 |
GO:0007161 |
calcium-independent cell-matrix adhesion(GO:0007161) |
| 0.0 |
0.1 |
GO:0051647 |
nucleus localization(GO:0051647) |
| 0.0 |
0.1 |
GO:0018106 |
peptidyl-histidine phosphorylation(GO:0018106) |
| 0.0 |
0.1 |
GO:0002143 |
tRNA wobble position uridine thiolation(GO:0002143) |
| 0.0 |
0.1 |
GO:0035864 |
response to potassium ion(GO:0035864) |
| 0.0 |
0.1 |
GO:0051694 |
pointed-end actin filament capping(GO:0051694) |
| 0.0 |
0.4 |
GO:0015695 |
organic cation transport(GO:0015695) |
| 0.0 |
0.0 |
GO:0030200 |
heparan sulfate proteoglycan catabolic process(GO:0030200) |
| 0.0 |
0.2 |
GO:0090110 |
cargo loading into COPII-coated vesicle(GO:0090110) |
| 0.0 |
0.6 |
GO:0006270 |
DNA replication initiation(GO:0006270) |
| 0.0 |
0.0 |
GO:1901339 |
regulation of store-operated calcium channel activity(GO:1901339) |
| 0.0 |
0.0 |
GO:0038158 |
granulocyte colony-stimulating factor signaling pathway(GO:0038158) |
| 0.0 |
0.6 |
GO:2001259 |
positive regulation of cation channel activity(GO:2001259) |
| 0.0 |
0.0 |
GO:0033182 |
regulation of histone ubiquitination(GO:0033182) |
| 0.0 |
0.0 |
GO:0009750 |
response to fructose(GO:0009750) |
| 0.0 |
0.0 |
GO:0038171 |
cannabinoid signaling pathway(GO:0038171) |
| 0.0 |
0.2 |
GO:0039532 |
negative regulation of viral-induced cytoplasmic pattern recognition receptor signaling pathway(GO:0039532) |
| 0.0 |
0.0 |
GO:1990000 |
amyloid fibril formation(GO:1990000) |
| 0.0 |
0.7 |
GO:0043303 |
mast cell activation involved in immune response(GO:0002279) mast cell degranulation(GO:0043303) |
| 0.0 |
0.0 |
GO:0070365 |
hepatocyte differentiation(GO:0070365) |
| 0.0 |
0.3 |
GO:0051281 |
positive regulation of release of sequestered calcium ion into cytosol(GO:0051281) |
| 0.0 |
0.0 |
GO:0007210 |
adenylate cyclase-inhibiting serotonin receptor signaling pathway(GO:0007198) serotonin receptor signaling pathway(GO:0007210) |
| 0.0 |
0.1 |
GO:0051013 |
microtubule severing(GO:0051013) |
| 0.0 |
0.0 |
GO:1902613 |
regulation of anti-Mullerian hormone signaling pathway(GO:1902612) negative regulation of anti-Mullerian hormone signaling pathway(GO:1902613) anti-Mullerian hormone signaling pathway(GO:1990262) |
| 0.0 |
0.1 |
GO:0045023 |
G0 to G1 transition(GO:0045023) |
| 0.0 |
0.1 |
GO:0007635 |
chemosensory behavior(GO:0007635) |
| 0.0 |
0.0 |
GO:0001992 |
regulation of systemic arterial blood pressure by vasopressin(GO:0001992) |
| 0.0 |
0.1 |
GO:0001867 |
complement activation, lectin pathway(GO:0001867) |
| 0.0 |
0.2 |
GO:0000460 |
maturation of 5.8S rRNA(GO:0000460) |
| 0.0 |
0.1 |
GO:0051775 |
response to redox state(GO:0051775) |
| 0.0 |
0.3 |
GO:1904659 |
hexose transmembrane transport(GO:0035428) glucose transmembrane transport(GO:1904659) |
| 0.0 |
0.0 |
GO:0042779 |
tRNA 3'-trailer cleavage, endonucleolytic(GO:0034414) tRNA 3'-trailer cleavage(GO:0042779) |
| 0.0 |
0.1 |
GO:0021902 |
commitment of neuronal cell to specific neuron type in forebrain(GO:0021902) |
| 0.0 |
0.0 |
GO:0010481 |
epidermal cell division(GO:0010481) regulation of epidermal cell division(GO:0010482) |
| 0.0 |
0.1 |
GO:0045738 |
negative regulation of DNA repair(GO:0045738) negative regulation of double-strand break repair(GO:2000780) |
| 0.0 |
0.1 |
GO:0043568 |
positive regulation of insulin-like growth factor receptor signaling pathway(GO:0043568) |
| 0.0 |
0.0 |
GO:0044557 |
relaxation of smooth muscle(GO:0044557) relaxation of vascular smooth muscle(GO:0060087) |
| 0.0 |
0.0 |
GO:0002572 |
pro-T cell differentiation(GO:0002572) |
| 0.0 |
0.0 |
GO:0070508 |
sterol import(GO:0035376) cholesterol import(GO:0070508) |
| 0.0 |
0.1 |
GO:0046519 |
sphingoid metabolic process(GO:0046519) |
| 0.0 |
0.0 |
GO:0043605 |
cellular amide catabolic process(GO:0043605) |
| 0.0 |
0.1 |
GO:0097264 |
self proteolysis(GO:0097264) |
| 0.0 |
0.1 |
GO:0060261 |
positive regulation of transcription initiation from RNA polymerase II promoter(GO:0060261) |
| 0.0 |
0.1 |
GO:0007140 |
male meiosis(GO:0007140) |
| 0.0 |
0.1 |
GO:0015886 |
heme transport(GO:0015886) |
| 0.0 |
0.3 |
GO:0034776 |
response to histamine(GO:0034776) |
| 0.0 |
0.0 |
GO:0070314 |
G1 to G0 transition(GO:0070314) |
| 0.0 |
0.2 |
GO:0001502 |
cartilage condensation(GO:0001502) |
| 0.0 |
0.0 |
GO:0009099 |
branched-chain amino acid biosynthetic process(GO:0009082) leucine biosynthetic process(GO:0009098) valine biosynthetic process(GO:0009099) |
| 0.0 |
0.1 |
GO:0000463 |
maturation of LSU-rRNA from tricistronic rRNA transcript (SSU-rRNA, 5.8S rRNA, LSU-rRNA)(GO:0000463) |
| 0.0 |
0.0 |
GO:0021797 |
forebrain anterior/posterior pattern specification(GO:0021797) |
| 0.0 |
0.0 |
GO:0046040 |
IMP metabolic process(GO:0046040) |
| 0.0 |
0.0 |
GO:0009240 |
isopentenyl diphosphate biosynthetic process(GO:0009240) isopentenyl diphosphate biosynthetic process, mevalonate pathway(GO:0019287) isopentenyl diphosphate metabolic process(GO:0046490) |
| 0.0 |
0.2 |
GO:0006782 |
protoporphyrinogen IX biosynthetic process(GO:0006782) |
| 0.0 |
0.1 |
GO:0070166 |
enamel mineralization(GO:0070166) |
| 0.0 |
0.2 |
GO:0003091 |
renal water homeostasis(GO:0003091) |
| 0.0 |
0.0 |
GO:1902514 |
regulation of calcium ion transmembrane transport via high voltage-gated calcium channel(GO:1902514) |
| 0.0 |
0.1 |
GO:0021520 |
spinal cord motor neuron cell fate specification(GO:0021520) |
| 0.0 |
0.2 |
GO:0006517 |
protein deglycosylation(GO:0006517) |
| 0.0 |
0.1 |
GO:0097646 |
calcitonin family receptor signaling pathway(GO:0097646) amylin receptor signaling pathway(GO:0097647) |
| 0.0 |
0.0 |
GO:1901142 |
insulin metabolic process(GO:1901142) |
| 0.0 |
0.3 |
GO:0007638 |
mechanosensory behavior(GO:0007638) |
| 0.0 |
0.0 |
GO:0002933 |
lipid hydroxylation(GO:0002933) |
| 0.0 |
0.2 |
GO:0048268 |
clathrin coat assembly(GO:0048268) |
| 0.0 |
0.1 |
GO:0000491 |
small nucleolar ribonucleoprotein complex assembly(GO:0000491) |
| 0.0 |
0.1 |
GO:0006312 |
mitotic recombination(GO:0006312) |
| 0.0 |
0.2 |
GO:0033120 |
positive regulation of RNA splicing(GO:0033120) |
| 0.0 |
0.1 |
GO:0035608 |
protein deglutamylation(GO:0035608) |
| 0.0 |
0.0 |
GO:1901529 |
positive regulation of anion channel activity(GO:1901529) |
| 0.0 |
1.3 |
GO:0045047 |
protein targeting to ER(GO:0045047) |
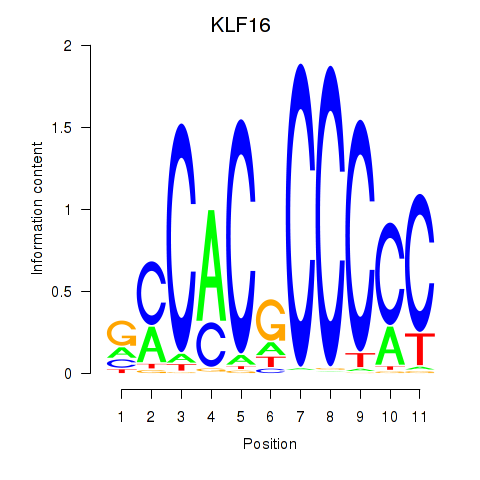
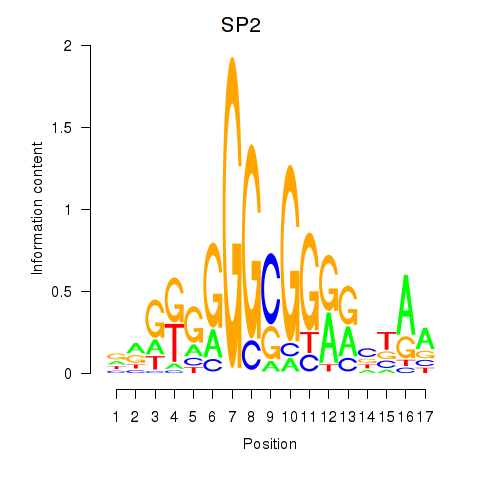
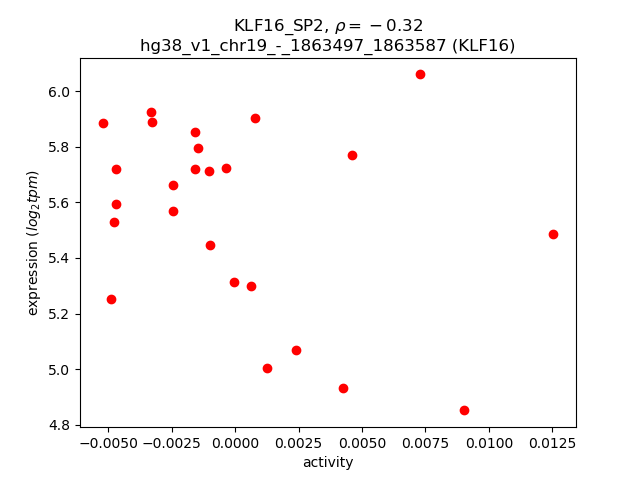

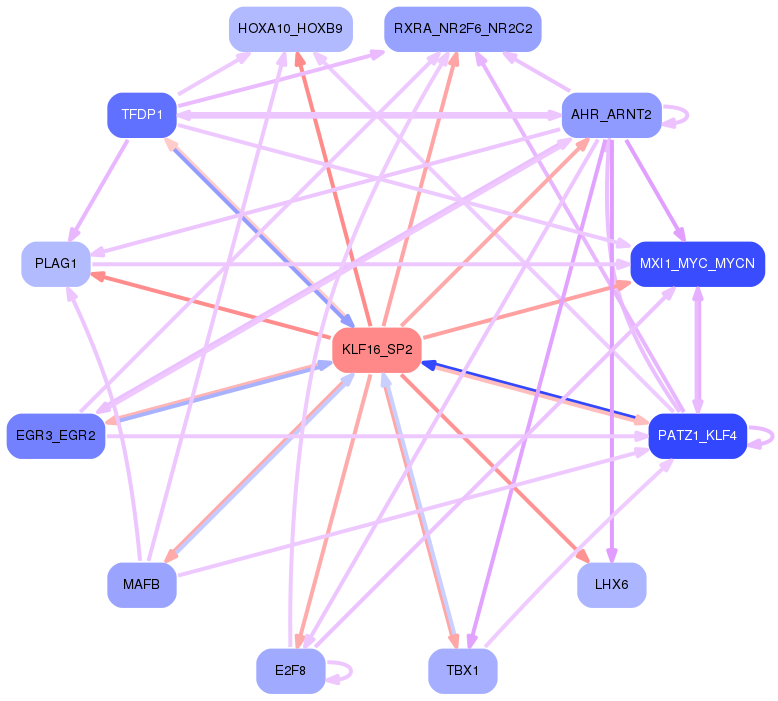