Project
Inflammatory response time course, HUVEC (Wada, 2009)
Navigation
Downloads
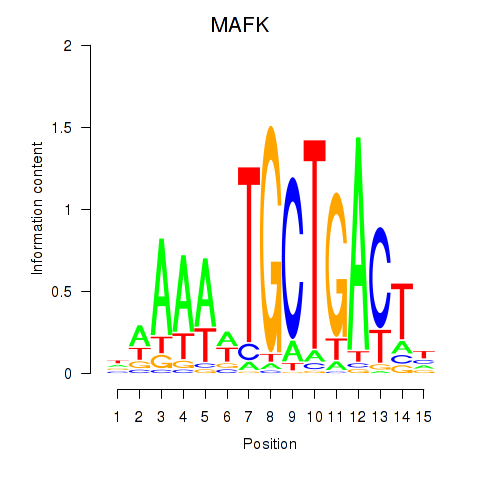
Results for MAFK
Z-value: 0.69
Motif logo
Transcription factors associated with MAFK
| Gene Symbol | Gene ID | Gene Info |
|---|---|---|
|
MAFK
|
ENSG00000198517.10 | MAFK |
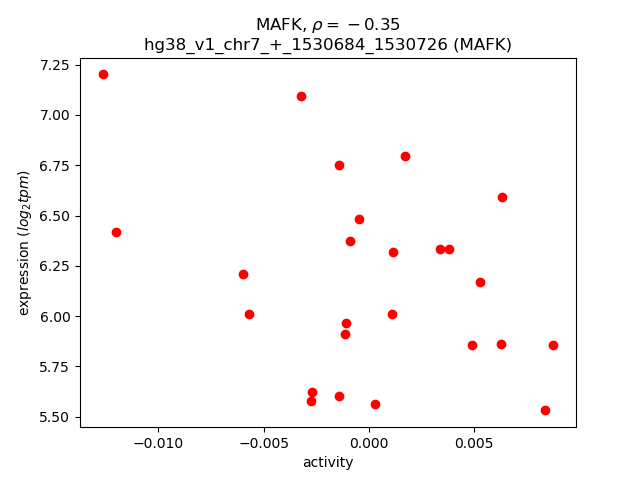
Activity-expression correlation:
| Gene | Promoter | Pearson corr. coef. | P-value | Plot |
|---|---|---|---|---|
| MAFK | hg38_v1_chr7_+_1530684_1530726 | -0.35 | 8.2e-02 | Click! |
Activity profile of MAFK motif
Sorted Z-values of MAFK motif
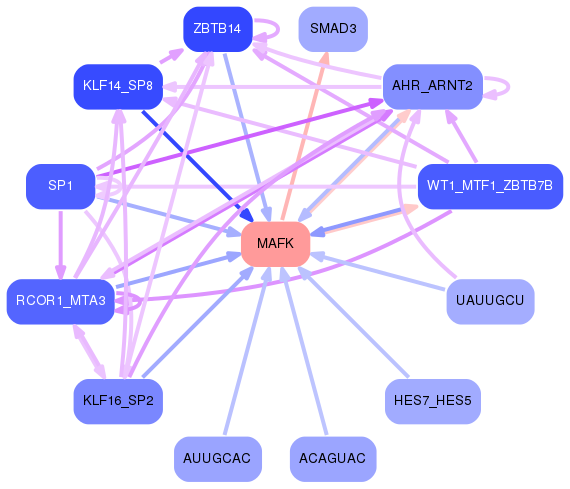
Network of associatons between targets according to the STRING database.

First level regulatory network of MAFK
| Promoter | Score | Transcript | Gene | Gene Info |
|---|---|---|---|---|
| chr9_-_120914549 | 3.55 |
ENST00000546084.5
|
TRAF1
|
TNF receptor associated factor 1 |
| chr1_-_173050931 | 2.71 |
ENST00000404377.5
|
TNFSF18
|
TNF superfamily member 18 |
| chr3_+_122680802 | 2.34 |
ENST00000474629.7
|
PARP14
|
poly(ADP-ribose) polymerase family member 14 |
| chr1_-_169734064 | 2.06 |
ENST00000333360.12
|
SELE
|
selectin E |
| chr4_-_68670648 | 1.51 |
ENST00000338206.6
|
UGT2B15
|
UDP glucuronosyltransferase family 2 member B15 |
| chr5_+_114056017 | 1.31 |
ENST00000512097.9
|
KCNN2
|
potassium calcium-activated channel subfamily N member 2 |
| chr15_-_79971164 | 1.29 |
ENST00000335661.6
ENST00000267953.4 ENST00000677151.1 |
BCL2A1
|
BCL2 related protein A1 |
| chr1_-_89126066 | 0.96 |
ENST00000370466.4
|
GBP2
|
guanylate binding protein 2 |
| chr6_+_32844789 | 0.92 |
ENST00000414474.5
|
PSMB9
|
proteasome 20S subunit beta 9 |
| chr1_+_86547070 | 0.84 |
ENST00000370563.3
|
CLCA4
|
chloride channel accessory 4 |
| chr2_+_108377947 | 0.81 |
ENST00000272452.7
|
SULT1C4
|
sulfotransferase family 1C member 4 |
| chr3_+_183265302 | 0.78 |
ENST00000465010.1
|
B3GNT5
|
UDP-GlcNAc:betaGal beta-1,3-N-acetylglucosaminyltransferase 5 |
| chr16_-_75556214 | 0.75 |
ENST00000568377.5
ENST00000565067.5 ENST00000258173.11 |
TMEM231
|
transmembrane protein 231 |
| chr1_-_7940825 | 0.75 |
ENST00000377507.8
|
TNFRSF9
|
TNF receptor superfamily member 9 |
| chr6_+_125919296 | 0.74 |
ENST00000444128.2
|
NCOA7
|
nuclear receptor coactivator 7 |
| chr15_+_67138001 | 0.73 |
ENST00000439724.7
|
SMAD3
|
SMAD family member 3 |
| chr19_+_20776292 | 0.70 |
ENST00000360204.5
ENST00000344519.10 ENST00000594534.5 |
ZNF66
|
zinc finger protein 66 |
| chr21_+_42499600 | 0.69 |
ENST00000398341.7
|
SLC37A1
|
solute carrier family 37 member 1 |
| chr20_-_56525925 | 0.69 |
ENST00000243913.8
|
GCNT7
|
glucosaminyl (N-acetyl) transferase family member 7 |
| chr1_-_150765735 | 0.67 |
ENST00000679898.1
ENST00000448301.7 ENST00000680664.1 ENST00000679512.1 ENST00000368985.8 ENST00000679582.1 |
CTSS
|
cathepsin S |
| chr6_+_4706133 | 0.66 |
ENST00000328908.9
|
CDYL
|
chromodomain Y like |
| chrX_+_1336775 | 0.66 |
ENST00000331035.10
ENST00000432757.6 |
IL3RA
|
interleukin 3 receptor subunit alpha |
| chr14_+_22070548 | 0.65 |
ENST00000390450.3
|
TRAV22
|
T cell receptor alpha variable 22 |
| chr2_+_161136901 | 0.65 |
ENST00000259075.6
ENST00000432002.5 |
TANK
|
TRAF family member associated NFKB activator |
| chr2_+_90021567 | 0.65 |
ENST00000436451.2
|
IGKV6D-21
|
immunoglobulin kappa variable 6D-21 (non-functional) |
| chr6_+_29099490 | 0.65 |
ENST00000641659.2
|
OR2J1
|
olfactory receptor family 2 subfamily J member 1 |
| chr12_+_116910935 | 0.64 |
ENST00000652555.1
ENST00000455858.2 |
FBXW8
|
F-box and WD repeat domain containing 8 |
| chr6_-_37257622 | 0.64 |
ENST00000650812.1
ENST00000497775.1 ENST00000478262.2 ENST00000356757.7 |
ENSG00000286105.1
TMEM217
|
novel transmembrane protein transmembrane protein 217 |
| chr6_-_37257643 | 0.63 |
ENST00000651039.1
ENST00000652495.1 ENST00000652218.1 |
TMEM217
|
transmembrane protein 217 |
| chr6_-_37257590 | 0.63 |
ENST00000336655.7
|
TMEM217
|
transmembrane protein 217 |
| chr12_-_70788914 | 0.63 |
ENST00000342084.8
|
PTPRR
|
protein tyrosine phosphatase receptor type R |
| chr3_-_172711005 | 0.63 |
ENST00000424772.2
ENST00000475381.7 |
NCEH1
|
neutral cholesterol ester hydrolase 1 |
| chr2_+_161160299 | 0.63 |
ENST00000440506.5
ENST00000429217.5 ENST00000406287.5 ENST00000402568.5 |
TANK
|
TRAF family member associated NFKB activator |
| chr1_+_78620722 | 0.63 |
ENST00000679848.1
|
IFI44L
|
interferon induced protein 44 like |
| chr7_-_56034133 | 0.62 |
ENST00000421626.5
|
PSPH
|
phosphoserine phosphatase |
| chr11_-_57568276 | 0.62 |
ENST00000340573.8
|
UBE2L6
|
ubiquitin conjugating enzyme E2 L6 |
| chr1_-_150765785 | 0.62 |
ENST00000680311.1
ENST00000681728.1 ENST00000680288.1 |
CTSS
|
cathepsin S |
| chr15_-_55249029 | 0.61 |
ENST00000566877.5
|
RAB27A
|
RAB27A, member RAS oncogene family |
| chr3_-_122564577 | 0.59 |
ENST00000477522.6
ENST00000360356.6 |
PARP9
|
poly(ADP-ribose) polymerase family member 9 |
| chr12_-_89526253 | 0.59 |
ENST00000547474.1
|
POC1B-GALNT4
|
POC1B-GALNT4 readthrough |
| chr22_+_36913620 | 0.58 |
ENST00000403662.8
ENST00000262825.9 |
CSF2RB
|
colony stimulating factor 2 receptor subunit beta |
| chr18_+_24113341 | 0.58 |
ENST00000540918.2
|
TTC39C
|
tetratricopeptide repeat domain 39C |
| chr4_+_78057313 | 0.57 |
ENST00000508900.2
ENST00000684159.1 ENST00000682513.1 ENST00000512123.4 |
FRAS1
|
Fraser extracellular matrix complex subunit 1 |
| chr5_-_147401591 | 0.54 |
ENST00000520473.1
|
DPYSL3
|
dihydropyrimidinase like 3 |
| chr12_+_77830886 | 0.54 |
ENST00000397909.7
ENST00000549464.5 |
NAV3
|
neuron navigator 3 |
| chr19_+_38899680 | 0.53 |
ENST00000576510.5
ENST00000392079.7 |
NFKBIB
|
NFKB inhibitor beta |
| chr5_+_141421064 | 0.52 |
ENST00000518882.2
|
PCDHGA11
|
protocadherin gamma subfamily A, 11 |
| chr18_+_63887698 | 0.52 |
ENST00000457692.5
ENST00000299502.9 ENST00000413956.5 |
SERPINB2
|
serpin family B member 2 |
| chr9_-_21368962 | 0.52 |
ENST00000610660.1
|
IFNA13
|
interferon alpha 13 |
| chr2_+_108378176 | 0.52 |
ENST00000409309.3
|
SULT1C4
|
sulfotransferase family 1C member 4 |
| chr3_+_183253795 | 0.51 |
ENST00000460419.1
|
B3GNT5
|
UDP-GlcNAc:betaGal beta-1,3-N-acetylglucosaminyltransferase 5 |
| chr19_-_10380558 | 0.50 |
ENST00000524462.5
ENST00000525621.6 ENST00000531836.5 |
TYK2
|
tyrosine kinase 2 |
| chr6_-_83193882 | 0.50 |
ENST00000506587.5
ENST00000507554.1 |
PGM3
|
phosphoglucomutase 3 |
| chr10_+_84452208 | 0.50 |
ENST00000480006.1
|
CCSER2
|
coiled-coil serine rich protein 2 |
| chr11_+_35943981 | 0.50 |
ENST00000528989.5
ENST00000524419.5 ENST00000315571.6 |
LDLRAD3
|
low density lipoprotein receptor class A domain containing 3 |
| chr17_+_68515399 | 0.49 |
ENST00000588188.6
|
PRKAR1A
|
protein kinase cAMP-dependent type I regulatory subunit alpha |
| chr12_-_89526164 | 0.48 |
ENST00000548729.5
|
POC1B-GALNT4
|
POC1B-GALNT4 readthrough |
| chr15_-_55270383 | 0.48 |
ENST00000396307.6
|
RAB27A
|
RAB27A, member RAS oncogene family |
| chr15_-_35085295 | 0.47 |
ENST00000528386.4
|
NANOGP8
|
Nanog homeobox retrogene P8 |
| chr12_+_112906777 | 0.47 |
ENST00000452357.7
ENST00000445409.7 |
OAS1
|
2'-5'-oligoadenylate synthetase 1 |
| chr2_+_222861059 | 0.47 |
ENST00000681697.1
ENST00000680921.1 |
ACSL3
|
acyl-CoA synthetase long chain family member 3 |
| chr8_-_63026179 | 0.47 |
ENST00000677919.1
|
GGH
|
gamma-glutamyl hydrolase |
| chr10_+_88664439 | 0.45 |
ENST00000394375.7
ENST00000608620.5 ENST00000238983.9 ENST00000355843.2 |
LIPF
|
lipase F, gastric type |
| chr15_-_55270874 | 0.45 |
ENST00000567380.5
ENST00000565972.5 ENST00000569493.5 |
RAB27A
|
RAB27A, member RAS oncogene family |
| chr20_-_63568074 | 0.45 |
ENST00000427522.6
|
HELZ2
|
helicase with zinc finger 2 |
| chr6_-_26271815 | 0.45 |
ENST00000614378.1
|
H3C8
|
H3 clustered histone 8 |
| chr8_+_95133940 | 0.45 |
ENST00000519516.1
|
PLEKHF2
|
pleckstrin homology and FYVE domain containing 2 |
| chr2_+_201129318 | 0.44 |
ENST00000417748.1
|
CFLAR
|
CASP8 and FADD like apoptosis regulator |
| chr16_-_67936808 | 0.44 |
ENST00000358514.9
|
PSMB10
|
proteasome 20S subunit beta 10 |
| chr10_-_13001705 | 0.44 |
ENST00000378825.5
|
CCDC3
|
coiled-coil domain containing 3 |
| chr7_+_28685968 | 0.44 |
ENST00000396298.6
|
CREB5
|
cAMP responsive element binding protein 5 |
| chr19_+_38899946 | 0.44 |
ENST00000572515.5
ENST00000313582.6 ENST00000575359.5 |
NFKBIB
|
NFKB inhibitor beta |
| chr5_+_141330494 | 0.44 |
ENST00000517417.3
ENST00000378105.4 |
PCDHGA1
|
protocadherin gamma subfamily A, 1 |
| chr7_+_143222037 | 0.44 |
ENST00000408947.4
|
TAS2R40
|
taste 2 receptor member 40 |
| chr12_-_10098977 | 0.43 |
ENST00000315330.8
ENST00000457018.6 |
CLEC1A
|
C-type lectin domain family 1 member A |
| chr3_+_42856021 | 0.43 |
ENST00000493193.1
|
ACKR2
|
atypical chemokine receptor 2 |
| chr2_+_161160420 | 0.42 |
ENST00000392749.7
ENST00000405852.5 |
TANK
|
TRAF family member associated NFKB activator |
| chr11_-_57410113 | 0.42 |
ENST00000529411.1
|
ENSG00000254979.5
|
novel protein |
| chr12_+_75481204 | 0.42 |
ENST00000550491.1
|
GLIPR1
|
GLI pathogenesis related 1 |
| chr11_-_5154757 | 0.41 |
ENST00000380367.3
|
OR52A1
|
olfactory receptor family 52 subfamily A member 1 |
| chr17_+_68525795 | 0.41 |
ENST00000592800.5
|
PRKAR1A
|
protein kinase cAMP-dependent type I regulatory subunit alpha |
| chr6_+_137871208 | 0.41 |
ENST00000614035.4
ENST00000621150.3 ENST00000619035.4 ENST00000615468.4 ENST00000620204.3 |
TNFAIP3
|
TNF alpha induced protein 3 |
| chr12_-_51009264 | 0.41 |
ENST00000545993.7
|
SLC11A2
|
solute carrier family 11 member 2 |
| chr5_+_35856883 | 0.41 |
ENST00000506850.5
ENST00000303115.8 ENST00000511982.1 |
IL7R
|
interleukin 7 receptor |
| chr4_-_170090153 | 0.41 |
ENST00000509167.5
ENST00000353187.6 ENST00000507375.5 ENST00000515480.5 |
AADAT
|
aminoadipate aminotransferase |
| chr8_-_95269190 | 0.41 |
ENST00000286688.6
|
C8orf37
|
chromosome 8 open reading frame 37 |
| chr2_-_230225628 | 0.40 |
ENST00000540870.5
|
SP110
|
SP110 nuclear body protein |
| chr10_+_15032193 | 0.40 |
ENST00000428897.5
ENST00000413672.5 |
OLAH
|
oleoyl-ACP hydrolase |
| chr6_-_11779606 | 0.40 |
ENST00000506810.1
|
ADTRP
|
androgen dependent TFPI regulating protein |
| chr2_-_100142575 | 0.39 |
ENST00000317233.8
ENST00000672204.1 ENST00000416492.5 ENST00000672857.1 ENST00000672756.2 |
AFF3
|
AF4/FMR2 family member 3 |
| chr20_+_59721210 | 0.39 |
ENST00000395636.6
ENST00000361300.4 |
PHACTR3
|
phosphatase and actin regulator 3 |
| chr3_+_102099244 | 0.39 |
ENST00000491959.5
|
ZPLD1
|
zona pellucida like domain containing 1 |
| chr6_+_6588082 | 0.39 |
ENST00000379953.6
|
LY86
|
lymphocyte antigen 86 |
| chr1_-_120051714 | 0.38 |
ENST00000579475.7
|
NOTCH2
|
notch receptor 2 |
| chr22_+_23145366 | 0.38 |
ENST00000341989.9
ENST00000263116.8 |
RAB36
|
RAB36, member RAS oncogene family |
| chr3_+_155083523 | 0.38 |
ENST00000680057.1
|
MME
|
membrane metalloendopeptidase |
| chr6_+_125919210 | 0.37 |
ENST00000438495.6
|
NCOA7
|
nuclear receptor coactivator 7 |
| chr19_-_2151525 | 0.37 |
ENST00000345016.9
ENST00000643116.3 |
AP3D1
|
adaptor related protein complex 3 subunit delta 1 |
| chr3_-_112829367 | 0.36 |
ENST00000448932.4
ENST00000617549.3 |
CD200R1L
|
CD200 receptor 1 like |
| chr17_-_62806632 | 0.36 |
ENST00000583803.1
ENST00000456609.6 |
MARCHF10
|
membrane associated ring-CH-type finger 10 |
| chr4_+_99511008 | 0.36 |
ENST00000514652.5
ENST00000326581.9 |
C4orf17
|
chromosome 4 open reading frame 17 |
| chr8_-_100950549 | 0.36 |
ENST00000395951.7
|
YWHAZ
|
tyrosine 3-monooxygenase/tryptophan 5-monooxygenase activation protein zeta |
| chr7_+_116499687 | 0.36 |
ENST00000222693.5
ENST00000343213.2 |
CAV2
|
caveolin 2 |
| chr11_+_64186219 | 0.35 |
ENST00000543847.1
|
STIP1
|
stress induced phosphoprotein 1 |
| chr6_+_36676455 | 0.35 |
ENST00000615513.4
|
CDKN1A
|
cyclin dependent kinase inhibitor 1A |
| chr8_+_85245451 | 0.35 |
ENST00000321764.4
|
CA13
|
carbonic anhydrase 13 |
| chr1_-_160343235 | 0.35 |
ENST00000368069.7
ENST00000241704.8 ENST00000647683.1 ENST00000649787.1 |
COPA
|
COPI coat complex subunit alpha |
| chr12_+_112907006 | 0.35 |
ENST00000680455.1
ENST00000551241.6 ENST00000550689.2 ENST00000679841.1 ENST00000679494.1 ENST00000553185.2 |
OAS1
|
2'-5'-oligoadenylate synthetase 1 |
| chr10_+_27532521 | 0.35 |
ENST00000683924.1
|
RAB18
|
RAB18, member RAS oncogene family |
| chr11_-_6030758 | 0.35 |
ENST00000641900.1
|
OR56A1
|
olfactory receptor family 56 subfamily A member 1 |
| chr13_-_60013178 | 0.34 |
ENST00000498416.2
ENST00000465066.5 |
DIAPH3
|
diaphanous related formin 3 |
| chrX_+_41689006 | 0.34 |
ENST00000378138.5
ENST00000620846.1 ENST00000649219.1 |
GPR34
|
G protein-coupled receptor 34 |
| chrX_-_8171267 | 0.34 |
ENST00000317103.5
|
VCX2
|
variable charge X-linked 2 |
| chr3_+_155083889 | 0.34 |
ENST00000680282.1
|
MME
|
membrane metalloendopeptidase |
| chr22_+_23696400 | 0.34 |
ENST00000452208.1
|
RGL4
|
ral guanine nucleotide dissociation stimulator like 4 |
| chr2_+_222860942 | 0.33 |
ENST00000392066.7
ENST00000680251.1 ENST00000679541.1 ENST00000679545.1 ENST00000680395.1 |
ACSL3
|
acyl-CoA synthetase long chain family member 3 |
| chr5_-_147081428 | 0.33 |
ENST00000394413.7
|
PPP2R2B
|
protein phosphatase 2 regulatory subunit Bbeta |
| chr1_-_247078804 | 0.33 |
ENST00000366503.3
|
ZNF670
|
zinc finger protein 670 |
| chr6_+_106098933 | 0.33 |
ENST00000369089.3
|
PRDM1
|
PR/SET domain 1 |
| chr22_+_31212207 | 0.33 |
ENST00000406516.5
ENST00000331728.9 |
LIMK2
|
LIM domain kinase 2 |
| chr7_+_134866831 | 0.33 |
ENST00000435928.1
|
CALD1
|
caldesmon 1 |
| chr5_+_33936386 | 0.33 |
ENST00000330120.5
|
RXFP3
|
relaxin family peptide receptor 3 |
| chr1_+_119368773 | 0.33 |
ENST00000457318.5
ENST00000622548.4 ENST00000325945.4 |
HAO2
|
hydroxyacid oxidase 2 |
| chr16_+_57245229 | 0.32 |
ENST00000219204.8
|
ARL2BP
|
ADP ribosylation factor like GTPase 2 binding protein |
| chr1_+_119368802 | 0.32 |
ENST00000361035.8
ENST00000419144.1 |
HAO2
HAO2-IT1
|
hydroxyacid oxidase 2 HAO2 intronic transcript 1 |
| chr14_+_20955484 | 0.32 |
ENST00000304625.3
|
RNASE2
|
ribonuclease A family member 2 |
| chr20_+_32358979 | 0.32 |
ENST00000646985.1
ENST00000497249.6 |
ASXL1
|
ASXL transcriptional regulator 1 |
| chr21_-_30372265 | 0.32 |
ENST00000399889.4
|
KRTAP13-2
|
keratin associated protein 13-2 |
| chr10_-_73591330 | 0.32 |
ENST00000451492.5
ENST00000681793.1 ENST00000680396.1 ENST00000413442.5 |
USP54
|
ubiquitin specific peptidase 54 |
| chr5_-_59216826 | 0.31 |
ENST00000638939.1
|
PDE4D
|
phosphodiesterase 4D |
| chr6_+_63563448 | 0.31 |
ENST00000673199.1
|
PTP4A1
|
protein tyrosine phosphatase 4A1 |
| chr13_+_24160740 | 0.31 |
ENST00000382095.8
|
SPATA13
|
spermatogenesis associated 13 |
| chr3_+_172754457 | 0.31 |
ENST00000441497.6
|
ECT2
|
epithelial cell transforming 2 |
| chr4_+_95051671 | 0.31 |
ENST00000440890.7
|
BMPR1B
|
bone morphogenetic protein receptor type 1B |
| chr7_+_44200960 | 0.31 |
ENST00000496112.5
ENST00000678359.1 ENST00000223369.3 ENST00000677090.1 |
YKT6
|
YKT6 v-SNARE homolog |
| chr7_+_144048948 | 0.31 |
ENST00000641693.1
|
OR2A5
|
olfactory receptor family 2 subfamily A member 5 |
| chr19_+_7030578 | 0.31 |
ENST00000329753.5
|
MBD3L5
|
methyl-CpG binding domain protein 3 like 5 |
| chrX_-_84502442 | 0.30 |
ENST00000297977.9
ENST00000506585.6 ENST00000373177.3 ENST00000449553.2 |
HDX
|
highly divergent homeobox |
| chr9_-_35732122 | 0.30 |
ENST00000314888.10
|
TLN1
|
talin 1 |
| chr1_+_111139436 | 0.30 |
ENST00000545121.5
|
CEPT1
|
choline/ethanolamine phosphotransferase 1 |
| chr18_-_26090584 | 0.30 |
ENST00000415083.7
|
SS18
|
SS18 subunit of BAF chromatin remodeling complex |
| chr2_+_201129483 | 0.30 |
ENST00000440180.5
|
CFLAR
|
CASP8 and FADD like apoptosis regulator |
| chr15_+_84981981 | 0.30 |
ENST00000339708.9
|
PDE8A
|
phosphodiesterase 8A |
| chr20_-_56497608 | 0.30 |
ENST00000617620.1
|
GCNT7
|
glucosaminyl (N-acetyl) transferase family member 7 |
| chr11_-_5509929 | 0.30 |
ENST00000311659.5
ENST00000445998.1 |
UBQLN3
|
ubiquilin 3 |
| chr8_+_80485641 | 0.30 |
ENST00000430430.5
|
ZBTB10
|
zinc finger and BTB domain containing 10 |
| chr18_-_12656716 | 0.29 |
ENST00000462226.1
ENST00000497844.6 ENST00000309836.9 ENST00000453447.6 |
SPIRE1
|
spire type actin nucleation factor 1 |
| chr20_+_4171709 | 0.29 |
ENST00000379460.6
|
SMOX
|
spermine oxidase |
| chr11_+_30231000 | 0.29 |
ENST00000254122.8
ENST00000533718.2 ENST00000417547.1 |
FSHB
|
follicle stimulating hormone subunit beta |
| chrX_+_41688967 | 0.29 |
ENST00000378142.9
|
GPR34
|
G protein-coupled receptor 34 |
| chr11_-_55936400 | 0.29 |
ENST00000301532.3
|
OR5I1
|
olfactory receptor family 5 subfamily I member 1 |
| chrX_+_35798342 | 0.29 |
ENST00000399988.5
ENST00000399992.5 ENST00000399987.5 ENST00000399989.5 |
MAGEB16
|
MAGE family member B16 |
| chr12_+_69825273 | 0.29 |
ENST00000547771.6
|
MYRFL
|
myelin regulatory factor like |
| chr3_-_71360753 | 0.29 |
ENST00000648783.1
|
FOXP1
|
forkhead box P1 |
| chr10_+_80537902 | 0.29 |
ENST00000339284.6
ENST00000646907.2 |
SH2D4B
|
SH2 domain containing 4B |
| chr15_-_55319107 | 0.29 |
ENST00000565225.1
ENST00000436697.3 ENST00000567948.1 ENST00000563262.5 |
PIGBOS1
RAB27A
|
PIGB opposite strand 1 RAB27A, member RAS oncogene family |
| chr6_-_49744434 | 0.29 |
ENST00000433368.6
ENST00000354620.4 |
CRISP3
|
cysteine rich secretory protein 3 |
| chr3_+_119147375 | 0.28 |
ENST00000490594.2
|
ENSG00000251012.2
|
novel chromosome 3 open reading frame 30 (C3orf30) and uroplakin 1B (UPK1B) |
| chr11_-_125778788 | 0.28 |
ENST00000436890.2
|
PATE2
|
prostate and testis expressed 2 |
| chr21_-_26090035 | 0.28 |
ENST00000448850.5
|
APP
|
amyloid beta precursor protein |
| chrX_+_50204753 | 0.28 |
ENST00000376042.6
|
CCNB3
|
cyclin B3 |
| chr6_+_36029082 | 0.28 |
ENST00000472333.1
|
MAPK14
|
mitogen-activated protein kinase 14 |
| chr3_+_148739798 | 0.28 |
ENST00000402260.2
|
AGTR1
|
angiotensin II receptor type 1 |
| chr9_-_70414657 | 0.28 |
ENST00000377126.4
|
KLF9
|
Kruppel like factor 9 |
| chr17_+_41255384 | 0.28 |
ENST00000394008.1
|
KRTAP9-9
|
keratin associated protein 9-9 |
| chr5_-_144170607 | 0.28 |
ENST00000448443.6
ENST00000513112.5 ENST00000519064.5 ENST00000274496.10 ENST00000522203.5 |
YIPF5
|
Yip1 domain family member 5 |
| chr1_-_16156059 | 0.28 |
ENST00000358432.8
|
EPHA2
|
EPH receptor A2 |
| chr6_+_37257762 | 0.27 |
ENST00000373491.3
|
TBC1D22B
|
TBC1 domain family member 22B |
| chr3_+_178536205 | 0.27 |
ENST00000420517.6
|
KCNMB2
|
potassium calcium-activated channel subfamily M regulatory beta subunit 2 |
| chr11_-_117876892 | 0.27 |
ENST00000539526.5
|
FXYD6
|
FXYD domain containing ion transport regulator 6 |
| chr19_+_7049321 | 0.27 |
ENST00000381393.3
|
MBD3L2
|
methyl-CpG binding domain protein 3 like 2 |
| chr3_-_71493500 | 0.27 |
ENST00000648380.1
ENST00000650295.1 |
FOXP1
|
forkhead box P1 |
| chr2_+_85539158 | 0.27 |
ENST00000306434.8
|
MAT2A
|
methionine adenosyltransferase 2A |
| chr5_-_16508788 | 0.27 |
ENST00000682142.1
|
RETREG1
|
reticulophagy regulator 1 |
| chr2_-_89160329 | 0.27 |
ENST00000390256.2
|
IGKV6-21
|
immunoglobulin kappa variable 6-21 (non-functional) |
| chr3_+_178419123 | 0.27 |
ENST00000614557.1
ENST00000455307.5 ENST00000436432.1 |
ENSG00000275163.1
LINC01014
|
potassium large conductance calcium-activated channel, subfamily M, beta member 2 (KCNMB2-IT1 - KCNMB2 readthrough transcript) long intergenic non-protein coding RNA 1014 |
| chr6_-_43528867 | 0.27 |
ENST00000455285.2
|
XPO5
|
exportin 5 |
| chr6_-_158819355 | 0.27 |
ENST00000367075.4
|
EZR
|
ezrin |
| chr5_+_136028979 | 0.26 |
ENST00000442011.7
|
TGFBI
|
transforming growth factor beta induced |
| chr5_+_136160986 | 0.26 |
ENST00000507637.1
|
SMAD5
|
SMAD family member 5 |
| chr2_+_88885397 | 0.26 |
ENST00000390243.2
|
IGKV4-1
|
immunoglobulin kappa variable 4-1 |
| chr8_+_124973288 | 0.26 |
ENST00000319286.6
|
ZNF572
|
zinc finger protein 572 |
| chr12_-_10098940 | 0.26 |
ENST00000420265.2
|
CLEC1A
|
C-type lectin domain family 1 member A |
| chr4_+_94996232 | 0.26 |
ENST00000512312.5
|
BMPR1B
|
bone morphogenetic protein receptor type 1B |
| chr16_+_50696999 | 0.26 |
ENST00000300589.6
|
NOD2
|
nucleotide binding oligomerization domain containing 2 |
| chr5_-_147081462 | 0.26 |
ENST00000508267.5
ENST00000504198.5 |
PPP2R2B
|
protein phosphatase 2 regulatory subunit Bbeta |
| chr3_+_141384790 | 0.26 |
ENST00000507722.5
|
ZBTB38
|
zinc finger and BTB domain containing 38 |
| chr11_-_117877463 | 0.26 |
ENST00000527717.5
|
FXYD6
|
FXYD domain containing ion transport regulator 6 |
| chr12_+_51239278 | 0.25 |
ENST00000551313.1
|
DAZAP2
|
DAZ associated protein 2 |
| chr19_+_43576800 | 0.25 |
ENST00000612042.4
|
PINLYP
|
phospholipase A2 inhibitor and LY6/PLAUR domain containing |
| chr1_+_179293760 | 0.25 |
ENST00000367619.8
|
SOAT1
|
sterol O-acyltransferase 1 |
| chr1_-_150808251 | 0.25 |
ENST00000271651.8
ENST00000676970.1 ENST00000679260.1 ENST00000676751.1 ENST00000677887.1 |
CTSK
|
cathepsin K |
| chr8_+_32721823 | 0.25 |
ENST00000539990.3
ENST00000519240.5 |
NRG1
|
neuregulin 1 |
| chr6_-_47042306 | 0.25 |
ENST00000371253.7
|
ADGRF1
|
adhesion G protein-coupled receptor F1 |
| chr19_-_6737565 | 0.25 |
ENST00000601716.1
ENST00000264080.11 |
GPR108
|
G protein-coupled receptor 108 |
| chr9_+_128455180 | 0.25 |
ENST00000497812.6
ENST00000393533.6 |
ODF2
|
outer dense fiber of sperm tails 2 |
| chr15_+_73873604 | 0.24 |
ENST00000535547.6
ENST00000562056.1 |
TBC1D21
|
TBC1 domain family member 21 |
| chr22_+_50486784 | 0.24 |
ENST00000395733.7
|
MIOX
|
myo-inositol oxygenase |
| chr3_-_57597443 | 0.24 |
ENST00000463880.1
|
ARF4
|
ADP ribosylation factor 4 |
| chr3_+_178536407 | 0.24 |
ENST00000452583.6
|
KCNMB2
|
potassium calcium-activated channel subfamily M regulatory beta subunit 2 |
Gene Ontology Analysis
Gene overrepresentation in biological process category:
| Log-likelihood per target | Total log-likelihood | Term | Description |
|---|---|---|---|
| 0.7 | 2.7 | GO:2000329 | negative regulation of T-helper 17 cell lineage commitment(GO:2000329) |
| 0.4 | 1.3 | GO:0034769 | basement membrane disassembly(GO:0034769) |
| 0.4 | 1.2 | GO:0038156 | interleukin-3-mediated signaling pathway(GO:0038156) |
| 0.3 | 1.8 | GO:1903435 | positive regulation of constitutive secretory pathway(GO:1903435) |
| 0.3 | 1.7 | GO:2000158 | positive regulation of ubiquitin-specific protease activity(GO:2000158) |
| 0.2 | 0.8 | GO:2001247 | positive regulation of phosphatidylcholine biosynthetic process(GO:2001247) |
| 0.1 | 0.4 | GO:0070429 | regulation of toll-like receptor 5 signaling pathway(GO:0034147) negative regulation of toll-like receptor 5 signaling pathway(GO:0034148) negative regulation of nucleotide-binding oligomerization domain containing 1 signaling pathway(GO:0070429) |
| 0.1 | 0.3 | GO:0035419 | activation of MAPK activity involved in innate immune response(GO:0035419) |
| 0.1 | 0.7 | GO:2001180 | negative regulation of interleukin-10 secretion(GO:2001180) |
| 0.1 | 0.4 | GO:0036466 | synaptic vesicle recycling via endosome(GO:0036466) |
| 0.1 | 0.7 | GO:0061767 | negative regulation of lung blood pressure(GO:0061767) |
| 0.1 | 0.5 | GO:0046900 | tetrahydrofolylpolyglutamate metabolic process(GO:0046900) |
| 0.1 | 0.1 | GO:0009441 | glycolate metabolic process(GO:0009441) |
| 0.1 | 0.3 | GO:1990654 | regulation of extrathymic T cell differentiation(GO:0033082) sebum secreting cell proliferation(GO:1990654) |
| 0.1 | 0.6 | GO:1903385 | regulation of homophilic cell adhesion(GO:1903385) |
| 0.1 | 0.5 | GO:0035359 | negative regulation of peroxisome proliferator activated receptor signaling pathway(GO:0035359) |
| 0.1 | 0.6 | GO:0006041 | glucosamine metabolic process(GO:0006041) |
| 0.1 | 1.3 | GO:0098914 | membrane repolarization during atrial cardiac muscle cell action potential(GO:0098914) |
| 0.1 | 0.3 | GO:1901491 | notochord formation(GO:0014028) axial mesoderm formation(GO:0048320) negative regulation of lymphangiogenesis(GO:1901491) |
| 0.1 | 0.3 | GO:0035281 | pre-miRNA export from nucleus(GO:0035281) |
| 0.1 | 0.4 | GO:0001915 | negative regulation of T cell mediated cytotoxicity(GO:0001915) |
| 0.1 | 0.7 | GO:0015760 | hexose phosphate transport(GO:0015712) glucose-6-phosphate transport(GO:0015760) |
| 0.1 | 0.3 | GO:0000454 | snoRNA guided rRNA pseudouridine synthesis(GO:0000454) |
| 0.1 | 2.3 | GO:0002523 | leukocyte migration involved in inflammatory response(GO:0002523) |
| 0.1 | 0.4 | GO:0015692 | lead ion transport(GO:0015692) |
| 0.1 | 0.4 | GO:0033512 | L-lysine catabolic process to acetyl-CoA via saccharopine(GO:0033512) |
| 0.1 | 0.6 | GO:1902731 | ovarian cumulus expansion(GO:0001550) fused antrum stage(GO:0048165) negative regulation of chondrocyte proliferation(GO:1902731) |
| 0.1 | 0.8 | GO:0071492 | cellular response to UV-A(GO:0071492) |
| 0.1 | 0.2 | GO:0048058 | compound eye corneal lens development(GO:0048058) |
| 0.1 | 0.2 | GO:1903015 | regulation of exo-alpha-sialidase activity(GO:1903015) |
| 0.1 | 0.3 | GO:0086097 | phospholipase C-activating angiotensin-activated signaling pathway(GO:0086097) |
| 0.1 | 0.7 | GO:1903944 | regulation of hepatocyte apoptotic process(GO:1903943) negative regulation of hepatocyte apoptotic process(GO:1903944) |
| 0.1 | 0.3 | GO:0006556 | S-adenosylmethionine biosynthetic process(GO:0006556) |
| 0.1 | 0.5 | GO:0061709 | reticulophagy(GO:0061709) |
| 0.1 | 0.3 | GO:0090290 | positive regulation of osteoclast proliferation(GO:0090290) |
| 0.1 | 0.2 | GO:2001226 | negative regulation of chloride transport(GO:2001226) |
| 0.1 | 0.4 | GO:0044789 | modulation by host of viral release from host cell(GO:0044789) positive regulation by host of viral release from host cell(GO:0044791) |
| 0.1 | 0.6 | GO:0032020 | ISG15-protein conjugation(GO:0032020) |
| 0.1 | 0.3 | GO:0042713 | sperm ejaculation(GO:0042713) |
| 0.1 | 1.3 | GO:1902083 | negative regulation of peptidyl-cysteine S-nitrosylation(GO:1902083) |
| 0.1 | 0.6 | GO:0070212 | protein poly-ADP-ribosylation(GO:0070212) |
| 0.1 | 0.2 | GO:1903487 | regulation of lactation(GO:1903487) |
| 0.1 | 0.3 | GO:0046208 | spermine catabolic process(GO:0046208) |
| 0.1 | 0.2 | GO:0045065 | cytotoxic T cell differentiation(GO:0045065) |
| 0.1 | 0.2 | GO:0034402 | recruitment of 3'-end processing factors to RNA polymerase II holoenzyme complex(GO:0034402) |
| 0.1 | 0.3 | GO:2001184 | positive regulation of interleukin-12 secretion(GO:2001184) |
| 0.1 | 0.4 | GO:0036337 | Fas signaling pathway(GO:0036337) |
| 0.1 | 0.5 | GO:0002051 | osteoblast fate commitment(GO:0002051) |
| 0.1 | 0.5 | GO:0086024 | adrenergic receptor signaling pathway involved in positive regulation of heart rate(GO:0086024) |
| 0.1 | 0.3 | GO:1902896 | terminal web assembly(GO:1902896) |
| 0.1 | 0.9 | GO:0046007 | negative regulation of activated T cell proliferation(GO:0046007) |
| 0.1 | 0.2 | GO:0030451 | regulation of complement activation, alternative pathway(GO:0030451) negative regulation of complement activation, alternative pathway(GO:0045957) |
| 0.1 | 0.2 | GO:0030505 | inorganic diphosphate transport(GO:0030505) |
| 0.1 | 0.3 | GO:0042986 | positive regulation of amyloid precursor protein biosynthetic process(GO:0042986) |
| 0.1 | 0.7 | GO:0006564 | L-serine biosynthetic process(GO:0006564) |
| 0.0 | 0.1 | GO:0032826 | natural killer cell differentiation involved in immune response(GO:0002325) negative regulation of natural killer cell differentiation(GO:0032824) regulation of natural killer cell differentiation involved in immune response(GO:0032826) negative regulation of natural killer cell differentiation involved in immune response(GO:0032827) positive regulation of cytolysis in other organism(GO:0051714) |
| 0.0 | 0.2 | GO:0019249 | lactate biosynthetic process(GO:0019249) |
| 0.0 | 0.2 | GO:0002774 | Fc receptor mediated inhibitory signaling pathway(GO:0002774) |
| 0.0 | 0.1 | GO:0060309 | elastin catabolic process(GO:0060309) |
| 0.0 | 0.3 | GO:0071874 | microglia differentiation(GO:0014004) microglia development(GO:0014005) collateral sprouting in absence of injury(GO:0048669) smooth endoplasmic reticulum calcium ion homeostasis(GO:0051563) cellular response to norepinephrine stimulus(GO:0071874) |
| 0.0 | 0.1 | GO:1901860 | positive regulation of mitochondrial DNA metabolic process(GO:1901860) |
| 0.0 | 0.2 | GO:2000870 | oocyte growth(GO:0001555) regulation of progesterone secretion(GO:2000870) |
| 0.0 | 0.1 | GO:1903517 | regulation of telomere maintenance via recombination(GO:0032207) negative regulation of telomere maintenance via recombination(GO:0032208) negative regulation of single strand break repair(GO:1903517) negative regulation of beta-galactosidase activity(GO:1903770) telomere single strand break repair(GO:1903823) negative regulation of telomere single strand break repair(GO:1903824) |
| 0.0 | 0.1 | GO:0044278 | cell wall disruption in other organism(GO:0044278) |
| 0.0 | 0.4 | GO:0031666 | positive regulation of lipopolysaccharide-mediated signaling pathway(GO:0031666) |
| 0.0 | 0.1 | GO:0031508 | pericentric heterochromatin assembly(GO:0031508) |
| 0.0 | 0.3 | GO:0006701 | progesterone biosynthetic process(GO:0006701) Sertoli cell proliferation(GO:0060011) |
| 0.0 | 0.1 | GO:0006391 | transcription initiation from mitochondrial promoter(GO:0006391) |
| 0.0 | 0.4 | GO:0060574 | intestinal epithelial cell maturation(GO:0060574) |
| 0.0 | 0.9 | GO:0035589 | G-protein coupled purinergic nucleotide receptor signaling pathway(GO:0035589) |
| 0.0 | 0.2 | GO:0000912 | assembly of actomyosin apparatus involved in cytokinesis(GO:0000912) actomyosin contractile ring assembly(GO:0000915) actomyosin contractile ring organization(GO:0044837) |
| 0.0 | 0.5 | GO:0006108 | malate metabolic process(GO:0006108) |
| 0.0 | 4.0 | GO:0010803 | regulation of tumor necrosis factor-mediated signaling pathway(GO:0010803) |
| 0.0 | 0.3 | GO:0032439 | endosome localization(GO:0032439) |
| 0.0 | 0.7 | GO:0052695 | cellular glucuronidation(GO:0052695) |
| 0.0 | 0.1 | GO:0072344 | rescue of stalled ribosome(GO:0072344) |
| 0.0 | 0.2 | GO:0003350 | pulmonary myocardium development(GO:0003350) |
| 0.0 | 0.3 | GO:0000727 | double-strand break repair via break-induced replication(GO:0000727) |
| 0.0 | 0.1 | GO:1902623 | negative regulation of granulocyte chemotaxis(GO:0071623) negative regulation of neutrophil chemotaxis(GO:0090024) negative regulation of neutrophil migration(GO:1902623) |
| 0.0 | 0.1 | GO:0060459 | positive regulation of immature T cell proliferation in thymus(GO:0033092) left lung development(GO:0060459) |
| 0.0 | 0.6 | GO:0051967 | negative regulation of synaptic transmission, glutamatergic(GO:0051967) |
| 0.0 | 0.1 | GO:0031446 | regulation of fast-twitch skeletal muscle fiber contraction(GO:0031446) positive regulation of fast-twitch skeletal muscle fiber contraction(GO:0031448) |
| 0.0 | 1.3 | GO:0008053 | mitochondrial fusion(GO:0008053) |
| 0.0 | 0.2 | GO:0036438 | maintenance of lens transparency(GO:0036438) |
| 0.0 | 0.2 | GO:0014738 | regulation of muscle hyperplasia(GO:0014738) |
| 0.0 | 0.3 | GO:0051414 | response to cortisol(GO:0051414) |
| 0.0 | 0.2 | GO:0018094 | protein polyglycylation(GO:0018094) |
| 0.0 | 0.9 | GO:0006346 | methylation-dependent chromatin silencing(GO:0006346) |
| 0.0 | 0.1 | GO:0015670 | carbon dioxide transport(GO:0015670) |
| 0.0 | 0.6 | GO:0072619 | interleukin-21 production(GO:0032625) interleukin-21 secretion(GO:0072619) |
| 0.0 | 0.1 | GO:0072369 | regulation of lipid transport by positive regulation of transcription from RNA polymerase II promoter(GO:0072369) |
| 0.0 | 0.1 | GO:0006617 | SRP-dependent cotranslational protein targeting to membrane, signal sequence recognition(GO:0006617) |
| 0.0 | 0.3 | GO:0036072 | intramembranous ossification(GO:0001957) direct ossification(GO:0036072) |
| 0.0 | 0.1 | GO:0035377 | transepithelial water transport(GO:0035377) positive regulation of cyclic nucleotide-gated ion channel activity(GO:1902161) regulation of voltage-gated chloride channel activity(GO:1902941) positive regulation of voltage-gated chloride channel activity(GO:1902943) |
| 0.0 | 0.2 | GO:0046985 | positive regulation of hemoglobin biosynthetic process(GO:0046985) |
| 0.0 | 0.1 | GO:2000863 | positive regulation of estrogen secretion(GO:2000863) positive regulation of estradiol secretion(GO:2000866) |
| 0.0 | 0.6 | GO:0060712 | spongiotrophoblast layer development(GO:0060712) |
| 0.0 | 0.0 | GO:1902523 | positive regulation of protein K63-linked ubiquitination(GO:1902523) |
| 0.0 | 0.1 | GO:0052651 | monoacylglycerol metabolic process(GO:0046462) monoacylglycerol catabolic process(GO:0052651) |
| 0.0 | 0.1 | GO:0061484 | hematopoietic stem cell homeostasis(GO:0061484) |
| 0.0 | 0.1 | GO:0060528 | secretory columnal luminar epithelial cell differentiation involved in prostate glandular acinus development(GO:0060528) |
| 0.0 | 0.5 | GO:0002315 | marginal zone B cell differentiation(GO:0002315) |
| 0.0 | 0.3 | GO:0070649 | formin-nucleated actin cable assembly(GO:0070649) |
| 0.0 | 0.1 | GO:1903031 | regulation of microtubule plus-end binding(GO:1903031) positive regulation of microtubule plus-end binding(GO:1903033) |
| 0.0 | 0.3 | GO:1990573 | potassium ion import across plasma membrane(GO:1990573) |
| 0.0 | 0.1 | GO:0070837 | dehydroascorbic acid transport(GO:0070837) |
| 0.0 | 0.2 | GO:0048769 | sarcomerogenesis(GO:0048769) |
| 0.0 | 0.2 | GO:1904749 | regulation of protein localization to nucleolus(GO:1904749) |
| 0.0 | 0.7 | GO:0051923 | sulfation(GO:0051923) |
| 0.0 | 0.4 | GO:0090168 | Golgi reassembly(GO:0090168) |
| 0.0 | 0.3 | GO:0034392 | negative regulation of smooth muscle cell apoptotic process(GO:0034392) |
| 0.0 | 0.2 | GO:0090070 | positive regulation of ribosome biogenesis(GO:0090070) positive regulation of rRNA processing(GO:2000234) |
| 0.0 | 0.2 | GO:0031584 | activation of phospholipase D activity(GO:0031584) |
| 0.0 | 0.1 | GO:0061083 | regulation of protein refolding(GO:0061083) negative regulation of protein refolding(GO:0061084) |
| 0.0 | 0.1 | GO:0003290 | septum secundum development(GO:0003285) atrial septum secundum morphogenesis(GO:0003290) embryonic heart tube anterior/posterior pattern specification(GO:0035054) |
| 0.0 | 0.1 | GO:0061300 | cerebellum vasculature development(GO:0061300) |
| 0.0 | 0.1 | GO:0033625 | positive regulation of integrin activation(GO:0033625) |
| 0.0 | 0.2 | GO:0044026 | DNA hypermethylation(GO:0044026) |
| 0.0 | 0.5 | GO:0005513 | detection of calcium ion(GO:0005513) |
| 0.0 | 0.1 | GO:0072301 | negative regulation of metanephric glomerulus development(GO:0072299) regulation of metanephric glomerular mesangial cell proliferation(GO:0072301) negative regulation of metanephric glomerular mesangial cell proliferation(GO:0072302) |
| 0.0 | 0.2 | GO:0051511 | regulation of unidimensional cell growth(GO:0051510) negative regulation of unidimensional cell growth(GO:0051511) establishment of cell polarity regulating cell shape(GO:0071964) regulation of establishment or maintenance of cell polarity regulating cell shape(GO:2000769) positive regulation of establishment or maintenance of cell polarity regulating cell shape(GO:2000771) regulation of establishment of cell polarity regulating cell shape(GO:2000782) positive regulation of establishment of cell polarity regulating cell shape(GO:2000784) positive regulation of barbed-end actin filament capping(GO:2000814) |
| 0.0 | 0.0 | GO:1903279 | regulation of calcium:sodium antiporter activity(GO:1903279) positive regulation of calcium:sodium antiporter activity(GO:1903281) |
| 0.0 | 0.2 | GO:0032534 | regulation of microvillus assembly(GO:0032534) |
| 0.0 | 0.6 | GO:0051764 | actin crosslink formation(GO:0051764) |
| 0.0 | 0.4 | GO:0031284 | positive regulation of guanylate cyclase activity(GO:0031284) |
| 0.0 | 0.1 | GO:0010387 | COP9 signalosome assembly(GO:0010387) |
| 0.0 | 0.1 | GO:0016333 | morphogenesis of follicular epithelium(GO:0016333) establishment or maintenance of polarity of follicular epithelium(GO:0016334) establishment of planar polarity of follicular epithelium(GO:0042247) |
| 0.0 | 0.1 | GO:0046338 | phosphatidylethanolamine catabolic process(GO:0046338) |
| 0.0 | 0.1 | GO:0044565 | dendritic cell proliferation(GO:0044565) |
| 0.0 | 0.4 | GO:0030157 | pancreatic juice secretion(GO:0030157) |
| 0.0 | 0.2 | GO:0010989 | negative regulation of low-density lipoprotein particle clearance(GO:0010989) |
| 0.0 | 0.1 | GO:1990086 | lens fiber cell apoptotic process(GO:1990086) |
| 0.0 | 0.1 | GO:0071529 | cementum mineralization(GO:0071529) |
| 0.0 | 0.6 | GO:0070262 | peptidyl-serine dephosphorylation(GO:0070262) |
| 0.0 | 0.2 | GO:0070294 | renal sodium ion absorption(GO:0070294) |
| 0.0 | 0.0 | GO:1901536 | regulation of DNA demethylation(GO:1901535) negative regulation of DNA demethylation(GO:1901536) |
| 0.0 | 0.1 | GO:0051012 | microtubule sliding(GO:0051012) |
| 0.0 | 0.1 | GO:0071400 | cellular response to oleic acid(GO:0071400) |
| 0.0 | 0.1 | GO:1900264 | regulation of DNA-directed DNA polymerase activity(GO:1900262) positive regulation of DNA-directed DNA polymerase activity(GO:1900264) |
| 0.0 | 0.1 | GO:0042640 | anagen(GO:0042640) |
| 0.0 | 0.1 | GO:0006154 | adenosine catabolic process(GO:0006154) inosine biosynthetic process(GO:0046103) |
| 0.0 | 0.0 | GO:0042495 | detection of triacyl bacterial lipopeptide(GO:0042495) detection of bacterial lipopeptide(GO:0070340) |
| 0.0 | 0.1 | GO:0032914 | positive regulation of transforming growth factor beta1 production(GO:0032914) |
| 0.0 | 0.1 | GO:1904306 | regulation of gastro-intestinal system smooth muscle contraction(GO:1904304) positive regulation of gastro-intestinal system smooth muscle contraction(GO:1904306) |
| 0.0 | 0.1 | GO:0046005 | positive regulation of circadian sleep/wake cycle, REM sleep(GO:0046005) |
| 0.0 | 0.1 | GO:0001971 | negative regulation of activation of membrane attack complex(GO:0001971) |
| 0.0 | 0.1 | GO:0035106 | operant conditioning(GO:0035106) |
| 0.0 | 0.2 | GO:0006552 | leucine catabolic process(GO:0006552) |
| 0.0 | 0.7 | GO:0042730 | fibrinolysis(GO:0042730) |
| 0.0 | 0.2 | GO:0006489 | dolichyl diphosphate biosynthetic process(GO:0006489) dolichyl diphosphate metabolic process(GO:0046465) |
| 0.0 | 0.2 | GO:0010756 | positive regulation of plasminogen activation(GO:0010756) |
| 0.0 | 0.1 | GO:0071896 | protein localization to adherens junction(GO:0071896) |
| 0.0 | 0.3 | GO:0007172 | signal complex assembly(GO:0007172) negative regulation of synapse assembly(GO:0051964) |
| 0.0 | 0.1 | GO:0007499 | ectoderm and mesoderm interaction(GO:0007499) |
| 0.0 | 0.2 | GO:0021840 | directional guidance of interneurons involved in migration from the subpallium to the cortex(GO:0021840) chemorepulsion involved in interneuron migration from the subpallium to the cortex(GO:0021842) ERBB3 signaling pathway(GO:0038129) |
| 0.0 | 0.1 | GO:1901052 | sarcosine metabolic process(GO:1901052) sarcosine catabolic process(GO:1901053) |
| 0.0 | 0.2 | GO:1901970 | positive regulation of mitotic metaphase/anaphase transition(GO:0045842) positive regulation of mitotic sister chromatid separation(GO:1901970) positive regulation of metaphase/anaphase transition of cell cycle(GO:1902101) |
| 0.0 | 0.1 | GO:0030423 | targeting of mRNA for destruction involved in RNA interference(GO:0030423) |
| 0.0 | 0.1 | GO:0052405 | negative regulation by host of symbiont molecular function(GO:0052405) |
| 0.0 | 0.3 | GO:0010745 | negative regulation of macrophage derived foam cell differentiation(GO:0010745) |
| 0.0 | 0.5 | GO:0071786 | endoplasmic reticulum tubular network organization(GO:0071786) |
| 0.0 | 0.2 | GO:0002934 | desmosome organization(GO:0002934) |
| 0.0 | 0.2 | GO:0032264 | IMP salvage(GO:0032264) |
| 0.0 | 0.1 | GO:0086053 | AV node cell to bundle of His cell communication by electrical coupling(GO:0086053) |
| 0.0 | 0.1 | GO:0050713 | negative regulation of interleukin-1 beta secretion(GO:0050713) |
| 0.0 | 0.1 | GO:1904158 | axonemal central apparatus assembly(GO:1904158) |
| 0.0 | 0.3 | GO:0060628 | regulation of ER to Golgi vesicle-mediated transport(GO:0060628) |
| 0.0 | 0.2 | GO:0048023 | positive regulation of melanin biosynthetic process(GO:0048023) positive regulation of secondary metabolite biosynthetic process(GO:1900378) |
| 0.0 | 0.2 | GO:0006657 | CDP-choline pathway(GO:0006657) |
| 0.0 | 0.1 | GO:0048631 | regulation of skeletal muscle tissue growth(GO:0048631) negative regulation of satellite cell differentiation(GO:1902725) |
| 0.0 | 0.1 | GO:0043988 | histone H3-S28 phosphorylation(GO:0043988) |
| 0.0 | 0.1 | GO:0035726 | common myeloid progenitor cell proliferation(GO:0035726) |
| 0.0 | 0.2 | GO:0051661 | maintenance of centrosome location(GO:0051661) |
| 0.0 | 0.1 | GO:0060339 | negative regulation of type I interferon-mediated signaling pathway(GO:0060339) |
| 0.0 | 0.1 | GO:0098957 | anterograde axonal transport of mitochondrion(GO:0098957) |
| 0.0 | 0.1 | GO:0035434 | copper ion transmembrane transport(GO:0035434) |
| 0.0 | 0.0 | GO:0030974 | thiamine pyrophosphate transport(GO:0030974) |
| 0.0 | 0.1 | GO:0045040 | protein import into mitochondrial outer membrane(GO:0045040) |
| 0.0 | 0.0 | GO:0031959 | mineralocorticoid receptor signaling pathway(GO:0031959) positive regulation of cardiac vascular smooth muscle cell differentiation(GO:2000724) |
| 0.0 | 0.3 | GO:0006020 | inositol metabolic process(GO:0006020) |
| 0.0 | 1.9 | GO:0060337 | type I interferon signaling pathway(GO:0060337) cellular response to type I interferon(GO:0071357) |
| 0.0 | 0.1 | GO:0071109 | superior temporal gyrus development(GO:0071109) |
| 0.0 | 0.1 | GO:0043128 | regulation of 1-phosphatidylinositol 4-kinase activity(GO:0043126) positive regulation of 1-phosphatidylinositol 4-kinase activity(GO:0043128) |
| 0.0 | 0.1 | GO:1902544 | regulation of DNA N-glycosylase activity(GO:1902544) |
| 0.0 | 1.3 | GO:0009247 | glycolipid biosynthetic process(GO:0009247) |
| 0.0 | 0.1 | GO:0060335 | positive regulation of response to interferon-gamma(GO:0060332) positive regulation of interferon-gamma-mediated signaling pathway(GO:0060335) |
| 0.0 | 0.1 | GO:1903412 | response to bile acid(GO:1903412) |
| 0.0 | 0.1 | GO:0070681 | glutaminyl-tRNAGln biosynthesis via transamidation(GO:0070681) |
| 0.0 | 0.1 | GO:1990481 | mRNA pseudouridine synthesis(GO:1990481) |
| 0.0 | 0.0 | GO:0042040 | molybdenum incorporation into molybdenum-molybdopterin complex(GO:0018315) metal incorporation into metallo-molybdopterin complex(GO:0042040) glycine receptor clustering(GO:0072579) |
| 0.0 | 0.2 | GO:0015866 | ADP transport(GO:0015866) |
| 0.0 | 0.1 | GO:0035633 | maintenance of blood-brain barrier(GO:0035633) regulation of chemokine (C-C motif) ligand 2 secretion(GO:1904207) positive regulation of chemokine (C-C motif) ligand 2 secretion(GO:1904209) |
| 0.0 | 0.1 | GO:0007341 | penetration of zona pellucida(GO:0007341) |
| 0.0 | 0.2 | GO:0008627 | intrinsic apoptotic signaling pathway in response to osmotic stress(GO:0008627) |
| 0.0 | 0.1 | GO:0045213 | neurotransmitter receptor metabolic process(GO:0045213) |
| 0.0 | 0.1 | GO:0010918 | positive regulation of mitochondrial membrane potential(GO:0010918) |
| 0.0 | 0.2 | GO:0060536 | cartilage morphogenesis(GO:0060536) |
| 0.0 | 0.1 | GO:0032218 | riboflavin transport(GO:0032218) |
| 0.0 | 0.2 | GO:0035745 | T-helper 2 cell cytokine production(GO:0035745) |
| 0.0 | 0.1 | GO:0060054 | positive regulation of epithelial cell proliferation involved in wound healing(GO:0060054) |
| 0.0 | 0.1 | GO:0014038 | regulation of Schwann cell differentiation(GO:0014038) |
| 0.0 | 0.6 | GO:0003338 | metanephros morphogenesis(GO:0003338) |
| 0.0 | 1.1 | GO:0006521 | regulation of cellular amino acid metabolic process(GO:0006521) |
| 0.0 | 0.1 | GO:0070307 | lens fiber cell development(GO:0070307) |
| 0.0 | 0.1 | GO:0045651 | positive regulation of macrophage differentiation(GO:0045651) |
| 0.0 | 0.1 | GO:0006432 | phenylalanyl-tRNA aminoacylation(GO:0006432) |
| 0.0 | 0.3 | GO:1902259 | regulation of delayed rectifier potassium channel activity(GO:1902259) |
| 0.0 | 0.0 | GO:1990785 | response to water-immersion restraint stress(GO:1990785) |
| 0.0 | 0.2 | GO:0006054 | N-acetylneuraminate metabolic process(GO:0006054) |
| 0.0 | 0.2 | GO:0007016 | cytoskeletal anchoring at plasma membrane(GO:0007016) |
| 0.0 | 0.1 | GO:0090666 | scaRNA localization to Cajal body(GO:0090666) |
| 0.0 | 0.1 | GO:0009304 | tRNA transcription(GO:0009304) |
| 0.0 | 0.1 | GO:0030070 | insulin processing(GO:0030070) |
| 0.0 | 0.2 | GO:1904424 | regulation of GTP binding(GO:1904424) |
| 0.0 | 0.0 | GO:0090283 | regulation of protein glycosylation in Golgi(GO:0090283) |
| 0.0 | 0.2 | GO:0097340 | inhibition of cysteine-type endopeptidase activity(GO:0097340) zymogen inhibition(GO:0097341) |
| 0.0 | 0.1 | GO:0018352 | protein-pyridoxal-5-phosphate linkage(GO:0018352) |
| 0.0 | 0.1 | GO:0075525 | viral translational termination-reinitiation(GO:0075525) |
| 0.0 | 0.0 | GO:0031296 | B cell costimulation(GO:0031296) |
| 0.0 | 0.2 | GO:0043508 | negative regulation of JUN kinase activity(GO:0043508) |
| 0.0 | 0.2 | GO:2000766 | negative regulation of cytoplasmic translation(GO:2000766) |
| 0.0 | 0.3 | GO:0097150 | neuronal stem cell population maintenance(GO:0097150) |
| 0.0 | 0.2 | GO:0090286 | cytoskeletal anchoring at nuclear membrane(GO:0090286) |
| 0.0 | 0.0 | GO:0033967 | box C/D snoRNA 3'-end processing(GO:0000494) box C/D snoRNA metabolic process(GO:0033967) box C/D snoRNA processing(GO:0034963) histone glutamine methylation(GO:1990258) |
| 0.0 | 0.1 | GO:0072383 | plus-end-directed vesicle transport along microtubule(GO:0072383) |
| 0.0 | 0.2 | GO:0034374 | low-density lipoprotein particle remodeling(GO:0034374) |
| 0.0 | 0.1 | GO:0030951 | establishment or maintenance of microtubule cytoskeleton polarity(GO:0030951) |
Gene overrepresentation in cellular component category:
| Log-likelihood per target | Total log-likelihood | Term | Description |
|---|---|---|---|
| 0.2 | 1.5 | GO:0036021 | endolysosome lumen(GO:0036021) |
| 0.2 | 1.4 | GO:1990111 | spermatoproteasome complex(GO:1990111) |
| 0.1 | 1.8 | GO:0033093 | Weibel-Palade body(GO:0033093) |
| 0.1 | 0.5 | GO:0035517 | PR-DUB complex(GO:0035517) |
| 0.1 | 0.3 | GO:0048269 | methionine adenosyltransferase complex(GO:0048269) |
| 0.1 | 0.3 | GO:0042565 | RNA nuclear export complex(GO:0042565) |
| 0.1 | 0.6 | GO:0031467 | Cul7-RING ubiquitin ligase complex(GO:0031467) |
| 0.1 | 0.3 | GO:0033597 | mitotic checkpoint complex(GO:0033597) bub1-bub3 complex(GO:1990298) |
| 0.1 | 0.4 | GO:0070826 | paraferritin complex(GO:0070826) |
| 0.1 | 0.7 | GO:0071144 | SMAD2-SMAD3 protein complex(GO:0071144) |
| 0.1 | 0.5 | GO:0097149 | centralspindlin complex(GO:0097149) |
| 0.1 | 0.3 | GO:0097441 | basilar dendrite(GO:0097441) |
| 0.1 | 0.3 | GO:0000811 | GINS complex(GO:0000811) |
| 0.1 | 0.4 | GO:0070557 | PCNA-p21 complex(GO:0070557) |
| 0.1 | 0.3 | GO:0044393 | microspike(GO:0044393) cytoplasmic side of apical plasma membrane(GO:0098592) |
| 0.1 | 1.2 | GO:0031265 | CD95 death-inducing signaling complex(GO:0031265) |
| 0.1 | 0.2 | GO:0034455 | t-UTP complex(GO:0034455) |
| 0.0 | 0.3 | GO:0090661 | box H/ACA scaRNP complex(GO:0072589) box H/ACA telomerase RNP complex(GO:0090661) |
| 0.0 | 0.9 | GO:0031588 | nucleotide-activated protein kinase complex(GO:0031588) |
| 0.0 | 0.6 | GO:1990712 | HFE-transferrin receptor complex(GO:1990712) |
| 0.0 | 0.1 | GO:0043159 | acrosomal matrix(GO:0043159) |
| 0.0 | 0.3 | GO:0008282 | ATP-sensitive potassium channel complex(GO:0008282) |
| 0.0 | 0.1 | GO:0001674 | female germ cell nucleus(GO:0001674) |
| 0.0 | 0.3 | GO:1990761 | growth cone lamellipodium(GO:1990761) |
| 0.0 | 0.1 | GO:0016939 | kinesin II complex(GO:0016939) |
| 0.0 | 0.2 | GO:1905202 | 3-methylcrotonyl-CoA carboxylase complex, mitochondrial(GO:0002169) methylcrotonoyl-CoA carboxylase complex(GO:1905202) |
| 0.0 | 0.2 | GO:0035838 | growing cell tip(GO:0035838) |
| 0.0 | 0.3 | GO:0030478 | actin cap(GO:0030478) |
| 0.0 | 0.5 | GO:0031089 | platelet dense granule lumen(GO:0031089) |
| 0.0 | 0.1 | GO:0005663 | DNA replication factor C complex(GO:0005663) |
| 0.0 | 0.4 | GO:0001520 | outer dense fiber(GO:0001520) |
| 0.0 | 0.4 | GO:0030123 | AP-3 adaptor complex(GO:0030123) |
| 0.0 | 0.5 | GO:0005885 | Arp2/3 protein complex(GO:0005885) |
| 0.0 | 0.4 | GO:0030126 | COPI vesicle coat(GO:0030126) |
| 0.0 | 0.1 | GO:0005953 | CAAX-protein geranylgeranyltransferase complex(GO:0005953) |
| 0.0 | 0.1 | GO:0000214 | tRNA-intron endonuclease complex(GO:0000214) |
| 0.0 | 0.2 | GO:0000015 | phosphopyruvate hydratase complex(GO:0000015) |
| 0.0 | 0.1 | GO:0000229 | cytoplasmic chromosome(GO:0000229) |
| 0.0 | 0.1 | GO:0000126 | transcription factor TFIIIB complex(GO:0000126) |
| 0.0 | 0.1 | GO:0042720 | mitochondrial inner membrane peptidase complex(GO:0042720) |
| 0.0 | 0.3 | GO:0034709 | methylosome(GO:0034709) |
| 0.0 | 0.1 | GO:0009328 | phenylalanine-tRNA ligase complex(GO:0009328) |
| 0.0 | 0.1 | GO:0031205 | endoplasmic reticulum Sec complex(GO:0031205) |
| 0.0 | 0.1 | GO:0042643 | actomyosin, actin portion(GO:0042643) |
| 0.0 | 0.2 | GO:0070449 | elongin complex(GO:0070449) |
| 0.0 | 2.3 | GO:0005901 | caveola(GO:0005901) |
| 0.0 | 0.1 | GO:1990716 | axonemal central apparatus(GO:1990716) |
| 0.0 | 0.1 | GO:0097125 | cyclin B1-CDK1 complex(GO:0097125) |
| 0.0 | 0.2 | GO:0071141 | SMAD protein complex(GO:0071141) |
| 0.0 | 0.0 | GO:0071752 | dimeric IgA immunoglobulin complex(GO:0071750) secretory dimeric IgA immunoglobulin complex(GO:0071752) IgM immunoglobulin complex(GO:0071753) IgM immunoglobulin complex, circulating(GO:0071754) pentameric IgM immunoglobulin complex(GO:0071756) |
| 0.0 | 0.0 | GO:0097636 | intrinsic component of autophagosome membrane(GO:0097636) integral component of autophagosome membrane(GO:0097637) |
| 0.0 | 0.3 | GO:0036038 | MKS complex(GO:0036038) |
| 0.0 | 0.2 | GO:0016593 | Cdc73/Paf1 complex(GO:0016593) |
| 0.0 | 0.2 | GO:0000506 | glycosylphosphatidylinositol-N-acetylglucosaminyltransferase (GPI-GnT) complex(GO:0000506) |
| 0.0 | 0.1 | GO:0030956 | glutamyl-tRNA(Gln) amidotransferase complex(GO:0030956) |
| 0.0 | 0.4 | GO:0097381 | photoreceptor disc membrane(GO:0097381) |
| 0.0 | 0.0 | GO:0035354 | Toll-like receptor 1-Toll-like receptor 2 protein complex(GO:0035354) |
| 0.0 | 0.1 | GO:0036128 | CatSper complex(GO:0036128) |
| 0.0 | 1.2 | GO:0035580 | specific granule lumen(GO:0035580) |
| 0.0 | 0.5 | GO:0071782 | endoplasmic reticulum tubular network(GO:0071782) |
| 0.0 | 0.2 | GO:0061200 | clathrin-sculpted gamma-aminobutyric acid transport vesicle(GO:0061200) clathrin-sculpted gamma-aminobutyric acid transport vesicle membrane(GO:0061202) |
| 0.0 | 0.5 | GO:0000159 | protein phosphatase type 2A complex(GO:0000159) |
| 0.0 | 0.1 | GO:0072487 | MSL complex(GO:0072487) |
| 0.0 | 0.2 | GO:0044354 | pinosome(GO:0044352) macropinosome(GO:0044354) |
| 0.0 | 0.1 | GO:0005742 | mitochondrial outer membrane translocase complex(GO:0005742) |
| 0.0 | 0.1 | GO:0097442 | CA3 pyramidal cell dendrite(GO:0097442) |
| 0.0 | 0.1 | GO:0097209 | epidermal lamellar body(GO:0097209) |
| 0.0 | 0.3 | GO:0070971 | endoplasmic reticulum exit site(GO:0070971) |
| 0.0 | 0.1 | GO:0097443 | sorting endosome(GO:0097443) |
| 0.0 | 0.1 | GO:0070187 | telosome(GO:0070187) |
| 0.0 | 0.8 | GO:0005801 | cis-Golgi network(GO:0005801) |
| 0.0 | 0.0 | GO:0042272 | nuclear RNA export factor complex(GO:0042272) |
| 0.0 | 0.3 | GO:0005614 | interstitial matrix(GO:0005614) |
| 0.0 | 0.1 | GO:0005786 | signal recognition particle, endoplasmic reticulum targeting(GO:0005786) |
| 0.0 | 0.1 | GO:0032133 | chromosome passenger complex(GO:0032133) |
| 0.0 | 0.2 | GO:0016580 | Sin3 complex(GO:0016580) |
Gene overrepresentation in molecular function category:
| Log-likelihood per target | Total log-likelihood | Term | Description |
|---|---|---|---|
| 0.5 | 1.5 | GO:0047256 | beta-galactosyl-N-acetylglucosaminylgalactosylglucosyl-ceramide beta-1,3-acetylglucosaminyltransferase activity(GO:0008457) lactosylceramide 1,3-N-acetyl-beta-D-glucosaminyltransferase activity(GO:0047256) |
| 0.4 | 1.2 | GO:0004912 | interleukin-3 receptor activity(GO:0004912) |
| 0.3 | 1.7 | GO:0035800 | deubiquitinase activator activity(GO:0035800) |
| 0.3 | 0.8 | GO:0003973 | (S)-2-hydroxy-acid oxidase activity(GO:0003973) very-long-chain-(S)-2-hydroxy-acid oxidase activity(GO:0052852) long-chain-(S)-2-hydroxy-long-chain-acid oxidase activity(GO:0052853) medium-chain-(S)-2-hydroxy-acid oxidase activity(GO:0052854) |
| 0.2 | 3.5 | GO:0031996 | thioesterase binding(GO:0031996) |
| 0.2 | 2.3 | GO:0033691 | sialic acid binding(GO:0033691) |
| 0.1 | 0.4 | GO:0050528 | acyloxyacyl hydrolase activity(GO:0050528) |
| 0.1 | 0.7 | GO:0015526 | hexose phosphate transmembrane transporter activity(GO:0015119) organophosphate:inorganic phosphate antiporter activity(GO:0015315) hexose-phosphate:inorganic phosphate antiporter activity(GO:0015526) glucose 6-phosphate:inorganic phosphate antiporter activity(GO:0061513) |
| 0.1 | 1.3 | GO:0016286 | small conductance calcium-activated potassium channel activity(GO:0016286) |
| 0.1 | 0.6 | GO:0004647 | phosphoserine phosphatase activity(GO:0004647) |
| 0.1 | 0.7 | GO:0031962 | mineralocorticoid receptor binding(GO:0031962) |
| 0.1 | 0.4 | GO:0004320 | oleoyl-[acyl-carrier-protein] hydrolase activity(GO:0004320) myristoyl-[acyl-carrier-protein] hydrolase activity(GO:0016295) palmitoyl-[acyl-carrier-protein] hydrolase activity(GO:0016296) acyl-[acyl-carrier-protein] hydrolase activity(GO:0016297) |
| 0.1 | 0.3 | GO:0001596 | angiotensin type I receptor activity(GO:0001596) |
| 0.1 | 0.6 | GO:0004771 | sterol esterase activity(GO:0004771) |
| 0.1 | 0.3 | GO:0090631 | pre-miRNA transporter activity(GO:0090631) |
| 0.1 | 0.6 | GO:0042296 | ISG15 transferase activity(GO:0042296) |
| 0.1 | 0.3 | GO:0034736 | sterol O-acyltransferase activity(GO:0004772) cholesterol O-acyltransferase activity(GO:0034736) |
| 0.1 | 0.4 | GO:0015086 | cadmium ion transmembrane transporter activity(GO:0015086) cobalt ion transmembrane transporter activity(GO:0015087) lead ion transmembrane transporter activity(GO:0015094) ferrous iron uptake transmembrane transporter activity(GO:0015639) |
| 0.1 | 0.2 | GO:0005174 | CD40 receptor binding(GO:0005174) |
| 0.1 | 0.3 | GO:0004142 | diacylglycerol cholinephosphotransferase activity(GO:0004142) ethanolaminephosphotransferase activity(GO:0004307) |
| 0.1 | 0.3 | GO:0046592 | polyamine oxidase activity(GO:0046592) spermine:oxygen oxidoreductase (spermidine-forming) activity(GO:0052901) |
| 0.1 | 0.1 | GO:0032427 | GBD domain binding(GO:0032427) |
| 0.1 | 0.5 | GO:0004614 | phosphoglucomutase activity(GO:0004614) |
| 0.1 | 0.4 | GO:0019912 | cyclin-dependent protein kinase activating kinase activity(GO:0019912) |
| 0.1 | 1.0 | GO:0001730 | 2'-5'-oligoadenylate synthetase activity(GO:0001730) |
| 0.1 | 2.0 | GO:0031489 | myosin V binding(GO:0031489) |
| 0.1 | 0.2 | GO:0042284 | sphingolipid delta-4 desaturase activity(GO:0042284) |
| 0.1 | 0.6 | GO:0035374 | chondroitin sulfate binding(GO:0035374) |
| 0.1 | 1.3 | GO:0051400 | BH domain binding(GO:0051400) |
| 0.1 | 0.4 | GO:0008454 | alpha-1,3-mannosylglycoprotein 4-beta-N-acetylglucosaminyltransferase activity(GO:0008454) |
| 0.1 | 0.4 | GO:0016212 | kynurenine-oxoglutarate transaminase activity(GO:0016212) kynurenine aminotransferase activity(GO:0036137) |
| 0.1 | 0.3 | GO:0017098 | sulfonylurea receptor binding(GO:0017098) |
| 0.1 | 0.3 | GO:0060230 | lipoprotein lipase activator activity(GO:0060230) |
| 0.1 | 0.3 | GO:0004966 | galanin receptor activity(GO:0004966) |
| 0.1 | 2.4 | GO:0003950 | NAD+ ADP-ribosyltransferase activity(GO:0003950) |
| 0.1 | 0.3 | GO:0004522 | ribonuclease A activity(GO:0004522) |
| 0.1 | 0.2 | GO:0004877 | complement component C4b receptor activity(GO:0001861) complement component C3b receptor activity(GO:0004877) |
| 0.1 | 0.2 | GO:0031862 | prostanoid receptor binding(GO:0031862) |
| 0.0 | 0.2 | GO:0004692 | cGMP-dependent protein kinase activity(GO:0004692) |
| 0.0 | 0.2 | GO:0015222 | serotonin transmembrane transporter activity(GO:0015222) |
| 0.0 | 0.6 | GO:0005025 | transforming growth factor beta receptor activity, type I(GO:0005025) |
| 0.0 | 1.3 | GO:0034236 | protein kinase A catalytic subunit binding(GO:0034236) |
| 0.0 | 0.2 | GO:0004419 | hydroxymethylglutaryl-CoA lyase activity(GO:0004419) |
| 0.0 | 0.1 | GO:0035651 | AP-3 adaptor complex binding(GO:0035651) |
| 0.0 | 0.3 | GO:0043120 | tumor necrosis factor binding(GO:0043120) |
| 0.0 | 3.4 | GO:0032813 | tumor necrosis factor receptor superfamily binding(GO:0032813) |
| 0.0 | 0.4 | GO:0008048 | calcium sensitive guanylate cyclase activator activity(GO:0008048) |
| 0.0 | 0.3 | GO:0034513 | box H/ACA snoRNA binding(GO:0034513) |
| 0.0 | 0.4 | GO:0038049 | transcription factor activity, ligand-activated RNA polymerase II transcription factor binding(GO:0038049) |
| 0.0 | 0.2 | GO:0004040 | amidase activity(GO:0004040) |
| 0.0 | 0.4 | GO:0001849 | complement component C1q binding(GO:0001849) |
| 0.0 | 1.5 | GO:0008327 | methyl-CpG binding(GO:0008327) |
| 0.0 | 1.2 | GO:0070003 | threonine-type endopeptidase activity(GO:0004298) threonine-type peptidase activity(GO:0070003) |
| 0.0 | 0.5 | GO:0016615 | malate dehydrogenase activity(GO:0016615) |
| 0.0 | 0.3 | GO:0001591 | dopamine neurotransmitter receptor activity, coupled via Gi/Go(GO:0001591) |
| 0.0 | 0.9 | GO:0045028 | G-protein coupled nucleotide receptor activity(GO:0001608) G-protein coupled purinergic nucleotide receptor activity(GO:0045028) |
| 0.0 | 0.5 | GO:0042975 | peroxisome proliferator activated receptor binding(GO:0042975) |
| 0.0 | 1.6 | GO:0043394 | proteoglycan binding(GO:0043394) |
| 0.0 | 0.1 | GO:0008431 | vitamin E binding(GO:0008431) |
| 0.0 | 0.9 | GO:0102391 | decanoate--CoA ligase activity(GO:0102391) |
| 0.0 | 0.1 | GO:0008745 | N-acetylmuramoyl-L-alanine amidase activity(GO:0008745) |
| 0.0 | 0.7 | GO:0004062 | aryl sulfotransferase activity(GO:0004062) |
| 0.0 | 0.4 | GO:0051525 | NFAT protein binding(GO:0051525) |
| 0.0 | 0.2 | GO:0008109 | N-acetyllactosaminide beta-1,6-N-acetylglucosaminyltransferase activity(GO:0008109) |
| 0.0 | 0.1 | GO:0003845 | 11-beta-hydroxysteroid dehydrogenase [NAD(P)] activity(GO:0003845) |
| 0.0 | 0.2 | GO:0070735 | protein-glycine ligase activity(GO:0070735) |
| 0.0 | 0.5 | GO:0019957 | C-C chemokine binding(GO:0019957) |
| 0.0 | 0.3 | GO:0030618 | transforming growth factor beta receptor, pathway-specific cytoplasmic mediator activity(GO:0030618) |
| 0.0 | 0.1 | GO:0051734 | ATP-dependent polydeoxyribonucleotide 5'-hydroxyl-kinase activity(GO:0046404) polydeoxyribonucleotide kinase activity(GO:0051733) ATP-dependent polynucleotide kinase activity(GO:0051734) |
| 0.0 | 0.4 | GO:0005131 | growth hormone receptor binding(GO:0005131) |
| 0.0 | 0.1 | GO:0005260 | channel-conductance-controlling ATPase activity(GO:0005260) |
| 0.0 | 0.2 | GO:0047961 | glycine N-acyltransferase activity(GO:0047961) |
| 0.0 | 0.1 | GO:0047757 | chondroitin-glucuronate 5-epimerase activity(GO:0047757) |
| 0.0 | 0.2 | GO:0035529 | NADH pyrophosphatase activity(GO:0035529) |
| 0.0 | 0.2 | GO:0023029 | MHC class Ib protein binding(GO:0023029) |
| 0.0 | 0.1 | GO:0070363 | mitochondrial light strand promoter sense binding(GO:0070363) |
| 0.0 | 0.4 | GO:0097371 | MDM2/MDM4 family protein binding(GO:0097371) |
| 0.0 | 0.1 | GO:0033300 | dehydroascorbic acid transporter activity(GO:0033300) |
| 0.0 | 0.1 | GO:0008969 | phosphohistidine phosphatase activity(GO:0008969) |
| 0.0 | 0.2 | GO:0004459 | L-lactate dehydrogenase activity(GO:0004459) |
| 0.0 | 0.2 | GO:0004485 | methylcrotonoyl-CoA carboxylase activity(GO:0004485) |
| 0.0 | 0.1 | GO:0016497 | substance K receptor activity(GO:0016497) |
| 0.0 | 0.2 | GO:0003831 | beta-N-acetylglucosaminylglycopeptide beta-1,4-galactosyltransferase activity(GO:0003831) |
| 0.0 | 0.8 | GO:0005229 | intracellular calcium activated chloride channel activity(GO:0005229) |
| 0.0 | 0.3 | GO:0051425 | PTB domain binding(GO:0051425) |
| 0.0 | 0.1 | GO:0070546 | L-phenylalanine aminotransferase activity(GO:0070546) L-phenylalanine:2-oxoglutarate aminotransferase activity(GO:0080130) |
| 0.0 | 0.1 | GO:0089720 | caspase binding(GO:0089720) |
| 0.0 | 0.2 | GO:0005237 | inhibitory extracellular ligand-gated ion channel activity(GO:0005237) |
| 0.0 | 0.1 | GO:0008900 | hydrogen:potassium-exchanging ATPase activity(GO:0008900) |
| 0.0 | 0.2 | GO:0010859 | calcium-dependent cysteine-type endopeptidase inhibitor activity(GO:0010859) |
| 0.0 | 0.8 | GO:0015269 | calcium-activated potassium channel activity(GO:0015269) |
| 0.0 | 0.9 | GO:0001972 | retinoic acid binding(GO:0001972) |
| 0.0 | 0.4 | GO:0061578 | Lys63-specific deubiquitinase activity(GO:0061578) |
| 0.0 | 0.1 | GO:0004878 | complement component C5a receptor activity(GO:0004878) |
| 0.0 | 0.3 | GO:0030274 | LIM domain binding(GO:0030274) |
| 0.0 | 0.1 | GO:0050146 | nucleoside phosphotransferase activity(GO:0050146) |
| 0.0 | 0.2 | GO:0004111 | creatine kinase activity(GO:0004111) |
| 0.0 | 0.3 | GO:0015266 | protein channel activity(GO:0015266) |
| 0.0 | 0.1 | GO:0004662 | CAAX-protein geranylgeranyltransferase activity(GO:0004662) |
| 0.0 | 0.1 | GO:0000773 | phosphatidyl-N-methylethanolamine N-methyltransferase activity(GO:0000773) phosphatidylethanolamine N-methyltransferase activity(GO:0004608) phosphatidyl-N-dimethylethanolamine N-methyltransferase activity(GO:0080101) |
| 0.0 | 0.1 | GO:0005223 | intracellular cGMP activated cation channel activity(GO:0005223) |
| 0.0 | 0.1 | GO:0052739 | phosphatidylserine 1-acylhydrolase activity(GO:0052739) |
| 0.0 | 0.1 | GO:0051500 | D-aminoacyl-tRNA deacylase activity(GO:0051499) D-tyrosyl-tRNA(Tyr) deacylase activity(GO:0051500) |
| 0.0 | 0.1 | GO:0017018 | myosin phosphatase activity(GO:0017018) |
| 0.0 | 0.1 | GO:0044729 | double-stranded methylated DNA binding(GO:0010385) hemi-methylated DNA-binding(GO:0044729) |
| 0.0 | 0.2 | GO:0003876 | AMP deaminase activity(GO:0003876) adenosine-phosphate deaminase activity(GO:0047623) |
| 0.0 | 0.1 | GO:0000293 | ferric-chelate reductase activity(GO:0000293) |
| 0.0 | 0.2 | GO:0004634 | phosphopyruvate hydratase activity(GO:0004634) |
| 0.0 | 0.1 | GO:0019862 | IgA binding(GO:0019862) |
| 0.0 | 0.1 | GO:0017129 | triglyceride binding(GO:0017129) |
| 0.0 | 0.1 | GO:0001026 | TFIIIB-type transcription factor activity(GO:0001026) |
| 0.0 | 0.1 | GO:0043739 | G/U mismatch-specific uracil-DNA glycosylase activity(GO:0043739) |
| 0.0 | 0.2 | GO:0043008 | ATP-dependent protein binding(GO:0043008) |
| 0.0 | 0.1 | GO:0008480 | sarcosine dehydrogenase activity(GO:0008480) |
| 0.0 | 0.1 | GO:0005000 | vasopressin receptor activity(GO:0005000) |
| 0.0 | 0.3 | GO:0043138 | 3'-5' DNA helicase activity(GO:0043138) |
| 0.0 | 0.1 | GO:0005150 | interleukin-1, Type I receptor binding(GO:0005150) |
| 0.0 | 0.0 | GO:0017116 | single-stranded DNA-dependent ATP-dependent DNA helicase activity(GO:0017116) |
| 0.0 | 0.1 | GO:0016812 | hydrolase activity, acting on carbon-nitrogen (but not peptide) bonds, in cyclic amides(GO:0016812) |
| 0.0 | 0.3 | GO:0004089 | carbonate dehydratase activity(GO:0004089) |
| 0.0 | 0.1 | GO:0086077 | gap junction channel activity involved in AV node cell-bundle of His cell electrical coupling(GO:0086077) |
| 0.0 | 0.5 | GO:0031698 | beta-2 adrenergic receptor binding(GO:0031698) |
| 0.0 | 0.3 | GO:0031681 | G-protein beta-subunit binding(GO:0031681) |
| 0.0 | 1.1 | GO:0008375 | acetylglucosaminyltransferase activity(GO:0008375) |
| 0.0 | 0.5 | GO:0008242 | omega peptidase activity(GO:0008242) |
| 0.0 | 0.3 | GO:0008199 | ferric iron binding(GO:0008199) |
| 0.0 | 0.0 | GO:0004088 | carbamoyl-phosphate synthase (ammonia) activity(GO:0004087) carbamoyl-phosphate synthase (glutamine-hydrolyzing) activity(GO:0004088) |
| 0.0 | 0.5 | GO:0005035 | tumor necrosis factor-activated receptor activity(GO:0005031) death receptor activity(GO:0005035) |
| 0.0 | 0.1 | GO:0070290 | N-acylphosphatidylethanolamine-specific phospholipase D activity(GO:0070290) |
| 0.0 | 0.1 | GO:0003689 | DNA clamp loader activity(GO:0003689) protein-DNA loading ATPase activity(GO:0033170) |
| 0.0 | 0.4 | GO:0038191 | neuropilin binding(GO:0038191) |
| 0.0 | 0.1 | GO:0005375 | copper ion transmembrane transporter activity(GO:0005375) |
| 0.0 | 0.0 | GO:0090422 | thiamine pyrophosphate transporter activity(GO:0090422) |
| 0.0 | 0.1 | GO:0034597 | phosphatidylinositol-3,4-bisphosphate 4-phosphatase activity(GO:0016316) inositol-1,3,4-trisphosphate 4-phosphatase activity(GO:0017161) phosphatidylinositol-4,5-bisphosphate 4-phosphatase activity(GO:0034597) inositol-3,4-bisphosphate 4-phosphatase activity(GO:0052828) |
| 0.0 | 1.2 | GO:0030374 | ligand-dependent nuclear receptor transcription coactivator activity(GO:0030374) |
| 0.0 | 0.1 | GO:0004430 | 1-phosphatidylinositol 4-kinase activity(GO:0004430) |
| 0.0 | 0.1 | GO:0050252 | retinol O-fatty-acyltransferase activity(GO:0050252) |
| 0.0 | 0.0 | GO:0061599 | nitrate reductase activity(GO:0008940) molybdopterin adenylyltransferase activity(GO:0061598) molybdopterin molybdotransferase activity(GO:0061599) |
| 0.0 | 0.1 | GO:0030942 | endoplasmic reticulum signal peptide binding(GO:0030942) |
| 0.0 | 0.1 | GO:0034485 | phosphatidylinositol-3,4,5-trisphosphate 5-phosphatase activity(GO:0034485) |
| 0.0 | 0.2 | GO:0005176 | ErbB-2 class receptor binding(GO:0005176) |
| 0.0 | 0.0 | GO:0035663 | Toll-like receptor 2 binding(GO:0035663) |
| 0.0 | 0.2 | GO:0015217 | ATP transmembrane transporter activity(GO:0005347) ADP transmembrane transporter activity(GO:0015217) |
| 0.0 | 0.1 | GO:0048248 | CXCR3 chemokine receptor binding(GO:0048248) |
| 0.0 | 0.1 | GO:0043023 | ribosomal large subunit binding(GO:0043023) |
| 0.0 | 0.2 | GO:0042834 | peptidoglycan binding(GO:0042834) |
| 0.0 | 0.4 | GO:0005549 | odorant binding(GO:0005549) |
| 0.0 | 0.1 | GO:0032217 | riboflavin transporter activity(GO:0032217) |
| 0.0 | 0.3 | GO:0008432 | JUN kinase binding(GO:0008432) |
| 0.0 | 0.1 | GO:0004826 | phenylalanine-tRNA ligase activity(GO:0004826) |
| 0.0 | 0.2 | GO:0005227 | calcium activated cation channel activity(GO:0005227) |
| 0.0 | 0.1 | GO:0030021 | extracellular matrix structural constituent conferring compression resistance(GO:0030021) structural constituent of tooth enamel(GO:0030345) |
| 0.0 | 0.2 | GO:0097200 | cysteine-type endopeptidase activity involved in execution phase of apoptosis(GO:0097200) |
| 0.0 | 0.1 | GO:0003720 | telomerase activity(GO:0003720) RNA-directed DNA polymerase activity(GO:0003964) |
| 0.0 | 0.0 | GO:0032795 | heterotrimeric G-protein binding(GO:0032795) |
| 0.0 | 0.1 | GO:0043237 | laminin-1 binding(GO:0043237) |
| 0.0 | 0.1 | GO:0015562 | efflux transmembrane transporter activity(GO:0015562) |
| 0.0 | 0.5 | GO:0008157 | protein phosphatase 1 binding(GO:0008157) |
| 0.0 | 0.3 | GO:0005523 | tropomyosin binding(GO:0005523) |
| 0.0 | 0.3 | GO:0019198 | transmembrane receptor protein tyrosine phosphatase activity(GO:0005001) transmembrane receptor protein phosphatase activity(GO:0019198) |
| 0.0 | 0.1 | GO:0017128 | phospholipid scramblase activity(GO:0017128) |
| 0.0 | 0.0 | GO:0023024 | MHC class I protein complex binding(GO:0023024) |
| 0.0 | 0.1 | GO:0008440 | inositol-1,4,5-trisphosphate 3-kinase activity(GO:0008440) |
| 0.0 | 0.0 | GO:0036009 | protein-glutamine N-methyltransferase activity(GO:0036009) histone-glutamine methyltransferase activity(GO:1990259) |
| 0.0 | 0.0 | GO:0004769 | steroid delta-isomerase activity(GO:0004769) |
| 0.0 | 0.0 | GO:0016838 | carbon-oxygen lyase activity, acting on phosphates(GO:0016838) |
| 0.0 | 0.1 | GO:0017162 | aryl hydrocarbon receptor binding(GO:0017162) |
Gene overrepresentation in curated gene sets: canonical pathways category:
| Log-likelihood per target | Total log-likelihood | Term | Description |
|---|---|---|---|
| 0.1 | 0.7 | PID IL3 PATHWAY | IL3-mediated signaling events |
| 0.1 | 0.9 | PID INTEGRIN A4B1 PATHWAY | Alpha4 beta1 integrin signaling events |
| 0.1 | 4.8 | PID HIV NEF PATHWAY | HIV-1 Nef: Negative effector of Fas and TNF-alpha |
| 0.1 | 0.6 | PID IL5 PATHWAY | IL5-mediated signaling events |
| 0.0 | 1.3 | ST TUMOR NECROSIS FACTOR PATHWAY | Tumor Necrosis Factor Pathway. |
| 0.0 | 0.5 | ST IL 13 PATHWAY | Interleukin 13 (IL-13) Pathway |
| 0.0 | 0.3 | ST JAK STAT PATHWAY | Jak-STAT Pathway |
| 0.0 | 0.4 | SA G2 AND M PHASES | Cdc25 activates the cdc2/cyclin B complex to induce the G2/M transition. |
| 0.0 | 2.8 | PID IL4 2PATHWAY | IL4-mediated signaling events |
| 0.0 | 2.0 | PID ATF2 PATHWAY | ATF-2 transcription factor network |
| 0.0 | 1.4 | PID BCR 5PATHWAY | BCR signaling pathway |
| 0.0 | 0.7 | PID EPHA2 FWD PATHWAY | EPHA2 forward signaling |
| 0.0 | 0.2 | ST INTERFERON GAMMA PATHWAY | Interferon gamma pathway. |
| 0.0 | 0.7 | PID SYNDECAN 2 PATHWAY | Syndecan-2-mediated signaling events |
| 0.0 | 0.2 | SA FAS SIGNALING | The TNF-type receptor Fas induces apoptosis on ligand binding. |
| 0.0 | 1.1 | PID ATR PATHWAY | ATR signaling pathway |
| 0.0 | 0.5 | PID CONE PATHWAY | Visual signal transduction: Cones |
| 0.0 | 0.4 | PID ARF 3PATHWAY | Arf1 pathway |
| 0.0 | 0.1 | ST DIFFERENTIATION PATHWAY IN PC12 CELLS | Differentiation Pathway in PC12 Cells; this is a specific case of PAC1 Receptor Pathway. |
| 0.0 | 0.3 | PID ALK2 PATHWAY | ALK2 signaling events |
| 0.0 | 0.4 | PID SMAD2 3PATHWAY | Regulation of cytoplasmic and nuclear SMAD2/3 signaling |
| 0.0 | 0.4 | PID PRL SIGNALING EVENTS PATHWAY | Signaling events mediated by PRL |
| 0.0 | 1.2 | PID ERA GENOMIC PATHWAY | Validated nuclear estrogen receptor alpha network |
| 0.0 | 0.4 | PID BMP PATHWAY | BMP receptor signaling |
| 0.0 | 0.5 | PID GLYPICAN 1PATHWAY | Glypican 1 network |
| 0.0 | 0.3 | PID RHOA PATHWAY | RhoA signaling pathway |
| 0.0 | 0.6 | PID PLK1 PATHWAY | PLK1 signaling events |
| 0.0 | 0.4 | PID AMB2 NEUTROPHILS PATHWAY | amb2 Integrin signaling |
| 0.0 | 0.3 | PID ANGIOPOIETIN RECEPTOR PATHWAY | Angiopoietin receptor Tie2-mediated signaling |
Gene overrepresentation in curated gene sets: REACTOME pathways category:
| Log-likelihood per target | Total log-likelihood | Term | Description |
|---|---|---|---|
| 0.1 | 1.3 | REACTOME ENDOSOMAL VACUOLAR PATHWAY | Genes involved in Endosomal/Vacuolar pathway |
| 0.1 | 1.9 | REACTOME INSULIN SYNTHESIS AND PROCESSING | Genes involved in Insulin Synthesis and Processing |
| 0.1 | 0.5 | REACTOME G ALPHA S SIGNALLING EVENTS | Genes involved in G alpha (s) signalling events |
| 0.0 | 0.4 | REACTOME IL 7 SIGNALING | Genes involved in Interleukin-7 signaling |
| 0.0 | 1.2 | REACTOME RIP MEDIATED NFKB ACTIVATION VIA DAI | Genes involved in RIP-mediated NFkB activation via DAI |
| 0.0 | 1.2 | REACTOME EXTRINSIC PATHWAY FOR APOPTOSIS | Genes involved in Extrinsic Pathway for Apoptosis |
| 0.0 | 0.9 | REACTOME N GLYCAN ANTENNAE ELONGATION | Genes involved in N-Glycan antennae elongation |
| 0.0 | 0.4 | REACTOME TRYPTOPHAN CATABOLISM | Genes involved in Tryptophan catabolism |
| 0.0 | 1.3 | REACTOME TRAF6 MEDIATED IRF7 ACTIVATION | Genes involved in TRAF6 mediated IRF7 activation |
| 0.0 | 0.5 | REACTOME SYNTHESIS OF SUBSTRATES IN N GLYCAN BIOSYTHESIS | Genes involved in Synthesis of substrates in N-glycan biosythesis |
| 0.0 | 2.6 | REACTOME INTERFERON ALPHA BETA SIGNALING | Genes involved in Interferon alpha/beta signaling |
| 0.0 | 1.3 | REACTOME IL RECEPTOR SHC SIGNALING | Genes involved in Interleukin receptor SHC signaling |
| 0.0 | 0.4 | REACTOME COPI MEDIATED TRANSPORT | Genes involved in COPI Mediated Transport |
| 0.0 | 0.8 | REACTOME GRB2 SOS PROVIDES LINKAGE TO MAPK SIGNALING FOR INTERGRINS | Genes involved in GRB2:SOS provides linkage to MAPK signaling for Intergrins |
| 0.0 | 0.7 | REACTOME CYTOSOLIC SULFONATION OF SMALL MOLECULES | Genes involved in Cytosolic sulfonation of small molecules |
| 0.0 | 0.9 | REACTOME NEGATIVE REGULATORS OF RIG I MDA5 SIGNALING | Genes involved in Negative regulators of RIG-I/MDA5 signaling |
| 0.0 | 0.3 | REACTOME GLYCOPROTEIN HORMONES | Genes involved in Glycoprotein hormones |
| 0.0 | 0.4 | REACTOME RECEPTOR LIGAND BINDING INITIATES THE SECOND PROTEOLYTIC CLEAVAGE OF NOTCH RECEPTOR | Genes involved in Receptor-ligand binding initiates the second proteolytic cleavage of Notch receptor |
| 0.0 | 0.8 | REACTOME SIGNALING BY BMP | Genes involved in Signaling by BMP |
| 0.0 | 0.8 | REACTOME SIGNALING BY NODAL | Genes involved in Signaling by NODAL |
| 0.0 | 1.5 | REACTOME P53 DEPENDENT G1 DNA DAMAGE RESPONSE | Genes involved in p53-Dependent G1 DNA Damage Response |
| 0.0 | 0.7 | REACTOME SYNTHESIS OF VERY LONG CHAIN FATTY ACYL COAS | Genes involved in Synthesis of very long-chain fatty acyl-CoAs |
| 0.0 | 0.3 | REACTOME REVERSIBLE HYDRATION OF CARBON DIOXIDE | Genes involved in Reversible Hydration of Carbon Dioxide |
| 0.0 | 0.3 | REACTOME TRAFFICKING AND PROCESSING OF ENDOSOMAL TLR | Genes involved in Trafficking and processing of endosomal TLR |
| 0.0 | 0.5 | REACTOME CRMPS IN SEMA3A SIGNALING | Genes involved in CRMPs in Sema3A signaling |
| 0.0 | 0.4 | REACTOME PROCESSING OF INTRONLESS PRE MRNAS | Genes involved in Processing of Intronless Pre-mRNAs |
| 0.0 | 0.3 | REACTOME UNWINDING OF DNA | Genes involved in Unwinding of DNA |
| 0.0 | 0.1 | REACTOME DESTABILIZATION OF MRNA BY TRISTETRAPROLIN TTP | Genes involved in Destabilization of mRNA by Tristetraprolin (TTP) |
| 0.0 | 0.4 | REACTOME DSCAM INTERACTIONS | Genes involved in DSCAM interactions |
| 0.0 | 0.2 | REACTOME THE NLRP3 INFLAMMASOME | Genes involved in The NLRP3 inflammasome |
| 0.0 | 0.3 | REACTOME METABOLISM OF POLYAMINES | Genes involved in Metabolism of polyamines |
| 0.0 | 0.3 | REACTOME SYNTHESIS OF PE | Genes involved in Synthesis of PE |
| 0.0 | 0.3 | REACTOME TETRAHYDROBIOPTERIN BH4 SYNTHESIS RECYCLING SALVAGE AND REGULATION | Genes involved in Tetrahydrobiopterin (BH4) synthesis, recycling, salvage and regulation |
| 0.0 | 0.2 | REACTOME SEMA3A PAK DEPENDENT AXON REPULSION | Genes involved in Sema3A PAK dependent Axon repulsion |
| 0.0 | 2.3 | REACTOME POTASSIUM CHANNELS | Genes involved in Potassium Channels |
| 0.0 | 0.4 | REACTOME AMINO ACID SYNTHESIS AND INTERCONVERSION TRANSAMINATION | Genes involved in Amino acid synthesis and interconversion (transamination) |
| 0.0 | 0.1 | REACTOME PACKAGING OF TELOMERE ENDS | Genes involved in Packaging Of Telomere Ends |
| 0.0 | 0.1 | REACTOME CREATION OF C4 AND C2 ACTIVATORS | Genes involved in Creation of C4 and C2 activators |
| 0.0 | 0.3 | REACTOME BETA DEFENSINS | Genes involved in Beta defensins |
| 0.0 | 0.3 | REACTOME SHC1 EVENTS IN ERBB4 SIGNALING | Genes involved in SHC1 events in ERBB4 signaling |