Project
Inflammatory response time course, HUVEC (Wada, 2009)
Navigation
Downloads
Results for NFATC4
Z-value: 2.00
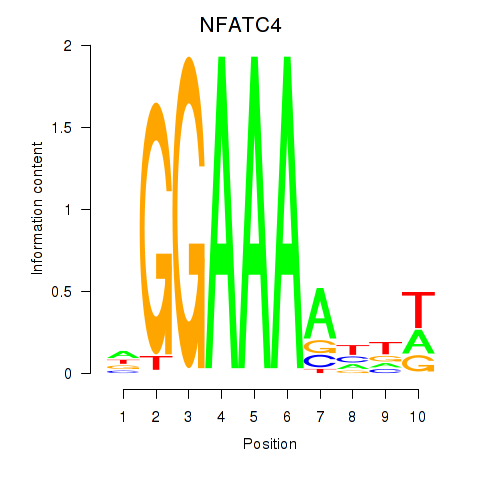
Motif logo
Transcription factors associated with NFATC4
| Gene Symbol | Gene ID | Gene Info |
|---|---|---|
|
NFATC4
|
ENSG00000100968.14 | NFATC4 |
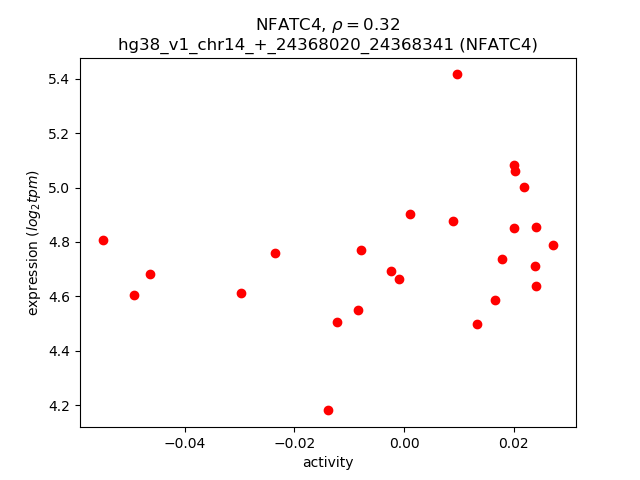
Activity-expression correlation:
| Gene | Promoter | Pearson corr. coef. | P-value | Plot |
|---|---|---|---|---|
| NFATC4 | hg38_v1_chr14_+_24368020_24368341 | 0.32 | 1.1e-01 | Click! |
Activity profile of NFATC4 motif
Sorted Z-values of NFATC4 motif
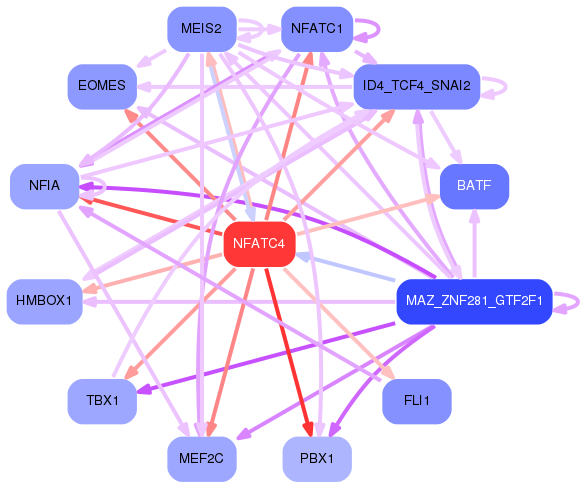
Network of associatons between targets according to the STRING database.

First level regulatory network of NFATC4
Gene Ontology Analysis
Gene overrepresentation in biological process category:
| Log-likelihood per target | Total log-likelihood | Term | Description |
|---|---|---|---|
| 1.9 | 5.6 | GO:0002302 | CD8-positive, alpha-beta T cell differentiation involved in immune response(GO:0002302) |
| 1.5 | 4.6 | GO:1903892 | negative regulation of ATF6-mediated unfolded protein response(GO:1903892) |
| 1.4 | 16.7 | GO:0048251 | elastic fiber assembly(GO:0048251) |
| 1.3 | 4.0 | GO:0001869 | regulation of complement activation, lectin pathway(GO:0001868) negative regulation of complement activation, lectin pathway(GO:0001869) |
| 1.3 | 5.1 | GO:0021649 | vestibulocochlear nerve structural organization(GO:0021649) positive regulation of cytokine activity(GO:0060301) ganglion morphogenesis(GO:0061552) VEGF-activated neuropilin signaling pathway involved in axon guidance(GO:1902378) dorsal root ganglion morphogenesis(GO:1904835) otic placode development(GO:1905040) |
| 1.2 | 9.9 | GO:0003185 | primary heart field specification(GO:0003138) sinoatrial valve development(GO:0003172) sinoatrial valve morphogenesis(GO:0003185) |
| 1.1 | 3.4 | GO:0050653 | chondroitin sulfate proteoglycan biosynthetic process, polysaccharide chain biosynthetic process(GO:0050653) |
| 1.0 | 3.0 | GO:1903926 | signal transduction involved in intra-S DNA damage checkpoint(GO:0072428) response to bisphenol A(GO:1903925) cellular response to bisphenol A(GO:1903926) |
| 0.9 | 6.4 | GO:0097338 | response to clozapine(GO:0097338) |
| 0.9 | 3.5 | GO:1905167 | positive regulation of lysosomal protein catabolic process(GO:1905167) |
| 0.9 | 2.6 | GO:1902809 | regulation of skeletal muscle fiber differentiation(GO:1902809) |
| 0.8 | 2.3 | GO:0014846 | esophagus smooth muscle contraction(GO:0014846) |
| 0.7 | 2.9 | GO:0032474 | otolith morphogenesis(GO:0032474) |
| 0.7 | 2.8 | GO:1904045 | cellular response to aldosterone(GO:1904045) |
| 0.7 | 4.1 | GO:0006574 | valine catabolic process(GO:0006574) |
| 0.7 | 2.6 | GO:0061357 | positive regulation of Wnt protein secretion(GO:0061357) |
| 0.6 | 5.7 | GO:0098967 | exocytic insertion of neurotransmitter receptor to plasma membrane(GO:0098881) exocytic insertion of neurotransmitter receptor to postsynaptic membrane(GO:0098967) |
| 0.6 | 2.3 | GO:1903756 | regulation of transcription from RNA polymerase II promoter by histone modification(GO:1903756) negative regulation of transcription from RNA polymerase II promoter by histone modification(GO:1903758) |
| 0.5 | 2.0 | GO:0018032 | protein amidation(GO:0018032) |
| 0.5 | 1.5 | GO:1904438 | regulation of antigen processing and presentation of peptide antigen via MHC class I(GO:0002589) negative regulation of antigen processing and presentation of peptide antigen via MHC class I(GO:0002590) regulation of T cell antigen processing and presentation(GO:0002625) positive regulation of iron ion transport(GO:0034758) positive regulation of iron ion transmembrane transport(GO:0034761) regulation of iron ion import(GO:1900390) regulation of ferrous iron import into cell(GO:1903989) positive regulation of ferrous iron import into cell(GO:1903991) regulation of ferrous iron binding(GO:1904432) positive regulation of ferrous iron binding(GO:1904434) regulation of transferrin receptor binding(GO:1904435) positive regulation of transferrin receptor binding(GO:1904437) regulation of ferrous iron import across plasma membrane(GO:1904438) positive regulation of ferrous iron import across plasma membrane(GO:1904440) response to iron ion starvation(GO:1990641) |
| 0.5 | 2.9 | GO:2000503 | positive regulation of natural killer cell chemotaxis(GO:2000503) |
| 0.5 | 2.9 | GO:0071460 | cellular response to cell-matrix adhesion(GO:0071460) |
| 0.5 | 6.6 | GO:0043374 | CD8-positive, alpha-beta T cell differentiation(GO:0043374) |
| 0.5 | 11.6 | GO:0009812 | flavonoid metabolic process(GO:0009812) |
| 0.4 | 2.0 | GO:1902498 | regulation of protein autoubiquitination(GO:1902498) |
| 0.4 | 1.1 | GO:0046416 | D-amino acid metabolic process(GO:0046416) |
| 0.4 | 11.5 | GO:0072189 | ureter development(GO:0072189) |
| 0.3 | 1.0 | GO:2000777 | positive regulation of oocyte maturation(GO:1900195) positive regulation of proteasomal ubiquitin-dependent protein catabolic process involved in cellular response to hypoxia(GO:2000777) |
| 0.3 | 1.0 | GO:0036111 | very long-chain fatty-acyl-CoA metabolic process(GO:0036111) |
| 0.3 | 2.2 | GO:0032431 | diacylglycerol biosynthetic process(GO:0006651) activation of phospholipase A2 activity(GO:0032431) |
| 0.3 | 2.3 | GO:0034316 | negative regulation of Arp2/3 complex-mediated actin nucleation(GO:0034316) |
| 0.3 | 1.4 | GO:0008588 | release of cytoplasmic sequestered NF-kappaB(GO:0008588) |
| 0.3 | 0.8 | GO:0034092 | negative regulation of maintenance of sister chromatid cohesion(GO:0034092) negative regulation of maintenance of mitotic sister chromatid cohesion(GO:0034183) maintenance of mitotic sister chromatid cohesion, telomeric(GO:0099403) mitotic sister chromatid cohesion, telomeric(GO:0099404) regulation of maintenance of mitotic sister chromatid cohesion, telomeric(GO:1904907) negative regulation of maintenance of mitotic sister chromatid cohesion, telomeric(GO:1904908) |
| 0.3 | 0.8 | GO:0035526 | retrograde transport, plasma membrane to Golgi(GO:0035526) |
| 0.3 | 1.5 | GO:0006696 | ergosterol biosynthetic process(GO:0006696) ergosterol metabolic process(GO:0008204) |
| 0.3 | 8.6 | GO:0035162 | embryonic hemopoiesis(GO:0035162) |
| 0.2 | 10.4 | GO:0010842 | retina layer formation(GO:0010842) |
| 0.2 | 1.7 | GO:0016584 | nucleosome positioning(GO:0016584) |
| 0.2 | 0.7 | GO:1902683 | regulation of receptor localization to synapse(GO:1902683) |
| 0.2 | 1.6 | GO:0060414 | aorta smooth muscle tissue morphogenesis(GO:0060414) |
| 0.2 | 1.1 | GO:0044856 | plasma membrane raft distribution(GO:0044855) plasma membrane raft localization(GO:0044856) plasma membrane raft polarization(GO:0044858) regulation of plasma membrane raft polarization(GO:1903906) |
| 0.2 | 0.7 | GO:0060032 | notochord regression(GO:0060032) |
| 0.2 | 2.9 | GO:2000096 | positive regulation of Wnt signaling pathway, planar cell polarity pathway(GO:2000096) |
| 0.2 | 4.2 | GO:0035563 | positive regulation of chromatin binding(GO:0035563) |
| 0.2 | 0.8 | GO:0006740 | NADPH regeneration(GO:0006740) |
| 0.2 | 0.5 | GO:1903677 | regulation of cap-independent translational initiation(GO:1903677) positive regulation of cap-independent translational initiation(GO:1903679) regulation of cytoplasmic translational initiation(GO:1904688) positive regulation of cytoplasmic translational initiation(GO:1904690) |
| 0.2 | 6.6 | GO:0003298 | physiological muscle hypertrophy(GO:0003298) physiological cardiac muscle hypertrophy(GO:0003301) cell growth involved in cardiac muscle cell development(GO:0061049) |
| 0.2 | 1.7 | GO:0046959 | habituation(GO:0046959) negative regulation of growth hormone secretion(GO:0060125) |
| 0.2 | 1.3 | GO:0061343 | cell adhesion involved in heart morphogenesis(GO:0061343) |
| 0.2 | 1.0 | GO:0006701 | progesterone biosynthetic process(GO:0006701) |
| 0.2 | 3.8 | GO:0032060 | bleb assembly(GO:0032060) |
| 0.2 | 1.6 | GO:0001887 | selenium compound metabolic process(GO:0001887) |
| 0.2 | 2.0 | GO:1900028 | negative regulation of ruffle assembly(GO:1900028) |
| 0.2 | 1.7 | GO:1902459 | positive regulation of stem cell population maintenance(GO:1902459) |
| 0.2 | 0.9 | GO:0002225 | positive regulation of antimicrobial peptide production(GO:0002225) positive regulation of antibacterial peptide production(GO:0002803) |
| 0.1 | 0.4 | GO:0070093 | negative regulation of glucagon secretion(GO:0070093) |
| 0.1 | 18.4 | GO:0030032 | lamellipodium assembly(GO:0030032) |
| 0.1 | 1.0 | GO:0006154 | adenosine catabolic process(GO:0006154) inosine biosynthetic process(GO:0046103) |
| 0.1 | 0.7 | GO:0002357 | defense response to tumor cell(GO:0002357) |
| 0.1 | 2.3 | GO:0001675 | acrosome assembly(GO:0001675) |
| 0.1 | 0.7 | GO:2000653 | regulation of genetic imprinting(GO:2000653) |
| 0.1 | 1.9 | GO:0051661 | maintenance of centrosome location(GO:0051661) |
| 0.1 | 0.4 | GO:1990785 | response to water-immersion restraint stress(GO:1990785) |
| 0.1 | 3.6 | GO:0016180 | snRNA processing(GO:0016180) |
| 0.1 | 0.6 | GO:0086053 | AV node cell to bundle of His cell communication by electrical coupling(GO:0086053) |
| 0.1 | 1.0 | GO:0002329 | pre-B cell differentiation(GO:0002329) |
| 0.1 | 1.8 | GO:0048387 | negative regulation of retinoic acid receptor signaling pathway(GO:0048387) |
| 0.1 | 1.3 | GO:0015886 | heme transport(GO:0015886) |
| 0.1 | 0.8 | GO:0042539 | hypotonic salinity response(GO:0042539) cellular hypotonic salinity response(GO:0071477) |
| 0.1 | 1.3 | GO:0042985 | negative regulation of amyloid precursor protein biosynthetic process(GO:0042985) |
| 0.1 | 0.7 | GO:0002036 | regulation of L-glutamate transport(GO:0002036) |
| 0.1 | 2.6 | GO:0006044 | N-acetylglucosamine metabolic process(GO:0006044) |
| 0.1 | 1.3 | GO:0090091 | positive regulation of extracellular matrix disassembly(GO:0090091) |
| 0.1 | 0.9 | GO:0031022 | nuclear migration along microfilament(GO:0031022) |
| 0.1 | 1.4 | GO:0009642 | response to light intensity(GO:0009642) |
| 0.1 | 2.5 | GO:0034389 | lipid particle organization(GO:0034389) |
| 0.1 | 0.4 | GO:1901842 | negative regulation of high voltage-gated calcium channel activity(GO:1901842) |
| 0.1 | 0.7 | GO:0071386 | cellular response to corticosterone stimulus(GO:0071386) |
| 0.1 | 0.6 | GO:0032417 | positive regulation of sodium:proton antiporter activity(GO:0032417) |
| 0.1 | 7.2 | GO:0043268 | positive regulation of potassium ion transport(GO:0043268) |
| 0.1 | 0.6 | GO:2001012 | mesenchymal cell differentiation involved in kidney development(GO:0072161) mesenchymal cell differentiation involved in renal system development(GO:2001012) |
| 0.1 | 0.5 | GO:1903232 | melanosome assembly(GO:1903232) |
| 0.1 | 0.9 | GO:0070307 | lens fiber cell development(GO:0070307) |
| 0.1 | 0.5 | GO:0030885 | regulation of myeloid dendritic cell activation(GO:0030885) |
| 0.1 | 1.4 | GO:0036109 | fatty acid beta-oxidation using acyl-CoA oxidase(GO:0033540) alpha-linolenic acid metabolic process(GO:0036109) |
| 0.1 | 1.4 | GO:0043116 | negative regulation of vascular permeability(GO:0043116) |
| 0.1 | 0.5 | GO:1903377 | negative regulation of oxidative stress-induced neuron intrinsic apoptotic signaling pathway(GO:1903377) |
| 0.1 | 0.3 | GO:0030200 | heparan sulfate proteoglycan catabolic process(GO:0030200) |
| 0.1 | 0.6 | GO:0006572 | tyrosine catabolic process(GO:0006572) |
| 0.1 | 0.3 | GO:0001994 | norepinephrine-epinephrine vasoconstriction involved in regulation of systemic arterial blood pressure(GO:0001994) |
| 0.1 | 0.3 | GO:0038018 | Wnt receptor catabolic process(GO:0038018) |
| 0.1 | 0.4 | GO:2000210 | positive regulation of anoikis(GO:2000210) |
| 0.1 | 0.2 | GO:0001812 | positive regulation of type I hypersensitivity(GO:0001812) |
| 0.1 | 3.4 | GO:0033173 | calcineurin-NFAT signaling cascade(GO:0033173) |
| 0.1 | 1.0 | GO:0051988 | regulation of attachment of spindle microtubules to kinetochore(GO:0051988) |
| 0.1 | 0.2 | GO:0002881 | negative regulation of chronic inflammatory response to non-antigenic stimulus(GO:0002881) |
| 0.1 | 0.5 | GO:1903237 | negative regulation of leukocyte tethering or rolling(GO:1903237) |
| 0.1 | 1.0 | GO:0006516 | glycoprotein catabolic process(GO:0006516) |
| 0.1 | 0.2 | GO:0010572 | positive regulation of platelet activation(GO:0010572) |
| 0.1 | 0.2 | GO:0034414 | tRNA 3'-trailer cleavage, endonucleolytic(GO:0034414) tRNA 3'-trailer cleavage(GO:0042779) |
| 0.1 | 0.3 | GO:0010032 | meiotic chromosome condensation(GO:0010032) |
| 0.1 | 0.4 | GO:0060478 | acrosomal vesicle exocytosis(GO:0060478) |
| 0.1 | 0.8 | GO:0006703 | estrogen biosynthetic process(GO:0006703) |
| 0.1 | 0.9 | GO:0072540 | T-helper 17 cell lineage commitment(GO:0072540) |
| 0.1 | 1.2 | GO:0051044 | positive regulation of membrane protein ectodomain proteolysis(GO:0051044) |
| 0.1 | 0.5 | GO:0048341 | paraxial mesoderm formation(GO:0048341) |
| 0.0 | 0.9 | GO:1904778 | regulation of protein localization to cell cortex(GO:1904776) positive regulation of protein localization to cell cortex(GO:1904778) |
| 0.0 | 2.4 | GO:0032731 | positive regulation of interleukin-1 beta production(GO:0032731) |
| 0.0 | 3.9 | GO:0032781 | positive regulation of ATPase activity(GO:0032781) |
| 0.0 | 0.6 | GO:0030949 | positive regulation of vascular endothelial growth factor receptor signaling pathway(GO:0030949) |
| 0.0 | 1.6 | GO:0031069 | hair follicle morphogenesis(GO:0031069) |
| 0.0 | 0.5 | GO:0050861 | positive regulation of B cell receptor signaling pathway(GO:0050861) |
| 0.0 | 0.4 | GO:0010727 | negative regulation of hydrogen peroxide metabolic process(GO:0010727) |
| 0.0 | 0.6 | GO:0010623 | programmed cell death involved in cell development(GO:0010623) |
| 0.0 | 1.2 | GO:0097320 | membrane tubulation(GO:0097320) |
| 0.0 | 0.7 | GO:0071688 | striated muscle myosin thick filament assembly(GO:0071688) |
| 0.0 | 0.3 | GO:0071651 | positive regulation of chemokine (C-C motif) ligand 5 production(GO:0071651) |
| 0.0 | 10.3 | GO:0008360 | regulation of cell shape(GO:0008360) |
| 0.0 | 3.1 | GO:0007077 | mitotic nuclear envelope disassembly(GO:0007077) |
| 0.0 | 0.1 | GO:0032416 | negative regulation of sodium:proton antiporter activity(GO:0032416) |
| 0.0 | 0.4 | GO:0010867 | positive regulation of triglyceride biosynthetic process(GO:0010867) |
| 0.0 | 0.3 | GO:0035672 | oligopeptide transmembrane transport(GO:0035672) |
| 0.0 | 0.7 | GO:0035855 | megakaryocyte development(GO:0035855) |
| 0.0 | 0.3 | GO:0036289 | peptidyl-serine autophosphorylation(GO:0036289) |
| 0.0 | 3.1 | GO:0006383 | transcription from RNA polymerase III promoter(GO:0006383) |
| 0.0 | 0.7 | GO:0051770 | positive regulation of nitric-oxide synthase biosynthetic process(GO:0051770) |
| 0.0 | 2.2 | GO:0000413 | protein peptidyl-prolyl isomerization(GO:0000413) |
| 0.0 | 0.1 | GO:0031117 | positive regulation of microtubule depolymerization(GO:0031117) |
| 0.0 | 0.7 | GO:0060044 | negative regulation of cardiac muscle tissue growth(GO:0055022) negative regulation of cardiac muscle cell proliferation(GO:0060044) negative regulation of heart growth(GO:0061117) |
| 0.0 | 0.2 | GO:0086048 | membrane depolarization during bundle of His cell action potential(GO:0086048) |
| 0.0 | 1.3 | GO:0097503 | sialylation(GO:0097503) |
| 0.0 | 0.7 | GO:0070493 | thrombin receptor signaling pathway(GO:0070493) |
| 0.0 | 0.2 | GO:0060158 | phospholipase C-activating dopamine receptor signaling pathway(GO:0060158) |
| 0.0 | 0.7 | GO:0001556 | oocyte maturation(GO:0001556) |
| 0.0 | 0.4 | GO:2000622 | regulation of nuclear-transcribed mRNA catabolic process, nonsense-mediated decay(GO:2000622) negative regulation of nuclear-transcribed mRNA catabolic process, nonsense-mediated decay(GO:2000623) |
| 0.0 | 0.9 | GO:0043555 | regulation of translation in response to stress(GO:0043555) |
| 0.0 | 2.7 | GO:0007585 | respiratory gaseous exchange(GO:0007585) |
| 0.0 | 0.7 | GO:0045898 | regulation of RNA polymerase II transcriptional preinitiation complex assembly(GO:0045898) |
| 0.0 | 1.8 | GO:0031102 | neuron projection regeneration(GO:0031102) |
| 0.0 | 1.2 | GO:0000188 | inactivation of MAPK activity(GO:0000188) |
| 0.0 | 1.3 | GO:1903959 | regulation of anion transmembrane transport(GO:1903959) |
| 0.0 | 0.5 | GO:0038092 | nodal signaling pathway(GO:0038092) |
| 0.0 | 0.1 | GO:1903031 | regulation of microtubule plus-end binding(GO:1903031) positive regulation of microtubule plus-end binding(GO:1903033) |
| 0.0 | 1.2 | GO:0070207 | protein homotrimerization(GO:0070207) |
| 0.0 | 0.7 | GO:0090312 | positive regulation of protein deacetylation(GO:0090312) |
| 0.0 | 0.1 | GO:0001507 | acetylcholine catabolic process in synaptic cleft(GO:0001507) acetylcholine catabolic process(GO:0006581) |
| 0.0 | 0.1 | GO:1903251 | multi-ciliated epithelial cell differentiation(GO:1903251) |
| 0.0 | 2.7 | GO:0000079 | regulation of cyclin-dependent protein serine/threonine kinase activity(GO:0000079) |
| 0.0 | 0.2 | GO:0046813 | receptor-mediated virion attachment to host cell(GO:0046813) |
| 0.0 | 0.5 | GO:0007064 | mitotic sister chromatid cohesion(GO:0007064) |
| 0.0 | 0.2 | GO:0042866 | pyruvate biosynthetic process(GO:0042866) |
| 0.0 | 0.2 | GO:1903546 | protein localization to photoreceptor outer segment(GO:1903546) |
| 0.0 | 0.2 | GO:0051725 | protein de-ADP-ribosylation(GO:0051725) |
| 0.0 | 0.9 | GO:0016486 | peptide hormone processing(GO:0016486) |
| 0.0 | 0.4 | GO:0018298 | protein-chromophore linkage(GO:0018298) |
| 0.0 | 0.3 | GO:0000963 | mitochondrial RNA processing(GO:0000963) |
| 0.0 | 0.3 | GO:0045008 | depyrimidination(GO:0045008) |
| 0.0 | 0.7 | GO:0061014 | positive regulation of mRNA catabolic process(GO:0061014) |
| 0.0 | 0.7 | GO:0018126 | protein hydroxylation(GO:0018126) |
| 0.0 | 1.0 | GO:0021762 | substantia nigra development(GO:0021762) |
| 0.0 | 1.5 | GO:0009060 | aerobic respiration(GO:0009060) |
| 0.0 | 0.3 | GO:1903504 | regulation of mitotic cell cycle spindle assembly checkpoint(GO:0090266) regulation of mitotic spindle checkpoint(GO:1903504) |
| 0.0 | 0.3 | GO:0010991 | negative regulation of SMAD protein complex assembly(GO:0010991) |
| 0.0 | 0.0 | GO:0002378 | immunoglobulin biosynthetic process(GO:0002378) |
| 0.0 | 1.8 | GO:0006672 | ceramide metabolic process(GO:0006672) |
| 0.0 | 0.2 | GO:0070327 | thyroid hormone transport(GO:0070327) |
| 0.0 | 1.6 | GO:0032508 | DNA duplex unwinding(GO:0032508) |
| 0.0 | 0.5 | GO:0002323 | natural killer cell activation involved in immune response(GO:0002323) |
| 0.0 | 2.6 | GO:0065004 | protein-DNA complex assembly(GO:0065004) |
| 0.0 | 0.3 | GO:0042118 | endothelial cell activation(GO:0042118) |
| 0.0 | 0.4 | GO:0061099 | negative regulation of protein tyrosine kinase activity(GO:0061099) |
| 0.0 | 0.4 | GO:0031122 | cytoplasmic microtubule organization(GO:0031122) |
| 0.0 | 0.9 | GO:0061178 | regulation of insulin secretion involved in cellular response to glucose stimulus(GO:0061178) |
| 0.0 | 1.3 | GO:0010811 | positive regulation of cell-substrate adhesion(GO:0010811) |
Gene overrepresentation in cellular component category:
| Log-likelihood per target | Total log-likelihood | Term | Description |
|---|---|---|---|
| 2.2 | 19.4 | GO:0071953 | elastic fiber(GO:0071953) |
| 1.2 | 3.5 | GO:1990666 | PCSK9-LDLR complex(GO:1990666) |
| 1.1 | 5.7 | GO:1990796 | photoreceptor cell terminal bouton(GO:1990796) |
| 0.6 | 5.1 | GO:0097443 | sorting endosome(GO:0097443) |
| 0.6 | 1.7 | GO:0071148 | TEAD-1-YAP complex(GO:0071148) |
| 0.5 | 1.9 | GO:0044307 | dendritic branch(GO:0044307) |
| 0.4 | 2.2 | GO:0032311 | angiogenin-PRI complex(GO:0032311) |
| 0.3 | 1.3 | GO:1990876 | cytoplasmic side of nuclear pore(GO:1990876) |
| 0.3 | 6.4 | GO:0005952 | cAMP-dependent protein kinase complex(GO:0005952) |
| 0.3 | 5.6 | GO:0043220 | Schmidt-Lanterman incisure(GO:0043220) |
| 0.3 | 1.5 | GO:1990357 | terminal web(GO:1990357) |
| 0.2 | 3.6 | GO:0032039 | integrator complex(GO:0032039) |
| 0.2 | 0.6 | GO:0071062 | alphav-beta3 integrin-vitronectin complex(GO:0071062) |
| 0.2 | 0.8 | GO:0031933 | telomeric heterochromatin(GO:0031933) |
| 0.2 | 1.7 | GO:0016589 | NURF complex(GO:0016589) |
| 0.2 | 1.0 | GO:0097149 | centralspindlin complex(GO:0097149) |
| 0.1 | 1.6 | GO:0097470 | ribbon synapse(GO:0097470) |
| 0.1 | 0.7 | GO:0005943 | phosphatidylinositol 3-kinase complex, class IA(GO:0005943) |
| 0.1 | 5.2 | GO:0005720 | nuclear heterochromatin(GO:0005720) |
| 0.1 | 3.1 | GO:0005666 | DNA-directed RNA polymerase III complex(GO:0005666) |
| 0.1 | 0.5 | GO:0045293 | MIS complex(GO:0036396) mRNA editing complex(GO:0045293) |
| 0.1 | 1.3 | GO:0035102 | PRC1 complex(GO:0035102) |
| 0.1 | 0.5 | GO:0031905 | early endosome lumen(GO:0031905) |
| 0.1 | 1.3 | GO:0005583 | fibrillar collagen trimer(GO:0005583) banded collagen fibril(GO:0098643) |
| 0.1 | 10.2 | GO:0001725 | stress fiber(GO:0001725) contractile actin filament bundle(GO:0097517) |
| 0.1 | 1.0 | GO:0002199 | zona pellucida receptor complex(GO:0002199) |
| 0.1 | 1.1 | GO:0030478 | actin cap(GO:0030478) |
| 0.1 | 1.5 | GO:0031089 | platelet dense granule lumen(GO:0031089) |
| 0.1 | 2.0 | GO:0005614 | interstitial matrix(GO:0005614) |
| 0.1 | 0.5 | GO:0032584 | growth cone membrane(GO:0032584) |
| 0.1 | 3.3 | GO:0032590 | dendrite membrane(GO:0032590) |
| 0.1 | 2.6 | GO:0005697 | telomerase holoenzyme complex(GO:0005697) |
| 0.1 | 0.9 | GO:0097433 | dense body(GO:0097433) |
| 0.1 | 0.4 | GO:0002079 | inner acrosomal membrane(GO:0002079) outer acrosomal membrane(GO:0002081) |
| 0.1 | 3.4 | GO:0030173 | integral component of Golgi membrane(GO:0030173) |
| 0.1 | 0.3 | GO:1990604 | IRE1-TRAF2-ASK1 complex(GO:1990604) |
| 0.1 | 3.8 | GO:0019005 | SCF ubiquitin ligase complex(GO:0019005) |
| 0.1 | 3.5 | GO:0031907 | peroxisomal matrix(GO:0005782) microbody lumen(GO:0031907) |
| 0.0 | 0.9 | GO:0008091 | spectrin(GO:0008091) |
| 0.0 | 0.7 | GO:0030015 | CCR4-NOT core complex(GO:0030015) |
| 0.0 | 0.9 | GO:0034992 | microtubule organizing center attachment site(GO:0034992) LINC complex(GO:0034993) |
| 0.0 | 0.3 | GO:0000796 | condensin complex(GO:0000796) |
| 0.0 | 4.9 | GO:0016459 | myosin complex(GO:0016459) |
| 0.0 | 0.5 | GO:0042382 | paraspeckles(GO:0042382) |
| 0.0 | 1.0 | GO:0044232 | organelle membrane contact site(GO:0044232) |
| 0.0 | 11.2 | GO:0043197 | dendritic spine(GO:0043197) |
| 0.0 | 0.2 | GO:0032280 | symmetric synapse(GO:0032280) |
| 0.0 | 1.3 | GO:0016581 | NuRD complex(GO:0016581) CHD-type complex(GO:0090545) |
| 0.0 | 4.0 | GO:0031093 | platelet alpha granule lumen(GO:0031093) |
| 0.0 | 3.8 | GO:0000502 | proteasome complex(GO:0000502) |
| 0.0 | 10.0 | GO:0030027 | lamellipodium(GO:0030027) |
| 0.0 | 7.1 | GO:0090575 | RNA polymerase II transcription factor complex(GO:0090575) |
| 0.0 | 1.1 | GO:0071564 | npBAF complex(GO:0071564) |
| 0.0 | 0.1 | GO:0043625 | delta DNA polymerase complex(GO:0043625) |
| 0.0 | 3.5 | GO:0032993 | protein-DNA complex(GO:0032993) |
| 0.0 | 0.2 | GO:0010369 | chromocenter(GO:0010369) |
| 0.0 | 1.3 | GO:0008305 | integrin complex(GO:0008305) |
| 0.0 | 0.6 | GO:0005922 | connexon complex(GO:0005922) |
| 0.0 | 1.5 | GO:0008023 | transcription elongation factor complex(GO:0008023) |
| 0.0 | 2.8 | GO:0005758 | mitochondrial intermembrane space(GO:0005758) |
| 0.0 | 1.9 | GO:0031463 | Cul3-RING ubiquitin ligase complex(GO:0031463) |
| 0.0 | 3.0 | GO:0016605 | PML body(GO:0016605) |
| 0.0 | 0.4 | GO:0005671 | Ada2/Gcn5/Ada3 transcription activator complex(GO:0005671) |
| 0.0 | 17.6 | GO:0016604 | nuclear body(GO:0016604) |
| 0.0 | 0.4 | GO:0042622 | photoreceptor outer segment membrane(GO:0042622) |
| 0.0 | 0.2 | GO:0043240 | Fanconi anaemia nuclear complex(GO:0043240) |
| 0.0 | 1.4 | GO:0030134 | ER to Golgi transport vesicle(GO:0030134) |
| 0.0 | 2.1 | GO:0005604 | basement membrane(GO:0005604) |
| 0.0 | 0.4 | GO:0098563 | integral component of synaptic vesicle membrane(GO:0030285) intrinsic component of synaptic vesicle membrane(GO:0098563) |
| 0.0 | 2.6 | GO:0031901 | early endosome membrane(GO:0031901) |
| 0.0 | 2.4 | GO:0005795 | Golgi stack(GO:0005795) |
| 0.0 | 0.1 | GO:0098536 | deuterosome(GO:0098536) |
| 0.0 | 1.5 | GO:0005930 | axoneme(GO:0005930) ciliary plasm(GO:0097014) |
| 0.0 | 0.4 | GO:0051233 | spindle midzone(GO:0051233) |
| 0.0 | 0.3 | GO:0005689 | U12-type spliceosomal complex(GO:0005689) |
| 0.0 | 0.8 | GO:0032588 | trans-Golgi network membrane(GO:0032588) |
Gene overrepresentation in molecular function category:
| Log-likelihood per target | Total log-likelihood | Term | Description |
|---|---|---|---|
| 2.7 | 10.7 | GO:0016524 | latrotoxin receptor activity(GO:0016524) |
| 1.3 | 4.0 | GO:0019959 | interleukin-8 binding(GO:0019959) |
| 0.7 | 2.0 | GO:0003860 | 3-hydroxyisobutyryl-CoA hydrolase activity(GO:0003860) |
| 0.6 | 2.9 | GO:0031726 | CCR1 chemokine receptor binding(GO:0031726) |
| 0.6 | 11.6 | GO:0004062 | aryl sulfotransferase activity(GO:0004062) |
| 0.6 | 3.4 | GO:0047238 | glucuronylgalactosylproteoglycan 4-beta-N-acetylgalactosaminyltransferase activity(GO:0047237) glucuronosyl-N-acetylgalactosaminyl-proteoglycan 4-beta-N-acetylgalactosaminyltransferase activity(GO:0047238) |
| 0.6 | 4.0 | GO:0001225 | RNA polymerase II transcription coactivator binding(GO:0001225) |
| 0.5 | 9.9 | GO:0003680 | AT DNA binding(GO:0003680) |
| 0.5 | 2.0 | GO:0004598 | peptidylglycine monooxygenase activity(GO:0004504) peptidylamidoglycolate lyase activity(GO:0004598) |
| 0.5 | 2.3 | GO:0008449 | N-acetylglucosamine-6-sulfatase activity(GO:0008449) |
| 0.4 | 3.5 | GO:0038085 | vascular endothelial growth factor binding(GO:0038085) |
| 0.4 | 3.5 | GO:0030229 | very-low-density lipoprotein particle receptor activity(GO:0030229) |
| 0.4 | 1.2 | GO:0098640 | integrin binding involved in cell-matrix adhesion(GO:0098640) |
| 0.4 | 6.4 | GO:0004691 | cAMP-dependent protein kinase activity(GO:0004691) |
| 0.4 | 10.3 | GO:0042813 | Wnt-activated receptor activity(GO:0042813) |
| 0.4 | 2.6 | GO:0001517 | N-acetylglucosamine 6-O-sulfotransferase activity(GO:0001517) |
| 0.4 | 2.2 | GO:0004522 | ribonuclease A activity(GO:0004522) |
| 0.4 | 5.7 | GO:0050544 | arachidonic acid binding(GO:0050544) |
| 0.3 | 3.3 | GO:0016312 | inositol bisphosphate phosphatase activity(GO:0016312) |
| 0.3 | 1.0 | GO:0034739 | histone deacetylase activity (H4-K16 specific)(GO:0034739) |
| 0.3 | 1.0 | GO:0044594 | 3alpha,7alpha,12alpha-trihydroxy-5beta-cholest-24-enoyl-CoA hydratase activity(GO:0033989) 17-beta-hydroxysteroid dehydrogenase (NAD+) activity(GO:0044594) |
| 0.3 | 1.8 | GO:0003998 | acylphosphatase activity(GO:0003998) |
| 0.3 | 0.8 | GO:0015616 | DNA translocase activity(GO:0015616) |
| 0.3 | 1.3 | GO:0047288 | monosialoganglioside sialyltransferase activity(GO:0047288) |
| 0.3 | 0.8 | GO:0000253 | 3-keto sterol reductase activity(GO:0000253) |
| 0.3 | 0.8 | GO:0016652 | NAD(P)+ transhydrogenase activity(GO:0008746) oxidoreductase activity, acting on NAD(P)H, NAD(P) as acceptor(GO:0016652) |
| 0.3 | 1.5 | GO:0004310 | farnesyl-diphosphate farnesyltransferase activity(GO:0004310) squalene synthase activity(GO:0051996) |
| 0.2 | 2.8 | GO:0016174 | NAD(P)H oxidase activity(GO:0016174) |
| 0.2 | 3.0 | GO:0071933 | Arp2/3 complex binding(GO:0071933) |
| 0.2 | 6.9 | GO:0008093 | cytoskeletal adaptor activity(GO:0008093) |
| 0.2 | 1.8 | GO:0044323 | retinoic acid-responsive element binding(GO:0044323) |
| 0.2 | 1.8 | GO:0017040 | ceramidase activity(GO:0017040) |
| 0.2 | 1.6 | GO:0030267 | hydroxypyruvate reductase activity(GO:0016618) glyoxylate reductase (NADP) activity(GO:0030267) |
| 0.2 | 4.3 | GO:0001087 | transcription factor activity, sequence-specific DNA binding, RNA polymerase recruiting(GO:0001011) transcription factor activity, TFIIB-class binding(GO:0001087) |
| 0.2 | 1.2 | GO:0038062 | protein tyrosine kinase collagen receptor activity(GO:0038062) |
| 0.2 | 2.6 | GO:0003720 | telomerase activity(GO:0003720) RNA-directed DNA polymerase activity(GO:0003964) |
| 0.2 | 0.6 | GO:1904713 | beta-catenin destruction complex binding(GO:1904713) |
| 0.2 | 0.5 | GO:0016422 | mRNA (2'-O-methyladenosine-N6-)-methyltransferase activity(GO:0016422) |
| 0.2 | 1.4 | GO:0016403 | dimethylargininase activity(GO:0016403) |
| 0.2 | 0.5 | GO:0080130 | L-phenylalanine:2-oxoglutarate aminotransferase activity(GO:0080130) |
| 0.2 | 1.0 | GO:0008273 | calcium, potassium:sodium antiporter activity(GO:0008273) |
| 0.2 | 0.5 | GO:0035650 | AP-1 adaptor complex binding(GO:0035650) AP-3 adaptor complex binding(GO:0035651) |
| 0.2 | 0.5 | GO:0008511 | sodium:potassium:chloride symporter activity(GO:0008511) |
| 0.2 | 1.4 | GO:0003997 | acyl-CoA oxidase activity(GO:0003997) |
| 0.2 | 2.6 | GO:0017147 | Wnt-protein binding(GO:0017147) |
| 0.1 | 0.7 | GO:0047280 | nicotinamide phosphoribosyltransferase activity(GO:0047280) |
| 0.1 | 2.7 | GO:0005522 | profilin binding(GO:0005522) |
| 0.1 | 1.5 | GO:0047134 | protein-disulfide reductase activity(GO:0047134) |
| 0.1 | 1.6 | GO:0008430 | selenium binding(GO:0008430) |
| 0.1 | 0.6 | GO:0086077 | gap junction channel activity involved in AV node cell-bundle of His cell electrical coupling(GO:0086077) |
| 0.1 | 1.3 | GO:0015232 | heme transporter activity(GO:0015232) |
| 0.1 | 1.3 | GO:0048407 | platelet-derived growth factor binding(GO:0048407) |
| 0.1 | 1.1 | GO:0001162 | RNA polymerase II intronic transcription regulatory region sequence-specific DNA binding(GO:0001162) |
| 0.1 | 3.9 | GO:0001671 | ATPase activator activity(GO:0001671) |
| 0.1 | 1.0 | GO:0031685 | adenosine receptor binding(GO:0031685) |
| 0.1 | 1.5 | GO:1990459 | transferrin receptor binding(GO:1990459) |
| 0.1 | 0.3 | GO:0004566 | beta-glucuronidase activity(GO:0004566) heparanase activity(GO:0030305) |
| 0.1 | 0.3 | GO:0004937 | alpha1-adrenergic receptor activity(GO:0004937) |
| 0.1 | 0.4 | GO:0032810 | sterol response element binding(GO:0032810) |
| 0.1 | 0.3 | GO:0043273 | CTPase activity(GO:0043273) |
| 0.1 | 2.2 | GO:0005528 | macrolide binding(GO:0005527) FK506 binding(GO:0005528) |
| 0.1 | 0.3 | GO:0050692 | DBD domain binding(GO:0050692) |
| 0.1 | 0.2 | GO:1902271 | D3 vitamins binding(GO:1902271) |
| 0.1 | 2.0 | GO:0031435 | mitogen-activated protein kinase kinase kinase binding(GO:0031435) |
| 0.1 | 0.9 | GO:0042731 | PH domain binding(GO:0042731) |
| 0.1 | 0.3 | GO:0004583 | dolichyl-phosphate-glucose-glycolipid alpha-glucosyltransferase activity(GO:0004583) |
| 0.1 | 1.3 | GO:0005049 | nuclear export signal receptor activity(GO:0005049) |
| 0.1 | 2.1 | GO:0000062 | fatty-acyl-CoA binding(GO:0000062) |
| 0.1 | 0.2 | GO:1990763 | arrestin family protein binding(GO:1990763) |
| 0.1 | 0.3 | GO:0000702 | oxidized base lesion DNA N-glycosylase activity(GO:0000702) |
| 0.1 | 0.4 | GO:0005502 | 11-cis retinal binding(GO:0005502) |
| 0.1 | 1.1 | GO:0045159 | myosin II binding(GO:0045159) |
| 0.1 | 1.0 | GO:0045504 | dynein heavy chain binding(GO:0045504) |
| 0.1 | 0.7 | GO:0035005 | 1-phosphatidylinositol-4-phosphate 3-kinase activity(GO:0035005) |
| 0.1 | 0.1 | GO:0070506 | high-density lipoprotein particle receptor activity(GO:0070506) |
| 0.1 | 0.6 | GO:0043184 | vascular endothelial growth factor receptor 2 binding(GO:0043184) |
| 0.1 | 0.2 | GO:0016495 | C-X3-C chemokine receptor activity(GO:0016495) |
| 0.1 | 1.2 | GO:0005537 | mannose binding(GO:0005537) |
| 0.1 | 0.7 | GO:0019869 | chloride channel inhibitor activity(GO:0019869) |
| 0.1 | 1.9 | GO:0034237 | protein kinase A regulatory subunit binding(GO:0034237) |
| 0.1 | 0.8 | GO:0022820 | potassium:chloride symporter activity(GO:0015379) potassium ion symporter activity(GO:0022820) |
| 0.1 | 1.9 | GO:0070001 | aspartic-type endopeptidase activity(GO:0004190) aspartic-type peptidase activity(GO:0070001) |
| 0.1 | 0.3 | GO:0035673 | oligopeptide transmembrane transporter activity(GO:0035673) |
| 0.1 | 1.1 | GO:0071949 | FAD binding(GO:0071949) |
| 0.1 | 2.3 | GO:0070577 | lysine-acetylated histone binding(GO:0070577) |
| 0.1 | 3.1 | GO:0003899 | DNA-directed RNA polymerase activity(GO:0003899) |
| 0.1 | 5.4 | GO:0048306 | calcium-dependent protein binding(GO:0048306) |
| 0.1 | 0.2 | GO:0042781 | 3'-tRNA processing endoribonuclease activity(GO:0042781) |
| 0.1 | 1.3 | GO:0005247 | voltage-gated chloride channel activity(GO:0005247) |
| 0.0 | 18.3 | GO:0008022 | protein C-terminus binding(GO:0008022) |
| 0.0 | 0.4 | GO:0035368 | selenocysteine insertion sequence binding(GO:0035368) |
| 0.0 | 1.2 | GO:0031432 | titin binding(GO:0031432) |
| 0.0 | 1.3 | GO:0005212 | structural constituent of eye lens(GO:0005212) |
| 0.0 | 2.2 | GO:0043027 | cysteine-type endopeptidase inhibitor activity involved in apoptotic process(GO:0043027) |
| 0.0 | 0.4 | GO:0030274 | LIM domain binding(GO:0030274) |
| 0.0 | 0.2 | GO:0004743 | pyruvate kinase activity(GO:0004743) |
| 0.0 | 0.3 | GO:0001594 | trace-amine receptor activity(GO:0001594) |
| 0.0 | 1.7 | GO:0030676 | Rac guanyl-nucleotide exchange factor activity(GO:0030676) |
| 0.0 | 1.0 | GO:0001965 | G-protein alpha-subunit binding(GO:0001965) |
| 0.0 | 2.6 | GO:0001102 | RNA polymerase II activating transcription factor binding(GO:0001102) |
| 0.0 | 0.6 | GO:0070410 | co-SMAD binding(GO:0070410) |
| 0.0 | 1.6 | GO:0004003 | ATP-dependent DNA helicase activity(GO:0004003) |
| 0.0 | 0.7 | GO:0048156 | tau protein binding(GO:0048156) |
| 0.0 | 2.7 | GO:0008138 | protein tyrosine/serine/threonine phosphatase activity(GO:0008138) |
| 0.0 | 0.9 | GO:0017075 | syntaxin-1 binding(GO:0017075) |
| 0.0 | 24.4 | GO:0003779 | actin binding(GO:0003779) |
| 0.0 | 1.0 | GO:0004012 | phospholipid-translocating ATPase activity(GO:0004012) |
| 0.0 | 0.7 | GO:0004535 | poly(A)-specific ribonuclease activity(GO:0004535) |
| 0.0 | 0.3 | GO:0004340 | glucokinase activity(GO:0004340) hexokinase activity(GO:0004396) fructokinase activity(GO:0008865) mannokinase activity(GO:0019158) |
| 0.0 | 0.1 | GO:0001601 | peptide YY receptor activity(GO:0001601) |
| 0.0 | 0.4 | GO:0008020 | G-protein coupled photoreceptor activity(GO:0008020) |
| 0.0 | 0.4 | GO:0022851 | GABA-gated chloride ion channel activity(GO:0022851) |
| 0.0 | 13.5 | GO:0001077 | transcriptional activator activity, RNA polymerase II core promoter proximal region sequence-specific binding(GO:0001077) |
| 0.0 | 1.1 | GO:0031624 | ubiquitin conjugating enzyme binding(GO:0031624) |
| 0.0 | 0.5 | GO:0005132 | type I interferon receptor binding(GO:0005132) |
| 0.0 | 1.7 | GO:0031491 | nucleosome binding(GO:0031491) |
| 0.0 | 1.6 | GO:0001786 | phosphatidylserine binding(GO:0001786) |
| 0.0 | 0.7 | GO:0070182 | DNA polymerase binding(GO:0070182) |
| 0.0 | 0.2 | GO:0019763 | immunoglobulin receptor activity(GO:0019763) IgE binding(GO:0019863) |
| 0.0 | 0.3 | GO:0005161 | platelet-derived growth factor receptor binding(GO:0005161) |
| 0.0 | 0.5 | GO:0017160 | Ral GTPase binding(GO:0017160) |
| 0.0 | 1.0 | GO:0004520 | endodeoxyribonuclease activity(GO:0004520) |
| 0.0 | 1.2 | GO:0008137 | NADH dehydrogenase (ubiquinone) activity(GO:0008137) NADH dehydrogenase (quinone) activity(GO:0050136) |
| 0.0 | 0.5 | GO:0000980 | RNA polymerase II distal enhancer sequence-specific DNA binding(GO:0000980) |
| 0.0 | 1.0 | GO:0000978 | RNA polymerase II core promoter proximal region sequence-specific DNA binding(GO:0000978) |
| 0.0 | 0.4 | GO:1990841 | promoter-specific chromatin binding(GO:1990841) |
| 0.0 | 0.2 | GO:0036312 | phosphatidylinositol 3-kinase regulatory subunit binding(GO:0036312) |
| 0.0 | 1.7 | GO:0005201 | extracellular matrix structural constituent(GO:0005201) |
| 0.0 | 5.2 | GO:0001227 | transcriptional repressor activity, RNA polymerase II transcription regulatory region sequence-specific binding(GO:0001227) |
| 0.0 | 0.2 | GO:0086007 | voltage-gated calcium channel activity involved in cardiac muscle cell action potential(GO:0086007) |
| 0.0 | 0.1 | GO:0001591 | dopamine neurotransmitter receptor activity, coupled via Gi/Go(GO:0001591) |
| 0.0 | 0.3 | GO:0034450 | ubiquitin-ubiquitin ligase activity(GO:0034450) |
| 0.0 | 1.8 | GO:0005089 | Rho guanyl-nucleotide exchange factor activity(GO:0005089) |
| 0.0 | 0.9 | GO:0008094 | DNA-dependent ATPase activity(GO:0008094) |
| 0.0 | 0.1 | GO:0016286 | small conductance calcium-activated potassium channel activity(GO:0016286) |
| 0.0 | 0.6 | GO:0004879 | RNA polymerase II transcription factor activity, ligand-activated sequence-specific DNA binding(GO:0004879) transcription factor activity, direct ligand regulated sequence-specific DNA binding(GO:0098531) |
| 0.0 | 0.5 | GO:0005385 | zinc ion transmembrane transporter activity(GO:0005385) |
| 0.0 | 0.8 | GO:0017112 | Rab guanyl-nucleotide exchange factor activity(GO:0017112) |
| 0.0 | 0.0 | GO:0017159 | pantetheine hydrolase activity(GO:0017159) |
| 0.0 | 0.1 | GO:0008568 | microtubule-severing ATPase activity(GO:0008568) |
Gene overrepresentation in curated gene sets: canonical pathways category:
| Log-likelihood per target | Total log-likelihood | Term | Description |
|---|---|---|---|
| 0.2 | 4.1 | PID VEGF VEGFR PATHWAY | VEGF and VEGFR signaling network |
| 0.2 | 11.5 | PID MAPK TRK PATHWAY | Trk receptor signaling mediated by the MAPK pathway |
| 0.1 | 1.8 | ST PAC1 RECEPTOR PATHWAY | PAC1 Receptor Pathway |
| 0.1 | 12.0 | PID HNF3A PATHWAY | FOXA1 transcription factor network |
| 0.1 | 7.1 | PID IL3 PATHWAY | IL3-mediated signaling events |
| 0.1 | 2.8 | PID CERAMIDE PATHWAY | Ceramide signaling pathway |
| 0.1 | 5.9 | PID FOXM1 PATHWAY | FOXM1 transcription factor network |
| 0.1 | 7.7 | PID CD8 TCR DOWNSTREAM PATHWAY | Downstream signaling in naïve CD8+ T cells |
| 0.1 | 8.9 | PID CASPASE PATHWAY | Caspase cascade in apoptosis |
| 0.1 | 2.0 | PID FCER1 PATHWAY | Fc-epsilon receptor I signaling in mast cells |
| 0.1 | 0.6 | PID LYMPH ANGIOGENESIS PATHWAY | VEGFR3 signaling in lymphatic endothelium |
| 0.1 | 17.5 | NABA ECM GLYCOPROTEINS | Genes encoding structural ECM glycoproteins |
| 0.1 | 1.7 | PID ARF6 DOWNSTREAM PATHWAY | Arf6 downstream pathway |
| 0.1 | 2.9 | PID IL6 7 PATHWAY | IL6-mediated signaling events |
| 0.0 | 0.9 | SA B CELL RECEPTOR COMPLEXES | Antigen binding to B cell receptors activates protein tyrosine kinases, such as the Src family, which ultimate activate MAP kinases. |
| 0.0 | 1.3 | PID SMAD2 3PATHWAY | Regulation of cytoplasmic and nuclear SMAD2/3 signaling |
| 0.0 | 1.4 | PID HDAC CLASSIII PATHWAY | Signaling events mediated by HDAC Class III |
| 0.0 | 1.8 | NABA COLLAGENS | Genes encoding collagen proteins |
| 0.0 | 2.7 | PID AR PATHWAY | Coregulation of Androgen receptor activity |
| 0.0 | 1.0 | PID RHODOPSIN PATHWAY | Visual signal transduction: Rods |
| 0.0 | 0.4 | PID CONE PATHWAY | Visual signal transduction: Cones |
| 0.0 | 0.5 | PID CIRCADIAN PATHWAY | Circadian rhythm pathway |
| 0.0 | 1.5 | PID DELTA NP63 PATHWAY | Validated transcriptional targets of deltaNp63 isoforms |
| 0.0 | 0.9 | ST WNT BETA CATENIN PATHWAY | Wnt/beta-catenin Pathway |
| 0.0 | 1.7 | PID E2F PATHWAY | E2F transcription factor network |
| 0.0 | 0.2 | PID THROMBIN PAR4 PATHWAY | PAR4-mediated thrombin signaling events |
| 0.0 | 1.4 | WNT SIGNALING | Genes related to Wnt-mediated signal transduction |
| 0.0 | 1.0 | PID PLK1 PATHWAY | PLK1 signaling events |
| 0.0 | 0.2 | PID BARD1 PATHWAY | BARD1 signaling events |
| 0.0 | 0.7 | PID HEDGEHOG GLI PATHWAY | Hedgehog signaling events mediated by Gli proteins |
Gene overrepresentation in curated gene sets: REACTOME pathways category:
| Log-likelihood per target | Total log-likelihood | Term | Description |
|---|---|---|---|
| 0.5 | 16.0 | REACTOME DCC MEDIATED ATTRACTIVE SIGNALING | Genes involved in DCC mediated attractive signaling |
| 0.4 | 11.6 | REACTOME CYTOSOLIC SULFONATION OF SMALL MOLECULES | Genes involved in Cytosolic sulfonation of small molecules |
| 0.3 | 5.1 | REACTOME SEMA3A PLEXIN REPULSION SIGNALING BY INHIBITING INTEGRIN ADHESION | Genes involved in SEMA3A-Plexin repulsion signaling by inhibiting Integrin adhesion |
| 0.2 | 6.4 | REACTOME PROTEOLYTIC CLEAVAGE OF SNARE COMPLEX PROTEINS | Genes involved in Proteolytic cleavage of SNARE complex proteins |
| 0.2 | 10.2 | REACTOME ERK MAPK TARGETS | Genes involved in ERK/MAPK targets |
| 0.2 | 6.4 | REACTOME HORMONE SENSITIVE LIPASE HSL MEDIATED TRIACYLGLYCEROL HYDROLYSIS | Genes involved in Hormone-sensitive lipase (HSL)-mediated triacylglycerol hydrolysis |
| 0.2 | 3.0 | REACTOME G2 M DNA DAMAGE CHECKPOINT | Genes involved in G2/M DNA damage checkpoint |
| 0.2 | 4.0 | REACTOME INTRINSIC PATHWAY | Genes involved in Intrinsic Pathway |
| 0.2 | 6.0 | REACTOME CHONDROITIN SULFATE BIOSYNTHESIS | Genes involved in Chondroitin sulfate biosynthesis |
| 0.1 | 4.1 | REACTOME BRANCHED CHAIN AMINO ACID CATABOLISM | Genes involved in Branched-chain amino acid catabolism |
| 0.1 | 2.4 | REACTOME ALPHA LINOLENIC ACID ALA METABOLISM | Genes involved in alpha-linolenic acid (ALA) metabolism |
| 0.1 | 3.1 | REACTOME RNA POL III CHAIN ELONGATION | Genes involved in RNA Polymerase III Chain Elongation |
| 0.1 | 2.3 | REACTOME CHYLOMICRON MEDIATED LIPID TRANSPORT | Genes involved in Chylomicron-mediated lipid transport |
| 0.1 | 1.6 | REACTOME SIGNALLING TO P38 VIA RIT AND RIN | Genes involved in Signalling to p38 via RIT and RIN |
| 0.1 | 1.6 | REACTOME SIGNALING BY HIPPO | Genes involved in Signaling by Hippo |
| 0.1 | 7.4 | REACTOME APOPTOTIC CLEAVAGE OF CELLULAR PROTEINS | Genes involved in Apoptotic cleavage of cellular proteins |
| 0.1 | 4.6 | REACTOME ACTIVATION OF CHAPERONE GENES BY XBP1S | Genes involved in Activation of Chaperone Genes by XBP1(S) |
| 0.1 | 1.7 | REACTOME DEPOSITION OF NEW CENPA CONTAINING NUCLEOSOMES AT THE CENTROMERE | Genes involved in Deposition of New CENPA-containing Nucleosomes at the Centromere |
| 0.1 | 2.3 | REACTOME CHOLESTEROL BIOSYNTHESIS | Genes involved in Cholesterol biosynthesis |
| 0.1 | 2.7 | REACTOME SIGNALING BY ROBO RECEPTOR | Genes involved in Signaling by Robo receptor |
| 0.1 | 1.9 | REACTOME RAS ACTIVATION UOPN CA2 INFUX THROUGH NMDA RECEPTOR | Genes involved in Ras activation uopn Ca2+ infux through NMDA receptor |
| 0.1 | 4.8 | REACTOME NRAGE SIGNALS DEATH THROUGH JNK | Genes involved in NRAGE signals death through JNK |
| 0.1 | 3.7 | REACTOME CHEMOKINE RECEPTORS BIND CHEMOKINES | Genes involved in Chemokine receptors bind chemokines |
| 0.0 | 2.9 | REACTOME G1 PHASE | Genes involved in G1 Phase |
| 0.0 | 2.3 | REACTOME MYOGENESIS | Genes involved in Myogenesis |
| 0.0 | 1.3 | REACTOME REGULATION OF GLUCOKINASE BY GLUCOKINASE REGULATORY PROTEIN | Genes involved in Regulation of Glucokinase by Glucokinase Regulatory Protein |
| 0.0 | 0.7 | REACTOME SIGNALING BY CONSTITUTIVELY ACTIVE EGFR | Genes involved in Signaling by constitutively active EGFR |
| 0.0 | 0.4 | REACTOME OPSINS | Genes involved in Opsins |
| 0.0 | 1.1 | REACTOME SMAD2 SMAD3 SMAD4 HETEROTRIMER REGULATES TRANSCRIPTION | Genes involved in SMAD2/SMAD3:SMAD4 heterotrimer regulates transcription |
| 0.0 | 0.5 | REACTOME G0 AND EARLY G1 | Genes involved in G0 and Early G1 |
| 0.0 | 0.4 | REACTOME SIGNAL REGULATORY PROTEIN SIRP FAMILY INTERACTIONS | Genes involved in Signal regulatory protein (SIRP) family interactions |
| 0.0 | 0.5 | REACTOME ZINC TRANSPORTERS | Genes involved in Zinc transporters |
| 0.0 | 0.5 | REACTOME ANTIGEN ACTIVATES B CELL RECEPTOR LEADING TO GENERATION OF SECOND MESSENGERS | Genes involved in Antigen Activates B Cell Receptor Leading to Generation of Second Messengers |
| 0.0 | 0.4 | REACTOME SYNTHESIS SECRETION AND DEACYLATION OF GHRELIN | Genes involved in Synthesis, Secretion, and Deacylation of Ghrelin |
| 0.0 | 0.3 | REACTOME AMINE LIGAND BINDING RECEPTORS | Genes involved in Amine ligand-binding receptors |
| 0.0 | 0.5 | REACTOME INSULIN SYNTHESIS AND PROCESSING | Genes involved in Insulin Synthesis and Processing |
| 0.0 | 0.5 | REACTOME ADHERENS JUNCTIONS INTERACTIONS | Genes involved in Adherens junctions interactions |
| 0.0 | 0.2 | REACTOME REGULATION OF INSULIN SECRETION BY ACETYLCHOLINE | Genes involved in Regulation of Insulin Secretion by Acetylcholine |
| 0.0 | 0.5 | REACTOME RESOLUTION OF AP SITES VIA THE MULTIPLE NUCLEOTIDE PATCH REPLACEMENT PATHWAY | Genes involved in Resolution of AP sites via the multiple-nucleotide patch replacement pathway |
| 0.0 | 0.4 | REACTOME CITRIC ACID CYCLE TCA CYCLE | Genes involved in Citric acid cycle (TCA cycle) |
| 0.0 | 1.2 | REACTOME RESPIRATORY ELECTRON TRANSPORT | Genes involved in Respiratory electron transport |
| 0.0 | 0.3 | REACTOME DOPAMINE NEUROTRANSMITTER RELEASE CYCLE | Genes involved in Dopamine Neurotransmitter Release Cycle |
| 0.0 | 0.6 | REACTOME SIGNAL TRANSDUCTION BY L1 | Genes involved in Signal transduction by L1 |
| 0.0 | 0.4 | REACTOME RORA ACTIVATES CIRCADIAN EXPRESSION | Genes involved in RORA Activates Circadian Expression |
| 0.0 | 0.3 | REACTOME HS GAG DEGRADATION | Genes involved in HS-GAG degradation |
| 0.0 | 0.9 | REACTOME CELL SURFACE INTERACTIONS AT THE VASCULAR WALL | Genes involved in Cell surface interactions at the vascular wall |
| 0.0 | 0.4 | REACTOME DEGRADATION OF THE EXTRACELLULAR MATRIX | Genes involved in Degradation of the extracellular matrix |
| 0.0 | 0.5 | REACTOME G ALPHA Z SIGNALLING EVENTS | Genes involved in G alpha (z) signalling events |
| 0.0 | 0.2 | REACTOME FANCONI ANEMIA PATHWAY | Genes involved in Fanconi Anemia pathway |
| 0.0 | 0.2 | REACTOME GAP JUNCTION ASSEMBLY | Genes involved in Gap junction assembly |
| 0.0 | 0.3 | REACTOME G ALPHA1213 SIGNALLING EVENTS | Genes involved in G alpha (12/13) signalling events |