Project
Inflammatory response time course, HUVEC (Wada, 2009)
Navigation
Downloads
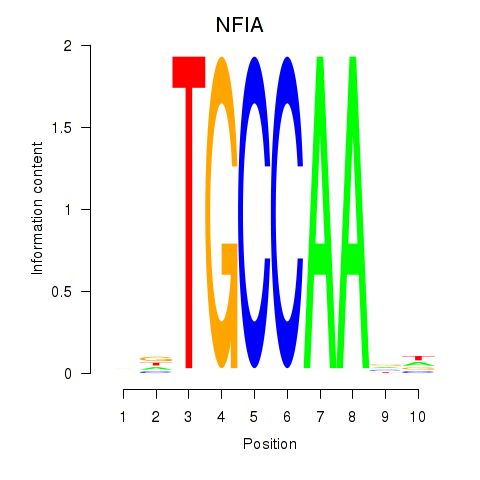
Results for NFIA
Z-value: 0.67
Motif logo
Transcription factors associated with NFIA
| Gene Symbol | Gene ID | Gene Info |
|---|---|---|
|
NFIA
|
ENSG00000162599.17 | NFIA |
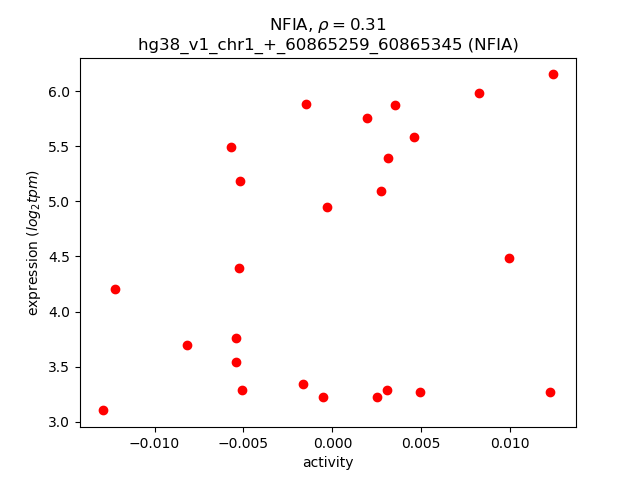
Activity-expression correlation:
| Gene | Promoter | Pearson corr. coef. | P-value | Plot |
|---|---|---|---|---|
| NFIA | hg38_v1_chr1_+_60865259_60865345 | 0.31 | 1.3e-01 | Click! |
Activity profile of NFIA motif
Sorted Z-values of NFIA motif
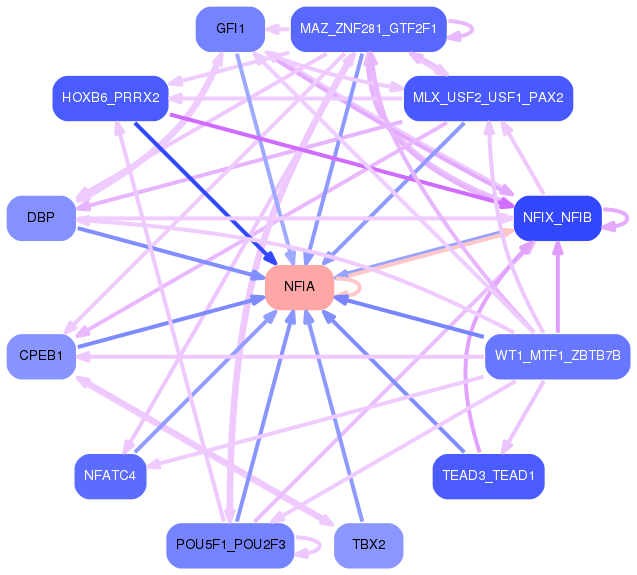
Network of associatons between targets according to the STRING database.

First level regulatory network of NFIA
| Promoter | Score | Transcript | Gene | Gene Info |
|---|---|---|---|---|
| chr13_+_30906263 | 1.20 |
ENST00000380482.9
|
MEDAG
|
mesenteric estrogen dependent adipogenesis |
| chr7_-_27143672 | 1.04 |
ENST00000222726.4
|
HOXA5
|
homeobox A5 |
| chr7_+_1055285 | 1.04 |
ENST00000397095.2
|
GPR146
|
G protein-coupled receptor 146 |
| chr7_-_41703062 | 1.04 |
ENST00000242208.5
|
INHBA
|
inhibin subunit beta A |
| chr9_-_90642855 | 0.87 |
ENST00000637905.1
|
DIRAS2
|
DIRAS family GTPase 2 |
| chr4_-_156970903 | 0.80 |
ENST00000422544.2
|
PDGFC
|
platelet derived growth factor C |
| chr7_+_80134794 | 0.75 |
ENST00000649796.2
|
GNAI1
|
G protein subunit alpha i1 |
| chr3_-_15797930 | 0.74 |
ENST00000683139.1
|
ANKRD28
|
ankyrin repeat domain 28 |
| chr4_+_41360759 | 0.69 |
ENST00000508501.5
ENST00000512946.5 ENST00000313860.11 ENST00000512632.5 ENST00000512820.5 |
LIMCH1
|
LIM and calponin homology domains 1 |
| chr12_+_82686889 | 0.68 |
ENST00000321196.8
|
TMTC2
|
transmembrane O-mannosyltransferase targeting cadherins 2 |
| chr12_+_93572664 | 0.65 |
ENST00000551556.2
|
SOCS2
|
suppressor of cytokine signaling 2 |
| chr8_-_28386417 | 0.65 |
ENST00000521185.5
ENST00000520290.5 ENST00000344423.10 |
ZNF395
|
zinc finger protein 395 |
| chr3_+_16174628 | 0.64 |
ENST00000339732.10
|
GALNT15
|
polypeptide N-acetylgalactosaminyltransferase 15 |
| chr10_-_6062290 | 0.62 |
ENST00000256876.10
ENST00000379954.5 |
IL2RA
|
interleukin 2 receptor subunit alpha |
| chr3_-_169146595 | 0.62 |
ENST00000468789.5
|
MECOM
|
MDS1 and EVI1 complex locus |
| chr5_-_88785493 | 0.60 |
ENST00000503554.4
|
MEF2C
|
myocyte enhancer factor 2C |
| chr9_-_14307928 | 0.60 |
ENST00000637640.1
ENST00000493697.1 ENST00000636057.1 |
NFIB
|
nuclear factor I B |
| chr15_-_52652031 | 0.58 |
ENST00000546305.6
|
FAM214A
|
family with sequence similarity 214 member A |
| chr4_+_30720348 | 0.55 |
ENST00000361762.3
|
PCDH7
|
protocadherin 7 |
| chr12_+_93574965 | 0.55 |
ENST00000551883.1
ENST00000549510.1 |
SOCS2
|
suppressor of cytokine signaling 2 |
| chr12_+_93571832 | 0.54 |
ENST00000549887.1
|
SOCS2
|
suppressor of cytokine signaling 2 |
| chr6_+_156776020 | 0.54 |
ENST00000346085.10
|
ARID1B
|
AT-rich interaction domain 1B |
| chr6_+_31706866 | 0.53 |
ENST00000375832.5
ENST00000503322.1 |
LY6G6F
LY6G6F-LY6G6D
|
lymphocyte antigen 6 family member G6F LY6G6F-LY6G6D readthrough |
| chr9_-_96302104 | 0.52 |
ENST00000375262.4
ENST00000650386.1 |
HSD17B3
|
hydroxysteroid 17-beta dehydrogenase 3 |
| chr19_-_1822038 | 0.52 |
ENST00000643515.1
|
REXO1
|
RNA exonuclease 1 homolog |
| chr9_-_96302142 | 0.52 |
ENST00000648799.1
|
HSD17B3
|
hydroxysteroid 17-beta dehydrogenase 3 |
| chr3_-_15798184 | 0.51 |
ENST00000624145.3
|
ANKRD28
|
ankyrin repeat domain 28 |
| chr18_+_44697118 | 0.51 |
ENST00000677077.1
|
SETBP1
|
SET binding protein 1 |
| chr3_+_152300135 | 0.50 |
ENST00000465907.6
ENST00000492948.5 ENST00000485509.5 ENST00000464596.5 |
MBNL1
|
muscleblind like splicing regulator 1 |
| chr3_-_171460063 | 0.50 |
ENST00000284483.12
ENST00000475336.5 ENST00000357327.9 ENST00000460047.5 ENST00000488470.5 ENST00000470834.5 |
TNIK
|
TRAF2 and NCK interacting kinase |
| chr19_-_40690553 | 0.48 |
ENST00000598779.5
|
NUMBL
|
NUMB like endocytic adaptor protein |
| chr20_-_47356721 | 0.47 |
ENST00000262975.8
ENST00000446994.6 ENST00000355972.8 ENST00000396281.8 ENST00000619049.4 ENST00000611941.4 ENST00000372023.7 |
ZMYND8
|
zinc finger MYND-type containing 8 |
| chr20_-_47356670 | 0.46 |
ENST00000540497.5
ENST00000461685.5 ENST00000617418.4 ENST00000435836.5 ENST00000471951.6 ENST00000352431.6 ENST00000360911.7 ENST00000458360.6 |
ZMYND8
|
zinc finger MYND-type containing 8 |
| chr20_+_43945677 | 0.46 |
ENST00000358131.5
|
TOX2
|
TOX high mobility group box family member 2 |
| chr1_+_61081728 | 0.46 |
ENST00000371189.8
|
NFIA
|
nuclear factor I A |
| chr7_-_78489900 | 0.44 |
ENST00000636039.1
|
MAGI2
|
membrane associated guanylate kinase, WW and PDZ domain containing 2 |
| chr3_+_148791058 | 0.44 |
ENST00000491148.5
|
CPB1
|
carboxypeptidase B1 |
| chr7_-_21945866 | 0.43 |
ENST00000356195.9
ENST00000447180.5 ENST00000373934.4 ENST00000406877.8 ENST00000457951.5 |
CDCA7L
|
cell division cycle associated 7 like |
| chr11_-_118264282 | 0.43 |
ENST00000278937.7
|
MPZL2
|
myelin protein zero like 2 |
| chr4_-_100517991 | 0.42 |
ENST00000511970.5
ENST00000502569.1 ENST00000305864.7 ENST00000296420.9 |
EMCN
|
endomucin |
| chr12_+_93570969 | 0.42 |
ENST00000536696.6
|
SOCS2
|
suppressor of cytokine signaling 2 |
| chr7_+_17298642 | 0.41 |
ENST00000242057.9
|
AHR
|
aryl hydrocarbon receptor |
| chr14_+_91114667 | 0.40 |
ENST00000523894.5
ENST00000522322.5 ENST00000523771.5 |
DGLUCY
|
D-glutamate cyclase |
| chr2_+_33476640 | 0.40 |
ENST00000425210.5
ENST00000444784.5 ENST00000423159.5 ENST00000403687.8 |
RASGRP3
|
RAS guanyl releasing protein 3 |
| chrX_-_120559889 | 0.39 |
ENST00000371323.3
|
CUL4B
|
cullin 4B |
| chr6_-_75363003 | 0.39 |
ENST00000370020.1
|
FILIP1
|
filamin A interacting protein 1 |
| chr3_+_50269140 | 0.39 |
ENST00000616701.5
ENST00000433753.4 ENST00000611067.4 |
SEMA3B
|
semaphorin 3B |
| chr3_-_138132381 | 0.39 |
ENST00000236709.4
|
A4GNT
|
alpha-1,4-N-acetylglucosaminyltransferase |
| chr11_-_35525603 | 0.38 |
ENST00000529303.1
ENST00000619888.5 ENST00000622144.4 |
PAMR1
|
peptidase domain containing associated with muscle regeneration 1 |
| chr7_-_27140195 | 0.37 |
ENST00000522788.5
ENST00000317201.7 |
HOXA3
|
homeobox A3 |
| chrX_-_136780925 | 0.37 |
ENST00000250617.7
|
ARHGEF6
|
Rac/Cdc42 guanine nucleotide exchange factor 6 |
| chr7_-_151633182 | 0.37 |
ENST00000476632.2
|
PRKAG2
|
protein kinase AMP-activated non-catalytic subunit gamma 2 |
| chr14_+_22495890 | 0.37 |
ENST00000390494.1
|
TRAJ43
|
T cell receptor alpha joining 43 |
| chr12_-_52553139 | 0.36 |
ENST00000267119.6
|
KRT71
|
keratin 71 |
| chrX_-_71255060 | 0.36 |
ENST00000373988.5
ENST00000373998.5 |
ZMYM3
|
zinc finger MYM-type containing 3 |
| chr2_-_191013955 | 0.36 |
ENST00000409465.5
|
STAT1
|
signal transducer and activator of transcription 1 |
| chr2_-_110534010 | 0.35 |
ENST00000437167.1
|
RGPD6
|
RANBP2 like and GRIP domain containing 6 |
| chr9_-_14300231 | 0.35 |
ENST00000636735.1
|
NFIB
|
nuclear factor I B |
| chr8_-_134510182 | 0.35 |
ENST00000521673.5
|
ZFAT
|
zinc finger and AT-hook domain containing |
| chr9_-_123184233 | 0.35 |
ENST00000447404.6
|
STRBP
|
spermatid perinuclear RNA binding protein |
| chr12_+_82358496 | 0.35 |
ENST00000248306.8
ENST00000548200.5 |
METTL25
|
methyltransferase like 25 |
| chr14_+_96256194 | 0.35 |
ENST00000216629.11
ENST00000553356.1 |
BDKRB1
|
bradykinin receptor B1 |
| chr21_-_26843063 | 0.35 |
ENST00000678221.1
|
ADAMTS1
|
ADAM metallopeptidase with thrombospondin type 1 motif 1 |
| chr5_+_136059151 | 0.34 |
ENST00000503087.1
|
TGFBI
|
transforming growth factor beta induced |
| chr19_-_14062028 | 0.34 |
ENST00000669674.2
|
PALM3
|
paralemmin 3 |
| chr21_-_26843012 | 0.34 |
ENST00000517777.6
|
ADAMTS1
|
ADAM metallopeptidase with thrombospondin type 1 motif 1 |
| chr10_+_119819244 | 0.34 |
ENST00000637174.1
|
INPP5F
|
inositol polyphosphate-5-phosphatase F |
| chr18_-_48950960 | 0.34 |
ENST00000262158.8
|
SMAD7
|
SMAD family member 7 |
| chr22_-_19881163 | 0.34 |
ENST00000485358.5
|
TXNRD2
|
thioredoxin reductase 2 |
| chr8_-_70403786 | 0.34 |
ENST00000452400.7
|
NCOA2
|
nuclear receptor coactivator 2 |
| chr2_-_40512361 | 0.33 |
ENST00000403092.5
|
SLC8A1
|
solute carrier family 8 member A1 |
| chr22_-_19881369 | 0.33 |
ENST00000462330.5
|
TXNRD2
|
thioredoxin reductase 2 |
| chr1_-_113887375 | 0.32 |
ENST00000471267.1
ENST00000393320.3 |
BCL2L15
|
BCL2 like 15 |
| chr4_+_85778681 | 0.32 |
ENST00000395183.6
|
ARHGAP24
|
Rho GTPase activating protein 24 |
| chr3_+_25428233 | 0.31 |
ENST00000437042.6
ENST00000330688.9 |
RARB
|
retinoic acid receptor beta |
| chr17_-_1829818 | 0.31 |
ENST00000305513.12
|
SMYD4
|
SET and MYND domain containing 4 |
| chr1_-_41484680 | 0.30 |
ENST00000372587.5
|
EDN2
|
endothelin 2 |
| chr5_+_75511756 | 0.30 |
ENST00000241436.8
|
POLK
|
DNA polymerase kappa |
| chr2_+_135531460 | 0.30 |
ENST00000683871.1
ENST00000409478.5 ENST00000264160.8 ENST00000438014.5 |
R3HDM1
|
R3H domain containing 1 |
| chr8_-_78805306 | 0.30 |
ENST00000639719.1
ENST00000263851.9 |
IL7
|
interleukin 7 |
| chr12_+_8843236 | 0.30 |
ENST00000541459.5
|
A2ML1
|
alpha-2-macroglobulin like 1 |
| chr9_-_81689536 | 0.29 |
ENST00000376499.8
|
TLE1
|
TLE family member 1, transcriptional corepressor |
| chrX_-_10576901 | 0.29 |
ENST00000380779.5
|
MID1
|
midline 1 |
| chr6_-_41941728 | 0.29 |
ENST00000414200.6
|
CCND3
|
cyclin D3 |
| chr8_-_17002327 | 0.29 |
ENST00000180166.6
|
FGF20
|
fibroblast growth factor 20 |
| chr17_-_69060906 | 0.29 |
ENST00000495634.5
ENST00000453985.6 ENST00000340001.9 ENST00000585714.1 |
ABCA9
|
ATP binding cassette subfamily A member 9 |
| chr1_+_168280872 | 0.29 |
ENST00000367821.8
|
TBX19
|
T-box transcription factor 19 |
| chr5_+_123512214 | 0.28 |
ENST00000511130.6
ENST00000512718.7 |
CSNK1G3
|
casein kinase 1 gamma 3 |
| chr1_-_243163310 | 0.28 |
ENST00000492145.1
ENST00000490813.5 ENST00000464936.5 |
CEP170
|
centrosomal protein 170 |
| chr9_+_470291 | 0.28 |
ENST00000382303.5
|
KANK1
|
KN motif and ankyrin repeat domains 1 |
| chr2_+_209771814 | 0.27 |
ENST00000673951.1
ENST00000673920.1 |
UNC80
|
unc-80 homolog, NALCN channel complex subunit |
| chr10_+_97319250 | 0.27 |
ENST00000371021.5
|
FRAT1
|
FRAT regulator of WNT signaling pathway 1 |
| chr5_+_112737847 | 0.27 |
ENST00000257430.9
ENST00000508376.6 |
APC
|
APC regulator of WNT signaling pathway |
| chr6_-_111483190 | 0.26 |
ENST00000368802.8
|
REV3L
|
REV3 like, DNA directed polymerase zeta catalytic subunit |
| chr2_-_180007254 | 0.26 |
ENST00000410053.8
|
CWC22
|
CWC22 spliceosome associated protein homolog |
| chr3_+_101779182 | 0.26 |
ENST00000495842.5
ENST00000273347.10 |
NXPE3
|
neurexophilin and PC-esterase domain family member 3 |
| chr5_-_56116946 | 0.26 |
ENST00000434982.2
|
ANKRD55
|
ankyrin repeat domain 55 |
| chrX_+_28587411 | 0.26 |
ENST00000378993.6
|
IL1RAPL1
|
interleukin 1 receptor accessory protein like 1 |
| chr11_-_84317296 | 0.26 |
ENST00000280241.12
ENST00000398301.6 |
DLG2
|
discs large MAGUK scaffold protein 2 |
| chr8_-_42501224 | 0.26 |
ENST00000520262.6
ENST00000517366.1 |
SLC20A2
|
solute carrier family 20 member 2 |
| chr4_+_85475167 | 0.25 |
ENST00000503995.5
|
ARHGAP24
|
Rho GTPase activating protein 24 |
| chrX_+_136169833 | 0.25 |
ENST00000628032.2
|
FHL1
|
four and a half LIM domains 1 |
| chr21_-_26170654 | 0.25 |
ENST00000439274.6
ENST00000358918.7 ENST00000354192.7 ENST00000348990.9 ENST00000346798.8 ENST00000357903.7 |
APP
|
amyloid beta precursor protein |
| chr7_-_8262668 | 0.25 |
ENST00000446305.1
|
ICA1
|
islet cell autoantigen 1 |
| chr19_-_39934626 | 0.25 |
ENST00000616721.6
|
FCGBP
|
Fc fragment of IgG binding protein |
| chr6_-_41941507 | 0.25 |
ENST00000372987.8
|
CCND3
|
cyclin D3 |
| chrX_+_136169664 | 0.25 |
ENST00000456445.5
|
FHL1
|
four and a half LIM domains 1 |
| chr6_-_32816910 | 0.24 |
ENST00000447394.1
ENST00000438763.7 |
HLA-DOB
|
major histocompatibility complex, class II, DO beta |
| chr8_-_78805515 | 0.24 |
ENST00000379113.6
ENST00000541183.2 |
IL7
|
interleukin 7 |
| chr16_-_66549839 | 0.24 |
ENST00000527800.6
ENST00000677555.1 ENST00000563369.6 |
TK2
|
thymidine kinase 2 |
| chr1_+_213989691 | 0.24 |
ENST00000607425.1
|
PROX1
|
prospero homeobox 1 |
| chr11_-_106077313 | 0.24 |
ENST00000531837.2
ENST00000534815.1 |
KBTBD3
|
kelch repeat and BTB domain containing 3 |
| chrX_-_18354672 | 0.24 |
ENST00000251900.9
|
SCML2
|
Scm polycomb group protein like 2 |
| chr4_+_78776340 | 0.24 |
ENST00000502613.3
ENST00000502871.5 |
BMP2K
|
BMP2 inducible kinase |
| chr7_+_94908230 | 0.24 |
ENST00000433881.5
|
PPP1R9A
|
protein phosphatase 1 regulatory subunit 9A |
| chr12_-_95116967 | 0.24 |
ENST00000551521.5
|
FGD6
|
FYVE, RhoGEF and PH domain containing 6 |
| chr1_+_15659869 | 0.24 |
ENST00000345034.1
|
RSC1A1
|
regulator of solute carriers 1 |
| chr5_+_54455661 | 0.23 |
ENST00000302005.3
|
HSPB3
|
heat shock protein family B (small) member 3 |
| chr2_-_40512423 | 0.23 |
ENST00000402441.5
ENST00000448531.1 |
SLC8A1
|
solute carrier family 8 member A1 |
| chr6_+_156777366 | 0.23 |
ENST00000636930.2
|
ARID1B
|
AT-rich interaction domain 1B |
| chr5_+_36606355 | 0.23 |
ENST00000681909.1
ENST00000513903.5 ENST00000681795.1 ENST00000680125.1 ENST00000612708.5 ENST00000680232.1 ENST00000681776.1 ENST00000681926.1 ENST00000679958.1 ENST00000265113.9 ENST00000504121.5 ENST00000512374.1 ENST00000613445.5 ENST00000679983.1 |
SLC1A3
|
solute carrier family 1 member 3 |
| chr1_+_173714908 | 0.23 |
ENST00000209884.5
|
KLHL20
|
kelch like family member 20 |
| chr4_+_85475131 | 0.23 |
ENST00000395184.6
|
ARHGAP24
|
Rho GTPase activating protein 24 |
| chr5_-_75511596 | 0.23 |
ENST00000643158.1
ENST00000261415.12 ENST00000646713.1 ENST00000643773.1 ENST00000645866.1 ENST00000644072.2 ENST00000643780.2 ENST00000645483.1 ENST00000642556.1 ENST00000646511.1 |
CERT1
|
ceramide transporter 1 |
| chr21_+_6111123 | 0.23 |
ENST00000613488.3
|
SIK1B
|
salt inducible kinase 1B (putative) |
| chr16_-_66550091 | 0.23 |
ENST00000564917.5
ENST00000677420.1 |
TK2
|
thymidine kinase 2 |
| chr16_-_66550005 | 0.23 |
ENST00000527284.6
|
TK2
|
thymidine kinase 2 |
| chr5_-_65481907 | 0.22 |
ENST00000381055.8
|
ADAMTS6
|
ADAM metallopeptidase with thrombospondin type 1 motif 6 |
| chr21_-_43427131 | 0.22 |
ENST00000270162.8
|
SIK1
|
salt inducible kinase 1 |
| chrX_+_131083706 | 0.22 |
ENST00000370921.1
|
ARHGAP36
|
Rho GTPase activating protein 36 |
| chr5_-_56233287 | 0.22 |
ENST00000513241.2
ENST00000341048.9 |
ANKRD55
|
ankyrin repeat domain 55 |
| chr20_+_31819348 | 0.22 |
ENST00000375985.5
|
MYLK2
|
myosin light chain kinase 2 |
| chr11_+_54706832 | 0.22 |
ENST00000319760.8
|
OR4A5
|
olfactory receptor family 4 subfamily A member 5 |
| chr20_+_31819302 | 0.22 |
ENST00000375994.6
|
MYLK2
|
myosin light chain kinase 2 |
| chr11_-_58575846 | 0.22 |
ENST00000395074.7
|
LPXN
|
leupaxin |
| chr15_+_36702009 | 0.22 |
ENST00000562489.1
|
CDIN1
|
CDAN1 interacting nuclease 1 |
| chr12_+_55931148 | 0.21 |
ENST00000549629.5
ENST00000555218.5 ENST00000331886.10 |
DGKA
|
diacylglycerol kinase alpha |
| chr18_-_55422306 | 0.21 |
ENST00000566777.5
ENST00000626584.2 |
TCF4
|
transcription factor 4 |
| chr5_+_148268830 | 0.21 |
ENST00000511106.5
|
SPINK13
|
serine peptidase inhibitor Kazal type 13 |
| chr16_-_67416420 | 0.21 |
ENST00000348579.6
ENST00000565726.3 |
ZDHHC1
|
zinc finger DHHC-type containing 1 |
| chr16_-_49664225 | 0.21 |
ENST00000535559.5
|
ZNF423
|
zinc finger protein 423 |
| chr9_+_27109200 | 0.21 |
ENST00000380036.10
|
TEK
|
TEK receptor tyrosine kinase |
| chr9_-_127122623 | 0.21 |
ENST00000373417.1
ENST00000373425.8 |
ANGPTL2
|
angiopoietin like 2 |
| chr3_-_114624921 | 0.21 |
ENST00000393785.6
|
ZBTB20
|
zinc finger and BTB domain containing 20 |
| chr16_-_3577375 | 0.21 |
ENST00000359128.10
|
NLRC3
|
NLR family CARD domain containing 3 |
| chr10_+_72893734 | 0.21 |
ENST00000334011.10
|
OIT3
|
oncoprotein induced transcript 3 |
| chr9_+_27109135 | 0.21 |
ENST00000519097.5
ENST00000615002.4 |
TEK
|
TEK receptor tyrosine kinase |
| chr9_+_128504655 | 0.20 |
ENST00000683748.1
ENST00000684314.1 ENST00000684331.1 ENST00000684646.1 ENST00000309971.9 ENST00000684139.1 ENST00000372770.4 |
GLE1
|
GLE1 RNA export mediator |
| chr13_+_35476740 | 0.20 |
ENST00000537702.5
|
NBEA
|
neurobeachin |
| chr9_-_96302170 | 0.20 |
ENST00000375263.8
|
HSD17B3
|
hydroxysteroid 17-beta dehydrogenase 3 |
| chr1_+_28438104 | 0.20 |
ENST00000633167.1
ENST00000373836.4 |
PHACTR4
|
phosphatase and actin regulator 4 |
| chr3_+_152299570 | 0.20 |
ENST00000485910.5
ENST00000463374.5 |
MBNL1
|
muscleblind like splicing regulator 1 |
| chr10_-_99235783 | 0.20 |
ENST00000370546.5
ENST00000614306.1 |
HPSE2
|
heparanase 2 (inactive) |
| chr12_-_11022620 | 0.20 |
ENST00000390673.2
|
TAS2R19
|
taste 2 receptor member 19 |
| chr10_-_6062349 | 0.20 |
ENST00000379959.8
|
IL2RA
|
interleukin 2 receptor subunit alpha |
| chr4_+_128809791 | 0.20 |
ENST00000452328.6
ENST00000504089.5 |
JADE1
|
jade family PHD finger 1 |
| chr6_-_106629472 | 0.19 |
ENST00000369063.8
|
RTN4IP1
|
reticulon 4 interacting protein 1 |
| chr5_-_111758061 | 0.19 |
ENST00000509979.5
ENST00000513100.5 ENST00000508161.5 ENST00000455559.6 |
NREP
|
neuronal regeneration related protein |
| chrX_+_22032301 | 0.19 |
ENST00000379374.5
|
PHEX
|
phosphate regulating endopeptidase homolog X-linked |
| chr7_-_56092932 | 0.19 |
ENST00000446428.5
ENST00000432123.5 ENST00000297373.7 |
PHKG1
|
phosphorylase kinase catalytic subunit gamma 1 |
| chr5_-_150086511 | 0.19 |
ENST00000675795.1
|
CSF1R
|
colony stimulating factor 1 receptor |
| chr6_-_24719146 | 0.19 |
ENST00000378119.9
|
C6orf62
|
chromosome 6 open reading frame 62 |
| chr13_+_53028806 | 0.19 |
ENST00000219022.3
|
OLFM4
|
olfactomedin 4 |
| chr5_+_93584916 | 0.19 |
ENST00000647447.1
ENST00000615873.1 |
NR2F1
|
nuclear receptor subfamily 2 group F member 1 |
| chr7_-_56092974 | 0.19 |
ENST00000452681.6
ENST00000537360.5 |
PHKG1
|
phosphorylase kinase catalytic subunit gamma 1 |
| chrX_-_106903331 | 0.19 |
ENST00000411805.1
ENST00000276173.5 |
RIPPLY1
|
ripply transcriptional repressor 1 |
| chr3_+_32695535 | 0.19 |
ENST00000454516.7
|
CNOT10
|
CCR4-NOT transcription complex subunit 10 |
| chr5_+_108924585 | 0.18 |
ENST00000618353.1
|
FER
|
FER tyrosine kinase |
| chr4_+_186227501 | 0.18 |
ENST00000446598.6
ENST00000264690.11 ENST00000513864.2 |
KLKB1
|
kallikrein B1 |
| chr9_-_122905340 | 0.18 |
ENST00000423239.6
ENST00000357244.7 |
RC3H2
|
ring finger and CCCH-type domains 2 |
| chr7_+_27242796 | 0.18 |
ENST00000496902.7
|
EVX1
|
even-skipped homeobox 1 |
| chr16_-_66550142 | 0.18 |
ENST00000417693.8
ENST00000299697.12 ENST00000451102.7 |
TK2
|
thymidine kinase 2 |
| chr12_+_121626493 | 0.18 |
ENST00000617316.2
|
ORAI1
|
ORAI calcium release-activated calcium modulator 1 |
| chrX_-_136767322 | 0.18 |
ENST00000370620.5
|
ARHGEF6
|
Rac/Cdc42 guanine nucleotide exchange factor 6 |
| chr1_-_201112451 | 0.18 |
ENST00000367338.7
|
CACNA1S
|
calcium voltage-gated channel subunit alpha1 S |
| chr19_-_19515542 | 0.18 |
ENST00000585580.4
|
TSSK6
|
testis specific serine kinase 6 |
| chr1_+_153728042 | 0.18 |
ENST00000318967.7
ENST00000435409.6 |
INTS3
|
integrator complex subunit 3 |
| chrX_+_136169891 | 0.18 |
ENST00000449474.5
|
FHL1
|
four and a half LIM domains 1 |
| chr10_+_119818699 | 0.18 |
ENST00000650409.1
|
INPP5F
|
inositol polyphosphate-5-phosphatase F |
| chr8_-_17895487 | 0.17 |
ENST00000427924.5
ENST00000381841.4 |
FGL1
|
fibrinogen like 1 |
| chr12_-_70609788 | 0.17 |
ENST00000547715.1
ENST00000538708.5 ENST00000550857.5 ENST00000261266.9 |
PTPRB
|
protein tyrosine phosphatase receptor type B |
| chr1_-_201112420 | 0.17 |
ENST00000362061.4
ENST00000681874.1 |
CACNA1S
|
calcium voltage-gated channel subunit alpha1 S |
| chr11_+_118359572 | 0.17 |
ENST00000252108.8
ENST00000431736.6 |
UBE4A
|
ubiquitination factor E4A |
| chrX_+_106611930 | 0.17 |
ENST00000372544.6
ENST00000372548.9 |
RADX
|
RPA1 related single stranded DNA binding protein, X-linked |
| chr4_-_21697755 | 0.17 |
ENST00000382148.7
|
KCNIP4
|
potassium voltage-gated channel interacting protein 4 |
| chr4_-_6070162 | 0.17 |
ENST00000636216.1
ENST00000637373.2 |
ENSG00000284684.1
JAKMIP1
|
novel protein janus kinase and microtubule interacting protein 1 |
| chr14_-_63728027 | 0.17 |
ENST00000247225.7
|
SGPP1
|
sphingosine-1-phosphate phosphatase 1 |
| chr5_+_162067764 | 0.17 |
ENST00000639213.2
ENST00000414552.6 |
GABRG2
|
gamma-aminobutyric acid type A receptor subunit gamma2 |
| chrX_+_136169624 | 0.16 |
ENST00000394153.6
|
FHL1
|
four and a half LIM domains 1 |
| chr2_-_210171402 | 0.16 |
ENST00000281772.14
|
KANSL1L
|
KAT8 regulatory NSL complex subunit 1 like |
| chr5_-_75511213 | 0.16 |
ENST00000644445.1
ENST00000646302.1 ENST00000644912.1 ENST00000642809.1 ENST00000644377.1 |
CERT1
|
ceramide transporter 1 |
| chr17_-_74361860 | 0.16 |
ENST00000375366.4
|
BTBD17
|
BTB domain containing 17 |
| chr5_-_149550284 | 0.16 |
ENST00000504676.5
ENST00000515435.5 |
CSNK1A1
|
casein kinase 1 alpha 1 |
| chr1_-_151008365 | 0.16 |
ENST00000361936.9
ENST00000361738.11 |
MINDY1
|
MINDY lysine 48 deubiquitinase 1 |
| chr1_-_175743529 | 0.16 |
ENST00000367674.7
ENST00000263525.6 |
TNR
|
tenascin R |
| chr1_+_22636577 | 0.16 |
ENST00000374642.8
ENST00000438241.1 |
C1QA
|
complement C1q A chain |
| chr5_+_43603163 | 0.16 |
ENST00000660752.1
ENST00000654405.1 ENST00000344920.9 ENST00000657172.1 ENST00000512996.6 ENST00000671668.1 |
NNT
|
nicotinamide nucleotide transhydrogenase |
| chr16_-_11273610 | 0.16 |
ENST00000327157.4
|
PRM3
|
protamine 3 |
| chrX_+_70423301 | 0.16 |
ENST00000374382.4
|
GDPD2
|
glycerophosphodiester phosphodiesterase domain containing 2 |
| chrX_+_70423031 | 0.16 |
ENST00000453994.6
ENST00000538649.5 ENST00000536730.5 |
GDPD2
|
glycerophosphodiester phosphodiesterase domain containing 2 |
Gene Ontology Analysis
Gene overrepresentation in biological process category:
| Log-likelihood per target | Total log-likelihood | Term | Description |
|---|---|---|---|
| 0.3 | 1.0 | GO:0060279 | positive regulation of ovulation(GO:0060279) |
| 0.3 | 0.8 | GO:0060435 | bronchiole development(GO:0060435) |
| 0.2 | 0.9 | GO:1903758 | regulation of transcription from RNA polymerase II promoter by histone modification(GO:1903756) negative regulation of transcription from RNA polymerase II promoter by histone modification(GO:1903758) |
| 0.2 | 0.8 | GO:0046013 | regulation of T cell homeostatic proliferation(GO:0046013) |
| 0.1 | 0.9 | GO:0046092 | deoxycytidine metabolic process(GO:0046092) |
| 0.1 | 1.4 | GO:0061370 | testosterone biosynthetic process(GO:0061370) |
| 0.1 | 0.5 | GO:0031161 | phosphatidylinositol catabolic process(GO:0031161) |
| 0.1 | 0.4 | GO:0072308 | negative regulation by virus of viral protein levels in host cell(GO:0046725) negative regulation of metanephric nephron tubule epithelial cell differentiation(GO:0072308) |
| 0.1 | 0.3 | GO:0021849 | neuroblast division in subventricular zone(GO:0021849) |
| 0.1 | 0.3 | GO:1904017 | cellular response to Thyroglobulin triiodothyronine(GO:1904017) |
| 0.1 | 0.3 | GO:0003099 | positive regulation of the force of heart contraction by chemical signal(GO:0003099) |
| 0.1 | 2.2 | GO:0040015 | negative regulation of multicellular organism growth(GO:0040015) |
| 0.1 | 0.8 | GO:0097026 | dendritic cell dendrite assembly(GO:0097026) |
| 0.1 | 0.3 | GO:0021913 | regulation of transcription from RNA polymerase II promoter involved in ventral spinal cord interneuron specification(GO:0021913) |
| 0.1 | 0.6 | GO:0038016 | insulin receptor internalization(GO:0038016) |
| 0.1 | 1.0 | GO:2000795 | negative regulation of epithelial cell proliferation involved in lung morphogenesis(GO:2000795) |
| 0.1 | 0.2 | GO:0002581 | negative regulation of antigen processing and presentation of peptide or polysaccharide antigen via MHC class II(GO:0002581) |
| 0.1 | 0.2 | GO:2000979 | hepatocyte cell migration(GO:0002194) otic placode formation(GO:0043049) branching involved in pancreas morphogenesis(GO:0061114) acinar cell differentiation(GO:0090425) positive regulation of forebrain neuron differentiation(GO:2000979) |
| 0.1 | 0.2 | GO:1904049 | negative regulation of spontaneous neurotransmitter secretion(GO:1904049) |
| 0.1 | 0.6 | GO:0003185 | primary heart field specification(GO:0003138) sinoatrial valve development(GO:0003172) sinoatrial valve morphogenesis(GO:0003185) |
| 0.1 | 0.1 | GO:0003150 | muscular septum morphogenesis(GO:0003150) |
| 0.1 | 1.0 | GO:0071313 | cellular response to caffeine(GO:0071313) |
| 0.1 | 0.3 | GO:2000393 | negative regulation of lamellipodium morphogenesis(GO:2000393) |
| 0.1 | 0.2 | GO:0061386 | closure of optic fissure(GO:0061386) negative regulation of integrin-mediated signaling pathway(GO:2001045) |
| 0.1 | 0.4 | GO:0032971 | regulation of muscle filament sliding(GO:0032971) |
| 0.1 | 0.2 | GO:1904383 | response to sodium phosphate(GO:1904383) |
| 0.1 | 0.1 | GO:0090214 | spongiotrophoblast layer developmental growth(GO:0090214) |
| 0.1 | 0.3 | GO:0006740 | NADPH regeneration(GO:0006740) |
| 0.1 | 0.6 | GO:0007256 | activation of JNKK activity(GO:0007256) |
| 0.1 | 0.8 | GO:1904321 | response to forskolin(GO:1904321) cellular response to forskolin(GO:1904322) |
| 0.1 | 0.4 | GO:0010159 | specification of organ position(GO:0010159) glossopharyngeal nerve morphogenesis(GO:0021615) |
| 0.1 | 0.4 | GO:0048014 | Tie signaling pathway(GO:0048014) |
| 0.1 | 0.5 | GO:0098907 | protein localization to T-tubule(GO:0036371) regulation of SA node cell action potential(GO:0098907) |
| 0.1 | 0.2 | GO:0036292 | DNA rewinding(GO:0036292) |
| 0.0 | 0.1 | GO:0060957 | endocardial cell fate commitment(GO:0060957) endocardial cushion cell fate commitment(GO:0061445) |
| 0.0 | 0.3 | GO:1904338 | regulation of dopaminergic neuron differentiation(GO:1904338) |
| 0.0 | 0.1 | GO:0014016 | neuroblast differentiation(GO:0014016) |
| 0.0 | 0.2 | GO:0050904 | response to stem cell factor(GO:0036215) cellular response to stem cell factor stimulus(GO:0036216) Kit signaling pathway(GO:0038109) diapedesis(GO:0050904) |
| 0.0 | 0.2 | GO:0051919 | activation of plasma proteins involved in acute inflammatory response(GO:0002541) positive regulation of fibrinolysis(GO:0051919) |
| 0.0 | 0.1 | GO:0005989 | lactose metabolic process(GO:0005988) lactose biosynthetic process(GO:0005989) |
| 0.0 | 0.2 | GO:0010868 | negative regulation of triglyceride biosynthetic process(GO:0010868) |
| 0.0 | 0.3 | GO:0060373 | regulation of ventricular cardiac muscle cell membrane depolarization(GO:0060373) |
| 0.0 | 0.2 | GO:0014005 | microglia differentiation(GO:0014004) microglia development(GO:0014005) collateral sprouting in absence of injury(GO:0048669) smooth endoplasmic reticulum calcium ion homeostasis(GO:0051563) response to norepinephrine(GO:0071873) cellular response to norepinephrine stimulus(GO:0071874) |
| 0.0 | 0.4 | GO:1904885 | beta-catenin destruction complex assembly(GO:1904885) |
| 0.0 | 0.2 | GO:0048686 | regulation of sprouting of injured axon(GO:0048686) regulation of axon extension involved in regeneration(GO:0048690) |
| 0.0 | 0.2 | GO:0032474 | otolith morphogenesis(GO:0032474) |
| 0.0 | 0.4 | GO:0003402 | planar cell polarity pathway involved in axis elongation(GO:0003402) |
| 0.0 | 0.2 | GO:1900226 | negative regulation of NLRP3 inflammasome complex assembly(GO:1900226) |
| 0.0 | 0.1 | GO:0001080 | nitrogen catabolite regulation of transcription from RNA polymerase II promoter(GO:0001079) nitrogen catabolite activation of transcription from RNA polymerase II promoter(GO:0001080) regulation of urea metabolic process(GO:0034255) intracellular bile acid receptor signaling pathway(GO:0038185) interleukin-17 secretion(GO:0072615) nitrogen catabolite regulation of transcription(GO:0090293) nitrogen catabolite activation of transcription(GO:0090294) regulation of nitrogen cycle metabolic process(GO:1903314) positive regulation of glutamate metabolic process(GO:2000213) regulation of ammonia assimilation cycle(GO:2001248) positive regulation of ammonia assimilation cycle(GO:2001250) |
| 0.0 | 0.3 | GO:0008063 | Toll signaling pathway(GO:0008063) |
| 0.0 | 0.1 | GO:0003032 | detection of oxygen(GO:0003032) |
| 0.0 | 0.2 | GO:0006668 | sphinganine-1-phosphate metabolic process(GO:0006668) |
| 0.0 | 0.3 | GO:0003360 | brainstem development(GO:0003360) |
| 0.0 | 0.1 | GO:0006272 | leading strand elongation(GO:0006272) |
| 0.0 | 0.1 | GO:0043375 | negative regulation of cellular pH reduction(GO:0032848) CD8-positive, alpha-beta T cell lineage commitment(GO:0043375) negative regulation of retinal cell programmed cell death(GO:0046671) |
| 0.0 | 0.1 | GO:0072233 | thick ascending limb development(GO:0072023) metanephric thick ascending limb development(GO:0072233) |
| 0.0 | 0.7 | GO:0060347 | heart trabecula formation(GO:0060347) |
| 0.0 | 0.2 | GO:0018343 | protein farnesylation(GO:0018343) |
| 0.0 | 0.3 | GO:0006537 | glutamate biosynthetic process(GO:0006537) gamma-aminobutyric acid biosynthetic process(GO:0009449) |
| 0.0 | 0.1 | GO:0098935 | dendritic transport(GO:0098935) anterograde dendritic transport(GO:0098937) |
| 0.0 | 0.2 | GO:0001661 | conditioned taste aversion(GO:0001661) |
| 0.0 | 0.2 | GO:0050859 | negative regulation of B cell receptor signaling pathway(GO:0050859) |
| 0.0 | 0.3 | GO:1902572 | negative regulation of serine-type endopeptidase activity(GO:1900004) negative regulation of serine-type peptidase activity(GO:1902572) |
| 0.0 | 0.3 | GO:0097105 | presynaptic membrane assembly(GO:0097105) |
| 0.0 | 0.1 | GO:0018032 | protein amidation(GO:0018032) |
| 0.0 | 0.1 | GO:0030327 | prenylated protein catabolic process(GO:0030327) |
| 0.0 | 0.1 | GO:0019477 | L-lysine catabolic process to acetyl-CoA(GO:0019474) L-lysine catabolic process(GO:0019477) L-lysine metabolic process(GO:0046440) |
| 0.0 | 0.2 | GO:0072402 | response to cell cycle checkpoint signaling(GO:0072396) response to DNA integrity checkpoint signaling(GO:0072402) response to DNA damage checkpoint signaling(GO:0072423) |
| 0.0 | 0.2 | GO:0006154 | adenosine catabolic process(GO:0006154) inosine biosynthetic process(GO:0046103) |
| 0.0 | 0.1 | GO:0045356 | positive regulation of interferon-alpha biosynthetic process(GO:0045356) |
| 0.0 | 0.6 | GO:0007171 | activation of transmembrane receptor protein tyrosine kinase activity(GO:0007171) |
| 0.0 | 0.7 | GO:0042276 | error-prone translesion synthesis(GO:0042276) |
| 0.0 | 0.3 | GO:0043983 | histone H4-K12 acetylation(GO:0043983) |
| 0.0 | 0.2 | GO:0044341 | sodium-dependent phosphate transport(GO:0044341) |
| 0.0 | 0.5 | GO:0072189 | ureter development(GO:0072189) |
| 0.0 | 0.2 | GO:0003406 | retinal pigment epithelium development(GO:0003406) |
| 0.0 | 0.3 | GO:0035372 | protein localization to microtubule(GO:0035372) |
| 0.0 | 0.4 | GO:0071420 | cellular response to histamine(GO:0071420) |
| 0.0 | 0.4 | GO:0070914 | UV-damage excision repair(GO:0070914) |
| 0.0 | 0.2 | GO:0032525 | somite rostral/caudal axis specification(GO:0032525) |
| 0.0 | 0.1 | GO:0002933 | lipid hydroxylation(GO:0002933) |
| 0.0 | 0.1 | GO:0032483 | regulation of Rab protein signal transduction(GO:0032483) |
| 0.0 | 0.1 | GO:0006106 | fumarate metabolic process(GO:0006106) aspartate biosynthetic process(GO:0006532) aspartate catabolic process(GO:0006533) |
| 0.0 | 0.2 | GO:0045217 | cell-cell junction maintenance(GO:0045217) |
| 0.0 | 0.1 | GO:0035965 | cardiolipin acyl-chain remodeling(GO:0035965) |
| 0.0 | 0.2 | GO:0097396 | response to interleukin-17(GO:0097396) cellular response to interleukin-17(GO:0097398) |
| 0.0 | 0.6 | GO:0071425 | hematopoietic stem cell proliferation(GO:0071425) |
| 0.0 | 0.1 | GO:0051684 | maintenance of Golgi location(GO:0051684) |
| 0.0 | 0.1 | GO:1904217 | regulation of CDP-diacylglycerol-serine O-phosphatidyltransferase activity(GO:1904217) positive regulation of CDP-diacylglycerol-serine O-phosphatidyltransferase activity(GO:1904219) positive regulation of serine C-palmitoyltransferase activity(GO:1904222) |
| 0.0 | 0.2 | GO:0006449 | regulation of translational termination(GO:0006449) |
| 0.0 | 0.1 | GO:0032417 | positive regulation of sodium:proton antiporter activity(GO:0032417) |
| 0.0 | 0.3 | GO:0060712 | spongiotrophoblast layer development(GO:0060712) |
| 0.0 | 0.1 | GO:0006549 | isoleucine metabolic process(GO:0006549) |
| 0.0 | 0.0 | GO:0010607 | negative regulation of cytoplasmic mRNA processing body assembly(GO:0010607) |
| 0.0 | 0.3 | GO:0006853 | carnitine shuttle(GO:0006853) |
| 0.0 | 0.2 | GO:2000645 | negative regulation of receptor catabolic process(GO:2000645) |
| 0.0 | 0.3 | GO:0090527 | actin filament reorganization(GO:0090527) |
| 0.0 | 0.2 | GO:0035092 | sperm chromatin condensation(GO:0035092) |
| 0.0 | 0.0 | GO:1904844 | response to L-glutamine(GO:1904844) cellular response to L-glutamine(GO:1904845) |
| 0.0 | 0.7 | GO:0032728 | positive regulation of interferon-beta production(GO:0032728) |
| 0.0 | 0.1 | GO:0043587 | tongue morphogenesis(GO:0043587) |
| 0.0 | 0.1 | GO:0016259 | selenocysteine metabolic process(GO:0016259) |
| 0.0 | 0.1 | GO:0046532 | regulation of photoreceptor cell differentiation(GO:0046532) |
| 0.0 | 0.1 | GO:0050882 | voluntary musculoskeletal movement(GO:0050882) |
| 0.0 | 0.0 | GO:0050883 | musculoskeletal movement, spinal reflex action(GO:0050883) |
| 0.0 | 0.9 | GO:0030888 | regulation of B cell proliferation(GO:0030888) |
| 0.0 | 0.5 | GO:0045737 | positive regulation of cyclin-dependent protein serine/threonine kinase activity(GO:0045737) |
| 0.0 | 0.0 | GO:0006556 | S-adenosylmethionine biosynthetic process(GO:0006556) |
| 0.0 | 0.1 | GO:0006651 | diacylglycerol biosynthetic process(GO:0006651) |
| 0.0 | 0.1 | GO:0021603 | cranial nerve formation(GO:0021603) embryonic neurocranium morphogenesis(GO:0048702) semicircular canal morphogenesis(GO:0048752) |
| 0.0 | 1.1 | GO:0048208 | vesicle targeting, rough ER to cis-Golgi(GO:0048207) COPII vesicle coating(GO:0048208) |
| 0.0 | 0.2 | GO:0061635 | regulation of protein complex stability(GO:0061635) |
| 0.0 | 0.1 | GO:0072502 | cellular phosphate ion homeostasis(GO:0030643) cellular trivalent inorganic anion homeostasis(GO:0072502) |
| 0.0 | 0.0 | GO:0009631 | cold acclimation(GO:0009631) |
| 0.0 | 0.0 | GO:0097021 | lymphocyte migration into lymphoid organs(GO:0097021) |
| 0.0 | 0.0 | GO:1905150 | regulation of voltage-gated sodium channel activity(GO:1905150) |
| 0.0 | 0.3 | GO:1904886 | beta-catenin destruction complex disassembly(GO:1904886) |
| 0.0 | 0.1 | GO:2000389 | regulation of neutrophil extravasation(GO:2000389) |
| 0.0 | 0.1 | GO:0044245 | polysaccharide digestion(GO:0044245) |
| 0.0 | 0.3 | GO:2000811 | negative regulation of anoikis(GO:2000811) |
| 0.0 | 0.7 | GO:0000305 | response to oxygen radical(GO:0000305) |
| 0.0 | 0.1 | GO:0009804 | coumarin metabolic process(GO:0009804) |
| 0.0 | 0.4 | GO:0009251 | polysaccharide catabolic process(GO:0000272) glycogen catabolic process(GO:0005980) glucan catabolic process(GO:0009251) cellular polysaccharide catabolic process(GO:0044247) |
| 0.0 | 0.9 | GO:0043268 | positive regulation of potassium ion transport(GO:0043268) |
| 0.0 | 0.0 | GO:1903565 | negative regulation of protein localization to cilium(GO:1903565) regulation of protein localization to ciliary membrane(GO:1903567) negative regulation of protein localization to ciliary membrane(GO:1903568) |
Gene overrepresentation in cellular component category:
| Log-likelihood per target | Total log-likelihood | Term | Description |
|---|---|---|---|
| 0.3 | 1.0 | GO:0043511 | inhibin complex(GO:0043511) inhibin A complex(GO:0043512) |
| 0.1 | 0.4 | GO:0034753 | nuclear aryl hydrocarbon receptor complex(GO:0034753) |
| 0.1 | 0.3 | GO:0071006 | U2-type catalytic step 1 spliceosome(GO:0071006) |
| 0.1 | 0.3 | GO:0097059 | CNTFR-CLCF1 complex(GO:0097059) |
| 0.1 | 0.2 | GO:0070931 | Golgi-associated vesicle lumen(GO:0070931) |
| 0.1 | 0.2 | GO:0042613 | MHC class II protein complex(GO:0042613) |
| 0.1 | 0.5 | GO:1990761 | growth cone lamellipodium(GO:1990761) |
| 0.1 | 0.2 | GO:0043293 | apoptosome(GO:0043293) |
| 0.0 | 0.1 | GO:0070195 | growth hormone receptor complex(GO:0070195) |
| 0.0 | 0.2 | GO:0070876 | SOSS complex(GO:0070876) |
| 0.0 | 0.3 | GO:0016035 | zeta DNA polymerase complex(GO:0016035) |
| 0.0 | 0.2 | GO:0005602 | complement component C1 complex(GO:0005602) |
| 0.0 | 0.4 | GO:0005964 | phosphorylase kinase complex(GO:0005964) |
| 0.0 | 0.4 | GO:0031465 | Cul4B-RING E3 ubiquitin ligase complex(GO:0031465) |
| 0.0 | 0.9 | GO:0044300 | cerebellar mossy fiber(GO:0044300) |
| 0.0 | 0.2 | GO:0072534 | perineuronal net(GO:0072534) |
| 0.0 | 0.2 | GO:1990682 | CSF1-CSF1R complex(GO:1990682) |
| 0.0 | 0.4 | GO:0036057 | filtration diaphragm(GO:0036056) slit diaphragm(GO:0036057) |
| 0.0 | 0.2 | GO:0035976 | AP1 complex(GO:0035976) |
| 0.0 | 0.1 | GO:0048179 | activin receptor complex(GO:0048179) |
| 0.0 | 0.2 | GO:0044614 | nuclear pore cytoplasmic filaments(GO:0044614) |
| 0.0 | 0.1 | GO:0070939 | Dsl1p complex(GO:0070939) |
| 0.0 | 1.1 | GO:0031092 | platelet alpha granule membrane(GO:0031092) |
| 0.0 | 0.1 | GO:0070557 | PCNA-p21 complex(GO:0070557) |
| 0.0 | 0.5 | GO:0016342 | catenin complex(GO:0016342) |
| 0.0 | 0.1 | GO:0036156 | inner dynein arm(GO:0036156) |
| 0.0 | 1.6 | GO:0043198 | dendritic shaft(GO:0043198) |
| 0.0 | 0.4 | GO:0032045 | guanyl-nucleotide exchange factor complex(GO:0032045) |
| 0.0 | 0.2 | GO:0071986 | Ragulator complex(GO:0071986) |
| 0.0 | 0.1 | GO:0030121 | AP-1 adaptor complex(GO:0030121) |
| 0.0 | 0.8 | GO:0016514 | SWI/SNF complex(GO:0016514) |
| 0.0 | 0.4 | GO:0031588 | nucleotide-activated protein kinase complex(GO:0031588) |
| 0.0 | 0.1 | GO:1990578 | perinuclear endoplasmic reticulum membrane(GO:1990578) |
| 0.0 | 0.3 | GO:1990454 | L-type voltage-gated calcium channel complex(GO:1990454) |
| 0.0 | 0.1 | GO:0097149 | centralspindlin complex(GO:0097149) |
| 0.0 | 0.1 | GO:0005955 | calcineurin complex(GO:0005955) |
| 0.0 | 0.2 | GO:0005833 | hemoglobin complex(GO:0005833) |
| 0.0 | 0.1 | GO:0036020 | endolysosome membrane(GO:0036020) |
| 0.0 | 1.2 | GO:0045334 | clathrin-coated endocytic vesicle(GO:0045334) |
| 0.0 | 0.1 | GO:0031673 | H zone(GO:0031673) |
| 0.0 | 0.4 | GO:1902711 | GABA-A receptor complex(GO:1902711) |
| 0.0 | 0.9 | GO:0010494 | cytoplasmic stress granule(GO:0010494) |
Gene overrepresentation in molecular function category:
| Log-likelihood per target | Total log-likelihood | Term | Description |
|---|---|---|---|
| 0.3 | 2.2 | GO:0008269 | JAK pathway signal transduction adaptor activity(GO:0008269) |
| 0.2 | 0.8 | GO:0019976 | interleukin-2 receptor activity(GO:0004911) interleukin-2 binding(GO:0019976) |
| 0.2 | 0.8 | GO:0001069 | regulatory region RNA binding(GO:0001069) |
| 0.2 | 1.4 | GO:0047045 | testosterone 17-beta-dehydrogenase (NADP+) activity(GO:0047045) |
| 0.2 | 1.5 | GO:0070699 | type II activin receptor binding(GO:0070699) |
| 0.1 | 0.4 | GO:0004874 | aryl hydrocarbon receptor activity(GO:0004874) |
| 0.1 | 0.9 | GO:0004797 | deoxycytidine kinase activity(GO:0004137) thymidine kinase activity(GO:0004797) |
| 0.1 | 0.3 | GO:0008746 | NAD(P)+ transhydrogenase activity(GO:0008746) oxidoreductase activity, acting on NAD(P)H, NAD(P) as acceptor(GO:0016652) |
| 0.1 | 0.6 | GO:0015235 | cobalamin transporter activity(GO:0015235) |
| 0.1 | 0.6 | GO:0099580 | ion antiporter activity involved in regulation of postsynaptic membrane potential(GO:0099580) |
| 0.1 | 0.3 | GO:0010861 | thyroid hormone receptor activator activity(GO:0010861) thyroid hormone receptor coactivator activity(GO:0030375) |
| 0.1 | 0.3 | GO:0000822 | inositol hexakisphosphate binding(GO:0000822) |
| 0.1 | 0.5 | GO:0052832 | inositol monophosphate 1-phosphatase activity(GO:0008934) inositol monophosphate 3-phosphatase activity(GO:0052832) inositol monophosphate 4-phosphatase activity(GO:0052833) inositol monophosphate phosphatase activity(GO:0052834) |
| 0.1 | 0.2 | GO:0005011 | macrophage colony-stimulating factor receptor activity(GO:0005011) |
| 0.1 | 0.3 | GO:0031708 | endothelin B receptor binding(GO:0031708) |
| 0.1 | 0.3 | GO:0015319 | sodium:inorganic phosphate symporter activity(GO:0015319) |
| 0.0 | 0.1 | GO:0030305 | heparanase activity(GO:0030305) |
| 0.0 | 0.4 | GO:0004687 | myosin light chain kinase activity(GO:0004687) |
| 0.0 | 0.2 | GO:0008798 | beta-aspartyl-peptidase activity(GO:0008798) |
| 0.0 | 0.1 | GO:0008534 | oxidized purine nucleobase lesion DNA N-glycosylase activity(GO:0008534) |
| 0.0 | 0.8 | GO:0031821 | G-protein coupled serotonin receptor binding(GO:0031821) |
| 0.0 | 0.3 | GO:0008889 | glycerophosphodiester phosphodiesterase activity(GO:0008889) |
| 0.0 | 0.1 | GO:0030337 | DNA polymerase processivity factor activity(GO:0030337) |
| 0.0 | 0.7 | GO:0004791 | thioredoxin-disulfide reductase activity(GO:0004791) |
| 0.0 | 0.4 | GO:0004689 | phosphorylase kinase activity(GO:0004689) |
| 0.0 | 0.8 | GO:0005161 | platelet-derived growth factor receptor binding(GO:0005161) |
| 0.0 | 0.1 | GO:0003990 | acetylcholinesterase activity(GO:0003990) choline binding(GO:0033265) |
| 0.0 | 0.1 | GO:1902122 | chenodeoxycholic acid binding(GO:1902122) |
| 0.0 | 0.1 | GO:0004461 | lactose synthase activity(GO:0004461) |
| 0.0 | 0.3 | GO:0004897 | ciliary neurotrophic factor receptor activity(GO:0004897) |
| 0.0 | 0.6 | GO:0003680 | AT DNA binding(GO:0003680) |
| 0.0 | 0.2 | GO:0042015 | interleukin-20 binding(GO:0042015) |
| 0.0 | 0.4 | GO:0008607 | phosphorylase kinase regulator activity(GO:0008607) |
| 0.0 | 0.6 | GO:0004653 | polypeptide N-acetylgalactosaminyltransferase activity(GO:0004653) |
| 0.0 | 0.1 | GO:1904713 | beta-catenin destruction complex binding(GO:1904713) |
| 0.0 | 0.2 | GO:0042392 | sphingosine-1-phosphate phosphatase activity(GO:0042392) |
| 0.0 | 0.2 | GO:0070004 | cysteine-type carboxypeptidase activity(GO:0016807) cysteine-type exopeptidase activity(GO:0070004) |
| 0.0 | 0.1 | GO:0016647 | oxidoreductase activity, acting on the CH-NH group of donors, oxygen as acceptor(GO:0016647) |
| 0.0 | 0.4 | GO:0008503 | benzodiazepine receptor activity(GO:0008503) |
| 0.0 | 0.2 | GO:0001225 | RNA polymerase II transcription coactivator binding(GO:0001225) |
| 0.0 | 0.4 | GO:0034713 | type I transforming growth factor beta receptor binding(GO:0034713) |
| 0.0 | 0.3 | GO:0072542 | protein phosphatase activator activity(GO:0072542) |
| 0.0 | 0.2 | GO:0050692 | DBD domain binding(GO:0050692) |
| 0.0 | 0.1 | GO:0016509 | long-chain-3-hydroxyacyl-CoA dehydrogenase activity(GO:0016509) |
| 0.0 | 0.1 | GO:0005220 | inositol 1,4,5-trisphosphate-sensitive calcium-release channel activity(GO:0005220) |
| 0.0 | 1.2 | GO:0001106 | RNA polymerase II transcription corepressor activity(GO:0001106) |
| 0.0 | 0.2 | GO:0044323 | retinoic acid-responsive element binding(GO:0044323) |
| 0.0 | 0.1 | GO:0004504 | peptidylglycine monooxygenase activity(GO:0004504) peptidylamidoglycolate lyase activity(GO:0004598) |
| 0.0 | 0.2 | GO:0051425 | PTB domain binding(GO:0051425) |
| 0.0 | 0.1 | GO:0016215 | stearoyl-CoA 9-desaturase activity(GO:0004768) acyl-CoA desaturase activity(GO:0016215) |
| 0.0 | 0.3 | GO:0015501 | glutamate:sodium symporter activity(GO:0015501) |
| 0.0 | 0.1 | GO:0016361 | activin receptor activity, type I(GO:0016361) |
| 0.0 | 0.5 | GO:0008349 | MAP kinase kinase kinase kinase activity(GO:0008349) |
| 0.0 | 0.3 | GO:0019966 | interleukin-1 binding(GO:0019966) |
| 0.0 | 0.1 | GO:0072345 | NAADP-sensitive calcium-release channel activity(GO:0072345) |
| 0.0 | 0.1 | GO:0043208 | glycosphingolipid binding(GO:0043208) |
| 0.0 | 0.1 | GO:0017159 | pantetheine hydrolase activity(GO:0017159) |
| 0.0 | 0.1 | GO:0004750 | ribulose-phosphate 3-epimerase activity(GO:0004750) |
| 0.0 | 0.1 | GO:0080130 | L-aspartate:2-oxoglutarate aminotransferase activity(GO:0004069) L-phenylalanine:2-oxoglutarate aminotransferase activity(GO:0080130) |
| 0.0 | 0.3 | GO:0003708 | retinoic acid receptor activity(GO:0003708) |
| 0.0 | 0.6 | GO:0003887 | DNA-directed DNA polymerase activity(GO:0003887) |
| 0.0 | 0.2 | GO:0035612 | AP-2 adaptor complex binding(GO:0035612) |
| 0.0 | 0.2 | GO:0015279 | store-operated calcium channel activity(GO:0015279) |
| 0.0 | 0.2 | GO:0031685 | adenosine receptor binding(GO:0031685) |
| 0.0 | 0.2 | GO:0032395 | MHC class II receptor activity(GO:0032395) |
| 0.0 | 0.1 | GO:0030368 | interleukin-17 receptor activity(GO:0030368) |
| 0.0 | 0.2 | GO:0036312 | phosphatidylinositol 3-kinase regulatory subunit binding(GO:0036312) |
| 0.0 | 0.2 | GO:0036310 | annealing helicase activity(GO:0036310) |
| 0.0 | 0.1 | GO:0030492 | hemoglobin binding(GO:0030492) |
| 0.0 | 0.1 | GO:0016934 | extracellular-glycine-gated ion channel activity(GO:0016933) extracellular-glycine-gated chloride channel activity(GO:0016934) |
| 0.0 | 0.0 | GO:0016715 | oxidoreductase activity, acting on paired donors, with incorporation or reduction of molecular oxygen, reduced ascorbate as one donor, and incorporation of one atom of oxygen(GO:0016715) |
| 0.0 | 0.2 | GO:0008140 | cAMP response element binding protein binding(GO:0008140) |
| 0.0 | 0.1 | GO:0005021 | vascular endothelial growth factor-activated receptor activity(GO:0005021) |
| 0.0 | 0.4 | GO:0004181 | metallocarboxypeptidase activity(GO:0004181) |
| 0.0 | 0.1 | GO:0003810 | protein-glutamine gamma-glutamyltransferase activity(GO:0003810) |
| 0.0 | 0.5 | GO:0008157 | protein phosphatase 1 binding(GO:0008157) |
| 0.0 | 0.3 | GO:0016712 | oxidoreductase activity, acting on paired donors, with incorporation or reduction of molecular oxygen, reduced flavin or flavoprotein as one donor, and incorporation of one atom of oxygen(GO:0016712) |
| 0.0 | 0.1 | GO:0015198 | oligopeptide transporter activity(GO:0015198) |
| 0.0 | 0.1 | GO:0016520 | growth hormone-releasing hormone receptor activity(GO:0016520) |
| 0.0 | 0.1 | GO:0048407 | platelet-derived growth factor binding(GO:0048407) |
| 0.0 | 0.1 | GO:0004427 | inorganic diphosphatase activity(GO:0004427) |
| 0.0 | 0.2 | GO:0001011 | transcription factor activity, sequence-specific DNA binding, RNA polymerase recruiting(GO:0001011) transcription factor activity, TFIIB-class binding(GO:0001087) |
Gene overrepresentation in curated gene sets: canonical pathways category:
| Log-likelihood per target | Total log-likelihood | Term | Description |
|---|---|---|---|
| 0.0 | 1.6 | PID ALK1 PATHWAY | ALK1 signaling events |
| 0.0 | 0.8 | PID S1P S1P4 PATHWAY | S1P4 pathway |
| 0.0 | 3.1 | PID IL2 1PATHWAY | IL2-mediated signaling events |
| 0.0 | 0.5 | PID IL2 STAT5 PATHWAY | IL2 signaling events mediated by STAT5 |
| 0.0 | 0.6 | PID RETINOIC ACID PATHWAY | Retinoic acid receptors-mediated signaling |
| 0.0 | 1.4 | PID HNF3A PATHWAY | FOXA1 transcription factor network |
| 0.0 | 0.0 | PID LPA4 PATHWAY | LPA4-mediated signaling events |
| 0.0 | 0.2 | SA PROGRAMMED CELL DEATH | Programmed cell death, or apoptosis, eliminates damaged or unneeded cells. |
| 0.0 | 0.9 | PID PS1 PATHWAY | Presenilin action in Notch and Wnt signaling |
| 0.0 | 0.5 | PID RAS PATHWAY | Regulation of Ras family activation |
| 0.0 | 0.1 | PID S1P S1P3 PATHWAY | S1P3 pathway |
| 0.0 | 0.6 | PID MAPK TRK PATHWAY | Trk receptor signaling mediated by the MAPK pathway |
| 0.0 | 0.0 | SIG CHEMOTAXIS | Genes related to chemotaxis |
| 0.0 | 0.1 | PID P38 MKK3 6PATHWAY | p38 MAPK signaling pathway |
Gene overrepresentation in curated gene sets: REACTOME pathways category:
| Log-likelihood per target | Total log-likelihood | Term | Description |
|---|---|---|---|
| 0.1 | 1.1 | REACTOME ANDROGEN BIOSYNTHESIS | Genes involved in Androgen biosynthesis |
| 0.1 | 1.0 | REACTOME GLYCOPROTEIN HORMONES | Genes involved in Glycoprotein hormones |
| 0.1 | 2.4 | REACTOME GROWTH HORMONE RECEPTOR SIGNALING | Genes involved in Growth hormone receptor signaling |
| 0.0 | 0.8 | REACTOME VEGF LIGAND RECEPTOR INTERACTIONS | Genes involved in VEGF ligand-receptor interactions |
| 0.0 | 0.6 | REACTOME IL 7 SIGNALING | Genes involved in Interleukin-7 signaling |
| 0.0 | 0.8 | REACTOME ADENYLATE CYCLASE INHIBITORY PATHWAY | Genes involved in Adenylate cyclase inhibitory pathway |
| 0.0 | 1.0 | REACTOME G1 S SPECIFIC TRANSCRIPTION | Genes involved in G1/S-Specific Transcription |
| 0.0 | 0.4 | REACTOME TIE2 SIGNALING | Genes involved in Tie2 Signaling |
| 0.0 | 1.0 | REACTOME RNA POL III TRANSCRIPTION TERMINATION | Genes involved in RNA Polymerase III Transcription Termination |
| 0.0 | 0.8 | REACTOME IL RECEPTOR SHC SIGNALING | Genes involved in Interleukin receptor SHC signaling |
| 0.0 | 0.8 | REACTOME PLATELET CALCIUM HOMEOSTASIS | Genes involved in Platelet calcium homeostasis |
| 0.0 | 0.6 | REACTOME CTNNB1 PHOSPHORYLATION CASCADE | Genes involved in Beta-catenin phosphorylation cascade |
| 0.0 | 0.4 | REACTOME REGULATION OF RHEB GTPASE ACTIVITY BY AMPK | Genes involved in Regulation of Rheb GTPase activity by AMPK |
| 0.0 | 0.6 | REACTOME ERK MAPK TARGETS | Genes involved in ERK/MAPK targets |
| 0.0 | 0.6 | REACTOME CELL EXTRACELLULAR MATRIX INTERACTIONS | Genes involved in Cell-extracellular matrix interactions |
| 0.0 | 0.4 | REACTOME NEPHRIN INTERACTIONS | Genes involved in Nephrin interactions |
| 0.0 | 0.3 | REACTOME SIGNALING BY FGFR3 MUTANTS | Genes involved in Signaling by FGFR3 mutants |
| 0.0 | 0.2 | REACTOME XENOBIOTICS | Genes involved in Xenobiotics |
| 0.0 | 0.2 | REACTOME THE NLRP3 INFLAMMASOME | Genes involved in The NLRP3 inflammasome |
| 0.0 | 0.2 | REACTOME ACTIVATION OF THE AP1 FAMILY OF TRANSCRIPTION FACTORS | Genes involved in Activation of the AP-1 family of transcription factors |
| 0.0 | 0.4 | REACTOME GLYCOGEN BREAKDOWN GLYCOGENOLYSIS | Genes involved in Glycogen breakdown (glycogenolysis) |
| 0.0 | 0.2 | REACTOME SIGNALING BY SCF KIT | Genes involved in Signaling by SCF-KIT |
| 0.0 | 0.2 | REACTOME CREATION OF C4 AND C2 ACTIVATORS | Genes involved in Creation of C4 and C2 activators |
| 0.0 | 0.2 | REACTOME REMOVAL OF THE FLAP INTERMEDIATE FROM THE C STRAND | Genes involved in Removal of the Flap Intermediate from the C-strand |
| 0.0 | 0.3 | REACTOME ABCA TRANSPORTERS IN LIPID HOMEOSTASIS | Genes involved in ABCA transporters in lipid homeostasis |
| 0.0 | 0.4 | REACTOME GABA A RECEPTOR ACTIVATION | Genes involved in GABA A receptor activation |
| 0.0 | 0.4 | REACTOME CIRCADIAN REPRESSION OF EXPRESSION BY REV ERBA | Genes involved in Circadian Repression of Expression by REV-ERBA |