Project
Inflammatory response time course, HUVEC (Wada, 2009)
Navigation
Downloads
Results for PBX3
Z-value: 1.61
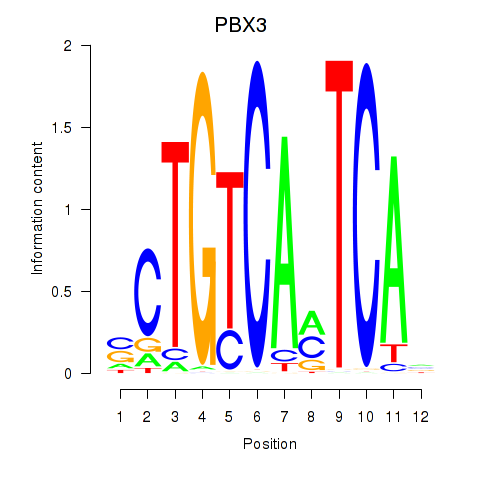
Motif logo
Transcription factors associated with PBX3
| Gene Symbol | Gene ID | Gene Info |
|---|---|---|
|
PBX3
|
ENSG00000167081.18 | PBX3 |
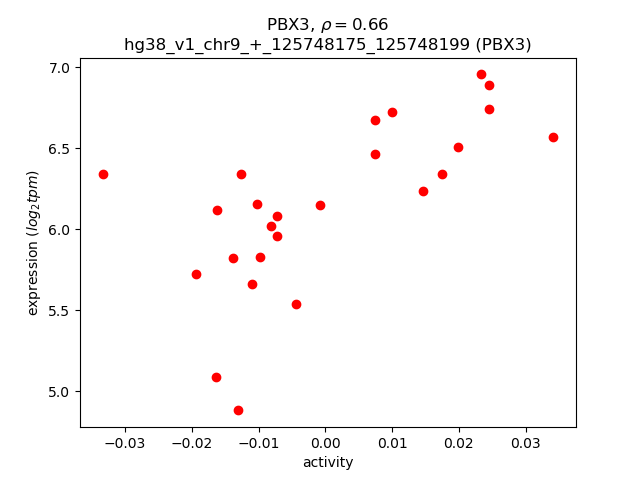
Activity-expression correlation:
| Gene | Promoter | Pearson corr. coef. | P-value | Plot |
|---|---|---|---|---|
| PBX3 | hg38_v1_chr9_+_125748175_125748199 | 0.66 | 3.0e-04 | Click! |
Activity profile of PBX3 motif
Sorted Z-values of PBX3 motif
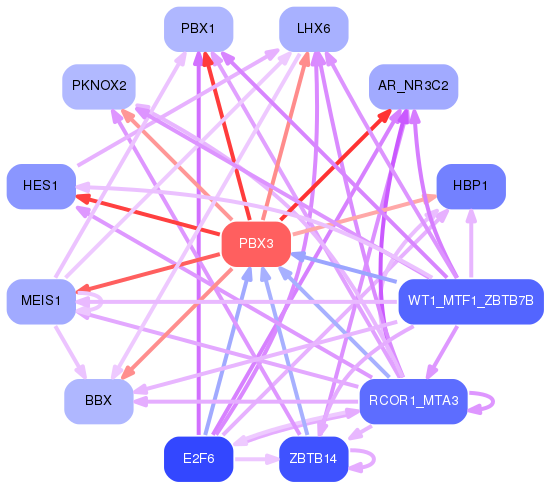
Network of associatons between targets according to the STRING database.

First level regulatory network of PBX3
Gene Ontology Analysis
Gene overrepresentation in biological process category:
| Log-likelihood per target | Total log-likelihood | Term | Description |
|---|---|---|---|
| 3.3 | 10.0 | GO:1903892 | negative regulation of ATF6-mediated unfolded protein response(GO:1903892) |
| 2.3 | 2.3 | GO:0072554 | blood vessel lumenization(GO:0072554) |
| 1.7 | 5.0 | GO:0045608 | trochlear nerve development(GO:0021558) auditory receptor cell fate determination(GO:0042668) negative regulation of auditory receptor cell differentiation(GO:0045608) negative regulation of pro-B cell differentiation(GO:2000974) |
| 1.2 | 6.1 | GO:0051892 | negative regulation of cardioblast differentiation(GO:0051892) regulation of cardiac muscle cell myoblast differentiation(GO:2000690) negative regulation of cardiac muscle cell myoblast differentiation(GO:2000691) |
| 1.0 | 3.9 | GO:0021592 | fourth ventricle development(GO:0021592) |
| 0.6 | 3.2 | GO:0043988 | histone H3-S28 phosphorylation(GO:0043988) |
| 0.6 | 5.1 | GO:1903027 | regulation of complement activation, classical pathway(GO:0030450) negative regulation of complement activation, classical pathway(GO:0045959) regulation of opsonization(GO:1903027) |
| 0.6 | 5.8 | GO:1901525 | negative regulation of macromitophagy(GO:1901525) |
| 0.6 | 1.7 | GO:0090234 | regulation of kinetochore assembly(GO:0090234) |
| 0.6 | 1.7 | GO:0006714 | sesquiterpenoid metabolic process(GO:0006714) sesquiterpenoid catabolic process(GO:0016107) farnesol metabolic process(GO:0016487) farnesol catabolic process(GO:0016488) regulation of testosterone biosynthetic process(GO:2000224) |
| 0.5 | 3.7 | GO:0060120 | auditory receptor cell fate commitment(GO:0009912) inner ear receptor cell fate commitment(GO:0060120) |
| 0.5 | 1.4 | GO:0061290 | cell-cell signaling involved in kidney development(GO:0060995) Wnt signaling pathway involved in kidney development(GO:0061289) canonical Wnt signaling pathway involved in metanephric kidney development(GO:0061290) cell-cell signaling involved in metanephros development(GO:0072204) |
| 0.4 | 1.3 | GO:0036292 | DNA rewinding(GO:0036292) |
| 0.4 | 2.1 | GO:0044565 | dendritic cell proliferation(GO:0044565) |
| 0.4 | 1.2 | GO:1903926 | signal transduction involved in intra-S DNA damage checkpoint(GO:0072428) response to bisphenol A(GO:1903925) cellular response to bisphenol A(GO:1903926) |
| 0.4 | 1.1 | GO:0060823 | canonical Wnt signaling pathway involved in neural plate anterior/posterior pattern formation(GO:0060823) |
| 0.3 | 1.4 | GO:0035513 | oxidative RNA demethylation(GO:0035513) oxidative single-stranded RNA demethylation(GO:0035553) |
| 0.3 | 3.8 | GO:0007256 | activation of JNKK activity(GO:0007256) |
| 0.3 | 0.7 | GO:0060423 | foregut regionalization(GO:0060423) lung field specification(GO:0060424) lung induction(GO:0060492) |
| 0.3 | 1.0 | GO:1902683 | regulation of receptor localization to synapse(GO:1902683) |
| 0.3 | 1.0 | GO:0022012 | subpallium cell proliferation in forebrain(GO:0022012) lateral ganglionic eminence cell proliferation(GO:0022018) lambdoid suture morphogenesis(GO:0060366) sagittal suture morphogenesis(GO:0060367) anterior semicircular canal development(GO:0060873) lateral semicircular canal development(GO:0060875) |
| 0.3 | 1.6 | GO:0006740 | NADPH regeneration(GO:0006740) |
| 0.3 | 1.0 | GO:1903674 | regulation of cap-dependent translational initiation(GO:1903674) positive regulation of cap-dependent translational initiation(GO:1903676) |
| 0.3 | 2.2 | GO:0060125 | negative regulation of growth hormone secretion(GO:0060125) |
| 0.3 | 0.9 | GO:0070895 | transposon integration(GO:0070893) regulation of transposon integration(GO:0070894) negative regulation of transposon integration(GO:0070895) |
| 0.3 | 0.9 | GO:0044805 | late nucleophagy(GO:0044805) |
| 0.3 | 3.4 | GO:0098734 | macromolecule depalmitoylation(GO:0098734) |
| 0.3 | 0.8 | GO:0052047 | interaction with other organism via secreted substance involved in symbiotic interaction(GO:0052047) |
| 0.3 | 1.7 | GO:0006574 | valine catabolic process(GO:0006574) |
| 0.3 | 0.8 | GO:0003064 | regulation of heart rate by hormone(GO:0003064) negative regulation of potassium ion export(GO:1902303) |
| 0.3 | 1.9 | GO:0060770 | negative regulation of epithelial cell proliferation involved in prostate gland development(GO:0060770) |
| 0.3 | 1.1 | GO:1902617 | response to fluoride(GO:1902617) |
| 0.3 | 7.7 | GO:0035855 | megakaryocyte development(GO:0035855) |
| 0.3 | 1.3 | GO:0071409 | cellular response to cycloheximide(GO:0071409) |
| 0.2 | 1.0 | GO:0016259 | selenocysteine metabolic process(GO:0016259) |
| 0.2 | 1.2 | GO:0035022 | positive regulation of Rac protein signal transduction(GO:0035022) |
| 0.2 | 1.2 | GO:0071630 | nucleus-associated proteasomal ubiquitin-dependent protein catabolic process(GO:0071630) |
| 0.2 | 0.7 | GO:2000078 | glandular epithelial cell maturation(GO:0002071) positive regulation of type B pancreatic cell development(GO:2000078) |
| 0.2 | 0.7 | GO:0033092 | regulation of CD4-positive, CD25-positive, alpha-beta regulatory T cell differentiation(GO:0032829) positive regulation of CD4-positive, CD25-positive, alpha-beta regulatory T cell differentiation(GO:0032831) positive regulation of immature T cell proliferation in thymus(GO:0033092) |
| 0.2 | 0.9 | GO:0042997 | negative regulation of Golgi to plasma membrane protein transport(GO:0042997) |
| 0.2 | 1.0 | GO:0070358 | actin polymerization-dependent cell motility(GO:0070358) |
| 0.2 | 0.6 | GO:1904717 | excitatory chemical synaptic transmission(GO:0098976) regulation of AMPA glutamate receptor clustering(GO:1904717) positive regulation of AMPA glutamate receptor clustering(GO:1904719) |
| 0.2 | 4.6 | GO:0016558 | protein import into peroxisome matrix(GO:0016558) |
| 0.2 | 3.3 | GO:0001574 | ganglioside biosynthetic process(GO:0001574) |
| 0.2 | 3.3 | GO:0070389 | chaperone cofactor-dependent protein refolding(GO:0070389) |
| 0.2 | 0.7 | GO:0019747 | regulation of isoprenoid metabolic process(GO:0019747) |
| 0.2 | 2.3 | GO:1904936 | cerebral cortex GABAergic interneuron migration(GO:0021853) interneuron migration(GO:1904936) |
| 0.2 | 1.1 | GO:0051344 | negative regulation of cyclic-nucleotide phosphodiesterase activity(GO:0051344) |
| 0.2 | 0.8 | GO:1903750 | regulation of intrinsic apoptotic signaling pathway in response to hydrogen peroxide(GO:1903750) negative regulation of intrinsic apoptotic signaling pathway in response to hydrogen peroxide(GO:1903751) |
| 0.2 | 0.6 | GO:1990167 | protein K6-linked deubiquitination(GO:0044313) protein K27-linked deubiquitination(GO:1990167) |
| 0.2 | 0.5 | GO:2000176 | pro-T cell differentiation(GO:0002572) regulation of pro-T cell differentiation(GO:2000174) positive regulation of pro-T cell differentiation(GO:2000176) |
| 0.2 | 0.6 | GO:0060940 | epithelial to mesenchymal transition involved in cardiac fibroblast development(GO:0060940) |
| 0.2 | 0.9 | GO:1901979 | regulation of inward rectifier potassium channel activity(GO:1901979) |
| 0.2 | 0.9 | GO:0033490 | cholesterol biosynthetic process via desmosterol(GO:0033489) cholesterol biosynthetic process via lathosterol(GO:0033490) |
| 0.1 | 1.3 | GO:1904684 | negative regulation of metalloendopeptidase activity(GO:1904684) |
| 0.1 | 2.6 | GO:0071688 | striated muscle myosin thick filament assembly(GO:0071688) |
| 0.1 | 0.4 | GO:1902310 | positive regulation of peptidyl-serine dephosphorylation(GO:1902310) |
| 0.1 | 2.5 | GO:0006308 | DNA catabolic process(GO:0006308) |
| 0.1 | 1.1 | GO:0070345 | negative regulation of fat cell proliferation(GO:0070345) |
| 0.1 | 0.4 | GO:1903464 | negative regulation of mitotic cell cycle DNA replication(GO:1903464) |
| 0.1 | 0.4 | GO:0050976 | detection of mechanical stimulus involved in sensory perception of touch(GO:0050976) |
| 0.1 | 5.1 | GO:0010971 | positive regulation of G2/M transition of mitotic cell cycle(GO:0010971) |
| 0.1 | 7.6 | GO:0000305 | response to oxygen radical(GO:0000305) |
| 0.1 | 3.0 | GO:0060394 | negative regulation of pathway-restricted SMAD protein phosphorylation(GO:0060394) |
| 0.1 | 3.1 | GO:0006768 | biotin metabolic process(GO:0006768) |
| 0.1 | 0.9 | GO:0061198 | fungiform papilla formation(GO:0061198) |
| 0.1 | 3.8 | GO:2000811 | negative regulation of anoikis(GO:2000811) |
| 0.1 | 0.5 | GO:0051311 | meiotic metaphase I plate congression(GO:0043060) meiotic spindle midzone assembly(GO:0051257) meiotic metaphase plate congression(GO:0051311) |
| 0.1 | 0.5 | GO:0032072 | plasmacytoid dendritic cell activation(GO:0002270) regulation of restriction endodeoxyribonuclease activity(GO:0032072) |
| 0.1 | 7.8 | GO:0048791 | calcium ion-regulated exocytosis of neurotransmitter(GO:0048791) |
| 0.1 | 1.9 | GO:0015871 | choline transport(GO:0015871) |
| 0.1 | 1.3 | GO:0016191 | synaptic vesicle uncoating(GO:0016191) |
| 0.1 | 0.4 | GO:2000670 | positive regulation of dendritic cell apoptotic process(GO:2000670) |
| 0.1 | 1.3 | GO:0031936 | negative regulation of chromatin silencing(GO:0031936) |
| 0.1 | 2.0 | GO:0036149 | phosphatidylinositol acyl-chain remodeling(GO:0036149) |
| 0.1 | 0.6 | GO:0045541 | negative regulation of cholesterol biosynthetic process(GO:0045541) negative regulation of cholesterol metabolic process(GO:0090206) |
| 0.1 | 2.6 | GO:2000251 | positive regulation of actin cytoskeleton reorganization(GO:2000251) |
| 0.1 | 1.1 | GO:1904896 | ESCRT complex disassembly(GO:1904896) ESCRT III complex disassembly(GO:1904903) |
| 0.1 | 0.6 | GO:0006620 | posttranslational protein targeting to membrane(GO:0006620) |
| 0.1 | 0.7 | GO:1901727 | positive regulation of histone deacetylase activity(GO:1901727) |
| 0.1 | 0.3 | GO:0042377 | menaquinone catabolic process(GO:0042361) vitamin K catabolic process(GO:0042377) |
| 0.1 | 0.3 | GO:0051037 | regulation of transcription involved in meiotic cell cycle(GO:0051037) |
| 0.1 | 0.5 | GO:0002803 | positive regulation of antimicrobial peptide production(GO:0002225) positive regulation of antibacterial peptide production(GO:0002803) |
| 0.1 | 0.3 | GO:0002378 | immunoglobulin biosynthetic process(GO:0002378) |
| 0.1 | 0.4 | GO:0036378 | calcitriol biosynthetic process from calciol(GO:0036378) |
| 0.1 | 1.0 | GO:0070131 | positive regulation of mitochondrial translation(GO:0070131) |
| 0.1 | 0.8 | GO:0006777 | Mo-molybdopterin cofactor biosynthetic process(GO:0006777) Mo-molybdopterin cofactor metabolic process(GO:0019720) |
| 0.1 | 1.6 | GO:0031507 | heterochromatin assembly(GO:0031507) |
| 0.1 | 1.2 | GO:0060252 | positive regulation of glial cell proliferation(GO:0060252) |
| 0.1 | 1.3 | GO:0070307 | lens fiber cell development(GO:0070307) |
| 0.1 | 0.6 | GO:0060591 | chondroblast differentiation(GO:0060591) |
| 0.1 | 1.5 | GO:0048243 | norepinephrine secretion(GO:0048243) |
| 0.1 | 0.1 | GO:0034445 | regulation of plasma lipoprotein particle oxidation(GO:0034444) negative regulation of plasma lipoprotein particle oxidation(GO:0034445) |
| 0.1 | 1.7 | GO:0051044 | positive regulation of membrane protein ectodomain proteolysis(GO:0051044) |
| 0.1 | 0.3 | GO:0071442 | positive regulation of histone H3-K14 acetylation(GO:0071442) |
| 0.1 | 0.8 | GO:0030091 | protein repair(GO:0030091) |
| 0.1 | 0.4 | GO:1903377 | negative regulation of oxidative stress-induced neuron intrinsic apoptotic signaling pathway(GO:1903377) |
| 0.1 | 2.7 | GO:0030262 | apoptotic nuclear changes(GO:0030262) |
| 0.1 | 1.7 | GO:0090083 | regulation of inclusion body assembly(GO:0090083) |
| 0.1 | 10.7 | GO:0031424 | keratinization(GO:0031424) |
| 0.1 | 0.6 | GO:0007512 | adult heart development(GO:0007512) |
| 0.1 | 0.3 | GO:0090116 | C-5 methylation of cytosine(GO:0090116) |
| 0.1 | 0.5 | GO:1904885 | beta-catenin destruction complex assembly(GO:1904885) |
| 0.1 | 1.0 | GO:0036010 | protein localization to endosome(GO:0036010) |
| 0.1 | 1.9 | GO:0051016 | barbed-end actin filament capping(GO:0051016) |
| 0.1 | 3.0 | GO:0035735 | intraciliary transport involved in cilium morphogenesis(GO:0035735) |
| 0.1 | 0.3 | GO:0032079 | positive regulation of endodeoxyribonuclease activity(GO:0032079) |
| 0.1 | 0.8 | GO:0000338 | protein deneddylation(GO:0000338) |
| 0.0 | 5.0 | GO:0043966 | histone H3 acetylation(GO:0043966) |
| 0.0 | 1.3 | GO:0016180 | snRNA processing(GO:0016180) |
| 0.0 | 0.4 | GO:0051001 | negative regulation of nitric-oxide synthase activity(GO:0051001) |
| 0.0 | 0.7 | GO:0046784 | viral mRNA export from host cell nucleus(GO:0046784) |
| 0.0 | 0.3 | GO:0097428 | protein maturation by iron-sulfur cluster transfer(GO:0097428) |
| 0.0 | 1.0 | GO:0048934 | peripheral nervous system neuron differentiation(GO:0048934) peripheral nervous system neuron development(GO:0048935) |
| 0.0 | 0.8 | GO:0035090 | maintenance of apical/basal cell polarity(GO:0035090) maintenance of epithelial cell apical/basal polarity(GO:0045199) |
| 0.0 | 0.1 | GO:0030576 | Cajal body organization(GO:0030576) |
| 0.0 | 0.4 | GO:0031119 | tRNA pseudouridine synthesis(GO:0031119) |
| 0.0 | 0.4 | GO:0018401 | peptidyl-proline hydroxylation to 4-hydroxy-L-proline(GO:0018401) |
| 0.0 | 0.5 | GO:0018095 | protein polyglutamylation(GO:0018095) |
| 0.0 | 0.4 | GO:0048227 | plasma membrane to endosome transport(GO:0048227) |
| 0.0 | 0.3 | GO:0031022 | nuclear migration along microfilament(GO:0031022) |
| 0.0 | 0.7 | GO:0032463 | negative regulation of protein homooligomerization(GO:0032463) |
| 0.0 | 1.0 | GO:0002230 | positive regulation of defense response to virus by host(GO:0002230) |
| 0.0 | 0.8 | GO:0006590 | thyroid hormone generation(GO:0006590) |
| 0.0 | 0.3 | GO:0045040 | protein import into mitochondrial outer membrane(GO:0045040) |
| 0.0 | 0.4 | GO:0035694 | mitochondrial protein catabolic process(GO:0035694) |
| 0.0 | 10.3 | GO:0006367 | transcription initiation from RNA polymerase II promoter(GO:0006367) |
| 0.0 | 1.3 | GO:0000083 | regulation of transcription involved in G1/S transition of mitotic cell cycle(GO:0000083) |
| 0.0 | 2.7 | GO:0006301 | postreplication repair(GO:0006301) |
| 0.0 | 0.3 | GO:0000920 | cell separation after cytokinesis(GO:0000920) |
| 0.0 | 0.1 | GO:1901145 | optic nerve formation(GO:0021634) regulation of metanephros size(GO:0035566) pronephric field specification(GO:0039003) pattern specification involved in pronephros development(GO:0039017) optic chiasma development(GO:0061360) kidney field specification(GO:0072004) regulation of mesenchymal cell apoptotic process involved in nephron morphogenesis(GO:0072039) negative regulation of mesenchymal cell apoptotic process involved in nephron morphogenesis(GO:0072040) regulation of mesenchymal cell apoptotic process involved in metanephric nephron morphogenesis(GO:0072304) negative regulation of mesenchymal cell apoptotic process involved in metanephric nephron morphogenesis(GO:0072305) mesenchymal stem cell maintenance involved in metanephric nephron morphogenesis(GO:0072309) mesenchymal cell apoptotic process involved in metanephros development(GO:1900200) apoptotic process involved in metanephric collecting duct development(GO:1900204) apoptotic process involved in metanephric nephron tubule development(GO:1900205) regulation of mesenchymal cell apoptotic process involved in metanephros development(GO:1900211) negative regulation of mesenchymal cell apoptotic process involved in metanephros development(GO:1900212) regulation of apoptotic process involved in metanephric collecting duct development(GO:1900214) negative regulation of apoptotic process involved in metanephric collecting duct development(GO:1900215) regulation of apoptotic process involved in metanephric nephron tubule development(GO:1900217) negative regulation of apoptotic process involved in metanephric nephron tubule development(GO:1900218) mesenchymal cell apoptotic process involved in nephron morphogenesis(GO:1901145) mesenchymal cell apoptotic process involved in metanephric nephron morphogenesis(GO:1901147) negative regulation of somatic stem cell population maintenance(GO:1904673) regulation of metanephric DCT cell differentiation(GO:2000592) positive regulation of metanephric DCT cell differentiation(GO:2000594) regulation of optic nerve formation(GO:2000595) positive regulation of optic nerve formation(GO:2000597) |
| 0.0 | 1.9 | GO:0008333 | endosome to lysosome transport(GO:0008333) |
| 0.0 | 2.1 | GO:0000186 | activation of MAPKK activity(GO:0000186) |
| 0.0 | 0.7 | GO:0040033 | miRNA mediated inhibition of translation(GO:0035278) negative regulation of translation, ncRNA-mediated(GO:0040033) regulation of translation, ncRNA-mediated(GO:0045974) |
| 0.0 | 0.2 | GO:0051552 | flavone metabolic process(GO:0051552) |
| 0.0 | 0.5 | GO:1904380 | endoplasmic reticulum mannose trimming(GO:1904380) |
| 0.0 | 0.2 | GO:0006499 | N-terminal protein myristoylation(GO:0006499) |
| 0.0 | 0.2 | GO:0070900 | tRNA wobble uridine modification(GO:0002098) mitochondrial tRNA modification(GO:0070900) mitochondrial RNA modification(GO:1900864) |
| 0.0 | 0.4 | GO:0044030 | regulation of DNA methylation(GO:0044030) |
| 0.0 | 0.5 | GO:0033141 | positive regulation of peptidyl-serine phosphorylation of STAT protein(GO:0033141) |
| 0.0 | 0.2 | GO:1900004 | negative regulation of serine-type endopeptidase activity(GO:1900004) negative regulation of serine-type peptidase activity(GO:1902572) |
| 0.0 | 0.1 | GO:0019086 | late viral transcription(GO:0019086) |
| 0.0 | 0.6 | GO:2001275 | positive regulation of glucose import in response to insulin stimulus(GO:2001275) |
| 0.0 | 0.4 | GO:0030497 | fatty acid elongation(GO:0030497) |
| 0.0 | 0.2 | GO:0060136 | embryonic process involved in female pregnancy(GO:0060136) |
| 0.0 | 0.4 | GO:0061298 | retina vasculature development in camera-type eye(GO:0061298) |
| 0.0 | 1.2 | GO:1903959 | regulation of anion transmembrane transport(GO:1903959) |
| 0.0 | 1.3 | GO:0021762 | substantia nigra development(GO:0021762) |
| 0.0 | 5.4 | GO:0008360 | regulation of cell shape(GO:0008360) |
| 0.0 | 0.2 | GO:0090160 | Golgi to lysosome transport(GO:0090160) |
| 0.0 | 0.7 | GO:0071108 | protein K48-linked deubiquitination(GO:0071108) |
| 0.0 | 0.6 | GO:0032098 | regulation of appetite(GO:0032098) |
| 0.0 | 0.3 | GO:2000680 | rubidium ion transport(GO:0035826) regulation of rubidium ion transport(GO:2000680) |
| 0.0 | 0.8 | GO:0097352 | autophagosome maturation(GO:0097352) |
| 0.0 | 3.5 | GO:0007156 | homophilic cell adhesion via plasma membrane adhesion molecules(GO:0007156) |
| 0.0 | 3.0 | GO:0002576 | platelet degranulation(GO:0002576) |
| 0.0 | 0.1 | GO:0010641 | positive regulation of platelet-derived growth factor receptor signaling pathway(GO:0010641) |
| 0.0 | 0.3 | GO:0045945 | positive regulation of transcription from RNA polymerase III promoter(GO:0045945) |
| 0.0 | 0.3 | GO:0016024 | CDP-diacylglycerol biosynthetic process(GO:0016024) |
| 0.0 | 0.3 | GO:0034587 | piRNA metabolic process(GO:0034587) |
| 0.0 | 0.5 | GO:0007140 | male meiosis(GO:0007140) |
| 0.0 | 0.1 | GO:2000660 | negative regulation of interleukin-1-mediated signaling pathway(GO:2000660) |
| 0.0 | 1.3 | GO:0046323 | glucose import(GO:0046323) |
| 0.0 | 0.4 | GO:0006750 | glutathione biosynthetic process(GO:0006750) |
| 0.0 | 0.2 | GO:0030210 | heparin metabolic process(GO:0030202) heparin biosynthetic process(GO:0030210) |
| 0.0 | 0.3 | GO:0001502 | cartilage condensation(GO:0001502) |
| 0.0 | 1.2 | GO:0031110 | regulation of microtubule polymerization or depolymerization(GO:0031110) |
| 0.0 | 0.8 | GO:0007528 | neuromuscular junction development(GO:0007528) |
| 0.0 | 0.2 | GO:0007175 | negative regulation of epidermal growth factor-activated receptor activity(GO:0007175) |
| 0.0 | 1.4 | GO:0043154 | negative regulation of cysteine-type endopeptidase activity involved in apoptotic process(GO:0043154) |
| 0.0 | 0.8 | GO:0006635 | fatty acid beta-oxidation(GO:0006635) |
| 0.0 | 0.1 | GO:0001561 | fatty acid alpha-oxidation(GO:0001561) |
| 0.0 | 0.4 | GO:0019433 | triglyceride catabolic process(GO:0019433) |
Gene overrepresentation in cellular component category:
| Log-likelihood per target | Total log-likelihood | Term | Description |
|---|---|---|---|
| 0.7 | 3.4 | GO:0097513 | myosin II filament(GO:0097513) |
| 0.5 | 3.1 | GO:1990393 | 3M complex(GO:1990393) |
| 0.4 | 4.5 | GO:0016593 | Cdc73/Paf1 complex(GO:0016593) |
| 0.3 | 1.3 | GO:0070876 | SOSS complex(GO:0070876) |
| 0.3 | 4.1 | GO:0070776 | H3 histone acetyltransferase complex(GO:0070775) MOZ/MORF histone acetyltransferase complex(GO:0070776) |
| 0.3 | 1.5 | GO:0070695 | FHF complex(GO:0070695) |
| 0.2 | 2.7 | GO:0031464 | Cul4A-RING E3 ubiquitin ligase complex(GO:0031464) |
| 0.2 | 1.3 | GO:0031232 | extrinsic component of external side of plasma membrane(GO:0031232) |
| 0.2 | 0.8 | GO:1902937 | inward rectifier potassium channel complex(GO:1902937) |
| 0.2 | 5.8 | GO:0071782 | endoplasmic reticulum tubular network(GO:0071782) |
| 0.1 | 1.1 | GO:0034751 | aryl hydrocarbon receptor complex(GO:0034751) |
| 0.1 | 11.9 | GO:0045095 | keratin filament(GO:0045095) |
| 0.1 | 1.9 | GO:0008290 | F-actin capping protein complex(GO:0008290) |
| 0.1 | 1.8 | GO:0098799 | outer mitochondrial membrane protein complex(GO:0098799) |
| 0.1 | 0.5 | GO:0005715 | late recombination nodule(GO:0005715) |
| 0.1 | 0.8 | GO:0000788 | nuclear nucleosome(GO:0000788) |
| 0.1 | 1.6 | GO:0005677 | chromatin silencing complex(GO:0005677) |
| 0.1 | 1.7 | GO:0030008 | TRAPP complex(GO:0030008) |
| 0.1 | 2.6 | GO:0035327 | transcriptionally active chromatin(GO:0035327) |
| 0.1 | 0.7 | GO:0000308 | cytoplasmic cyclin-dependent protein kinase holoenzyme complex(GO:0000308) |
| 0.1 | 1.0 | GO:0032593 | insulin-responsive compartment(GO:0032593) |
| 0.1 | 9.5 | GO:0000502 | proteasome complex(GO:0000502) |
| 0.1 | 0.9 | GO:0042105 | alpha-beta T cell receptor complex(GO:0042105) |
| 0.1 | 1.4 | GO:0000164 | protein phosphatase type 1 complex(GO:0000164) |
| 0.1 | 0.8 | GO:0005577 | fibrinogen complex(GO:0005577) |
| 0.1 | 1.0 | GO:0005687 | U4 snRNP(GO:0005687) |
| 0.1 | 1.6 | GO:0000242 | pericentriolar material(GO:0000242) |
| 0.1 | 0.7 | GO:0000347 | THO complex(GO:0000347) THO complex part of transcription export complex(GO:0000445) |
| 0.1 | 0.9 | GO:0000124 | SAGA complex(GO:0000124) |
| 0.1 | 0.2 | GO:0097196 | Shu complex(GO:0097196) |
| 0.1 | 0.9 | GO:0097512 | cardiac myofibril(GO:0097512) |
| 0.1 | 0.6 | GO:0036513 | Derlin-1 retrotranslocation complex(GO:0036513) |
| 0.1 | 6.7 | GO:0030672 | synaptic vesicle membrane(GO:0030672) exocytic vesicle membrane(GO:0099501) |
| 0.0 | 1.9 | GO:0034451 | centriolar satellite(GO:0034451) |
| 0.0 | 0.6 | GO:0031298 | replication fork protection complex(GO:0031298) |
| 0.0 | 0.3 | GO:0034992 | microtubule organizing center attachment site(GO:0034992) LINC complex(GO:0034993) |
| 0.0 | 1.3 | GO:0080008 | Cul4-RING E3 ubiquitin ligase complex(GO:0080008) |
| 0.0 | 0.9 | GO:0016580 | Sin3 complex(GO:0016580) |
| 0.0 | 0.4 | GO:0042382 | paraspeckles(GO:0042382) |
| 0.0 | 0.7 | GO:1990909 | Wnt signalosome(GO:1990909) |
| 0.0 | 0.6 | GO:0000940 | condensed chromosome outer kinetochore(GO:0000940) |
| 0.0 | 0.3 | GO:0016012 | sarcoglycan complex(GO:0016012) |
| 0.0 | 1.9 | GO:0045171 | intercellular bridge(GO:0045171) |
| 0.0 | 2.2 | GO:0097542 | ciliary tip(GO:0097542) |
| 0.0 | 0.1 | GO:0071006 | U2-type catalytic step 1 spliceosome(GO:0071006) |
| 0.0 | 0.1 | GO:0034365 | discoidal high-density lipoprotein particle(GO:0034365) |
| 0.0 | 0.2 | GO:0005610 | laminin-5 complex(GO:0005610) |
| 0.0 | 0.6 | GO:0001931 | uropod(GO:0001931) cell trailing edge(GO:0031254) |
| 0.0 | 0.8 | GO:0071682 | endocytic vesicle lumen(GO:0071682) |
| 0.0 | 0.3 | GO:0031390 | Ctf18 RFC-like complex(GO:0031390) |
| 0.0 | 1.3 | GO:0008180 | COP9 signalosome(GO:0008180) |
| 0.0 | 1.1 | GO:0000421 | autophagosome membrane(GO:0000421) |
| 0.0 | 0.3 | GO:0097487 | multivesicular body, internal vesicle(GO:0097487) |
| 0.0 | 0.5 | GO:0014731 | spectrin-associated cytoskeleton(GO:0014731) |
| 0.0 | 4.4 | GO:0055037 | recycling endosome(GO:0055037) |
| 0.0 | 4.2 | GO:0090575 | RNA polymerase II transcription factor complex(GO:0090575) |
| 0.0 | 0.2 | GO:0034663 | endoplasmic reticulum chaperone complex(GO:0034663) |
| 0.0 | 0.9 | GO:0005640 | nuclear outer membrane(GO:0005640) |
| 0.0 | 12.9 | GO:0005759 | mitochondrial matrix(GO:0005759) |
| 0.0 | 0.4 | GO:0005885 | Arp2/3 protein complex(GO:0005885) |
| 0.0 | 0.4 | GO:0033270 | paranode region of axon(GO:0033270) |
| 0.0 | 1.7 | GO:0005746 | mitochondrial respiratory chain(GO:0005746) |
| 0.0 | 2.8 | GO:0031901 | early endosome membrane(GO:0031901) |
| 0.0 | 0.3 | GO:0005736 | DNA-directed RNA polymerase I complex(GO:0005736) |
| 0.0 | 2.7 | GO:0035579 | specific granule membrane(GO:0035579) |
| 0.0 | 2.8 | GO:0043202 | lysosomal lumen(GO:0043202) |
| 0.0 | 0.4 | GO:0031092 | platelet alpha granule membrane(GO:0031092) |
| 0.0 | 1.7 | GO:0031093 | platelet alpha granule lumen(GO:0031093) |
| 0.0 | 1.0 | GO:0032154 | cleavage furrow(GO:0032154) cell surface furrow(GO:0097610) |
| 0.0 | 2.9 | GO:0043197 | dendritic spine(GO:0043197) |
| 0.0 | 2.1 | GO:0000932 | cytoplasmic mRNA processing body(GO:0000932) |
| 0.0 | 0.1 | GO:0000786 | nucleosome(GO:0000786) |
| 0.0 | 0.7 | GO:0016235 | aggresome(GO:0016235) |
| 0.0 | 0.2 | GO:0005890 | sodium:potassium-exchanging ATPase complex(GO:0005890) |
| 0.0 | 3.2 | GO:0005667 | transcription factor complex(GO:0005667) |
Gene overrepresentation in molecular function category:
| Log-likelihood per target | Total log-likelihood | Term | Description |
|---|---|---|---|
| 1.9 | 5.8 | GO:0005128 | erythropoietin receptor binding(GO:0005128) interleukin-3 receptor binding(GO:0005135) |
| 0.9 | 2.6 | GO:0010698 | acetyltransferase activator activity(GO:0010698) |
| 0.8 | 3.3 | GO:0004513 | neolactotetraosylceramide alpha-2,3-sialyltransferase activity(GO:0004513) lactosylceramide alpha-2,3-sialyltransferase activity(GO:0047291) |
| 0.8 | 0.8 | GO:0004887 | thyroid hormone receptor activity(GO:0004887) |
| 0.7 | 2.9 | GO:0047708 | biotinidase activity(GO:0047708) |
| 0.6 | 1.7 | GO:0045550 | geranylgeranyl reductase activity(GO:0045550) delta4-3-oxosteroid 5beta-reductase activity(GO:0047787) |
| 0.5 | 1.6 | GO:0008746 | NAD(P)+ transhydrogenase activity(GO:0008746) oxidoreductase activity, acting on NAD(P)H, NAD(P) as acceptor(GO:0016652) |
| 0.5 | 7.8 | GO:0004791 | thioredoxin-disulfide reductase activity(GO:0004791) |
| 0.5 | 2.8 | GO:0042806 | fucose binding(GO:0042806) |
| 0.4 | 1.7 | GO:0004616 | phosphogluconate dehydrogenase (decarboxylating) activity(GO:0004616) |
| 0.4 | 1.2 | GO:0052857 | NADHX epimerase activity(GO:0052856) NADPHX epimerase activity(GO:0052857) |
| 0.4 | 1.4 | GO:0005163 | nerve growth factor receptor binding(GO:0005163) |
| 0.3 | 1.4 | GO:0035515 | oxidative RNA demethylase activity(GO:0035515) |
| 0.3 | 3.0 | GO:0008420 | CTD phosphatase activity(GO:0008420) |
| 0.3 | 3.4 | GO:0008474 | palmitoyl-(protein) hydrolase activity(GO:0008474) palmitoyl hydrolase activity(GO:0098599) |
| 0.3 | 1.3 | GO:0019834 | phospholipase A2 inhibitor activity(GO:0019834) |
| 0.3 | 3.1 | GO:0047498 | calcium-dependent phospholipase A2 activity(GO:0047498) |
| 0.2 | 0.9 | GO:0004583 | dolichyl-phosphate-glucose-glycolipid alpha-glucosyltransferase activity(GO:0004583) |
| 0.2 | 6.0 | GO:0005112 | Notch binding(GO:0005112) |
| 0.2 | 1.9 | GO:0015220 | choline transmembrane transporter activity(GO:0015220) |
| 0.2 | 1.1 | GO:0003998 | acylphosphatase activity(GO:0003998) |
| 0.2 | 5.5 | GO:0008093 | cytoskeletal adaptor activity(GO:0008093) |
| 0.2 | 2.7 | GO:0000774 | adenyl-nucleotide exchange factor activity(GO:0000774) |
| 0.2 | 0.8 | GO:0004447 | iodide peroxidase activity(GO:0004447) |
| 0.2 | 0.8 | GO:0004719 | protein-L-isoaspartate (D-aspartate) O-methyltransferase activity(GO:0004719) |
| 0.2 | 0.5 | GO:1904713 | beta-catenin destruction complex binding(GO:1904713) |
| 0.2 | 0.6 | GO:0052812 | phosphatidylinositol-3,4-bisphosphate 5-kinase activity(GO:0052812) |
| 0.1 | 0.4 | GO:0017099 | very-long-chain-acyl-CoA dehydrogenase activity(GO:0017099) |
| 0.1 | 1.9 | GO:0005072 | transforming growth factor beta receptor, cytoplasmic mediator activity(GO:0005072) |
| 0.1 | 3.3 | GO:0008349 | MAP kinase kinase kinase kinase activity(GO:0008349) |
| 0.1 | 3.4 | GO:0030898 | actin-dependent ATPase activity(GO:0030898) |
| 0.1 | 6.9 | GO:0001106 | RNA polymerase II transcription corepressor activity(GO:0001106) |
| 0.1 | 1.3 | GO:0034987 | immunoglobulin receptor binding(GO:0034987) |
| 0.1 | 7.8 | GO:0005544 | calcium-dependent phospholipid binding(GO:0005544) |
| 0.1 | 0.4 | GO:0050253 | retinyl-palmitate esterase activity(GO:0050253) |
| 0.1 | 10.4 | GO:0048306 | calcium-dependent protein binding(GO:0048306) |
| 0.1 | 0.4 | GO:0070643 | vitamin D3 25-hydroxylase activity(GO:0030343) vitamin D 25-hydroxylase activity(GO:0070643) |
| 0.1 | 1.5 | GO:0034713 | type I transforming growth factor beta receptor binding(GO:0034713) |
| 0.1 | 1.6 | GO:0030306 | ADP-ribosylation factor binding(GO:0030306) |
| 0.1 | 1.7 | GO:0019855 | calcium channel inhibitor activity(GO:0019855) |
| 0.1 | 3.4 | GO:0004709 | MAP kinase kinase kinase activity(GO:0004709) |
| 0.1 | 1.0 | GO:0019869 | chloride channel inhibitor activity(GO:0019869) |
| 0.1 | 0.8 | GO:0019784 | NEDD8-specific protease activity(GO:0019784) |
| 0.1 | 0.8 | GO:0055131 | phosphorelay sensor kinase activity(GO:0000155) C3HC4-type RING finger domain binding(GO:0055131) |
| 0.1 | 1.0 | GO:0071933 | Arp2/3 complex binding(GO:0071933) |
| 0.1 | 1.1 | GO:0017162 | aryl hydrocarbon receptor binding(GO:0017162) |
| 0.1 | 4.0 | GO:0044390 | ubiquitin-like protein conjugating enzyme binding(GO:0044390) |
| 0.1 | 9.8 | GO:0003707 | steroid hormone receptor activity(GO:0003707) |
| 0.1 | 1.1 | GO:0070410 | co-SMAD binding(GO:0070410) |
| 0.1 | 0.7 | GO:0051525 | NFAT protein binding(GO:0051525) |
| 0.1 | 2.7 | GO:0030676 | Rac guanyl-nucleotide exchange factor activity(GO:0030676) |
| 0.1 | 0.2 | GO:0030158 | protein xylosyltransferase activity(GO:0030158) |
| 0.1 | 6.2 | GO:0004843 | thiol-dependent ubiquitin-specific protease activity(GO:0004843) |
| 0.1 | 0.5 | GO:0010858 | calcium-dependent protein kinase regulator activity(GO:0010858) |
| 0.1 | 1.3 | GO:0008191 | metalloendopeptidase inhibitor activity(GO:0008191) |
| 0.1 | 0.9 | GO:0003688 | DNA replication origin binding(GO:0003688) |
| 0.1 | 0.3 | GO:0003886 | DNA (cytosine-5-)-methyltransferase activity(GO:0003886) |
| 0.1 | 0.5 | GO:0070740 | tubulin-glutamic acid ligase activity(GO:0070740) |
| 0.1 | 0.7 | GO:0005168 | neurotrophin TRKA receptor binding(GO:0005168) |
| 0.1 | 4.7 | GO:0004402 | histone acetyltransferase activity(GO:0004402) |
| 0.0 | 0.2 | GO:0047179 | platelet-activating factor acetyltransferase activity(GO:0047179) |
| 0.0 | 0.8 | GO:0016783 | sulfurtransferase activity(GO:0016783) |
| 0.0 | 1.2 | GO:0005247 | voltage-gated chloride channel activity(GO:0005247) |
| 0.0 | 0.3 | GO:0008467 | [heparan sulfate]-glucosamine 3-sulfotransferase 1 activity(GO:0008467) |
| 0.0 | 1.1 | GO:0001223 | transcription coactivator binding(GO:0001223) |
| 0.0 | 0.4 | GO:0019826 | oxygen sensor activity(GO:0019826) |
| 0.0 | 0.9 | GO:0001011 | transcription factor activity, sequence-specific DNA binding, RNA polymerase recruiting(GO:0001011) transcription factor activity, TFIIB-class binding(GO:0001087) TFIIB-class transcription factor binding(GO:0001093) |
| 0.0 | 1.9 | GO:0003785 | actin monomer binding(GO:0003785) |
| 0.0 | 1.3 | GO:0005212 | structural constituent of eye lens(GO:0005212) |
| 0.0 | 1.0 | GO:0038191 | neuropilin binding(GO:0038191) |
| 0.0 | 0.4 | GO:0072542 | protein phosphatase activator activity(GO:0072542) |
| 0.0 | 0.5 | GO:0032137 | guanine/thymine mispair binding(GO:0032137) |
| 0.0 | 17.0 | GO:0001077 | transcriptional activator activity, RNA polymerase II core promoter proximal region sequence-specific binding(GO:0001077) |
| 0.0 | 1.3 | GO:0080025 | phosphatidylinositol-3,5-bisphosphate binding(GO:0080025) |
| 0.0 | 0.5 | GO:0005132 | type I interferon receptor binding(GO:0005132) |
| 0.0 | 0.2 | GO:0001849 | complement component C1q binding(GO:0001849) |
| 0.0 | 0.1 | GO:0004078 | biotin-[acetyl-CoA-carboxylase] ligase activity(GO:0004077) biotin-[methylcrotonoyl-CoA-carboxylase] ligase activity(GO:0004078) biotin-[methylmalonyl-CoA-carboxytransferase] ligase activity(GO:0004079) biotin-[propionyl-CoA-carboxylase (ATP-hydrolyzing)] ligase activity(GO:0004080) biotin-protein ligase activity(GO:0018271) |
| 0.0 | 0.9 | GO:0005001 | transmembrane receptor protein tyrosine phosphatase activity(GO:0005001) transmembrane receptor protein phosphatase activity(GO:0019198) |
| 0.0 | 1.7 | GO:0017112 | Rab guanyl-nucleotide exchange factor activity(GO:0017112) |
| 0.0 | 0.3 | GO:0015288 | porin activity(GO:0015288) |
| 0.0 | 0.7 | GO:0003746 | translation elongation factor activity(GO:0003746) |
| 0.0 | 0.9 | GO:0016628 | oxidoreductase activity, acting on the CH-CH group of donors, NAD or NADP as acceptor(GO:0016628) |
| 0.0 | 0.4 | GO:0009982 | pseudouridine synthase activity(GO:0009982) |
| 0.0 | 0.7 | GO:0005521 | lamin binding(GO:0005521) |
| 0.0 | 0.2 | GO:0008568 | microtubule-severing ATPase activity(GO:0008568) |
| 0.0 | 0.5 | GO:0016805 | dipeptidase activity(GO:0016805) |
| 0.0 | 4.7 | GO:0003823 | antigen binding(GO:0003823) |
| 0.0 | 0.4 | GO:0016594 | glycine binding(GO:0016594) |
| 0.0 | 0.3 | GO:0001055 | RNA polymerase II activity(GO:0001055) |
| 0.0 | 5.9 | GO:0061630 | ubiquitin protein ligase activity(GO:0061630) |
| 0.0 | 0.1 | GO:0016404 | 15-hydroxyprostaglandin dehydrogenase (NAD+) activity(GO:0016404) |
| 0.0 | 2.1 | GO:0004536 | deoxyribonuclease activity(GO:0004536) |
| 0.0 | 0.5 | GO:0070530 | K63-linked polyubiquitin binding(GO:0070530) |
| 0.0 | 0.3 | GO:0005537 | mannose binding(GO:0005537) |
| 0.0 | 0.4 | GO:0019992 | diacylglycerol binding(GO:0019992) |
| 0.0 | 0.1 | GO:0016929 | SUMO-specific protease activity(GO:0016929) |
| 0.0 | 3.3 | GO:0001078 | transcriptional repressor activity, RNA polymerase II core promoter proximal region sequence-specific binding(GO:0001078) |
| 0.0 | 0.5 | GO:0008198 | ferrous iron binding(GO:0008198) |
| 0.0 | 0.6 | GO:0005104 | fibroblast growth factor receptor binding(GO:0005104) |
| 0.0 | 0.7 | GO:0030332 | cyclin binding(GO:0030332) |
| 0.0 | 0.6 | GO:0005184 | neuropeptide hormone activity(GO:0005184) |
| 0.0 | 1.5 | GO:0016279 | protein-lysine N-methyltransferase activity(GO:0016279) |
| 0.0 | 0.0 | GO:0061628 | H3K27me3 modified histone binding(GO:0061628) |
| 0.0 | 0.8 | GO:0016504 | peptidase activator activity(GO:0016504) |
| 0.0 | 0.4 | GO:0005251 | delayed rectifier potassium channel activity(GO:0005251) |
| 0.0 | 0.3 | GO:0004653 | polypeptide N-acetylgalactosaminyltransferase activity(GO:0004653) |
| 0.0 | 0.2 | GO:0004303 | estradiol 17-beta-dehydrogenase activity(GO:0004303) |
| 0.0 | 0.3 | GO:0004185 | serine-type carboxypeptidase activity(GO:0004185) |
| 0.0 | 0.4 | GO:0005109 | frizzled binding(GO:0005109) |
Gene overrepresentation in curated gene sets: canonical pathways category:
| Log-likelihood per target | Total log-likelihood | Term | Description |
|---|---|---|---|
| 0.4 | 5.8 | PID ERBB2 ERBB3 PATHWAY | ErbB2/ErbB3 signaling events |
| 0.1 | 1.9 | SA REG CASCADE OF CYCLIN EXPR | Expression of cyclins regulates progression through the cell cycle by activating cyclin-dependent kinases. |
| 0.1 | 6.0 | PID TNF PATHWAY | TNF receptor signaling pathway |
| 0.1 | 1.8 | PID LPA4 PATHWAY | LPA4-mediated signaling events |
| 0.1 | 5.1 | PID NOTCH PATHWAY | Notch signaling pathway |
| 0.1 | 4.8 | PID PS1 PATHWAY | Presenilin action in Notch and Wnt signaling |
| 0.1 | 1.8 | PID ARF6 DOWNSTREAM PATHWAY | Arf6 downstream pathway |
| 0.0 | 1.5 | PID EPHRINB REV PATHWAY | Ephrin B reverse signaling |
| 0.0 | 3.1 | PID ARF6 PATHWAY | Arf6 signaling events |
| 0.0 | 2.5 | PID FANCONI PATHWAY | Fanconi anemia pathway |
| 0.0 | 1.0 | PID HEDGEHOG GLI PATHWAY | Hedgehog signaling events mediated by Gli proteins |
| 0.0 | 2.2 | PID ERBB1 RECEPTOR PROXIMAL PATHWAY | EGF receptor (ErbB1) signaling pathway |
| 0.0 | 0.8 | PID LYMPH ANGIOGENESIS PATHWAY | VEGFR3 signaling in lymphatic endothelium |
| 0.0 | 1.7 | PID ALPHA SYNUCLEIN PATHWAY | Alpha-synuclein signaling |
| 0.0 | 3.6 | PID E2F PATHWAY | E2F transcription factor network |
| 0.0 | 2.4 | PID HNF3A PATHWAY | FOXA1 transcription factor network |
| 0.0 | 6.8 | NABA ECM AFFILIATED | Genes encoding proteins affiliated structurally or functionally to extracellular matrix proteins |
| 0.0 | 0.7 | PID IL2 STAT5 PATHWAY | IL2 signaling events mediated by STAT5 |
| 0.0 | 0.4 | PID CIRCADIAN PATHWAY | Circadian rhythm pathway |
| 0.0 | 1.1 | PID IL6 7 PATHWAY | IL6-mediated signaling events |
| 0.0 | 3.7 | PID P53 DOWNSTREAM PATHWAY | Direct p53 effectors |
| 0.0 | 0.3 | PID ERB GENOMIC PATHWAY | Validated nuclear estrogen receptor beta network |
| 0.0 | 2.1 | PID AR PATHWAY | Coregulation of Androgen receptor activity |
| 0.0 | 0.3 | PID P38 MK2 PATHWAY | p38 signaling mediated by MAPKAP kinases |
| 0.0 | 2.0 | PID REG GR PATHWAY | Glucocorticoid receptor regulatory network |
| 0.0 | 0.6 | PID FOXM1 PATHWAY | FOXM1 transcription factor network |
| 0.0 | 0.4 | PID HIF1A PATHWAY | Hypoxic and oxygen homeostasis regulation of HIF-1-alpha |
| 0.0 | 0.4 | PID WNT SIGNALING PATHWAY | Wnt signaling network |
| 0.0 | 0.2 | PID INTEGRIN4 PATHWAY | Alpha6 beta4 integrin-ligand interactions |
| 0.0 | 0.5 | PID AMB2 NEUTROPHILS PATHWAY | amb2 Integrin signaling |
| 0.0 | 1.1 | PID CXCR4 PATHWAY | CXCR4-mediated signaling events |
| 0.0 | 0.5 | PID CMYB PATHWAY | C-MYB transcription factor network |
Gene overrepresentation in curated gene sets: REACTOME pathways category:
| Log-likelihood per target | Total log-likelihood | Term | Description |
|---|---|---|---|
| 0.4 | 6.0 | REACTOME SIGNALING BY NOTCH3 | Genes involved in Signaling by NOTCH3 |
| 0.2 | 4.0 | REACTOME REGULATION OF COMPLEMENT CASCADE | Genes involved in Regulation of Complement cascade |
| 0.1 | 1.9 | REACTOME AKT PHOSPHORYLATES TARGETS IN THE CYTOSOL | Genes involved in AKT phosphorylates targets in the cytosol |
| 0.1 | 9.9 | REACTOME ACTIVATION OF CHAPERONE GENES BY XBP1S | Genes involved in Activation of Chaperone Genes by XBP1(S) |
| 0.1 | 2.0 | REACTOME ACYL CHAIN REMODELLING OF PS | Genes involved in Acyl chain remodelling of PS |
| 0.1 | 9.8 | REACTOME NUCLEAR RECEPTOR TRANSCRIPTION PATHWAY | Genes involved in Nuclear Receptor transcription pathway |
| 0.1 | 6.0 | REACTOME REGULATION OF BETA CELL DEVELOPMENT | Genes involved in Regulation of beta-cell development |
| 0.1 | 1.6 | REACTOME PECAM1 INTERACTIONS | Genes involved in PECAM1 interactions |
| 0.1 | 2.4 | REACTOME ADVANCED GLYCOSYLATION ENDPRODUCT RECEPTOR SIGNALING | Genes involved in Advanced glycosylation endproduct receptor signaling |
| 0.1 | 3.8 | REACTOME SEMA4D INDUCED CELL MIGRATION AND GROWTH CONE COLLAPSE | Genes involved in Sema4D induced cell migration and growth-cone collapse |
| 0.1 | 1.1 | REACTOME CDC6 ASSOCIATION WITH THE ORC ORIGIN COMPLEX | Genes involved in CDC6 association with the ORC:origin complex |
| 0.1 | 3.2 | REACTOME ERK MAPK TARGETS | Genes involved in ERK/MAPK targets |
| 0.1 | 1.2 | REACTOME G2 M DNA DAMAGE CHECKPOINT | Genes involved in G2/M DNA damage checkpoint |
| 0.1 | 1.6 | REACTOME CITRIC ACID CYCLE TCA CYCLE | Genes involved in Citric acid cycle (TCA cycle) |
| 0.1 | 0.3 | REACTOME CROSS PRESENTATION OF SOLUBLE EXOGENOUS ANTIGENS ENDOSOMES | Genes involved in Cross-presentation of soluble exogenous antigens (endosomes) |
| 0.1 | 1.7 | REACTOME BRANCHED CHAIN AMINO ACID CATABOLISM | Genes involved in Branched-chain amino acid catabolism |
| 0.1 | 1.9 | REACTOME SYNTHESIS OF PC | Genes involved in Synthesis of PC |
| 0.1 | 1.0 | REACTOME PROTEOLYTIC CLEAVAGE OF SNARE COMPLEX PROTEINS | Genes involved in Proteolytic cleavage of SNARE complex proteins |
| 0.0 | 0.6 | REACTOME SEMA3A PLEXIN REPULSION SIGNALING BY INHIBITING INTEGRIN ADHESION | Genes involved in SEMA3A-Plexin repulsion signaling by inhibiting Integrin adhesion |
| 0.0 | 1.0 | REACTOME ACTIVATION OF RAC | Genes involved in Activation of Rac |
| 0.0 | 2.3 | REACTOME IL1 SIGNALING | Genes involved in Interleukin-1 signaling |
| 0.0 | 0.8 | REACTOME GRB2 SOS PROVIDES LINKAGE TO MAPK SIGNALING FOR INTERGRINS | Genes involved in GRB2:SOS provides linkage to MAPK signaling for Intergrins |
| 0.0 | 1.1 | REACTOME ENDOSOMAL SORTING COMPLEX REQUIRED FOR TRANSPORT ESCRT | Genes involved in Endosomal Sorting Complex Required For Transport (ESCRT) |
| 0.0 | 2.1 | REACTOME MYOGENESIS | Genes involved in Myogenesis |
| 0.0 | 0.8 | REACTOME AMINE DERIVED HORMONES | Genes involved in Amine-derived hormones |
| 0.0 | 1.8 | REACTOME DOWNREGULATION OF SMAD2 3 SMAD4 TRANSCRIPTIONAL ACTIVITY | Genes involved in Downregulation of SMAD2/3:SMAD4 transcriptional activity |
| 0.0 | 1.2 | REACTOME SIGNALING BY FGFR1 FUSION MUTANTS | Genes involved in Signaling by FGFR1 fusion mutants |
| 0.0 | 0.6 | REACTOME SIGNALING BY FGFR3 MUTANTS | Genes involved in Signaling by FGFR3 mutants |
| 0.0 | 1.1 | REACTOME KINESINS | Genes involved in Kinesins |
| 0.0 | 0.5 | REACTOME MEIOSIS | Genes involved in Meiosis |
| 0.0 | 1.0 | REACTOME REGULATORY RNA PATHWAYS | Genes involved in Regulatory RNA pathways |
| 0.0 | 2.2 | REACTOME NRAGE SIGNALS DEATH THROUGH JNK | Genes involved in NRAGE signals death through JNK |
| 0.0 | 0.3 | REACTOME PLATELET SENSITIZATION BY LDL | Genes involved in Platelet sensitization by LDL |
| 0.0 | 0.9 | REACTOME RNA POL II TRANSCRIPTION PRE INITIATION AND PROMOTER OPENING | Genes involved in RNA Polymerase II Transcription Pre-Initiation And Promoter Opening |
| 0.0 | 0.9 | REACTOME CHOLESTEROL BIOSYNTHESIS | Genes involved in Cholesterol biosynthesis |
| 0.0 | 7.7 | REACTOME GENERIC TRANSCRIPTION PATHWAY | Genes involved in Generic Transcription Pathway |
| 0.0 | 0.6 | REACTOME EGFR DOWNREGULATION | Genes involved in EGFR downregulation |
| 0.0 | 0.5 | REACTOME REGULATION OF IFNA SIGNALING | Genes involved in Regulation of IFNA signaling |
| 0.0 | 0.4 | REACTOME OXYGEN DEPENDENT PROLINE HYDROXYLATION OF HYPOXIA INDUCIBLE FACTOR ALPHA | Genes involved in Oxygen-dependent Proline Hydroxylation of Hypoxia-inducible Factor Alpha |
| 0.0 | 0.5 | REACTOME ENOS ACTIVATION AND REGULATION | Genes involved in eNOS activation and regulation |
| 0.0 | 0.3 | REACTOME SYNTHESIS OF PA | Genes involved in Synthesis of PA |
| 0.0 | 0.5 | REACTOME BIOSYNTHESIS OF THE N GLYCAN PRECURSOR DOLICHOL LIPID LINKED OLIGOSACCHARIDE LLO AND TRANSFER TO A NASCENT PROTEIN | Genes involved in Biosynthesis of the N-glycan precursor (dolichol lipid-linked oligosaccharide, LLO) and transfer to a nascent protein |
| 0.0 | 0.5 | REACTOME INTERACTION BETWEEN L1 AND ANKYRINS | Genes involved in Interaction between L1 and Ankyrins |
| 0.0 | 0.6 | REACTOME MEIOTIC SYNAPSIS | Genes involved in Meiotic Synapsis |
| 0.0 | 0.8 | REACTOME CYTOCHROME P450 ARRANGED BY SUBSTRATE TYPE | Genes involved in Cytochrome P450 - arranged by substrate type |