Project
Inflammatory response time course, HUVEC (Wada, 2009)
Navigation
Downloads
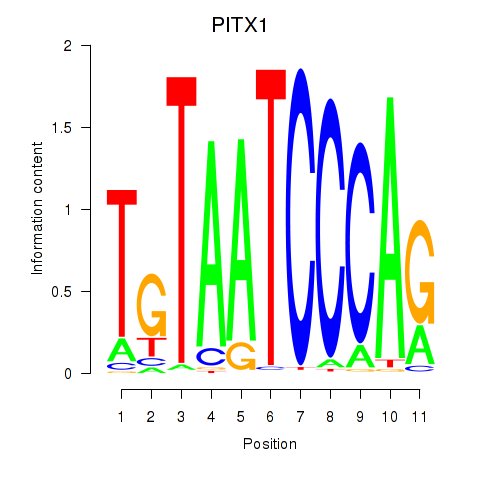
Results for PITX1
Z-value: 1.13
Motif logo
Transcription factors associated with PITX1
| Gene Symbol | Gene ID | Gene Info |
|---|---|---|
|
PITX1
|
ENSG00000069011.16 | PITX1 |
Activity-expression correlation:
| Gene | Promoter | Pearson corr. coef. | P-value | Plot |
|---|---|---|---|---|
| PITX1 | hg38_v1_chr5_-_135034212_135034294 | 0.05 | 8.1e-01 | Click! |
Activity profile of PITX1 motif
Sorted Z-values of PITX1 motif
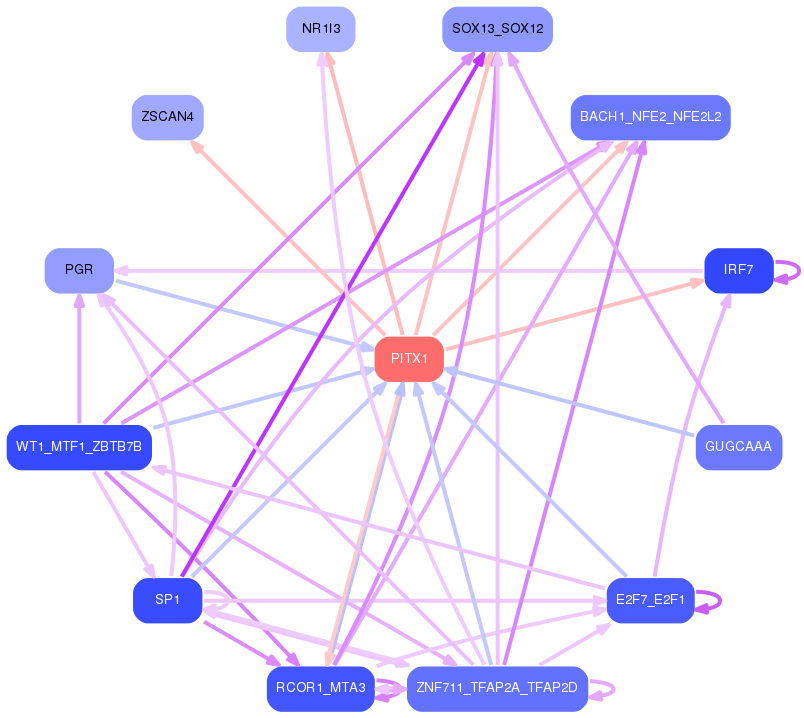
Network of associatons between targets according to the STRING database.

First level regulatory network of PITX1
| Promoter | Score | Transcript | Gene | Gene Info |
|---|---|---|---|---|
| chr3_+_184340337 | 1.37 |
ENST00000310585.4
|
FAM131A
|
family with sequence similarity 131 member A |
| chr9_-_72060590 | 1.20 |
ENST00000652156.1
|
C9orf57
|
chromosome 9 open reading frame 57 |
| chr9_-_72060605 | 1.19 |
ENST00000377024.8
ENST00000651200.2 ENST00000652752.1 |
C9orf57
|
chromosome 9 open reading frame 57 |
| chr8_+_142834247 | 1.08 |
ENST00000522728.5
|
GML
|
glycosylphosphatidylinositol anchored molecule like |
| chr21_-_30487436 | 1.04 |
ENST00000334055.5
|
KRTAP19-2
|
keratin associated protein 19-2 |
| chr11_+_60429595 | 1.03 |
ENST00000528905.1
ENST00000528093.1 |
MS4A5
|
membrane spanning 4-domains A5 |
| chr19_+_2389761 | 0.94 |
ENST00000648592.1
|
TMPRSS9
|
transmembrane serine protease 9 |
| chr16_-_3372666 | 0.89 |
ENST00000399974.5
|
MTRNR2L4
|
MT-RNR2 like 4 |
| chr16_+_72008588 | 0.85 |
ENST00000572887.5
ENST00000219240.9 ENST00000574309.5 ENST00000576145.1 |
DHODH
|
dihydroorotate dehydrogenase (quinone) |
| chr19_+_45499797 | 0.85 |
ENST00000401593.5
ENST00000396736.2 |
PPM1N
|
protein phosphatase, Mg2+/Mn2+ dependent 1N (putative) |
| chr6_+_107028188 | 0.82 |
ENST00000311381.8
ENST00000405204.6 |
MTRES1
|
mitochondrial transcription rescue factor 1 |
| chrX_-_154292117 | 0.82 |
ENST00000610938.1
|
TEX28
|
testis expressed 28 |
| chr19_-_2256406 | 0.82 |
ENST00000300961.10
|
JSRP1
|
junctional sarcoplasmic reticulum protein 1 |
| chr9_-_96302142 | 0.80 |
ENST00000648799.1
|
HSD17B3
|
hydroxysteroid 17-beta dehydrogenase 3 |
| chr16_+_180435 | 0.77 |
ENST00000199708.3
|
HBQ1
|
hemoglobin subunit theta 1 |
| chr15_-_89679360 | 0.77 |
ENST00000300055.10
|
PLIN1
|
perilipin 1 |
| chr15_-_89679411 | 0.76 |
ENST00000430628.2
|
PLIN1
|
perilipin 1 |
| chr3_+_37987970 | 0.71 |
ENST00000283713.10
|
VILL
|
villin like |
| chr12_+_112906777 | 0.71 |
ENST00000452357.7
ENST00000445409.7 |
OAS1
|
2'-5'-oligoadenylate synthetase 1 |
| chr19_-_50476725 | 0.69 |
ENST00000595790.5
|
FAM71E1
|
family with sequence similarity 71 member E1 |
| chr19_+_57120043 | 0.69 |
ENST00000254181.8
ENST00000600940.1 |
USP29
|
ubiquitin specific peptidase 29 |
| chr6_-_131701401 | 0.69 |
ENST00000315453.4
|
OR2A4
|
olfactory receptor family 2 subfamily A member 4 |
| chr3_-_196515315 | 0.69 |
ENST00000397537.3
|
SMCO1
|
single-pass membrane protein with coiled-coil domains 1 |
| chr11_+_60429567 | 0.68 |
ENST00000300190.7
|
MS4A5
|
membrane spanning 4-domains A5 |
| chr17_-_42112674 | 0.64 |
ENST00000251642.8
ENST00000591220.5 |
DHX58
|
DExH-box helicase 58 |
| chr7_+_74209947 | 0.64 |
ENST00000475494.5
ENST00000398475.5 |
LAT2
|
linker for activation of T cells family member 2 |
| chr1_+_40247926 | 0.61 |
ENST00000372766.4
|
TMCO2
|
transmembrane and coiled-coil domains 2 |
| chr1_+_13389632 | 0.60 |
ENST00000376098.4
|
PRAMEF17
|
PRAME family member 17 |
| chr6_-_111606260 | 0.59 |
ENST00000340026.10
|
TRAF3IP2
|
TRAF3 interacting protein 2 |
| chr17_+_78146353 | 0.59 |
ENST00000340363.9
|
C17orf99
|
chromosome 17 open reading frame 99 |
| chr16_+_30200729 | 0.59 |
ENST00000563322.5
|
SULT1A3
|
sulfotransferase family 1A member 3 |
| chr3_-_127598204 | 0.59 |
ENST00000462228.1
ENST00000490643.5 ENST00000648957.1 |
TPRA1
|
transmembrane protein adipocyte associated 1 |
| chr7_+_142332182 | 0.58 |
ENST00000547918.2
|
TRBV7-1
|
T cell receptor beta variable 7-1 (non-functional) |
| chr19_-_50476838 | 0.57 |
ENST00000600100.6
|
FAM71E1
|
family with sequence similarity 71 member E1 |
| chr19_+_41350911 | 0.56 |
ENST00000539627.5
|
TMEM91
|
transmembrane protein 91 |
| chr6_-_145964330 | 0.56 |
ENST00000275233.12
ENST00000367505.6 |
SHPRH
|
SNF2 histone linker PHD RING helicase |
| chr1_+_16004228 | 0.56 |
ENST00000329454.2
|
SRARP
|
steroid receptor associated and regulated protein |
| chr14_+_73591873 | 0.56 |
ENST00000326303.5
|
ACOT4
|
acyl-CoA thioesterase 4 |
| chr10_-_68471911 | 0.55 |
ENST00000358410.8
ENST00000399180.3 |
DNA2
|
DNA replication helicase/nuclease 2 |
| chr1_+_28328994 | 0.55 |
ENST00000373842.9
ENST00000398997.2 |
MED18
|
mediator complex subunit 18 |
| chr7_-_138774036 | 0.55 |
ENST00000393054.5
ENST00000483139.1 |
ATP6V0A4
|
ATPase H+ transporting V0 subunit a4 |
| chr3_+_127598400 | 0.55 |
ENST00000265056.12
|
MCM2
|
minichromosome maintenance complex component 2 |
| chr22_+_24423597 | 0.54 |
ENST00000424232.5
ENST00000611543.4 ENST00000486108.1 |
ADORA2A
|
adenosine A2a receptor |
| chr19_+_52429142 | 0.54 |
ENST00000433050.6
|
ZNF534
|
zinc finger protein 534 |
| chr6_-_27912396 | 0.53 |
ENST00000303324.4
|
OR2B2
|
olfactory receptor family 2 subfamily B member 2 |
| chr7_-_138679045 | 0.53 |
ENST00000419765.4
|
SVOPL
|
SVOP like |
| chr10_+_46375721 | 0.52 |
ENST00000616785.1
ENST00000611655.1 ENST00000619162.5 |
ENSG00000285402.1
ANXA8L1
|
novel transcript annexin A8 like 1 |
| chr16_+_29461386 | 0.52 |
ENST00000565290.5
|
SULT1A4
|
sulfotransferase family 1A member 4 |
| chr17_-_3691887 | 0.52 |
ENST00000552050.5
|
P2RX5
|
purinergic receptor P2X 5 |
| chr19_+_1077394 | 0.51 |
ENST00000590577.2
|
ARHGAP45
|
Rho GTPase activating protein 45 |
| chr19_+_17226218 | 0.51 |
ENST00000601529.5
ENST00000215061.9 ENST00000600232.5 |
OCEL1
|
occludin/ELL domain containing 1 |
| chr19_-_9621195 | 0.51 |
ENST00000424629.5
ENST00000326044.9 ENST00000435550.5 ENST00000302851.8 ENST00000444611.5 ENST00000421525.5 |
ZNF561
|
zinc finger protein 561 |
| chr9_+_128702485 | 0.50 |
ENST00000291906.5
|
PKN3
|
protein kinase N3 |
| chr22_-_17199609 | 0.50 |
ENST00000330232.8
|
ADA2
|
adenosine deaminase 2 |
| chr11_+_124673888 | 0.49 |
ENST00000227135.7
|
SPA17
|
sperm autoantigenic protein 17 |
| chr4_-_56977577 | 0.49 |
ENST00000264230.5
|
NOA1
|
nitric oxide associated 1 |
| chr11_+_124673844 | 0.49 |
ENST00000532692.1
|
SPA17
|
sperm autoantigenic protein 17 |
| chr10_+_68109433 | 0.49 |
ENST00000613327.4
ENST00000358913.10 ENST00000373675.3 |
MYPN
|
myopalladin |
| chr16_-_75207152 | 0.49 |
ENST00000303037.13
|
CTRB2
|
chymotrypsinogen B2 |
| chr6_+_16129077 | 0.49 |
ENST00000356840.8
ENST00000349606.4 |
MYLIP
|
myosin regulatory light chain interacting protein |
| chr7_-_144259722 | 0.48 |
ENST00000493325.1
|
OR2A7
|
olfactory receptor family 2 subfamily A member 7 |
| chr11_+_35176611 | 0.48 |
ENST00000279452.10
|
CD44
|
CD44 molecule (Indian blood group) |
| chr3_-_113515145 | 0.48 |
ENST00000295872.8
ENST00000480527.1 |
SPICE1
|
spindle and centriole associated protein 1 |
| chr20_-_37178966 | 0.48 |
ENST00000422138.1
|
MROH8
|
maestro heat like repeat family member 8 |
| chr19_+_41114430 | 0.47 |
ENST00000331105.7
|
CYP2F1
|
cytochrome P450 family 2 subfamily F member 1 |
| chr11_-_506316 | 0.47 |
ENST00000532055.5
ENST00000531540.5 |
RNH1
|
ribonuclease/angiogenin inhibitor 1 |
| chr12_-_57818704 | 0.46 |
ENST00000549994.1
|
AVIL
|
advillin |
| chr1_+_11664191 | 0.46 |
ENST00000376753.9
|
FBXO6
|
F-box protein 6 |
| chr19_-_55141889 | 0.46 |
ENST00000593194.5
|
TNNT1
|
troponin T1, slow skeletal type |
| chr15_-_78621272 | 0.46 |
ENST00000348639.7
|
CHRNA3
|
cholinergic receptor nicotinic alpha 3 subunit |
| chr14_-_73938094 | 0.45 |
ENST00000556794.5
ENST00000555916.1 |
FAM161B
ENSG00000258891.1
|
FAM161 centrosomal protein B novel transcript, antisense to ZNF410 |
| chr19_-_15808126 | 0.45 |
ENST00000334920.3
|
OR10H1
|
olfactory receptor family 10 subfamily H member 1 |
| chr15_-_89815332 | 0.45 |
ENST00000559874.2
|
ANPEP
|
alanyl aminopeptidase, membrane |
| chr19_-_49867542 | 0.44 |
ENST00000600910.5
ENST00000322344.8 ENST00000600573.5 ENST00000596726.3 ENST00000638016.1 |
PNKP
|
polynucleotide kinase 3'-phosphatase |
| chr22_-_42640601 | 0.44 |
ENST00000505920.1
|
ATP5MGL
|
ATP synthase membrane subunit g like |
| chr17_-_5191831 | 0.43 |
ENST00000576772.1
ENST00000575779.2 |
ZNF594
|
zinc finger protein 594 |
| chr19_+_57119138 | 0.43 |
ENST00000600020.5
|
USP29
|
ubiquitin specific peptidase 29 |
| chr1_-_113887375 | 0.43 |
ENST00000471267.1
ENST00000393320.3 |
BCL2L15
|
BCL2 like 15 |
| chr7_-_97872420 | 0.43 |
ENST00000444334.5
ENST00000422745.5 ENST00000451771.5 ENST00000175506.8 |
ASNS
|
asparagine synthetase (glutamine-hydrolyzing) |
| chr15_-_78937198 | 0.43 |
ENST00000677207.1
|
CTSH
|
cathepsin H |
| chr17_+_43006740 | 0.43 |
ENST00000438323.2
ENST00000415816.7 |
IFI35
|
interferon induced protein 35 |
| chr16_-_89719369 | 0.42 |
ENST00000561976.5
|
VPS9D1
|
VPS9 domain containing 1 |
| chr1_-_11796536 | 0.42 |
ENST00000641820.1
|
MTHFR
|
methylenetetrahydrofolate reductase |
| chr5_-_157059109 | 0.42 |
ENST00000523175.6
ENST00000522693.5 |
HAVCR1
|
hepatitis A virus cellular receptor 1 |
| chr6_-_33580229 | 0.42 |
ENST00000374467.4
ENST00000442998.6 ENST00000360661.9 |
BAK1
|
BCL2 antagonist/killer 1 |
| chr19_+_16888991 | 0.42 |
ENST00000248076.4
|
F2RL3
|
F2R like thrombin or trypsin receptor 3 |
| chr19_-_53824288 | 0.41 |
ENST00000324134.11
ENST00000391773.6 ENST00000391775.7 ENST00000345770.9 ENST00000391772.1 |
NLRP12
|
NLR family pyrin domain containing 12 |
| chr12_-_10674013 | 0.41 |
ENST00000535345.5
ENST00000542562.5 ENST00000075503.8 |
STYK1
|
serine/threonine/tyrosine kinase 1 |
| chr6_+_26020442 | 0.41 |
ENST00000613854.2
|
H3C1
|
H3 clustered histone 1 |
| chr7_+_74453790 | 0.41 |
ENST00000265755.7
ENST00000424337.7 ENST00000455841.6 |
GTF2IRD1
|
GTF2I repeat domain containing 1 |
| chr19_+_44671722 | 0.41 |
ENST00000403660.3
|
CEACAM19
|
CEA cell adhesion molecule 19 |
| chr1_-_161238085 | 0.41 |
ENST00000512372.5
ENST00000437437.6 ENST00000412844.6 ENST00000428574.6 ENST00000442691.6 ENST00000505005.5 ENST00000508740.5 ENST00000367981.7 ENST00000502985.5 ENST00000504010.5 ENST00000508387.5 ENST00000511676.5 ENST00000511748.5 ENST00000511944.5 ENST00000515621.5 ENST00000367984.8 ENST00000367985.7 |
NR1I3
|
nuclear receptor subfamily 1 group I member 3 |
| chr9_-_113376973 | 0.41 |
ENST00000374180.4
|
HDHD3
|
haloacid dehalogenase like hydrolase domain containing 3 |
| chr19_+_34677723 | 0.40 |
ENST00000505365.2
|
ZNF302
|
zinc finger protein 302 |
| chr7_-_76618300 | 0.40 |
ENST00000441393.1
|
POMZP3
|
POM121 and ZP3 fusion |
| chr1_-_9088437 | 0.39 |
ENST00000464985.5
ENST00000487835.5 ENST00000486632.5 |
SLC2A5
|
solute carrier family 2 member 5 |
| chr10_+_94683771 | 0.39 |
ENST00000339022.6
|
CYP2C18
|
cytochrome P450 family 2 subfamily C member 18 |
| chr19_-_45370384 | 0.39 |
ENST00000485403.6
ENST00000586856.1 ENST00000586131.6 ENST00000391945.10 ENST00000684407.1 ENST00000391944.8 |
ERCC2
|
ERCC excision repair 2, TFIIH core complex helicase subunit |
| chr19_-_45405034 | 0.39 |
ENST00000592134.1
ENST00000360957.10 |
PPP1R13L
|
protein phosphatase 1 regulatory subunit 13 like |
| chr19_+_47337060 | 0.39 |
ENST00000600626.1
|
C5AR2
|
complement component 5a receptor 2 |
| chr19_-_46654657 | 0.39 |
ENST00000300875.4
|
DACT3
|
dishevelled binding antagonist of beta catenin 3 |
| chr10_+_69269984 | 0.39 |
ENST00000436817.6
ENST00000450646.6 ENST00000360289.6 ENST00000448642.6 ENST00000464803.6 |
HK1
|
hexokinase 1 |
| chr14_+_67701886 | 0.39 |
ENST00000551171.6
|
RDH12
|
retinol dehydrogenase 12 |
| chr16_+_30199860 | 0.39 |
ENST00000395138.6
|
SULT1A3
|
sulfotransferase family 1A member 3 |
| chr19_-_51368979 | 0.39 |
ENST00000601435.1
ENST00000291715.5 |
CLDND2
|
claudin domain containing 2 |
| chr3_-_58587033 | 0.38 |
ENST00000447756.2
|
FAM107A
|
family with sequence similarity 107 member A |
| chr17_+_7435416 | 0.38 |
ENST00000323206.2
ENST00000396568.1 |
TMEM102
|
transmembrane protein 102 |
| chr15_-_52112730 | 0.38 |
ENST00000561198.1
ENST00000260442.3 |
BCL2L10
|
BCL2 like 10 |
| chr12_-_110445540 | 0.37 |
ENST00000547365.1
|
ARPC3
|
actin related protein 2/3 complex subunit 3 |
| chr21_+_41426232 | 0.37 |
ENST00000398598.8
ENST00000681896.1 ENST00000680629.1 ENST00000680760.1 ENST00000680176.1 ENST00000680776.1 ENST00000681607.1 ENST00000680536.1 |
MX1
|
MX dynamin like GTPase 1 |
| chr16_+_29459913 | 0.37 |
ENST00000360423.12
|
SULT1A4
|
sulfotransferase family 1A member 4 |
| chr19_-_36666810 | 0.37 |
ENST00000592829.5
ENST00000591370.5 ENST00000588268.6 ENST00000360357.8 |
ZNF461
|
zinc finger protein 461 |
| chr19_-_4302380 | 0.37 |
ENST00000600114.5
ENST00000600349.1 ENST00000595645.5 ENST00000301272.6 |
TMIGD2
|
transmembrane and immunoglobulin domain containing 2 |
| chr16_+_30199255 | 0.37 |
ENST00000338971.10
|
SULT1A3
|
sulfotransferase family 1A member 3 |
| chr19_+_58544045 | 0.37 |
ENST00000253024.10
ENST00000593582.5 |
TRIM28
|
tripartite motif containing 28 |
| chr19_+_44671452 | 0.37 |
ENST00000358777.9
|
CEACAM19
|
CEA cell adhesion molecule 19 |
| chr1_-_153565535 | 0.37 |
ENST00000368707.5
|
S100A2
|
S100 calcium binding protein A2 |
| chr16_-_28609992 | 0.37 |
ENST00000314752.11
|
SULT1A1
|
sulfotransferase family 1A member 1 |
| chr1_-_153375591 | 0.37 |
ENST00000368737.5
|
S100A12
|
S100 calcium binding protein A12 |
| chrX_-_71106728 | 0.37 |
ENST00000374251.6
|
CXorf65
|
chromosome X open reading frame 65 |
| chr13_-_48444653 | 0.36 |
ENST00000378434.8
|
LPAR6
|
lysophosphatidic acid receptor 6 |
| chr12_+_121743623 | 0.36 |
ENST00000541467.1
|
TMEM120B
|
transmembrane protein 120B |
| chr9_-_127778659 | 0.36 |
ENST00000314830.13
|
SH2D3C
|
SH2 domain containing 3C |
| chrX_-_154295085 | 0.36 |
ENST00000617225.4
ENST00000619903.4 |
TEX28
|
testis expressed 28 |
| chr13_-_33205997 | 0.36 |
ENST00000399365.7
|
STARD13
|
StAR related lipid transfer domain containing 13 |
| chr9_+_114611206 | 0.36 |
ENST00000374049.4
ENST00000288502.9 |
TMEM268
|
transmembrane protein 268 |
| chr13_+_49495941 | 0.35 |
ENST00000378319.8
ENST00000496623.5 ENST00000426879.5 |
PHF11
|
PHD finger protein 11 |
| chr17_+_35760881 | 0.35 |
ENST00000605587.2
ENST00000604830.1 |
C17orf50
|
chromosome 17 open reading frame 50 |
| chr14_-_49688201 | 0.35 |
ENST00000553805.2
ENST00000554396.5 ENST00000216367.10 |
POLE2
|
DNA polymerase epsilon 2, accessory subunit |
| chr17_-_39918589 | 0.35 |
ENST00000309481.11
|
GSDMB
|
gasdermin B |
| chr22_+_39399715 | 0.35 |
ENST00000216160.11
ENST00000331454.3 |
TAB1
|
TGF-beta activated kinase 1 (MAP3K7) binding protein 1 |
| chr2_+_38778194 | 0.35 |
ENST00000409566.1
ENST00000281950.8 |
GEMIN6
|
gem nuclear organelle associated protein 6 |
| chrX_+_154257538 | 0.35 |
ENST00000599405.3
|
OPN1MW3
|
opsin 1, medium wave sensitive 3 |
| chr14_+_24205725 | 0.35 |
ENST00000556621.5
ENST00000287913.10 ENST00000428351.2 ENST00000555092.1 |
TSSK4
|
testis specific serine kinase 4 |
| chr22_-_37580075 | 0.35 |
ENST00000215886.6
|
LGALS2
|
galectin 2 |
| chr2_-_96986572 | 0.35 |
ENST00000490605.3
|
FAM178B
|
family with sequence similarity 178 member B |
| chr17_-_39918606 | 0.35 |
ENST00000418519.6
ENST00000520542.5 |
GSDMB
|
gasdermin B |
| chr5_-_157058396 | 0.35 |
ENST00000518745.1
ENST00000339252.7 ENST00000625904.2 |
HAVCR1
|
hepatitis A virus cellular receptor 1 |
| chr6_+_136038195 | 0.34 |
ENST00000615259.4
|
PDE7B
|
phosphodiesterase 7B |
| chr9_+_124291935 | 0.34 |
ENST00000546191.5
|
NEK6
|
NIMA related kinase 6 |
| chr1_-_9069797 | 0.34 |
ENST00000473209.1
|
SLC2A5
|
solute carrier family 2 member 5 |
| chr19_-_38949855 | 0.34 |
ENST00000599996.1
|
ENSG00000269547.1
|
novel protein |
| chr9_-_132406807 | 0.34 |
ENST00000334270.3
ENST00000612514.4 |
TTF1
|
transcription termination factor 1 |
| chr14_+_24094053 | 0.34 |
ENST00000559250.5
ENST00000560736.5 ENST00000396973.8 ENST00000559837.5 |
PCK2
|
phosphoenolpyruvate carboxykinase 2, mitochondrial |
| chr14_+_24130659 | 0.34 |
ENST00000267426.6
|
FITM1
|
fat storage inducing transmembrane protein 1 |
| chr13_+_27270814 | 0.34 |
ENST00000241463.5
|
RASL11A
|
RAS like family 11 member A |
| chr12_+_104588845 | 0.34 |
ENST00000549016.1
|
CHST11
|
carbohydrate sulfotransferase 11 |
| chr3_-_12545499 | 0.33 |
ENST00000564146.4
|
MKRN2OS
|
MKRN2 opposite strand |
| chr20_+_18145083 | 0.33 |
ENST00000489634.2
|
KAT14
|
lysine acetyltransferase 14 |
| chr12_+_122774515 | 0.33 |
ENST00000392441.8
ENST00000539171.1 |
CCDC62
|
coiled-coil domain containing 62 |
| chr1_-_161238163 | 0.33 |
ENST00000367982.8
|
NR1I3
|
nuclear receptor subfamily 1 group I member 3 |
| chr7_-_97872394 | 0.33 |
ENST00000455086.5
ENST00000394308.8 ENST00000453600.5 |
ASNS
|
asparagine synthetase (glutamine-hydrolyzing) |
| chr19_+_54965252 | 0.33 |
ENST00000543010.5
ENST00000391721.8 ENST00000339757.11 |
NLRP2
|
NLR family pyrin domain containing 2 |
| chr11_+_119084873 | 0.33 |
ENST00000652429.1
ENST00000442944.7 ENST00000537841.5 ENST00000542729.5 ENST00000546302.6 ENST00000536813.6 ENST00000544387.5 ENST00000543090.5 |
HMBS
|
hydroxymethylbilane synthase |
| chr6_+_167325071 | 0.33 |
ENST00000649884.1
ENST00000239587.10 |
TTLL2
|
tubulin tyrosine ligase like 2 |
| chr9_+_78236037 | 0.33 |
ENST00000424347.6
ENST00000645398.1 ENST00000643347.1 ENST00000643273.2 ENST00000647199.1 ENST00000643847.1 ENST00000643499.1 ENST00000415759.6 ENST00000376597.9 ENST00000277082.9 ENST00000642669.1 ENST00000642214.1 ENST00000644208.1 ENST00000376598.3 |
CEP78
|
centrosomal protein 78 |
| chr12_+_122774566 | 0.33 |
ENST00000253079.11
|
CCDC62
|
coiled-coil domain containing 62 |
| chr21_-_30497160 | 0.32 |
ENST00000334058.3
|
KRTAP19-4
|
keratin associated protein 19-4 |
| chr2_-_112255015 | 0.32 |
ENST00000615791.1
ENST00000409573.7 ENST00000272570.9 |
ZC3H8
|
zinc finger CCCH-type containing 8 |
| chr19_+_8052315 | 0.32 |
ENST00000680646.1
|
CCL25
|
C-C motif chemokine ligand 25 |
| chr19_-_51027954 | 0.32 |
ENST00000391804.7
|
KLK11
|
kallikrein related peptidase 11 |
| chr11_-_615921 | 0.32 |
ENST00000348655.11
ENST00000525445.6 ENST00000330243.9 |
IRF7
|
interferon regulatory factor 7 |
| chr1_+_158461574 | 0.32 |
ENST00000641432.1
ENST00000641460.1 ENST00000641535.1 ENST00000641971.1 |
OR10K1
|
olfactory receptor family 10 subfamily K member 1 |
| chr19_+_49388243 | 0.32 |
ENST00000447857.8
|
KASH5
|
KASH domain containing 5 |
| chr22_+_18150162 | 0.32 |
ENST00000215794.8
|
USP18
|
ubiquitin specific peptidase 18 |
| chr16_-_81181312 | 0.32 |
ENST00000527937.1
ENST00000531391.5 |
PKD1L2
|
polycystin 1 like 2 (gene/pseudogene) |
| chr7_-_100436425 | 0.31 |
ENST00000292330.3
|
PPP1R35
|
protein phosphatase 1 regulatory subunit 35 |
| chr15_-_41544243 | 0.31 |
ENST00000567866.5
ENST00000304330.9 ENST00000561603.5 ENST00000566863.1 |
RPAP1
|
RNA polymerase II associated protein 1 |
| chr12_-_7936177 | 0.31 |
ENST00000544291.1
ENST00000075120.12 |
SLC2A3
|
solute carrier family 2 member 3 |
| chr2_-_74465162 | 0.31 |
ENST00000649854.1
ENST00000650523.1 ENST00000649601.1 ENST00000448666.7 ENST00000409065.5 ENST00000414701.1 ENST00000452063.7 ENST00000649075.1 ENST00000648810.1 ENST00000462443.2 |
MOGS
|
mannosyl-oligosaccharide glucosidase |
| chr2_+_219229783 | 0.31 |
ENST00000453432.5
ENST00000409849.5 ENST00000323348.10 ENST00000416565.1 ENST00000410034.7 ENST00000447157.5 |
ANKZF1
|
ankyrin repeat and zinc finger peptidyl tRNA hydrolase 1 |
| chr6_-_32130237 | 0.31 |
ENST00000375156.4
|
FKBPL
|
FKBP prolyl isomerase like |
| chr14_+_24205684 | 0.31 |
ENST00000339917.10
|
TSSK4
|
testis specific serine kinase 4 |
| chr16_-_30382805 | 0.31 |
ENST00000321367.7
ENST00000652617.1 |
SEPTIN1
|
septin 1 |
| chr8_-_144755424 | 0.31 |
ENST00000525191.2
ENST00000292562.12 |
ZNF251
|
zinc finger protein 251 |
| chr1_+_1280436 | 0.31 |
ENST00000379116.10
|
SCNN1D
|
sodium channel epithelial 1 subunit delta |
| chr11_+_125569469 | 0.31 |
ENST00000527842.6
ENST00000278903.11 ENST00000527235.6 |
EI24
|
EI24 autophagy associated transmembrane protein |
| chr22_-_17219571 | 0.31 |
ENST00000610390.4
|
ADA2
|
adenosine deaminase 2 |
| chr8_-_42768781 | 0.31 |
ENST00000276410.7
|
CHRNA6
|
cholinergic receptor nicotinic alpha 6 subunit |
| chr3_-_51903341 | 0.30 |
ENST00000310914.10
|
IQCF1
|
IQ motif containing F1 |
| chr12_-_122266425 | 0.30 |
ENST00000643696.1
ENST00000267199.9 |
VPS33A
|
VPS33A core subunit of CORVET and HOPS complexes |
| chr1_+_156061142 | 0.30 |
ENST00000361084.10
|
RAB25
|
RAB25, member RAS oncogene family |
| chr1_-_23913353 | 0.30 |
ENST00000374472.5
|
CNR2
|
cannabinoid receptor 2 |
| chr1_-_12831410 | 0.30 |
ENST00000619922.1
|
PRAMEF11
|
PRAME family member 11 |
| chr8_+_38404363 | 0.30 |
ENST00000527175.1
|
LETM2
|
leucine zipper and EF-hand containing transmembrane protein 2 |
| chr7_+_144086278 | 0.30 |
ENST00000641592.1
|
OR2A12
|
olfactory receptor family 2 subfamily A member 12 |
| chrX_+_3041471 | 0.29 |
ENST00000381127.6
|
ARSF
|
arylsulfatase F |
| chr19_+_17511606 | 0.29 |
ENST00000252603.7
ENST00000600923.5 |
PGLS
|
6-phosphogluconolactonase |
| chr6_-_99394164 | 0.29 |
ENST00000254759.8
|
COQ3
|
coenzyme Q3, methyltransferase |
| chr1_+_1280588 | 0.29 |
ENST00000338555.6
|
SCNN1D
|
sodium channel epithelial 1 subunit delta |
| chr19_+_57670242 | 0.29 |
ENST00000612521.1
|
ZSCAN4
|
zinc finger and SCAN domain containing 4 |
| chr16_-_28609976 | 0.29 |
ENST00000566189.5
|
SULT1A1
|
sulfotransferase family 1A member 1 |
| chr6_-_31806937 | 0.29 |
ENST00000375661.6
|
LSM2
|
LSM2 homolog, U6 small nuclear RNA and mRNA degradation associated |
| chr3_+_37975773 | 0.29 |
ENST00000436654.1
|
CTDSPL
|
CTD small phosphatase like |
| chr6_-_34105965 | 0.29 |
ENST00000609222.5
|
GRM4
|
glutamate metabotropic receptor 4 |
| chr22_-_41940208 | 0.29 |
ENST00000472374.6
|
CENPM
|
centromere protein M |
| chr19_-_3547306 | 0.29 |
ENST00000589063.5
ENST00000615073.4 |
MFSD12
|
major facilitator superfamily domain containing 12 |
| chr9_-_96302170 | 0.28 |
ENST00000375263.8
|
HSD17B3
|
hydroxysteroid 17-beta dehydrogenase 3 |
| chr1_-_161238196 | 0.28 |
ENST00000367983.9
ENST00000506209.5 ENST00000367980.6 ENST00000628566.2 |
NR1I3
|
nuclear receptor subfamily 1 group I member 3 |
| chr3_+_39384423 | 0.28 |
ENST00000645280.1
ENST00000643672.1 |
SLC25A38
|
solute carrier family 25 member 38 |
Gene Ontology Analysis
Gene overrepresentation in biological process category:
| Log-likelihood per target | Total log-likelihood | Term | Description |
|---|---|---|---|
| 0.3 | 0.9 | GO:1903576 | 'de novo' UMP biosynthetic process(GO:0044205) response to L-arginine(GO:1903576) |
| 0.2 | 0.2 | GO:0016487 | sesquiterpenoid metabolic process(GO:0006714) sesquiterpenoid catabolic process(GO:0016107) farnesol metabolic process(GO:0016487) farnesol catabolic process(GO:0016488) |
| 0.2 | 1.5 | GO:0098989 | NMDA selective glutamate receptor signaling pathway(GO:0098989) |
| 0.2 | 0.8 | GO:0070981 | L-asparagine biosynthetic process(GO:0070981) L-asparagine metabolic process(GO:0070982) |
| 0.2 | 1.0 | GO:0097319 | fructose transport(GO:0015755) fructose import(GO:0032445) carbohydrate import into cell(GO:0097319) carbohydrate import across plasma membrane(GO:0098704) fructose import across plasma membrane(GO:1990539) |
| 0.2 | 0.5 | GO:0036233 | glycine import(GO:0036233) |
| 0.2 | 0.6 | GO:0039534 | negative regulation of MDA-5 signaling pathway(GO:0039534) |
| 0.2 | 0.8 | GO:0043504 | mitochondrial DNA repair(GO:0043504) |
| 0.2 | 1.1 | GO:0006154 | adenosine catabolic process(GO:0006154) inosine biosynthetic process(GO:0046103) |
| 0.1 | 0.4 | GO:0002339 | B cell selection(GO:0002339) |
| 0.1 | 0.1 | GO:0002439 | chronic inflammatory response to antigenic stimulus(GO:0002439) |
| 0.1 | 1.1 | GO:0014056 | acetylcholine secretion, neurotransmission(GO:0014055) regulation of acetylcholine secretion, neurotransmission(GO:0014056) |
| 0.1 | 0.8 | GO:0035803 | egg coat formation(GO:0035803) |
| 0.1 | 0.4 | GO:0032289 | central nervous system myelin formation(GO:0032289) |
| 0.1 | 0.4 | GO:0038178 | complement component C5a signaling pathway(GO:0038178) |
| 0.1 | 0.3 | GO:0001812 | positive regulation of type I hypersensitivity(GO:0001812) |
| 0.1 | 0.6 | GO:0010836 | negative regulation of protein ADP-ribosylation(GO:0010836) |
| 0.1 | 0.5 | GO:0000023 | maltose metabolic process(GO:0000023) |
| 0.1 | 0.3 | GO:0006059 | hexitol metabolic process(GO:0006059) |
| 0.1 | 0.3 | GO:0033037 | polysaccharide localization(GO:0033037) |
| 0.1 | 0.3 | GO:0018160 | peptidyl-pyrromethane cofactor linkage(GO:0018160) |
| 0.1 | 0.4 | GO:0060448 | dichotomous subdivision of terminal units involved in lung branching(GO:0060448) |
| 0.1 | 0.4 | GO:0032661 | regulation of interleukin-18 production(GO:0032661) |
| 0.1 | 0.9 | GO:0061370 | testosterone biosynthetic process(GO:0061370) |
| 0.1 | 0.5 | GO:0071393 | cellular response to progesterone stimulus(GO:0071393) |
| 0.1 | 0.3 | GO:0034476 | U1 snRNA 3'-end processing(GO:0034473) U5 snRNA 3'-end processing(GO:0034476) |
| 0.1 | 1.1 | GO:1900623 | regulation of monocyte aggregation(GO:1900623) positive regulation of monocyte aggregation(GO:1900625) |
| 0.1 | 0.4 | GO:0014886 | transition between slow and fast fiber(GO:0014886) |
| 0.1 | 0.2 | GO:0046203 | spermidine catabolic process(GO:0046203) |
| 0.1 | 0.3 | GO:0070837 | dehydroascorbic acid transport(GO:0070837) |
| 0.1 | 0.6 | GO:0006104 | succinyl-CoA metabolic process(GO:0006104) |
| 0.1 | 0.6 | GO:0031444 | slow-twitch skeletal muscle fiber contraction(GO:0031444) |
| 0.1 | 0.3 | GO:0060474 | positive regulation of sperm motility involved in capacitation(GO:0060474) |
| 0.1 | 0.4 | GO:0090309 | positive regulation of methylation-dependent chromatin silencing(GO:0090309) regulation of DNA demethylation(GO:1901535) negative regulation of DNA demethylation(GO:1901536) |
| 0.1 | 0.3 | GO:0009051 | pentose-phosphate shunt, oxidative branch(GO:0009051) |
| 0.1 | 0.3 | GO:0044805 | late nucleophagy(GO:0044805) |
| 0.1 | 0.2 | GO:0097187 | dentinogenesis(GO:0097187) regulation of sodium-dependent phosphate transport(GO:2000118) |
| 0.1 | 0.4 | GO:0033274 | response to vitamin B2(GO:0033274) heterochromatin maintenance(GO:0070829) |
| 0.1 | 0.1 | GO:0002314 | germinal center B cell differentiation(GO:0002314) |
| 0.1 | 0.5 | GO:0010989 | negative regulation of low-density lipoprotein particle clearance(GO:0010989) |
| 0.1 | 0.1 | GO:0005989 | lactose metabolic process(GO:0005988) lactose biosynthetic process(GO:0005989) |
| 0.1 | 0.2 | GO:0038158 | granulocyte colony-stimulating factor signaling pathway(GO:0038158) |
| 0.1 | 0.6 | GO:0040016 | embryonic cleavage(GO:0040016) |
| 0.1 | 0.3 | GO:0034224 | cellular response to zinc ion starvation(GO:0034224) |
| 0.1 | 0.3 | GO:0035407 | histone H3-T11 phosphorylation(GO:0035407) |
| 0.1 | 0.2 | GO:0070898 | RNA polymerase III transcriptional preinitiation complex assembly(GO:0070898) |
| 0.1 | 0.5 | GO:0072719 | cellular response to cisplatin(GO:0072719) |
| 0.1 | 0.6 | GO:0010890 | positive regulation of sequestering of triglyceride(GO:0010890) |
| 0.1 | 0.2 | GO:0006533 | aspartate catabolic process(GO:0006533) |
| 0.1 | 0.3 | GO:0071630 | nucleus-associated proteasomal ubiquitin-dependent protein catabolic process(GO:0071630) |
| 0.1 | 0.1 | GO:0071623 | negative regulation of granulocyte chemotaxis(GO:0071623) negative regulation of neutrophil chemotaxis(GO:0090024) negative regulation of neutrophil migration(GO:1902623) |
| 0.1 | 0.2 | GO:1902595 | regulation of DNA replication origin binding(GO:1902595) |
| 0.1 | 0.2 | GO:0006391 | transcription initiation from mitochondrial promoter(GO:0006391) |
| 0.1 | 0.4 | GO:0034124 | regulation of MyD88-dependent toll-like receptor signaling pathway(GO:0034124) |
| 0.1 | 0.4 | GO:0097498 | endothelial tube lumen extension(GO:0097498) |
| 0.1 | 0.8 | GO:0015986 | energy coupled proton transport, down electrochemical gradient(GO:0015985) ATP synthesis coupled proton transport(GO:0015986) |
| 0.1 | 0.2 | GO:0009822 | alkaloid catabolic process(GO:0009822) |
| 0.1 | 0.2 | GO:0061536 | glycine secretion(GO:0061536) glycine secretion, neurotransmission(GO:0061537) |
| 0.1 | 2.0 | GO:0034035 | purine ribonucleoside bisphosphate metabolic process(GO:0034035) 3'-phosphoadenosine 5'-phosphosulfate metabolic process(GO:0050427) |
| 0.1 | 0.5 | GO:1903237 | negative regulation of leukocyte tethering or rolling(GO:1903237) |
| 0.1 | 0.1 | GO:1903797 | positive regulation of inorganic anion transmembrane transport(GO:1903797) |
| 0.1 | 0.2 | GO:0048867 | stem cell fate determination(GO:0048867) |
| 0.1 | 0.2 | GO:1900111 | positive regulation of histone H3-K9 dimethylation(GO:1900111) |
| 0.1 | 0.2 | GO:0018016 | N-terminal protein amino acid methylation(GO:0006480) N-terminal peptidyl-alanine methylation(GO:0018011) N-terminal peptidyl-alanine trimethylation(GO:0018012) N-terminal peptidyl-glycine methylation(GO:0018013) N-terminal peptidyl-proline dimethylation(GO:0018016) peptidyl-alanine modification(GO:0018194) N-terminal peptidyl-proline methylation(GO:0035568) N-terminal peptidyl-serine methylation(GO:0035570) N-terminal peptidyl-serine dimethylation(GO:0035572) N-terminal peptidyl-serine trimethylation(GO:0035573) |
| 0.1 | 0.2 | GO:0021503 | neural fold bending(GO:0021503) |
| 0.1 | 0.3 | GO:0042109 | lymphotoxin A production(GO:0032641) lymphotoxin A biosynthetic process(GO:0042109) |
| 0.1 | 0.3 | GO:0042796 | snRNA transcription from RNA polymerase III promoter(GO:0042796) |
| 0.1 | 0.5 | GO:0070315 | positive regulation of satellite cell activation involved in skeletal muscle regeneration(GO:0014718) G1 to G0 transition involved in cell differentiation(GO:0070315) |
| 0.1 | 0.5 | GO:0030951 | establishment or maintenance of microtubule cytoskeleton polarity(GO:0030951) |
| 0.1 | 0.2 | GO:0060672 | epithelial cell differentiation involved in embryonic placenta development(GO:0060671) epithelial cell morphogenesis involved in placental branching(GO:0060672) |
| 0.1 | 0.2 | GO:0045626 | negative regulation of T-helper 1 cell differentiation(GO:0045626) |
| 0.1 | 0.6 | GO:0006268 | DNA unwinding involved in DNA replication(GO:0006268) |
| 0.1 | 0.2 | GO:0061713 | neural crest cell migration involved in heart formation(GO:0003147) anterior neural tube closure(GO:0061713) |
| 0.0 | 0.2 | GO:0060940 | epithelial to mesenchymal transition involved in cardiac fibroblast development(GO:0060940) |
| 0.0 | 0.2 | GO:1900138 | negative regulation of phospholipase A2 activity(GO:1900138) |
| 0.0 | 0.2 | GO:0045658 | regulation of neutrophil differentiation(GO:0045658) negative regulation of neutrophil differentiation(GO:0045659) |
| 0.0 | 0.1 | GO:1990641 | response to iron ion starvation(GO:1990641) |
| 0.0 | 0.3 | GO:0008295 | spermidine biosynthetic process(GO:0008295) |
| 0.0 | 0.4 | GO:0070475 | rRNA base methylation(GO:0070475) |
| 0.0 | 0.2 | GO:0060327 | cytoplasmic actin-based contraction involved in cell motility(GO:0060327) |
| 0.0 | 0.1 | GO:0007079 | mitotic chromosome movement towards spindle pole(GO:0007079) |
| 0.0 | 0.2 | GO:0043988 | histone H3-S28 phosphorylation(GO:0043988) |
| 0.0 | 0.2 | GO:0031291 | Ran protein signal transduction(GO:0031291) |
| 0.0 | 0.2 | GO:0035519 | protein K29-linked ubiquitination(GO:0035519) |
| 0.0 | 0.1 | GO:0034635 | glutathione transport(GO:0034635) tripeptide transport(GO:0042939) |
| 0.0 | 0.1 | GO:1900110 | negative regulation of histone H3-K9 dimethylation(GO:1900110) regulation of TORC2 signaling(GO:1903939) |
| 0.0 | 0.1 | GO:0038193 | thromboxane A2 signaling pathway(GO:0038193) |
| 0.0 | 0.1 | GO:1900377 | negative regulation of melanin biosynthetic process(GO:0048022) negative regulation of secondary metabolite biosynthetic process(GO:1900377) |
| 0.0 | 0.4 | GO:0032264 | IMP salvage(GO:0032264) |
| 0.0 | 0.1 | GO:0006212 | uracil catabolic process(GO:0006212) |
| 0.0 | 0.2 | GO:0072092 | ureteric bud invasion(GO:0072092) |
| 0.0 | 1.3 | GO:0003351 | epithelial cilium movement(GO:0003351) |
| 0.0 | 0.1 | GO:0032929 | negative regulation of superoxide anion generation(GO:0032929) |
| 0.0 | 0.2 | GO:0010032 | meiotic chromosome condensation(GO:0010032) |
| 0.0 | 0.2 | GO:1900041 | negative regulation of interleukin-2 secretion(GO:1900041) |
| 0.0 | 0.9 | GO:0015671 | oxygen transport(GO:0015671) |
| 0.0 | 0.1 | GO:0034729 | histone H3-K79 methylation(GO:0034729) |
| 0.0 | 0.1 | GO:1904172 | regulation of bleb assembly(GO:1904170) positive regulation of bleb assembly(GO:1904172) |
| 0.0 | 0.9 | GO:0019373 | epoxygenase P450 pathway(GO:0019373) |
| 0.0 | 0.1 | GO:1901804 | beta-glucoside metabolic process(GO:1901804) beta-glucoside catabolic process(GO:1901805) positive regulation of neuronal action potential(GO:1904457) |
| 0.0 | 0.3 | GO:0019375 | galactosylceramide biosynthetic process(GO:0006682) galactolipid biosynthetic process(GO:0019375) |
| 0.0 | 0.4 | GO:0072656 | maintenance of protein location in mitochondrion(GO:0072656) |
| 0.0 | 0.2 | GO:0044828 | negative regulation by host of viral genome replication(GO:0044828) |
| 0.0 | 0.2 | GO:0040030 | regulation of molecular function, epigenetic(GO:0040030) |
| 0.0 | 0.0 | GO:0000255 | allantoin metabolic process(GO:0000255) |
| 0.0 | 0.3 | GO:0006390 | transcription from mitochondrial promoter(GO:0006390) |
| 0.0 | 0.1 | GO:0098923 | retrograde trans-synaptic signaling by soluble gas(GO:0098923) trans-synaptic signaling by soluble gas(GO:0099543) |
| 0.0 | 0.1 | GO:0098971 | anterograde dendritic transport of neurotransmitter receptor complex(GO:0098971) |
| 0.0 | 0.4 | GO:0045950 | negative regulation of mitotic recombination(GO:0045950) |
| 0.0 | 0.2 | GO:1902044 | regulation of Fas signaling pathway(GO:1902044) |
| 0.0 | 0.1 | GO:0000454 | snoRNA guided rRNA pseudouridine synthesis(GO:0000454) |
| 0.0 | 0.4 | GO:0002863 | positive regulation of inflammatory response to antigenic stimulus(GO:0002863) |
| 0.0 | 0.2 | GO:2000676 | positive regulation of type B pancreatic cell apoptotic process(GO:2000676) |
| 0.0 | 0.3 | GO:0000066 | mitochondrial ornithine transport(GO:0000066) |
| 0.0 | 0.6 | GO:0018298 | protein-chromophore linkage(GO:0018298) |
| 0.0 | 0.1 | GO:0070634 | transepithelial ammonium transport(GO:0070634) |
| 0.0 | 0.1 | GO:0035513 | oxidative RNA demethylation(GO:0035513) oxidative single-stranded RNA demethylation(GO:0035553) |
| 0.0 | 0.2 | GO:0090206 | negative regulation of cholesterol biosynthetic process(GO:0045541) negative regulation of cholesterol metabolic process(GO:0090206) |
| 0.0 | 0.2 | GO:0070127 | tRNA aminoacylation for mitochondrial protein translation(GO:0070127) |
| 0.0 | 0.1 | GO:0045356 | positive regulation of interferon-alpha biosynthetic process(GO:0045356) |
| 0.0 | 0.3 | GO:0006116 | NADH oxidation(GO:0006116) |
| 0.0 | 0.1 | GO:0046684 | response to pyrethroid(GO:0046684) |
| 0.0 | 0.3 | GO:0045759 | negative regulation of action potential(GO:0045759) |
| 0.0 | 0.3 | GO:0071287 | cellular response to manganese ion(GO:0071287) |
| 0.0 | 0.4 | GO:0010820 | positive regulation of T cell chemotaxis(GO:0010820) |
| 0.0 | 0.3 | GO:0010637 | negative regulation of mitochondrial fusion(GO:0010637) |
| 0.0 | 0.1 | GO:0071596 | ubiquitin-dependent protein catabolic process via the N-end rule pathway(GO:0071596) |
| 0.0 | 0.9 | GO:0002230 | positive regulation of defense response to virus by host(GO:0002230) |
| 0.0 | 0.2 | GO:0002175 | protein localization to paranode region of axon(GO:0002175) |
| 0.0 | 0.5 | GO:0048739 | cardiac muscle fiber development(GO:0048739) |
| 0.0 | 0.2 | GO:1903904 | negative regulation of establishment of T cell polarity(GO:1903904) negative regulation of Rho guanyl-nucleotide exchange factor activity(GO:2001107) |
| 0.0 | 0.1 | GO:0061624 | fructose catabolic process(GO:0006001) fructose catabolic process to hydroxyacetone phosphate and glyceraldehyde-3-phosphate(GO:0061624) |
| 0.0 | 0.2 | GO:0046092 | deoxycytidine metabolic process(GO:0046092) |
| 0.0 | 0.2 | GO:0051012 | microtubule sliding(GO:0051012) |
| 0.0 | 0.2 | GO:0070269 | pyroptosis(GO:0070269) |
| 0.0 | 0.1 | GO:1903998 | regulation of eating behavior(GO:1903998) |
| 0.0 | 0.1 | GO:0036292 | DNA rewinding(GO:0036292) |
| 0.0 | 0.2 | GO:2000049 | positive regulation of cell-cell adhesion mediated by cadherin(GO:2000049) |
| 0.0 | 0.2 | GO:0045586 | regulation of gamma-delta T cell differentiation(GO:0045586) |
| 0.0 | 0.3 | GO:0008063 | Toll signaling pathway(GO:0008063) |
| 0.0 | 0.2 | GO:1900369 | negative regulation of RNA interference(GO:1900369) |
| 0.0 | 0.1 | GO:0019075 | virus maturation(GO:0019075) |
| 0.0 | 0.4 | GO:0060155 | platelet dense granule organization(GO:0060155) |
| 0.0 | 0.7 | GO:0032793 | positive regulation of CREB transcription factor activity(GO:0032793) |
| 0.0 | 0.5 | GO:0035751 | regulation of lysosomal lumen pH(GO:0035751) |
| 0.0 | 0.1 | GO:0032497 | detection of lipopolysaccharide(GO:0032497) |
| 0.0 | 0.1 | GO:0030961 | peptidyl-arginine hydroxylation(GO:0030961) |
| 0.0 | 0.4 | GO:0034497 | protein localization to pre-autophagosomal structure(GO:0034497) |
| 0.0 | 0.2 | GO:0035965 | cardiolipin acyl-chain remodeling(GO:0035965) |
| 0.0 | 0.4 | GO:0000712 | resolution of meiotic recombination intermediates(GO:0000712) |
| 0.0 | 0.1 | GO:0090135 | actin filament branching(GO:0090135) |
| 0.0 | 0.6 | GO:0048240 | sperm capacitation(GO:0048240) |
| 0.0 | 0.4 | GO:1990001 | inhibition of cysteine-type endopeptidase activity involved in apoptotic process(GO:1990001) |
| 0.0 | 0.3 | GO:0017182 | peptidyl-diphthamide metabolic process(GO:0017182) peptidyl-diphthamide biosynthetic process from peptidyl-histidine(GO:0017183) |
| 0.0 | 0.1 | GO:0090070 | positive regulation of ribosome biogenesis(GO:0090070) positive regulation of rRNA processing(GO:2000234) |
| 0.0 | 0.4 | GO:0018026 | peptidyl-lysine monomethylation(GO:0018026) |
| 0.0 | 0.1 | GO:0006477 | protein sulfation(GO:0006477) |
| 0.0 | 0.1 | GO:0031937 | positive regulation of chromatin silencing(GO:0031937) |
| 0.0 | 0.1 | GO:0071879 | positive regulation of adrenergic receptor signaling pathway(GO:0071879) |
| 0.0 | 0.2 | GO:0015705 | iodide transport(GO:0015705) |
| 0.0 | 0.7 | GO:0009235 | cobalamin metabolic process(GO:0009235) |
| 0.0 | 0.6 | GO:0060285 | cilium-dependent cell motility(GO:0060285) |
| 0.0 | 0.1 | GO:0046502 | uroporphyrinogen III biosynthetic process(GO:0006780) uroporphyrinogen III metabolic process(GO:0046502) |
| 0.0 | 0.1 | GO:0036046 | protein demalonylation(GO:0036046) peptidyl-lysine demalonylation(GO:0036047) protein desuccinylation(GO:0036048) peptidyl-lysine desuccinylation(GO:0036049) protein deglutarylation(GO:0061698) peptidyl-lysine deglutarylation(GO:0061699) |
| 0.0 | 0.2 | GO:0006565 | L-serine catabolic process(GO:0006565) |
| 0.0 | 0.1 | GO:0042631 | cellular response to water deprivation(GO:0042631) |
| 0.0 | 0.3 | GO:2000622 | regulation of nuclear-transcribed mRNA catabolic process, nonsense-mediated decay(GO:2000622) negative regulation of nuclear-transcribed mRNA catabolic process, nonsense-mediated decay(GO:2000623) |
| 0.0 | 0.3 | GO:0010566 | regulation of ketone biosynthetic process(GO:0010566) |
| 0.0 | 0.2 | GO:1902416 | positive regulation of mRNA binding(GO:1902416) |
| 0.0 | 0.2 | GO:0000056 | ribosomal small subunit export from nucleus(GO:0000056) |
| 0.0 | 0.2 | GO:1902661 | positive regulation of glucose mediated signaling pathway(GO:1902661) |
| 0.0 | 0.5 | GO:0006516 | glycoprotein catabolic process(GO:0006516) |
| 0.0 | 0.2 | GO:0032020 | ISG15-protein conjugation(GO:0032020) |
| 0.0 | 0.1 | GO:0046116 | queuosine biosynthetic process(GO:0008616) queuosine metabolic process(GO:0046116) |
| 0.0 | 0.0 | GO:0045819 | positive regulation of glycogen catabolic process(GO:0045819) |
| 0.0 | 0.5 | GO:0070816 | phosphorylation of RNA polymerase II C-terminal domain(GO:0070816) |
| 0.0 | 0.0 | GO:0035610 | protein side chain deglutamylation(GO:0035610) |
| 0.0 | 0.1 | GO:0031999 | negative regulation of fatty acid beta-oxidation(GO:0031999) |
| 0.0 | 0.5 | GO:0046599 | regulation of centriole replication(GO:0046599) |
| 0.0 | 0.4 | GO:0003374 | dynamin polymerization involved in membrane fission(GO:0003373) dynamin polymerization involved in mitochondrial fission(GO:0003374) |
| 0.0 | 0.2 | GO:0035609 | C-terminal protein deglutamylation(GO:0035609) |
| 0.0 | 0.3 | GO:0070900 | mitochondrial tRNA modification(GO:0070900) mitochondrial RNA modification(GO:1900864) |
| 0.0 | 0.2 | GO:1900748 | positive regulation of vascular endothelial growth factor signaling pathway(GO:1900748) |
| 0.0 | 0.1 | GO:0035022 | positive regulation of Rac protein signal transduction(GO:0035022) |
| 0.0 | 0.3 | GO:0051873 | killing by host of symbiont cells(GO:0051873) |
| 0.0 | 0.3 | GO:0019317 | fucose catabolic process(GO:0019317) L-fucose metabolic process(GO:0042354) L-fucose catabolic process(GO:0042355) |
| 0.0 | 0.1 | GO:0090666 | scaRNA localization to Cajal body(GO:0090666) |
| 0.0 | 0.1 | GO:0045218 | zonula adherens maintenance(GO:0045218) |
| 0.0 | 0.5 | GO:0006337 | nucleosome disassembly(GO:0006337) |
| 0.0 | 0.1 | GO:1904379 | protein localization to cytosolic proteasome complex(GO:1904327) protein localization to cytosolic proteasome complex involved in ERAD pathway(GO:1904379) |
| 0.0 | 0.1 | GO:0061051 | positive regulation of cell growth involved in cardiac muscle cell development(GO:0061051) |
| 0.0 | 0.2 | GO:0010968 | regulation of microtubule nucleation(GO:0010968) |
| 0.0 | 0.2 | GO:0061469 | regulation of type B pancreatic cell proliferation(GO:0061469) |
| 0.0 | 0.1 | GO:2000297 | negative regulation of synapse maturation(GO:2000297) |
| 0.0 | 0.1 | GO:0032707 | negative regulation of interleukin-23 production(GO:0032707) |
| 0.0 | 0.1 | GO:0010643 | cell communication by chemical coupling(GO:0010643) |
| 0.0 | 0.1 | GO:0042779 | tRNA 3'-trailer cleavage, endonucleolytic(GO:0034414) tRNA 3'-trailer cleavage(GO:0042779) mitochondrial tRNA processing(GO:0090646) mitochondrial tRNA 3'-end processing(GO:1990180) |
| 0.0 | 0.4 | GO:0042832 | defense response to protozoan(GO:0042832) |
| 0.0 | 0.1 | GO:0034970 | histone H3-R2 methylation(GO:0034970) |
| 0.0 | 0.1 | GO:0042791 | 5S class rRNA transcription from RNA polymerase III type 1 promoter(GO:0042791) tRNA transcription from RNA polymerase III promoter(GO:0042797) |
| 0.0 | 0.1 | GO:0043328 | protein targeting to vacuole involved in ubiquitin-dependent protein catabolic process via the multivesicular body sorting pathway(GO:0043328) |
| 0.0 | 0.1 | GO:1904578 | response to thapsigargin(GO:1904578) cellular response to thapsigargin(GO:1904579) |
| 0.0 | 0.1 | GO:1902101 | positive regulation of mitotic metaphase/anaphase transition(GO:0045842) positive regulation of mitotic sister chromatid separation(GO:1901970) positive regulation of metaphase/anaphase transition of cell cycle(GO:1902101) |
| 0.0 | 0.1 | GO:0001878 | response to yeast(GO:0001878) |
| 0.0 | 0.1 | GO:1902731 | ovarian cumulus expansion(GO:0001550) fused antrum stage(GO:0048165) negative regulation of chondrocyte proliferation(GO:1902731) |
| 0.0 | 0.1 | GO:2001270 | regulation of cysteine-type endopeptidase activity involved in execution phase of apoptosis(GO:2001270) |
| 0.0 | 0.1 | GO:0000727 | double-strand break repair via break-induced replication(GO:0000727) |
| 0.0 | 0.1 | GO:0016554 | cytidine to uridine editing(GO:0016554) |
| 0.0 | 0.3 | GO:0007196 | adenylate cyclase-inhibiting G-protein coupled glutamate receptor signaling pathway(GO:0007196) |
| 0.0 | 0.1 | GO:1904729 | regulation of intestinal cholesterol absorption(GO:0030300) regulation of intestinal lipid absorption(GO:1904729) |
| 0.0 | 0.2 | GO:0048251 | elastic fiber assembly(GO:0048251) |
| 0.0 | 0.1 | GO:0097029 | mature conventional dendritic cell differentiation(GO:0097029) |
| 0.0 | 0.3 | GO:0050901 | leukocyte tethering or rolling(GO:0050901) |
| 0.0 | 0.9 | GO:0060314 | regulation of ryanodine-sensitive calcium-release channel activity(GO:0060314) |
| 0.0 | 2.9 | GO:0050911 | detection of chemical stimulus involved in sensory perception of smell(GO:0050911) |
| 0.0 | 0.1 | GO:0060158 | phospholipase C-activating dopamine receptor signaling pathway(GO:0060158) |
| 0.0 | 0.2 | GO:0002291 | T cell activation via T cell receptor contact with antigen bound to MHC molecule on antigen presenting cell(GO:0002291) |
| 0.0 | 0.1 | GO:0045329 | carnitine biosynthetic process(GO:0045329) |
| 0.0 | 0.1 | GO:0031340 | positive regulation of vesicle fusion(GO:0031340) |
| 0.0 | 0.2 | GO:0070535 | histone H2A K63-linked ubiquitination(GO:0070535) |
| 0.0 | 0.1 | GO:0021691 | cerebellar Purkinje cell layer maturation(GO:0021691) |
| 0.0 | 0.3 | GO:0007084 | mitotic nuclear envelope reassembly(GO:0007084) |
| 0.0 | 0.2 | GO:0016540 | protein autoprocessing(GO:0016540) |
| 0.0 | 1.1 | GO:0051693 | actin filament capping(GO:0051693) |
| 0.0 | 0.0 | GO:0090258 | negative regulation of mitochondrial fission(GO:0090258) |
| 0.0 | 0.3 | GO:0070200 | establishment of protein localization to telomere(GO:0070200) |
| 0.0 | 0.3 | GO:0031268 | pseudopodium organization(GO:0031268) |
| 0.0 | 0.1 | GO:0006701 | progesterone biosynthetic process(GO:0006701) |
| 0.0 | 0.1 | GO:0010182 | hexose mediated signaling(GO:0009757) sugar mediated signaling pathway(GO:0010182) glucose mediated signaling pathway(GO:0010255) |
| 0.0 | 0.1 | GO:0072734 | response to staurosporine(GO:0072733) cellular response to staurosporine(GO:0072734) |
| 0.0 | 0.1 | GO:1900425 | negative regulation of defense response to bacterium(GO:1900425) |
| 0.0 | 0.1 | GO:0008218 | bioluminescence(GO:0008218) |
| 0.0 | 0.2 | GO:0019227 | neuronal action potential propagation(GO:0019227) action potential propagation(GO:0098870) |
| 0.0 | 0.0 | GO:0034769 | basement membrane disassembly(GO:0034769) |
| 0.0 | 0.1 | GO:0044245 | polysaccharide digestion(GO:0044245) |
| 0.0 | 0.4 | GO:0006123 | mitochondrial electron transport, cytochrome c to oxygen(GO:0006123) |
| 0.0 | 0.1 | GO:0046340 | diacylglycerol catabolic process(GO:0046340) |
| 0.0 | 0.2 | GO:0007035 | vacuolar acidification(GO:0007035) |
| 0.0 | 0.1 | GO:1904569 | regulation of selenocysteine incorporation(GO:1904569) |
| 0.0 | 0.1 | GO:0060750 | epithelial cell proliferation involved in mammary gland duct elongation(GO:0060750) |
| 0.0 | 0.1 | GO:0006772 | thiamine metabolic process(GO:0006772) |
| 0.0 | 0.2 | GO:0045141 | meiotic telomere clustering(GO:0045141) chromosome localization to nuclear envelope involved in homologous chromosome segregation(GO:0090220) |
| 0.0 | 0.1 | GO:0021914 | negative regulation of smoothened signaling pathway involved in ventral spinal cord patterning(GO:0021914) |
| 0.0 | 0.1 | GO:0038030 | non-canonical Wnt signaling pathway via MAPK cascade(GO:0038030) non-canonical Wnt signaling pathway via JNK cascade(GO:0038031) |
| 0.0 | 0.5 | GO:0061641 | CENP-A containing nucleosome assembly(GO:0034080) CENP-A containing chromatin organization(GO:0061641) |
| 0.0 | 0.3 | GO:0005513 | detection of calcium ion(GO:0005513) |
| 0.0 | 0.3 | GO:0050716 | positive regulation of interleukin-1 secretion(GO:0050716) |
| 0.0 | 0.1 | GO:0043129 | surfactant homeostasis(GO:0043129) |
| 0.0 | 0.0 | GO:0043553 | negative regulation of phosphatidylinositol 3-kinase activity(GO:0043553) |
| 0.0 | 0.1 | GO:0001887 | selenium compound metabolic process(GO:0001887) |
| 0.0 | 0.1 | GO:0018095 | protein polyglutamylation(GO:0018095) |
| 0.0 | 0.0 | GO:2000255 | negative regulation of male germ cell proliferation(GO:2000255) |
| 0.0 | 0.5 | GO:0006270 | DNA replication initiation(GO:0006270) |
| 0.0 | 0.1 | GO:0019856 | 'de novo' pyrimidine nucleobase biosynthetic process(GO:0006207) pyrimidine nucleobase biosynthetic process(GO:0019856) |
| 0.0 | 0.0 | GO:0033499 | galactose catabolic process via UDP-galactose(GO:0033499) |
| 0.0 | 0.1 | GO:0042262 | DNA protection(GO:0042262) |
| 0.0 | 0.2 | GO:0006564 | L-serine biosynthetic process(GO:0006564) |
| 0.0 | 1.0 | GO:0045576 | mast cell activation(GO:0045576) |
| 0.0 | 0.1 | GO:0031468 | nuclear envelope reassembly(GO:0031468) |
| 0.0 | 0.0 | GO:0070221 | succinate transport(GO:0015744) sulfide oxidation(GO:0019418) sulfide oxidation, using sulfide:quinone oxidoreductase(GO:0070221) succinate transmembrane transport(GO:0071422) |
| 0.0 | 0.4 | GO:0006363 | termination of RNA polymerase I transcription(GO:0006363) |
| 0.0 | 0.1 | GO:2000491 | positive regulation of hepatic stellate cell activation(GO:2000491) |
| 0.0 | 0.1 | GO:0035616 | histone H2B conserved C-terminal lysine deubiquitination(GO:0035616) |
| 0.0 | 0.1 | GO:0032490 | detection of molecule of bacterial origin(GO:0032490) |
| 0.0 | 0.2 | GO:0045943 | positive regulation of transcription from RNA polymerase I promoter(GO:0045943) |
| 0.0 | 0.1 | GO:0075525 | viral translational termination-reinitiation(GO:0075525) |
| 0.0 | 0.2 | GO:0006600 | creatine metabolic process(GO:0006600) |
| 0.0 | 0.1 | GO:0071578 | zinc II ion transmembrane import(GO:0071578) |
| 0.0 | 0.3 | GO:0007597 | blood coagulation, intrinsic pathway(GO:0007597) |
| 0.0 | 0.2 | GO:0007021 | tubulin complex assembly(GO:0007021) |
| 0.0 | 0.1 | GO:0000972 | transcription-dependent tethering of RNA polymerase II gene DNA at nuclear periphery(GO:0000972) |
| 0.0 | 0.4 | GO:2000772 | regulation of cellular senescence(GO:2000772) |
| 0.0 | 0.1 | GO:0035457 | cellular response to interferon-alpha(GO:0035457) |
| 0.0 | 0.1 | GO:1900016 | negative regulation of cytokine production involved in inflammatory response(GO:1900016) |
| 0.0 | 0.1 | GO:0070166 | enamel mineralization(GO:0070166) |
| 0.0 | 0.4 | GO:0000185 | activation of MAPKKK activity(GO:0000185) |
| 0.0 | 0.1 | GO:0070164 | negative regulation of adiponectin secretion(GO:0070164) |
| 0.0 | 0.3 | GO:0045577 | regulation of B cell differentiation(GO:0045577) |
| 0.0 | 0.2 | GO:0007095 | mitotic G2 DNA damage checkpoint(GO:0007095) |
| 0.0 | 0.4 | GO:0051482 | positive regulation of cytosolic calcium ion concentration involved in phospholipase C-activating G-protein coupled signaling pathway(GO:0051482) |
| 0.0 | 0.2 | GO:0043248 | proteasome assembly(GO:0043248) |
| 0.0 | 0.1 | GO:1900747 | negative regulation of vascular endothelial growth factor signaling pathway(GO:1900747) negative regulation of cellular response to vascular endothelial growth factor stimulus(GO:1902548) |
| 0.0 | 0.3 | GO:0042104 | positive regulation of activated T cell proliferation(GO:0042104) |
| 0.0 | 0.1 | GO:0030263 | apoptotic chromosome condensation(GO:0030263) |
| 0.0 | 0.0 | GO:0048478 | replication fork protection(GO:0048478) |
| 0.0 | 0.0 | GO:0009698 | phenylpropanoid metabolic process(GO:0009698) coumarin metabolic process(GO:0009804) |
| 0.0 | 0.2 | GO:0051601 | exocyst localization(GO:0051601) |
Gene overrepresentation in cellular component category:
| Log-likelihood per target | Total log-likelihood | Term | Description |
|---|---|---|---|
| 0.3 | 0.8 | GO:0005760 | gamma DNA polymerase complex(GO:0005760) |
| 0.1 | 0.4 | GO:0060342 | photoreceptor inner segment membrane(GO:0060342) |
| 0.1 | 0.5 | GO:0000438 | core TFIIH complex portion of holo TFIIH complex(GO:0000438) |
| 0.1 | 0.7 | GO:0070847 | core mediator complex(GO:0070847) |
| 0.1 | 0.4 | GO:0071817 | MMXD complex(GO:0071817) |
| 0.1 | 1.1 | GO:0035692 | macrophage migration inhibitory factor receptor complex(GO:0035692) |
| 0.1 | 0.9 | GO:0035686 | sperm fibrous sheath(GO:0035686) |
| 0.1 | 0.5 | GO:0009368 | endopeptidase Clp complex(GO:0009368) |
| 0.1 | 0.2 | GO:0000799 | nuclear condensin complex(GO:0000799) |
| 0.1 | 0.2 | GO:0000229 | cytoplasmic chromosome(GO:0000229) |
| 0.1 | 0.5 | GO:0032311 | angiogenin-PRI complex(GO:0032311) |
| 0.1 | 0.6 | GO:0032133 | chromosome passenger complex(GO:0032133) |
| 0.1 | 0.3 | GO:0070876 | SOSS complex(GO:0070876) |
| 0.1 | 0.4 | GO:0002081 | outer acrosomal membrane(GO:0002081) |
| 0.1 | 0.3 | GO:0035363 | histone locus body(GO:0035363) |
| 0.1 | 0.4 | GO:0008622 | epsilon DNA polymerase complex(GO:0008622) |
| 0.1 | 0.6 | GO:0005664 | origin recognition complex(GO:0000808) nuclear origin of replication recognition complex(GO:0005664) |
| 0.0 | 0.5 | GO:0031314 | extrinsic component of mitochondrial inner membrane(GO:0031314) |
| 0.0 | 0.3 | GO:0070545 | PeBoW complex(GO:0070545) |
| 0.0 | 0.3 | GO:1990726 | Lsm1-7-Pat1 complex(GO:1990726) |
| 0.0 | 0.5 | GO:0097486 | multivesicular body lumen(GO:0097486) |
| 0.0 | 0.4 | GO:0000220 | vacuolar proton-transporting V-type ATPase, V0 domain(GO:0000220) |
| 0.0 | 0.7 | GO:0090543 | Flemming body(GO:0090543) |
| 0.0 | 0.3 | GO:0000127 | transcription factor TFIIIC complex(GO:0000127) |
| 0.0 | 0.1 | GO:1905103 | integral component of lysosomal membrane(GO:1905103) |
| 0.0 | 0.1 | GO:0098855 | HCN channel complex(GO:0098855) |
| 0.0 | 0.4 | GO:0097504 | Gemini of coiled bodies(GO:0097504) |
| 0.0 | 0.1 | GO:0005606 | laminin-1 complex(GO:0005606) laminin-10 complex(GO:0043259) |
| 0.0 | 0.2 | GO:0045160 | myosin I complex(GO:0045160) |
| 0.0 | 0.7 | GO:0005861 | troponin complex(GO:0005861) |
| 0.0 | 0.3 | GO:0005638 | lamin filament(GO:0005638) |
| 0.0 | 0.1 | GO:0000811 | GINS complex(GO:0000811) |
| 0.0 | 0.6 | GO:0005885 | Arp2/3 protein complex(GO:0005885) |
| 0.0 | 0.2 | GO:0033165 | interphotoreceptor matrix(GO:0033165) |
| 0.0 | 0.5 | GO:0030123 | AP-3 adaptor complex(GO:0030123) |
| 0.0 | 0.8 | GO:0005892 | acetylcholine-gated channel complex(GO:0005892) |
| 0.0 | 1.0 | GO:0042629 | mast cell granule(GO:0042629) |
| 0.0 | 0.2 | GO:0060171 | stereocilium membrane(GO:0060171) |
| 0.0 | 0.6 | GO:0000786 | nucleosome(GO:0000786) |
| 0.0 | 0.2 | GO:0044530 | supraspliceosomal complex(GO:0044530) |
| 0.0 | 0.4 | GO:0000813 | ESCRT I complex(GO:0000813) |
| 0.0 | 0.1 | GO:0033179 | proton-transporting V-type ATPase, V0 domain(GO:0033179) |
| 0.0 | 0.1 | GO:0072557 | IPAF inflammasome complex(GO:0072557) |
| 0.0 | 0.1 | GO:0001534 | radial spoke(GO:0001534) |
| 0.0 | 0.6 | GO:0031362 | anchored component of external side of plasma membrane(GO:0031362) |
| 0.0 | 0.2 | GO:0034687 | integrin alphaL-beta2 complex(GO:0034687) |
| 0.0 | 0.3 | GO:0070938 | contractile ring(GO:0070938) |
| 0.0 | 0.2 | GO:0036128 | CatSper complex(GO:0036128) |
| 0.0 | 0.1 | GO:0019907 | cyclin-dependent protein kinase activating kinase holoenzyme complex(GO:0019907) |
| 0.0 | 0.2 | GO:0070761 | pre-snoRNP complex(GO:0070761) |
| 0.0 | 0.1 | GO:0046696 | lipopolysaccharide receptor complex(GO:0046696) |
| 0.0 | 0.1 | GO:0031838 | haptoglobin-hemoglobin complex(GO:0031838) |
| 0.0 | 0.3 | GO:0005751 | mitochondrial respiratory chain complex IV(GO:0005751) |
| 0.0 | 0.1 | GO:0000221 | vacuolar proton-transporting V-type ATPase, V1 domain(GO:0000221) |
| 0.0 | 0.2 | GO:0070652 | HAUS complex(GO:0070652) |
| 0.0 | 0.1 | GO:0000814 | ESCRT II complex(GO:0000814) |
| 0.0 | 0.1 | GO:0000408 | EKC/KEOPS complex(GO:0000408) |
| 0.0 | 0.1 | GO:0031313 | extrinsic component of endosome membrane(GO:0031313) |
| 0.0 | 0.5 | GO:0031143 | pseudopodium(GO:0031143) |
| 0.0 | 0.4 | GO:0034045 | pre-autophagosomal structure membrane(GO:0034045) |
| 0.0 | 0.1 | GO:1990745 | EARP complex(GO:1990745) |
| 0.0 | 0.1 | GO:1990604 | IRE1-TRAF2-ASK1 complex(GO:1990604) |
| 0.0 | 0.8 | GO:0030673 | axolemma(GO:0030673) |
| 0.0 | 0.1 | GO:1990130 | Iml1 complex(GO:1990130) |
| 0.0 | 0.1 | GO:0000138 | Golgi trans cisterna(GO:0000138) |
| 0.0 | 0.3 | GO:0005832 | chaperonin-containing T-complex(GO:0005832) |
| 0.0 | 0.2 | GO:0097512 | cardiac myofibril(GO:0097512) |
| 0.0 | 0.1 | GO:0070522 | ERCC4-ERCC1 complex(GO:0070522) |
| 0.0 | 0.1 | GO:0001651 | dense fibrillar component(GO:0001651) |
| 0.0 | 0.3 | GO:0046930 | pore complex(GO:0046930) |
| 0.0 | 0.4 | GO:0097228 | sperm principal piece(GO:0097228) |
| 0.0 | 0.2 | GO:0035327 | transcriptionally active chromatin(GO:0035327) |
| 0.0 | 0.2 | GO:0032039 | integrator complex(GO:0032039) |
| 0.0 | 0.2 | GO:0005642 | annulate lamellae(GO:0005642) |
| 0.0 | 0.0 | GO:0033593 | BRCA2-MAGE-D1 complex(GO:0033593) |
| 0.0 | 0.2 | GO:0017119 | Golgi transport complex(GO:0017119) |
| 0.0 | 0.1 | GO:0032299 | ribonuclease H2 complex(GO:0032299) |
| 0.0 | 0.1 | GO:0005658 | alpha DNA polymerase:primase complex(GO:0005658) |
| 0.0 | 0.0 | GO:1990876 | cytoplasmic side of nuclear pore(GO:1990876) |
| 0.0 | 0.1 | GO:0070449 | elongin complex(GO:0070449) |
| 0.0 | 0.2 | GO:0043186 | P granule(GO:0043186) pole plasm(GO:0045495) germ plasm(GO:0060293) |
| 0.0 | 0.0 | GO:0030678 | mitochondrial ribonuclease P complex(GO:0030678) |
| 0.0 | 0.8 | GO:0019005 | SCF ubiquitin ligase complex(GO:0019005) |
| 0.0 | 0.3 | GO:0043194 | axon initial segment(GO:0043194) |
| 0.0 | 0.2 | GO:0033391 | chromatoid body(GO:0033391) |
| 0.0 | 0.1 | GO:0005589 | collagen type VI trimer(GO:0005589) collagen beaded filament(GO:0098647) |
| 0.0 | 0.2 | GO:0000177 | cytoplasmic exosome (RNase complex)(GO:0000177) |
| 0.0 | 0.3 | GO:1990124 | messenger ribonucleoprotein complex(GO:1990124) |
Gene overrepresentation in molecular function category:
| Log-likelihood per target | Total log-likelihood | Term | Description |
|---|---|---|---|
| 0.3 | 1.3 | GO:0047685 | amine sulfotransferase activity(GO:0047685) |
| 0.2 | 0.2 | GO:0045550 | geranylgeranyl reductase activity(GO:0045550) |
| 0.2 | 1.0 | GO:0004882 | androgen receptor activity(GO:0004882) |
| 0.2 | 1.0 | GO:0005353 | fructose transmembrane transporter activity(GO:0005353) |
| 0.2 | 0.5 | GO:0004339 | glucan 1,4-alpha-glucosidase activity(GO:0004339) |
| 0.2 | 0.5 | GO:0032090 | Pyrin domain binding(GO:0032090) |
| 0.2 | 0.8 | GO:0004066 | asparagine synthase (glutamine-hydrolyzing) activity(GO:0004066) |
| 0.2 | 0.8 | GO:0016890 | site-specific endodeoxyribonuclease activity, specific for altered base(GO:0016890) |
| 0.1 | 0.6 | GO:0051734 | ATP-dependent polydeoxyribonucleotide 5'-hydroxyl-kinase activity(GO:0046404) polydeoxyribonucleotide kinase activity(GO:0051733) ATP-dependent polynucleotide kinase activity(GO:0051734) |
| 0.1 | 0.7 | GO:0016635 | oxidoreductase activity, acting on the CH-CH group of donors, quinone or related compound as acceptor(GO:0016635) |
| 0.1 | 0.8 | GO:0047894 | flavonol 3-sulfotransferase activity(GO:0047894) |
| 0.1 | 0.9 | GO:0015057 | thrombin receptor activity(GO:0015057) |
| 0.1 | 0.9 | GO:0047045 | testosterone 17-beta-dehydrogenase (NADP+) activity(GO:0047045) |
| 0.1 | 0.4 | GO:0004878 | complement component C5a receptor activity(GO:0004878) |
| 0.1 | 0.3 | GO:0004611 | phosphoenolpyruvate carboxykinase activity(GO:0004611) phosphoenolpyruvate carboxykinase (GTP) activity(GO:0004613) |
| 0.1 | 1.1 | GO:0004062 | aryl sulfotransferase activity(GO:0004062) |
| 0.1 | 0.3 | GO:0004418 | hydroxymethylbilane synthase activity(GO:0004418) |
| 0.1 | 1.1 | GO:0031685 | adenosine receptor binding(GO:0031685) |
| 0.1 | 0.4 | GO:0008169 | C-methyltransferase activity(GO:0008169) |
| 0.1 | 0.6 | GO:0031735 | CCR10 chemokine receptor binding(GO:0031735) |
| 0.1 | 0.3 | GO:0098640 | integrin binding involved in cell-matrix adhesion(GO:0098640) |
| 0.1 | 0.5 | GO:0022850 | serotonin-gated cation channel activity(GO:0022850) |
| 0.1 | 0.8 | GO:0032190 | acrosin binding(GO:0032190) |
| 0.1 | 0.3 | GO:0033300 | dehydroascorbic acid transporter activity(GO:0033300) |
| 0.1 | 0.3 | GO:0004949 | cannabinoid receptor activity(GO:0004949) |
| 0.1 | 0.3 | GO:0017057 | 6-phosphogluconolactonase activity(GO:0017057) |
| 0.1 | 0.4 | GO:0004489 | methylenetetrahydrofolate reductase (NAD(P)H) activity(GO:0004489) |
| 0.1 | 0.3 | GO:0004991 | parathyroid hormone receptor activity(GO:0004991) |
| 0.1 | 0.3 | GO:0035402 | histone kinase activity (H3-T11 specific)(GO:0035402) |
| 0.1 | 1.0 | GO:0001730 | 2'-5'-oligoadenylate synthetase activity(GO:0001730) |
| 0.1 | 0.2 | GO:0043035 | chromatin insulator sequence binding(GO:0043035) |
| 0.1 | 0.2 | GO:0000992 | polymerase III regulatory region sequence-specific DNA binding(GO:0000992) RNA polymerase III type 1 promoter sequence-specific DNA binding(GO:0001002) RNA polymerase III type 2 promoter sequence-specific DNA binding(GO:0001003) RNA polymerase III transcription factor activity, sequence-specific DNA binding(GO:0001034) |
| 0.1 | 0.2 | GO:0035727 | lysophosphatidic acid binding(GO:0035727) |
| 0.1 | 0.2 | GO:0004766 | spermidine synthase activity(GO:0004766) |
| 0.1 | 0.5 | GO:0031802 | type 5 metabotropic glutamate receptor binding(GO:0031802) |
| 0.1 | 0.2 | GO:0070643 | vitamin D3 25-hydroxylase activity(GO:0030343) vitamin D 25-hydroxylase activity(GO:0070643) |
| 0.1 | 0.6 | GO:0050694 | galactosylceramide sulfotransferase activity(GO:0001733) galactose 3-O-sulfotransferase activity(GO:0050694) |
| 0.1 | 0.2 | GO:0004335 | galactokinase activity(GO:0004335) |
| 0.1 | 0.7 | GO:0015187 | glycine transmembrane transporter activity(GO:0015187) |
| 0.1 | 0.2 | GO:0071885 | N-terminal protein N-methyltransferase activity(GO:0071885) |
| 0.1 | 0.2 | GO:0019166 | 2,4-dienoyl-CoA reductase (NADPH) activity(GO:0008670) trans-2-enoyl-CoA reductase (NADPH) activity(GO:0019166) |
| 0.1 | 0.3 | GO:0030395 | lactose binding(GO:0030395) |
| 0.1 | 0.3 | GO:0005502 | 11-cis retinal binding(GO:0005502) |
| 0.0 | 0.2 | GO:0016936 | galactoside binding(GO:0016936) |
| 0.0 | 0.6 | GO:0031014 | troponin T binding(GO:0031014) |
| 0.0 | 0.2 | GO:0015111 | iodide transmembrane transporter activity(GO:0015111) |
| 0.0 | 0.4 | GO:0003876 | AMP deaminase activity(GO:0003876) adenosine-phosphate deaminase activity(GO:0047623) |
| 0.0 | 0.9 | GO:0008391 | arachidonic acid monooxygenase activity(GO:0008391) arachidonic acid epoxygenase activity(GO:0008392) |
| 0.0 | 0.3 | GO:0050659 | N-acetylgalactosamine 4-sulfate 6-O-sulfotransferase activity(GO:0050659) |
| 0.0 | 0.2 | GO:0017159 | pantetheine hydrolase activity(GO:0017159) |
| 0.0 | 0.9 | GO:0005344 | oxygen transporter activity(GO:0005344) |
| 0.0 | 0.4 | GO:0043139 | 5'-3' DNA helicase activity(GO:0043139) |
| 0.0 | 0.1 | GO:0004960 | thromboxane receptor activity(GO:0004960) thromboxane A2 receptor activity(GO:0004961) |
| 0.0 | 0.5 | GO:0008428 | ribonuclease inhibitor activity(GO:0008428) |
| 0.0 | 0.1 | GO:0004157 | dihydropyrimidinase activity(GO:0004157) |
| 0.0 | 0.4 | GO:0070097 | delta-catenin binding(GO:0070097) |
| 0.0 | 0.2 | GO:1904492 | Ac-Asp-Glu binding(GO:1904492) tetrahydrofolyl-poly(glutamate) polymer binding(GO:1904493) |
| 0.0 | 0.1 | GO:0003896 | DNA primase activity(GO:0003896) |
| 0.0 | 0.2 | GO:1902444 | riboflavin binding(GO:1902444) |
| 0.0 | 0.2 | GO:0003831 | beta-N-acetylglucosaminylglycopeptide beta-1,4-galactosyltransferase activity(GO:0003831) |
| 0.0 | 0.1 | GO:0004348 | glucosylceramidase activity(GO:0004348) |
| 0.0 | 0.6 | GO:0003688 | DNA replication origin binding(GO:0003688) |
| 0.0 | 0.4 | GO:0089720 | caspase binding(GO:0089720) |
| 0.0 | 0.6 | GO:0009881 | photoreceptor activity(GO:0009881) |
| 0.0 | 0.1 | GO:0061714 | folic acid receptor activity(GO:0061714) |
| 0.0 | 0.1 | GO:1903135 | cupric ion binding(GO:1903135) |
| 0.0 | 0.4 | GO:0008310 | single-stranded DNA 3'-5' exodeoxyribonuclease activity(GO:0008310) |
| 0.0 | 0.6 | GO:0016290 | palmitoyl-CoA hydrolase activity(GO:0016290) |
| 0.0 | 0.1 | GO:0035515 | oxidative RNA demethylase activity(GO:0035515) |
| 0.0 | 0.1 | GO:0004461 | lactose synthase activity(GO:0004461) |
| 0.0 | 0.1 | GO:0003941 | L-serine ammonia-lyase activity(GO:0003941) |
| 0.0 | 1.0 | GO:0008656 | cysteine-type endopeptidase activator activity involved in apoptotic process(GO:0008656) |
| 0.0 | 0.3 | GO:0004396 | glucokinase activity(GO:0004340) hexokinase activity(GO:0004396) fructokinase activity(GO:0008865) mannokinase activity(GO:0019158) |
| 0.0 | 0.1 | GO:0016503 | pheromone receptor activity(GO:0016503) |
| 0.0 | 0.4 | GO:0070915 | lysophosphatidic acid receptor activity(GO:0070915) |
| 0.0 | 0.1 | GO:0097677 | STAT family protein binding(GO:0097677) |
| 0.0 | 0.3 | GO:0001162 | RNA polymerase II intronic transcription regulatory region sequence-specific DNA binding(GO:0001162) |
| 0.0 | 0.2 | GO:0004647 | phosphoserine phosphatase activity(GO:0004647) |
| 0.0 | 0.4 | GO:0004865 | protein serine/threonine phosphatase inhibitor activity(GO:0004865) |
| 0.0 | 0.3 | GO:0008269 | JAK pathway signal transduction adaptor activity(GO:0008269) |
| 0.0 | 0.3 | GO:0019863 | IgE binding(GO:0019863) |
| 0.0 | 0.4 | GO:0052650 | NADP-retinol dehydrogenase activity(GO:0052650) |
| 0.0 | 0.3 | GO:0000064 | L-ornithine transmembrane transporter activity(GO:0000064) |
| 0.0 | 0.2 | GO:0042296 | ISG15 transferase activity(GO:0042296) |
| 0.0 | 0.4 | GO:0070087 | chromo shadow domain binding(GO:0070087) |
| 0.0 | 0.2 | GO:0044547 | DNA topoisomerase binding(GO:0044547) |
| 0.0 | 0.2 | GO:0001875 | lipopolysaccharide receptor activity(GO:0001875) |
| 0.0 | 0.1 | GO:0052739 | phosphatidylserine 1-acylhydrolase activity(GO:0052739) |
| 0.0 | 0.2 | GO:0019237 | centromeric DNA binding(GO:0019237) |
| 0.0 | 0.5 | GO:0015280 | ligand-gated sodium channel activity(GO:0015280) |
| 0.0 | 1.2 | GO:0005540 | hyaluronic acid binding(GO:0005540) |
| 0.0 | 0.3 | GO:0001135 | transcription factor activity, RNA polymerase II transcription factor recruiting(GO:0001135) |
| 0.0 | 0.3 | GO:0070740 | tubulin-glutamic acid ligase activity(GO:0070740) |
| 0.0 | 0.2 | GO:0005166 | neurotrophin p75 receptor binding(GO:0005166) |
| 0.0 | 0.1 | GO:0031826 | type 2A serotonin receptor binding(GO:0031826) |
| 0.0 | 0.3 | GO:0046920 | alpha-(1->3)-fucosyltransferase activity(GO:0046920) |
| 0.0 | 0.2 | GO:0047184 | 1-acylglycerophosphocholine O-acyltransferase activity(GO:0047184) |
| 0.0 | 0.4 | GO:0015926 | glucosidase activity(GO:0015926) |
| 0.0 | 0.2 | GO:0004137 | deoxycytidine kinase activity(GO:0004137) thymidine kinase activity(GO:0004797) |
| 0.0 | 0.2 | GO:0035174 | histone serine kinase activity(GO:0035174) |
| 0.0 | 0.1 | GO:0047223 | beta-1,3-galactosyl-O-glycosyl-glycoprotein beta-1,3-N-acetylglucosaminyltransferase activity(GO:0047223) |
| 0.0 | 0.8 | GO:0003887 | DNA-directed DNA polymerase activity(GO:0003887) |
| 0.0 | 0.5 | GO:0008353 | RNA polymerase II carboxy-terminal domain kinase activity(GO:0008353) |
| 0.0 | 0.1 | GO:0004852 | uroporphyrinogen-III synthase activity(GO:0004852) |
| 0.0 | 0.1 | GO:0036055 | protein-malonyllysine demalonylase activity(GO:0036054) protein-succinyllysine desuccinylase activity(GO:0036055) protein-glutaryllysine deglutarylase activity(GO:0061697) |
| 0.0 | 0.1 | GO:0035673 | oligopeptide transmembrane transporter activity(GO:0035673) |
| 0.0 | 0.2 | GO:0004969 | histamine receptor activity(GO:0004969) |
| 0.0 | 0.2 | GO:0043142 | single-stranded DNA-dependent ATPase activity(GO:0043142) |
| 0.0 | 0.1 | GO:0004419 | hydroxymethylglutaryl-CoA lyase activity(GO:0004419) |
| 0.0 | 0.1 | GO:0034512 | box C/D snoRNA binding(GO:0034512) |
| 0.0 | 0.5 | GO:0001965 | G-protein alpha-subunit binding(GO:0001965) |
| 0.0 | 0.7 | GO:0046961 | ATPase activity, coupled to transmembrane movement of ions, rotational mechanism(GO:0044769) proton-transporting ATPase activity, rotational mechanism(GO:0046961) |
| 0.0 | 0.1 | GO:0050119 | N-acetylglucosamine deacetylase activity(GO:0050119) |
| 0.0 | 0.4 | GO:0099589 | serotonin receptor activity(GO:0099589) |
| 0.0 | 0.2 | GO:0015321 | sodium-dependent phosphate transmembrane transporter activity(GO:0015321) |
| 0.0 | 0.2 | GO:0050682 | AF-2 domain binding(GO:0050682) |
| 0.0 | 0.5 | GO:0031432 | titin binding(GO:0031432) |
| 0.0 | 0.1 | GO:0005222 | intracellular cAMP activated cation channel activity(GO:0005222) |
| 0.0 | 0.3 | GO:0030274 | LIM domain binding(GO:0030274) |
| 0.0 | 0.2 | GO:0010340 | carboxyl-O-methyltransferase activity(GO:0010340) protein carboxyl O-methyltransferase activity(GO:0051998) |
| 0.0 | 0.1 | GO:0004694 | eukaryotic translation initiation factor 2alpha kinase activity(GO:0004694) |
| 0.0 | 0.5 | GO:0004697 | protein kinase C activity(GO:0004697) |
| 0.0 | 0.1 | GO:0005499 | vitamin D binding(GO:0005499) |
| 0.0 | 0.0 | GO:0018685 | alkane 1-monooxygenase activity(GO:0018685) |
| 0.0 | 0.4 | GO:0017070 | U6 snRNA binding(GO:0017070) |
| 0.0 | 0.1 | GO:0035473 | lipase binding(GO:0035473) |
| 0.0 | 0.2 | GO:0034485 | phosphatidylinositol-3,4,5-trisphosphate 5-phosphatase activity(GO:0034485) |
| 0.0 | 0.1 | GO:0033878 | hormone-sensitive lipase activity(GO:0033878) |
| 0.0 | 0.2 | GO:0030368 | interleukin-17 receptor activity(GO:0030368) |
| 0.0 | 0.1 | GO:0001165 | RNA polymerase I upstream control element sequence-specific DNA binding(GO:0001165) |
| 0.0 | 0.1 | GO:0004630 | phospholipase D activity(GO:0004630) |
| 0.0 | 0.1 | GO:0042781 | 3'-tRNA processing endoribonuclease activity(GO:0042781) |
| 0.0 | 0.2 | GO:0030369 | ICAM-3 receptor activity(GO:0030369) |
| 0.0 | 0.1 | GO:0070290 | N-acylphosphatidylethanolamine-specific phospholipase D activity(GO:0070290) |
| 0.0 | 0.1 | GO:0043237 | laminin-1 binding(GO:0043237) |
| 0.0 | 0.3 | GO:0001222 | transcription corepressor binding(GO:0001222) |
| 0.0 | 0.1 | GO:0050571 | 1,5-anhydro-D-fructose reductase activity(GO:0050571) |
| 0.0 | 0.0 | GO:0019150 | D-ribulokinase activity(GO:0019150) |
| 0.0 | 0.3 | GO:0008494 | translation activator activity(GO:0008494) |
| 0.0 | 0.0 | GO:0015140 | malate transmembrane transporter activity(GO:0015140) |
| 0.0 | 0.2 | GO:0030215 | semaphorin receptor binding(GO:0030215) |
| 0.0 | 0.1 | GO:0004775 | succinate-CoA ligase (ADP-forming) activity(GO:0004775) |
| 0.0 | 0.3 | GO:0098505 | G-rich strand telomeric DNA binding(GO:0098505) |
| 0.0 | 0.0 | GO:0032427 | GBD domain binding(GO:0032427) |
| 0.0 | 0.2 | GO:0004065 | arylsulfatase activity(GO:0004065) |
| 0.0 | 2.5 | GO:0004984 | olfactory receptor activity(GO:0004984) |
| 0.0 | 0.1 | GO:1990599 | 3' overhang single-stranded DNA endodeoxyribonuclease activity(GO:1990599) |
| 0.0 | 0.0 | GO:0004165 | dodecenoyl-CoA delta-isomerase activity(GO:0004165) |
| 0.0 | 0.9 | GO:0042169 | SH2 domain binding(GO:0042169) |
| 0.0 | 0.1 | GO:0071535 | RING-like zinc finger domain binding(GO:0071535) |
| 0.0 | 0.1 | GO:0004046 | aminoacylase activity(GO:0004046) |
| 0.0 | 0.1 | GO:0035241 | protein-arginine omega-N monomethyltransferase activity(GO:0035241) |
| 0.0 | 0.0 | GO:0005275 | amine transmembrane transporter activity(GO:0005275) |
| 0.0 | 0.1 | GO:0046624 | sphingolipid transporter activity(GO:0046624) |
| 0.0 | 0.2 | GO:0005522 | profilin binding(GO:0005522) |
| 0.0 | 1.1 | GO:0005544 | calcium-dependent phospholipid binding(GO:0005544) |
| 0.0 | 0.1 | GO:0004727 | prenylated protein tyrosine phosphatase activity(GO:0004727) |
| 0.0 | 0.1 | GO:0004499 | N,N-dimethylaniline monooxygenase activity(GO:0004499) |
| 0.0 | 0.1 | GO:0038052 | RNA polymerase II transcription factor activity, estrogen-activated sequence-specific DNA binding(GO:0038052) |
| 0.0 | 0.1 | GO:1990050 | phosphatidic acid transporter activity(GO:1990050) |
| 0.0 | 0.1 | GO:0009041 | uridylate kinase activity(GO:0009041) |
| 0.0 | 0.1 | GO:0030614 | oxidoreductase activity, acting on phosphorus or arsenic in donors(GO:0030613) oxidoreductase activity, acting on phosphorus or arsenic in donors, disulfide as acceptor(GO:0030614) |
| 0.0 | 0.0 | GO:0004301 | epoxide hydrolase activity(GO:0004301) |
| 0.0 | 0.1 | GO:0016494 | C-X-C chemokine receptor activity(GO:0016494) |
| 0.0 | 0.0 | GO:0099609 | microtubule lateral binding(GO:0099609) |
| 0.0 | 1.0 | GO:0030374 | ligand-dependent nuclear receptor transcription coactivator activity(GO:0030374) |
| 0.0 | 0.2 | GO:0070628 | proteasome binding(GO:0070628) |
| 0.0 | 0.3 | GO:0070006 | metalloaminopeptidase activity(GO:0070006) |
| 0.0 | 0.2 | GO:0016813 | hydrolase activity, acting on carbon-nitrogen (but not peptide) bonds, in linear amidines(GO:0016813) |
| 0.0 | 0.1 | GO:0051022 | GDP-dissociation inhibitor binding(GO:0051021) Rho GDP-dissociation inhibitor binding(GO:0051022) |
| 0.0 | 0.3 | GO:0022848 | acetylcholine-gated cation channel activity(GO:0022848) |
| 0.0 | 0.1 | GO:0008121 | ubiquinol-cytochrome-c reductase activity(GO:0008121) oxidoreductase activity, acting on diphenols and related substances as donors, cytochrome as acceptor(GO:0016681) |
| 0.0 | 0.1 | GO:0086006 | voltage-gated sodium channel activity involved in cardiac muscle cell action potential(GO:0086006) |
| 0.0 | 0.1 | GO:0015315 | hexose phosphate transmembrane transporter activity(GO:0015119) organophosphate:inorganic phosphate antiporter activity(GO:0015315) hexose-phosphate:inorganic phosphate antiporter activity(GO:0015526) glucose 6-phosphate:inorganic phosphate antiporter activity(GO:0061513) |
| 0.0 | 0.2 | GO:0001163 | RNA polymerase I regulatory region DNA binding(GO:0001013) RNA polymerase I regulatory region sequence-specific DNA binding(GO:0001163) RNA polymerase I CORE element sequence-specific DNA binding(GO:0001164) |
| 0.0 | 0.3 | GO:0005092 | GDP-dissociation inhibitor activity(GO:0005092) |
| 0.0 | 0.1 | GO:0043138 | 3'-5' DNA helicase activity(GO:0043138) |
| 0.0 | 0.0 | GO:0005136 | interleukin-4 receptor binding(GO:0005136) |
| 0.0 | 0.4 | GO:0015269 | calcium-activated potassium channel activity(GO:0015269) |
| 0.0 | 1.5 | GO:0036459 | thiol-dependent ubiquitinyl hydrolase activity(GO:0036459) |
| 0.0 | 0.1 | GO:0001849 | complement component C1q binding(GO:0001849) |
| 0.0 | 0.1 | GO:0005025 | transforming growth factor beta receptor activity, type I(GO:0005025) |
| 0.0 | 0.1 | GO:0045545 | syndecan binding(GO:0045545) |
| 0.0 | 0.2 | GO:0050786 | RAGE receptor binding(GO:0050786) |
| 0.0 | 0.4 | GO:0005385 | zinc ion transmembrane transporter activity(GO:0005385) |
Gene overrepresentation in curated gene sets: canonical pathways category:
| Log-likelihood per target | Total log-likelihood | Term | Description |
|---|---|---|---|
| 0.1 | 0.1 | PID CXCR3 PATHWAY | CXCR3-mediated signaling events |
| 0.1 | 0.2 | SA CASPASE CASCADE | Apoptosis is mediated by caspases, cysteine proteases arranged in a proteolytic cascade. |
| 0.0 | 0.1 | ST GAQ PATHWAY | G alpha q Pathway |
| 0.0 | 0.5 | PID THROMBIN PAR4 PATHWAY | PAR4-mediated thrombin signaling events |
| 0.0 | 0.3 | ST PAC1 RECEPTOR PATHWAY | PAC1 Receptor Pathway |
| 0.0 | 0.2 | SIG PIP3 SIGNALING IN CARDIAC MYOCTES | Genes related to PIP3 signaling in cardiac myocytes |
| 0.0 | 0.6 | PID DNA PK PATHWAY | DNA-PK pathway in nonhomologous end joining |
| 0.0 | 0.3 | PID IL2 1PATHWAY | IL2-mediated signaling events |
| 0.0 | 0.3 | PID P38 GAMMA DELTA PATHWAY | Signaling mediated by p38-gamma and p38-delta |
| 0.0 | 1.1 | PID ATR PATHWAY | ATR signaling pathway |
| 0.0 | 0.3 | PID INTEGRIN5 PATHWAY | Beta5 beta6 beta7 and beta8 integrin cell surface interactions |
| 0.0 | 0.2 | PID P38 MKK3 6PATHWAY | p38 MAPK signaling pathway |
| 0.0 | 0.2 | ST JAK STAT PATHWAY | Jak-STAT Pathway |
| 0.0 | 0.9 | PID AVB3 OPN PATHWAY | Osteopontin-mediated events |
| 0.0 | 0.1 | PID RETINOIC ACID PATHWAY | Retinoic acid receptors-mediated signaling |
| 0.0 | 0.1 | PID TXA2PATHWAY | Thromboxane A2 receptor signaling |
| 0.0 | 0.8 | PID FOXM1 PATHWAY | FOXM1 transcription factor network |
| 0.0 | 0.1 | ST STAT3 PATHWAY | STAT3 Pathway |
| 0.0 | 0.3 | PID SMAD2 3PATHWAY | Regulation of cytoplasmic and nuclear SMAD2/3 signaling |
| 0.0 | 0.3 | PID VEGFR1 2 PATHWAY | Signaling events mediated by VEGFR1 and VEGFR2 |
| 0.0 | 0.8 | PID HNF3A PATHWAY | FOXA1 transcription factor network |
| 0.0 | 0.2 | PID RANBP2 PATHWAY | Sumoylation by RanBP2 regulates transcriptional repression |
Gene overrepresentation in curated gene sets: REACTOME pathways category:
| Log-likelihood per target | Total log-likelihood | Term | Description |
|---|---|---|---|
| 0.1 | 3.3 | REACTOME CYTOSOLIC SULFONATION OF SMALL MOLECULES | Genes involved in Cytosolic sulfonation of small molecules |
| 0.1 | 0.9 | REACTOME ANDROGEN BIOSYNTHESIS | Genes involved in Androgen biosynthesis |
| 0.1 | 1.1 | REACTOME XENOBIOTICS | Genes involved in Xenobiotics |
| 0.1 | 1.3 | REACTOME FACILITATIVE NA INDEPENDENT GLUCOSE TRANSPORTERS | Genes involved in Facilitative Na+-independent glucose transporters |
| 0.1 | 0.8 | REACTOME REMOVAL OF THE FLAP INTERMEDIATE FROM THE C STRAND | Genes involved in Removal of the Flap Intermediate from the C-strand |
| 0.1 | 0.4 | REACTOME REPAIR SYNTHESIS FOR GAP FILLING BY DNA POL IN TC NER | Genes involved in Repair synthesis for gap-filling by DNA polymerase in TC-NER |
| 0.0 | 0.6 | REACTOME DIGESTION OF DIETARY CARBOHYDRATE | Genes involved in Digestion of dietary carbohydrate |
| 0.0 | 1.6 | REACTOME HORMONE SENSITIVE LIPASE HSL MEDIATED TRIACYLGLYCEROL HYDROLYSIS | Genes involved in Hormone-sensitive lipase (HSL)-mediated triacylglycerol hydrolysis |
| 0.0 | 0.1 | REACTOME THROMBOXANE SIGNALLING THROUGH TP RECEPTOR | Genes involved in Thromboxane signalling through TP receptor |
| 0.0 | 0.7 | REACTOME PLATELET ADHESION TO EXPOSED COLLAGEN | Genes involved in Platelet Adhesion to exposed collagen |
| 0.0 | 0.7 | REACTOME UNWINDING OF DNA | Genes involved in Unwinding of DNA |
| 0.0 | 0.8 | REACTOME PRESYNAPTIC NICOTINIC ACETYLCHOLINE RECEPTORS | Genes involved in Presynaptic nicotinic acetylcholine receptors |
| 0.0 | 0.9 | REACTOME NUCLEOTIDE LIKE PURINERGIC RECEPTORS | Genes involved in Nucleotide-like (purinergic) receptors |
| 0.0 | 0.9 | REACTOME AMINO ACID SYNTHESIS AND INTERCONVERSION TRANSAMINATION | Genes involved in Amino acid synthesis and interconversion (transamination) |
| 0.0 | 0.9 | REACTOME FORMATION OF INCISION COMPLEX IN GG NER | Genes involved in Formation of incision complex in GG-NER |
| 0.0 | 0.6 | REACTOME HYALURONAN UPTAKE AND DEGRADATION | Genes involved in Hyaluronan uptake and degradation |
| 0.0 | 0.3 | REACTOME TRAF6 MEDIATED IRF7 ACTIVATION IN TLR7 8 OR 9 SIGNALING | Genes involved in TRAF6 mediated IRF7 activation in TLR7/8 or 9 signaling |
| 0.0 | 0.3 | REACTOME OPSINS | Genes involved in Opsins |
| 0.0 | 0.5 | REACTOME CD28 DEPENDENT VAV1 PATHWAY | Genes involved in CD28 dependent Vav1 pathway |
| 0.0 | 0.2 | REACTOME SIGNALING BY FGFR | Genes involved in Signaling by FGFR |
| 0.0 | 0.4 | REACTOME REGULATION OF KIT SIGNALING | Genes involved in Regulation of KIT signaling |
| 0.0 | 0.1 | REACTOME SLBP DEPENDENT PROCESSING OF REPLICATION DEPENDENT HISTONE PRE MRNAS | Genes involved in SLBP Dependent Processing of Replication-Dependent Histone Pre-mRNAs |
| 0.0 | 0.5 | REACTOME ADVANCED GLYCOSYLATION ENDPRODUCT RECEPTOR SIGNALING | Genes involved in Advanced glycosylation endproduct receptor signaling |
| 0.0 | 1.0 | REACTOME LATENT INFECTION OF HOMO SAPIENS WITH MYCOBACTERIUM TUBERCULOSIS | Genes involved in Latent infection of Homo sapiens with Mycobacterium tuberculosis |
| 0.0 | 0.3 | REACTOME THE ACTIVATION OF ARYLSULFATASES | Genes involved in The activation of arylsulfatases |
| 0.0 | 0.3 | REACTOME TRAF6 MEDIATED INDUCTION OF TAK1 COMPLEX | Genes involved in TRAF6 mediated induction of TAK1 complex |
| 0.0 | 2.9 | REACTOME OLFACTORY SIGNALING PATHWAY | Genes involved in Olfactory Signaling Pathway |
| 0.0 | 0.3 | REACTOME ASSOCIATION OF LICENSING FACTORS WITH THE PRE REPLICATIVE COMPLEX | Genes involved in Association of licensing factors with the pre-replicative complex |
| 0.0 | 0.4 | REACTOME PURINE SALVAGE | Genes involved in Purine salvage |
| 0.0 | 0.1 | REACTOME POL SWITCHING | Genes involved in Polymerase switching |
| 0.0 | 0.3 | REACTOME METABOLISM OF POLYAMINES | Genes involved in Metabolism of polyamines |
| 0.0 | 0.2 | REACTOME FANCONI ANEMIA PATHWAY | Genes involved in Fanconi Anemia pathway |
| 0.0 | 1.4 | REACTOME INTERFERON GAMMA SIGNALING | Genes involved in Interferon gamma signaling |
| 0.0 | 0.5 | REACTOME THROMBIN SIGNALLING THROUGH PROTEINASE ACTIVATED RECEPTORS PARS | Genes involved in Thrombin signalling through proteinase activated receptors (PARs) |
| 0.0 | 0.3 | REACTOME HOMOLOGOUS RECOMBINATION REPAIR OF REPLICATION INDEPENDENT DOUBLE STRAND BREAKS | Genes involved in Homologous recombination repair of replication-independent double-strand breaks |
| 0.0 | 0.3 | REACTOME MRNA DECAY BY 5 TO 3 EXORIBONUCLEASE | Genes involved in mRNA Decay by 5' to 3' Exoribonuclease |
| 0.0 | 0.3 | REACTOME CLASS C 3 METABOTROPIC GLUTAMATE PHEROMONE RECEPTORS | Genes involved in Class C/3 (Metabotropic glutamate/pheromone receptors) |
| 0.0 | 0.1 | REACTOME INFLUENZA VIRAL RNA TRANSCRIPTION AND REPLICATION | Genes involved in Influenza Viral RNA Transcription and Replication |
| 0.0 | 0.4 | REACTOME KINESINS | Genes involved in Kinesins |
| 0.0 | 0.5 | REACTOME ASSOCIATION OF TRIC CCT WITH TARGET PROTEINS DURING BIOSYNTHESIS | Genes involved in Association of TriC/CCT with target proteins during biosynthesis |
| 0.0 | 0.3 | REACTOME DEADENYLATION OF MRNA | Genes involved in Deadenylation of mRNA |
| 0.0 | 0.2 | REACTOME N GLYCAN TRIMMING IN THE ER AND CALNEXIN CALRETICULIN CYCLE | Genes involved in N-glycan trimming in the ER and Calnexin/Calreticulin cycle |
| 0.0 | 0.0 | REACTOME ENDOSOMAL VACUOLAR PATHWAY | Genes involved in Endosomal/Vacuolar pathway |
| 0.0 | 0.4 | REACTOME CHONDROITIN SULFATE BIOSYNTHESIS | Genes involved in Chondroitin sulfate biosynthesis |
| 0.0 | 0.7 | REACTOME STRIATED MUSCLE CONTRACTION | Genes involved in Striated Muscle Contraction |