Project
Inflammatory response time course, HUVEC (Wada, 2009)
Navigation
Downloads
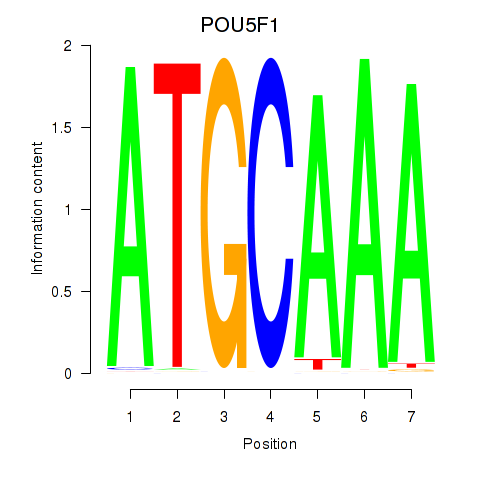
Results for POU5F1_POU2F3
Z-value: 1.54
Motif logo
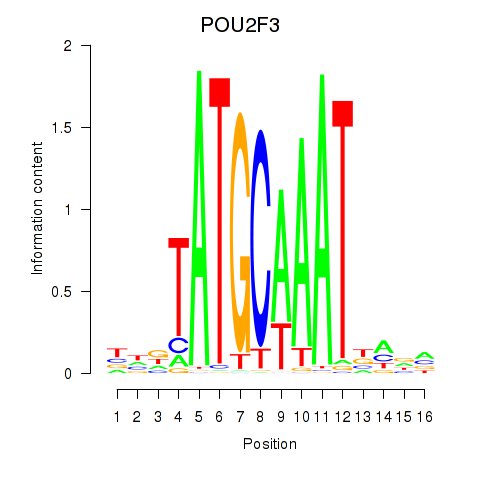
Transcription factors associated with POU5F1_POU2F3
| Gene Symbol | Gene ID | Gene Info |
|---|---|---|
|
POU5F1
|
ENSG00000204531.20 | POU5F1 |
|
POU2F3
|
ENSG00000137709.10 | POU2F3 |
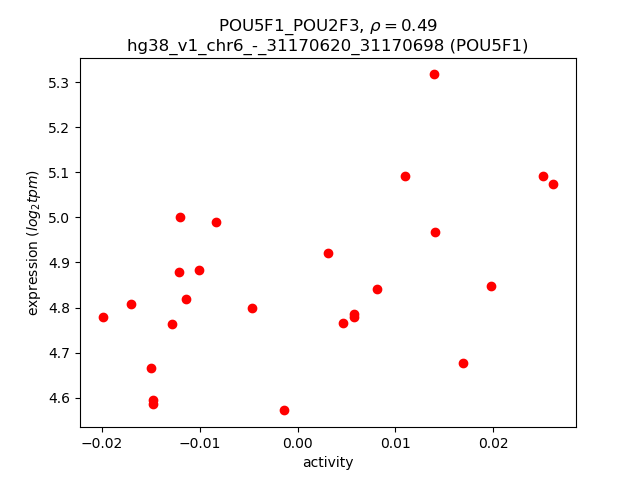
Activity-expression correlation:
| Gene | Promoter | Pearson corr. coef. | P-value | Plot |
|---|---|---|---|---|
| POU5F1 | hg38_v1_chr6_-_31170620_31170698 | 0.49 | 1.2e-02 | Click! |
| POU2F3 | hg38_v1_chr11_+_120236635_120236642, hg38_v1_chr11_+_120240135_120240199 | 0.11 | 5.9e-01 | Click! |
Activity profile of POU5F1_POU2F3 motif
Sorted Z-values of POU5F1_POU2F3 motif
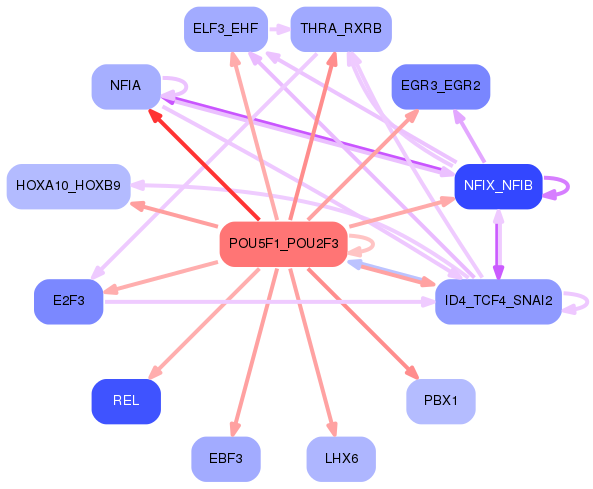
Network of associatons between targets according to the STRING database.

First level regulatory network of POU5F1_POU2F3
Gene Ontology Analysis
Gene overrepresentation in biological process category:
| Log-likelihood per target | Total log-likelihood | Term | Description |
|---|---|---|---|
| 1.5 | 7.7 | GO:2000690 | negative regulation of cardioblast differentiation(GO:0051892) regulation of cardiac muscle cell myoblast differentiation(GO:2000690) negative regulation of cardiac muscle cell myoblast differentiation(GO:2000691) |
| 1.4 | 8.7 | GO:0060023 | soft palate development(GO:0060023) |
| 1.3 | 6.7 | GO:0019075 | virus maturation(GO:0019075) |
| 1.3 | 4.0 | GO:0021593 | rhombomere morphogenesis(GO:0021593) rhombomere 3 morphogenesis(GO:0021658) |
| 1.3 | 5.1 | GO:0072137 | condensed mesenchymal cell proliferation(GO:0072137) |
| 1.2 | 3.6 | GO:0060369 | positive regulation of Fc receptor mediated stimulatory signaling pathway(GO:0060369) mast cell proliferation(GO:0070662) |
| 0.9 | 2.7 | GO:0099557 | trans-synaptic signaling by trans-synaptic complex, modulating synaptic transmission(GO:0099557) |
| 0.7 | 2.1 | GO:0061290 | cell-cell signaling involved in kidney development(GO:0060995) Wnt signaling pathway involved in kidney development(GO:0061289) canonical Wnt signaling pathway involved in metanephric kidney development(GO:0061290) cell-cell signaling involved in metanephros development(GO:0072204) |
| 0.7 | 3.3 | GO:0045925 | positive regulation of female receptivity(GO:0045925) |
| 0.7 | 2.0 | GO:0035026 | leading edge cell differentiation(GO:0035026) |
| 0.7 | 7.9 | GO:0048251 | elastic fiber assembly(GO:0048251) |
| 0.6 | 4.3 | GO:0061624 | fructose catabolic process(GO:0006001) fructose catabolic process to hydroxyacetone phosphate and glyceraldehyde-3-phosphate(GO:0061624) |
| 0.6 | 1.2 | GO:0003192 | mitral valve formation(GO:0003192) |
| 0.6 | 1.1 | GO:0060003 | copper ion export(GO:0060003) |
| 0.5 | 7.4 | GO:1904321 | response to forskolin(GO:1904321) cellular response to forskolin(GO:1904322) |
| 0.5 | 15.7 | GO:0072189 | ureter development(GO:0072189) |
| 0.5 | 5.5 | GO:0006657 | CDP-choline pathway(GO:0006657) |
| 0.5 | 1.4 | GO:0072709 | cellular response to sorbitol(GO:0072709) |
| 0.4 | 1.7 | GO:0009956 | radial pattern formation(GO:0009956) |
| 0.4 | 4.6 | GO:0010499 | proteasomal ubiquitin-independent protein catabolic process(GO:0010499) |
| 0.4 | 4.3 | GO:0032525 | somite rostral/caudal axis specification(GO:0032525) |
| 0.4 | 1.2 | GO:0014016 | neuroblast differentiation(GO:0014016) |
| 0.4 | 2.7 | GO:0036486 | trunk segmentation(GO:0035290) trunk neural crest cell migration(GO:0036484) ventral trunk neural crest cell migration(GO:0036486) |
| 0.4 | 1.5 | GO:0018364 | peptidyl-glutamine methylation(GO:0018364) |
| 0.3 | 1.3 | GO:1903758 | regulation of transcription from RNA polymerase II promoter by histone modification(GO:1903756) negative regulation of transcription from RNA polymerase II promoter by histone modification(GO:1903758) |
| 0.3 | 1.2 | GO:0071596 | ubiquitin-dependent protein catabolic process via the N-end rule pathway(GO:0071596) |
| 0.3 | 2.7 | GO:0007598 | blood coagulation, extrinsic pathway(GO:0007598) |
| 0.3 | 2.1 | GO:0090245 | axis elongation involved in somitogenesis(GO:0090245) |
| 0.3 | 0.9 | GO:0046081 | dUTP metabolic process(GO:0046080) dUTP catabolic process(GO:0046081) |
| 0.3 | 1.7 | GO:0051621 | negative regulation of dopamine uptake involved in synaptic transmission(GO:0051585) norepinephrine uptake(GO:0051620) regulation of norepinephrine uptake(GO:0051621) negative regulation of norepinephrine uptake(GO:0051622) negative regulation of catecholamine uptake involved in synaptic transmission(GO:0051945) regulation of glutathione peroxidase activity(GO:1903282) positive regulation of glutathione peroxidase activity(GO:1903284) positive regulation of hydrogen peroxide catabolic process(GO:1903285) positive regulation of peroxidase activity(GO:2000470) |
| 0.3 | 1.4 | GO:1902498 | regulation of protein autoubiquitination(GO:1902498) |
| 0.3 | 0.8 | GO:0016121 | tetraterpenoid metabolic process(GO:0016108) carotenoid metabolic process(GO:0016116) carotene catabolic process(GO:0016121) xanthophyll metabolic process(GO:0016122) terpene catabolic process(GO:0046247) |
| 0.3 | 0.8 | GO:0021913 | regulation of transcription from RNA polymerase II promoter involved in ventral spinal cord interneuron specification(GO:0021913) |
| 0.3 | 0.8 | GO:0005989 | lactose metabolic process(GO:0005988) lactose biosynthetic process(GO:0005989) |
| 0.3 | 2.9 | GO:2000576 | positive regulation of microtubule motor activity(GO:2000576) |
| 0.3 | 0.8 | GO:0006097 | glyoxylate cycle(GO:0006097) |
| 0.2 | 0.5 | GO:0097491 | sympathetic neuron projection extension(GO:0097490) sympathetic neuron projection guidance(GO:0097491) |
| 0.2 | 9.6 | GO:0003298 | physiological muscle hypertrophy(GO:0003298) physiological cardiac muscle hypertrophy(GO:0003301) cell growth involved in cardiac muscle cell development(GO:0061049) |
| 0.2 | 2.3 | GO:0055095 | lipoprotein particle mediated signaling(GO:0055095) low-density lipoprotein particle mediated signaling(GO:0055096) |
| 0.2 | 1.1 | GO:0015891 | iron chelate transport(GO:0015688) siderophore transport(GO:0015891) |
| 0.2 | 1.5 | GO:0035093 | spermatogenesis, exchange of chromosomal proteins(GO:0035093) |
| 0.2 | 2.8 | GO:0014809 | regulation of skeletal muscle contraction by regulation of release of sequestered calcium ion(GO:0014809) |
| 0.2 | 1.1 | GO:0070345 | negative regulation of fat cell proliferation(GO:0070345) |
| 0.2 | 1.7 | GO:0021678 | third ventricle development(GO:0021678) |
| 0.2 | 0.6 | GO:0010133 | proline catabolic process to glutamate(GO:0010133) |
| 0.2 | 1.0 | GO:1903998 | regulation of eating behavior(GO:1903998) |
| 0.2 | 2.4 | GO:0018095 | protein polyglutamylation(GO:0018095) |
| 0.2 | 0.6 | GO:0016340 | calcium-dependent cell-matrix adhesion(GO:0016340) regulation of embryonic cell shape(GO:0016476) |
| 0.2 | 0.6 | GO:0072161 | mesenchymal cell differentiation involved in kidney development(GO:0072161) mesenchymal cell differentiation involved in renal system development(GO:2001012) |
| 0.2 | 5.1 | GO:0045898 | regulation of RNA polymerase II transcriptional preinitiation complex assembly(GO:0045898) |
| 0.2 | 1.7 | GO:0031914 | negative regulation of synaptic plasticity(GO:0031914) |
| 0.2 | 0.4 | GO:0007525 | somatic muscle development(GO:0007525) |
| 0.2 | 0.7 | GO:0002384 | hepatic immune response(GO:0002384) response to prolactin(GO:1990637) |
| 0.2 | 0.7 | GO:0010982 | regulation of high-density lipoprotein particle clearance(GO:0010982) |
| 0.2 | 0.9 | GO:0048388 | endosomal lumen acidification(GO:0048388) |
| 0.2 | 5.5 | GO:0035162 | embryonic hemopoiesis(GO:0035162) |
| 0.2 | 0.7 | GO:0046671 | negative regulation of cellular pH reduction(GO:0032848) CD8-positive, alpha-beta T cell lineage commitment(GO:0043375) negative regulation of retinal cell programmed cell death(GO:0046671) |
| 0.2 | 0.5 | GO:1901253 | negative regulation of intracellular transport of viral material(GO:1901253) |
| 0.2 | 1.0 | GO:1900063 | regulation of peroxisome organization(GO:1900063) |
| 0.2 | 1.5 | GO:0048539 | bone marrow development(GO:0048539) |
| 0.2 | 2.3 | GO:0043983 | histone H4-K12 acetylation(GO:0043983) |
| 0.2 | 0.6 | GO:0016259 | selenocysteine metabolic process(GO:0016259) |
| 0.2 | 1.7 | GO:2000795 | negative regulation of epithelial cell proliferation involved in lung morphogenesis(GO:2000795) |
| 0.2 | 0.5 | GO:0051387 | negative regulation of neurotrophin TRK receptor signaling pathway(GO:0051387) |
| 0.2 | 2.4 | GO:0038203 | TORC2 signaling(GO:0038203) |
| 0.2 | 0.5 | GO:0014846 | esophagus smooth muscle contraction(GO:0014846) |
| 0.2 | 0.6 | GO:2000196 | positive regulation of female gonad development(GO:2000196) |
| 0.1 | 0.4 | GO:0098758 | response to interleukin-8(GO:0098758) cellular response to interleukin-8(GO:0098759) |
| 0.1 | 0.4 | GO:0007538 | primary sex determination(GO:0007538) |
| 0.1 | 1.3 | GO:0070236 | negative regulation of activation-induced cell death of T cells(GO:0070236) |
| 0.1 | 0.4 | GO:0061011 | hepatic duct development(GO:0061011) |
| 0.1 | 1.7 | GO:0072307 | metanephric nephron tubule epithelial cell differentiation(GO:0072257) regulation of metanephric nephron tubule epithelial cell differentiation(GO:0072307) |
| 0.1 | 1.7 | GO:0006265 | DNA topological change(GO:0006265) |
| 0.1 | 0.5 | GO:0061086 | negative regulation of histone H3-K27 methylation(GO:0061086) |
| 0.1 | 0.4 | GO:0000710 | meiotic mismatch repair(GO:0000710) |
| 0.1 | 2.0 | GO:0032688 | negative regulation of interferon-beta production(GO:0032688) |
| 0.1 | 0.4 | GO:1903028 | positive regulation of opsonization(GO:1903028) |
| 0.1 | 0.5 | GO:0070681 | glutaminyl-tRNAGln biosynthesis via transamidation(GO:0070681) |
| 0.1 | 2.1 | GO:0001574 | ganglioside biosynthetic process(GO:0001574) |
| 0.1 | 2.1 | GO:2000774 | positive regulation of cellular senescence(GO:2000774) |
| 0.1 | 1.9 | GO:0021514 | ventral spinal cord interneuron differentiation(GO:0021514) |
| 0.1 | 2.0 | GO:0071688 | striated muscle myosin thick filament assembly(GO:0071688) |
| 0.1 | 0.5 | GO:0018032 | protein amidation(GO:0018032) |
| 0.1 | 0.7 | GO:0071051 | polyadenylation-dependent snoRNA 3'-end processing(GO:0071051) |
| 0.1 | 0.4 | GO:0018312 | peptidyl-serine ADP-ribosylation(GO:0018312) |
| 0.1 | 1.5 | GO:2000628 | regulation of miRNA metabolic process(GO:2000628) |
| 0.1 | 1.6 | GO:0021853 | cerebral cortex GABAergic interneuron migration(GO:0021853) interneuron migration(GO:1904936) |
| 0.1 | 0.5 | GO:0044210 | 'de novo' CTP biosynthetic process(GO:0044210) |
| 0.1 | 1.0 | GO:0051388 | positive regulation of neurotrophin TRK receptor signaling pathway(GO:0051388) |
| 0.1 | 3.1 | GO:0002230 | positive regulation of defense response to virus by host(GO:0002230) |
| 0.1 | 2.0 | GO:0031115 | negative regulation of microtubule polymerization(GO:0031115) |
| 0.1 | 0.2 | GO:1903691 | positive regulation of wound healing, spreading of epidermal cells(GO:1903691) |
| 0.1 | 0.6 | GO:0046116 | queuosine biosynthetic process(GO:0008616) queuosine metabolic process(GO:0046116) regulation of protein refolding(GO:0061083) negative regulation of protein refolding(GO:0061084) |
| 0.1 | 0.6 | GO:1900226 | negative regulation of NLRP3 inflammasome complex assembly(GO:1900226) |
| 0.1 | 0.9 | GO:0061525 | hindgut development(GO:0061525) |
| 0.1 | 3.0 | GO:0030208 | dermatan sulfate biosynthetic process(GO:0030208) |
| 0.1 | 0.4 | GO:0033484 | nitric oxide homeostasis(GO:0033484) |
| 0.1 | 0.9 | GO:0002606 | positive regulation of dendritic cell antigen processing and presentation(GO:0002606) |
| 0.1 | 3.1 | GO:0060065 | uterus development(GO:0060065) |
| 0.1 | 0.3 | GO:0001812 | positive regulation of type I hypersensitivity(GO:0001812) |
| 0.1 | 0.4 | GO:0030047 | actin modification(GO:0030047) |
| 0.1 | 0.3 | GO:0002305 | gamma-delta intraepithelial T cell differentiation(GO:0002304) CD8-positive, gamma-delta intraepithelial T cell differentiation(GO:0002305) |
| 0.1 | 1.6 | GO:0060056 | mammary gland involution(GO:0060056) |
| 0.1 | 0.4 | GO:2000342 | negative regulation of chemokine (C-X-C motif) ligand 2 production(GO:2000342) |
| 0.1 | 0.3 | GO:0050883 | musculoskeletal movement, spinal reflex action(GO:0050883) |
| 0.1 | 0.4 | GO:0014835 | myoblast differentiation involved in skeletal muscle regeneration(GO:0014835) |
| 0.1 | 15.1 | GO:0006958 | complement activation, classical pathway(GO:0006958) |
| 0.1 | 0.6 | GO:0050917 | sensory perception of umami taste(GO:0050917) |
| 0.1 | 0.8 | GO:0048386 | positive regulation of retinoic acid receptor signaling pathway(GO:0048386) |
| 0.1 | 0.2 | GO:0003290 | atrial septum secundum morphogenesis(GO:0003290) |
| 0.1 | 0.3 | GO:1903259 | exon-exon junction complex disassembly(GO:1903259) |
| 0.1 | 0.3 | GO:0046010 | positive regulation of circadian sleep/wake cycle, non-REM sleep(GO:0046010) |
| 0.1 | 0.4 | GO:0060596 | mammary placode formation(GO:0060596) |
| 0.1 | 0.5 | GO:0033058 | directional locomotion(GO:0033058) |
| 0.1 | 0.5 | GO:1904491 | protein localization to ciliary transition zone(GO:1904491) |
| 0.1 | 0.3 | GO:0035905 | ascending aorta development(GO:0035905) ascending aorta morphogenesis(GO:0035910) |
| 0.1 | 1.0 | GO:2000096 | positive regulation of Wnt signaling pathway, planar cell polarity pathway(GO:2000096) |
| 0.1 | 0.4 | GO:1902896 | terminal web assembly(GO:1902896) |
| 0.1 | 0.7 | GO:0035021 | negative regulation of Rac protein signal transduction(GO:0035021) |
| 0.1 | 0.9 | GO:0014894 | response to muscle inactivity involved in regulation of muscle adaptation(GO:0014877) response to denervation involved in regulation of muscle adaptation(GO:0014894) |
| 0.1 | 0.3 | GO:0003219 | cardiac right ventricle formation(GO:0003219) |
| 0.1 | 0.4 | GO:0035519 | protein K29-linked ubiquitination(GO:0035519) |
| 0.1 | 0.7 | GO:1903026 | negative regulation of RNA polymerase II regulatory region sequence-specific DNA binding(GO:1903026) |
| 0.1 | 0.3 | GO:0030186 | melatonin metabolic process(GO:0030186) melatonin biosynthetic process(GO:0030187) |
| 0.1 | 0.4 | GO:0033031 | positive regulation of neutrophil apoptotic process(GO:0033031) |
| 0.1 | 1.2 | GO:0042908 | xenobiotic transport(GO:0042908) |
| 0.1 | 0.9 | GO:0033623 | regulation of integrin activation(GO:0033623) |
| 0.1 | 0.5 | GO:0019509 | L-methionine biosynthetic process from methylthioadenosine(GO:0019509) |
| 0.1 | 0.4 | GO:0045872 | positive regulation of rhodopsin gene expression(GO:0045872) |
| 0.1 | 1.1 | GO:0035970 | peptidyl-threonine dephosphorylation(GO:0035970) |
| 0.1 | 0.2 | GO:0046909 | intermembrane transport(GO:0046909) protein transport from ciliary membrane to plasma membrane(GO:1903445) |
| 0.1 | 0.4 | GO:0038161 | prolactin signaling pathway(GO:0038161) |
| 0.1 | 0.9 | GO:0046600 | negative regulation of centriole replication(GO:0046600) |
| 0.1 | 0.5 | GO:0007221 | positive regulation of transcription of Notch receptor target(GO:0007221) |
| 0.1 | 0.6 | GO:0001957 | intramembranous ossification(GO:0001957) direct ossification(GO:0036072) |
| 0.1 | 2.0 | GO:2000811 | negative regulation of anoikis(GO:2000811) |
| 0.1 | 0.1 | GO:0030185 | nitric oxide transport(GO:0030185) |
| 0.1 | 0.4 | GO:0009753 | response to jasmonic acid(GO:0009753) cellular response to jasmonic acid stimulus(GO:0071395) |
| 0.1 | 0.5 | GO:0046485 | ether lipid metabolic process(GO:0046485) |
| 0.1 | 5.5 | GO:0030835 | negative regulation of actin filament depolymerization(GO:0030835) |
| 0.1 | 0.7 | GO:0090481 | pyrimidine nucleotide-sugar transmembrane transport(GO:0090481) |
| 0.1 | 0.2 | GO:0060086 | circadian temperature homeostasis(GO:0060086) positive regulation of bile acid biosynthetic process(GO:0070859) positive regulation of bile acid metabolic process(GO:1904253) |
| 0.1 | 0.4 | GO:0006432 | phenylalanyl-tRNA aminoacylation(GO:0006432) |
| 0.1 | 0.9 | GO:0016191 | synaptic vesicle uncoating(GO:0016191) |
| 0.1 | 3.7 | GO:0018149 | peptide cross-linking(GO:0018149) |
| 0.1 | 0.6 | GO:0071386 | cellular response to corticosterone stimulus(GO:0071386) |
| 0.1 | 1.7 | GO:0006750 | glutathione biosynthetic process(GO:0006750) |
| 0.1 | 0.5 | GO:0010623 | programmed cell death involved in cell development(GO:0010623) |
| 0.1 | 0.9 | GO:0035372 | protein localization to microtubule(GO:0035372) |
| 0.1 | 0.4 | GO:0046092 | deoxycytidine metabolic process(GO:0046092) |
| 0.1 | 0.7 | GO:0060340 | positive regulation of type I interferon-mediated signaling pathway(GO:0060340) |
| 0.1 | 0.2 | GO:0007290 | spermatid nucleus elongation(GO:0007290) formaldehyde metabolic process(GO:0046292) |
| 0.1 | 0.6 | GO:0035729 | cellular response to hepatocyte growth factor stimulus(GO:0035729) |
| 0.1 | 0.3 | GO:0071163 | DNA replication preinitiation complex assembly(GO:0071163) |
| 0.1 | 0.5 | GO:1901475 | pyruvate transport(GO:0006848) pyruvate transmembrane transport(GO:1901475) |
| 0.1 | 1.0 | GO:0051601 | exocyst localization(GO:0051601) |
| 0.1 | 0.2 | GO:0035674 | tricarboxylic acid transmembrane transport(GO:0035674) |
| 0.1 | 0.2 | GO:0036215 | response to stem cell factor(GO:0036215) cellular response to stem cell factor stimulus(GO:0036216) Kit signaling pathway(GO:0038109) |
| 0.1 | 0.5 | GO:0035881 | amacrine cell differentiation(GO:0035881) |
| 0.1 | 1.8 | GO:0042347 | negative regulation of NF-kappaB import into nucleus(GO:0042347) |
| 0.1 | 3.6 | GO:0006749 | glutathione metabolic process(GO:0006749) |
| 0.1 | 0.5 | GO:0046543 | development of secondary sexual characteristics(GO:0045136) development of secondary female sexual characteristics(GO:0046543) |
| 0.1 | 0.7 | GO:0030091 | protein repair(GO:0030091) |
| 0.1 | 0.2 | GO:0090365 | regulation of mRNA modification(GO:0090365) |
| 0.1 | 9.4 | GO:0002377 | immunoglobulin production(GO:0002377) |
| 0.1 | 1.2 | GO:0035518 | histone H2A monoubiquitination(GO:0035518) UV-damage excision repair(GO:0070914) |
| 0.1 | 0.6 | GO:0052696 | flavonoid glucuronidation(GO:0052696) xenobiotic glucuronidation(GO:0052697) |
| 0.1 | 0.2 | GO:0048631 | regulation of skeletal muscle tissue growth(GO:0048631) |
| 0.1 | 0.2 | GO:0071626 | mastication(GO:0071626) learned vocalization behavior(GO:0098583) |
| 0.1 | 0.5 | GO:0017196 | N-terminal peptidyl-methionine acetylation(GO:0017196) |
| 0.1 | 5.1 | GO:0030032 | lamellipodium assembly(GO:0030032) |
| 0.1 | 1.5 | GO:0032897 | negative regulation of viral transcription(GO:0032897) |
| 0.1 | 0.2 | GO:0035552 | oxidative single-stranded DNA demethylation(GO:0035552) |
| 0.1 | 0.5 | GO:2001106 | regulation of Rho guanyl-nucleotide exchange factor activity(GO:2001106) |
| 0.0 | 0.1 | GO:0060921 | heart induction(GO:0003129) sinoatrial node development(GO:0003163) sinoatrial node cell differentiation(GO:0060921) |
| 0.0 | 0.2 | GO:0036091 | positive regulation of transcription from RNA polymerase II promoter in response to oxidative stress(GO:0036091) |
| 0.0 | 0.3 | GO:0046103 | adenosine catabolic process(GO:0006154) inosine biosynthetic process(GO:0046103) |
| 0.0 | 0.4 | GO:1900122 | positive regulation of receptor binding(GO:1900122) |
| 0.0 | 0.3 | GO:1902774 | late endosome to lysosome transport(GO:1902774) |
| 0.0 | 1.9 | GO:0010842 | retina layer formation(GO:0010842) |
| 0.0 | 1.7 | GO:0000188 | inactivation of MAPK activity(GO:0000188) |
| 0.0 | 0.4 | GO:0035583 | sequestering of TGFbeta in extracellular matrix(GO:0035583) |
| 0.0 | 0.2 | GO:0016480 | negative regulation of transcription from RNA polymerase III promoter(GO:0016480) |
| 0.0 | 0.2 | GO:0033306 | phytol metabolic process(GO:0033306) fatty alcohol metabolic process(GO:1903173) |
| 0.0 | 0.2 | GO:0010430 | fatty acid omega-oxidation(GO:0010430) |
| 0.0 | 1.1 | GO:0007625 | grooming behavior(GO:0007625) |
| 0.0 | 1.3 | GO:0021591 | ventricular system development(GO:0021591) |
| 0.0 | 0.2 | GO:0042904 | 9-cis-retinoic acid biosynthetic process(GO:0042904) 9-cis-retinoic acid metabolic process(GO:0042905) |
| 0.0 | 0.5 | GO:0097118 | neuroligin clustering involved in postsynaptic membrane assembly(GO:0097118) |
| 0.0 | 0.3 | GO:0021759 | globus pallidus development(GO:0021759) |
| 0.0 | 1.3 | GO:0007638 | mechanosensory behavior(GO:0007638) |
| 0.0 | 0.4 | GO:0033004 | negative regulation of mast cell activation(GO:0033004) |
| 0.0 | 10.0 | GO:0065004 | protein-DNA complex assembly(GO:0065004) |
| 0.0 | 0.2 | GO:0015862 | uridine transport(GO:0015862) |
| 0.0 | 0.2 | GO:0048861 | leukemia inhibitory factor signaling pathway(GO:0048861) |
| 0.0 | 0.2 | GO:1990502 | dense core granule maturation(GO:1990502) |
| 0.0 | 0.1 | GO:0007161 | calcium-independent cell-matrix adhesion(GO:0007161) |
| 0.0 | 0.8 | GO:0040033 | miRNA mediated inhibition of translation(GO:0035278) negative regulation of translation, ncRNA-mediated(GO:0040033) regulation of translation, ncRNA-mediated(GO:0045974) |
| 0.0 | 0.5 | GO:0010898 | positive regulation of triglyceride catabolic process(GO:0010898) |
| 0.0 | 1.2 | GO:0007635 | chemosensory behavior(GO:0007635) |
| 0.0 | 1.4 | GO:0006706 | steroid catabolic process(GO:0006706) |
| 0.0 | 0.3 | GO:0034472 | snRNA 3'-end processing(GO:0034472) |
| 0.0 | 0.1 | GO:0051563 | smooth endoplasmic reticulum calcium ion homeostasis(GO:0051563) |
| 0.0 | 0.8 | GO:0097369 | sodium ion import(GO:0097369) |
| 0.0 | 0.1 | GO:1900126 | negative regulation of hyaluronan biosynthetic process(GO:1900126) |
| 0.0 | 0.3 | GO:0051013 | microtubule severing(GO:0051013) |
| 0.0 | 1.4 | GO:0071108 | protein K48-linked deubiquitination(GO:0071108) |
| 0.0 | 0.2 | GO:1904995 | negative regulation of leukocyte tethering or rolling(GO:1903237) negative regulation of leukocyte adhesion to vascular endothelial cell(GO:1904995) |
| 0.0 | 0.1 | GO:0002881 | negative regulation of chronic inflammatory response to non-antigenic stimulus(GO:0002881) |
| 0.0 | 0.8 | GO:0045662 | negative regulation of myoblast differentiation(GO:0045662) |
| 0.0 | 0.3 | GO:0035507 | regulation of myosin-light-chain-phosphatase activity(GO:0035507) |
| 0.0 | 0.6 | GO:0015871 | choline transport(GO:0015871) |
| 0.0 | 0.2 | GO:0030070 | insulin processing(GO:0030070) |
| 0.0 | 0.3 | GO:0045040 | protein import into mitochondrial outer membrane(GO:0045040) |
| 0.0 | 0.8 | GO:0033234 | negative regulation of protein sumoylation(GO:0033234) |
| 0.0 | 0.4 | GO:0070131 | positive regulation of mitochondrial translation(GO:0070131) |
| 0.0 | 1.6 | GO:1901661 | quinone metabolic process(GO:1901661) |
| 0.0 | 1.7 | GO:0034260 | negative regulation of GTPase activity(GO:0034260) |
| 0.0 | 0.1 | GO:0060741 | prostate gland stromal morphogenesis(GO:0060741) |
| 0.0 | 0.2 | GO:0033087 | immature T cell proliferation in thymus(GO:0033080) regulation of immature T cell proliferation in thymus(GO:0033084) negative regulation of immature T cell proliferation(GO:0033087) negative regulation of immature T cell proliferation in thymus(GO:0033088) |
| 0.0 | 0.5 | GO:0006610 | ribosomal protein import into nucleus(GO:0006610) |
| 0.0 | 0.3 | GO:0008343 | adult feeding behavior(GO:0008343) |
| 0.0 | 0.3 | GO:2000288 | positive regulation of myoblast proliferation(GO:2000288) |
| 0.0 | 0.2 | GO:0060753 | regulation of mast cell chemotaxis(GO:0060753) positive regulation of mast cell chemotaxis(GO:0060754) |
| 0.0 | 0.5 | GO:0031284 | positive regulation of guanylate cyclase activity(GO:0031284) |
| 0.0 | 0.1 | GO:0097283 | keratinocyte apoptotic process(GO:0097283) regulation of keratinocyte apoptotic process(GO:1902172) |
| 0.0 | 0.5 | GO:0042226 | interleukin-6 biosynthetic process(GO:0042226) |
| 0.0 | 0.1 | GO:0007206 | phospholipase C-activating G-protein coupled glutamate receptor signaling pathway(GO:0007206) |
| 0.0 | 0.6 | GO:0034587 | piRNA metabolic process(GO:0034587) |
| 0.0 | 0.3 | GO:0033123 | positive regulation of cyclic nucleotide catabolic process(GO:0030807) positive regulation of cAMP catabolic process(GO:0030822) positive regulation of purine nucleotide catabolic process(GO:0033123) |
| 0.0 | 0.4 | GO:0044341 | sodium-dependent phosphate transport(GO:0044341) |
| 0.0 | 0.2 | GO:0097264 | self proteolysis(GO:0097264) |
| 0.0 | 0.1 | GO:0045348 | positive regulation of MHC class II biosynthetic process(GO:0045348) |
| 0.0 | 0.1 | GO:0035426 | extracellular matrix-cell signaling(GO:0035426) |
| 0.0 | 0.4 | GO:0090073 | positive regulation of protein homodimerization activity(GO:0090073) |
| 0.0 | 0.3 | GO:0061158 | 3'-UTR-mediated mRNA destabilization(GO:0061158) |
| 0.0 | 0.2 | GO:0072423 | response to cell cycle checkpoint signaling(GO:0072396) response to DNA integrity checkpoint signaling(GO:0072402) response to DNA damage checkpoint signaling(GO:0072423) |
| 0.0 | 0.1 | GO:0033386 | geranylgeranyl diphosphate metabolic process(GO:0033385) geranylgeranyl diphosphate biosynthetic process(GO:0033386) |
| 0.0 | 0.2 | GO:0046440 | L-lysine catabolic process to acetyl-CoA(GO:0019474) L-lysine catabolic process(GO:0019477) L-lysine metabolic process(GO:0046440) |
| 0.0 | 0.1 | GO:0006127 | glycerophosphate shuttle(GO:0006127) |
| 0.0 | 1.1 | GO:0032467 | positive regulation of cytokinesis(GO:0032467) |
| 0.0 | 0.2 | GO:0010890 | positive regulation of sequestering of triglyceride(GO:0010890) |
| 0.0 | 0.3 | GO:0016180 | snRNA processing(GO:0016180) |
| 0.0 | 4.2 | GO:0031424 | keratinization(GO:0031424) |
| 0.0 | 0.3 | GO:1903800 | positive regulation of production of miRNAs involved in gene silencing by miRNA(GO:1903800) |
| 0.0 | 0.2 | GO:0006600 | creatine metabolic process(GO:0006600) |
| 0.0 | 0.6 | GO:0060347 | heart trabecula formation(GO:0060347) |
| 0.0 | 0.7 | GO:0045880 | positive regulation of smoothened signaling pathway(GO:0045880) |
| 0.0 | 0.0 | GO:0035691 | macrophage migration inhibitory factor signaling pathway(GO:0035691) |
| 0.0 | 0.1 | GO:0044027 | hypermethylation of CpG island(GO:0044027) |
| 0.0 | 0.2 | GO:1901409 | positive regulation of phosphorylation of RNA polymerase II C-terminal domain(GO:1901409) |
| 0.0 | 0.3 | GO:0035524 | proline transmembrane transport(GO:0035524) |
| 0.0 | 0.2 | GO:0051684 | maintenance of Golgi location(GO:0051684) |
| 0.0 | 0.5 | GO:0033141 | positive regulation of peptidyl-serine phosphorylation of STAT protein(GO:0033141) |
| 0.0 | 0.2 | GO:0032074 | regulation of endodeoxyribonuclease activity(GO:0032071) negative regulation of nuclease activity(GO:0032074) |
| 0.0 | 0.8 | GO:0034314 | Arp2/3 complex-mediated actin nucleation(GO:0034314) |
| 0.0 | 0.2 | GO:0042985 | negative regulation of amyloid precursor protein biosynthetic process(GO:0042985) |
| 0.0 | 0.4 | GO:0033169 | histone H3-K9 demethylation(GO:0033169) |
| 0.0 | 2.5 | GO:0060071 | Wnt signaling pathway, planar cell polarity pathway(GO:0060071) |
| 0.0 | 0.5 | GO:0006853 | carnitine shuttle(GO:0006853) |
| 0.0 | 1.1 | GO:0030866 | cortical actin cytoskeleton organization(GO:0030866) |
| 0.0 | 0.4 | GO:0033539 | fatty acid beta-oxidation using acyl-CoA dehydrogenase(GO:0033539) |
| 0.0 | 0.2 | GO:0021817 | nucleokinesis involved in cell motility in cerebral cortex radial glia guided migration(GO:0021817) nuclear migration along microtubule(GO:0030473) |
| 0.0 | 0.3 | GO:0001682 | tRNA 5'-leader removal(GO:0001682) |
| 0.0 | 0.2 | GO:0090160 | Golgi to lysosome transport(GO:0090160) |
| 0.0 | 0.1 | GO:0038169 | somatostatin receptor signaling pathway(GO:0038169) somatostatin signaling pathway(GO:0038170) |
| 0.0 | 0.1 | GO:0061589 | calcium activated phosphatidylserine scrambling(GO:0061589) |
| 0.0 | 0.7 | GO:0006625 | protein targeting to peroxisome(GO:0006625) protein localization to peroxisome(GO:0072662) establishment of protein localization to peroxisome(GO:0072663) |
| 0.0 | 0.1 | GO:0036245 | cellular response to menadione(GO:0036245) |
| 0.0 | 0.1 | GO:0006384 | transcription initiation from RNA polymerase III promoter(GO:0006384) |
| 0.0 | 0.3 | GO:0060155 | platelet dense granule organization(GO:0060155) |
| 0.0 | 0.4 | GO:0006105 | succinate metabolic process(GO:0006105) |
| 0.0 | 0.8 | GO:0043252 | sodium-independent organic anion transport(GO:0043252) |
| 0.0 | 0.1 | GO:0002399 | MHC protein complex assembly(GO:0002396) MHC class II protein complex assembly(GO:0002399) |
| 0.0 | 0.2 | GO:0070050 | neuron cellular homeostasis(GO:0070050) |
| 0.0 | 0.9 | GO:0046039 | GTP metabolic process(GO:0046039) |
| 0.0 | 0.3 | GO:0003334 | keratinocyte development(GO:0003334) |
| 0.0 | 1.2 | GO:0006301 | postreplication repair(GO:0006301) |
| 0.0 | 0.2 | GO:0031642 | negative regulation of myelination(GO:0031642) |
| 0.0 | 0.8 | GO:0032007 | negative regulation of TOR signaling(GO:0032007) |
| 0.0 | 0.3 | GO:0032516 | positive regulation of phosphoprotein phosphatase activity(GO:0032516) |
| 0.0 | 1.3 | GO:0090502 | RNA phosphodiester bond hydrolysis, endonucleolytic(GO:0090502) |
| 0.0 | 0.1 | GO:1904526 | regulation of microtubule binding(GO:1904526) |
| 0.0 | 0.3 | GO:0006012 | galactose metabolic process(GO:0006012) |
| 0.0 | 1.4 | GO:0048207 | vesicle targeting, rough ER to cis-Golgi(GO:0048207) COPII vesicle coating(GO:0048208) |
| 0.0 | 0.0 | GO:0043619 | regulation of transcription from RNA polymerase II promoter in response to oxidative stress(GO:0043619) |
| 0.0 | 0.2 | GO:0006122 | mitochondrial electron transport, ubiquinol to cytochrome c(GO:0006122) |
| 0.0 | 0.1 | GO:0002467 | germinal center formation(GO:0002467) |
| 0.0 | 0.1 | GO:0019375 | galactosylceramide biosynthetic process(GO:0006682) galactolipid biosynthetic process(GO:0019375) |
| 0.0 | 0.3 | GO:0006002 | fructose 6-phosphate metabolic process(GO:0006002) |
| 0.0 | 0.1 | GO:2000434 | regulation of protein neddylation(GO:2000434) negative regulation of protein neddylation(GO:2000435) |
| 0.0 | 0.2 | GO:0031573 | intra-S DNA damage checkpoint(GO:0031573) |
| 0.0 | 0.2 | GO:1900364 | negative regulation of mRNA polyadenylation(GO:1900364) |
| 0.0 | 0.1 | GO:0060907 | positive regulation of macrophage cytokine production(GO:0060907) |
| 0.0 | 0.2 | GO:0075522 | IRES-dependent viral translational initiation(GO:0075522) |
| 0.0 | 0.6 | GO:0042417 | dopamine metabolic process(GO:0042417) |
| 0.0 | 0.7 | GO:0000413 | protein peptidyl-prolyl isomerization(GO:0000413) |
| 0.0 | 0.2 | GO:2000001 | regulation of DNA damage checkpoint(GO:2000001) |
| 0.0 | 0.6 | GO:0030513 | positive regulation of BMP signaling pathway(GO:0030513) |
| 0.0 | 0.2 | GO:0031915 | positive regulation of synaptic plasticity(GO:0031915) |
| 0.0 | 0.6 | GO:0045494 | photoreceptor cell maintenance(GO:0045494) |
| 0.0 | 0.9 | GO:0016239 | positive regulation of macroautophagy(GO:0016239) |
| 0.0 | 0.2 | GO:0060712 | spongiotrophoblast layer development(GO:0060712) |
| 0.0 | 0.3 | GO:0007095 | mitotic G2 DNA damage checkpoint(GO:0007095) |
| 0.0 | 0.0 | GO:0032661 | regulation of interleukin-18 production(GO:0032661) |
| 0.0 | 0.5 | GO:0009081 | branched-chain amino acid metabolic process(GO:0009081) branched-chain amino acid catabolic process(GO:0009083) |
| 0.0 | 1.5 | GO:0034968 | histone lysine methylation(GO:0034968) |
| 0.0 | 0.2 | GO:1904714 | regulation of chaperone-mediated autophagy(GO:1904714) |
| 0.0 | 0.8 | GO:0071349 | interleukin-12-mediated signaling pathway(GO:0035722) cellular response to interleukin-12(GO:0071349) |
| 0.0 | 0.4 | GO:0072678 | T cell migration(GO:0072678) |
| 0.0 | 0.0 | GO:0048850 | cuticle development(GO:0042335) hypophysis morphogenesis(GO:0048850) |
| 0.0 | 0.5 | GO:0045747 | positive regulation of Notch signaling pathway(GO:0045747) |
| 0.0 | 0.2 | GO:0007258 | JUN phosphorylation(GO:0007258) |
| 0.0 | 0.1 | GO:2000483 | negative regulation of interleukin-8 secretion(GO:2000483) |
| 0.0 | 0.8 | GO:0006968 | cellular defense response(GO:0006968) |
| 0.0 | 0.5 | GO:0006270 | DNA replication initiation(GO:0006270) |
Gene overrepresentation in cellular component category:
| Log-likelihood per target | Total log-likelihood | Term | Description |
|---|---|---|---|
| 1.2 | 2.4 | GO:0034680 | integrin alpha10-beta1 complex(GO:0034680) |
| 0.9 | 7.9 | GO:0071953 | elastic fiber(GO:0071953) |
| 0.7 | 3.6 | GO:0034666 | integrin alpha2-beta1 complex(GO:0034666) |
| 0.4 | 6.7 | GO:0000813 | ESCRT I complex(GO:0000813) |
| 0.3 | 1.7 | GO:0016533 | cyclin-dependent protein kinase 5 holoenzyme complex(GO:0016533) |
| 0.3 | 0.9 | GO:0097598 | sperm cytoplasmic droplet(GO:0097598) |
| 0.3 | 0.8 | GO:0071754 | IgM immunoglobulin complex(GO:0071753) IgM immunoglobulin complex, circulating(GO:0071754) pentameric IgM immunoglobulin complex(GO:0071756) |
| 0.3 | 1.5 | GO:0070022 | transforming growth factor beta receptor homodimeric complex(GO:0070022) |
| 0.2 | 2.9 | GO:0097427 | microtubule bundle(GO:0097427) |
| 0.2 | 1.8 | GO:0098560 | cytoplasmic side of early endosome membrane(GO:0098559) cytoplasmic side of late endosome membrane(GO:0098560) |
| 0.2 | 0.5 | GO:0031084 | BLOC-2 complex(GO:0031084) |
| 0.1 | 2.1 | GO:0016013 | syntrophin complex(GO:0016013) |
| 0.1 | 0.7 | GO:0005896 | interleukin-6 receptor complex(GO:0005896) |
| 0.1 | 1.7 | GO:0031298 | replication fork protection complex(GO:0031298) |
| 0.1 | 2.4 | GO:0061700 | GATOR2 complex(GO:0061700) |
| 0.1 | 0.5 | GO:0030956 | glutamyl-tRNA(Gln) amidotransferase complex(GO:0030956) |
| 0.1 | 1.0 | GO:0035976 | AP1 complex(GO:0035976) |
| 0.1 | 1.5 | GO:0033256 | I-kappaB/NF-kappaB complex(GO:0033256) |
| 0.1 | 1.2 | GO:0031465 | Cul4B-RING E3 ubiquitin ligase complex(GO:0031465) |
| 0.1 | 8.5 | GO:0005834 | heterotrimeric G-protein complex(GO:0005834) |
| 0.1 | 4.6 | GO:0042571 | immunoglobulin complex, circulating(GO:0042571) |
| 0.1 | 1.2 | GO:0005589 | collagen type VI trimer(GO:0005589) collagen beaded filament(GO:0098647) |
| 0.1 | 1.5 | GO:0070938 | contractile ring(GO:0070938) |
| 0.1 | 2.0 | GO:0032982 | myosin filament(GO:0032982) |
| 0.1 | 0.4 | GO:0032301 | MutSalpha complex(GO:0032301) |
| 0.1 | 0.7 | GO:0002193 | MAML1-RBP-Jkappa- ICN1 complex(GO:0002193) |
| 0.1 | 0.4 | GO:0005749 | mitochondrial respiratory chain complex II, succinate dehydrogenase complex (ubiquinone)(GO:0005749) succinate dehydrogenase complex (ubiquinone)(GO:0045257) respiratory chain complex II(GO:0045273) succinate dehydrogenase complex(GO:0045281) fumarate reductase complex(GO:0045283) |
| 0.1 | 0.6 | GO:0071546 | pi-body(GO:0071546) |
| 0.1 | 2.9 | GO:0031092 | platelet alpha granule membrane(GO:0031092) |
| 0.1 | 0.5 | GO:0035867 | alphav-beta3 integrin-IGF-1-IGF1R complex(GO:0035867) |
| 0.1 | 0.5 | GO:0005947 | mitochondrial alpha-ketoglutarate dehydrogenase complex(GO:0005947) |
| 0.1 | 1.3 | GO:0005641 | nuclear envelope lumen(GO:0005641) |
| 0.1 | 1.0 | GO:0031209 | SCAR complex(GO:0031209) |
| 0.1 | 3.9 | GO:0001533 | cornified envelope(GO:0001533) |
| 0.1 | 0.2 | GO:0043293 | apoptosome(GO:0043293) |
| 0.1 | 1.7 | GO:0044300 | cerebellar mossy fiber(GO:0044300) |
| 0.1 | 12.9 | GO:0032993 | protein-DNA complex(GO:0032993) |
| 0.1 | 0.2 | GO:0071148 | TEAD-1-YAP complex(GO:0071148) |
| 0.1 | 0.9 | GO:0005687 | U4 snRNP(GO:0005687) |
| 0.1 | 0.4 | GO:1990357 | terminal web(GO:1990357) |
| 0.1 | 0.2 | GO:0072536 | interleukin-23 receptor complex(GO:0072536) |
| 0.1 | 0.5 | GO:0031415 | NatA complex(GO:0031415) |
| 0.1 | 0.5 | GO:0005672 | transcription factor TFIIA complex(GO:0005672) |
| 0.1 | 0.3 | GO:0033263 | CORVET complex(GO:0033263) |
| 0.1 | 0.4 | GO:0000308 | cytoplasmic cyclin-dependent protein kinase holoenzyme complex(GO:0000308) |
| 0.1 | 0.3 | GO:0097169 | IPAF inflammasome complex(GO:0072557) AIM2 inflammasome complex(GO:0097169) |
| 0.1 | 0.5 | GO:0031428 | box C/D snoRNP complex(GO:0031428) |
| 0.0 | 0.4 | GO:0031464 | Cul4A-RING E3 ubiquitin ligase complex(GO:0031464) |
| 0.0 | 0.3 | GO:0000172 | ribonuclease MRP complex(GO:0000172) |
| 0.0 | 0.7 | GO:0000176 | nuclear exosome (RNase complex)(GO:0000176) |
| 0.0 | 0.5 | GO:0097470 | ribbon synapse(GO:0097470) |
| 0.0 | 0.7 | GO:0032039 | integrator complex(GO:0032039) |
| 0.0 | 0.5 | GO:0044666 | MLL3/4 complex(GO:0044666) |
| 0.0 | 3.4 | GO:0045095 | keratin filament(GO:0045095) |
| 0.0 | 0.3 | GO:0032437 | cuticular plate(GO:0032437) |
| 0.0 | 0.4 | GO:1990316 | ATG1/ULK1 kinase complex(GO:1990316) |
| 0.0 | 0.6 | GO:0008385 | IkappaB kinase complex(GO:0008385) |
| 0.0 | 3.5 | GO:0031463 | Cul3-RING ubiquitin ligase complex(GO:0031463) |
| 0.0 | 1.5 | GO:0035861 | site of double-strand break(GO:0035861) |
| 0.0 | 0.5 | GO:0002116 | semaphorin receptor complex(GO:0002116) |
| 0.0 | 1.0 | GO:0000145 | exocyst(GO:0000145) |
| 0.0 | 6.4 | GO:0031901 | early endosome membrane(GO:0031901) |
| 0.0 | 3.7 | GO:0000123 | histone acetyltransferase complex(GO:0000123) |
| 0.0 | 8.5 | GO:0030018 | Z disc(GO:0030018) |
| 0.0 | 5.5 | GO:0090575 | RNA polymerase II transcription factor complex(GO:0090575) |
| 0.0 | 0.5 | GO:0036056 | filtration diaphragm(GO:0036056) slit diaphragm(GO:0036057) |
| 0.0 | 4.9 | GO:0042734 | presynaptic membrane(GO:0042734) |
| 0.0 | 0.6 | GO:0016281 | eukaryotic translation initiation factor 4F complex(GO:0016281) |
| 0.0 | 1.2 | GO:1902555 | endoribonuclease complex(GO:1902555) |
| 0.0 | 0.5 | GO:0042622 | photoreceptor outer segment membrane(GO:0042622) |
| 0.0 | 0.4 | GO:0005583 | fibrillar collagen trimer(GO:0005583) banded collagen fibril(GO:0098643) |
| 0.0 | 2.7 | GO:0031093 | platelet alpha granule lumen(GO:0031093) |
| 0.0 | 0.7 | GO:0046930 | pore complex(GO:0046930) |
| 0.0 | 0.5 | GO:0036038 | MKS complex(GO:0036038) |
| 0.0 | 0.3 | GO:0098799 | outer mitochondrial membrane protein complex(GO:0098799) |
| 0.0 | 0.2 | GO:1990745 | EARP complex(GO:1990745) |
| 0.0 | 0.2 | GO:0070554 | synaptobrevin 2-SNAP-25-syntaxin-1a-complexin II complex(GO:0070033) synaptobrevin 2-SNAP-25-syntaxin-3-complexin complex(GO:0070554) |
| 0.0 | 0.2 | GO:0043596 | nuclear replication fork(GO:0043596) |
| 0.0 | 0.3 | GO:0035749 | myelin sheath adaxonal region(GO:0035749) |
| 0.0 | 4.2 | GO:0005814 | centriole(GO:0005814) |
| 0.0 | 1.5 | GO:0001772 | immunological synapse(GO:0001772) |
| 0.0 | 0.1 | GO:0009331 | glycerol-3-phosphate dehydrogenase complex(GO:0009331) |
| 0.0 | 0.2 | GO:0098574 | cytoplasmic side of lysosomal membrane(GO:0098574) |
| 0.0 | 0.3 | GO:0031045 | dense core granule(GO:0031045) |
| 0.0 | 0.4 | GO:0005885 | Arp2/3 protein complex(GO:0005885) |
| 0.0 | 0.7 | GO:0032809 | neuronal cell body membrane(GO:0032809) cell body membrane(GO:0044298) |
| 0.0 | 0.3 | GO:0035145 | exon-exon junction complex(GO:0035145) |
| 0.0 | 0.1 | GO:0031838 | haptoglobin-hemoglobin complex(GO:0031838) |
| 0.0 | 0.4 | GO:0031528 | microvillus membrane(GO:0031528) |
| 0.0 | 0.3 | GO:0034663 | endoplasmic reticulum chaperone complex(GO:0034663) |
| 0.0 | 0.1 | GO:0033093 | Weibel-Palade body(GO:0033093) |
| 0.0 | 3.5 | GO:0042579 | peroxisome(GO:0005777) microbody(GO:0042579) |
| 0.0 | 0.4 | GO:0043205 | microfibril(GO:0001527) fibril(GO:0043205) |
| 0.0 | 0.4 | GO:0042629 | mast cell granule(GO:0042629) |
| 0.0 | 0.3 | GO:0032585 | multivesicular body membrane(GO:0032585) |
| 0.0 | 0.1 | GO:0070552 | BRISC complex(GO:0070552) |
| 0.0 | 0.2 | GO:0005719 | nuclear euchromatin(GO:0005719) |
| 0.0 | 0.1 | GO:0071541 | eukaryotic translation initiation factor 3 complex, eIF3m(GO:0071541) |
| 0.0 | 0.3 | GO:0033162 | melanosome membrane(GO:0033162) chitosome(GO:0045009) |
| 0.0 | 1.4 | GO:0005811 | lipid particle(GO:0005811) |
| 0.0 | 0.3 | GO:0005665 | DNA-directed RNA polymerase II, core complex(GO:0005665) |
| 0.0 | 1.3 | GO:0032588 | trans-Golgi network membrane(GO:0032588) |
| 0.0 | 0.1 | GO:0034366 | spherical high-density lipoprotein particle(GO:0034366) |
| 0.0 | 0.3 | GO:0034451 | centriolar satellite(GO:0034451) |
| 0.0 | 0.3 | GO:0031235 | intrinsic component of the cytoplasmic side of the plasma membrane(GO:0031235) |
| 0.0 | 0.1 | GO:0097442 | CA3 pyramidal cell dendrite(GO:0097442) |
| 0.0 | 0.5 | GO:0016592 | mediator complex(GO:0016592) |
| 0.0 | 0.1 | GO:0032045 | guanyl-nucleotide exchange factor complex(GO:0032045) |
| 0.0 | 0.3 | GO:0048786 | presynaptic active zone(GO:0048786) |
| 0.0 | 10.8 | GO:0016604 | nuclear body(GO:0016604) |
| 0.0 | 1.0 | GO:0042641 | actomyosin(GO:0042641) |
| 0.0 | 0.1 | GO:0005664 | origin recognition complex(GO:0000808) nuclear origin of replication recognition complex(GO:0005664) |
| 0.0 | 0.3 | GO:0044798 | nuclear transcription factor complex(GO:0044798) |
Gene overrepresentation in molecular function category:
| Log-likelihood per target | Total log-likelihood | Term | Description |
|---|---|---|---|
| 1.1 | 5.5 | GO:0004105 | choline-phosphate cytidylyltransferase activity(GO:0004105) |
| 0.9 | 5.2 | GO:0042806 | fucose binding(GO:0042806) |
| 0.7 | 4.1 | GO:0018479 | benzaldehyde dehydrogenase (NAD+) activity(GO:0018479) |
| 0.6 | 13.4 | GO:0001011 | transcription factor activity, sequence-specific DNA binding, RNA polymerase recruiting(GO:0001011) transcription factor activity, TFIIB-class binding(GO:0001087) |
| 0.6 | 3.1 | GO:0043208 | glycosphingolipid binding(GO:0043208) |
| 0.6 | 1.7 | GO:0030549 | acetylcholine receptor activator activity(GO:0030549) |
| 0.5 | 2.1 | GO:0047291 | neolactotetraosylceramide alpha-2,3-sialyltransferase activity(GO:0004513) lactosylceramide alpha-2,3-sialyltransferase activity(GO:0047291) |
| 0.5 | 7.4 | GO:0031821 | G-protein coupled serotonin receptor binding(GO:0031821) |
| 0.4 | 1.7 | GO:0047757 | chondroitin-glucuronate 5-epimerase activity(GO:0047757) |
| 0.4 | 1.1 | GO:0043682 | copper-exporting ATPase activity(GO:0004008) copper-transporting ATPase activity(GO:0043682) |
| 0.4 | 1.1 | GO:0008330 | protein tyrosine/threonine phosphatase activity(GO:0008330) |
| 0.3 | 1.7 | GO:0004464 | leukotriene-C4 synthase activity(GO:0004464) |
| 0.3 | 10.0 | GO:0008093 | cytoskeletal adaptor activity(GO:0008093) |
| 0.3 | 2.4 | GO:0098639 | collagen binding involved in cell-matrix adhesion(GO:0098639) |
| 0.3 | 0.9 | GO:0004170 | dUTP diphosphatase activity(GO:0004170) |
| 0.3 | 1.7 | GO:0060961 | phospholipase D inhibitor activity(GO:0060961) |
| 0.3 | 1.2 | GO:0033265 | acetylcholinesterase activity(GO:0003990) choline binding(GO:0033265) |
| 0.3 | 1.7 | GO:0003917 | DNA topoisomerase type I activity(GO:0003917) |
| 0.3 | 1.1 | GO:0004773 | steryl-sulfatase activity(GO:0004773) |
| 0.3 | 3.6 | GO:0030280 | structural constituent of epidermis(GO:0030280) |
| 0.3 | 0.8 | GO:0090555 | phosphatidylethanolamine-translocating ATPase activity(GO:0090555) |
| 0.3 | 1.5 | GO:0032296 | ribonuclease III activity(GO:0004525) double-stranded RNA-specific ribonuclease activity(GO:0032296) |
| 0.3 | 0.8 | GO:0051990 | isocitrate dehydrogenase (NADP+) activity(GO:0004450) (R)-2-hydroxyglutarate dehydrogenase activity(GO:0051990) |
| 0.2 | 2.7 | GO:0005005 | transmembrane-ephrin receptor activity(GO:0005005) |
| 0.2 | 0.9 | GO:0072320 | volume-sensitive chloride channel activity(GO:0072320) |
| 0.2 | 1.3 | GO:0070004 | cysteine-type carboxypeptidase activity(GO:0016807) cysteine-type exopeptidase activity(GO:0070004) |
| 0.2 | 1.7 | GO:0070892 | lipoteichoic acid receptor activity(GO:0070892) |
| 0.2 | 2.0 | GO:0034485 | phosphatidylinositol-3,4,5-trisphosphate 5-phosphatase activity(GO:0034485) |
| 0.2 | 0.8 | GO:0004461 | lactose synthase activity(GO:0004461) |
| 0.2 | 0.6 | GO:1904713 | beta-catenin destruction complex binding(GO:1904713) |
| 0.2 | 2.7 | GO:0070324 | thyroid hormone binding(GO:0070324) |
| 0.2 | 1.0 | GO:0004522 | ribonuclease A activity(GO:0004522) |
| 0.2 | 1.3 | GO:0015220 | choline transmembrane transporter activity(GO:0015220) |
| 0.2 | 0.5 | GO:0005477 | pyruvate secondary active transmembrane transporter activity(GO:0005477) |
| 0.2 | 0.5 | GO:1990259 | protein-glutamine N-methyltransferase activity(GO:0036009) histone-glutamine methyltransferase activity(GO:1990259) |
| 0.2 | 0.5 | GO:0004556 | alpha-amylase activity(GO:0004556) |
| 0.2 | 5.8 | GO:0071837 | HMG box domain binding(GO:0071837) |
| 0.2 | 1.2 | GO:0003960 | NADPH:quinone reductase activity(GO:0003960) |
| 0.2 | 4.3 | GO:0017166 | vinculin binding(GO:0017166) |
| 0.2 | 1.4 | GO:0043426 | MRF binding(GO:0043426) |
| 0.1 | 0.4 | GO:0019959 | interleukin-8 binding(GO:0019959) |
| 0.1 | 0.5 | GO:0016524 | latrotoxin receptor activity(GO:0016524) |
| 0.1 | 2.7 | GO:0004653 | polypeptide N-acetylgalactosaminyltransferase activity(GO:0004653) |
| 0.1 | 0.5 | GO:0050567 | glutaminyl-tRNA synthase (glutamine-hydrolyzing) activity(GO:0050567) |
| 0.1 | 1.0 | GO:0070290 | N-acylphosphatidylethanolamine-specific phospholipase D activity(GO:0070290) |
| 0.1 | 0.9 | GO:0004465 | lipoprotein lipase activity(GO:0004465) |
| 0.1 | 0.5 | GO:0004598 | peptidylglycine monooxygenase activity(GO:0004504) peptidylamidoglycolate lyase activity(GO:0004598) |
| 0.1 | 0.5 | GO:0003883 | CTP synthase activity(GO:0003883) |
| 0.1 | 2.6 | GO:0045499 | chemorepellent activity(GO:0045499) |
| 0.1 | 0.3 | GO:0033858 | N-acetylgalactosamine kinase activity(GO:0033858) |
| 0.1 | 0.3 | GO:0055100 | adiponectin binding(GO:0055100) |
| 0.1 | 0.7 | GO:0016812 | hydrolase activity, acting on carbon-nitrogen (but not peptide) bonds, in cyclic amides(GO:0016812) |
| 0.1 | 1.2 | GO:0008559 | xenobiotic-transporting ATPase activity(GO:0008559) |
| 0.1 | 1.0 | GO:0016286 | small conductance calcium-activated potassium channel activity(GO:0016286) |
| 0.1 | 0.8 | GO:0047522 | 13-prostaglandin reductase activity(GO:0036132) 15-oxoprostaglandin 13-oxidase activity(GO:0047522) |
| 0.1 | 1.0 | GO:0001162 | RNA polymerase II intronic transcription regulatory region sequence-specific DNA binding(GO:0001162) |
| 0.1 | 0.4 | GO:0004925 | prolactin receptor activity(GO:0004925) |
| 0.1 | 0.7 | GO:0016618 | hydroxypyruvate reductase activity(GO:0016618) glyoxylate reductase (NADP) activity(GO:0030267) |
| 0.1 | 0.3 | GO:0044323 | retinoic acid-responsive element binding(GO:0044323) |
| 0.1 | 23.0 | GO:0003823 | antigen binding(GO:0003823) |
| 0.1 | 0.5 | GO:0047179 | platelet-activating factor acetyltransferase activity(GO:0047179) |
| 0.1 | 0.9 | GO:0033743 | peptide-methionine (R)-S-oxide reductase activity(GO:0033743) |
| 0.1 | 0.4 | GO:0008177 | succinate dehydrogenase (ubiquinone) activity(GO:0008177) 3 iron, 4 sulfur cluster binding(GO:0051538) |
| 0.1 | 0.5 | GO:0008449 | N-acetylglucosamine-6-sulfatase activity(GO:0008449) |
| 0.1 | 0.4 | GO:0047086 | phenanthrene 9,10-monooxygenase activity(GO:0018636) ketosteroid monooxygenase activity(GO:0047086) |
| 0.1 | 0.6 | GO:0004771 | sterol esterase activity(GO:0004771) |
| 0.1 | 0.4 | GO:0016402 | pristanoyl-CoA oxidase activity(GO:0016402) |
| 0.1 | 0.5 | GO:0004517 | nitric-oxide synthase activity(GO:0004517) |
| 0.1 | 2.2 | GO:0097493 | structural molecule activity conferring elasticity(GO:0097493) |
| 0.1 | 1.6 | GO:0042809 | vitamin D receptor binding(GO:0042809) |
| 0.1 | 0.4 | GO:0032143 | single thymine insertion binding(GO:0032143) |
| 0.1 | 0.6 | GO:0008479 | queuine tRNA-ribosyltransferase activity(GO:0008479) |
| 0.1 | 2.1 | GO:0042813 | Wnt-activated receptor activity(GO:0042813) |
| 0.1 | 0.5 | GO:0043812 | phosphatidylinositol-4-phosphate phosphatase activity(GO:0043812) |
| 0.1 | 0.5 | GO:0016714 | oxidoreductase activity, acting on paired donors, with incorporation or reduction of molecular oxygen, reduced pteridine as one donor, and incorporation of one atom of oxygen(GO:0016714) |
| 0.1 | 36.4 | GO:0001077 | transcriptional activator activity, RNA polymerase II core promoter proximal region sequence-specific binding(GO:0001077) |
| 0.1 | 0.7 | GO:0005138 | interleukin-6 receptor binding(GO:0005138) |
| 0.1 | 0.4 | GO:0004826 | phenylalanine-tRNA ligase activity(GO:0004826) |
| 0.1 | 0.9 | GO:0015279 | store-operated calcium channel activity(GO:0015279) |
| 0.1 | 0.4 | GO:0015319 | sodium:inorganic phosphate symporter activity(GO:0015319) |
| 0.1 | 0.2 | GO:0004923 | leukemia inhibitory factor receptor activity(GO:0004923) |
| 0.1 | 0.7 | GO:0015165 | pyrimidine nucleotide-sugar transmembrane transporter activity(GO:0015165) |
| 0.1 | 0.2 | GO:0061609 | fructose-1-phosphate aldolase activity(GO:0061609) |
| 0.1 | 0.3 | GO:0019763 | immunoglobulin receptor activity(GO:0019763) |
| 0.1 | 0.8 | GO:0016846 | carbon-sulfur lyase activity(GO:0016846) |
| 0.1 | 2.3 | GO:0001972 | retinoic acid binding(GO:0001972) |
| 0.1 | 1.7 | GO:0008527 | taste receptor activity(GO:0008527) |
| 0.1 | 0.9 | GO:0017017 | MAP kinase tyrosine/serine/threonine phosphatase activity(GO:0017017) |
| 0.1 | 1.0 | GO:0031435 | mitogen-activated protein kinase kinase kinase binding(GO:0031435) |
| 0.1 | 0.2 | GO:0019150 | D-ribulokinase activity(GO:0019150) |
| 0.1 | 2.9 | GO:0001106 | RNA polymerase II transcription corepressor activity(GO:0001106) |
| 0.1 | 2.6 | GO:0051393 | alpha-actinin binding(GO:0051393) |
| 0.1 | 0.4 | GO:0003998 | acylphosphatase activity(GO:0003998) |
| 0.1 | 0.7 | GO:0048407 | platelet-derived growth factor binding(GO:0048407) |
| 0.1 | 0.3 | GO:0016520 | growth hormone-releasing hormone receptor activity(GO:0016520) |
| 0.1 | 0.2 | GO:0008670 | 2,4-dienoyl-CoA reductase (NADPH) activity(GO:0008670) trans-2-enoyl-CoA reductase (NADPH) activity(GO:0019166) |
| 0.1 | 0.4 | GO:0051525 | NFAT protein binding(GO:0051525) |
| 0.1 | 0.2 | GO:0042019 | interleukin-23 binding(GO:0042019) interleukin-23 receptor activity(GO:0042020) |
| 0.1 | 0.5 | GO:0000213 | tRNA-intron endonuclease activity(GO:0000213) |
| 0.1 | 1.1 | GO:0004861 | cyclin-dependent protein serine/threonine kinase inhibitor activity(GO:0004861) |
| 0.1 | 1.6 | GO:0005095 | GTPase inhibitor activity(GO:0005095) |
| 0.1 | 0.9 | GO:0042834 | peptidoglycan binding(GO:0042834) |
| 0.1 | 0.4 | GO:0004137 | deoxycytidine kinase activity(GO:0004137) thymidine kinase activity(GO:0004797) |
| 0.1 | 0.7 | GO:0051434 | BH3 domain binding(GO:0051434) |
| 0.1 | 1.2 | GO:0035615 | clathrin adaptor activity(GO:0035615) endocytic adaptor activity(GO:0098748) |
| 0.1 | 0.2 | GO:0035514 | DNA demethylase activity(GO:0035514) |
| 0.1 | 3.4 | GO:0008028 | monocarboxylic acid transmembrane transporter activity(GO:0008028) |
| 0.0 | 0.1 | GO:0008511 | sodium:potassium:chloride symporter activity(GO:0008511) |
| 0.0 | 0.5 | GO:0005021 | vascular endothelial growth factor-activated receptor activity(GO:0005021) |
| 0.0 | 0.4 | GO:0070699 | type II activin receptor binding(GO:0070699) |
| 0.0 | 0.2 | GO:0004031 | aldehyde oxidase activity(GO:0004031) |
| 0.0 | 0.4 | GO:0003910 | DNA ligase (ATP) activity(GO:0003910) |
| 0.0 | 0.3 | GO:0005298 | proline:sodium symporter activity(GO:0005298) |
| 0.0 | 0.5 | GO:0004972 | NMDA glutamate receptor activity(GO:0004972) |
| 0.0 | 0.5 | GO:0031492 | nucleosomal DNA binding(GO:0031492) |
| 0.0 | 0.3 | GO:0044213 | intronic transcription regulatory region sequence-specific DNA binding(GO:0001161) intronic transcription regulatory region DNA binding(GO:0044213) |
| 0.0 | 0.4 | GO:0099580 | ion antiporter activity involved in regulation of postsynaptic membrane potential(GO:0099580) |
| 0.0 | 0.3 | GO:0001591 | dopamine neurotransmitter receptor activity, coupled via Gi/Go(GO:0001591) |
| 0.0 | 8.9 | GO:0017124 | SH3 domain binding(GO:0017124) |
| 0.0 | 1.2 | GO:0004708 | MAP kinase kinase activity(GO:0004708) |
| 0.0 | 0.4 | GO:0008420 | CTD phosphatase activity(GO:0008420) |
| 0.0 | 0.4 | GO:0035612 | AP-2 adaptor complex binding(GO:0035612) |
| 0.0 | 0.3 | GO:0016634 | oxidoreductase activity, acting on the CH-CH group of donors, oxygen as acceptor(GO:0016634) |
| 0.0 | 0.4 | GO:0015386 | potassium:proton antiporter activity(GO:0015386) |
| 0.0 | 0.1 | GO:0016495 | C-X3-C chemokine receptor activity(GO:0016495) |
| 0.0 | 0.6 | GO:0005132 | type I interferon receptor binding(GO:0005132) |
| 0.0 | 0.3 | GO:0031685 | adenosine receptor binding(GO:0031685) |
| 0.0 | 0.1 | GO:0052590 | sn-glycerol-3-phosphate:ubiquinone oxidoreductase activity(GO:0052590) sn-glycerol-3-phosphate:ubiquinone-8 oxidoreductase activity(GO:0052591) |
| 0.0 | 0.3 | GO:0003872 | 6-phosphofructokinase activity(GO:0003872) |
| 0.0 | 0.2 | GO:0004301 | epoxide hydrolase activity(GO:0004301) |
| 0.0 | 0.6 | GO:0032454 | histone demethylase activity (H3-K9 specific)(GO:0032454) |
| 0.0 | 0.2 | GO:0016647 | oxidoreductase activity, acting on the CH-NH group of donors, oxygen as acceptor(GO:0016647) |
| 0.0 | 0.3 | GO:0008172 | S-methyltransferase activity(GO:0008172) |
| 0.0 | 0.1 | GO:0003680 | AT DNA binding(GO:0003680) |
| 0.0 | 0.8 | GO:0000339 | RNA cap binding(GO:0000339) |
| 0.0 | 0.2 | GO:0015142 | citrate transmembrane transporter activity(GO:0015137) tricarboxylic acid transmembrane transporter activity(GO:0015142) |
| 0.0 | 0.5 | GO:0043422 | protein kinase B binding(GO:0043422) |
| 0.0 | 2.3 | GO:0035064 | methylated histone binding(GO:0035064) |
| 0.0 | 0.2 | GO:1990829 | C-rich single-stranded DNA binding(GO:1990829) |
| 0.0 | 0.6 | GO:0031005 | filamin binding(GO:0031005) |
| 0.0 | 0.4 | GO:0045159 | myosin II binding(GO:0045159) |
| 0.0 | 2.0 | GO:0018024 | histone-lysine N-methyltransferase activity(GO:0018024) |
| 0.0 | 0.3 | GO:0008568 | microtubule-severing ATPase activity(GO:0008568) |
| 0.0 | 0.5 | GO:0004596 | peptide alpha-N-acetyltransferase activity(GO:0004596) |
| 0.0 | 0.8 | GO:0043325 | phosphatidylinositol-3,4-bisphosphate binding(GO:0043325) |
| 0.0 | 0.0 | GO:0045322 | unmethylated CpG binding(GO:0045322) |
| 0.0 | 0.6 | GO:0048156 | tau protein binding(GO:0048156) |
| 0.0 | 0.1 | GO:0005502 | 11-cis retinal binding(GO:0005502) |
| 0.0 | 0.6 | GO:0071949 | FAD binding(GO:0071949) |
| 0.0 | 0.5 | GO:0008191 | metalloendopeptidase inhibitor activity(GO:0008191) |
| 0.0 | 0.5 | GO:0004806 | triglyceride lipase activity(GO:0004806) |
| 0.0 | 0.2 | GO:0008379 | thioredoxin peroxidase activity(GO:0008379) |
| 0.0 | 0.8 | GO:0001968 | fibronectin binding(GO:0001968) |
| 0.0 | 3.4 | GO:0004867 | serine-type endopeptidase inhibitor activity(GO:0004867) |
| 0.0 | 0.3 | GO:0004526 | ribonuclease P activity(GO:0004526) |
| 0.0 | 0.2 | GO:0016681 | ubiquinol-cytochrome-c reductase activity(GO:0008121) oxidoreductase activity, acting on diphenols and related substances as donors, cytochrome as acceptor(GO:0016681) |
| 0.0 | 4.7 | GO:0001078 | transcriptional repressor activity, RNA polymerase II core promoter proximal region sequence-specific binding(GO:0001078) |
| 0.0 | 3.3 | GO:0005178 | integrin binding(GO:0005178) |
| 0.0 | 0.1 | GO:0050254 | rhodopsin kinase activity(GO:0050254) |
| 0.0 | 0.3 | GO:0017034 | Rap guanyl-nucleotide exchange factor activity(GO:0017034) |
| 0.0 | 0.2 | GO:0005172 | vascular endothelial growth factor receptor binding(GO:0005172) |
| 0.0 | 0.2 | GO:0004126 | cytidine deaminase activity(GO:0004126) |
| 0.0 | 0.1 | GO:0001594 | trace-amine receptor activity(GO:0001594) |
| 0.0 | 0.7 | GO:0008327 | methyl-CpG binding(GO:0008327) |
| 0.0 | 0.1 | GO:0000293 | ferric-chelate reductase activity(GO:0000293) |
| 0.0 | 0.6 | GO:0005528 | macrolide binding(GO:0005527) FK506 binding(GO:0005528) |
| 0.0 | 0.4 | GO:0005112 | Notch binding(GO:0005112) |
| 0.0 | 0.7 | GO:0016702 | oxidoreductase activity, acting on single donors with incorporation of molecular oxygen, incorporation of two atoms of oxygen(GO:0016702) |
| 0.0 | 0.2 | GO:0004022 | alcohol dehydrogenase (NAD) activity(GO:0004022) |
| 0.0 | 0.1 | GO:0046912 | transferase activity, transferring acyl groups, acyl groups converted into alkyl on transfer(GO:0046912) |
| 0.0 | 0.1 | GO:0031697 | beta-1 adrenergic receptor binding(GO:0031697) |
| 0.0 | 0.4 | GO:0008494 | translation activator activity(GO:0008494) |
| 0.0 | 0.3 | GO:0015467 | G-protein activated inward rectifier potassium channel activity(GO:0015467) |
| 0.0 | 1.7 | GO:0001158 | enhancer sequence-specific DNA binding(GO:0001158) |
| 0.0 | 0.1 | GO:0004994 | somatostatin receptor activity(GO:0004994) |
| 0.0 | 0.1 | GO:0004161 | dimethylallyltranstransferase activity(GO:0004161) geranyltranstransferase activity(GO:0004337) |
| 0.0 | 0.1 | GO:0016532 | superoxide dismutase copper chaperone activity(GO:0016532) |
| 0.0 | 0.1 | GO:0070905 | serine binding(GO:0070905) |
| 0.0 | 10.8 | GO:0003779 | actin binding(GO:0003779) |
| 0.0 | 0.0 | GO:0004874 | aryl hydrocarbon receptor activity(GO:0004874) |
| 0.0 | 0.2 | GO:0008140 | cAMP response element binding protein binding(GO:0008140) |
| 0.0 | 0.1 | GO:0008240 | tripeptidyl-peptidase activity(GO:0008240) |
| 0.0 | 0.1 | GO:0017128 | phospholipid scramblase activity(GO:0017128) |
| 0.0 | 0.1 | GO:0004176 | ATP-dependent peptidase activity(GO:0004176) |
| 0.0 | 0.7 | GO:0061631 | ubiquitin conjugating enzyme activity(GO:0061631) |
| 0.0 | 0.3 | GO:0015037 | peptide disulfide oxidoreductase activity(GO:0015037) |
| 0.0 | 0.1 | GO:0008142 | oxysterol binding(GO:0008142) |
| 0.0 | 0.0 | GO:0097100 | supercoiled DNA binding(GO:0097100) |
| 0.0 | 2.0 | GO:0005089 | Rho guanyl-nucleotide exchange factor activity(GO:0005089) |
| 0.0 | 1.2 | GO:0003684 | damaged DNA binding(GO:0003684) |
| 0.0 | 0.1 | GO:0032051 | clathrin light chain binding(GO:0032051) |
| 0.0 | 0.5 | GO:0008139 | nuclear localization sequence binding(GO:0008139) |
| 0.0 | 0.4 | GO:0004435 | phosphatidylinositol phospholipase C activity(GO:0004435) |
| 0.0 | 0.6 | GO:0008276 | protein methyltransferase activity(GO:0008276) |
| 0.0 | 0.3 | GO:0097153 | cysteine-type endopeptidase activity involved in apoptotic process(GO:0097153) |
| 0.0 | 0.3 | GO:0008569 | ATP-dependent microtubule motor activity, minus-end-directed(GO:0008569) |
Gene overrepresentation in curated gene sets: canonical pathways category:
| Log-likelihood per target | Total log-likelihood | Term | Description |
|---|---|---|---|
| 0.3 | 23.5 | PID HNF3A PATHWAY | FOXA1 transcription factor network |
| 0.2 | 6.3 | PID S1P S1P4 PATHWAY | S1P4 pathway |
| 0.1 | 6.6 | PID P38 ALPHA BETA PATHWAY | Regulation of p38-alpha and p38-beta |
| 0.1 | 10.6 | PID AR PATHWAY | Coregulation of Androgen receptor activity |
| 0.1 | 1.5 | PID TGFBR PATHWAY | TGF-beta receptor signaling |
| 0.1 | 2.2 | PID HDAC CLASSIII PATHWAY | Signaling events mediated by HDAC Class III |
| 0.1 | 0.3 | ST G ALPHA S PATHWAY | G alpha s Pathway |
| 0.1 | 2.5 | PID EPHRINB REV PATHWAY | Ephrin B reverse signaling |
| 0.1 | 1.5 | PID NFKAPPAB ATYPICAL PATHWAY | Atypical NF-kappaB pathway |
| 0.1 | 2.5 | PID INTEGRIN CS PATHWAY | Integrin family cell surface interactions |
| 0.1 | 0.2 | PID IL23 PATHWAY | IL23-mediated signaling events |
| 0.1 | 2.0 | PID ALPHA SYNUCLEIN PATHWAY | Alpha-synuclein signaling |
| 0.1 | 2.2 | PID LIS1 PATHWAY | Lissencephaly gene (LIS1) in neuronal migration and development |
| 0.1 | 3.3 | PID FRA PATHWAY | Validated transcriptional targets of AP1 family members Fra1 and Fra2 |
| 0.1 | 2.9 | PID NFAT TFPATHWAY | Calcineurin-regulated NFAT-dependent transcription in lymphocytes |
| 0.1 | 1.8 | PID P38 MK2 PATHWAY | p38 signaling mediated by MAPKAP kinases |
| 0.0 | 0.4 | ST T CELL SIGNAL TRANSDUCTION | T Cell Signal Transduction |
| 0.0 | 0.9 | SA PROGRAMMED CELL DEATH | Programmed cell death, or apoptosis, eliminates damaged or unneeded cells. |
| 0.0 | 2.8 | PID HES HEY PATHWAY | Notch-mediated HES/HEY network |
| 0.0 | 2.2 | PID SYNDECAN 4 PATHWAY | Syndecan-4-mediated signaling events |
| 0.0 | 1.5 | PID ATM PATHWAY | ATM pathway |
| 0.0 | 1.3 | PID CONE PATHWAY | Visual signal transduction: Cones |
| 0.0 | 8.8 | NABA ECM AFFILIATED | Genes encoding proteins affiliated structurally or functionally to extracellular matrix proteins |
| 0.0 | 2.7 | PID CDC42 REG PATHWAY | Regulation of CDC42 activity |
| 0.0 | 1.7 | PID RXR VDR PATHWAY | RXR and RAR heterodimerization with other nuclear receptor |
| 0.0 | 0.5 | PID VEGF VEGFR PATHWAY | VEGF and VEGFR signaling network |
| 0.0 | 3.2 | PID REG GR PATHWAY | Glucocorticoid receptor regulatory network |
| 0.0 | 2.4 | PID RHOA REG PATHWAY | Regulation of RhoA activity |
| 0.0 | 2.1 | PID ERA GENOMIC PATHWAY | Validated nuclear estrogen receptor alpha network |
| 0.0 | 0.3 | PID BCR 5PATHWAY | BCR signaling pathway |
| 0.0 | 0.6 | PID P75 NTR PATHWAY | p75(NTR)-mediated signaling |
| 0.0 | 1.3 | PID FCER1 PATHWAY | Fc-epsilon receptor I signaling in mast cells |
| 0.0 | 0.4 | PID IL8 CXCR1 PATHWAY | IL8- and CXCR1-mediated signaling events |
| 0.0 | 0.6 | PID PRL SIGNALING EVENTS PATHWAY | Signaling events mediated by PRL |
| 0.0 | 1.4 | PID RB 1PATHWAY | Regulation of retinoblastoma protein |
| 0.0 | 1.4 | PID ECADHERIN STABILIZATION PATHWAY | Stabilization and expansion of the E-cadherin adherens junction |
| 0.0 | 0.2 | ST PAC1 RECEPTOR PATHWAY | PAC1 Receptor Pathway |
| 0.0 | 0.5 | PID P38 ALPHA BETA DOWNSTREAM PATHWAY | Signaling mediated by p38-alpha and p38-beta |
| 0.0 | 0.3 | PID REELIN PATHWAY | Reelin signaling pathway |
| 0.0 | 0.4 | PID MAPK TRK PATHWAY | Trk receptor signaling mediated by the MAPK pathway |
| 0.0 | 0.7 | PID ENDOTHELIN PATHWAY | Endothelins |
| 0.0 | 0.6 | PID PI3K PLC TRK PATHWAY | Trk receptor signaling mediated by PI3K and PLC-gamma |
| 0.0 | 0.0 | PID ERB GENOMIC PATHWAY | Validated nuclear estrogen receptor beta network |
| 0.0 | 0.1 | PID GLYPICAN 1PATHWAY | Glypican 1 network |
| 0.0 | 0.6 | PID RAC1 PATHWAY | RAC1 signaling pathway |
| 0.0 | 3.4 | NABA ECM GLYCOPROTEINS | Genes encoding structural ECM glycoproteins |
| 0.0 | 0.4 | PID TELOMERASE PATHWAY | Regulation of Telomerase |
| 0.0 | 0.4 | PID FANCONI PATHWAY | Fanconi anemia pathway |
Gene overrepresentation in curated gene sets: REACTOME pathways category:
| Log-likelihood per target | Total log-likelihood | Term | Description |
|---|---|---|---|
| 0.3 | 7.4 | REACTOME ADENYLATE CYCLASE INHIBITORY PATHWAY | Genes involved in Adenylate cyclase inhibitory pathway |
| 0.3 | 4.4 | REACTOME ETHANOL OXIDATION | Genes involved in Ethanol oxidation |
| 0.2 | 3.6 | REACTOME PECAM1 INTERACTIONS | Genes involved in PECAM1 interactions |
| 0.2 | 15.1 | REACTOME MYOGENESIS | Genes involved in Myogenesis |
| 0.2 | 5.1 | REACTOME DCC MEDIATED ATTRACTIVE SIGNALING | Genes involved in DCC mediated attractive signaling |
| 0.2 | 6.4 | REACTOME SYNTHESIS OF PC | Genes involved in Synthesis of PC |
| 0.1 | 1.6 | REACTOME CDC6 ASSOCIATION WITH THE ORC ORIGIN COMPLEX | Genes involved in CDC6 association with the ORC:origin complex |
| 0.1 | 1.7 | REACTOME YAP1 AND WWTR1 TAZ STIMULATED GENE EXPRESSION | Genes involved in YAP1- and WWTR1 (TAZ)-stimulated gene expression |
| 0.1 | 5.0 | REACTOME STRIATED MUSCLE CONTRACTION | Genes involved in Striated Muscle Contraction |
| 0.1 | 1.6 | REACTOME GAP JUNCTION DEGRADATION | Genes involved in Gap junction degradation |
| 0.1 | 1.1 | REACTOME RECYCLING OF BILE ACIDS AND SALTS | Genes involved in Recycling of bile acids and salts |
| 0.1 | 2.4 | REACTOME REGULATORY RNA PATHWAYS | Genes involved in Regulatory RNA pathways |
| 0.1 | 1.8 | REACTOME RNA POL III TRANSCRIPTION TERMINATION | Genes involved in RNA Polymerase III Transcription Termination |
| 0.1 | 1.1 | REACTOME THE ACTIVATION OF ARYLSULFATASES | Genes involved in The activation of arylsulfatases |
| 0.1 | 2.6 | REACTOME GLUTATHIONE CONJUGATION | Genes involved in Glutathione conjugation |
| 0.1 | 1.2 | REACTOME SYNTHESIS SECRETION AND DEACYLATION OF GHRELIN | Genes involved in Synthesis, Secretion, and Deacylation of Ghrelin |
| 0.1 | 1.7 | REACTOME CELL EXTRACELLULAR MATRIX INTERACTIONS | Genes involved in Cell-extracellular matrix interactions |
| 0.1 | 0.8 | REACTOME MRNA DECAY BY 3 TO 5 EXORIBONUCLEASE | Genes involved in mRNA Decay by 3' to 5' Exoribonuclease |
| 0.1 | 6.7 | REACTOME TRANSCRIPTIONAL REGULATION OF WHITE ADIPOCYTE DIFFERENTIATION | Genes involved in Transcriptional Regulation of White Adipocyte Differentiation |
| 0.1 | 2.6 | REACTOME ABC FAMILY PROTEINS MEDIATED TRANSPORT | Genes involved in ABC-family proteins mediated transport |
| 0.0 | 0.3 | REACTOME TRANSMISSION ACROSS CHEMICAL SYNAPSES | Genes involved in Transmission across Chemical Synapses |
| 0.0 | 1.2 | REACTOME CS DS DEGRADATION | Genes involved in CS/DS degradation |
| 0.0 | 1.1 | REACTOME CLASS C 3 METABOTROPIC GLUTAMATE PHEROMONE RECEPTORS | Genes involved in Class C/3 (Metabotropic glutamate/pheromone receptors) |
| 0.0 | 0.5 | REACTOME ELEVATION OF CYTOSOLIC CA2 LEVELS | Genes involved in Elevation of cytosolic Ca2+ levels |
| 0.0 | 0.3 | REACTOME ASSOCIATION OF LICENSING FACTORS WITH THE PRE REPLICATIVE COMPLEX | Genes involved in Association of licensing factors with the pre-replicative complex |
| 0.0 | 0.9 | REACTOME ACTIVATED TAK1 MEDIATES P38 MAPK ACTIVATION | Genes involved in activated TAK1 mediates p38 MAPK activation |
| 0.0 | 0.7 | REACTOME IL 6 SIGNALING | Genes involved in Interleukin-6 signaling |
| 0.0 | 1.7 | REACTOME AMYLOIDS | Genes involved in Amyloids |
| 0.0 | 0.6 | REACTOME P130CAS LINKAGE TO MAPK SIGNALING FOR INTEGRINS | Genes involved in p130Cas linkage to MAPK signaling for integrins |
| 0.0 | 1.0 | REACTOME SYNTHESIS OF GLYCOSYLPHOSPHATIDYLINOSITOL GPI | Genes involved in Synthesis of glycosylphosphatidylinositol (GPI) |
| 0.0 | 1.2 | REACTOME PEROXISOMAL LIPID METABOLISM | Genes involved in Peroxisomal lipid metabolism |
| 0.0 | 0.7 | REACTOME ACTIVATION OF IRF3 IRF7 MEDIATED BY TBK1 IKK EPSILON | Genes involved in Activation of IRF3/IRF7 mediated by TBK1/IKK epsilon |
| 0.0 | 1.7 | REACTOME DARPP 32 EVENTS | Genes involved in DARPP-32 events |
| 0.0 | 1.3 | REACTOME FORMATION OF FIBRIN CLOT CLOTTING CASCADE | Genes involved in Formation of Fibrin Clot (Clotting Cascade) |
| 0.0 | 1.7 | REACTOME CHONDROITIN SULFATE DERMATAN SULFATE METABOLISM | Genes involved in Chondroitin sulfate/dermatan sulfate metabolism |
| 0.0 | 1.1 | REACTOME RAP1 SIGNALLING | Genes involved in Rap1 signalling |
| 0.0 | 0.7 | REACTOME ACTIVATION OF BH3 ONLY PROTEINS | Genes involved in Activation of BH3-only proteins |
| 0.0 | 3.0 | REACTOME LOSS OF NLP FROM MITOTIC CENTROSOMES | Genes involved in Loss of Nlp from mitotic centrosomes |
| 0.0 | 0.3 | REACTOME RECYCLING PATHWAY OF L1 | Genes involved in Recycling pathway of L1 |
| 0.0 | 0.4 | REACTOME UNWINDING OF DNA | Genes involved in Unwinding of DNA |
| 0.0 | 0.2 | REACTOME CIRCADIAN REPRESSION OF EXPRESSION BY REV ERBA | Genes involved in Circadian Repression of Expression by REV-ERBA |
| 0.0 | 0.5 | REACTOME BILE SALT AND ORGANIC ANION SLC TRANSPORTERS | Genes involved in Bile salt and organic anion SLC transporters |
| 0.0 | 0.5 | REACTOME METABOLISM OF POLYAMINES | Genes involved in Metabolism of polyamines |
| 0.0 | 1.2 | REACTOME SYNTHESIS OF PIPS AT THE PLASMA MEMBRANE | Genes involved in Synthesis of PIPs at the plasma membrane |
| 0.0 | 0.4 | REACTOME SIGNALING BY FGFR1 FUSION MUTANTS | Genes involved in Signaling by FGFR1 fusion mutants |
| 0.0 | 0.9 | REACTOME LYSOSOME VESICLE BIOGENESIS | Genes involved in Lysosome Vesicle Biogenesis |
| 0.0 | 0.4 | REACTOME MITOCHONDRIAL TRNA AMINOACYLATION | Genes involved in Mitochondrial tRNA aminoacylation |
| 0.0 | 0.9 | REACTOME TRANSPORT OF VITAMINS NUCLEOSIDES AND RELATED MOLECULES | Genes involved in Transport of vitamins, nucleosides, and related molecules |
| 0.0 | 0.3 | REACTOME G0 AND EARLY G1 | Genes involved in G0 and Early G1 |
| 0.0 | 0.3 | REACTOME GABA B RECEPTOR ACTIVATION | Genes involved in GABA B receptor activation |
| 0.0 | 0.4 | REACTOME FANCONI ANEMIA PATHWAY | Genes involved in Fanconi Anemia pathway |
| 0.0 | 0.5 | REACTOME CREB PHOSPHORYLATION THROUGH THE ACTIVATION OF CAMKII | Genes involved in CREB phosphorylation through the activation of CaMKII |
| 0.0 | 0.4 | REACTOME G1 S SPECIFIC TRANSCRIPTION | Genes involved in G1/S-Specific Transcription |
| 0.0 | 0.4 | REACTOME PROLACTIN RECEPTOR SIGNALING | Genes involved in Prolactin receptor signaling |
| 0.0 | 0.5 | REACTOME BRANCHED CHAIN AMINO ACID CATABOLISM | Genes involved in Branched-chain amino acid catabolism |
| 0.0 | 0.3 | REACTOME GLUCAGON TYPE LIGAND RECEPTORS | Genes involved in Glucagon-type ligand receptors |
| 0.0 | 0.7 | REACTOME SEMA4D IN SEMAPHORIN SIGNALING | Genes involved in Sema4D in semaphorin signaling |
| 0.0 | 1.2 | REACTOME ACTIVATION OF NF KAPPAB IN B CELLS | Genes involved in Activation of NF-kappaB in B Cells |
| 0.0 | 0.4 | REACTOME PLATELET CALCIUM HOMEOSTASIS | Genes involved in Platelet calcium homeostasis |
| 0.0 | 0.2 | REACTOME SIGNALING BY SCF KIT | Genes involved in Signaling by SCF-KIT |
| 0.0 | 1.3 | REACTOME RESPIRATORY ELECTRON TRANSPORT | Genes involved in Respiratory electron transport |
| 0.0 | 1.2 | REACTOME NRAGE SIGNALS DEATH THROUGH JNK | Genes involved in NRAGE signals death through JNK |
| 0.0 | 3.6 | REACTOME G ALPHA I SIGNALLING EVENTS | Genes involved in G alpha (i) signalling events |
| 0.0 | 0.7 | REACTOME TRAFFICKING OF AMPA RECEPTORS | Genes involved in Trafficking of AMPA receptors |
| 0.0 | 0.2 | REACTOME JNK C JUN KINASES PHOSPHORYLATION AND ACTIVATION MEDIATED BY ACTIVATED HUMAN TAK1 | Genes involved in JNK (c-Jun kinases) phosphorylation and activation mediated by activated human TAK1 |
| 0.0 | 0.7 | REACTOME NEGATIVE REGULATORS OF RIG I MDA5 SIGNALING | Genes involved in Negative regulators of RIG-I/MDA5 signaling |
| 0.0 | 0.9 | REACTOME TRANSPORT OF MATURE TRANSCRIPT TO CYTOPLASM | Genes involved in Transport of Mature Transcript to Cytoplasm |
| 0.0 | 1.0 | REACTOME NUCLEAR RECEPTOR TRANSCRIPTION PATHWAY | Genes involved in Nuclear Receptor transcription pathway |
| 0.0 | 0.2 | REACTOME REGULATION OF IFNA SIGNALING | Genes involved in Regulation of IFNA signaling |
| 0.0 | 0.3 | REACTOME ZINC TRANSPORTERS | Genes involved in Zinc transporters |