Project
Inflammatory response time course, HUVEC (Wada, 2009)
Navigation
Downloads
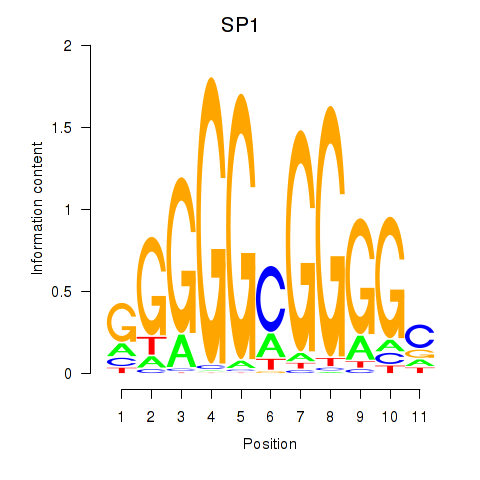
Results for SP1
Z-value: 1.74
Motif logo
Transcription factors associated with SP1
| Gene Symbol | Gene ID | Gene Info |
|---|---|---|
|
SP1
|
ENSG00000185591.10 | SP1 |
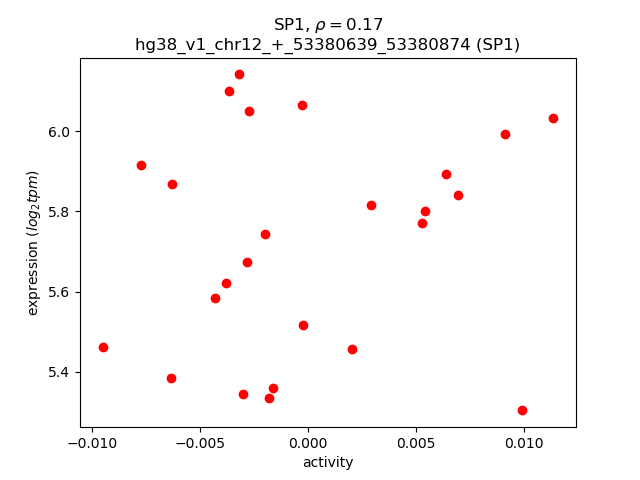
Activity-expression correlation:
| Gene | Promoter | Pearson corr. coef. | P-value | Plot |
|---|---|---|---|---|
| SP1 | hg38_v1_chr12_+_53380639_53380874, hg38_v1_chr12_+_53380141_53380210 | 0.17 | 4.2e-01 | Click! |
Activity profile of SP1 motif
Sorted Z-values of SP1 motif
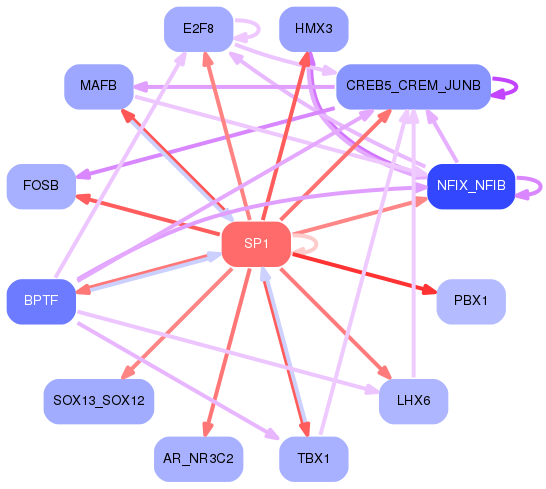
Network of associatons between targets according to the STRING database.

First level regulatory network of SP1
| Promoter | Score | Transcript | Gene | Gene Info |
|---|---|---|---|---|
| chr1_+_25616780 | 10.85 |
ENST00000374332.9
|
MAN1C1
|
mannosidase alpha class 1C member 1 |
| chr10_-_79445617 | 8.80 |
ENST00000372336.4
|
ZCCHC24
|
zinc finger CCHC-type containing 24 |
| chr20_+_43914801 | 8.76 |
ENST00000341197.9
|
TOX2
|
TOX high mobility group box family member 2 |
| chr1_+_164559173 | 8.38 |
ENST00000420696.7
|
PBX1
|
PBX homeobox 1 |
| chr14_-_91060113 | 8.33 |
ENST00000536315.6
|
RPS6KA5
|
ribosomal protein S6 kinase A5 |
| chr4_+_41360759 | 8.08 |
ENST00000508501.5
ENST00000512946.5 ENST00000313860.11 ENST00000512632.5 ENST00000512820.5 |
LIMCH1
|
LIM and calponin homology domains 1 |
| chr4_+_125314918 | 8.00 |
ENST00000674496.2
ENST00000394329.9 |
FAT4
|
FAT atypical cadherin 4 |
| chr3_+_37861849 | 7.46 |
ENST00000273179.10
|
CTDSPL
|
CTD small phosphatase like |
| chr14_-_91060578 | 6.44 |
ENST00000418736.6
ENST00000614987.5 |
RPS6KA5
|
ribosomal protein S6 kinase A5 |
| chr20_-_40689228 | 6.43 |
ENST00000373313.3
|
MAFB
|
MAF bZIP transcription factor B |
| chr12_+_122835426 | 6.19 |
ENST00000253083.9
|
HIP1R
|
huntingtin interacting protein 1 related |
| chr2_-_164621461 | 6.15 |
ENST00000446413.6
ENST00000263915.8 |
GRB14
|
growth factor receptor bound protein 14 |
| chr10_+_123135938 | 6.15 |
ENST00000357878.7
|
HMX3
|
H6 family homeobox 3 |
| chr3_+_37861926 | 6.13 |
ENST00000443503.6
|
CTDSPL
|
CTD small phosphatase like |
| chr22_+_19760714 | 6.11 |
ENST00000649276.2
|
TBX1
|
T-box transcription factor 1 |
| chr7_+_1044542 | 6.10 |
ENST00000444847.2
|
GPR146
|
G protein-coupled receptor 146 |
| chr19_+_45469841 | 6.06 |
ENST00000592811.5
ENST00000586615.5 |
FOSB
|
FosB proto-oncogene, AP-1 transcription factor subunit |
| chr4_-_101347471 | 5.89 |
ENST00000323055.10
ENST00000512215.5 |
PPP3CA
|
protein phosphatase 3 catalytic subunit alpha |
| chr13_+_31846713 | 5.85 |
ENST00000645780.1
|
FRY
|
FRY microtubule binding protein |
| chr6_-_13487593 | 5.84 |
ENST00000379287.4
ENST00000603223.1 |
GFOD1
|
glucose-fructose oxidoreductase domain containing 1 |
| chr4_+_6269831 | 5.82 |
ENST00000503569.5
ENST00000673991.1 ENST00000682275.1 ENST00000226760.5 |
WFS1
|
wolframin ER transmembrane glycoprotein |
| chr2_-_43226594 | 5.80 |
ENST00000282388.4
|
ZFP36L2
|
ZFP36 ring finger protein like 2 |
| chr3_-_64445396 | 5.65 |
ENST00000295902.11
|
PRICKLE2
|
prickle planar cell polarity protein 2 |
| chr6_-_83709019 | 5.58 |
ENST00000519779.5
ENST00000369694.6 ENST00000195649.10 |
SNAP91
|
synaptosome associated protein 91 |
| chr4_-_101347492 | 5.58 |
ENST00000394854.8
|
PPP3CA
|
protein phosphatase 3 catalytic subunit alpha |
| chr4_-_101347327 | 5.45 |
ENST00000394853.8
|
PPP3CA
|
protein phosphatase 3 catalytic subunit alpha |
| chr12_+_53046969 | 5.37 |
ENST00000379902.7
|
TNS2
|
tensin 2 |
| chr1_-_231040218 | 5.26 |
ENST00000366654.5
|
FAM89A
|
family with sequence similarity 89 member A |
| chr8_+_143734133 | 5.25 |
ENST00000527139.7
ENST00000533004.5 |
IQANK1
|
IQ motif and ankyrin repeat containing 1 |
| chr4_+_6269869 | 5.11 |
ENST00000506362.2
|
WFS1
|
wolframin ER transmembrane glycoprotein |
| chr6_-_83709141 | 5.05 |
ENST00000521743.5
|
SNAP91
|
synaptosome associated protein 91 |
| chr11_-_33869816 | 5.05 |
ENST00000395833.7
|
LMO2
|
LIM domain only 2 |
| chr19_+_39406831 | 5.00 |
ENST00000597629.3
ENST00000594442.2 ENST00000594045.2 |
ZFP36
|
ZFP36 ring finger protein |
| chr10_+_35126791 | 4.94 |
ENST00000474362.5
ENST00000374721.7 |
CREM
|
cAMP responsive element modulator |
| chr8_-_123274433 | 4.91 |
ENST00000297857.3
|
ZHX1
|
zinc fingers and homeoboxes 1 |
| chr18_+_11981488 | 4.91 |
ENST00000269159.8
|
IMPA2
|
inositol monophosphatase 2 |
| chr12_-_46372763 | 4.89 |
ENST00000256689.10
|
SLC38A2
|
solute carrier family 38 member 2 |
| chr3_+_111071773 | 4.81 |
ENST00000485303.6
|
NECTIN3
|
nectin cell adhesion molecule 3 |
| chr17_+_7834200 | 4.79 |
ENST00000448097.7
|
KDM6B
|
lysine demethylase 6B |
| chr18_-_25352116 | 4.79 |
ENST00000584787.5
ENST00000538137.6 ENST00000361524.8 |
ZNF521
|
zinc finger protein 521 |
| chr3_-_18424533 | 4.76 |
ENST00000417717.6
|
SATB1
|
SATB homeobox 1 |
| chr3_-_15859771 | 4.76 |
ENST00000399451.6
|
ANKRD28
|
ankyrin repeat domain 28 |
| chr3_+_32238667 | 4.75 |
ENST00000458535.6
ENST00000307526.4 |
CMTM8
|
CKLF like MARVEL transmembrane domain containing 8 |
| chr13_+_32031300 | 4.75 |
ENST00000642040.1
|
FRY
|
FRY microtubule binding protein |
| chr16_-_30096170 | 4.74 |
ENST00000566134.5
ENST00000565110.5 ENST00000398841.6 ENST00000398838.8 |
YPEL3
|
yippee like 3 |
| chr1_+_25543598 | 4.72 |
ENST00000374338.5
|
LDLRAP1
|
low density lipoprotein receptor adaptor protein 1 |
| chr4_-_148442342 | 4.71 |
ENST00000358102.8
|
NR3C2
|
nuclear receptor subfamily 3 group C member 2 |
| chr3_+_39809602 | 4.71 |
ENST00000302541.11
ENST00000396217.7 |
MYRIP
|
myosin VIIA and Rab interacting protein |
| chr10_+_35127162 | 4.70 |
ENST00000354759.7
|
CREM
|
cAMP responsive element modulator |
| chr9_+_128552558 | 4.67 |
ENST00000372731.8
ENST00000630804.2 ENST00000372739.7 ENST00000627441.2 ENST00000358161.9 ENST00000636257.1 |
SPTAN1
|
spectrin alpha, non-erythrocytic 1 |
| chr12_-_94650506 | 4.67 |
ENST00000261226.9
|
TMCC3
|
transmembrane and coiled-coil domain family 3 |
| chr17_+_67825664 | 4.66 |
ENST00000321892.8
|
BPTF
|
bromodomain PHD finger transcription factor |
| chr1_-_33182030 | 4.64 |
ENST00000291416.10
|
TRIM62
|
tripartite motif containing 62 |
| chr6_+_15248855 | 4.63 |
ENST00000397311.4
|
JARID2
|
jumonji and AT-rich interaction domain containing 2 |
| chr1_-_211579064 | 4.63 |
ENST00000367001.5
|
SLC30A1
|
solute carrier family 30 member 1 |
| chr14_-_53956811 | 4.60 |
ENST00000559087.5
ENST00000245451.9 |
BMP4
|
bone morphogenetic protein 4 |
| chr11_-_2885728 | 4.57 |
ENST00000647251.1
ENST00000380725.2 ENST00000430149.3 ENST00000414822.8 ENST00000440480.8 |
CDKN1C
|
cyclin dependent kinase inhibitor 1C |
| chr14_+_24398986 | 4.53 |
ENST00000382554.4
|
NYNRIN
|
NYN domain and retroviral integrase containing |
| chr2_-_239400991 | 4.51 |
ENST00000543185.6
|
HDAC4
|
histone deacetylase 4 |
| chr8_-_123274255 | 4.51 |
ENST00000622816.2
ENST00000395571.8 |
ZHX1-C8orf76
ZHX1
|
ZHX1-C8orf76 readthrough zinc fingers and homeoboxes 1 |
| chr10_+_35127023 | 4.48 |
ENST00000429130.7
ENST00000469949.6 ENST00000460270.5 |
CREM
|
cAMP responsive element modulator |
| chr4_-_148442508 | 4.48 |
ENST00000625323.2
|
NR3C2
|
nuclear receptor subfamily 3 group C member 2 |
| chr8_-_102655707 | 4.46 |
ENST00000285407.11
|
KLF10
|
Kruppel like factor 10 |
| chr9_-_122213903 | 4.44 |
ENST00000464484.3
|
LHX6
|
LIM homeobox 6 |
| chr13_-_109786567 | 4.40 |
ENST00000375856.5
|
IRS2
|
insulin receptor substrate 2 |
| chr12_+_27244222 | 4.40 |
ENST00000545470.5
ENST00000389032.8 ENST00000540996.5 |
STK38L
|
serine/threonine kinase 38 like |
| chr9_-_122213874 | 4.36 |
ENST00000482062.1
|
LHX6
|
LIM homeobox 6 |
| chr20_+_36154630 | 4.33 |
ENST00000338074.7
ENST00000636016.2 ENST00000373945.5 |
EPB41L1
|
erythrocyte membrane protein band 4.1 like 1 |
| chr5_-_111757465 | 4.30 |
ENST00000446294.6
|
NREP
|
neuronal regeneration related protein |
| chr5_-_111757704 | 4.28 |
ENST00000379671.7
|
NREP
|
neuronal regeneration related protein |
| chr2_-_239400949 | 4.28 |
ENST00000345617.7
|
HDAC4
|
histone deacetylase 4 |
| chr3_-_47578832 | 4.27 |
ENST00000264723.9
ENST00000610462.1 |
CSPG5
|
chondroitin sulfate proteoglycan 5 |
| chr7_+_80134794 | 4.26 |
ENST00000649796.2
|
GNAI1
|
G protein subunit alpha i1 |
| chr1_-_9910169 | 4.25 |
ENST00000377263.6
|
CTNNBIP1
|
catenin beta interacting protein 1 |
| chr11_-_130314858 | 4.25 |
ENST00000527478.6
ENST00000357899.9 |
ZBTB44
|
zinc finger and BTB domain containing 44 |
| chr14_+_61321571 | 4.23 |
ENST00000332981.11
|
PRKCH
|
protein kinase C eta |
| chr14_-_105168753 | 4.22 |
ENST00000331782.8
ENST00000347004.2 |
JAG2
|
jagged canonical Notch ligand 2 |
| chr19_-_11339573 | 4.21 |
ENST00000222120.8
|
RAB3D
|
RAB3D, member RAS oncogene family |
| chr2_+_111898592 | 4.21 |
ENST00000295408.9
ENST00000421804.6 ENST00000616902.4 ENST00000409780.5 |
MERTK
|
MER proto-oncogene, tyrosine kinase |
| chr19_-_11197516 | 4.19 |
ENST00000592903.5
ENST00000586659.6 ENST00000589359.5 ENST00000588724.5 |
KANK2
|
KN motif and ankyrin repeat domains 2 |
| chr11_-_130314686 | 4.15 |
ENST00000525842.5
|
ZBTB44
|
zinc finger and BTB domain containing 44 |
| chr8_-_126558461 | 4.13 |
ENST00000304916.4
|
LRATD2
|
LRAT domain containing 2 |
| chr9_-_35749165 | 4.11 |
ENST00000378094.4
ENST00000378103.7 |
GBA2
|
glucosylceramidase beta 2 |
| chr8_-_29263063 | 4.08 |
ENST00000524189.6
|
KIF13B
|
kinesin family member 13B |
| chr17_+_83079595 | 4.04 |
ENST00000320095.12
|
METRNL
|
meteorin like, glial cell differentiation regulator |
| chr19_-_31349408 | 4.04 |
ENST00000240587.5
|
TSHZ3
|
teashirt zinc finger homeobox 3 |
| chr6_-_129710145 | 4.03 |
ENST00000368149.3
|
ARHGAP18
|
Rho GTPase activating protein 18 |
| chr11_-_19241598 | 3.99 |
ENST00000532666.1
ENST00000527884.5 ENST00000620009.4 |
E2F8
|
E2F transcription factor 8 |
| chr10_+_92848461 | 3.97 |
ENST00000443748.6
ENST00000371543.5 ENST00000260762.10 |
EXOC6
|
exocyst complex component 6 |
| chr22_+_50674879 | 3.95 |
ENST00000262795.6
|
SHANK3
|
SH3 and multiple ankyrin repeat domains 3 |
| chr20_+_325536 | 3.93 |
ENST00000342665.5
|
SOX12
|
SRY-box transcription factor 12 |
| chr15_+_63277586 | 3.91 |
ENST00000261879.10
ENST00000380343.8 ENST00000560353.1 |
APH1B
|
aph-1 homolog B, gamma-secretase subunit |
| chr10_-_124092445 | 3.91 |
ENST00000346248.7
|
CHST15
|
carbohydrate sulfotransferase 15 |
| chr8_+_1763832 | 3.90 |
ENST00000520991.3
|
CLN8
|
CLN8 transmembrane ER and ERGIC protein |
| chrX_-_63351308 | 3.88 |
ENST00000374884.3
|
SPIN4
|
spindlin family member 4 |
| chr22_+_19714450 | 3.88 |
ENST00000455784.7
ENST00000406395.5 |
SEPTIN5
|
septin 5 |
| chr8_+_1763752 | 3.87 |
ENST00000519254.2
|
CLN8
|
CLN8 transmembrane ER and ERGIC protein |
| chr9_-_14314567 | 3.86 |
ENST00000397579.6
|
NFIB
|
nuclear factor I B |
| chr2_+_46297397 | 3.84 |
ENST00000263734.5
|
EPAS1
|
endothelial PAS domain protein 1 |
| chr8_-_9150648 | 3.84 |
ENST00000310455.4
|
PPP1R3B
|
protein phosphatase 1 regulatory subunit 3B |
| chr5_-_111757382 | 3.81 |
ENST00000453526.6
ENST00000509427.5 |
NREP
|
neuronal regeneration related protein |
| chr9_-_78031775 | 3.81 |
ENST00000286548.9
|
GNAQ
|
G protein subunit alpha q |
| chr6_-_98947911 | 3.78 |
ENST00000369244.7
ENST00000229971.2 |
FBXL4
|
F-box and leucine rich repeat protein 4 |
| chr1_+_61082398 | 3.77 |
ENST00000664149.1
|
NFIA
|
nuclear factor I A |
| chr16_+_30395400 | 3.77 |
ENST00000320159.2
ENST00000613509.2 |
ZNF48
|
zinc finger protein 48 |
| chr21_+_17513003 | 3.76 |
ENST00000284878.12
ENST00000400166.5 |
CXADR
|
CXADR Ig-like cell adhesion molecule |
| chr6_-_110179623 | 3.76 |
ENST00000265601.7
ENST00000447287.5 ENST00000392589.6 ENST00000444391.5 |
WASF1
|
WASP family member 1 |
| chr2_+_12716893 | 3.74 |
ENST00000381465.2
ENST00000155926.9 |
TRIB2
|
tribbles pseudokinase 2 |
| chr8_-_22693469 | 3.72 |
ENST00000317216.3
|
EGR3
|
early growth response 3 |
| chr19_-_14090963 | 3.70 |
ENST00000269724.5
|
SAMD1
|
sterile alpha motif domain containing 1 |
| chr14_+_56118404 | 3.69 |
ENST00000267460.9
|
PELI2
|
pellino E3 ubiquitin protein ligase family member 2 |
| chr7_+_80135079 | 3.68 |
ENST00000649634.1
|
GNAI1
|
G protein subunit alpha i1 |
| chr2_+_190880809 | 3.67 |
ENST00000320717.8
|
GLS
|
glutaminase |
| chr6_-_110179702 | 3.67 |
ENST00000392587.6
|
WASF1
|
WASP family member 1 |
| chr1_-_154502402 | 3.66 |
ENST00000304760.3
|
SHE
|
Src homology 2 domain containing E |
| chr3_+_43286512 | 3.64 |
ENST00000454177.5
ENST00000429705.6 ENST00000296088.12 ENST00000437827.1 |
SNRK
|
SNF related kinase |
| chr11_-_66677748 | 3.64 |
ENST00000525754.5
ENST00000531969.5 ENST00000524637.1 ENST00000531036.2 ENST00000310046.9 |
RBM4B
|
RNA binding motif protein 4B |
| chr11_-_19240936 | 3.63 |
ENST00000250024.9
|
E2F8
|
E2F transcription factor 8 |
| chr5_-_111757549 | 3.63 |
ENST00000419114.6
|
NREP
|
neuronal regeneration related protein |
| chr17_-_37359076 | 3.62 |
ENST00000621960.1
ENST00000614428.4 ENST00000614789.4 |
ACACA
|
acetyl-CoA carboxylase alpha |
| chr16_+_55509006 | 3.60 |
ENST00000262134.10
|
LPCAT2
|
lysophosphatidylcholine acyltransferase 2 |
| chr22_-_37519528 | 3.60 |
ENST00000403299.5
|
CARD10
|
caspase recruitment domain family member 10 |
| chr10_-_73874568 | 3.58 |
ENST00000322635.7
ENST00000322680.7 ENST00000394762.7 ENST00000680035.1 |
CAMK2G
|
calcium/calmodulin dependent protein kinase II gamma |
| chr7_+_17298642 | 3.57 |
ENST00000242057.9
|
AHR
|
aryl hydrocarbon receptor |
| chr13_-_48533069 | 3.55 |
ENST00000344532.8
|
RCBTB2
|
RCC1 and BTB domain containing protein 2 |
| chr3_-_171460063 | 3.53 |
ENST00000284483.12
ENST00000475336.5 ENST00000357327.9 ENST00000460047.5 ENST00000488470.5 ENST00000470834.5 |
TNIK
|
TRAF2 and NCK interacting kinase |
| chr11_-_130314575 | 3.53 |
ENST00000397753.5
|
ZBTB44
|
zinc finger and BTB domain containing 44 |
| chr11_-_119364166 | 3.53 |
ENST00000525735.1
|
USP2
|
ubiquitin specific peptidase 2 |
| chr6_+_11537738 | 3.53 |
ENST00000379426.2
|
TMEM170B
|
transmembrane protein 170B |
| chr6_-_16761447 | 3.47 |
ENST00000244769.8
ENST00000436367.6 |
ATXN1
|
ataxin 1 |
| chr7_+_7968787 | 3.46 |
ENST00000223145.10
|
GLCCI1
|
glucocorticoid induced 1 |
| chr22_-_37519349 | 3.46 |
ENST00000251973.10
|
CARD10
|
caspase recruitment domain family member 10 |
| chr1_+_113979460 | 3.45 |
ENST00000320334.5
|
OLFML3
|
olfactomedin like 3 |
| chr15_+_57376497 | 3.44 |
ENST00000281282.6
|
CGNL1
|
cingulin like 1 |
| chr10_-_73874461 | 3.43 |
ENST00000305762.11
|
CAMK2G
|
calcium/calmodulin dependent protein kinase II gamma |
| chr5_+_138465472 | 3.43 |
ENST00000239938.5
|
EGR1
|
early growth response 1 |
| chr12_+_3077355 | 3.41 |
ENST00000537971.5
ENST00000011898.10 ENST00000649909.1 |
TSPAN9
|
tetraspanin 9 |
| chr15_-_68820861 | 3.41 |
ENST00000560303.1
ENST00000465139.6 |
ANP32A
|
acidic nuclear phosphoprotein 32 family member A |
| chr4_-_148444674 | 3.40 |
ENST00000344721.8
|
NR3C2
|
nuclear receptor subfamily 3 group C member 2 |
| chr13_-_106535653 | 3.39 |
ENST00000646441.1
|
EFNB2
|
ephrin B2 |
| chr19_-_6279921 | 3.38 |
ENST00000252674.9
|
MLLT1
|
MLLT1 super elongation complex subunit |
| chr1_+_76074698 | 3.37 |
ENST00000328299.4
|
ST6GALNAC3
|
ST6 N-acetylgalactosaminide alpha-2,6-sialyltransferase 3 |
| chr2_-_74440484 | 3.37 |
ENST00000305557.9
ENST00000233330.6 |
RTKN
|
rhotekin |
| chr19_+_45340774 | 3.36 |
ENST00000589837.5
|
KLC3
|
kinesin light chain 3 |
| chr1_+_113979391 | 3.36 |
ENST00000393300.6
ENST00000369551.5 |
OLFML3
|
olfactomedin like 3 |
| chr6_-_110179995 | 3.35 |
ENST00000392586.5
ENST00000419252.1 ENST00000359451.6 ENST00000392588.5 |
WASF1
|
WASP family member 1 |
| chr9_-_122228845 | 3.35 |
ENST00000394319.8
ENST00000340587.7 |
LHX6
|
LIM homeobox 6 |
| chr18_+_11981015 | 3.32 |
ENST00000589238.5
|
IMPA2
|
inositol monophosphatase 2 |
| chr13_+_32031706 | 3.30 |
ENST00000542859.6
|
FRY
|
FRY microtubule binding protein |
| chr3_+_50155305 | 3.29 |
ENST00000002829.8
ENST00000426511.5 |
SEMA3F
|
semaphorin 3F |
| chr22_-_39152622 | 3.28 |
ENST00000216133.10
|
CBX7
|
chromobox 7 |
| chrX_+_67543973 | 3.27 |
ENST00000374690.9
|
AR
|
androgen receptor |
| chr1_+_34792990 | 3.27 |
ENST00000450137.1
ENST00000342280.5 |
GJA4
|
gap junction protein alpha 4 |
| chr12_+_19129779 | 3.27 |
ENST00000539256.5
ENST00000299275.10 ENST00000538714.5 |
PLEKHA5
|
pleckstrin homology domain containing A5 |
| chr20_-_25058115 | 3.26 |
ENST00000323482.9
|
ACSS1
|
acyl-CoA synthetase short chain family member 1 |
| chr9_-_109013483 | 3.25 |
ENST00000325551.9
ENST00000374593.4 ENST00000374595.8 |
CTNNAL1
|
catenin alpha like 1 |
| chr13_-_71866769 | 3.24 |
ENST00000619232.1
|
DACH1
|
dachshund family transcription factor 1 |
| chr14_-_53953415 | 3.22 |
ENST00000559501.1
ENST00000558984.1 |
BMP4
|
bone morphogenetic protein 4 |
| chr12_+_57089094 | 3.21 |
ENST00000342556.6
ENST00000300131.8 |
NAB2
|
NGFI-A binding protein 2 |
| chr15_-_34367045 | 3.21 |
ENST00000617710.4
|
LPCAT4
|
lysophosphatidylcholine acyltransferase 4 |
| chr17_-_50866347 | 3.20 |
ENST00000499247.3
|
TOB1
|
transducer of ERBB2, 1 |
| chr2_+_45651650 | 3.19 |
ENST00000306156.8
|
PRKCE
|
protein kinase C epsilon |
| chr17_-_49764123 | 3.16 |
ENST00000240364.7
ENST00000506156.1 |
FAM117A
|
family with sequence similarity 117 member A |
| chr10_-_129964240 | 3.14 |
ENST00000440978.2
ENST00000355311.10 |
EBF3
|
EBF transcription factor 3 |
| chr10_-_95561355 | 3.14 |
ENST00000607232.5
ENST00000371247.7 ENST00000371227.8 ENST00000371249.6 ENST00000371246.6 ENST00000306402.10 |
SORBS1
|
sorbin and SH3 domain containing 1 |
| chr6_-_110815408 | 3.14 |
ENST00000368911.8
|
CDK19
|
cyclin dependent kinase 19 |
| chr9_+_136665745 | 3.13 |
ENST00000371698.3
|
EGFL7
|
EGF like domain multiple 7 |
| chr7_+_90211686 | 3.12 |
ENST00000287908.7
ENST00000394621.7 ENST00000394626.5 |
STEAP2
|
STEAP2 metalloreductase |
| chr1_+_26529745 | 3.12 |
ENST00000374168.7
ENST00000374166.8 |
RPS6KA1
|
ribosomal protein S6 kinase A1 |
| chr7_-_140478975 | 3.12 |
ENST00000474576.5
ENST00000473444.1 ENST00000471104.5 |
MKRN1
|
makorin ring finger protein 1 |
| chr9_-_81689536 | 3.12 |
ENST00000376499.8
|
TLE1
|
TLE family member 1, transcriptional corepressor |
| chrX_-_63785510 | 3.12 |
ENST00000437457.6
ENST00000374878.5 ENST00000623517.3 |
ARHGEF9
|
Cdc42 guanine nucleotide exchange factor 9 |
| chrX_-_120561424 | 3.10 |
ENST00000681206.1
ENST00000679927.1 ENST00000336592.11 |
CUL4B
|
cullin 4B |
| chr8_-_31033582 | 3.10 |
ENST00000339382.3
ENST00000475541.2 |
PURG
|
purine rich element binding protein G |
| chr1_+_203305510 | 3.10 |
ENST00000290551.5
|
BTG2
|
BTG anti-proliferation factor 2 |
| chr2_+_11155498 | 3.09 |
ENST00000402361.5
ENST00000428481.1 |
SLC66A3
|
solute carrier family 66 member 3 |
| chr9_-_136687422 | 3.08 |
ENST00000371696.7
|
AGPAT2
|
1-acylglycerol-3-phosphate O-acyltransferase 2 |
| chrX_+_72069659 | 3.07 |
ENST00000631375.1
|
NHSL2
|
NHS like 2 |
| chr9_-_14314132 | 3.06 |
ENST00000380953.6
|
NFIB
|
nuclear factor I B |
| chr19_-_17245889 | 3.06 |
ENST00000291442.4
|
NR2F6
|
nuclear receptor subfamily 2 group F member 6 |
| chr3_+_20040437 | 3.06 |
ENST00000263754.5
|
KAT2B
|
lysine acetyltransferase 2B |
| chr4_-_98658582 | 3.05 |
ENST00000305798.8
|
TSPAN5
|
tetraspanin 5 |
| chr3_+_50155024 | 3.05 |
ENST00000414301.5
ENST00000450338.5 ENST00000413852.5 |
SEMA3F
|
semaphorin 3F |
| chr11_+_7513966 | 3.05 |
ENST00000299492.9
|
PPFIBP2
|
PPFIA binding protein 2 |
| chr5_-_111757643 | 3.05 |
ENST00000508870.5
|
NREP
|
neuronal regeneration related protein |
| chr10_+_129467178 | 3.04 |
ENST00000306010.8
ENST00000651593.1 |
MGMT
|
O-6-methylguanine-DNA methyltransferase |
| chr16_+_77722473 | 3.03 |
ENST00000613075.4
|
NUDT7
|
nudix hydrolase 7 |
| chr2_-_189580773 | 3.02 |
ENST00000261024.7
|
SLC40A1
|
solute carrier family 40 member 1 |
| chr19_+_40778216 | 3.02 |
ENST00000594800.5
ENST00000357052.8 ENST00000602173.5 |
RAB4B
|
RAB4B, member RAS oncogene family |
| chr1_+_108560031 | 3.00 |
ENST00000405454.1
ENST00000370035.8 |
FAM102B
|
family with sequence similarity 102 member B |
| chr12_-_56221701 | 2.99 |
ENST00000615206.4
ENST00000549038.5 ENST00000552244.5 |
RNF41
|
ring finger protein 41 |
| chr1_-_32702736 | 2.99 |
ENST00000373484.4
ENST00000409190.8 |
SYNC
|
syncoilin, intermediate filament protein |
| chr19_+_49691103 | 2.98 |
ENST00000323446.9
ENST00000392518.8 ENST00000598293.6 ENST00000598396.5 ENST00000405931.6 ENST00000602019.5 |
CPT1C
|
carnitine palmitoyltransferase 1C |
| chr3_+_58237501 | 2.97 |
ENST00000295962.8
|
ABHD6
|
abhydrolase domain containing 6, acylglycerol lipase |
| chrX_+_102712438 | 2.97 |
ENST00000486814.2
ENST00000535209.6 ENST00000543253.6 ENST00000332262.10 ENST00000483720.6 |
GPRASP2
|
G protein-coupled receptor associated sorting protein 2 |
| chr6_-_111483700 | 2.96 |
ENST00000435970.5
ENST00000358835.7 |
REV3L
|
REV3 like, DNA directed polymerase zeta catalytic subunit |
| chr1_+_10032832 | 2.96 |
ENST00000253251.12
ENST00000672724.1 ENST00000343090.11 |
UBE4B
|
ubiquitination factor E4B |
| chr3_+_143971784 | 2.96 |
ENST00000315691.8
|
DIPK2A
|
divergent protein kinase domain 2A |
| chr1_+_37474572 | 2.96 |
ENST00000373087.7
|
ZC3H12A
|
zinc finger CCCH-type containing 12A |
| chr8_+_123416766 | 2.95 |
ENST00000287387.7
ENST00000650311.1 ENST00000523356.1 |
NTAQ1
|
N-terminal glutamine amidase 1 |
Gene Ontology Analysis
Gene overrepresentation in biological process category:
| Log-likelihood per target | Total log-likelihood | Term | Description |
|---|---|---|---|
| 5.0 | 19.8 | GO:1905205 | positive regulation of connective tissue replacement(GO:1905205) |
| 3.8 | 15.2 | GO:1904428 | negative regulation of tubulin deacetylation(GO:1904428) |
| 3.6 | 10.9 | GO:1903892 | negative regulation of ATF6-mediated unfolded protein response(GO:1903892) |
| 3.3 | 13.2 | GO:1904381 | Golgi apparatus mannose trimming(GO:1904381) |
| 3.2 | 9.6 | GO:0060503 | apoptotic process involved in endocardial cushion morphogenesis(GO:0003277) intermediate mesoderm morphogenesis(GO:0048390) intermediate mesoderm formation(GO:0048391) intermediate mesodermal cell differentiation(GO:0048392) regulation of cardiac muscle fiber development(GO:0055018) positive regulation of cardiac muscle fiber development(GO:0055020) bud dilation involved in lung branching(GO:0060503) BMP signaling pathway involved in ureter morphogenesis(GO:0061149) renal system segmentation(GO:0061150) BMP signaling pathway involved in renal system segmentation(GO:0061151) pulmonary artery endothelial tube morphogenesis(GO:0061155) regulation of transcription from RNA polymerase II promoter involved in mesonephros development(GO:0061216) BMP signaling pathway involved in nephric duct formation(GO:0071893) negative regulation of branch elongation involved in ureteric bud branching(GO:0072096) negative regulation of branch elongation involved in ureteric bud branching by BMP signaling pathway(GO:0072097) anterior/posterior pattern specification involved in ureteric bud development(GO:0072099) specification of ureteric bud anterior/posterior symmetry(GO:0072100) specification of ureteric bud anterior/posterior symmetry by BMP signaling pathway(GO:0072101) ureter epithelial cell differentiation(GO:0072192) negative regulation of mesenchymal cell proliferation involved in ureter development(GO:0072200) positive regulation of cell proliferation involved in outflow tract morphogenesis(GO:1901964) cardiac jelly development(GO:1905072) regulation of metanephric S-shaped body morphogenesis(GO:2000004) negative regulation of metanephric S-shaped body morphogenesis(GO:2000005) regulation of metanephric comma-shaped body morphogenesis(GO:2000006) negative regulation of metanephric comma-shaped body morphogenesis(GO:2000007) |
| 2.9 | 14.6 | GO:0043988 | histone H3-S28 phosphorylation(GO:0043988) |
| 2.7 | 2.7 | GO:2000137 | negative regulation of cell proliferation involved in heart morphogenesis(GO:2000137) |
| 2.7 | 8.1 | GO:0019427 | acetate biosynthetic process(GO:0019413) acetyl-CoA biosynthetic process from acetate(GO:0019427) propionate biosynthetic process(GO:0019542) |
| 2.5 | 7.6 | GO:0032888 | regulation of spindle elongation(GO:0032887) regulation of mitotic spindle elongation(GO:0032888) anastral spindle assembly(GO:0055048) protein localization to spindle pole body(GO:0071988) regulation of protein localization to spindle pole body(GO:1902363) positive regulation of protein localization to spindle pole body(GO:1902365) positive regulation of mitotic spindle elongation(GO:1902846) |
| 2.3 | 9.2 | GO:0035284 | rhombomere 5 development(GO:0021571) central nervous system segmentation(GO:0035283) brain segmentation(GO:0035284) |
| 2.2 | 8.6 | GO:0072137 | condensed mesenchymal cell proliferation(GO:0072137) |
| 2.0 | 6.1 | GO:0060957 | endocardial cell fate commitment(GO:0060957) endocardial cushion cell fate commitment(GO:0061445) |
| 2.0 | 2.0 | GO:1901187 | regulation of ephrin receptor signaling pathway(GO:1901187) |
| 2.0 | 6.0 | GO:1904761 | negative regulation of myofibroblast differentiation(GO:1904761) |
| 2.0 | 8.0 | GO:0021644 | vagus nerve morphogenesis(GO:0021644) |
| 2.0 | 11.8 | GO:0006021 | inositol biosynthetic process(GO:0006021) |
| 1.9 | 5.8 | GO:0034031 | coenzyme A catabolic process(GO:0015938) nucleoside bisphosphate catabolic process(GO:0033869) ribonucleoside bisphosphate catabolic process(GO:0034031) purine nucleoside bisphosphate catabolic process(GO:0034034) |
| 1.9 | 5.8 | GO:0032877 | positive regulation of DNA endoreduplication(GO:0032877) |
| 1.8 | 1.8 | GO:0061441 | renal artery morphogenesis(GO:0061441) |
| 1.8 | 20.1 | GO:2000795 | negative regulation of epithelial cell proliferation involved in lung morphogenesis(GO:2000795) |
| 1.8 | 7.3 | GO:1903296 | regulation of glutamate secretion, neurotransmission(GO:1903294) positive regulation of glutamate secretion, neurotransmission(GO:1903296) |
| 1.7 | 5.2 | GO:0061290 | cell-cell signaling involved in kidney development(GO:0060995) Wnt signaling pathway involved in kidney development(GO:0061289) canonical Wnt signaling pathway involved in metanephric kidney development(GO:0061290) cell-cell signaling involved in metanephros development(GO:0072204) |
| 1.6 | 3.3 | GO:0016476 | regulation of embryonic cell shape(GO:0016476) |
| 1.5 | 7.7 | GO:0090118 | receptor-mediated endocytosis of low-density lipoprotein particle involved in cholesterol transport(GO:0090118) |
| 1.5 | 4.6 | GO:0007037 | vacuolar phosphate transport(GO:0007037) positive regulation of mitotic cell cycle DNA replication(GO:1903465) positive regulation of parathyroid hormone secretion(GO:2000830) |
| 1.5 | 10.4 | GO:0018317 | protein C-linked glycosylation(GO:0018103) peptidyl-tryptophan modification(GO:0018211) protein C-linked glycosylation via tryptophan(GO:0018317) protein C-linked glycosylation via 2'-alpha-mannosyl-L-tryptophan(GO:0018406) |
| 1.4 | 4.3 | GO:1901420 | negative regulation of response to alcohol(GO:1901420) |
| 1.4 | 4.3 | GO:1904580 | regulation of intracellular mRNA localization(GO:1904580) positive regulation of intracellular mRNA localization(GO:1904582) |
| 1.4 | 4.3 | GO:0002528 | regulation of vascular permeability involved in acute inflammatory response(GO:0002528) |
| 1.4 | 13.5 | GO:2000601 | positive regulation of Arp2/3 complex-mediated actin nucleation(GO:2000601) |
| 1.3 | 10.7 | GO:0060398 | regulation of growth hormone receptor signaling pathway(GO:0060398) |
| 1.3 | 9.0 | GO:0036484 | trunk segmentation(GO:0035290) trunk neural crest cell migration(GO:0036484) ventral trunk neural crest cell migration(GO:0036486) |
| 1.3 | 7.7 | GO:0038016 | insulin receptor internalization(GO:0038016) |
| 1.3 | 1.3 | GO:0035377 | transepithelial water transport(GO:0035377) |
| 1.2 | 3.7 | GO:0035674 | tricarboxylic acid transmembrane transport(GO:0035674) |
| 1.2 | 4.9 | GO:0046368 | GDP-L-fucose metabolic process(GO:0046368) |
| 1.2 | 3.6 | GO:0098758 | response to interleukin-8(GO:0098758) cellular response to interleukin-8(GO:0098759) |
| 1.2 | 3.5 | GO:1905053 | regulation of base-excision repair(GO:1905051) positive regulation of base-excision repair(GO:1905053) |
| 1.2 | 3.5 | GO:2000974 | negative regulation of pro-B cell differentiation(GO:2000974) |
| 1.1 | 4.6 | GO:0006663 | platelet activating factor biosynthetic process(GO:0006663) |
| 1.1 | 3.4 | GO:0030327 | prenylated protein catabolic process(GO:0030327) |
| 1.1 | 2.3 | GO:0035990 | tendon cell differentiation(GO:0035990) tendon formation(GO:0035992) |
| 1.1 | 5.6 | GO:0032185 | septin cytoskeleton organization(GO:0032185) |
| 1.1 | 4.4 | GO:1904980 | positive regulation of endosome organization(GO:1904980) |
| 1.1 | 15.6 | GO:1902894 | negative regulation of pri-miRNA transcription from RNA polymerase II promoter(GO:1902894) |
| 1.1 | 8.7 | GO:0034316 | negative regulation of Arp2/3 complex-mediated actin nucleation(GO:0034316) |
| 1.1 | 3.2 | GO:1901491 | negative regulation of lymphangiogenesis(GO:1901491) |
| 1.1 | 3.2 | GO:0060599 | lateral sprouting involved in mammary gland duct morphogenesis(GO:0060599) |
| 1.0 | 5.2 | GO:0093001 | glycolysis from storage polysaccharide through glucose-1-phosphate(GO:0093001) |
| 1.0 | 3.1 | GO:0015920 | lipopolysaccharide transport(GO:0015920) |
| 1.0 | 5.1 | GO:0098904 | regulation of AV node cell action potential(GO:0098904) |
| 1.0 | 3.0 | GO:0034395 | regulation of transcription from RNA polymerase II promoter in response to iron(GO:0034395) |
| 1.0 | 5.0 | GO:0018076 | N-terminal peptidyl-lysine acetylation(GO:0018076) |
| 1.0 | 1.0 | GO:0036482 | neuron intrinsic apoptotic signaling pathway in response to hydrogen peroxide(GO:0036482) positive regulation of mitochondrial electron transport, NADH to ubiquinone(GO:1902958) regulation of hydrogen peroxide-induced neuron intrinsic apoptotic signaling pathway(GO:1903383) negative regulation of hydrogen peroxide-induced neuron intrinsic apoptotic signaling pathway(GO:1903384) |
| 1.0 | 2.0 | GO:0061074 | regulation of neural retina development(GO:0061074) |
| 1.0 | 8.9 | GO:0048170 | positive regulation of long-term neuronal synaptic plasticity(GO:0048170) |
| 1.0 | 3.9 | GO:0018125 | peptidyl-cysteine methylation(GO:0018125) |
| 1.0 | 3.0 | GO:1901301 | regulation of cargo loading into COPII-coated vesicle(GO:1901301) |
| 1.0 | 2.9 | GO:0043000 | Golgi to plasma membrane CFTR protein transport(GO:0043000) |
| 1.0 | 2.9 | GO:0001579 | medium-chain fatty acid transport(GO:0001579) |
| 0.9 | 6.5 | GO:0097461 | ferric iron import into cell(GO:0097461) ferric iron import across plasma membrane(GO:0098706) |
| 0.9 | 5.5 | GO:0061687 | detoxification of inorganic compound(GO:0061687) |
| 0.9 | 2.7 | GO:0090285 | negative regulation of protein glycosylation in Golgi(GO:0090285) |
| 0.9 | 2.7 | GO:0097156 | fasciculation of motor neuron axon(GO:0097156) |
| 0.9 | 4.5 | GO:0014886 | transition between slow and fast fiber(GO:0014886) |
| 0.9 | 5.4 | GO:0032237 | activation of store-operated calcium channel activity(GO:0032237) positive regulation of store-operated calcium channel activity(GO:1901341) |
| 0.9 | 12.5 | GO:0021853 | cerebral cortex GABAergic interneuron migration(GO:0021853) interneuron migration(GO:1904936) |
| 0.9 | 3.6 | GO:0006208 | pyrimidine nucleobase catabolic process(GO:0006208) thymine catabolic process(GO:0006210) thymine metabolic process(GO:0019859) |
| 0.8 | 5.1 | GO:0051621 | negative regulation of dopamine uptake involved in synaptic transmission(GO:0051585) norepinephrine uptake(GO:0051620) regulation of norepinephrine uptake(GO:0051621) negative regulation of norepinephrine uptake(GO:0051622) negative regulation of catecholamine uptake involved in synaptic transmission(GO:0051945) regulation of glutathione peroxidase activity(GO:1903282) positive regulation of glutathione peroxidase activity(GO:1903284) positive regulation of hydrogen peroxide catabolic process(GO:1903285) positive regulation of peroxidase activity(GO:2000470) |
| 0.8 | 2.5 | GO:0072308 | negative regulation by virus of viral protein levels in host cell(GO:0046725) negative regulation of metanephric nephron tubule epithelial cell differentiation(GO:0072308) |
| 0.8 | 2.5 | GO:1902460 | mesenchymal stem cell proliferation(GO:0097168) regulation of mesenchymal stem cell proliferation(GO:1902460) positive regulation of mesenchymal stem cell proliferation(GO:1902462) |
| 0.8 | 2.5 | GO:0051230 | mitotic spindle disassembly(GO:0051228) spindle disassembly(GO:0051230) |
| 0.8 | 5.8 | GO:1904627 | response to phorbol 13-acetate 12-myristate(GO:1904627) cellular response to phorbol 13-acetate 12-myristate(GO:1904628) |
| 0.8 | 2.5 | GO:0090038 | negative regulation of protein kinase C signaling(GO:0090038) |
| 0.8 | 2.5 | GO:1902309 | negative regulation of peptidyl-serine dephosphorylation(GO:1902309) |
| 0.8 | 4.9 | GO:2000676 | positive regulation of type B pancreatic cell apoptotic process(GO:2000676) |
| 0.8 | 2.4 | GO:0036046 | protein demalonylation(GO:0036046) peptidyl-lysine demalonylation(GO:0036047) protein desuccinylation(GO:0036048) peptidyl-lysine desuccinylation(GO:0036049) protein deglutarylation(GO:0061698) peptidyl-lysine deglutarylation(GO:0061699) |
| 0.8 | 6.4 | GO:0003172 | primary heart field specification(GO:0003138) sinoatrial valve development(GO:0003172) sinoatrial valve morphogenesis(GO:0003185) |
| 0.8 | 2.4 | GO:0010808 | positive regulation of synaptic vesicle priming(GO:0010808) |
| 0.8 | 0.8 | GO:0015817 | histidine transport(GO:0015817) L-histidine transmembrane transport(GO:0089709) L-histidine transport(GO:1902024) |
| 0.8 | 11.9 | GO:2000507 | positive regulation of energy homeostasis(GO:2000507) |
| 0.8 | 8.6 | GO:0038033 | positive regulation of endothelial cell chemotaxis by VEGF-activated vascular endothelial growth factor receptor signaling pathway(GO:0038033) |
| 0.8 | 2.3 | GO:1904884 | telomerase catalytic core complex assembly(GO:1904868) regulation of telomerase catalytic core complex assembly(GO:1904882) positive regulation of telomerase catalytic core complex assembly(GO:1904884) |
| 0.8 | 2.3 | GO:0097274 | urea homeostasis(GO:0097274) |
| 0.8 | 2.3 | GO:0015917 | aminophospholipid transport(GO:0015917) |
| 0.8 | 1.5 | GO:0097155 | fasciculation of sensory neuron axon(GO:0097155) |
| 0.8 | 4.6 | GO:0006543 | glutamine catabolic process(GO:0006543) |
| 0.8 | 2.3 | GO:0006097 | glyoxylate cycle(GO:0006097) |
| 0.8 | 3.0 | GO:0021816 | extension of a leading process involved in cell motility in cerebral cortex radial glia guided migration(GO:0021816) |
| 0.7 | 3.0 | GO:0060268 | negative regulation of respiratory burst(GO:0060268) |
| 0.7 | 2.2 | GO:0021986 | epithalamus development(GO:0021538) habenula development(GO:0021986) |
| 0.7 | 1.5 | GO:0072209 | glial cell-derived neurotrophic factor secretion(GO:0044467) metanephric mesangial cell differentiation(GO:0072209) metanephric glomerular mesangial cell differentiation(GO:0072254) regulation of glial cell-derived neurotrophic factor secretion(GO:1900166) positive regulation of glial cell-derived neurotrophic factor secretion(GO:1900168) |
| 0.7 | 3.0 | GO:0008626 | granzyme-mediated apoptotic signaling pathway(GO:0008626) |
| 0.7 | 2.2 | GO:0002416 | IgG immunoglobulin transcytosis in epithelial cells mediated by FcRn immunoglobulin receptor(GO:0002416) |
| 0.7 | 1.4 | GO:1902683 | regulation of receptor localization to synapse(GO:1902683) |
| 0.7 | 5.0 | GO:0006269 | DNA replication, synthesis of RNA primer(GO:0006269) |
| 0.7 | 2.8 | GO:0042091 | interleukin-10 biosynthetic process(GO:0042091) regulation of interleukin-10 biosynthetic process(GO:0045074) |
| 0.7 | 2.8 | GO:0009956 | radial pattern formation(GO:0009956) |
| 0.7 | 3.5 | GO:0006574 | valine catabolic process(GO:0006574) |
| 0.7 | 2.8 | GO:0060672 | epithelial cell differentiation involved in embryonic placenta development(GO:0060671) epithelial cell morphogenesis involved in placental branching(GO:0060672) |
| 0.7 | 9.1 | GO:0001766 | membrane raft polarization(GO:0001766) membrane raft distribution(GO:0031580) |
| 0.7 | 2.1 | GO:1904017 | cellular response to Thyroglobulin triiodothyronine(GO:1904017) |
| 0.7 | 0.7 | GO:0006083 | acetate metabolic process(GO:0006083) |
| 0.7 | 3.4 | GO:1901350 | cell-cell signaling involved in cell-cell junction organization(GO:1901350) |
| 0.7 | 2.0 | GO:0042727 | flavin-containing compound biosynthetic process(GO:0042727) |
| 0.7 | 6.8 | GO:0003096 | renal sodium ion transport(GO:0003096) |
| 0.7 | 2.7 | GO:0031064 | negative regulation of histone deacetylation(GO:0031064) |
| 0.7 | 2.0 | GO:0043973 | histone H3-K4 acetylation(GO:0043973) |
| 0.7 | 2.0 | GO:0033364 | mast cell secretory granule organization(GO:0033364) |
| 0.7 | 9.4 | GO:1904322 | response to forskolin(GO:1904321) cellular response to forskolin(GO:1904322) |
| 0.7 | 3.3 | GO:2001295 | malonyl-CoA metabolic process(GO:2001293) malonyl-CoA biosynthetic process(GO:2001295) |
| 0.7 | 2.7 | GO:0015910 | peroxisomal long-chain fatty acid import(GO:0015910) |
| 0.7 | 0.7 | GO:0071409 | cellular response to cycloheximide(GO:0071409) |
| 0.7 | 3.3 | GO:0007386 | compartment pattern specification(GO:0007386) |
| 0.7 | 2.6 | GO:0001927 | exocyst assembly(GO:0001927) |
| 0.6 | 1.9 | GO:0042040 | molybdenum incorporation into molybdenum-molybdopterin complex(GO:0018315) metal incorporation into metallo-molybdopterin complex(GO:0042040) glycine receptor clustering(GO:0072579) |
| 0.6 | 3.2 | GO:0003150 | muscular septum morphogenesis(GO:0003150) |
| 0.6 | 8.3 | GO:0030050 | vesicle transport along actin filament(GO:0030050) |
| 0.6 | 3.2 | GO:0032484 | Ral protein signal transduction(GO:0032484) regulation of Ral protein signal transduction(GO:0032485) |
| 0.6 | 1.3 | GO:0003064 | regulation of heart rate by hormone(GO:0003064) |
| 0.6 | 1.9 | GO:0002572 | pro-T cell differentiation(GO:0002572) regulation of pro-T cell differentiation(GO:2000174) positive regulation of pro-T cell differentiation(GO:2000176) |
| 0.6 | 3.2 | GO:0016480 | negative regulation of transcription from RNA polymerase III promoter(GO:0016480) |
| 0.6 | 2.5 | GO:0090076 | relaxation of skeletal muscle(GO:0090076) |
| 0.6 | 1.9 | GO:0006667 | sphinganine metabolic process(GO:0006667) |
| 0.6 | 3.1 | GO:2000691 | negative regulation of cardioblast differentiation(GO:0051892) regulation of cardiac muscle cell myoblast differentiation(GO:2000690) negative regulation of cardiac muscle cell myoblast differentiation(GO:2000691) |
| 0.6 | 1.2 | GO:1904049 | negative regulation of spontaneous neurotransmitter secretion(GO:1904049) |
| 0.6 | 1.9 | GO:0042938 | dipeptide transport(GO:0042938) |
| 0.6 | 5.5 | GO:0097084 | vascular smooth muscle cell development(GO:0097084) |
| 0.6 | 7.4 | GO:0042492 | gamma-delta T cell differentiation(GO:0042492) |
| 0.6 | 1.8 | GO:0042412 | taurine biosynthetic process(GO:0042412) |
| 0.6 | 4.9 | GO:0038028 | insulin receptor signaling pathway via phosphatidylinositol 3-kinase(GO:0038028) |
| 0.6 | 12.0 | GO:0017187 | peptidyl-glutamic acid carboxylation(GO:0017187) protein carboxylation(GO:0018214) |
| 0.6 | 1.8 | GO:0044725 | chromatin reprogramming in the zygote(GO:0044725) |
| 0.6 | 6.5 | GO:0007256 | activation of JNKK activity(GO:0007256) |
| 0.6 | 1.2 | GO:0014005 | microglia differentiation(GO:0014004) microglia development(GO:0014005) |
| 0.6 | 2.3 | GO:1904849 | positive regulation of cell chemotaxis to fibroblast growth factor(GO:1904849) positive regulation of endothelial cell chemotaxis to fibroblast growth factor(GO:2000546) |
| 0.6 | 4.1 | GO:1902231 | positive regulation of intrinsic apoptotic signaling pathway in response to DNA damage(GO:1902231) |
| 0.6 | 1.2 | GO:0043335 | protein unfolding(GO:0043335) |
| 0.6 | 3.5 | GO:0010748 | regulation of plasma membrane long-chain fatty acid transport(GO:0010746) negative regulation of plasma membrane long-chain fatty acid transport(GO:0010748) |
| 0.6 | 1.7 | GO:0021722 | superior olivary nucleus development(GO:0021718) superior olivary nucleus maturation(GO:0021722) |
| 0.6 | 4.0 | GO:0030421 | defecation(GO:0030421) |
| 0.6 | 1.1 | GO:0021592 | fourth ventricle development(GO:0021592) |
| 0.6 | 2.9 | GO:0032792 | negative regulation of CREB transcription factor activity(GO:0032792) |
| 0.6 | 5.1 | GO:0001955 | blood vessel maturation(GO:0001955) |
| 0.6 | 3.9 | GO:0071557 | histone H3-K27 demethylation(GO:0071557) |
| 0.6 | 5.6 | GO:0016139 | glycoside catabolic process(GO:0016139) |
| 0.6 | 1.7 | GO:0060151 | peroxisome localization(GO:0060151) microtubule-based peroxisome localization(GO:0060152) |
| 0.6 | 1.7 | GO:1900169 | regulation of glucocorticoid mediated signaling pathway(GO:1900169) |
| 0.5 | 7.6 | GO:0043983 | histone H4-K12 acetylation(GO:0043983) |
| 0.5 | 9.2 | GO:0001574 | ganglioside biosynthetic process(GO:0001574) |
| 0.5 | 1.6 | GO:0050992 | dimethylallyl diphosphate biosynthetic process(GO:0050992) dimethylallyl diphosphate metabolic process(GO:0050993) |
| 0.5 | 2.2 | GO:0032765 | positive regulation of mast cell cytokine production(GO:0032765) |
| 0.5 | 2.7 | GO:0019075 | virus maturation(GO:0019075) |
| 0.5 | 1.6 | GO:0043397 | corticotropin-releasing hormone secretion(GO:0043396) regulation of corticotropin-releasing hormone secretion(GO:0043397) |
| 0.5 | 3.2 | GO:2001181 | positive regulation of interleukin-10 secretion(GO:2001181) |
| 0.5 | 1.6 | GO:0046416 | D-amino acid metabolic process(GO:0046416) |
| 0.5 | 5.8 | GO:0010578 | regulation of adenylate cyclase activity involved in G-protein coupled receptor signaling pathway(GO:0010578) positive regulation of adenylate cyclase activity involved in G-protein coupled receptor signaling pathway(GO:0010579) |
| 0.5 | 1.6 | GO:0051793 | medium-chain fatty acid catabolic process(GO:0051793) |
| 0.5 | 2.1 | GO:0010621 | negative regulation of transcription by transcription factor localization(GO:0010621) |
| 0.5 | 0.5 | GO:0070318 | positive regulation of G0 to G1 transition(GO:0070318) |
| 0.5 | 2.6 | GO:0044339 | canonical Wnt signaling pathway involved in osteoblast differentiation(GO:0044339) |
| 0.5 | 13.4 | GO:0072189 | ureter development(GO:0072189) |
| 0.5 | 1.5 | GO:0071931 | positive regulation of transcription involved in G1/S transition of mitotic cell cycle(GO:0071931) |
| 0.5 | 2.6 | GO:0046963 | 3'-phosphoadenosine 5'-phosphosulfate transport(GO:0046963) 3'-phospho-5'-adenylyl sulfate transmembrane transport(GO:1902559) |
| 0.5 | 4.6 | GO:0051151 | negative regulation of smooth muscle cell differentiation(GO:0051151) |
| 0.5 | 3.1 | GO:0008204 | ergosterol biosynthetic process(GO:0006696) ergosterol metabolic process(GO:0008204) |
| 0.5 | 1.0 | GO:0019254 | carnitine metabolic process, CoA-linked(GO:0019254) |
| 0.5 | 6.6 | GO:1900028 | negative regulation of ruffle assembly(GO:1900028) |
| 0.5 | 1.5 | GO:0090271 | positive regulation of fibroblast growth factor production(GO:0090271) |
| 0.5 | 3.0 | GO:0002329 | pre-B cell differentiation(GO:0002329) |
| 0.5 | 1.0 | GO:0090270 | fibroblast growth factor production(GO:0090269) regulation of fibroblast growth factor production(GO:0090270) |
| 0.5 | 1.5 | GO:0003408 | optic cup formation involved in camera-type eye development(GO:0003408) |
| 0.5 | 2.0 | GO:0015766 | disaccharide transport(GO:0015766) sucrose transport(GO:0015770) oligosaccharide transport(GO:0015772) |
| 0.5 | 3.5 | GO:1901725 | regulation of histone deacetylase activity(GO:1901725) |
| 0.5 | 3.0 | GO:0031914 | negative regulation of synaptic plasticity(GO:0031914) |
| 0.5 | 2.5 | GO:0090245 | axis elongation involved in somitogenesis(GO:0090245) |
| 0.5 | 0.5 | GO:0010641 | positive regulation of platelet-derived growth factor receptor signaling pathway(GO:0010641) |
| 0.5 | 2.5 | GO:0036149 | phosphatidylinositol acyl-chain remodeling(GO:0036149) |
| 0.5 | 5.9 | GO:0022417 | protein maturation by protein folding(GO:0022417) |
| 0.5 | 2.5 | GO:0002019 | regulation of renal output by angiotensin(GO:0002019) |
| 0.5 | 3.4 | GO:0045629 | negative regulation of T-helper 2 cell differentiation(GO:0045629) |
| 0.5 | 2.9 | GO:0070829 | response to vitamin B2(GO:0033274) heterochromatin maintenance(GO:0070829) |
| 0.5 | 3.4 | GO:0033132 | negative regulation of glucokinase activity(GO:0033132) negative regulation of hexokinase activity(GO:1903300) |
| 0.5 | 1.5 | GO:0061537 | glycine secretion(GO:0061536) glycine secretion, neurotransmission(GO:0061537) |
| 0.5 | 1.4 | GO:0045925 | positive regulation of female receptivity(GO:0045925) |
| 0.5 | 1.9 | GO:0060708 | spongiotrophoblast differentiation(GO:0060708) |
| 0.5 | 2.4 | GO:0002513 | tolerance induction to self antigen(GO:0002513) |
| 0.5 | 1.9 | GO:0046909 | intermembrane transport(GO:0046909) protein transport from ciliary membrane to plasma membrane(GO:1903445) |
| 0.5 | 1.4 | GO:0014876 | response to injury involved in regulation of muscle adaptation(GO:0014876) |
| 0.5 | 0.9 | GO:1903061 | positive regulation of protein lipidation(GO:1903061) |
| 0.5 | 1.9 | GO:0007418 | ventral midline development(GO:0007418) smoothened signaling pathway involved in regulation of cerebellar granule cell precursor cell proliferation(GO:0021938) |
| 0.5 | 1.9 | GO:0060179 | male mating behavior(GO:0060179) |
| 0.5 | 2.3 | GO:0015688 | iron chelate transport(GO:0015688) siderophore transport(GO:0015891) |
| 0.5 | 1.9 | GO:0060010 | Sertoli cell fate commitment(GO:0060010) |
| 0.5 | 1.4 | GO:2000646 | positive regulation of receptor catabolic process(GO:2000646) |
| 0.5 | 1.4 | GO:0007538 | primary sex determination(GO:0007538) |
| 0.5 | 1.4 | GO:0030576 | Cajal body organization(GO:0030576) |
| 0.5 | 0.9 | GO:2000562 | negative regulation of CD4-positive, alpha-beta T cell proliferation(GO:2000562) |
| 0.5 | 3.2 | GO:0060158 | phospholipase C-activating dopamine receptor signaling pathway(GO:0060158) |
| 0.5 | 1.4 | GO:0016557 | peroxisome membrane biogenesis(GO:0016557) |
| 0.5 | 3.2 | GO:0016584 | nucleosome positioning(GO:0016584) |
| 0.5 | 2.7 | GO:0033490 | cholesterol biosynthetic process via desmosterol(GO:0033489) cholesterol biosynthetic process via lathosterol(GO:0033490) |
| 0.5 | 10.0 | GO:0040015 | negative regulation of multicellular organism growth(GO:0040015) |
| 0.5 | 1.8 | GO:0010760 | negative regulation of macrophage chemotaxis(GO:0010760) |
| 0.4 | 1.3 | GO:1902498 | regulation of protein autoubiquitination(GO:1902498) |
| 0.4 | 15.1 | GO:2000369 | regulation of clathrin-mediated endocytosis(GO:2000369) |
| 0.4 | 3.1 | GO:0097338 | response to clozapine(GO:0097338) |
| 0.4 | 2.6 | GO:0000414 | regulation of histone H3-K36 methylation(GO:0000414) |
| 0.4 | 0.4 | GO:0070914 | UV-damage excision repair(GO:0070914) |
| 0.4 | 1.3 | GO:0098746 | fast, calcium ion-dependent exocytosis of neurotransmitter(GO:0098746) |
| 0.4 | 1.7 | GO:0061086 | negative regulation of histone H3-K27 methylation(GO:0061086) |
| 0.4 | 0.9 | GO:0036496 | regulation of translational initiation by eIF2 alpha dephosphorylation(GO:0036496) |
| 0.4 | 7.4 | GO:0070389 | chaperone cofactor-dependent protein refolding(GO:0070389) |
| 0.4 | 0.4 | GO:0035026 | leading edge cell differentiation(GO:0035026) |
| 0.4 | 6.9 | GO:0001967 | suckling behavior(GO:0001967) |
| 0.4 | 0.9 | GO:0031630 | regulation of synaptic vesicle fusion to presynaptic membrane(GO:0031630) |
| 0.4 | 0.4 | GO:0061622 | glycolytic process through glucose-1-phosphate(GO:0061622) |
| 0.4 | 0.4 | GO:0048807 | female genitalia morphogenesis(GO:0048807) |
| 0.4 | 3.0 | GO:0090210 | regulation of establishment of blood-brain barrier(GO:0090210) |
| 0.4 | 2.1 | GO:1902268 | negative regulation of polyamine transmembrane transport(GO:1902268) |
| 0.4 | 1.3 | GO:1904016 | response to Thyroglobulin triiodothyronine(GO:1904016) |
| 0.4 | 2.1 | GO:0043435 | response to corticotropin-releasing hormone(GO:0043435) cellular response to corticotropin-releasing hormone stimulus(GO:0071376) |
| 0.4 | 2.9 | GO:0006686 | sphingomyelin biosynthetic process(GO:0006686) |
| 0.4 | 0.8 | GO:0061187 | regulation of chromatin silencing at rDNA(GO:0061187) negative regulation of chromatin silencing at rDNA(GO:0061188) |
| 0.4 | 3.3 | GO:0061198 | fungiform papilla formation(GO:0061198) |
| 0.4 | 0.8 | GO:1902595 | regulation of DNA replication origin binding(GO:1902595) |
| 0.4 | 1.7 | GO:0009440 | cyanate metabolic process(GO:0009439) cyanate catabolic process(GO:0009440) |
| 0.4 | 4.5 | GO:0010499 | proteasomal ubiquitin-independent protein catabolic process(GO:0010499) |
| 0.4 | 1.2 | GO:0000103 | sulfate assimilation(GO:0000103) |
| 0.4 | 3.3 | GO:0042415 | norepinephrine metabolic process(GO:0042415) |
| 0.4 | 1.2 | GO:0071140 | resolution of recombination intermediates(GO:0071139) resolution of mitotic recombination intermediates(GO:0071140) |
| 0.4 | 2.5 | GO:0060214 | endocardium formation(GO:0060214) |
| 0.4 | 0.8 | GO:0002032 | desensitization of G-protein coupled receptor protein signaling pathway by arrestin(GO:0002032) |
| 0.4 | 1.6 | GO:0060734 | regulation of endoplasmic reticulum stress-induced eIF2 alpha phosphorylation(GO:0060734) |
| 0.4 | 0.4 | GO:2000653 | regulation of genetic imprinting(GO:2000653) |
| 0.4 | 1.6 | GO:0018242 | protein O-linked glycosylation via serine(GO:0018242) |
| 0.4 | 5.7 | GO:0009437 | carnitine metabolic process(GO:0009437) |
| 0.4 | 2.8 | GO:0005981 | regulation of glycogen catabolic process(GO:0005981) |
| 0.4 | 2.4 | GO:0045541 | negative regulation of cholesterol biosynthetic process(GO:0045541) negative regulation of cholesterol metabolic process(GO:0090206) |
| 0.4 | 2.8 | GO:0097350 | neutrophil clearance(GO:0097350) |
| 0.4 | 2.0 | GO:0006668 | sphinganine-1-phosphate metabolic process(GO:0006668) |
| 0.4 | 8.7 | GO:0043153 | entrainment of circadian clock by photoperiod(GO:0043153) |
| 0.4 | 1.2 | GO:0060689 | cell differentiation involved in salivary gland development(GO:0060689) |
| 0.4 | 5.1 | GO:0006975 | DNA damage induced protein phosphorylation(GO:0006975) |
| 0.4 | 3.5 | GO:0043589 | skin morphogenesis(GO:0043589) |
| 0.4 | 1.6 | GO:0061763 | multivesicular body-lysosome fusion(GO:0061763) |
| 0.4 | 1.2 | GO:1902617 | response to fluoride(GO:1902617) |
| 0.4 | 0.8 | GO:1901069 | guanosine-containing compound catabolic process(GO:1901069) |
| 0.4 | 3.9 | GO:0032328 | alanine transport(GO:0032328) |
| 0.4 | 2.3 | GO:0046056 | dADP metabolic process(GO:0046056) |
| 0.4 | 9.4 | GO:0035518 | histone H2A monoubiquitination(GO:0035518) |
| 0.4 | 2.7 | GO:0000821 | regulation of arginine metabolic process(GO:0000821) |
| 0.4 | 1.6 | GO:1900737 | negative regulation of phospholipase C activity(GO:1900275) regulation of proteinase activated receptor activity(GO:1900276) negative regulation of phospholipase C-activating G-protein coupled receptor signaling pathway(GO:1900737) |
| 0.4 | 1.2 | GO:0006679 | glucosylceramide biosynthetic process(GO:0006679) |
| 0.4 | 1.5 | GO:0002541 | activation of plasma proteins involved in acute inflammatory response(GO:0002541) |
| 0.4 | 3.1 | GO:1904177 | regulation of adipose tissue development(GO:1904177) positive regulation of adipose tissue development(GO:1904179) |
| 0.4 | 0.8 | GO:0072720 | response to dithiothreitol(GO:0072720) |
| 0.4 | 0.4 | GO:0060382 | regulation of DNA strand elongation(GO:0060382) |
| 0.4 | 6.5 | GO:0015871 | choline transport(GO:0015871) |
| 0.4 | 2.3 | GO:0070495 | regulation of thrombin receptor signaling pathway(GO:0070494) negative regulation of thrombin receptor signaling pathway(GO:0070495) |
| 0.4 | 2.3 | GO:0075071 | autophagy of host cells involved in interaction with symbiont(GO:0075044) autophagy involved in symbiotic interaction(GO:0075071) |
| 0.4 | 6.8 | GO:0002115 | store-operated calcium entry(GO:0002115) |
| 0.4 | 0.8 | GO:0038162 | erythropoietin-mediated signaling pathway(GO:0038162) |
| 0.4 | 1.9 | GO:1902659 | regulation of glucose mediated signaling pathway(GO:1902659) |
| 0.4 | 5.3 | GO:0070986 | left/right axis specification(GO:0070986) |
| 0.4 | 8.3 | GO:0016024 | CDP-diacylglycerol biosynthetic process(GO:0016024) |
| 0.4 | 5.2 | GO:0031115 | negative regulation of microtubule polymerization(GO:0031115) |
| 0.4 | 0.4 | GO:0010726 | positive regulation of hydrogen peroxide metabolic process(GO:0010726) |
| 0.4 | 1.1 | GO:0006272 | leading strand elongation(GO:0006272) |
| 0.4 | 1.1 | GO:0048633 | positive regulation of skeletal muscle tissue growth(GO:0048633) |
| 0.4 | 2.6 | GO:2000491 | positive regulation of hepatic stellate cell activation(GO:2000491) |
| 0.4 | 1.1 | GO:0060431 | primary lung bud formation(GO:0060431) |
| 0.4 | 1.1 | GO:0021610 | facial nerve development(GO:0021561) facial nerve morphogenesis(GO:0021610) |
| 0.4 | 1.5 | GO:0009786 | regulation of asymmetric cell division(GO:0009786) |
| 0.4 | 11.4 | GO:0009954 | proximal/distal pattern formation(GO:0009954) |
| 0.4 | 0.7 | GO:2000255 | negative regulation of male germ cell proliferation(GO:2000255) |
| 0.4 | 0.4 | GO:0010735 | positive regulation of transcription via serum response element binding(GO:0010735) |
| 0.4 | 0.4 | GO:0032902 | nerve growth factor production(GO:0032902) |
| 0.4 | 2.2 | GO:0036089 | cleavage furrow formation(GO:0036089) |
| 0.4 | 7.6 | GO:0036148 | phosphatidylglycerol acyl-chain remodeling(GO:0036148) |
| 0.4 | 1.1 | GO:0048319 | axial mesoderm morphogenesis(GO:0048319) |
| 0.4 | 1.1 | GO:0035880 | embryonic nail plate morphogenesis(GO:0035880) |
| 0.4 | 2.5 | GO:0035507 | regulation of myosin-light-chain-phosphatase activity(GO:0035507) |
| 0.4 | 1.1 | GO:0006393 | termination of mitochondrial transcription(GO:0006393) |
| 0.4 | 2.8 | GO:1901029 | negative regulation of mitochondrial outer membrane permeabilization involved in apoptotic signaling pathway(GO:1901029) |
| 0.4 | 3.2 | GO:0061302 | smooth muscle cell-matrix adhesion(GO:0061302) |
| 0.4 | 1.1 | GO:1901874 | negative regulation of post-translational protein modification(GO:1901874) |
| 0.4 | 0.4 | GO:0060979 | vasculogenesis involved in coronary vascular morphogenesis(GO:0060979) |
| 0.3 | 3.5 | GO:0008063 | Toll signaling pathway(GO:0008063) |
| 0.3 | 1.0 | GO:0044805 | late nucleophagy(GO:0044805) |
| 0.3 | 7.3 | GO:0035563 | positive regulation of chromatin binding(GO:0035563) |
| 0.3 | 1.0 | GO:0090341 | negative regulation of secretion of lysosomal enzymes(GO:0090341) |
| 0.3 | 1.7 | GO:0033084 | regulation of immature T cell proliferation in thymus(GO:0033084) |
| 0.3 | 1.0 | GO:0035426 | extracellular matrix-cell signaling(GO:0035426) |
| 0.3 | 3.0 | GO:0048845 | venous blood vessel morphogenesis(GO:0048845) |
| 0.3 | 1.0 | GO:2001151 | regulation of renal water transport(GO:2001151) positive regulation of renal water transport(GO:2001153) |
| 0.3 | 1.3 | GO:0048073 | regulation of eye pigmentation(GO:0048073) |
| 0.3 | 5.4 | GO:0031061 | negative regulation of histone methylation(GO:0031061) |
| 0.3 | 0.7 | GO:0046292 | formaldehyde metabolic process(GO:0046292) |
| 0.3 | 1.7 | GO:0003199 | endocardial cushion to mesenchymal transition involved in heart valve formation(GO:0003199) |
| 0.3 | 5.0 | GO:2000774 | positive regulation of cellular senescence(GO:2000774) |
| 0.3 | 3.3 | GO:2000582 | regulation of ATP-dependent microtubule motor activity, plus-end-directed(GO:2000580) positive regulation of ATP-dependent microtubule motor activity, plus-end-directed(GO:2000582) |
| 0.3 | 4.3 | GO:0051593 | response to folic acid(GO:0051593) |
| 0.3 | 2.0 | GO:0097105 | presynaptic membrane assembly(GO:0097105) |
| 0.3 | 1.3 | GO:0044313 | protein K6-linked deubiquitination(GO:0044313) |
| 0.3 | 1.3 | GO:0014053 | gamma-aminobutyric acid catabolic process(GO:0009450) negative regulation of gamma-aminobutyric acid secretion(GO:0014053) aspartate secretion(GO:0061528) regulation of aspartate secretion(GO:1904448) positive regulation of aspartate secretion(GO:1904450) |
| 0.3 | 1.0 | GO:0032803 | regulation of low-density lipoprotein particle receptor catabolic process(GO:0032803) |
| 0.3 | 1.0 | GO:0046603 | negative regulation of mitotic centrosome separation(GO:0046603) |
| 0.3 | 6.5 | GO:1901897 | regulation of relaxation of cardiac muscle(GO:1901897) |
| 0.3 | 2.6 | GO:2000786 | positive regulation of autophagosome assembly(GO:2000786) |
| 0.3 | 3.9 | GO:0061368 | behavioral response to chemical pain(GO:0061366) behavioral response to formalin induced pain(GO:0061368) |
| 0.3 | 1.0 | GO:0099640 | anterograde dendritic transport of neurotransmitter receptor complex(GO:0098971) axo-dendritic protein transport(GO:0099640) |
| 0.3 | 7.7 | GO:0016254 | preassembly of GPI anchor in ER membrane(GO:0016254) |
| 0.3 | 0.6 | GO:0035854 | regulation of primitive erythrocyte differentiation(GO:0010725) eosinophil fate commitment(GO:0035854) |
| 0.3 | 1.6 | GO:0008616 | queuosine biosynthetic process(GO:0008616) queuosine metabolic process(GO:0046116) |
| 0.3 | 3.2 | GO:0042985 | negative regulation of amyloid precursor protein biosynthetic process(GO:0042985) |
| 0.3 | 6.1 | GO:0002021 | response to dietary excess(GO:0002021) |
| 0.3 | 0.6 | GO:0021776 | smoothened signaling pathway involved in ventral spinal cord interneuron specification(GO:0021775) smoothened signaling pathway involved in spinal cord motor neuron cell fate specification(GO:0021776) |
| 0.3 | 1.9 | GO:0046086 | adenosine biosynthetic process(GO:0046086) |
| 0.3 | 0.9 | GO:2000777 | positive regulation of proteasomal ubiquitin-dependent protein catabolic process involved in cellular response to hypoxia(GO:2000777) |
| 0.3 | 2.2 | GO:0070560 | protein secretion by platelet(GO:0070560) |
| 0.3 | 0.9 | GO:1903377 | negative regulation of oxidative stress-induced neuron intrinsic apoptotic signaling pathway(GO:1903377) |
| 0.3 | 0.9 | GO:0070358 | actin polymerization-dependent cell motility(GO:0070358) |
| 0.3 | 0.9 | GO:0097187 | dentinogenesis(GO:0097187) |
| 0.3 | 0.9 | GO:1904772 | hepatocyte homeostasis(GO:0036333) response to tetrachloromethane(GO:1904772) |
| 0.3 | 1.2 | GO:0006578 | amino-acid betaine biosynthetic process(GO:0006578) |
| 0.3 | 3.3 | GO:1902746 | regulation of lens fiber cell differentiation(GO:1902746) |
| 0.3 | 1.5 | GO:1901094 | regulation of protein tetramerization(GO:1901090) negative regulation of protein tetramerization(GO:1901091) regulation of protein homotetramerization(GO:1901093) negative regulation of protein homotetramerization(GO:1901094) |
| 0.3 | 0.9 | GO:0061300 | cerebellum vasculature development(GO:0061300) |
| 0.3 | 0.6 | GO:2000984 | regulation of ATP citrate synthase activity(GO:2000983) negative regulation of ATP citrate synthase activity(GO:2000984) |
| 0.3 | 1.8 | GO:0032525 | somite rostral/caudal axis specification(GO:0032525) |
| 0.3 | 0.9 | GO:0051695 | actin filament uncapping(GO:0051695) |
| 0.3 | 1.2 | GO:0030472 | mitotic spindle organization in nucleus(GO:0030472) |
| 0.3 | 2.3 | GO:0042659 | regulation of cell fate specification(GO:0042659) |
| 0.3 | 1.2 | GO:0060596 | mammary placode formation(GO:0060596) |
| 0.3 | 0.6 | GO:0021861 | forebrain radial glial cell differentiation(GO:0021861) |
| 0.3 | 1.5 | GO:0046543 | development of secondary female sexual characteristics(GO:0046543) |
| 0.3 | 0.3 | GO:0035634 | response to stilbenoid(GO:0035634) |
| 0.3 | 1.4 | GO:0086017 | Purkinje myocyte action potential(GO:0086017) membrane depolarization during Purkinje myocyte cell action potential(GO:0086047) |
| 0.3 | 0.6 | GO:0002071 | glandular epithelial cell maturation(GO:0002071) |
| 0.3 | 1.4 | GO:0015862 | uridine transport(GO:0015862) |
| 0.3 | 1.1 | GO:0021860 | pyramidal neuron development(GO:0021860) |
| 0.3 | 0.9 | GO:1903961 | positive regulation of anion channel activity(GO:1901529) positive regulation of anion transmembrane transport(GO:1903961) |
| 0.3 | 1.1 | GO:0061034 | olfactory bulb mitral cell layer development(GO:0061034) |
| 0.3 | 6.5 | GO:0060394 | negative regulation of pathway-restricted SMAD protein phosphorylation(GO:0060394) |
| 0.3 | 3.9 | GO:0042789 | mRNA transcription from RNA polymerase II promoter(GO:0042789) |
| 0.3 | 1.4 | GO:0006931 | substrate-dependent cell migration, cell attachment to substrate(GO:0006931) |
| 0.3 | 0.6 | GO:0010807 | regulation of synaptic vesicle priming(GO:0010807) |
| 0.3 | 2.2 | GO:0035583 | sequestering of TGFbeta in extracellular matrix(GO:0035583) |
| 0.3 | 0.8 | GO:0006740 | NADPH regeneration(GO:0006740) |
| 0.3 | 0.8 | GO:0031247 | actin rod assembly(GO:0031247) |
| 0.3 | 1.7 | GO:0061091 | regulation of phospholipid translocation(GO:0061091) positive regulation of phospholipid translocation(GO:0061092) |
| 0.3 | 1.1 | GO:0031161 | phosphatidylinositol catabolic process(GO:0031161) |
| 0.3 | 1.4 | GO:0038031 | non-canonical Wnt signaling pathway via JNK cascade(GO:0038031) |
| 0.3 | 1.4 | GO:0097210 | response to gonadotropin-releasing hormone(GO:0097210) cellular response to gonadotropin-releasing hormone(GO:0097211) |
| 0.3 | 0.3 | GO:0014724 | regulation of twitch skeletal muscle contraction(GO:0014724) |
| 0.3 | 0.5 | GO:0046341 | CDP-diacylglycerol metabolic process(GO:0046341) |
| 0.3 | 1.4 | GO:0000379 | tRNA-type intron splice site recognition and cleavage(GO:0000379) |
| 0.3 | 0.5 | GO:0040009 | regulation of growth rate(GO:0040009) |
| 0.3 | 0.8 | GO:0035441 | cell migration involved in vasculogenesis(GO:0035441) |
| 0.3 | 1.9 | GO:0050872 | white fat cell differentiation(GO:0050872) |
| 0.3 | 2.2 | GO:0031936 | negative regulation of chromatin silencing(GO:0031936) |
| 0.3 | 1.4 | GO:0021626 | hindbrain maturation(GO:0021578) cerebellum maturation(GO:0021590) central nervous system maturation(GO:0021626) cerebellar cortex maturation(GO:0021699) |
| 0.3 | 0.8 | GO:0019676 | ammonia assimilation cycle(GO:0019676) |
| 0.3 | 2.4 | GO:0000395 | mRNA 5'-splice site recognition(GO:0000395) |
| 0.3 | 1.1 | GO:0048627 | myoblast development(GO:0048627) |
| 0.3 | 0.5 | GO:0003099 | positive regulation of the force of heart contraction by chemical signal(GO:0003099) |
| 0.3 | 0.5 | GO:0016103 | diterpenoid catabolic process(GO:0016103) retinoic acid catabolic process(GO:0034653) |
| 0.3 | 0.8 | GO:0031550 | positive regulation of brain-derived neurotrophic factor receptor signaling pathway(GO:0031550) |
| 0.3 | 1.6 | GO:0050859 | negative regulation of B cell receptor signaling pathway(GO:0050859) |
| 0.3 | 1.6 | GO:0019747 | regulation of isoprenoid metabolic process(GO:0019747) |
| 0.3 | 1.1 | GO:1903232 | melanosome assembly(GO:1903232) |
| 0.3 | 0.3 | GO:1903939 | regulation of TORC2 signaling(GO:1903939) |
| 0.3 | 2.1 | GO:0046600 | negative regulation of centriole replication(GO:0046600) |
| 0.3 | 0.3 | GO:0006447 | regulation of translational initiation by iron(GO:0006447) |
| 0.3 | 0.3 | GO:0042984 | amyloid precursor protein biosynthetic process(GO:0042983) regulation of amyloid precursor protein biosynthetic process(GO:0042984) |
| 0.3 | 1.6 | GO:0036152 | phosphatidylethanolamine acyl-chain remodeling(GO:0036152) |
| 0.3 | 0.8 | GO:0036451 | cap mRNA methylation(GO:0036451) |
| 0.3 | 0.8 | GO:0071681 | response to indole-3-methanol(GO:0071680) cellular response to indole-3-methanol(GO:0071681) |
| 0.3 | 1.0 | GO:0060454 | positive regulation of gastric acid secretion(GO:0060454) |
| 0.3 | 0.8 | GO:0061580 | colon epithelial cell migration(GO:0061580) |
| 0.3 | 1.3 | GO:0007497 | posterior midgut development(GO:0007497) enteric smooth muscle cell differentiation(GO:0035645) |
| 0.3 | 0.5 | GO:0009405 | pathogenesis(GO:0009405) |
| 0.3 | 0.8 | GO:0019878 | lysine biosynthetic process(GO:0009085) lysine biosynthetic process via aminoadipic acid(GO:0019878) |
| 0.3 | 1.0 | GO:0018032 | protein amidation(GO:0018032) |
| 0.3 | 2.6 | GO:0034983 | peptidyl-lysine deacetylation(GO:0034983) |
| 0.3 | 0.8 | GO:1990535 | neuron projection maintenance(GO:1990535) |
| 0.3 | 0.8 | GO:0090291 | regulation of toll-like receptor 5 signaling pathway(GO:0034147) negative regulation of toll-like receptor 5 signaling pathway(GO:0034148) negative regulation of nucleotide-binding oligomerization domain containing 1 signaling pathway(GO:0070429) negative regulation of osteoclast proliferation(GO:0090291) |
| 0.3 | 1.5 | GO:0010032 | meiotic chromosome condensation(GO:0010032) |
| 0.3 | 2.0 | GO:0060352 | cell adhesion molecule production(GO:0060352) |
| 0.3 | 4.3 | GO:0021542 | dentate gyrus development(GO:0021542) |
| 0.3 | 1.0 | GO:0006701 | progesterone biosynthetic process(GO:0006701) |
| 0.2 | 2.5 | GO:1903361 | protein localization to basolateral plasma membrane(GO:1903361) |
| 0.2 | 0.2 | GO:2000611 | positive regulation of thyroid hormone generation(GO:2000611) |
| 0.2 | 1.7 | GO:0035973 | aggrephagy(GO:0035973) |
| 0.2 | 0.7 | GO:0071460 | cellular response to cell-matrix adhesion(GO:0071460) |
| 0.2 | 1.5 | GO:0035246 | peptidyl-arginine N-methylation(GO:0035246) |
| 0.2 | 1.5 | GO:0032483 | regulation of Rab protein signal transduction(GO:0032483) |
| 0.2 | 0.5 | GO:0010159 | specification of organ position(GO:0010159) |
| 0.2 | 0.7 | GO:0050915 | sensory perception of sour taste(GO:0050915) |
| 0.2 | 0.7 | GO:0046338 | phosphatidylethanolamine catabolic process(GO:0046338) |
| 0.2 | 1.0 | GO:2000672 | negative regulation of motor neuron apoptotic process(GO:2000672) |
| 0.2 | 4.6 | GO:0016446 | somatic hypermutation of immunoglobulin genes(GO:0016446) |
| 0.2 | 1.4 | GO:1903566 | positive regulation of protein localization to cilium(GO:1903566) |
| 0.2 | 1.4 | GO:0090308 | regulation of methylation-dependent chromatin silencing(GO:0090308) |
| 0.2 | 1.7 | GO:0033183 | negative regulation of histone ubiquitination(GO:0033183) regulation of histone H2A K63-linked ubiquitination(GO:1901314) negative regulation of histone H2A K63-linked ubiquitination(GO:1901315) |
| 0.2 | 6.0 | GO:0007250 | activation of NF-kappaB-inducing kinase activity(GO:0007250) |
| 0.2 | 6.0 | GO:0072663 | protein targeting to peroxisome(GO:0006625) peroxisomal transport(GO:0043574) protein localization to peroxisome(GO:0072662) establishment of protein localization to peroxisome(GO:0072663) |
| 0.2 | 0.2 | GO:0021539 | subthalamus development(GO:0021539) |
| 0.2 | 1.4 | GO:0018197 | peptidyl-aspartic acid modification(GO:0018197) |
| 0.2 | 0.7 | GO:0098507 | polynucleotide 5' dephosphorylation(GO:0098507) |
| 0.2 | 2.1 | GO:0090219 | negative regulation of lipid kinase activity(GO:0090219) |
| 0.2 | 0.7 | GO:0021997 | neural plate axis specification(GO:0021997) |
| 0.2 | 2.4 | GO:1901525 | negative regulation of macromitophagy(GO:1901525) |
| 0.2 | 0.5 | GO:0000117 | regulation of transcription involved in G2/M transition of mitotic cell cycle(GO:0000117) |
| 0.2 | 0.9 | GO:0070213 | protein auto-ADP-ribosylation(GO:0070213) |
| 0.2 | 1.6 | GO:1900264 | regulation of DNA-directed DNA polymerase activity(GO:1900262) positive regulation of DNA-directed DNA polymerase activity(GO:1900264) |
| 0.2 | 1.6 | GO:0070345 | negative regulation of fat cell proliferation(GO:0070345) |
| 0.2 | 1.4 | GO:0032487 | regulation of Rap protein signal transduction(GO:0032487) |
| 0.2 | 0.9 | GO:0036058 | filtration diaphragm assembly(GO:0036058) slit diaphragm assembly(GO:0036060) |
| 0.2 | 0.5 | GO:2001045 | negative regulation of integrin-mediated signaling pathway(GO:2001045) |
| 0.2 | 0.7 | GO:2000417 | negative regulation of eosinophil migration(GO:2000417) |
| 0.2 | 0.5 | GO:0071930 | negative regulation of transcription involved in G1/S transition of mitotic cell cycle(GO:0071930) |
| 0.2 | 0.5 | GO:0036518 | chemorepulsion of dopaminergic neuron axon(GO:0036518) |
| 0.2 | 0.7 | GO:0046081 | dUTP metabolic process(GO:0046080) dUTP catabolic process(GO:0046081) |
| 0.2 | 1.4 | GO:0070940 | dephosphorylation of RNA polymerase II C-terminal domain(GO:0070940) |
| 0.2 | 1.8 | GO:0072257 | metanephric nephron tubule epithelial cell differentiation(GO:0072257) regulation of metanephric nephron tubule epithelial cell differentiation(GO:0072307) |
| 0.2 | 6.9 | GO:0014850 | response to muscle activity(GO:0014850) |
| 0.2 | 0.7 | GO:0050757 | thymidylate synthase biosynthetic process(GO:0050757) regulation of thymidylate synthase biosynthetic process(GO:0050758) negative regulation of thymidylate synthase biosynthetic process(GO:0050760) |
| 0.2 | 2.5 | GO:0032025 | response to cobalt ion(GO:0032025) |
| 0.2 | 1.8 | GO:0085020 | protein K6-linked ubiquitination(GO:0085020) |
| 0.2 | 1.6 | GO:0015798 | myo-inositol transport(GO:0015798) |
| 0.2 | 2.0 | GO:0038203 | TORC2 signaling(GO:0038203) |
| 0.2 | 3.1 | GO:0043374 | CD8-positive, alpha-beta T cell differentiation(GO:0043374) |
| 0.2 | 0.9 | GO:0009635 | response to herbicide(GO:0009635) |
| 0.2 | 0.4 | GO:2000049 | positive regulation of cell-cell adhesion mediated by cadherin(GO:2000049) |
| 0.2 | 2.0 | GO:1900025 | negative regulation of substrate adhesion-dependent cell spreading(GO:1900025) |
| 0.2 | 0.7 | GO:0034638 | phosphatidylcholine catabolic process(GO:0034638) |
| 0.2 | 2.2 | GO:0039663 | fusion of virus membrane with host plasma membrane(GO:0019064) membrane fusion involved in viral entry into host cell(GO:0039663) multi-organism membrane fusion(GO:0044800) |
| 0.2 | 0.4 | GO:0061010 | external genitalia morphogenesis(GO:0035261) gall bladder development(GO:0061010) |
| 0.2 | 0.2 | GO:2000381 | negative regulation of mesoderm development(GO:2000381) |
| 0.2 | 1.5 | GO:0072383 | plus-end-directed vesicle transport along microtubule(GO:0072383) |
| 0.2 | 0.7 | GO:1903676 | regulation of cap-dependent translational initiation(GO:1903674) positive regulation of cap-dependent translational initiation(GO:1903676) |
| 0.2 | 11.3 | GO:0009409 | response to cold(GO:0009409) |
| 0.2 | 1.3 | GO:2000618 | regulation of histone H4-K16 acetylation(GO:2000618) |
| 0.2 | 5.2 | GO:0045332 | phospholipid translocation(GO:0045332) |
| 0.2 | 7.1 | GO:0032012 | regulation of ARF protein signal transduction(GO:0032012) |
| 0.2 | 0.6 | GO:1990641 | response to iron ion starvation(GO:1990641) |
| 0.2 | 0.2 | GO:2000078 | positive regulation of type B pancreatic cell development(GO:2000078) |
| 0.2 | 0.4 | GO:0045653 | negative regulation of megakaryocyte differentiation(GO:0045653) |
| 0.2 | 3.4 | GO:0007175 | negative regulation of epidermal growth factor-activated receptor activity(GO:0007175) |
| 0.2 | 9.2 | GO:0048384 | retinoic acid receptor signaling pathway(GO:0048384) |
| 0.2 | 0.9 | GO:0018008 | N-terminal peptidyl-glycine N-myristoylation(GO:0018008) |
| 0.2 | 0.2 | GO:0051138 | positive regulation of NK T cell differentiation(GO:0051138) |
| 0.2 | 2.1 | GO:0070257 | positive regulation of mucus secretion(GO:0070257) |
| 0.2 | 0.8 | GO:2001033 | negative regulation of double-strand break repair via nonhomologous end joining(GO:2001033) |
| 0.2 | 0.8 | GO:0033484 | nitric oxide homeostasis(GO:0033484) |
| 0.2 | 0.4 | GO:0010645 | regulation of cell communication by chemical coupling(GO:0010645) positive regulation of cell communication by chemical coupling(GO:0010652) |
| 0.2 | 0.4 | GO:0032696 | negative regulation of interleukin-13 production(GO:0032696) |
| 0.2 | 0.6 | GO:0071469 | cellular response to alkaline pH(GO:0071469) |
| 0.2 | 9.7 | GO:0007566 | embryo implantation(GO:0007566) |
| 0.2 | 2.7 | GO:0021534 | cell proliferation in hindbrain(GO:0021534) cell proliferation in external granule layer(GO:0021924) cerebellar granule cell precursor proliferation(GO:0021930) |
| 0.2 | 1.9 | GO:0016127 | cholesterol catabolic process(GO:0006707) sterol catabolic process(GO:0016127) |
| 0.2 | 0.6 | GO:0032482 | Rab protein signal transduction(GO:0032482) |
| 0.2 | 0.6 | GO:0048496 | maintenance of organ identity(GO:0048496) |
| 0.2 | 5.1 | GO:0006646 | phosphatidylethanolamine biosynthetic process(GO:0006646) |
| 0.2 | 0.8 | GO:0030200 | heparan sulfate proteoglycan catabolic process(GO:0030200) |
| 0.2 | 1.6 | GO:0097026 | dendritic cell dendrite assembly(GO:0097026) |
| 0.2 | 0.4 | GO:0010986 | positive regulation of lipoprotein particle clearance(GO:0010986) |
| 0.2 | 1.0 | GO:1903385 | regulation of homophilic cell adhesion(GO:1903385) |
| 0.2 | 1.0 | GO:0030950 | establishment or maintenance of actin cytoskeleton polarity(GO:0030950) |
| 0.2 | 3.6 | GO:0070734 | histone H3-K27 methylation(GO:0070734) |
| 0.2 | 2.0 | GO:0098881 | exocytic insertion of neurotransmitter receptor to plasma membrane(GO:0098881) exocytic insertion of neurotransmitter receptor to postsynaptic membrane(GO:0098967) |
| 0.2 | 0.4 | GO:0021913 | regulation of transcription from RNA polymerase II promoter involved in ventral spinal cord interneuron specification(GO:0021913) |
| 0.2 | 5.0 | GO:0000185 | activation of MAPKKK activity(GO:0000185) |
| 0.2 | 0.8 | GO:2000342 | negative regulation of chemokine (C-X-C motif) ligand 2 production(GO:2000342) |
| 0.2 | 2.4 | GO:0006768 | biotin metabolic process(GO:0006768) |
| 0.2 | 1.4 | GO:1901621 | negative regulation of smoothened signaling pathway involved in dorsal/ventral neural tube patterning(GO:1901621) |
| 0.2 | 2.7 | GO:0015074 | DNA integration(GO:0015074) |
| 0.2 | 0.6 | GO:0097195 | pilomotor reflex(GO:0097195) |
| 0.2 | 0.6 | GO:0097056 | selenocysteinyl-tRNA(Sec) biosynthetic process(GO:0097056) |
| 0.2 | 0.2 | GO:0048341 | paraxial mesoderm formation(GO:0048341) |
| 0.2 | 0.6 | GO:0070315 | G1 to G0 transition involved in cell differentiation(GO:0070315) |
| 0.2 | 1.5 | GO:0045591 | positive regulation of regulatory T cell differentiation(GO:0045591) |
| 0.2 | 0.4 | GO:0015911 | plasma membrane long-chain fatty acid transport(GO:0015911) |
| 0.2 | 3.7 | GO:0034199 | activation of protein kinase A activity(GO:0034199) |
| 0.2 | 0.6 | GO:0051877 | pigment granule aggregation in cell center(GO:0051877) |
| 0.2 | 0.4 | GO:0090230 | regulation of centromere complex assembly(GO:0090230) regulation of kinetochore assembly(GO:0090234) |
| 0.2 | 2.9 | GO:0035269 | protein O-linked mannosylation(GO:0035269) |
| 0.2 | 0.8 | GO:1904045 | cellular response to aldosterone(GO:1904045) |
| 0.2 | 0.4 | GO:0060823 | canonical Wnt signaling pathway involved in neural plate anterior/posterior pattern formation(GO:0060823) |
| 0.2 | 1.5 | GO:0030949 | positive regulation of vascular endothelial growth factor receptor signaling pathway(GO:0030949) |
| 0.2 | 0.6 | GO:0050928 | negative regulation of positive chemotaxis(GO:0050928) |
| 0.2 | 1.3 | GO:0009597 | detection of virus(GO:0009597) |
| 0.2 | 0.8 | GO:0032290 | peripheral nervous system myelin formation(GO:0032290) |
| 0.2 | 8.1 | GO:0030206 | chondroitin sulfate biosynthetic process(GO:0030206) |
| 0.2 | 0.2 | GO:0002074 | extraocular skeletal muscle development(GO:0002074) |
| 0.2 | 0.9 | GO:1904764 | negative regulation of fibril organization(GO:1902904) chaperone-mediated autophagy translocation complex disassembly(GO:1904764) |
| 0.2 | 0.9 | GO:0036072 | intramembranous ossification(GO:0001957) direct ossification(GO:0036072) |
| 0.2 | 3.4 | GO:0033540 | fatty acid beta-oxidation using acyl-CoA oxidase(GO:0033540) |
| 0.2 | 4.1 | GO:0051044 | positive regulation of membrane protein ectodomain proteolysis(GO:0051044) |
| 0.2 | 1.3 | GO:0030207 | chondroitin sulfate catabolic process(GO:0030207) |
| 0.2 | 0.7 | GO:2000679 | positive regulation of transcription regulatory region DNA binding(GO:2000679) |
| 0.2 | 2.5 | GO:0045618 | positive regulation of keratinocyte differentiation(GO:0045618) |
| 0.2 | 0.9 | GO:0006104 | succinyl-CoA metabolic process(GO:0006104) |
| 0.2 | 1.6 | GO:0051096 | positive regulation of helicase activity(GO:0051096) |
| 0.2 | 0.4 | GO:0097490 | sympathetic neuron projection extension(GO:0097490) sympathetic neuron projection guidance(GO:0097491) |
| 0.2 | 0.4 | GO:1904253 | positive regulation of bile acid biosynthetic process(GO:0070859) positive regulation of bile acid metabolic process(GO:1904253) |
| 0.2 | 0.5 | GO:0060448 | dichotomous subdivision of terminal units involved in lung branching(GO:0060448) |
| 0.2 | 0.9 | GO:0048861 | leukemia inhibitory factor signaling pathway(GO:0048861) |
| 0.2 | 2.6 | GO:0097094 | craniofacial suture morphogenesis(GO:0097094) |
| 0.2 | 0.9 | GO:0060295 | regulation of cilium movement involved in cell motility(GO:0060295) regulation of cilium beat frequency involved in ciliary motility(GO:0060296) regulation of cilium-dependent cell motility(GO:1902019) |
| 0.2 | 0.9 | GO:0007198 | adenylate cyclase-inhibiting serotonin receptor signaling pathway(GO:0007198) |
| 0.2 | 1.0 | GO:0048739 | cardiac muscle fiber development(GO:0048739) |
| 0.2 | 0.5 | GO:0051596 | methylglyoxal catabolic process to D-lactate via S-lactoyl-glutathione(GO:0019243) methylglyoxal catabolic process(GO:0051596) methylglyoxal catabolic process to lactate(GO:0061727) |
| 0.2 | 0.9 | GO:0009082 | branched-chain amino acid biosynthetic process(GO:0009082) leucine biosynthetic process(GO:0009098) valine biosynthetic process(GO:0009099) |
| 0.2 | 0.3 | GO:0051902 | negative regulation of mitochondrial depolarization(GO:0051902) |
| 0.2 | 0.3 | GO:0051541 | elastin metabolic process(GO:0051541) |
| 0.2 | 1.7 | GO:0000733 | DNA strand renaturation(GO:0000733) |
| 0.2 | 2.0 | GO:0018095 | protein polyglutamylation(GO:0018095) |
| 0.2 | 3.2 | GO:0000052 | citrulline metabolic process(GO:0000052) |
| 0.2 | 1.7 | GO:0044351 | macropinocytosis(GO:0044351) |
| 0.2 | 1.0 | GO:0035520 | monoubiquitinated protein deubiquitination(GO:0035520) |
| 0.2 | 0.3 | GO:0006404 | RNA import into nucleus(GO:0006404) |
| 0.2 | 0.5 | GO:0060741 | prostate gland stromal morphogenesis(GO:0060741) |
| 0.2 | 1.8 | GO:0036150 | phosphatidylserine acyl-chain remodeling(GO:0036150) |
| 0.2 | 0.7 | GO:1904387 | response to thyroxine(GO:0097068) cellular response to thyroxine stimulus(GO:0097069) response to L-phenylalanine derivative(GO:1904386) cellular response to L-phenylalanine derivative(GO:1904387) |
| 0.2 | 0.3 | GO:0070245 | positive regulation of thymocyte apoptotic process(GO:0070245) |
| 0.2 | 0.5 | GO:0007113 | endomitotic cell cycle(GO:0007113) |
| 0.2 | 3.3 | GO:0010603 | regulation of cytoplasmic mRNA processing body assembly(GO:0010603) |
| 0.2 | 1.3 | GO:0036120 | response to platelet-derived growth factor(GO:0036119) cellular response to platelet-derived growth factor stimulus(GO:0036120) |
| 0.2 | 0.2 | GO:0060392 | negative regulation of SMAD protein import into nucleus(GO:0060392) |
| 0.2 | 0.8 | GO:0060973 | cell migration involved in heart development(GO:0060973) |
| 0.2 | 2.3 | GO:0006600 | creatine metabolic process(GO:0006600) |
| 0.2 | 0.8 | GO:0032049 | cardiolipin biosynthetic process(GO:0032049) |
| 0.2 | 0.5 | GO:0006500 | N-terminal protein palmitoylation(GO:0006500) |
| 0.2 | 0.3 | GO:1900220 | semaphorin-plexin signaling pathway involved in bone trabecula morphogenesis(GO:1900220) |
| 0.2 | 0.3 | GO:0018312 | peptidyl-serine ADP-ribosylation(GO:0018312) |
| 0.2 | 0.3 | GO:0005989 | lactose metabolic process(GO:0005988) lactose biosynthetic process(GO:0005989) |
| 0.2 | 5.5 | GO:0090503 | RNA phosphodiester bond hydrolysis, exonucleolytic(GO:0090503) |
| 0.2 | 0.8 | GO:0044806 | G-quadruplex DNA unwinding(GO:0044806) |
| 0.2 | 0.5 | GO:0032776 | DNA methylation on cytosine(GO:0032776) |
| 0.2 | 1.7 | GO:0032790 | ribosome disassembly(GO:0032790) |
| 0.2 | 1.6 | GO:1902414 | protein localization to cell junction(GO:1902414) |
| 0.2 | 2.3 | GO:0007220 | Notch receptor processing(GO:0007220) |
| 0.2 | 0.9 | GO:0071477 | hypotonic salinity response(GO:0042539) cellular hypotonic salinity response(GO:0071477) |
| 0.2 | 0.3 | GO:0061141 | lung ciliated cell differentiation(GO:0061141) |
| 0.2 | 0.6 | GO:0001692 | histamine metabolic process(GO:0001692) |
| 0.2 | 0.5 | GO:0016095 | polyprenol catabolic process(GO:0016095) |
| 0.2 | 1.1 | GO:1903903 | regulation of establishment of T cell polarity(GO:1903903) |
| 0.2 | 0.3 | GO:0070197 | meiotic telomere tethering at nuclear periphery(GO:0044821) meiotic attachment of telomere to nuclear envelope(GO:0070197) chromosome attachment to the nuclear envelope(GO:0097240) |
| 0.2 | 1.8 | GO:0045003 | DNA recombinase assembly(GO:0000730) double-strand break repair via synthesis-dependent strand annealing(GO:0045003) |
| 0.2 | 1.4 | GO:1901142 | insulin metabolic process(GO:1901142) |
| 0.2 | 0.9 | GO:0019918 | peptidyl-arginine methylation, to symmetrical-dimethyl arginine(GO:0019918) |
| 0.2 | 0.8 | GO:0048388 | endosomal lumen acidification(GO:0048388) |
| 0.2 | 0.5 | GO:0035498 | carnosine metabolic process(GO:0035498) |
| 0.1 | 2.5 | GO:0031441 | negative regulation of mRNA 3'-end processing(GO:0031441) |
| 0.1 | 1.0 | GO:0072502 | cellular phosphate ion homeostasis(GO:0030643) cellular divalent inorganic anion homeostasis(GO:0072501) cellular trivalent inorganic anion homeostasis(GO:0072502) |
| 0.1 | 0.3 | GO:0033591 | response to L-ascorbic acid(GO:0033591) |
| 0.1 | 0.6 | GO:0070933 | histone H4 deacetylation(GO:0070933) |
| 0.1 | 1.6 | GO:0006552 | leucine metabolic process(GO:0006551) leucine catabolic process(GO:0006552) |
| 0.1 | 1.2 | GO:0006689 | ganglioside catabolic process(GO:0006689) |
| 0.1 | 1.2 | GO:0090527 | actin filament reorganization(GO:0090527) |
| 0.1 | 1.3 | GO:0061179 | negative regulation of insulin secretion involved in cellular response to glucose stimulus(GO:0061179) |
| 0.1 | 0.3 | GO:0042494 | detection of bacterial lipoprotein(GO:0042494) |
| 0.1 | 0.4 | GO:0072144 | glomerular mesangial cell development(GO:0072144) |
| 0.1 | 0.1 | GO:0072161 | mesenchymal cell differentiation involved in kidney development(GO:0072161) mesenchymal cell differentiation involved in renal system development(GO:2001012) |
| 0.1 | 1.4 | GO:0031642 | negative regulation of myelination(GO:0031642) |
| 0.1 | 0.6 | GO:0061739 | protein lipidation involved in autophagosome assembly(GO:0061739) |
| 0.1 | 1.3 | GO:0071397 | cellular response to cholesterol(GO:0071397) |
| 0.1 | 0.3 | GO:0070885 | negative regulation of calcineurin-NFAT signaling cascade(GO:0070885) |
| 0.1 | 3.3 | GO:0060441 | epithelial tube branching involved in lung morphogenesis(GO:0060441) |
| 0.1 | 0.7 | GO:0010867 | positive regulation of triglyceride biosynthetic process(GO:0010867) |
| 0.1 | 0.6 | GO:0060545 | positive regulation of necroptotic process(GO:0060545) |
| 0.1 | 0.7 | GO:0060800 | regulation of cell differentiation involved in embryonic placenta development(GO:0060800) |
| 0.1 | 0.6 | GO:0090158 | endoplasmic reticulum membrane organization(GO:0090158) |
| 0.1 | 1.0 | GO:0009313 | oligosaccharide catabolic process(GO:0009313) |
| 0.1 | 1.1 | GO:2000121 | regulation of removal of superoxide radicals(GO:2000121) |
| 0.1 | 2.1 | GO:0001778 | plasma membrane repair(GO:0001778) |
| 0.1 | 0.4 | GO:0033385 | geranylgeranyl diphosphate metabolic process(GO:0033385) geranylgeranyl diphosphate biosynthetic process(GO:0033386) |
| 0.1 | 1.1 | GO:0044341 | sodium-dependent phosphate transport(GO:0044341) |
| 0.1 | 0.8 | GO:1901563 | cellular response to camptothecin(GO:0072757) response to camptothecin(GO:1901563) |
| 0.1 | 2.8 | GO:0031034 | myosin filament assembly(GO:0031034) |
| 0.1 | 0.3 | GO:0035494 | SNARE complex disassembly(GO:0035494) |
| 0.1 | 0.4 | GO:0002538 | arachidonic acid metabolite production involved in inflammatory response(GO:0002538) leukotriene production involved in inflammatory response(GO:0002540) |
| 0.1 | 0.5 | GO:0034144 | negative regulation of toll-like receptor 4 signaling pathway(GO:0034144) |
| 0.1 | 0.8 | GO:2000825 | positive regulation of androgen receptor activity(GO:2000825) |
| 0.1 | 0.5 | GO:0030174 | regulation of DNA-dependent DNA replication initiation(GO:0030174) |
| 0.1 | 1.7 | GO:0014809 | regulation of skeletal muscle contraction by regulation of release of sequestered calcium ion(GO:0014809) |
| 0.1 | 0.9 | GO:0000101 | sulfur amino acid transport(GO:0000101) |
| 0.1 | 0.4 | GO:1904806 | regulation of protein oxidation(GO:1904806) positive regulation of protein oxidation(GO:1904808) |
| 0.1 | 0.7 | GO:0097327 | response to antineoplastic agent(GO:0097327) |
| 0.1 | 3.7 | GO:0016180 | snRNA processing(GO:0016180) |
| 0.1 | 0.3 | GO:0090034 | regulation of chaperone-mediated protein complex assembly(GO:0090034) positive regulation of chaperone-mediated protein complex assembly(GO:0090035) |
| 0.1 | 0.8 | GO:0000720 | meiotic mismatch repair(GO:0000710) pyrimidine dimer repair by nucleotide-excision repair(GO:0000720) |
| 0.1 | 0.8 | GO:0035063 | nuclear speck organization(GO:0035063) |
| 0.1 | 3.9 | GO:0006337 | nucleosome disassembly(GO:0006337) |
| 0.1 | 0.4 | GO:0021684 | cerebellar granular layer formation(GO:0021684) cerebellar granule cell differentiation(GO:0021707) |
| 0.1 | 1.5 | GO:0032876 | negative regulation of DNA endoreduplication(GO:0032876) |
| 0.1 | 2.0 | GO:0006363 | termination of RNA polymerase I transcription(GO:0006363) |
| 0.1 | 0.8 | GO:0019509 | L-methionine biosynthetic process from methylthioadenosine(GO:0019509) |
| 0.1 | 0.8 | GO:0046007 | negative regulation of activated T cell proliferation(GO:0046007) |
| 0.1 | 0.8 | GO:0043968 | histone H2A acetylation(GO:0043968) |
| 0.1 | 0.5 | GO:0016259 | selenocysteine metabolic process(GO:0016259) |
| 0.1 | 1.0 | GO:0031547 | brain-derived neurotrophic factor receptor signaling pathway(GO:0031547) |
| 0.1 | 0.5 | GO:0046379 | extracellular polysaccharide biosynthetic process(GO:0045226) extracellular polysaccharide metabolic process(GO:0046379) |
| 0.1 | 0.4 | GO:0043504 | mitochondrial DNA repair(GO:0043504) |
| 0.1 | 5.9 | GO:0035735 | intraciliary transport involved in cilium morphogenesis(GO:0035735) |
| 0.1 | 0.4 | GO:0006562 | proline catabolic process(GO:0006562) proline catabolic process to glutamate(GO:0010133) |
| 0.1 | 0.1 | GO:0010891 | negative regulation of sequestering of triglyceride(GO:0010891) |
| 0.1 | 0.7 | GO:1901896 | positive regulation of calcium-transporting ATPase activity(GO:1901896) |
| 0.1 | 0.4 | GO:0046452 | dihydrofolate metabolic process(GO:0046452) |
| 0.1 | 0.4 | GO:0048672 | positive regulation of collateral sprouting(GO:0048672) |
| 0.1 | 0.5 | GO:0001555 | oocyte growth(GO:0001555) |
| 0.1 | 0.4 | GO:1901388 | regulation of transforming growth factor beta activation(GO:1901388) negative regulation of transforming growth factor beta activation(GO:1901389) negative regulation of complement-dependent cytotoxicity(GO:1903660) |
| 0.1 | 0.5 | GO:0060707 | trophoblast giant cell differentiation(GO:0060707) |
| 0.1 | 0.4 | GO:0071449 | cellular response to lipid hydroperoxide(GO:0071449) |
| 0.1 | 0.7 | GO:0006432 | phenylalanyl-tRNA aminoacylation(GO:0006432) |
| 0.1 | 0.2 | GO:0035624 | receptor transactivation(GO:0035624) |
| 0.1 | 0.6 | GO:0032383 | regulation of intracellular lipid transport(GO:0032377) regulation of intracellular sterol transport(GO:0032380) regulation of intracellular cholesterol transport(GO:0032383) |
| 0.1 | 0.4 | GO:1990637 | response to prolactin(GO:1990637) |
| 0.1 | 0.5 | GO:1990166 | protein localization to site of double-strand break(GO:1990166) |
| 0.1 | 4.5 | GO:0045762 | positive regulation of adenylate cyclase activity(GO:0045762) |
| 0.1 | 0.1 | GO:0046130 | purine nucleoside catabolic process(GO:0006152) purine ribonucleoside catabolic process(GO:0046130) |
| 0.1 | 0.7 | GO:0035610 | protein side chain deglutamylation(GO:0035610) |
| 0.1 | 0.8 | GO:0061469 | regulation of type B pancreatic cell proliferation(GO:0061469) |
| 0.1 | 0.2 | GO:0046121 | deoxyribonucleoside catabolic process(GO:0046121) |
| 0.1 | 1.7 | GO:0045725 | positive regulation of glycogen biosynthetic process(GO:0045725) |
| 0.1 | 0.3 | GO:0015993 | molecular hydrogen transport(GO:0015993) |
| 0.1 | 0.3 | GO:0014813 | skeletal muscle satellite cell commitment(GO:0014813) |
| 0.1 | 1.2 | GO:0035878 | nail development(GO:0035878) |
| 0.1 | 0.3 | GO:0032785 | negative regulation of DNA-templated transcription, elongation(GO:0032785) negative regulation of transcription elongation from RNA polymerase II promoter(GO:0034244) |
| 0.1 | 0.3 | GO:0035672 | oligopeptide transmembrane transport(GO:0035672) |
| 0.1 | 1.0 | GO:0002315 | marginal zone B cell differentiation(GO:0002315) |
| 0.1 | 0.9 | GO:0048368 | lateral mesoderm development(GO:0048368) |
| 0.1 | 0.3 | GO:0030997 | regulation of centriole-centriole cohesion(GO:0030997) |
| 0.1 | 1.0 | GO:0006020 | inositol metabolic process(GO:0006020) |
| 0.1 | 0.1 | GO:0001560 | regulation of cell growth by extracellular stimulus(GO:0001560) |
| 0.1 | 1.6 | GO:0014823 | response to activity(GO:0014823) |
| 0.1 | 1.7 | GO:0050434 | positive regulation of viral transcription(GO:0050434) |
| 0.1 | 0.2 | GO:0097032 | respiratory chain complex II assembly(GO:0034552) mitochondrial respiratory chain complex II assembly(GO:0034553) mitochondrial respiratory chain complex II biogenesis(GO:0097032) |
| 0.1 | 2.9 | GO:0016574 | histone ubiquitination(GO:0016574) |
| 0.1 | 0.7 | GO:0050965 | detection of temperature stimulus involved in sensory perception(GO:0050961) detection of temperature stimulus involved in sensory perception of pain(GO:0050965) |
| 0.1 | 0.3 | GO:0070278 | extracellular matrix constituent secretion(GO:0070278) |
| 0.1 | 0.3 | GO:0001546 | preantral ovarian follicle growth(GO:0001546) multi-layer follicle stage(GO:0048162) |
| 0.1 | 0.9 | GO:0009086 | methionine biosynthetic process(GO:0009086) |
| 0.1 | 0.4 | GO:0030242 | pexophagy(GO:0030242) |
| 0.1 | 0.8 | GO:0070537 | histone H2A K63-linked deubiquitination(GO:0070537) |
| 0.1 | 1.1 | GO:1904896 | ESCRT complex disassembly(GO:1904896) ESCRT III complex disassembly(GO:1904903) |
| 0.1 | 0.3 | GO:0001923 | B-1 B cell differentiation(GO:0001923) |
| 0.1 | 2.2 | GO:0030497 | fatty acid elongation(GO:0030497) |
| 0.1 | 0.9 | GO:0035021 | negative regulation of Rac protein signal transduction(GO:0035021) |
| 0.1 | 0.3 | GO:1990426 | homologous recombination-dependent replication fork processing(GO:1990426) |
| 0.1 | 12.4 | GO:0006334 | nucleosome assembly(GO:0006334) |
| 0.1 | 1.1 | GO:0030473 | nucleokinesis involved in cell motility in cerebral cortex radial glia guided migration(GO:0021817) nuclear migration along microtubule(GO:0030473) |
| 0.1 | 25.0 | GO:0006367 | transcription initiation from RNA polymerase II promoter(GO:0006367) |
| 0.1 | 0.3 | GO:0009838 | abscission(GO:0009838) mitotic cytokinesis checkpoint(GO:0044878) |
| 0.1 | 0.6 | GO:0010764 | negative regulation of fibroblast migration(GO:0010764) |
| 0.1 | 0.5 | GO:0051013 | microtubule severing(GO:0051013) |
| 0.1 | 0.5 | GO:0010801 | negative regulation of peptidyl-threonine phosphorylation(GO:0010801) |
| 0.1 | 0.4 | GO:0090190 | positive regulation of branching involved in ureteric bud morphogenesis(GO:0090190) |
| 0.1 | 0.1 | GO:1900363 | regulation of mRNA polyadenylation(GO:1900363) |
| 0.1 | 0.7 | GO:0045738 | negative regulation of DNA repair(GO:0045738) negative regulation of double-strand break repair(GO:2000780) |
| 0.1 | 1.3 | GO:0036309 | protein localization to M-band(GO:0036309) |
| 0.1 | 0.5 | GO:0035608 | protein deglutamylation(GO:0035608) |
| 0.1 | 0.2 | GO:0010643 | cell communication by chemical coupling(GO:0010643) |
| 0.1 | 0.3 | GO:1902513 | regulation of organelle transport along microtubule(GO:1902513) |
| 0.1 | 0.1 | GO:2000969 | positive regulation of alpha-amino-3-hydroxy-5-methyl-4-isoxazole propionate selective glutamate receptor activity(GO:2000969) |
| 0.1 | 0.3 | GO:0045217 | cell-cell junction maintenance(GO:0045217) |
| 0.1 | 0.5 | GO:0061343 | cell adhesion involved in heart morphogenesis(GO:0061343) |
| 0.1 | 0.7 | GO:0033148 | positive regulation of intracellular estrogen receptor signaling pathway(GO:0033148) |
| 0.1 | 0.7 | GO:0044597 | glycoside metabolic process(GO:0016137) polyketide metabolic process(GO:0030638) aminoglycoside antibiotic metabolic process(GO:0030647) daunorubicin metabolic process(GO:0044597) doxorubicin metabolic process(GO:0044598) |
| 0.1 | 1.5 | GO:0070911 | global genome nucleotide-excision repair(GO:0070911) |
| 0.1 | 1.6 | GO:0009125 | nucleoside monophosphate catabolic process(GO:0009125) |
| 0.1 | 0.3 | GO:0030047 | actin modification(GO:0030047) |
| 0.1 | 0.6 | GO:0051697 | protein delipidation(GO:0051697) |
| 0.1 | 0.3 | GO:0021503 | neural fold bending(GO:0021503) |
| 0.1 | 3.6 | GO:0006517 | protein deglycosylation(GO:0006517) |
| 0.1 | 4.0 | GO:0031572 | G2 DNA damage checkpoint(GO:0031572) |
| 0.1 | 0.2 | GO:0018171 | peptidyl-cysteine oxidation(GO:0018171) |
| 0.1 | 0.6 | GO:0033353 | S-adenosylmethionine cycle(GO:0033353) |
| 0.1 | 2.2 | GO:0006488 | dolichol-linked oligosaccharide biosynthetic process(GO:0006488) |
| 0.1 | 1.3 | GO:1903690 | negative regulation of wound healing, spreading of epidermal cells(GO:1903690) |
| 0.1 | 0.3 | GO:0006555 | methionine metabolic process(GO:0006555) |
| 0.1 | 1.4 | GO:0040020 | regulation of meiotic nuclear division(GO:0040020) |
| 0.1 | 0.4 | GO:0035513 | oxidative RNA demethylation(GO:0035513) oxidative single-stranded RNA demethylation(GO:0035553) |
| 0.1 | 0.5 | GO:0032264 | IMP salvage(GO:0032264) |
| 0.1 | 3.0 | GO:0007019 | microtubule depolymerization(GO:0007019) |
| 0.1 | 0.5 | GO:0060160 | negative regulation of dopamine receptor signaling pathway(GO:0060160) |
| 0.1 | 0.1 | GO:0033210 | leptin-mediated signaling pathway(GO:0033210) |
| 0.1 | 0.4 | GO:0018199 | peptidyl-glutamine modification(GO:0018199) |
| 0.1 | 0.4 | GO:2000313 | fibroblast growth factor receptor signaling pathway involved in neural plate anterior/posterior pattern formation(GO:0060825) regulation of neural crest formation(GO:0090299) negative regulation of neural crest formation(GO:0090301) regulation of fibroblast growth factor receptor signaling pathway involved in neural plate anterior/posterior pattern formation(GO:2000313) negative regulation of fibroblast growth factor receptor signaling pathway involved in neural plate anterior/posterior pattern formation(GO:2000314) |
| 0.1 | 0.9 | GO:0033539 | fatty acid beta-oxidation using acyl-CoA dehydrogenase(GO:0033539) |
| 0.1 | 1.1 | GO:0032802 | low-density lipoprotein particle receptor catabolic process(GO:0032802) |
| 0.1 | 0.7 | GO:0048194 | Golgi vesicle budding(GO:0048194) |
| 0.1 | 1.2 | GO:0098535 | de novo centriole assembly(GO:0098535) |
| 0.1 | 0.2 | GO:0097029 | mature conventional dendritic cell differentiation(GO:0097029) |
| 0.1 | 0.3 | GO:0060027 | convergent extension involved in gastrulation(GO:0060027) |
| 0.1 | 1.3 | GO:1904776 | regulation of protein localization to cell cortex(GO:1904776) positive regulation of protein localization to cell cortex(GO:1904778) |
| 0.1 | 0.3 | GO:0044376 | RNA polymerase II complex import to nucleus(GO:0044376) RNA polymerase III complex localization to nucleus(GO:1990022) |
| 0.1 | 1.0 | GO:0006105 | succinate metabolic process(GO:0006105) |
| 0.1 | 0.6 | GO:0045176 | apical protein localization(GO:0045176) |
| 0.1 | 2.1 | GO:0060976 | coronary vasculature development(GO:0060976) |
| 0.1 | 0.3 | GO:0001869 | regulation of complement activation, lectin pathway(GO:0001868) negative regulation of complement activation, lectin pathway(GO:0001869) |
| 0.1 | 2.2 | GO:0007216 | G-protein coupled glutamate receptor signaling pathway(GO:0007216) |
| 0.1 | 0.3 | GO:0033499 | galactose catabolic process via UDP-galactose(GO:0033499) |
| 0.1 | 0.5 | GO:0080154 | regulation of fertilization(GO:0080154) |
| 0.1 | 0.2 | GO:0000964 | mitochondrial RNA 5'-end processing(GO:0000964) |
| 0.1 | 0.6 | GO:0010166 | wax biosynthetic process(GO:0010025) wax metabolic process(GO:0010166) |
| 0.1 | 0.3 | GO:0070837 | dehydroascorbic acid transport(GO:0070837) |
| 0.1 | 0.3 | GO:0021943 | formation of radial glial scaffolds(GO:0021943) |
| 0.1 | 0.1 | GO:0071372 | cellular response to follicle-stimulating hormone stimulus(GO:0071372) |
| 0.1 | 0.3 | GO:0070973 | protein localization to endoplasmic reticulum exit site(GO:0070973) |
| 0.1 | 0.5 | GO:0001963 | synaptic transmission, dopaminergic(GO:0001963) |
| 0.1 | 0.6 | GO:0014051 | gamma-aminobutyric acid secretion(GO:0014051) |
| 0.1 | 0.3 | GO:1904562 | phosphatidylinositol 5-phosphate metabolic process(GO:1904562) |
| 0.1 | 1.6 | GO:0003091 | renal water homeostasis(GO:0003091) |
| 0.1 | 0.3 | GO:1902824 | positive regulation of late endosome to lysosome transport(GO:1902824) |
| 0.1 | 3.3 | GO:0006458 | 'de novo' protein folding(GO:0006458) |
| 0.1 | 0.3 | GO:1990258 | box C/D snoRNA 3'-end processing(GO:0000494) box C/D snoRNA metabolic process(GO:0033967) box C/D snoRNA processing(GO:0034963) histone glutamine methylation(GO:1990258) |
| 0.1 | 0.7 | GO:0010457 | centriole-centriole cohesion(GO:0010457) |
| 0.1 | 0.5 | GO:2000312 | regulation of kainate selective glutamate receptor activity(GO:2000312) |
| 0.1 | 0.9 | GO:0050966 | detection of mechanical stimulus involved in sensory perception of pain(GO:0050966) |
| 0.1 | 0.8 | GO:0070475 | rRNA base methylation(GO:0070475) |
| 0.1 | 1.3 | GO:0006012 | galactose metabolic process(GO:0006012) |
| 0.1 | 3.4 | GO:0006376 | mRNA splice site selection(GO:0006376) |
| 0.1 | 1.6 | GO:1903504 | regulation of mitotic cell cycle spindle assembly checkpoint(GO:0090266) regulation of mitotic spindle checkpoint(GO:1903504) |
| 0.1 | 0.5 | GO:0008218 | bioluminescence(GO:0008218) |
| 0.1 | 0.4 | GO:0008588 | release of cytoplasmic sequestered NF-kappaB(GO:0008588) |
| 0.1 | 0.4 | GO:0060455 | negative regulation of gastric acid secretion(GO:0060455) |
| 0.1 | 1.7 | GO:0005980 | glycogen catabolic process(GO:0005980) |
| 0.1 | 0.4 | GO:0006384 | transcription initiation from RNA polymerase III promoter(GO:0006384) |
| 0.1 | 0.4 | GO:0006127 | glycerophosphate shuttle(GO:0006127) |
| 0.1 | 2.4 | GO:0006743 | ubiquinone metabolic process(GO:0006743) ubiquinone biosynthetic process(GO:0006744) quinone biosynthetic process(GO:1901663) |
| 0.1 | 1.0 | GO:2000427 | positive regulation of apoptotic cell clearance(GO:2000427) |
| 0.1 | 0.3 | GO:0043012 | regulation of fusion of sperm to egg plasma membrane(GO:0043012) |
| 0.1 | 0.2 | GO:2001015 | negative regulation of skeletal muscle cell differentiation(GO:2001015) |
| 0.1 | 0.3 | GO:0072093 | metanephric renal vesicle formation(GO:0072093) |
| 0.1 | 1.5 | GO:0006506 | GPI anchor metabolic process(GO:0006505) GPI anchor biosynthetic process(GO:0006506) |
| 0.1 | 0.7 | GO:0015712 | hexose phosphate transport(GO:0015712) glucose-6-phosphate transport(GO:0015760) |
| 0.1 | 0.2 | GO:0090365 | regulation of mRNA modification(GO:0090365) |
| 0.1 | 0.6 | GO:0033623 | regulation of integrin activation(GO:0033623) |
| 0.1 | 0.1 | GO:0044240 | multicellular organism lipid catabolic process(GO:0044240) |
| 0.1 | 1.6 | GO:2000811 | negative regulation of anoikis(GO:2000811) |
| 0.1 | 1.9 | GO:0016578 | histone deubiquitination(GO:0016578) |
| 0.1 | 0.8 | GO:0050884 | neuromuscular process controlling posture(GO:0050884) |
| 0.1 | 0.2 | GO:0019853 | L-ascorbic acid biosynthetic process(GO:0019853) |
| 0.1 | 0.2 | GO:0002384 | hepatic immune response(GO:0002384) |
| 0.1 | 0.3 | GO:0044107 | cellular alcohol metabolic process(GO:0044107) cellular alcohol biosynthetic process(GO:0044108) |
| 0.1 | 0.3 | GO:0071044 | histone mRNA catabolic process(GO:0071044) |
| 0.1 | 0.7 | GO:0043101 | purine-containing compound salvage(GO:0043101) |
| 0.1 | 0.5 | GO:0061156 | pulmonary artery morphogenesis(GO:0061156) |
| 0.1 | 1.0 | GO:0030091 | protein repair(GO:0030091) |
| 0.1 | 0.6 | GO:0070272 | proton-transporting ATP synthase complex assembly(GO:0043461) proton-transporting ATP synthase complex biogenesis(GO:0070272) |
| 0.1 | 0.6 | GO:0006491 | N-glycan processing(GO:0006491) |
| 0.1 | 1.9 | GO:0003016 | respiratory system process(GO:0003016) |
| 0.1 | 2.2 | GO:0007585 | respiratory gaseous exchange(GO:0007585) |
| 0.1 | 0.1 | GO:0046709 | IDP metabolic process(GO:0046707) IDP catabolic process(GO:0046709) |
| 0.1 | 0.2 | GO:0001951 | intestinal D-glucose absorption(GO:0001951) |
| 0.1 | 0.2 | GO:1900126 | negative regulation of hyaluronan biosynthetic process(GO:1900126) |
| 0.1 | 0.9 | GO:0034058 | endosomal vesicle fusion(GO:0034058) |
| 0.1 | 0.1 | GO:0070255 | regulation of mucus secretion(GO:0070255) |
| 0.1 | 0.3 | GO:0042754 | negative regulation of circadian rhythm(GO:0042754) |
| 0.1 | 0.3 | GO:0009447 | putrescine catabolic process(GO:0009447) |
| 0.1 | 2.0 | GO:0060292 | long term synaptic depression(GO:0060292) |
| 0.1 | 0.3 | GO:0023016 | signal transduction by trans-phosphorylation(GO:0023016) |
| 0.1 | 0.1 | GO:0014735 | regulation of muscle atrophy(GO:0014735) |
| 0.1 | 0.6 | GO:2000144 | positive regulation of DNA-templated transcription, initiation(GO:2000144) |
| 0.1 | 1.6 | GO:0061082 | myeloid leukocyte cytokine production(GO:0061082) |
| 0.1 | 2.0 | GO:0046782 | regulation of viral transcription(GO:0046782) |
| 0.1 | 0.2 | GO:0051445 | regulation of meiotic cell cycle(GO:0051445) |
| 0.1 | 0.8 | GO:0090136 | epithelial cell-cell adhesion(GO:0090136) |
| 0.1 | 0.2 | GO:1903224 | regulation of endodermal cell differentiation(GO:1903224) negative regulation of endodermal cell differentiation(GO:1903225) negative regulation of gastrulation(GO:2000542) |
| 0.1 | 0.2 | GO:0051562 | negative regulation of mitochondrial calcium ion concentration(GO:0051562) |
| 0.1 | 1.1 | GO:0006853 | carnitine shuttle(GO:0006853) |
| 0.1 | 0.1 | GO:0045578 | negative regulation of B cell differentiation(GO:0045578) |
| 0.1 | 0.2 | GO:0036233 | glycine import(GO:0036233) |
| 0.1 | 0.2 | GO:0048712 | negative regulation of astrocyte differentiation(GO:0048712) |
| 0.1 | 0.2 | GO:0035526 | retrograde transport, plasma membrane to Golgi(GO:0035526) |
| 0.1 | 0.4 | GO:0048050 | post-embryonic eye morphogenesis(GO:0048050) |
| 0.1 | 0.3 | GO:0030238 | male sex determination(GO:0030238) |
| 0.1 | 1.9 | GO:0045737 | positive regulation of cyclin-dependent protein serine/threonine kinase activity(GO:0045737) |
| 0.1 | 1.9 | GO:0034142 | toll-like receptor 4 signaling pathway(GO:0034142) |
| 0.1 | 0.1 | GO:2000393 | negative regulation of lamellipodium morphogenesis(GO:2000393) |
| 0.1 | 0.2 | GO:0045869 | negative regulation of single stranded viral RNA replication via double stranded DNA intermediate(GO:0045869) |
| 0.1 | 0.3 | GO:0046952 | ketone body catabolic process(GO:0046952) |
| 0.1 | 1.5 | GO:0006895 | Golgi to endosome transport(GO:0006895) |
| 0.1 | 0.9 | GO:0045736 | negative regulation of cyclin-dependent protein serine/threonine kinase activity(GO:0045736) |
| 0.1 | 0.9 | GO:0035584 | calcium-mediated signaling using intracellular calcium source(GO:0035584) |
| 0.1 | 0.2 | GO:0070682 | proteasome regulatory particle assembly(GO:0070682) |
| 0.1 | 0.1 | GO:0090149 | mitochondrial membrane fission(GO:0090149) |
| 0.1 | 1.2 | GO:0050995 | negative regulation of lipid catabolic process(GO:0050995) |
| 0.1 | 0.2 | GO:0031937 | positive regulation of chromatin silencing(GO:0031937) |
| 0.1 | 0.2 | GO:0042732 | D-xylose metabolic process(GO:0042732) |
| 0.1 | 0.1 | GO:0015847 | putrescine transport(GO:0015847) |
| 0.1 | 0.2 | GO:0034443 | regulation of lipoprotein oxidation(GO:0034442) negative regulation of lipoprotein oxidation(GO:0034443) regulation of plasma lipoprotein particle oxidation(GO:0034444) negative regulation of plasma lipoprotein particle oxidation(GO:0034445) |
| 0.1 | 1.0 | GO:1904293 | negative regulation of ERAD pathway(GO:1904293) |
| 0.1 | 0.4 | GO:1904354 | negative regulation of telomere capping(GO:1904354) |
| 0.1 | 1.6 | GO:0007143 | female meiotic division(GO:0007143) |
| 0.1 | 0.3 | GO:1902954 | regulation of early endosome to recycling endosome transport(GO:1902954) |
| 0.1 | 1.1 | GO:0060219 | camera-type eye photoreceptor cell differentiation(GO:0060219) |
| 0.1 | 0.3 | GO:1900016 | negative regulation of cytokine production involved in inflammatory response(GO:1900016) |
| 0.1 | 0.4 | GO:0001731 | formation of translation preinitiation complex(GO:0001731) |
| 0.1 | 1.0 | GO:0009083 | branched-chain amino acid catabolic process(GO:0009083) |
| 0.1 | 0.5 | GO:0006741 | NADP biosynthetic process(GO:0006741) |
| 0.1 | 0.4 | GO:1902884 | positive regulation of response to oxidative stress(GO:1902884) |
| 0.1 | 0.1 | GO:0071677 | positive regulation of mononuclear cell migration(GO:0071677) |
| 0.1 | 0.3 | GO:0035627 | ceramide transport(GO:0035627) |
| 0.1 | 0.5 | GO:0071467 | cellular response to pH(GO:0071467) |
| 0.1 | 0.2 | GO:2000504 | positive regulation of blood vessel remodeling(GO:2000504) |
| 0.1 | 0.2 | GO:0035752 | lysosomal lumen pH elevation(GO:0035752) |
| 0.1 | 0.1 | GO:0000727 | double-strand break repair via break-induced replication(GO:0000727) |
| 0.1 | 0.9 | GO:0051412 | response to corticosterone(GO:0051412) |
| 0.1 | 1.3 | GO:0048286 | lung alveolus development(GO:0048286) |
| 0.1 | 1.1 | GO:2000766 | negative regulation of cytoplasmic translation(GO:2000766) |
| 0.1 | 0.8 | GO:0098734 | macromolecule depalmitoylation(GO:0098734) |
| 0.1 | 0.1 | GO:0006311 | meiotic gene conversion(GO:0006311) |
| 0.1 | 0.9 | GO:0032964 | collagen biosynthetic process(GO:0032964) |
| 0.1 | 0.1 | GO:1901252 | regulation of intracellular transport of viral material(GO:1901252) negative regulation of intracellular transport of viral material(GO:1901253) |
| 0.1 | 0.2 | GO:0072079 | nephron tubule formation(GO:0072079) |
| 0.1 | 0.1 | GO:1902956 | regulation of mitochondrial electron transport, NADH to ubiquinone(GO:1902956) negative regulation of mitochondrial electron transport, NADH to ubiquinone(GO:1902957) |
| 0.1 | 0.3 | GO:2000346 | negative regulation of hepatocyte proliferation(GO:2000346) |
| 0.1 | 0.7 | GO:0071941 | nitrogen cycle metabolic process(GO:0071941) |
| 0.1 | 5.4 | GO:0032981 | NADH dehydrogenase complex assembly(GO:0010257) mitochondrial respiratory chain complex I assembly(GO:0032981) mitochondrial respiratory chain complex I biogenesis(GO:0097031) |
| 0.1 | 0.5 | GO:0097267 | omega-hydroxylase P450 pathway(GO:0097267) |
| 0.1 | 0.9 | GO:1903608 | protein localization to cytoplasmic stress granule(GO:1903608) |
| 0.1 | 0.5 | GO:0044342 | type B pancreatic cell proliferation(GO:0044342) |
| 0.1 | 0.5 | GO:0070236 | regulation of activation-induced cell death of T cells(GO:0070235) negative regulation of activation-induced cell death of T cells(GO:0070236) |
| 0.1 | 0.1 | GO:0090666 | scaRNA localization to Cajal body(GO:0090666) |
| 0.1 | 0.5 | GO:0090042 | tubulin deacetylation(GO:0090042) |
| 0.1 | 0.8 | GO:0006703 | estrogen biosynthetic process(GO:0006703) |
| 0.1 | 0.5 | GO:0035879 | plasma membrane lactate transport(GO:0035879) |
| 0.1 | 0.3 | GO:0048484 | enteric nervous system development(GO:0048484) |
| 0.1 | 0.2 | GO:0046485 | ether lipid metabolic process(GO:0046485) |
| 0.1 | 0.2 | GO:0035886 | vascular smooth muscle cell differentiation(GO:0035886) |
| 0.1 | 0.3 | GO:0033108 | mitochondrial respiratory chain complex assembly(GO:0033108) |
| 0.1 | 0.1 | GO:1904431 | positive regulation of t-circle formation(GO:1904431) |
| 0.1 | 2.5 | GO:0065004 | protein-DNA complex assembly(GO:0065004) |
| 0.1 | 0.6 | GO:0098789 | pre-mRNA cleavage required for polyadenylation(GO:0098789) |
| 0.1 | 0.8 | GO:0019373 | epoxygenase P450 pathway(GO:0019373) |
| 0.1 | 0.4 | GO:0046101 | hypoxanthine metabolic process(GO:0046100) hypoxanthine biosynthetic process(GO:0046101) |
| 0.1 | 0.1 | GO:0070945 | neutrophil mediated killing of gram-negative bacterium(GO:0070945) |
| 0.1 | 1.1 | GO:0003334 | keratinocyte development(GO:0003334) |
| 0.1 | 0.4 | GO:2000757 | negative regulation of peptidyl-lysine acetylation(GO:2000757) |
| 0.1 | 0.6 | GO:0006817 | phosphate ion transport(GO:0006817) |
| 0.1 | 0.3 | GO:1903799 | negative regulation of production of miRNAs involved in gene silencing by miRNA(GO:1903799) |
| 0.1 | 0.2 | GO:1902897 | regulation of postsynaptic density protein 95 clustering(GO:1902897) |
| 0.1 | 0.5 | GO:0006776 | vitamin A metabolic process(GO:0006776) |
| 0.1 | 0.4 | GO:0045079 | negative regulation of chemokine biosynthetic process(GO:0045079) |
| 0.1 | 0.5 | GO:0043586 | tongue development(GO:0043586) |
| 0.1 | 2.0 | GO:0042417 | dopamine metabolic process(GO:0042417) |
| 0.1 | 2.5 | GO:2000249 | regulation of actin cytoskeleton reorganization(GO:2000249) |
| 0.1 | 0.2 | GO:0045950 | negative regulation of mitotic recombination(GO:0045950) |
| 0.1 | 0.2 | GO:1903025 | regulation of RNA polymerase II regulatory region sequence-specific DNA binding(GO:1903025) |
| 0.1 | 1.4 | GO:0045616 | regulation of keratinocyte differentiation(GO:0045616) |
| 0.1 | 0.5 | GO:0032286 | central nervous system myelin maintenance(GO:0032286) |
| 0.1 | 1.0 | GO:0045841 | negative regulation of mitotic metaphase/anaphase transition(GO:0045841) negative regulation of metaphase/anaphase transition of cell cycle(GO:1902100) |
| 0.1 | 0.3 | GO:0033299 | secretion of lysosomal enzymes(GO:0033299) |
| 0.1 | 0.3 | GO:0098700 | neurotransmitter loading into synaptic vesicle(GO:0098700) |
| 0.1 | 7.5 | GO:0016125 | sterol metabolic process(GO:0016125) |
| 0.1 | 0.4 | GO:0019720 | Mo-molybdopterin cofactor biosynthetic process(GO:0006777) Mo-molybdopterin cofactor metabolic process(GO:0019720) |
| 0.1 | 0.2 | GO:2000813 | negative regulation of barbed-end actin filament capping(GO:2000813) |
| 0.1 | 0.4 | GO:0036500 | ATF6-mediated unfolded protein response(GO:0036500) |
| 0.1 | 0.1 | GO:0090071 | negative regulation of ribosome biogenesis(GO:0090071) |
| 0.1 | 0.6 | GO:0010971 | positive regulation of G2/M transition of mitotic cell cycle(GO:0010971) |
| 0.1 | 1.0 | GO:0006782 | protoporphyrinogen IX biosynthetic process(GO:0006782) |
| 0.1 | 0.5 | GO:0017062 | respiratory chain complex III assembly(GO:0017062) mitochondrial respiratory chain complex III assembly(GO:0034551) |
| 0.1 | 0.1 | GO:0007228 | positive regulation of hh target transcription factor activity(GO:0007228) |
| 0.1 | 0.1 | GO:0055091 | phospholipid homeostasis(GO:0055091) |
| 0.1 | 0.3 | GO:1900225 | regulation of NLRP3 inflammasome complex assembly(GO:1900225) |
| 0.1 | 0.3 | GO:0032310 | prostaglandin secretion(GO:0032310) |
| 0.1 | 0.2 | GO:0009449 | gamma-aminobutyric acid biosynthetic process(GO:0009449) |
| 0.1 | 0.2 | GO:0035022 | positive regulation of Rac protein signal transduction(GO:0035022) |
| 0.1 | 0.9 | GO:0070262 | peptidyl-serine dephosphorylation(GO:0070262) |
| 0.1 | 0.4 | GO:0006265 | DNA topological change(GO:0006265) |
| 0.1 | 1.1 | GO:0006654 | phosphatidic acid biosynthetic process(GO:0006654) |
| 0.1 | 0.4 | GO:0021869 | forebrain ventricular zone progenitor cell division(GO:0021869) |
| 0.1 | 0.2 | GO:0045204 | MAPK export from nucleus(GO:0045204) |
| 0.1 | 0.2 | GO:0018200 | peptidyl-glutamic acid modification(GO:0018200) |
| 0.1 | 4.7 | GO:2000134 | negative regulation of G1/S transition of mitotic cell cycle(GO:2000134) |
| 0.1 | 0.3 | GO:0002775 | antimicrobial peptide production(GO:0002775) antibacterial peptide production(GO:0002778) |
| 0.1 | 2.8 | GO:0030835 | negative regulation of actin filament depolymerization(GO:0030835) |
| 0.1 | 0.3 | GO:0045007 | depurination(GO:0045007) |
| 0.1 | 0.3 | GO:2000773 | negative regulation of cellular senescence(GO:2000773) |
| 0.1 | 0.6 | GO:0035331 | negative regulation of hippo signaling(GO:0035331) |
| 0.1 | 0.2 | GO:0090675 | intermicrovillar adhesion(GO:0090675) |
| 0.1 | 1.7 | GO:0042733 | embryonic digit morphogenesis(GO:0042733) |
| 0.1 | 0.6 | GO:0042276 | error-prone translesion synthesis(GO:0042276) |
| 0.0 | 1.2 | GO:0000083 | regulation of transcription involved in G1/S transition of mitotic cell cycle(GO:0000083) |
| 0.0 | 0.3 | GO:0072718 | response to cisplatin(GO:0072718) |
| 0.0 | 0.1 | GO:1903624 | regulation of DNA catabolic process(GO:1903624) |
| 0.0 | 1.4 | GO:0035825 | reciprocal meiotic recombination(GO:0007131) reciprocal DNA recombination(GO:0035825) |
| 0.0 | 2.0 | GO:0006904 | vesicle docking involved in exocytosis(GO:0006904) |
| 0.0 | 0.5 | GO:0061088 | regulation of sequestering of zinc ion(GO:0061088) |
| 0.0 | 0.8 | GO:0033617 | mitochondrial respiratory chain complex IV assembly(GO:0033617) |
| 0.0 | 0.1 | GO:0000393 | spliceosomal conformational changes to generate catalytic conformation(GO:0000393) |
| 0.0 | 1.0 | GO:0045948 | positive regulation of translational initiation(GO:0045948) |
| 0.0 | 0.6 | GO:0034587 | piRNA metabolic process(GO:0034587) |
| 0.0 | 0.2 | GO:0048069 | eye pigmentation(GO:0048069) |
| 0.0 | 0.6 | GO:0035767 | endothelial cell chemotaxis(GO:0035767) |
| 0.0 | 0.1 | GO:0045631 | regulation of auditory receptor cell differentiation(GO:0045607) regulation of mechanoreceptor differentiation(GO:0045631) regulation of inner ear receptor cell differentiation(GO:2000980) |
| 0.0 | 0.1 | GO:0006982 | response to lipid hydroperoxide(GO:0006982) |
| 0.0 | 1.1 | GO:0006123 | mitochondrial electron transport, cytochrome c to oxygen(GO:0006123) |
| 0.0 | 0.2 | GO:0007512 | adult heart development(GO:0007512) |
| 0.0 | 0.5 | GO:0001542 | ovulation from ovarian follicle(GO:0001542) |
| 0.0 | 0.5 | GO:0021942 | radial glia guided migration of Purkinje cell(GO:0021942) |
| 0.0 | 0.3 | GO:0006296 | nucleotide-excision repair, DNA incision, 5'-to lesion(GO:0006296) |
| 0.0 | 0.4 | GO:0050703 | interleukin-1 alpha secretion(GO:0050703) |
| 0.0 | 1.5 | GO:0000188 | inactivation of MAPK activity(GO:0000188) |
| 0.0 | 0.4 | GO:0051988 | regulation of attachment of spindle microtubules to kinetochore(GO:0051988) |
| 0.0 | 0.2 | GO:0090096 | regulation of metanephric cap mesenchymal cell proliferation(GO:0090095) positive regulation of metanephric cap mesenchymal cell proliferation(GO:0090096) |
| 0.0 | 0.3 | GO:0060736 | prostate gland growth(GO:0060736) |
| 0.0 | 5.3 | GO:0070268 | cornification(GO:0070268) |
| 0.0 | 0.4 | GO:0060081 | membrane hyperpolarization(GO:0060081) |
| 0.0 | 0.9 | GO:0048265 | response to pain(GO:0048265) |
| 0.0 | 0.5 | GO:0035988 | chondrocyte proliferation(GO:0035988) |
| 0.0 | 0.4 | GO:0006352 | DNA-templated transcription, initiation(GO:0006352) |
| 0.0 | 0.2 | GO:0015727 | lactate transport(GO:0015727) lactate transmembrane transport(GO:0035873) |
| 0.0 | 1.8 | GO:0030866 | cortical actin cytoskeleton organization(GO:0030866) |
| 0.0 | 0.1 | GO:0003057 | regulation of the force of heart contraction by chemical signal(GO:0003057) |
| 0.0 | 1.1 | GO:0007129 | synapsis(GO:0007129) |
| 0.0 | 0.1 | GO:0032929 | negative regulation of superoxide anion generation(GO:0032929) |
| 0.0 | 0.1 | GO:0051974 | negative regulation of telomerase activity(GO:0051974) |
| 0.0 | 0.1 | GO:0006864 | pyrimidine nucleotide transport(GO:0006864) mitochondrial pyrimidine nucleotide import(GO:1990519) |
| 0.0 | 0.4 | GO:0042073 | intraciliary transport(GO:0042073) protein transport along microtubule(GO:0098840) |
| 0.0 | 0.7 | GO:0032836 | glomerular basement membrane development(GO:0032836) |
| 0.0 | 0.3 | GO:0032097 | positive regulation of response to food(GO:0032097) positive regulation of appetite(GO:0032100) |
| 0.0 | 0.2 | GO:0006538 | glutamate catabolic process(GO:0006538) |
| 0.0 | 1.2 | GO:0000186 | activation of MAPKK activity(GO:0000186) |
| 0.0 | 0.2 | GO:0046947 | hydroxylysine metabolic process(GO:0046946) hydroxylysine biosynthetic process(GO:0046947) |
| 0.0 | 1.3 | GO:1900026 | positive regulation of substrate adhesion-dependent cell spreading(GO:1900026) |
| 0.0 | 0.1 | GO:0048563 | post-embryonic organ morphogenesis(GO:0048563) |
| 0.0 | 0.7 | GO:0060135 | maternal process involved in female pregnancy(GO:0060135) |
| 0.0 | 0.0 | GO:0038183 | bile acid signaling pathway(GO:0038183) |
| 0.0 | 0.2 | GO:2000270 | negative regulation of fibroblast apoptotic process(GO:2000270) |
| 0.0 | 0.3 | GO:0070233 | negative regulation of T cell apoptotic process(GO:0070233) |
| 0.0 | 0.1 | GO:2000048 | regulation of cell-cell adhesion mediated by cadherin(GO:2000047) negative regulation of cell-cell adhesion mediated by cadherin(GO:2000048) |
| 0.0 | 1.1 | GO:0000387 | spliceosomal snRNP assembly(GO:0000387) |
| 0.0 | 0.2 | GO:0051958 | methotrexate transport(GO:0051958) |
| 0.0 | 0.1 | GO:0042335 | cuticle development(GO:0042335) |
| 0.0 | 0.1 | GO:0007252 | I-kappaB phosphorylation(GO:0007252) |
| 0.0 | 0.2 | GO:0042853 | L-alanine metabolic process(GO:0042851) L-alanine catabolic process(GO:0042853) |
| 0.0 | 0.3 | GO:0046548 | retinal rod cell development(GO:0046548) |
| 0.0 | 0.5 | GO:1904707 | positive regulation of vascular smooth muscle cell proliferation(GO:1904707) |
| 0.0 | 0.3 | GO:0051725 | protein de-ADP-ribosylation(GO:0051725) |
| 0.0 | 0.1 | GO:0032700 | negative regulation of interleukin-17 production(GO:0032700) |
| 0.0 | 0.1 | GO:0002644 | negative regulation of tolerance induction(GO:0002644) |
| 0.0 | 0.2 | GO:1901629 | regulation of presynaptic membrane organization(GO:1901629) regulation of synaptic vesicle clustering(GO:2000807) |
| 0.0 | 0.1 | GO:0048642 | negative regulation of skeletal muscle tissue development(GO:0048642) |
| 0.0 | 0.4 | GO:0046475 | glycerophospholipid catabolic process(GO:0046475) |
| 0.0 | 0.0 | GO:0051127 | positive regulation of actin nucleation(GO:0051127) |
| 0.0 | 0.1 | GO:0016121 | tetraterpenoid metabolic process(GO:0016108) carotenoid metabolic process(GO:0016116) carotene metabolic process(GO:0016119) carotene catabolic process(GO:0016121) xanthophyll metabolic process(GO:0016122) terpene metabolic process(GO:0042214) terpene catabolic process(GO:0046247) |
| 0.0 | 0.4 | GO:1903054 | negative regulation of extracellular matrix organization(GO:1903054) |
| 0.0 | 0.1 | GO:1900425 | negative regulation of defense response to bacterium(GO:1900425) |
| 0.0 | 1.5 | GO:0030433 | ER-associated ubiquitin-dependent protein catabolic process(GO:0030433) |
| 0.0 | 0.1 | GO:0097021 | lymphocyte migration into lymphoid organs(GO:0097021) |
| 0.0 | 0.8 | GO:0045814 | negative regulation of gene expression, epigenetic(GO:0045814) |
| 0.0 | 0.1 | GO:2000609 | regulation of thyroid hormone generation(GO:2000609) |
| 0.0 | 0.8 | GO:0071377 | cellular response to glucagon stimulus(GO:0071377) |
| 0.0 | 0.1 | GO:0006001 | fructose catabolic process(GO:0006001) fructose catabolic process to hydroxyacetone phosphate and glyceraldehyde-3-phosphate(GO:0061624) |
| 0.0 | 0.2 | GO:0030263 | apoptotic chromosome condensation(GO:0030263) |
| 0.0 | 0.1 | GO:0051599 | response to hydrostatic pressure(GO:0051599) |
| 0.0 | 0.2 | GO:0015742 | alpha-ketoglutarate transport(GO:0015742) |
| 0.0 | 0.6 | GO:0019372 | lipoxygenase pathway(GO:0019372) |
| 0.0 | 0.4 | GO:0006228 | UTP biosynthetic process(GO:0006228) |
| 0.0 | 0.2 | GO:0033314 | mitotic DNA replication checkpoint(GO:0033314) |
| 0.0 | 1.8 | GO:0031424 | keratinization(GO:0031424) |
| 0.0 | 0.2 | GO:0002862 | negative regulation of inflammatory response to antigenic stimulus(GO:0002862) |
| 0.0 | 0.1 | GO:0007181 | transforming growth factor beta receptor complex assembly(GO:0007181) |
| 0.0 | 0.3 | GO:0016082 | synaptic vesicle priming(GO:0016082) |
| 0.0 | 0.1 | GO:0038193 | thromboxane A2 signaling pathway(GO:0038193) |
| 0.0 | 0.3 | GO:0009650 | UV protection(GO:0009650) |
| 0.0 | 0.1 | GO:0046473 | phosphatidic acid metabolic process(GO:0046473) |
| 0.0 | 0.0 | GO:0060018 | basophil differentiation(GO:0030221) positive regulation of chromatin assembly or disassembly(GO:0045799) astrocyte fate commitment(GO:0060018) |
| 0.0 | 0.9 | GO:0033574 | response to testosterone(GO:0033574) |
| 0.0 | 0.2 | GO:0019323 | pentose catabolic process(GO:0019323) |
| 0.0 | 0.2 | GO:0050655 | dermatan sulfate proteoglycan metabolic process(GO:0050655) |
| 0.0 | 0.1 | GO:2000822 | regulation of fear response(GO:1903365) positive regulation of fear response(GO:1903367) regulation of behavioral fear response(GO:2000822) positive regulation of behavioral fear response(GO:2000987) |
| 0.0 | 0.2 | GO:0090481 | pyrimidine nucleotide-sugar transmembrane transport(GO:0090481) |
| 0.0 | 0.2 | GO:0035437 | maintenance of protein localization in endoplasmic reticulum(GO:0035437) |
| 0.0 | 0.2 | GO:0006616 | SRP-dependent cotranslational protein targeting to membrane, translocation(GO:0006616) |
| 0.0 | 0.1 | GO:0045065 | cytotoxic T cell differentiation(GO:0045065) |
| 0.0 | 0.1 | GO:0071529 | cementum mineralization(GO:0071529) |
| 0.0 | 0.6 | GO:0033139 | regulation of peptidyl-serine phosphorylation of STAT protein(GO:0033139) |
| 0.0 | 0.1 | GO:0072537 | fibroblast activation(GO:0072537) |
| 0.0 | 0.9 | GO:0032728 | positive regulation of interferon-beta production(GO:0032728) |
| 0.0 | 0.1 | GO:0018158 | peptidyl-lysine oxidation(GO:0018057) protein oxidation(GO:0018158) |
| 0.0 | 0.1 | GO:0032309 | icosanoid secretion(GO:0032309) |
| 0.0 | 0.1 | GO:0045741 | positive regulation of epidermal growth factor-activated receptor activity(GO:0045741) |
| 0.0 | 0.1 | GO:0001878 | response to yeast(GO:0001878) |
| 0.0 | 2.2 | GO:0006338 | chromatin remodeling(GO:0006338) |
| 0.0 | 0.1 | GO:0046146 | tetrahydrobiopterin biosynthetic process(GO:0006729) tetrahydrobiopterin metabolic process(GO:0046146) |
| 0.0 | 0.0 | GO:0044034 | negative stranded viral RNA replication(GO:0039689) multi-organism biosynthetic process(GO:0044034) |
| 0.0 | 0.5 | GO:0006333 | chromatin assembly or disassembly(GO:0006333) |
| 0.0 | 0.2 | GO:0070932 | histone H3 deacetylation(GO:0070932) |
| 0.0 | 0.4 | GO:0039531 | regulation of viral-induced cytoplasmic pattern recognition receptor signaling pathway(GO:0039531) |
| 0.0 | 0.0 | GO:0031125 | rRNA 3'-end processing(GO:0031125) |
| 0.0 | 0.0 | GO:0048294 | negative regulation of isotype switching to IgE isotypes(GO:0048294) |
| 0.0 | 0.0 | GO:1905244 | regulation of modification of synaptic structure(GO:1905244) |
| 0.0 | 0.4 | GO:0043616 | keratinocyte proliferation(GO:0043616) |
| 0.0 | 0.1 | GO:0003084 | positive regulation of systemic arterial blood pressure(GO:0003084) |
| 0.0 | 0.0 | GO:0045196 | establishment or maintenance of neuroblast polarity(GO:0045196) establishment of neuroblast polarity(GO:0045200) |
| 0.0 | 0.1 | GO:1903336 | negative regulation of vacuolar transport(GO:1903336) |
| 0.0 | 0.0 | GO:0044205 | 'de novo' UMP biosynthetic process(GO:0044205) |
| 0.0 | 0.1 | GO:2000435 | regulation of protein neddylation(GO:2000434) negative regulation of protein neddylation(GO:2000435) |
| 0.0 | 0.2 | GO:0061709 | reticulophagy(GO:0061709) |
| 0.0 | 0.3 | GO:0010226 | response to lithium ion(GO:0010226) |
| 0.0 | 0.1 | GO:0034499 | late endosome to Golgi transport(GO:0034499) |
| 0.0 | 0.1 | GO:0034154 | toll-like receptor 7 signaling pathway(GO:0034154) |
| 0.0 | 0.2 | GO:0035745 | T-helper 2 cell cytokine production(GO:0035745) |
| 0.0 | 0.1 | GO:1903301 | positive regulation of glucokinase activity(GO:0033133) regulation of hexokinase activity(GO:1903299) positive regulation of hexokinase activity(GO:1903301) |
| 0.0 | 0.1 | GO:1902527 | positive regulation of protein monoubiquitination(GO:1902527) |
| 0.0 | 0.2 | GO:0048681 | negative regulation of axon regeneration(GO:0048681) negative regulation of neuron projection regeneration(GO:0070571) |
| 0.0 | 0.0 | GO:0070970 | interleukin-2 secretion(GO:0070970) |
| 0.0 | 0.0 | GO:0006370 | 7-methylguanosine mRNA capping(GO:0006370) |
| 0.0 | 0.7 | GO:0045103 | intermediate filament-based process(GO:0045103) |
| 0.0 | 0.1 | GO:0010310 | regulation of hydrogen peroxide metabolic process(GO:0010310) |
| 0.0 | 0.1 | GO:1903173 | phytol metabolic process(GO:0033306) fatty alcohol metabolic process(GO:1903173) |
| 0.0 | 0.2 | GO:0051415 | interphase microtubule nucleation by interphase microtubule organizing center(GO:0051415) microtubule nucleation by microtubule organizing center(GO:0051418) |
| 0.0 | 0.2 | GO:0006189 | 'de novo' IMP biosynthetic process(GO:0006189) |
| 0.0 | 0.2 | GO:0070327 | thyroid hormone transport(GO:0070327) |
| 0.0 | 0.1 | GO:0018343 | protein farnesylation(GO:0018343) |
| 0.0 | 2.8 | GO:0006614 | SRP-dependent cotranslational protein targeting to membrane(GO:0006614) |
| 0.0 | 0.2 | GO:0031087 | nuclear-transcribed mRNA catabolic process, deadenylation-independent decay(GO:0031086) deadenylation-independent decapping of nuclear-transcribed mRNA(GO:0031087) |
| 0.0 | 0.0 | GO:0031133 | regulation of axon diameter(GO:0031133) |
| 0.0 | 0.1 | GO:0008628 | hormone-mediated apoptotic signaling pathway(GO:0008628) |
| 0.0 | 0.0 | GO:0034088 | maintenance of sister chromatid cohesion(GO:0034086) maintenance of mitotic sister chromatid cohesion(GO:0034088) |
| 0.0 | 0.1 | GO:0035562 | negative regulation of chromatin binding(GO:0035562) |
| 0.0 | 0.0 | GO:0051546 | keratinocyte migration(GO:0051546) |
| 0.0 | 0.1 | GO:0014010 | Schwann cell proliferation(GO:0014010) |
| 0.0 | 0.1 | GO:0001887 | selenium compound metabolic process(GO:0001887) |
| 0.0 | 0.2 | GO:0001833 | inner cell mass cell proliferation(GO:0001833) |
| 0.0 | 0.5 | GO:0006693 | prostanoid metabolic process(GO:0006692) prostaglandin metabolic process(GO:0006693) |
| 0.0 | 0.1 | GO:0009048 | dosage compensation(GO:0007549) dosage compensation by inactivation of X chromosome(GO:0009048) |
| 0.0 | 0.2 | GO:0007258 | JUN phosphorylation(GO:0007258) |
| 0.0 | 0.1 | GO:0018094 | protein polyglycylation(GO:0018094) |
| 0.0 | 0.1 | GO:0071934 | thiamine transmembrane transport(GO:0071934) |
| 0.0 | 0.1 | GO:0051343 | positive regulation of cyclic-nucleotide phosphodiesterase activity(GO:0051343) |
| 0.0 | 0.2 | GO:0006069 | ethanol oxidation(GO:0006069) |
| 0.0 | 0.0 | GO:0060244 | negative regulation of cell proliferation involved in contact inhibition(GO:0060244) |
| 0.0 | 0.0 | GO:0051140 | regulation of NK T cell proliferation(GO:0051140) positive regulation of NK T cell proliferation(GO:0051142) |
| 0.0 | 0.2 | GO:0032516 | positive regulation of phosphoprotein phosphatase activity(GO:0032516) |
| 0.0 | 0.1 | GO:0018904 | ether metabolic process(GO:0018904) |
| 0.0 | 0.5 | GO:0036297 | interstrand cross-link repair(GO:0036297) |
| 0.0 | 0.3 | GO:0070071 | proton-transporting V-type ATPase complex assembly(GO:0070070) proton-transporting two-sector ATPase complex assembly(GO:0070071) vacuolar proton-transporting V-type ATPase complex assembly(GO:0070072) |
| 0.0 | 0.1 | GO:0038155 | interleukin-23-mediated signaling pathway(GO:0038155) |
| 0.0 | 0.1 | GO:0002318 | myeloid progenitor cell differentiation(GO:0002318) |
| 0.0 | 0.1 | GO:0070673 | response to interleukin-18(GO:0070673) |
| 0.0 | 0.1 | GO:0006312 | mitotic recombination(GO:0006312) |
| 0.0 | 0.2 | GO:0046716 | muscle cell cellular homeostasis(GO:0046716) |
| 0.0 | 0.1 | GO:0010452 | histone H3-K36 methylation(GO:0010452) |
| 0.0 | 0.1 | GO:0070212 | protein poly-ADP-ribosylation(GO:0070212) |
| 0.0 | 0.2 | GO:0034453 | microtubule anchoring(GO:0034453) |
| 0.0 | 0.1 | GO:0060294 | cilium movement involved in cell motility(GO:0060294) |
| 0.0 | 0.4 | GO:0045672 | positive regulation of osteoclast differentiation(GO:0045672) |
| 0.0 | 0.0 | GO:0045647 | negative regulation of erythrocyte differentiation(GO:0045647) |
| 0.0 | 0.2 | GO:0007597 | blood coagulation, intrinsic pathway(GO:0007597) |
| 0.0 | 0.1 | GO:0023041 | neuronal signal transduction(GO:0023041) |
| 0.0 | 0.1 | GO:0043950 | positive regulation of cAMP-mediated signaling(GO:0043950) |
| 0.0 | 0.1 | GO:0070166 | enamel mineralization(GO:0070166) |
| 0.0 | 0.0 | GO:1903564 | regulation of protein localization to cilium(GO:1903564) |
| 0.0 | 0.1 | GO:0048539 | bone marrow development(GO:0048539) |
| 0.0 | 0.1 | GO:0034447 | very-low-density lipoprotein particle clearance(GO:0034447) |
| 0.0 | 0.0 | GO:0043045 | DNA methylation involved in embryo development(GO:0043045) changes to DNA methylation involved in embryo development(GO:1901538) |
| 0.0 | 0.1 | GO:0003056 | regulation of vascular smooth muscle contraction(GO:0003056) |
| 0.0 | 0.0 | GO:2000483 | negative regulation of interleukin-8 secretion(GO:2000483) |
| 0.0 | 0.2 | GO:0001502 | cartilage condensation(GO:0001502) |
| 0.0 | 0.1 | GO:1990035 | calcium ion import across plasma membrane(GO:0098703) calcium ion import into cell(GO:1990035) |
| 0.0 | 0.2 | GO:0036066 | protein O-linked fucosylation(GO:0036066) |
| 0.0 | 0.0 | GO:0006286 | base-excision repair, base-free sugar-phosphate removal(GO:0006286) |
| 0.0 | 0.2 | GO:0061684 | chaperone-mediated autophagy(GO:0061684) |
| 0.0 | 0.1 | GO:0006554 | lysine catabolic process(GO:0006554) |
| 0.0 | 0.0 | GO:0016075 | rRNA catabolic process(GO:0016075) |
| 0.0 | 0.0 | GO:0070966 | nuclear-transcribed mRNA catabolic process, no-go decay(GO:0070966) |
| 0.0 | 0.0 | GO:0048749 | compound eye development(GO:0048749) |
| 0.0 | 0.0 | GO:0070901 | mitochondrial tRNA methylation(GO:0070901) |
Gene overrepresentation in cellular component category:
| Log-likelihood per target | Total log-likelihood | Term | Description |
|---|---|---|---|
| 2.5 | 7.6 | GO:0055028 | cortical microtubule(GO:0055028) |
| 1.8 | 9.0 | GO:0032449 | CBM complex(GO:0032449) |
| 1.7 | 19.1 | GO:0005955 | calcineurin complex(GO:0005955) |
| 1.5 | 4.5 | GO:0043293 | apoptosome(GO:0043293) |
| 1.2 | 2.4 | GO:0002193 | MAML1-RBP-Jkappa- ICN1 complex(GO:0002193) |
| 1.1 | 5.6 | GO:0048179 | activin receptor complex(GO:0048179) |
| 1.0 | 2.9 | GO:0034753 | nuclear aryl hydrocarbon receptor complex(GO:0034753) |
| 1.0 | 4.8 | GO:0016533 | cyclin-dependent protein kinase 5 holoenzyme complex(GO:0016533) |
| 0.9 | 5.6 | GO:0048787 | presynaptic active zone membrane(GO:0048787) |
| 0.9 | 9.4 | GO:0031465 | Cul4B-RING E3 ubiquitin ligase complex(GO:0031465) |
| 0.8 | 8.4 | GO:0016589 | NURF complex(GO:0016589) |
| 0.8 | 8.1 | GO:0097443 | sorting endosome(GO:0097443) |
| 0.8 | 1.5 | GO:0071149 | TEAD-2-YAP complex(GO:0071149) |
| 0.7 | 11.1 | GO:0031209 | SCAR complex(GO:0031209) |
| 0.7 | 4.3 | GO:0031501 | mannosyltransferase complex(GO:0031501) |
| 0.7 | 5.7 | GO:1903439 | calcitonin family receptor complex(GO:1903439) amylin receptor complex(GO:1903440) |
| 0.7 | 4.2 | GO:0005945 | 6-phosphofructokinase complex(GO:0005945) |
| 0.7 | 2.7 | GO:0097197 | tetraspanin-enriched microdomain(GO:0097197) |
| 0.7 | 3.3 | GO:0034666 | integrin alpha2-beta1 complex(GO:0034666) |
| 0.6 | 1.9 | GO:0031251 | PAN complex(GO:0031251) |
| 0.6 | 2.6 | GO:0032798 | Swi5-Sfr1 complex(GO:0032798) |
| 0.6 | 1.9 | GO:0071148 | TEAD-1-YAP complex(GO:0071148) |
| 0.6 | 1.9 | GO:0097135 | cyclin E2-CDK2 complex(GO:0097135) |
| 0.6 | 2.5 | GO:0005899 | insulin receptor complex(GO:0005899) |
| 0.6 | 6.2 | GO:0000138 | Golgi trans cisterna(GO:0000138) |
| 0.6 | 10.8 | GO:0035102 | PRC1 complex(GO:0035102) |
| 0.6 | 15.4 | GO:0044300 | cerebellar mossy fiber(GO:0044300) |
| 0.6 | 2.3 | GO:0097629 | extrinsic component of omegasome membrane(GO:0097629) |
| 0.6 | 9.1 | GO:0097470 | ribbon synapse(GO:0097470) |
| 0.6 | 1.7 | GO:0071062 | alphav-beta3 integrin-vitronectin complex(GO:0071062) |
| 0.5 | 2.2 | GO:0097513 | myosin II filament(GO:0097513) |
| 0.5 | 0.5 | GO:0019034 | viral replication complex(GO:0019034) |
| 0.5 | 7.3 | GO:0070776 | H3 histone acetyltransferase complex(GO:0070775) MOZ/MORF histone acetyltransferase complex(GO:0070776) |
| 0.5 | 2.1 | GO:1990851 | Wnt-Frizzled-LRP5/6 complex(GO:1990851) |
| 0.5 | 4.1 | GO:0030121 | AP-1 adaptor complex(GO:0030121) |
| 0.5 | 5.6 | GO:0016011 | dystroglycan complex(GO:0016011) |
| 0.5 | 1.5 | GO:0097224 | sperm connecting piece(GO:0097224) |
| 0.5 | 3.9 | GO:0035976 | AP1 complex(GO:0035976) |
| 0.5 | 4.4 | GO:0071953 | elastic fiber(GO:0071953) |
| 0.5 | 10.1 | GO:0043220 | Schmidt-Lanterman incisure(GO:0043220) |
| 0.5 | 1.8 | GO:0032937 | SREBP-SCAP-Insig complex(GO:0032937) |
| 0.4 | 5.4 | GO:0032593 | insulin-responsive compartment(GO:0032593) |
| 0.4 | 2.7 | GO:0009331 | glycerol-3-phosphate dehydrogenase complex(GO:0009331) |
| 0.4 | 4.8 | GO:0042587 | glycogen granule(GO:0042587) |
| 0.4 | 0.9 | GO:0061673 | mitotic spindle astral microtubule(GO:0061673) |
| 0.4 | 4.8 | GO:0070652 | HAUS complex(GO:0070652) |
| 0.4 | 1.7 | GO:0012510 | trans-Golgi network transport vesicle membrane(GO:0012510) |
| 0.4 | 2.5 | GO:0042272 | nuclear RNA export factor complex(GO:0042272) |
| 0.4 | 1.3 | GO:1902937 | inward rectifier potassium channel complex(GO:1902937) |
| 0.4 | 1.7 | GO:0097059 | CNTFR-CLCF1 complex(GO:0097059) |
| 0.4 | 5.8 | GO:0016600 | flotillin complex(GO:0016600) |
| 0.4 | 5.0 | GO:0000124 | SAGA complex(GO:0000124) |
| 0.4 | 0.4 | GO:0032541 | cortical endoplasmic reticulum(GO:0032541) |
| 0.4 | 1.2 | GO:0036117 | hyaluranon cable(GO:0036117) |
| 0.4 | 0.8 | GO:0000805 | X chromosome(GO:0000805) |
| 0.4 | 1.6 | GO:0072517 | viral factory(GO:0039713) cytoplasmic viral factory(GO:0039714) host cell viral assembly compartment(GO:0072517) |
| 0.4 | 1.9 | GO:1990761 | growth cone lamellipodium(GO:1990761) |
| 0.4 | 0.8 | GO:0033186 | CAF-1 complex(GO:0033186) |
| 0.4 | 10.5 | GO:0000145 | exocyst(GO:0000145) |
| 0.4 | 3.4 | GO:0000125 | PCAF complex(GO:0000125) |
| 0.4 | 1.1 | GO:0005663 | DNA replication factor C complex(GO:0005663) |
| 0.4 | 0.4 | GO:0034667 | integrin alpha3-beta1 complex(GO:0034667) |
| 0.4 | 1.8 | GO:0005896 | interleukin-6 receptor complex(GO:0005896) |
| 0.4 | 2.2 | GO:0005958 | DNA-dependent protein kinase-DNA ligase 4 complex(GO:0005958) |
| 0.4 | 1.8 | GO:0032302 | MutSbeta complex(GO:0032302) |
| 0.4 | 1.4 | GO:0042720 | mitochondrial inner membrane peptidase complex(GO:0042720) |
| 0.3 | 0.3 | GO:0044292 | dendrite terminus(GO:0044292) |
| 0.3 | 0.7 | GO:0071817 | MMXD complex(GO:0071817) |
| 0.3 | 1.3 | GO:0032144 | 4-aminobutyrate transaminase complex(GO:0032144) |
| 0.3 | 13.4 | GO:0016514 | SWI/SNF complex(GO:0016514) |
| 0.3 | 1.3 | GO:0097196 | Shu complex(GO:0097196) |
| 0.3 | 5.0 | GO:0035253 | ciliary rootlet(GO:0035253) |
| 0.3 | 1.2 | GO:0020003 | symbiont-containing vacuole(GO:0020003) |
| 0.3 | 1.5 | GO:0034751 | aryl hydrocarbon receptor complex(GO:0034751) |
| 0.3 | 13.4 | GO:0034451 | centriolar satellite(GO:0034451) |
| 0.3 | 8.4 | GO:0035098 | ESC/E(Z) complex(GO:0035098) |
| 0.3 | 1.5 | GO:0031436 | BRCA1-BARD1 complex(GO:0031436) |
| 0.3 | 1.2 | GO:0031510 | SUMO activating enzyme complex(GO:0031510) |
| 0.3 | 17.2 | GO:0030173 | integral component of Golgi membrane(GO:0030173) |
| 0.3 | 1.2 | GO:0000839 | Hrd1p ubiquitin ligase ERAD-L complex(GO:0000839) |
| 0.3 | 1.4 | GO:0070033 | synaptobrevin 2-SNAP-25-syntaxin-1a-complexin II complex(GO:0070033) |
| 0.3 | 2.5 | GO:0070765 | gamma-secretase complex(GO:0070765) |
| 0.3 | 1.7 | GO:0046696 | lipopolysaccharide receptor complex(GO:0046696) |
| 0.3 | 0.8 | GO:0032002 | interleukin-28 receptor complex(GO:0032002) |
| 0.3 | 2.5 | GO:0070531 | BRCA1-A complex(GO:0070531) |
| 0.3 | 1.1 | GO:0014802 | terminal cisterna(GO:0014802) |
| 0.3 | 0.8 | GO:0097543 | ciliary inversin compartment(GO:0097543) |
| 0.3 | 2.4 | GO:0030905 | retromer, tubulation complex(GO:0030905) |
| 0.3 | 12.8 | GO:0099738 | cell cortex region(GO:0099738) |
| 0.3 | 7.6 | GO:0016327 | apicolateral plasma membrane(GO:0016327) |
| 0.3 | 5.7 | GO:0005952 | cAMP-dependent protein kinase complex(GO:0005952) |
| 0.3 | 0.5 | GO:1902636 | kinociliary basal body(GO:1902636) |
| 0.3 | 1.8 | GO:0043541 | UDP-N-acetylglucosamine transferase complex(GO:0043541) |
| 0.3 | 1.0 | GO:0089717 | spanning component of plasma membrane(GO:0044214) spanning component of membrane(GO:0089717) |
| 0.3 | 1.3 | GO:0043291 | RAVE complex(GO:0043291) |
| 0.3 | 6.8 | GO:0010369 | chromocenter(GO:0010369) |
| 0.2 | 3.2 | GO:1990023 | mitotic spindle midzone(GO:1990023) |
| 0.2 | 2.0 | GO:0030062 | mitochondrial tricarboxylic acid cycle enzyme complex(GO:0030062) |
| 0.2 | 0.7 | GO:1905103 | integral component of lysosomal membrane(GO:1905103) |
| 0.2 | 2.9 | GO:0045179 | apical cortex(GO:0045179) |
| 0.2 | 1.2 | GO:0005828 | kinetochore microtubule(GO:0005828) |
| 0.2 | 3.8 | GO:0032039 | integrator complex(GO:0032039) |
| 0.2 | 16.2 | GO:0031907 | peroxisomal matrix(GO:0005782) microbody lumen(GO:0031907) |
| 0.2 | 1.6 | GO:0014731 | spectrin-associated cytoskeleton(GO:0014731) |
| 0.2 | 4.2 | GO:0008091 | spectrin(GO:0008091) |
| 0.2 | 0.5 | GO:0000939 | condensed chromosome inner kinetochore(GO:0000939) |
| 0.2 | 26.2 | GO:0005905 | clathrin-coated pit(GO:0005905) |
| 0.2 | 2.3 | GO:0042584 | chromaffin granule membrane(GO:0042584) |
| 0.2 | 14.3 | GO:0033017 | sarcoplasmic reticulum membrane(GO:0033017) |
| 0.2 | 1.8 | GO:0000796 | condensin complex(GO:0000796) |
| 0.2 | 0.9 | GO:0034365 | discoidal high-density lipoprotein particle(GO:0034365) |
| 0.2 | 3.8 | GO:0042588 | zymogen granule(GO:0042588) |
| 0.2 | 0.7 | GO:0070195 | growth hormone receptor complex(GO:0070195) |
| 0.2 | 7.2 | GO:0000178 | exosome (RNase complex)(GO:0000178) |
| 0.2 | 2.6 | GO:0016602 | CCAAT-binding factor complex(GO:0016602) |
| 0.2 | 2.4 | GO:0034464 | BBSome(GO:0034464) |
| 0.2 | 1.3 | GO:0070938 | contractile ring(GO:0070938) |
| 0.2 | 5.0 | GO:0070822 | Sin3-type complex(GO:0070822) |
| 0.2 | 8.4 | GO:0031092 | platelet alpha granule membrane(GO:0031092) |
| 0.2 | 5.0 | GO:0035327 | transcriptionally active chromatin(GO:0035327) |
| 0.2 | 3.7 | GO:0032045 | guanyl-nucleotide exchange factor complex(GO:0032045) |
| 0.2 | 1.0 | GO:1902560 | GMP reductase complex(GO:1902560) |
| 0.2 | 2.0 | GO:0031390 | Ctf18 RFC-like complex(GO:0031390) |
| 0.2 | 3.5 | GO:0000815 | ESCRT III complex(GO:0000815) |
| 0.2 | 0.6 | GO:0034657 | GID complex(GO:0034657) |
| 0.2 | 1.2 | GO:0034673 | inhibin-betaglycan-ActRII complex(GO:0034673) |
| 0.2 | 1.0 | GO:0045273 | mitochondrial respiratory chain complex II, succinate dehydrogenase complex (ubiquinone)(GO:0005749) succinate dehydrogenase complex (ubiquinone)(GO:0045257) respiratory chain complex II(GO:0045273) succinate dehydrogenase complex(GO:0045281) fumarate reductase complex(GO:0045283) |
| 0.2 | 0.8 | GO:0002189 | ribose phosphate diphosphokinase complex(GO:0002189) |
| 0.2 | 1.3 | GO:0072357 | PTW/PP1 phosphatase complex(GO:0072357) |
| 0.2 | 1.0 | GO:0033263 | CORVET complex(GO:0033263) |
| 0.2 | 7.0 | GO:0005790 | smooth endoplasmic reticulum(GO:0005790) |
| 0.2 | 7.5 | GO:0000421 | autophagosome membrane(GO:0000421) |
| 0.2 | 1.1 | GO:1990909 | Wnt signalosome(GO:1990909) |
| 0.2 | 1.6 | GO:0072487 | MSL complex(GO:0072487) |
| 0.2 | 5.5 | GO:0030992 | intraciliary transport particle B(GO:0030992) |
| 0.2 | 0.9 | GO:0070695 | FHF complex(GO:0070695) |
| 0.2 | 3.5 | GO:0030877 | beta-catenin destruction complex(GO:0030877) |
| 0.2 | 1.9 | GO:0000506 | glycosylphosphatidylinositol-N-acetylglucosaminyltransferase (GPI-GnT) complex(GO:0000506) |
| 0.2 | 0.7 | GO:0017109 | glutamate-cysteine ligase complex(GO:0017109) |
| 0.2 | 0.8 | GO:0072558 | NLRP1 inflammasome complex(GO:0072558) |
| 0.2 | 4.7 | GO:0005720 | nuclear heterochromatin(GO:0005720) |
| 0.2 | 8.8 | GO:0045334 | clathrin-coated endocytic vesicle(GO:0045334) |
| 0.2 | 1.6 | GO:0002116 | semaphorin receptor complex(GO:0002116) |
| 0.2 | 1.1 | GO:0005658 | alpha DNA polymerase:primase complex(GO:0005658) |
| 0.2 | 0.5 | GO:0032116 | SMC loading complex(GO:0032116) |
| 0.2 | 0.2 | GO:0070044 | synaptobrevin 2-SNAP-25-syntaxin-1a complex(GO:0070044) |
| 0.2 | 0.6 | GO:0098647 | collagen type VI trimer(GO:0005589) collagen beaded filament(GO:0098647) |
| 0.2 | 0.9 | GO:0000214 | tRNA-intron endonuclease complex(GO:0000214) |
| 0.1 | 1.5 | GO:0044354 | pinosome(GO:0044352) macropinosome(GO:0044354) |
| 0.1 | 5.9 | GO:0005921 | gap junction(GO:0005921) |
| 0.1 | 0.6 | GO:0034678 | integrin alpha8-beta1 complex(GO:0034678) |
| 0.1 | 0.7 | GO:0097165 | nuclear stress granule(GO:0097165) |
| 0.1 | 1.6 | GO:0042105 | alpha-beta T cell receptor complex(GO:0042105) |
| 0.1 | 0.1 | GO:0045298 | tubulin complex(GO:0045298) |
| 0.1 | 0.7 | GO:0071595 | Nem1-Spo7 phosphatase complex(GO:0071595) |
| 0.1 | 0.3 | GO:0090498 | extrinsic component of Golgi membrane(GO:0090498) |
| 0.1 | 1.1 | GO:0097442 | CA3 pyramidal cell dendrite(GO:0097442) |
| 0.1 | 1.1 | GO:0045252 | oxoglutarate dehydrogenase complex(GO:0045252) |
| 0.1 | 1.0 | GO:0000308 | cytoplasmic cyclin-dependent protein kinase holoenzyme complex(GO:0000308) |
| 0.1 | 2.1 | GO:0033270 | paranode region of axon(GO:0033270) |
| 0.1 | 2.2 | GO:0043240 | Fanconi anaemia nuclear complex(GO:0043240) |
| 0.1 | 0.5 | GO:0097362 | MCM8-MCM9 complex(GO:0097362) |
| 0.1 | 1.4 | GO:0005577 | fibrinogen complex(GO:0005577) |
| 0.1 | 2.1 | GO:0030008 | TRAPP complex(GO:0030008) |
| 0.1 | 6.5 | GO:0016592 | mediator complex(GO:0016592) |
| 0.1 | 1.7 | GO:0001673 | male germ cell nucleus(GO:0001673) |
| 0.1 | 0.4 | GO:0000333 | telomerase catalytic core complex(GO:0000333) |
| 0.1 | 1.1 | GO:0017059 | serine C-palmitoyltransferase complex(GO:0017059) endoplasmic reticulum palmitoyltransferase complex(GO:0031211) |
| 0.1 | 0.9 | GO:0033063 | Rad51B-Rad51C-Rad51D-XRCC2 complex(GO:0033063) |
| 0.1 | 0.1 | GO:0005816 | spindle pole body(GO:0005816) |
| 0.1 | 10.9 | GO:0031672 | A band(GO:0031672) |
| 0.1 | 2.0 | GO:0051233 | spindle midzone(GO:0051233) |
| 0.1 | 2.5 | GO:0016591 | DNA-directed RNA polymerase II, holoenzyme(GO:0016591) |
| 0.1 | 0.8 | GO:0033503 | HULC complex(GO:0033503) |
| 0.1 | 2.2 | GO:0016529 | sarcoplasmic reticulum(GO:0016529) |
| 0.1 | 0.8 | GO:1990726 | Lsm1-7-Pat1 complex(GO:1990726) |
| 0.1 | 0.7 | GO:0042765 | GPI-anchor transamidase complex(GO:0042765) |
| 0.1 | 5.7 | GO:0045171 | intercellular bridge(GO:0045171) |
| 0.1 | 0.9 | GO:0098575 | lumenal side of lysosomal membrane(GO:0098575) |
| 0.1 | 0.6 | GO:0005971 | ribonucleoside-diphosphate reductase complex(GO:0005971) |
| 0.1 | 1.6 | GO:0031462 | Cul2-RING ubiquitin ligase complex(GO:0031462) |
| 0.1 | 0.8 | GO:0000110 | nucleotide-excision repair factor 1 complex(GO:0000110) |
| 0.1 | 2.6 | GO:0000930 | gamma-tubulin complex(GO:0000930) |
| 0.1 | 0.8 | GO:0001940 | male pronucleus(GO:0001940) |
| 0.1 | 1.1 | GO:0043190 | ATP-binding cassette (ABC) transporter complex(GO:0043190) |
| 0.1 | 0.3 | GO:0000836 | ER ubiquitin ligase complex(GO:0000835) Hrd1p ubiquitin ligase complex(GO:0000836) |
| 0.1 | 0.3 | GO:0033593 | BRCA2-MAGE-D1 complex(GO:0033593) |
| 0.1 | 3.8 | GO:0032281 | AMPA glutamate receptor complex(GO:0032281) |
| 0.1 | 1.1 | GO:0005964 | phosphorylase kinase complex(GO:0005964) |
| 0.1 | 1.0 | GO:0005721 | pericentric heterochromatin(GO:0005721) |
| 0.1 | 1.9 | GO:0005665 | DNA-directed RNA polymerase II, core complex(GO:0005665) |
| 0.1 | 1.1 | GO:0032389 | MutLalpha complex(GO:0032389) |
| 0.1 | 1.1 | GO:0097255 | R2TP complex(GO:0097255) |
| 0.1 | 2.0 | GO:0044232 | organelle membrane contact site(GO:0044232) |
| 0.1 | 0.3 | GO:0030678 | mitochondrial ribonuclease P complex(GO:0030678) |
| 0.1 | 6.2 | GO:0043198 | dendritic shaft(GO:0043198) |
| 0.1 | 0.3 | GO:0034272 | phosphatidylinositol 3-kinase complex, class III, type I(GO:0034271) phosphatidylinositol 3-kinase complex, class III, type II(GO:0034272) |
| 0.1 | 1.8 | GO:0016281 | eukaryotic translation initiation factor 4F complex(GO:0016281) |
| 0.1 | 0.9 | GO:1990630 | IRE1-RACK1-PP2A complex(GO:1990630) |
| 0.1 | 1.5 | GO:0030140 | trans-Golgi network transport vesicle(GO:0030140) |
| 0.1 | 0.3 | GO:0044611 | nuclear pore inner ring(GO:0044611) |
| 0.1 | 1.6 | GO:0097546 | ciliary base(GO:0097546) |
| 0.1 | 1.6 | GO:0005751 | mitochondrial respiratory chain complex IV(GO:0005751) |
| 0.1 | 2.2 | GO:0031362 | anchored component of external side of plasma membrane(GO:0031362) |
| 0.1 | 0.2 | GO:0044308 | axonal spine(GO:0044308) |
| 0.1 | 0.7 | GO:0030896 | checkpoint clamp complex(GO:0030896) |
| 0.1 | 1.0 | GO:0090665 | dystrophin-associated glycoprotein complex(GO:0016010) glycoprotein complex(GO:0090665) |
| 0.1 | 0.1 | GO:0035867 | alphav-beta3 integrin-IGF-1-IGF1R complex(GO:0035867) |
| 0.1 | 0.7 | GO:0005688 | U6 snRNP(GO:0005688) |
| 0.1 | 1.2 | GO:0016013 | syntrophin complex(GO:0016013) |
| 0.1 | 0.3 | GO:0097179 | protein C inhibitor-TMPRSS7 complex(GO:0036024) protein C inhibitor-TMPRSS11E complex(GO:0036025) protein C inhibitor-PLAT complex(GO:0036026) protein C inhibitor-PLAU complex(GO:0036027) protein C inhibitor-thrombin complex(GO:0036028) protein C inhibitor-KLK3 complex(GO:0036029) protein C inhibitor-plasma kallikrein complex(GO:0036030) protease inhibitor complex(GO:0097179) serine protease inhibitor complex(GO:0097180) protein C inhibitor-coagulation factor V complex(GO:0097181) protein C inhibitor-coagulation factor Xa complex(GO:0097182) protein C inhibitor-coagulation factor XI complex(GO:0097183) |
| 0.1 | 1.1 | GO:0044666 | MLL3/4 complex(GO:0044666) |
| 0.1 | 0.1 | GO:0030061 | mitochondrial crista(GO:0030061) |
| 0.1 | 1.6 | GO:0005736 | DNA-directed RNA polymerase I complex(GO:0005736) |
| 0.1 | 1.8 | GO:0043205 | microfibril(GO:0001527) fibril(GO:0043205) |
| 0.1 | 1.1 | GO:0098799 | outer mitochondrial membrane protein complex(GO:0098799) |
| 0.1 | 0.2 | GO:0097233 | lamellar body membrane(GO:0097232) alveolar lamellar body membrane(GO:0097233) |
| 0.1 | 1.2 | GO:0031588 | nucleotide-activated protein kinase complex(GO:0031588) |
| 0.1 | 2.2 | GO:0042629 | mast cell granule(GO:0042629) |
| 0.1 | 11.4 | GO:0043202 | lysosomal lumen(GO:0043202) |
| 0.1 | 6.1 | GO:0030315 | T-tubule(GO:0030315) |
| 0.1 | 0.4 | GO:0005967 | mitochondrial pyruvate dehydrogenase complex(GO:0005967) |
| 0.1 | 1.7 | GO:0030057 | desmosome(GO:0030057) |
| 0.1 | 0.2 | GO:0008622 | epsilon DNA polymerase complex(GO:0008622) |
| 0.1 | 1.2 | GO:0031254 | uropod(GO:0001931) cell trailing edge(GO:0031254) |
| 0.1 | 0.4 | GO:0000172 | ribonuclease MRP complex(GO:0000172) |
| 0.1 | 0.1 | GO:0098592 | cytoplasmic side of apical plasma membrane(GO:0098592) |
| 0.1 | 0.3 | GO:1990769 | proximal neuron projection(GO:1990769) |
| 0.1 | 6.3 | GO:0031093 | platelet alpha granule lumen(GO:0031093) |
| 0.1 | 5.8 | GO:0031463 | Cul3-RING ubiquitin ligase complex(GO:0031463) |
| 0.1 | 0.7 | GO:0042382 | paraspeckles(GO:0042382) |
| 0.1 | 1.4 | GO:0031528 | microvillus membrane(GO:0031528) |
| 0.1 | 0.1 | GO:0035189 | Rb-E2F complex(GO:0035189) |
| 0.1 | 1.3 | GO:0097025 | MPP7-DLG1-LIN7 complex(GO:0097025) |
| 0.1 | 0.5 | GO:0097504 | Gemini of coiled bodies(GO:0097504) |
| 0.1 | 8.9 | GO:0044450 | microtubule organizing center part(GO:0044450) |
| 0.1 | 4.4 | GO:0045095 | keratin filament(GO:0045095) |
| 0.1 | 0.3 | GO:0019815 | B cell receptor complex(GO:0019815) |
| 0.1 | 0.2 | GO:0031265 | CD95 death-inducing signaling complex(GO:0031265) |
| 0.1 | 0.3 | GO:0005873 | plus-end kinesin complex(GO:0005873) |
| 0.1 | 11.5 | GO:0030427 | site of polarized growth(GO:0030427) |
| 0.1 | 0.3 | GO:0032044 | DSIF complex(GO:0032044) |
| 0.1 | 0.3 | GO:0043625 | delta DNA polymerase complex(GO:0043625) |
| 0.1 | 2.7 | GO:0001750 | photoreceptor outer segment(GO:0001750) |
| 0.1 | 3.7 | GO:0000123 | histone acetyltransferase complex(GO:0000123) |
| 0.1 | 0.6 | GO:0000164 | protein phosphatase type 1 complex(GO:0000164) |
| 0.1 | 0.4 | GO:0071546 | pi-body(GO:0071546) |
| 0.1 | 0.2 | GO:0005588 | collagen type V trimer(GO:0005588) |
| 0.0 | 5.7 | GO:0035579 | specific granule membrane(GO:0035579) |
| 0.0 | 0.3 | GO:0031464 | Cul4A-RING E3 ubiquitin ligase complex(GO:0031464) |
| 0.0 | 22.7 | GO:0005667 | transcription factor complex(GO:0005667) |
| 0.0 | 5.2 | GO:0101003 | ficolin-1-rich granule membrane(GO:0101003) |
| 0.0 | 0.5 | GO:0016528 | sarcoplasm(GO:0016528) |
| 0.0 | 0.3 | GO:0030991 | intraciliary transport particle A(GO:0030991) |
| 0.0 | 4.4 | GO:0060170 | ciliary membrane(GO:0060170) |
| 0.0 | 0.1 | GO:0005683 | U7 snRNP(GO:0005683) |
| 0.0 | 0.5 | GO:0033268 | node of Ranvier(GO:0033268) |
| 0.0 | 0.2 | GO:0032300 | mismatch repair complex(GO:0032300) |
| 0.0 | 0.2 | GO:0071920 | cleavage body(GO:0071920) |
| 0.0 | 2.8 | GO:0032588 | trans-Golgi network membrane(GO:0032588) |
| 0.0 | 0.2 | GO:0038038 | G-protein coupled receptor homodimeric complex(GO:0038038) |
| 0.0 | 3.3 | GO:0005637 | nuclear inner membrane(GO:0005637) |
| 0.0 | 0.1 | GO:0000153 | cytoplasmic ubiquitin ligase complex(GO:0000153) |
| 0.0 | 0.2 | GO:0005846 | nuclear cap binding complex(GO:0005846) |
| 0.0 | 0.5 | GO:0005689 | U12-type spliceosomal complex(GO:0005689) |
| 0.0 | 0.1 | GO:0070435 | Shc-EGFR complex(GO:0070435) |
| 0.0 | 0.1 | GO:0071006 | U2-type catalytic step 1 spliceosome(GO:0071006) |
| 0.0 | 0.3 | GO:0097431 | mitotic spindle pole(GO:0097431) |
| 0.0 | 1.5 | GO:0000159 | protein phosphatase type 2A complex(GO:0000159) |
| 0.0 | 0.5 | GO:0005666 | DNA-directed RNA polymerase III complex(GO:0005666) |
| 0.0 | 1.0 | GO:0044322 | endoplasmic reticulum quality control compartment(GO:0044322) |
| 0.0 | 0.5 | GO:0030056 | hemidesmosome(GO:0030056) |
| 0.0 | 0.9 | GO:0016460 | myosin II complex(GO:0016460) |
| 0.0 | 0.6 | GO:0071682 | endocytic vesicle lumen(GO:0071682) |
| 0.0 | 0.3 | GO:1990130 | Iml1 complex(GO:1990130) |
| 0.0 | 0.4 | GO:0030870 | Mre11 complex(GO:0030870) |
| 0.0 | 0.1 | GO:0070939 | Dsl1p complex(GO:0070939) |
| 0.0 | 0.9 | GO:0032590 | dendrite membrane(GO:0032590) |
| 0.0 | 0.7 | GO:0090545 | NuRD complex(GO:0016581) CHD-type complex(GO:0090545) |
| 0.0 | 0.1 | GO:0071012 | catalytic step 1 spliceosome(GO:0071012) |
| 0.0 | 0.2 | GO:0097427 | microtubule bundle(GO:0097427) |
| 0.0 | 0.3 | GO:0042555 | MCM complex(GO:0042555) |
| 0.0 | 0.1 | GO:0005592 | collagen type XI trimer(GO:0005592) |
| 0.0 | 0.3 | GO:0005593 | FACIT collagen trimer(GO:0005593) |
| 0.0 | 1.7 | GO:0022627 | cytosolic small ribosomal subunit(GO:0022627) |
| 0.0 | 0.5 | GO:0031083 | BLOC-1 complex(GO:0031083) |
| 0.0 | 0.2 | GO:0032009 | early phagosome(GO:0032009) |
| 0.0 | 1.1 | GO:0008023 | transcription elongation factor complex(GO:0008023) |
| 0.0 | 0.6 | GO:0031932 | TORC2 complex(GO:0031932) |
| 0.0 | 0.4 | GO:0031143 | pseudopodium(GO:0031143) |
| 0.0 | 0.0 | GO:0098837 | postsynaptic recycling endosome(GO:0098837) |
| 0.0 | 0.1 | GO:0016222 | procollagen-proline 4-dioxygenase complex(GO:0016222) |
| 0.0 | 0.1 | GO:0031084 | BLOC-2 complex(GO:0031084) |
| 0.0 | 0.3 | GO:0031314 | extrinsic component of mitochondrial inner membrane(GO:0031314) |
| 0.0 | 0.1 | GO:0005656 | nuclear pre-replicative complex(GO:0005656) pre-replicative complex(GO:0036387) |
| 0.0 | 0.1 | GO:0002079 | inner acrosomal membrane(GO:0002079) |
| 0.0 | 0.2 | GO:0000408 | EKC/KEOPS complex(GO:0000408) |
| 0.0 | 0.1 | GO:0034992 | microtubule organizing center attachment site(GO:0034992) LINC complex(GO:0034993) |
| 0.0 | 1.3 | GO:0005747 | mitochondrial respiratory chain complex I(GO:0005747) NADH dehydrogenase complex(GO:0030964) respiratory chain complex I(GO:0045271) |
| 0.0 | 0.3 | GO:0008540 | proteasome regulatory particle, base subcomplex(GO:0008540) |
| 0.0 | 0.1 | GO:0071014 | post-mRNA release spliceosomal complex(GO:0071014) |
| 0.0 | 1.0 | GO:0031526 | brush border membrane(GO:0031526) |
| 0.0 | 2.3 | GO:0005923 | bicellular tight junction(GO:0005923) |
| 0.0 | 0.3 | GO:0043020 | NADPH oxidase complex(GO:0043020) |
| 0.0 | 0.1 | GO:0032982 | myosin filament(GO:0032982) |
| 0.0 | 0.1 | GO:0072536 | interleukin-23 receptor complex(GO:0072536) |
| 0.0 | 0.2 | GO:0000940 | condensed chromosome outer kinetochore(GO:0000940) |
| 0.0 | 0.9 | GO:0030864 | cortical actin cytoskeleton(GO:0030864) |
| 0.0 | 0.1 | GO:0031371 | ubiquitin conjugating enzyme complex(GO:0031371) |
| 0.0 | 0.5 | GO:0000307 | cyclin-dependent protein kinase holoenzyme complex(GO:0000307) |
| 0.0 | 0.2 | GO:0008250 | oligosaccharyltransferase complex(GO:0008250) |
| 0.0 | 0.3 | GO:0005686 | U2 snRNP(GO:0005686) |
| 0.0 | 0.3 | GO:0097342 | ripoptosome(GO:0097342) |
| 0.0 | 1.3 | GO:0005758 | mitochondrial intermembrane space(GO:0005758) |
| 0.0 | 0.0 | GO:0048237 | rough endoplasmic reticulum lumen(GO:0048237) |
| 0.0 | 0.2 | GO:0008074 | guanylate cyclase complex, soluble(GO:0008074) |
| 0.0 | 3.4 | GO:0005788 | endoplasmic reticulum lumen(GO:0005788) |
| 0.0 | 0.1 | GO:0005854 | nascent polypeptide-associated complex(GO:0005854) |
Gene overrepresentation in molecular function category:
| Log-likelihood per target | Total log-likelihood | Term | Description |
|---|---|---|---|
| 2.3 | 9.3 | GO:0047192 | 1-alkylglycerophosphocholine O-acetyltransferase activity(GO:0047192) |
| 2.0 | 26.5 | GO:0004723 | calcium-dependent protein serine/threonine phosphatase activity(GO:0004723) |
| 2.0 | 8.1 | GO:0003987 | acetate-CoA ligase activity(GO:0003987) |
| 1.8 | 7.4 | GO:0004513 | neolactotetraosylceramide alpha-2,3-sialyltransferase activity(GO:0004513) lactosylceramide alpha-2,3-sialyltransferase activity(GO:0047291) |
| 1.8 | 1.8 | GO:0048763 | calcium-induced calcium release activity(GO:0048763) |
| 1.6 | 4.9 | GO:0005135 | interleukin-3 receptor binding(GO:0005135) |
| 1.5 | 12.1 | GO:0052832 | inositol monophosphate 1-phosphatase activity(GO:0008934) inositol monophosphate 3-phosphatase activity(GO:0052832) inositol monophosphate 4-phosphatase activity(GO:0052833) inositol monophosphate phosphatase activity(GO:0052834) |
| 1.5 | 5.9 | GO:0016524 | latrotoxin receptor activity(GO:0016524) |
| 1.4 | 5.7 | GO:0001512 | dihydronicotinamide riboside quinone reductase activity(GO:0001512) melatonin binding(GO:1904408) |
| 1.4 | 4.3 | GO:0004584 | dolichyl-phosphate-mannose-glycolipid alpha-mannosyltransferase activity(GO:0004584) |
| 1.3 | 12.1 | GO:0004571 | mannosyl-oligosaccharide 1,2-alpha-mannosidase activity(GO:0004571) |
| 1.3 | 3.9 | GO:0004874 | aryl hydrocarbon receptor activity(GO:0004874) |
| 1.2 | 7.4 | GO:0050659 | N-acetylgalactosamine 4-sulfate 6-O-sulfotransferase activity(GO:0050659) |
| 1.2 | 4.9 | GO:0061769 | ribosylnicotinamide kinase activity(GO:0050262) ribosylnicotinate kinase activity(GO:0061769) |
| 1.2 | 5.9 | GO:0004719 | protein-L-isoaspartate (D-aspartate) O-methyltransferase activity(GO:0004719) |
| 1.2 | 8.2 | GO:0016900 | oxidoreductase activity, acting on the CH-OH group of donors, disulfide as acceptor(GO:0016900) vitamin-K-epoxide reductase (warfarin-sensitive) activity(GO:0047057) |
| 1.1 | 3.4 | GO:0008424 | glycoprotein 6-alpha-L-fucosyltransferase activity(GO:0008424) alpha-(1->6)-fucosyltransferase activity(GO:0046921) |
| 1.1 | 3.3 | GO:0070506 | high-density lipoprotein particle receptor activity(GO:0070506) |
| 1.1 | 6.5 | GO:0052851 | cupric reductase activity(GO:0008823) ferric-chelate reductase (NADPH) activity(GO:0052851) |
| 1.0 | 1.0 | GO:0004741 | [pyruvate dehydrogenase (lipoamide)] phosphatase activity(GO:0004741) |
| 1.0 | 8.2 | GO:0008269 | JAK pathway signal transduction adaptor activity(GO:0008269) |
| 1.0 | 7.1 | GO:0004305 | ethanolamine kinase activity(GO:0004305) |
| 1.0 | 8.1 | GO:0001025 | RNA polymerase III transcription factor binding(GO:0001025) |
| 1.0 | 3.0 | GO:0030549 | acetylcholine receptor activator activity(GO:0030549) |
| 1.0 | 2.0 | GO:0000822 | inositol hexakisphosphate binding(GO:0000822) |
| 1.0 | 4.9 | GO:0003986 | acetyl-CoA hydrolase activity(GO:0003986) |
| 0.9 | 3.8 | GO:0031826 | type 2A serotonin receptor binding(GO:0031826) |
| 0.9 | 3.7 | GO:0001222 | transcription corepressor binding(GO:0001222) |
| 0.9 | 15.8 | GO:0008140 | cAMP response element binding protein binding(GO:0008140) |
| 0.9 | 7.4 | GO:0015235 | cobalamin transporter activity(GO:0015235) |
| 0.9 | 2.8 | GO:0008330 | protein tyrosine/threonine phosphatase activity(GO:0008330) |
| 0.9 | 2.7 | GO:0072590 | N-acetyl-L-aspartate-L-glutamate ligase activity(GO:0072590) |
| 0.9 | 4.4 | GO:0004348 | glucosylceramidase activity(GO:0004348) |
| 0.9 | 3.6 | GO:0047493 | sphingomyelin synthase activity(GO:0033188) ceramide cholinephosphotransferase activity(GO:0047493) |
| 0.9 | 3.5 | GO:0004306 | ethanolamine-phosphate cytidylyltransferase activity(GO:0004306) |
| 0.9 | 3.5 | GO:0035033 | histone deacetylase regulator activity(GO:0035033) |
| 0.9 | 2.6 | GO:0051990 | (R)-2-hydroxyglutarate dehydrogenase activity(GO:0051990) |
| 0.8 | 5.9 | GO:0043812 | phosphatidylinositol-4-phosphate phosphatase activity(GO:0043812) |
| 0.8 | 5.1 | GO:0060961 | phospholipase D inhibitor activity(GO:0060961) |
| 0.8 | 3.4 | GO:0033829 | O-fucosylpeptide 3-beta-N-acetylglucosaminyltransferase activity(GO:0033829) |
| 0.8 | 2.5 | GO:0004119 | cGMP-inhibited cyclic-nucleotide phosphodiesterase activity(GO:0004119) |
| 0.8 | 5.8 | GO:0001225 | RNA polymerase II transcription coactivator binding(GO:0001225) |
| 0.8 | 4.2 | GO:0003896 | DNA primase activity(GO:0003896) |
| 0.8 | 2.5 | GO:0003860 | 3-hydroxyisobutyryl-CoA hydrolase activity(GO:0003860) |
| 0.8 | 4.1 | GO:0008240 | tripeptidyl-peptidase activity(GO:0008240) |
| 0.8 | 5.7 | GO:0016361 | activin receptor activity, type I(GO:0016361) |
| 0.8 | 6.5 | GO:0005087 | Ran guanyl-nucleotide exchange factor activity(GO:0005087) |
| 0.8 | 4.1 | GO:0005219 | ryanodine-sensitive calcium-release channel activity(GO:0005219) |
| 0.8 | 2.4 | GO:0036055 | protein-malonyllysine demalonylase activity(GO:0036054) protein-succinyllysine desuccinylase activity(GO:0036055) protein-glutaryllysine deglutarylase activity(GO:0061697) |
| 0.8 | 5.6 | GO:0016618 | hydroxypyruvate reductase activity(GO:0016618) glyoxylate reductase (NADP) activity(GO:0030267) |
| 0.8 | 2.4 | GO:0003863 | alpha-ketoacid dehydrogenase activity(GO:0003826) 3-methyl-2-oxobutanoate dehydrogenase (2-methylpropanoyl-transferring) activity(GO:0003863) |
| 0.8 | 4.7 | GO:0044729 | hemi-methylated DNA-binding(GO:0044729) |
| 0.8 | 4.7 | GO:0052811 | 1-phosphatidylinositol-3-phosphate 4-kinase activity(GO:0052811) |
| 0.8 | 2.3 | GO:0050613 | delta14-sterol reductase activity(GO:0050613) |
| 0.8 | 6.1 | GO:0016406 | carnitine O-acyltransferase activity(GO:0016406) |
| 0.7 | 5.7 | GO:0038064 | collagen receptor activity(GO:0038064) |
| 0.7 | 3.6 | GO:0047179 | platelet-activating factor acetyltransferase activity(GO:0047179) |
| 0.7 | 5.7 | GO:0097643 | amylin receptor activity(GO:0097643) |
| 0.7 | 0.7 | GO:0047760 | butyrate-CoA ligase activity(GO:0047760) |
| 0.7 | 4.1 | GO:0005134 | interleukin-2 receptor binding(GO:0005134) |
| 0.7 | 3.3 | GO:0003989 | acetyl-CoA carboxylase activity(GO:0003989) |
| 0.7 | 3.3 | GO:0004882 | androgen receptor activity(GO:0004882) |
| 0.7 | 7.2 | GO:0032051 | clathrin light chain binding(GO:0032051) |
| 0.6 | 2.6 | GO:0032422 | purine-rich negative regulatory element binding(GO:0032422) |
| 0.6 | 8.4 | GO:0051011 | microtubule minus-end binding(GO:0051011) |
| 0.6 | 1.9 | GO:0008940 | nitrate reductase activity(GO:0008940) molybdopterin adenylyltransferase activity(GO:0061598) molybdopterin molybdotransferase activity(GO:0061599) |
| 0.6 | 3.2 | GO:0035276 | ethanol binding(GO:0035276) |
| 0.6 | 3.7 | GO:0015137 | citrate transmembrane transporter activity(GO:0015137) tricarboxylic acid transmembrane transporter activity(GO:0015142) |
| 0.6 | 7.4 | GO:0031821 | G-protein coupled serotonin receptor binding(GO:0031821) |
| 0.6 | 1.8 | GO:1904928 | coreceptor activity involved in canonical Wnt signaling pathway(GO:1904928) |
| 0.6 | 1.8 | GO:0004782 | sulfinoalanine decarboxylase activity(GO:0004782) |
| 0.6 | 3.7 | GO:0043208 | glycosphingolipid binding(GO:0043208) |
| 0.6 | 3.7 | GO:0004359 | glutaminase activity(GO:0004359) |
| 0.6 | 8.5 | GO:0035612 | AP-2 adaptor complex binding(GO:0035612) |
| 0.6 | 1.8 | GO:0003829 | beta-1,3-galactosyl-O-glycosyl-glycoprotein beta-1,6-N-acetylglucosaminyltransferase activity(GO:0003829) |
| 0.6 | 7.7 | GO:0070700 | BMP receptor binding(GO:0070700) |
| 0.6 | 7.1 | GO:0005021 | vascular endothelial growth factor-activated receptor activity(GO:0005021) |
| 0.6 | 2.3 | GO:0000285 | 1-phosphatidylinositol-3-phosphate 5-kinase activity(GO:0000285) |
| 0.6 | 12.3 | GO:0035925 | mRNA 3'-UTR AU-rich region binding(GO:0035925) |
| 0.6 | 1.7 | GO:0016534 | cyclin-dependent protein kinase 5 activator activity(GO:0016534) |
| 0.6 | 0.6 | GO:0035650 | AP-1 adaptor complex binding(GO:0035650) |
| 0.6 | 3.9 | GO:0071558 | histone demethylase activity (H3-K27 specific)(GO:0071558) |
| 0.6 | 5.6 | GO:0046974 | histone methyltransferase activity (H3-K9 specific)(GO:0046974) |
| 0.6 | 4.4 | GO:0003872 | 6-phosphofructokinase activity(GO:0003872) |
| 0.6 | 2.2 | GO:0005169 | neurotrophin TRKB receptor binding(GO:0005169) |
| 0.5 | 2.2 | GO:0019770 | IgG receptor activity(GO:0019770) |
| 0.5 | 1.1 | GO:0008263 | pyrimidine-specific mismatch base pair DNA N-glycosylase activity(GO:0008263) |
| 0.5 | 1.6 | GO:0004452 | isopentenyl-diphosphate delta-isomerase activity(GO:0004452) |
| 0.5 | 1.6 | GO:0004577 | N-acetylglucosaminyldiphosphodolichol N-acetylglucosaminyltransferase activity(GO:0004577) |
| 0.5 | 8.5 | GO:0019911 | structural constituent of myelin sheath(GO:0019911) |
| 0.5 | 12.0 | GO:0008349 | MAP kinase kinase kinase kinase activity(GO:0008349) |
| 0.5 | 4.7 | GO:0015220 | choline transmembrane transporter activity(GO:0015220) |
| 0.5 | 2.6 | GO:0046964 | 3'-phosphoadenosine 5'-phosphosulfate transmembrane transporter activity(GO:0046964) |
| 0.5 | 3.1 | GO:0051996 | farnesyl-diphosphate farnesyltransferase activity(GO:0004310) squalene synthase activity(GO:0051996) |
| 0.5 | 7.6 | GO:0005007 | fibroblast growth factor-activated receptor activity(GO:0005007) |
| 0.5 | 1.5 | GO:0005055 | laminin receptor activity(GO:0005055) |
| 0.5 | 2.0 | GO:0015154 | sucrose:proton symporter activity(GO:0008506) sucrose transmembrane transporter activity(GO:0008515) disaccharide transmembrane transporter activity(GO:0015154) oligosaccharide transmembrane transporter activity(GO:0015157) |
| 0.5 | 2.9 | GO:0004489 | methylenetetrahydrofolate reductase (NAD(P)H) activity(GO:0004489) |
| 0.5 | 3.8 | GO:0016403 | dimethylargininase activity(GO:0016403) |
| 0.5 | 3.3 | GO:0070679 | inositol 1,4,5 trisphosphate binding(GO:0070679) |
| 0.5 | 1.4 | GO:0017095 | heparan sulfate 6-O-sulfotransferase activity(GO:0017095) |
| 0.5 | 2.8 | GO:0039552 | RIG-I binding(GO:0039552) |
| 0.5 | 1.4 | GO:0003941 | L-serine ammonia-lyase activity(GO:0003941) |
| 0.5 | 1.4 | GO:0047750 | cholestenol delta-isomerase activity(GO:0047750) |
| 0.5 | 2.3 | GO:0097108 | hedgehog family protein binding(GO:0097108) |
| 0.5 | 7.3 | GO:0001075 | transcription factor activity, RNA polymerase II core promoter sequence-specific binding involved in preinitiation complex assembly(GO:0001075) |
| 0.5 | 1.8 | GO:0047708 | biotinidase activity(GO:0047708) |
| 0.5 | 1.4 | GO:0001537 | N-acetylgalactosamine 4-O-sulfotransferase activity(GO:0001537) |
| 0.5 | 2.3 | GO:0004647 | phosphoserine phosphatase activity(GO:0004647) |
| 0.5 | 9.1 | GO:0034450 | ubiquitin-ubiquitin ligase activity(GO:0034450) |
| 0.4 | 4.5 | GO:0071253 | connexin binding(GO:0071253) |
| 0.4 | 8.0 | GO:0019855 | calcium channel inhibitor activity(GO:0019855) |
| 0.4 | 1.3 | GO:0008401 | retinoic acid 4-hydroxylase activity(GO:0008401) |
| 0.4 | 0.9 | GO:0005534 | galactose binding(GO:0005534) |
| 0.4 | 5.2 | GO:0030976 | thiamine pyrophosphate binding(GO:0030976) |
| 0.4 | 2.1 | GO:0008073 | ornithine decarboxylase inhibitor activity(GO:0008073) |
| 0.4 | 4.3 | GO:0048039 | ubiquinone binding(GO:0048039) |
| 0.4 | 2.1 | GO:0004758 | serine C-palmitoyltransferase activity(GO:0004758) C-palmitoyltransferase activity(GO:0016454) |
| 0.4 | 1.7 | GO:0004335 | galactokinase activity(GO:0004335) |
| 0.4 | 2.0 | GO:0070579 | methylcytosine dioxygenase activity(GO:0070579) |
| 0.4 | 13.2 | GO:0005545 | 1-phosphatidylinositol binding(GO:0005545) |
| 0.4 | 3.2 | GO:0036132 | 13-prostaglandin reductase activity(GO:0036132) 15-oxoprostaglandin 13-oxidase activity(GO:0047522) |
| 0.4 | 3.2 | GO:0004468 | lysine N-acetyltransferase activity, acting on acetyl phosphate as donor(GO:0004468) |
| 0.4 | 3.6 | GO:0047144 | 2-acylglycerol-3-phosphate O-acyltransferase activity(GO:0047144) |
| 0.4 | 3.9 | GO:0001162 | RNA polymerase II intronic transcription regulatory region sequence-specific DNA binding(GO:0001162) |
| 0.4 | 1.6 | GO:0070991 | medium-chain-acyl-CoA dehydrogenase activity(GO:0070991) |
| 0.4 | 3.9 | GO:0046975 | histone methyltransferase activity (H3-K36 specific)(GO:0046975) |
| 0.4 | 1.2 | GO:0016652 | NAD(P)+ transhydrogenase activity(GO:0008746) oxidoreductase activity, acting on NAD(P)H, NAD(P) as acceptor(GO:0016652) |
| 0.4 | 4.7 | GO:0015279 | store-operated calcium channel activity(GO:0015279) |
| 0.4 | 1.9 | GO:0050436 | microfibril binding(GO:0050436) |
| 0.4 | 2.7 | GO:0005324 | long-chain fatty acid transporter activity(GO:0005324) |
| 0.4 | 1.5 | GO:0015375 | glycine:sodium symporter activity(GO:0015375) |
| 0.4 | 2.3 | GO:0004427 | inorganic diphosphatase activity(GO:0004427) |
| 0.4 | 0.8 | GO:0004487 | methylenetetrahydrofolate dehydrogenase (NAD+) activity(GO:0004487) |
| 0.4 | 5.7 | GO:0034713 | type I transforming growth factor beta receptor binding(GO:0034713) |
| 0.4 | 0.7 | GO:0010858 | calcium-dependent protein kinase regulator activity(GO:0010858) |
| 0.4 | 4.8 | GO:0097100 | supercoiled DNA binding(GO:0097100) |
| 0.4 | 1.1 | GO:0032093 | SAM domain binding(GO:0032093) |
| 0.4 | 1.1 | GO:0008534 | oxidized purine nucleobase lesion DNA N-glycosylase activity(GO:0008534) |
| 0.4 | 1.1 | GO:0008670 | 2,4-dienoyl-CoA reductase (NADPH) activity(GO:0008670) trans-2-enoyl-CoA reductase (NADPH) activity(GO:0019166) |
| 0.4 | 1.1 | GO:0004583 | dolichyl-phosphate-glucose-glycolipid alpha-glucosyltransferase activity(GO:0004583) |
| 0.4 | 7.6 | GO:0003841 | 1-acylglycerol-3-phosphate O-acyltransferase activity(GO:0003841) |
| 0.4 | 2.5 | GO:0032139 | dinucleotide insertion or deletion binding(GO:0032139) |
| 0.4 | 2.1 | GO:0004694 | eukaryotic translation initiation factor 2alpha kinase activity(GO:0004694) |
| 0.4 | 1.4 | GO:0070905 | serine binding(GO:0070905) |
| 0.4 | 10.0 | GO:0000030 | mannosyltransferase activity(GO:0000030) |
| 0.4 | 1.1 | GO:0033142 | progesterone receptor binding(GO:0033142) |
| 0.4 | 1.4 | GO:0017162 | aryl hydrocarbon receptor binding(GO:0017162) |
| 0.3 | 1.0 | GO:0008267 | poly-glutamine tract binding(GO:0008267) |
| 0.3 | 0.3 | GO:0004088 | carbamoyl-phosphate synthase (ammonia) activity(GO:0004087) carbamoyl-phosphate synthase (glutamine-hydrolyzing) activity(GO:0004088) |
| 0.3 | 3.4 | GO:0071933 | Arp2/3 complex binding(GO:0071933) |
| 0.3 | 2.7 | GO:0009008 | DNA-methyltransferase activity(GO:0009008) |
| 0.3 | 5.1 | GO:0004887 | thyroid hormone receptor activity(GO:0004887) |
| 0.3 | 1.0 | GO:0016784 | 3-mercaptopyruvate sulfurtransferase activity(GO:0016784) |
| 0.3 | 1.3 | GO:0004991 | parathyroid hormone receptor activity(GO:0004991) |
| 0.3 | 1.7 | GO:0016936 | galactoside binding(GO:0016936) |
| 0.3 | 3.6 | GO:0070181 | small ribosomal subunit rRNA binding(GO:0070181) |
| 0.3 | 0.7 | GO:0048408 | epidermal growth factor binding(GO:0048408) |
| 0.3 | 2.6 | GO:0015923 | mannosidase activity(GO:0015923) |
| 0.3 | 2.0 | GO:0010465 | neurotrophin p75 receptor binding(GO:0005166) nerve growth factor receptor activity(GO:0010465) |
| 0.3 | 6.9 | GO:0001087 | transcription factor activity, sequence-specific DNA binding, RNA polymerase recruiting(GO:0001011) transcription factor activity, TFIIB-class binding(GO:0001087) |
| 0.3 | 1.3 | GO:0003867 | 4-aminobutyrate transaminase activity(GO:0003867) succinate-semialdehyde dehydrogenase binding(GO:0032145) (S)-3-amino-2-methylpropionate transaminase activity(GO:0047298) |
| 0.3 | 2.6 | GO:0044323 | retinoic acid-responsive element binding(GO:0044323) |
| 0.3 | 0.6 | GO:0004792 | thiosulfate sulfurtransferase activity(GO:0004792) |
| 0.3 | 4.5 | GO:0005346 | adenine nucleotide transmembrane transporter activity(GO:0000295) purine ribonucleotide transmembrane transporter activity(GO:0005346) ATP transmembrane transporter activity(GO:0005347) ADP transmembrane transporter activity(GO:0015217) |
| 0.3 | 1.0 | GO:0043035 | chromatin insulator sequence binding(GO:0043035) |
| 0.3 | 2.9 | GO:0050543 | icosatetraenoic acid binding(GO:0050543) arachidonic acid binding(GO:0050544) |
| 0.3 | 9.5 | GO:0004012 | phospholipid-translocating ATPase activity(GO:0004012) |
| 0.3 | 0.9 | GO:0004618 | phosphoglycerate kinase activity(GO:0004618) |
| 0.3 | 6.3 | GO:0008603 | cAMP-dependent protein kinase regulator activity(GO:0008603) |
| 0.3 | 1.6 | GO:0046624 | sphingolipid transporter activity(GO:0046624) |
| 0.3 | 2.8 | GO:0030160 | GKAP/Homer scaffold activity(GO:0030160) |
| 0.3 | 2.8 | GO:0035252 | UDP-xylosyltransferase activity(GO:0035252) xylosyltransferase activity(GO:0042285) |
| 0.3 | 10.9 | GO:0071837 | HMG box domain binding(GO:0071837) |
| 0.3 | 0.9 | GO:0036487 | nitric-oxide synthase inhibitor activity(GO:0036487) |
| 0.3 | 3.1 | GO:0030215 | semaphorin receptor binding(GO:0030215) |
| 0.3 | 0.9 | GO:0004165 | dodecenoyl-CoA delta-isomerase activity(GO:0004165) |
| 0.3 | 0.9 | GO:0050692 | DBD domain binding(GO:0050692) |
| 0.3 | 0.9 | GO:0004315 | [acyl-carrier-protein] S-malonyltransferase activity(GO:0004314) 3-oxoacyl-[acyl-carrier-protein] synthase activity(GO:0004315) S-malonyltransferase activity(GO:0016419) malonyltransferase activity(GO:0016420) |
| 0.3 | 2.7 | GO:0001665 | alpha-N-acetylgalactosaminide alpha-2,6-sialyltransferase activity(GO:0001665) |
| 0.3 | 0.9 | GO:0035673 | oligopeptide transmembrane transporter activity(GO:0035673) |
| 0.3 | 1.5 | GO:1990460 | leptin receptor binding(GO:1990460) |
| 0.3 | 1.5 | GO:0000403 | Y-form DNA binding(GO:0000403) |
| 0.3 | 0.9 | GO:0051377 | mannose-ethanolamine phosphotransferase activity(GO:0051377) |
| 0.3 | 0.9 | GO:0047322 | [hydroxymethylglutaryl-CoA reductase (NADPH)] kinase activity(GO:0047322) [acetyl-CoA carboxylase] kinase activity(GO:0050405) |
| 0.3 | 3.3 | GO:0032027 | myosin light chain binding(GO:0032027) |
| 0.3 | 8.9 | GO:0008093 | cytoskeletal adaptor activity(GO:0008093) |
| 0.3 | 0.9 | GO:1904455 | ubiquitin-specific protease activity involved in negative regulation of ERAD pathway(GO:1904455) |
| 0.3 | 2.9 | GO:0008568 | microtubule-severing ATPase activity(GO:0008568) |
| 0.3 | 2.0 | GO:0008454 | alpha-1,3-mannosylglycoprotein 4-beta-N-acetylglucosaminyltransferase activity(GO:0008454) |
| 0.3 | 2.0 | GO:0071535 | RING-like zinc finger domain binding(GO:0071535) |
| 0.3 | 1.4 | GO:0086062 | voltage-gated sodium channel activity involved in Purkinje myocyte action potential(GO:0086062) |
| 0.3 | 5.2 | GO:0035256 | G-protein coupled glutamate receptor binding(GO:0035256) |
| 0.3 | 0.9 | GO:0043546 | molybdopterin cofactor binding(GO:0043546) |
| 0.3 | 1.7 | GO:0098821 | BMP receptor activity(GO:0098821) |
| 0.3 | 0.8 | GO:0016434 | rRNA (cytosine) methyltransferase activity(GO:0016434) |
| 0.3 | 1.7 | GO:0003998 | acylphosphatase activity(GO:0003998) |
| 0.3 | 0.8 | GO:0047389 | glycerophosphocholine phosphodiesterase activity(GO:0047389) |
| 0.3 | 3.3 | GO:1904264 | ubiquitin protein ligase activity involved in ERAD pathway(GO:1904264) |
| 0.3 | 2.2 | GO:0004677 | DNA-dependent protein kinase activity(GO:0004677) |
| 0.3 | 1.1 | GO:0072320 | volume-sensitive chloride channel activity(GO:0072320) |
| 0.3 | 2.5 | GO:0043237 | laminin-1 binding(GO:0043237) |
| 0.3 | 3.3 | GO:0031386 | protein tag(GO:0031386) |
| 0.3 | 0.3 | GO:0031692 | alpha-1B adrenergic receptor binding(GO:0031692) |
| 0.3 | 0.8 | GO:0080023 | 3R-hydroxyacyl-CoA dehydratase activity(GO:0080023) |
| 0.3 | 7.2 | GO:0050431 | transforming growth factor beta binding(GO:0050431) |
| 0.3 | 1.3 | GO:0008508 | bile acid:sodium symporter activity(GO:0008508) |
| 0.3 | 2.9 | GO:0072542 | protein phosphatase activator activity(GO:0072542) |
| 0.3 | 1.0 | GO:0005138 | interleukin-6 receptor binding(GO:0005138) |
| 0.3 | 0.8 | GO:0004421 | hydroxymethylglutaryl-CoA synthase activity(GO:0004421) |
| 0.3 | 0.3 | GO:0001010 | transcription factor activity, sequence-specific DNA binding transcription factor recruiting(GO:0001010) |
| 0.3 | 3.1 | GO:0005005 | transmembrane-ephrin receptor activity(GO:0005005) |
| 0.3 | 0.8 | GO:0004483 | mRNA (nucleoside-2'-O-)-methyltransferase activity(GO:0004483) |
| 0.3 | 1.0 | GO:0001626 | nociceptin receptor activity(GO:0001626) |
| 0.3 | 1.3 | GO:0047756 | chondroitin 4-sulfotransferase activity(GO:0047756) |
| 0.3 | 0.8 | GO:0051717 | inositol-1,3,4,5-tetrakisphosphate 3-phosphatase activity(GO:0051717) |
| 0.3 | 1.0 | GO:0004504 | peptidylglycine monooxygenase activity(GO:0004504) peptidylamidoglycolate lyase activity(GO:0004598) |
| 0.3 | 0.8 | GO:0052857 | NADHX epimerase activity(GO:0052856) NADPHX epimerase activity(GO:0052857) |
| 0.3 | 1.0 | GO:0010385 | double-stranded methylated DNA binding(GO:0010385) |
| 0.3 | 0.8 | GO:0070704 | C-5 sterol desaturase activity(GO:0000248) sterol desaturase activity(GO:0070704) |
| 0.3 | 0.8 | GO:1904713 | beta-catenin destruction complex binding(GO:1904713) |
| 0.3 | 1.3 | GO:0005223 | intracellular cGMP activated cation channel activity(GO:0005223) |
| 0.3 | 2.0 | GO:0030229 | very-low-density lipoprotein particle receptor activity(GO:0030229) |
| 0.2 | 1.0 | GO:0046573 | lactonohydrolase activity(GO:0046573) acyl-L-homoserine-lactone lactonohydrolase activity(GO:0102007) |
| 0.2 | 5.2 | GO:0043274 | phospholipase binding(GO:0043274) |
| 0.2 | 1.5 | GO:1990226 | histone methyltransferase binding(GO:1990226) |
| 0.2 | 0.7 | GO:1903135 | cupric ion binding(GO:1903135) |
| 0.2 | 1.0 | GO:0003985 | acetyl-CoA C-acetyltransferase activity(GO:0003985) |
| 0.2 | 0.2 | GO:0070573 | metallodipeptidase activity(GO:0070573) |
| 0.2 | 2.2 | GO:0003689 | DNA clamp loader activity(GO:0003689) protein-DNA loading ATPase activity(GO:0033170) |
| 0.2 | 2.4 | GO:0034485 | phosphatidylinositol-3,4,5-trisphosphate 5-phosphatase activity(GO:0034485) |
| 0.2 | 2.4 | GO:0008420 | CTD phosphatase activity(GO:0008420) |
| 0.2 | 1.2 | GO:0015319 | sodium:inorganic phosphate symporter activity(GO:0015319) |
| 0.2 | 2.9 | GO:0015245 | fatty acid transporter activity(GO:0015245) |
| 0.2 | 3.1 | GO:0003857 | 3-hydroxyacyl-CoA dehydrogenase activity(GO:0003857) |
| 0.2 | 0.7 | GO:0004651 | polynucleotide 5'-phosphatase activity(GO:0004651) |
| 0.2 | 0.9 | GO:0003943 | N-acetylgalactosamine-4-sulfatase activity(GO:0003943) |
| 0.2 | 0.2 | GO:0004879 | RNA polymerase II transcription factor activity, ligand-activated sequence-specific DNA binding(GO:0004879) transcription factor activity, direct ligand regulated sequence-specific DNA binding(GO:0098531) |
| 0.2 | 5.6 | GO:0005095 | GTPase inhibitor activity(GO:0005095) |
| 0.2 | 5.1 | GO:0004535 | poly(A)-specific ribonuclease activity(GO:0004535) |
| 0.2 | 3.7 | GO:0043422 | protein kinase B binding(GO:0043422) |
| 0.2 | 1.6 | GO:0005052 | peroxisome matrix targeting signal-1 binding(GO:0005052) |
| 0.2 | 1.2 | GO:0032564 | adenyl deoxyribonucleotide binding(GO:0032558) dATP binding(GO:0032564) |
| 0.2 | 5.5 | GO:0050750 | low-density lipoprotein particle receptor binding(GO:0050750) |
| 0.2 | 0.9 | GO:0008426 | protein kinase C inhibitor activity(GO:0008426) |
| 0.2 | 0.7 | GO:0004170 | dUTP diphosphatase activity(GO:0004170) |
| 0.2 | 1.6 | GO:0008479 | queuine tRNA-ribosyltransferase activity(GO:0008479) |
| 0.2 | 1.4 | GO:0004300 | enoyl-CoA hydratase activity(GO:0004300) |
| 0.2 | 0.4 | GO:0008665 | 2'-phosphotransferase activity(GO:0008665) |
| 0.2 | 2.2 | GO:0004897 | ciliary neurotrophic factor receptor activity(GO:0004897) |
| 0.2 | 3.5 | GO:0010314 | phosphatidylinositol-5-phosphate binding(GO:0010314) |
| 0.2 | 4.1 | GO:0004861 | cyclin-dependent protein serine/threonine kinase inhibitor activity(GO:0004861) |
| 0.2 | 1.5 | GO:0004075 | biotin carboxylase activity(GO:0004075) |
| 0.2 | 0.7 | GO:0004605 | phosphatidate cytidylyltransferase activity(GO:0004605) |
| 0.2 | 0.4 | GO:0004566 | beta-glucuronidase activity(GO:0004566) |
| 0.2 | 0.6 | GO:0010698 | acetyltransferase activator activity(GO:0010698) |
| 0.2 | 0.9 | GO:0019107 | glycylpeptide N-tetradecanoyltransferase activity(GO:0004379) myristoyltransferase activity(GO:0019107) |
| 0.2 | 1.5 | GO:0001165 | RNA polymerase I upstream control element sequence-specific DNA binding(GO:0001165) |
| 0.2 | 0.6 | GO:0003680 | AT DNA binding(GO:0003680) |
| 0.2 | 1.1 | GO:0008453 | alanine-glyoxylate transaminase activity(GO:0008453) |
| 0.2 | 1.3 | GO:0004563 | beta-N-acetylhexosaminidase activity(GO:0004563) |
| 0.2 | 2.5 | GO:0047498 | calcium-dependent phospholipase A2 activity(GO:0047498) |
| 0.2 | 1.5 | GO:0001161 | intronic transcription regulatory region sequence-specific DNA binding(GO:0001161) intronic transcription regulatory region DNA binding(GO:0044213) |
| 0.2 | 4.0 | GO:0008179 | adenylate cyclase binding(GO:0008179) |
| 0.2 | 2.3 | GO:1990247 | N6-methyladenosine-containing RNA binding(GO:1990247) |
| 0.2 | 1.5 | GO:0043522 | leucine zipper domain binding(GO:0043522) |
| 0.2 | 0.2 | GO:0034617 | tetrahydrobiopterin binding(GO:0034617) |
| 0.2 | 1.0 | GO:0016657 | GMP reductase activity(GO:0003920) oxidoreductase activity, acting on NAD(P)H, nitrogenous group as acceptor(GO:0016657) |
| 0.2 | 0.6 | GO:0005046 | KDEL sequence binding(GO:0005046) |
| 0.2 | 0.6 | GO:0017128 | phospholipid scramblase activity(GO:0017128) |
| 0.2 | 0.8 | GO:0016880 | glutamate-ammonia ligase activity(GO:0004356) ammonia ligase activity(GO:0016211) acid-ammonia (or amide) ligase activity(GO:0016880) |
| 0.2 | 0.8 | GO:0004032 | alditol:NADP+ 1-oxidoreductase activity(GO:0004032) |
| 0.2 | 1.0 | GO:0030171 | voltage-gated proton channel activity(GO:0030171) |
| 0.2 | 0.2 | GO:1901567 | icosanoid binding(GO:0050542) fatty acid derivative binding(GO:1901567) |
| 0.2 | 1.8 | GO:0055131 | C3HC4-type RING finger domain binding(GO:0055131) |
| 0.2 | 0.4 | GO:0017099 | very-long-chain-acyl-CoA dehydrogenase activity(GO:0017099) |
| 0.2 | 0.2 | GO:0008169 | C-methyltransferase activity(GO:0008169) |
| 0.2 | 0.2 | GO:0016453 | C-acetyltransferase activity(GO:0016453) |
| 0.2 | 2.9 | GO:0004791 | thioredoxin-disulfide reductase activity(GO:0004791) |
| 0.2 | 0.6 | GO:0097363 | protein O-GlcNAc transferase activity(GO:0097363) |
| 0.2 | 4.0 | GO:0017134 | fibroblast growth factor binding(GO:0017134) |
| 0.2 | 0.9 | GO:0050501 | hyaluronan synthase activity(GO:0050501) |
| 0.2 | 1.7 | GO:0000213 | tRNA-intron endonuclease activity(GO:0000213) |
| 0.2 | 4.6 | GO:0005112 | Notch binding(GO:0005112) |
| 0.2 | 1.5 | GO:0004046 | aminoacylase activity(GO:0004046) |
| 0.2 | 0.9 | GO:0032810 | sterol response element binding(GO:0032810) |
| 0.2 | 1.3 | GO:0004962 | endothelin receptor activity(GO:0004962) |
| 0.2 | 2.0 | GO:0030957 | Tat protein binding(GO:0030957) |
| 0.2 | 1.1 | GO:0045504 | dynein heavy chain binding(GO:0045504) |
| 0.2 | 8.3 | GO:0031491 | nucleosome binding(GO:0031491) |
| 0.2 | 1.1 | GO:0042392 | sphingosine-1-phosphate phosphatase activity(GO:0042392) |
| 0.2 | 2.3 | GO:0030274 | LIM domain binding(GO:0030274) |
| 0.2 | 1.8 | GO:0097617 | annealing activity(GO:0097617) |
| 0.2 | 1.3 | GO:0003997 | acyl-CoA oxidase activity(GO:0003997) |
| 0.2 | 0.5 | GO:0010340 | carboxyl-O-methyltransferase activity(GO:0010340) protein carboxyl O-methyltransferase activity(GO:0051998) |
| 0.2 | 0.9 | GO:0004774 | succinate-CoA ligase activity(GO:0004774) |
| 0.2 | 1.8 | GO:0008430 | selenium binding(GO:0008430) |
| 0.2 | 1.1 | GO:0004111 | creatine kinase activity(GO:0004111) |
| 0.2 | 0.7 | GO:0004853 | uroporphyrinogen decarboxylase activity(GO:0004853) |
| 0.2 | 0.5 | GO:0004157 | dihydropyrimidinase activity(GO:0004157) |
| 0.2 | 4.2 | GO:0042813 | Wnt-activated receptor activity(GO:0042813) |
| 0.2 | 1.0 | GO:0004064 | arylesterase activity(GO:0004064) |
| 0.2 | 0.7 | GO:0004609 | phosphatidylserine decarboxylase activity(GO:0004609) |
| 0.2 | 0.5 | GO:0004416 | hydroxyacylglutathione hydrolase activity(GO:0004416) |
| 0.2 | 1.0 | GO:0015280 | ligand-gated sodium channel activity(GO:0015280) |
| 0.2 | 0.9 | GO:0004084 | branched-chain-amino-acid transaminase activity(GO:0004084) L-leucine transaminase activity(GO:0052654) L-valine transaminase activity(GO:0052655) L-isoleucine transaminase activity(GO:0052656) |
| 0.2 | 0.3 | GO:0005275 | amine transmembrane transporter activity(GO:0005275) |
| 0.2 | 4.0 | GO:0031432 | titin binding(GO:0031432) |
| 0.2 | 16.7 | GO:0003707 | steroid hormone receptor activity(GO:0003707) |
| 0.2 | 1.7 | GO:0036310 | annealing helicase activity(GO:0036310) |
| 0.2 | 3.9 | GO:0034979 | NAD-dependent protein deacetylase activity(GO:0034979) |
| 0.2 | 1.7 | GO:0017176 | phosphatidylinositol N-acetylglucosaminyltransferase activity(GO:0017176) |
| 0.2 | 2.5 | GO:0016628 | oxidoreductase activity, acting on the CH-CH group of donors, NAD or NADP as acceptor(GO:0016628) |
| 0.2 | 1.3 | GO:1990829 | C-rich single-stranded DNA binding(GO:1990829) |
| 0.2 | 0.3 | GO:0044388 | small protein activating enzyme binding(GO:0044388) |
| 0.2 | 0.7 | GO:0004357 | glutamate-cysteine ligase activity(GO:0004357) |
| 0.2 | 1.7 | GO:0097506 | uracil DNA N-glycosylase activity(GO:0004844) deaminated base DNA N-glycosylase activity(GO:0097506) |
| 0.2 | 1.2 | GO:0043199 | sulfate binding(GO:0043199) |
| 0.2 | 0.3 | GO:0030343 | vitamin D3 25-hydroxylase activity(GO:0030343) vitamin D 25-hydroxylase activity(GO:0070643) |
| 0.2 | 3.1 | GO:0001223 | transcription coactivator binding(GO:0001223) |
| 0.2 | 0.7 | GO:0003988 | acetyl-CoA C-acyltransferase activity(GO:0003988) |
| 0.2 | 4.0 | GO:0008191 | metalloendopeptidase inhibitor activity(GO:0008191) |
| 0.2 | 0.6 | GO:0032184 | SUMO polymer binding(GO:0032184) |
| 0.2 | 3.5 | GO:0070016 | armadillo repeat domain binding(GO:0070016) |
| 0.2 | 1.0 | GO:0001849 | complement component C1q binding(GO:0001849) |
| 0.2 | 1.1 | GO:0043023 | ribosomal large subunit binding(GO:0043023) |
| 0.2 | 1.9 | GO:0015386 | potassium:proton antiporter activity(GO:0015386) |
| 0.2 | 0.5 | GO:0052739 | phosphatidylserine 1-acylhydrolase activity(GO:0052739) |
| 0.2 | 5.0 | GO:0003887 | DNA-directed DNA polymerase activity(GO:0003887) |
| 0.2 | 0.5 | GO:0001003 | polymerase III regulatory region sequence-specific DNA binding(GO:0000992) RNA polymerase III type 1 promoter sequence-specific DNA binding(GO:0001002) RNA polymerase III type 2 promoter sequence-specific DNA binding(GO:0001003) |
| 0.2 | 0.5 | GO:0030272 | 5-formyltetrahydrofolate cyclo-ligase activity(GO:0030272) |
| 0.2 | 1.8 | GO:0003964 | telomerase activity(GO:0003720) RNA-directed DNA polymerase activity(GO:0003964) |
| 0.2 | 0.5 | GO:0015275 | stretch-activated, cation-selective, calcium channel activity(GO:0015275) |
| 0.2 | 0.5 | GO:0005113 | patched binding(GO:0005113) |
| 0.2 | 0.9 | GO:0035243 | protein-arginine omega-N symmetric methyltransferase activity(GO:0035243) |
| 0.2 | 0.6 | GO:1990430 | extracellular matrix protein binding(GO:1990430) |
| 0.1 | 0.4 | GO:0004958 | prostaglandin F receptor activity(GO:0004958) |
| 0.1 | 2.1 | GO:0017017 | MAP kinase tyrosine/serine/threonine phosphatase activity(GO:0017017) |
| 0.1 | 1.5 | GO:0008641 | small protein activating enzyme activity(GO:0008641) |
| 0.1 | 0.6 | GO:0017077 | oxidative phosphorylation uncoupler activity(GO:0017077) |
| 0.1 | 3.1 | GO:0008253 | 5'-nucleotidase activity(GO:0008253) |
| 0.1 | 0.3 | GO:0003858 | 3-hydroxybutyrate dehydrogenase activity(GO:0003858) |
| 0.1 | 0.4 | GO:0036134 | thromboxane-A synthase activity(GO:0004796) 12-hydroxyheptadecatrienoic acid synthase activity(GO:0036134) |
| 0.1 | 2.0 | GO:0030332 | cyclin binding(GO:0030332) |
| 0.1 | 0.4 | GO:0052827 | inositol tetrakisphosphate 1-kinase activity(GO:0047325) inositol-1,3,4-trisphosphate 6-kinase activity(GO:0052725) inositol-1,3,4-trisphosphate 5-kinase activity(GO:0052726) inositol-1,3,4,5,6-pentakisphosphate 1-phosphatase activity(GO:0052825) inositol pentakisphosphate phosphatase activity(GO:0052827) inositol-1,3,4,6-tetrakisphosphate 6-phosphatase activity(GO:0052830) inositol-1,3,4,6-tetrakisphosphate 1-phosphatase activity(GO:0052831) inositol-3,4,6-trisphosphate 1-kinase activity(GO:0052835) |
| 0.1 | 1.2 | GO:0016670 | oxidoreductase activity, acting on a sulfur group of donors, oxygen as acceptor(GO:0016670) |
| 0.1 | 6.3 | GO:0050699 | WW domain binding(GO:0050699) |
| 0.1 | 0.4 | GO:0005483 | soluble NSF attachment protein activity(GO:0005483) |
| 0.1 | 1.3 | GO:0033743 | peptide-methionine (R)-S-oxide reductase activity(GO:0033743) |
| 0.1 | 0.4 | GO:0090541 | MIT domain binding(GO:0090541) |
| 0.1 | 1.4 | GO:0008131 | primary amine oxidase activity(GO:0008131) |
| 0.1 | 1.1 | GO:0017040 | ceramidase activity(GO:0017040) |
| 0.1 | 4.7 | GO:0005001 | transmembrane receptor protein tyrosine phosphatase activity(GO:0005001) transmembrane receptor protein phosphatase activity(GO:0019198) |
| 0.1 | 0.6 | GO:0015563 | uptake transmembrane transporter activity(GO:0015563) |
| 0.1 | 0.8 | GO:0004740 | pyruvate dehydrogenase (acetyl-transferring) kinase activity(GO:0004740) |
| 0.1 | 3.1 | GO:0046875 | ephrin receptor binding(GO:0046875) |
| 0.1 | 4.6 | GO:0008574 | ATP-dependent microtubule motor activity, plus-end-directed(GO:0008574) |
| 0.1 | 0.7 | GO:0032138 | single base insertion or deletion binding(GO:0032138) |
| 0.1 | 1.1 | GO:0043184 | vascular endothelial growth factor receptor 2 binding(GO:0043184) |
| 0.1 | 2.6 | GO:0004697 | protein kinase C activity(GO:0004697) |
| 0.1 | 0.3 | GO:0032090 | Pyrin domain binding(GO:0032090) |
| 0.1 | 0.7 | GO:0008449 | N-acetylglucosamine-6-sulfatase activity(GO:0008449) |
| 0.1 | 6.8 | GO:0016709 | oxidoreductase activity, acting on paired donors, with incorporation or reduction of molecular oxygen, NAD(P)H as one donor, and incorporation of one atom of oxygen(GO:0016709) |
| 0.1 | 0.5 | GO:0004301 | epoxide hydrolase activity(GO:0004301) |
| 0.1 | 0.4 | GO:0008970 | phosphatidylcholine 1-acylhydrolase activity(GO:0008970) |
| 0.1 | 0.4 | GO:0004051 | arachidonate 5-lipoxygenase activity(GO:0004051) |
| 0.1 | 2.5 | GO:0015467 | G-protein activated inward rectifier potassium channel activity(GO:0015467) |
| 0.1 | 0.9 | GO:0000293 | ferric-chelate reductase activity(GO:0000293) |
| 0.1 | 0.3 | GO:0009378 | four-way junction helicase activity(GO:0009378) |
| 0.1 | 0.5 | GO:0004597 | peptide-aspartate beta-dioxygenase activity(GO:0004597) |
| 0.1 | 0.4 | GO:0008466 | glycogenin glucosyltransferase activity(GO:0008466) |
| 0.1 | 0.8 | GO:0004749 | ribose phosphate diphosphokinase activity(GO:0004749) |
| 0.1 | 0.9 | GO:0034046 | poly(G) binding(GO:0034046) |
| 0.1 | 0.6 | GO:0052796 | exo-alpha-(2->3)-sialidase activity(GO:0052794) exo-alpha-(2->6)-sialidase activity(GO:0052795) exo-alpha-(2->8)-sialidase activity(GO:0052796) |
| 0.1 | 13.6 | GO:0005070 | SH3/SH2 adaptor activity(GO:0005070) |
| 0.1 | 0.3 | GO:0030346 | protein phosphatase 2B binding(GO:0030346) |
| 0.1 | 2.1 | GO:0005522 | profilin binding(GO:0005522) |
| 0.1 | 1.3 | GO:0002161 | aminoacyl-tRNA editing activity(GO:0002161) |
| 0.1 | 1.5 | GO:0051920 | peroxiredoxin activity(GO:0051920) |
| 0.1 | 0.5 | GO:0044736 | acid-sensing ion channel activity(GO:0044736) |
| 0.1 | 3.0 | GO:0038191 | neuropilin binding(GO:0038191) |
| 0.1 | 10.0 | GO:0048365 | Rac GTPase binding(GO:0048365) |
| 0.1 | 1.7 | GO:0008020 | G-protein coupled photoreceptor activity(GO:0008020) |
| 0.1 | 0.7 | GO:0004826 | phenylalanine-tRNA ligase activity(GO:0004826) |
| 0.1 | 0.2 | GO:0004938 | alpha2-adrenergic receptor activity(GO:0004938) |
| 0.1 | 0.4 | GO:0097604 | temperature-gated cation channel activity(GO:0097604) |
| 0.1 | 2.3 | GO:0010857 | calcium-dependent protein serine/threonine kinase activity(GO:0009931) calcium-dependent protein kinase activity(GO:0010857) |
| 0.1 | 0.6 | GO:0015315 | hexose phosphate transmembrane transporter activity(GO:0015119) organophosphate:inorganic phosphate antiporter activity(GO:0015315) hexose-phosphate:inorganic phosphate antiporter activity(GO:0015526) glucose 6-phosphate:inorganic phosphate antiporter activity(GO:0061513) |
| 0.1 | 0.5 | GO:0018271 | biotin-[acetyl-CoA-carboxylase] ligase activity(GO:0004077) biotin-[methylcrotonoyl-CoA-carboxylase] ligase activity(GO:0004078) biotin-[methylmalonyl-CoA-carboxytransferase] ligase activity(GO:0004079) biotin-[propionyl-CoA-carboxylase (ATP-hydrolyzing)] ligase activity(GO:0004080) biotin-protein ligase activity(GO:0018271) |
| 0.1 | 0.7 | GO:0004522 | ribonuclease A activity(GO:0004522) |
| 0.1 | 3.0 | GO:0019992 | diacylglycerol binding(GO:0019992) |
| 0.1 | 4.2 | GO:0043027 | cysteine-type endopeptidase inhibitor activity involved in apoptotic process(GO:0043027) |
| 0.1 | 0.3 | GO:0008384 | IkappaB kinase activity(GO:0008384) |
| 0.1 | 0.3 | GO:0019777 | Atg12 transferase activity(GO:0019777) |
| 0.1 | 0.7 | GO:0003923 | GPI-anchor transamidase activity(GO:0003923) |
| 0.1 | 0.7 | GO:0016807 | cysteine-type carboxypeptidase activity(GO:0016807) cysteine-type exopeptidase activity(GO:0070004) |
| 0.1 | 1.2 | GO:0070569 | uridylyltransferase activity(GO:0070569) |
| 0.1 | 11.8 | GO:0008094 | DNA-dependent ATPase activity(GO:0008094) |
| 0.1 | 1.3 | GO:0031957 | very long-chain fatty acid-CoA ligase activity(GO:0031957) |
| 0.1 | 0.3 | GO:0005163 | nerve growth factor receptor binding(GO:0005163) |
| 0.1 | 0.6 | GO:0080019 | fatty-acyl-CoA reductase (alcohol-forming) activity(GO:0080019) |
| 0.1 | 0.3 | GO:0098519 | nucleotide phosphatase activity, acting on free nucleotides(GO:0098519) |
| 0.1 | 0.6 | GO:0016728 | ribonucleoside-diphosphate reductase activity, thioredoxin disulfide as acceptor(GO:0004748) oxidoreductase activity, acting on CH or CH2 groups, disulfide as acceptor(GO:0016728) ribonucleoside-diphosphate reductase activity(GO:0061731) |
| 0.1 | 1.6 | GO:0016538 | cyclin-dependent protein serine/threonine kinase regulator activity(GO:0016538) |
| 0.1 | 0.9 | GO:0061665 | SUMO ligase activity(GO:0061665) |
| 0.1 | 0.4 | GO:0050252 | retinol O-fatty-acyltransferase activity(GO:0050252) |
| 0.1 | 4.3 | GO:0033558 | protein deacetylase activity(GO:0033558) |
| 0.1 | 0.2 | GO:0035402 | histone kinase activity (H3-T11 specific)(GO:0035402) |
| 0.1 | 0.2 | GO:0016418 | S-acetyltransferase activity(GO:0016418) |
| 0.1 | 1.2 | GO:0000014 | single-stranded DNA endodeoxyribonuclease activity(GO:0000014) |
| 0.1 | 0.6 | GO:0070008 | serine-type exopeptidase activity(GO:0070008) |
| 0.1 | 1.1 | GO:0004689 | phosphorylase kinase activity(GO:0004689) |
| 0.1 | 6.0 | GO:0004693 | cyclin-dependent protein serine/threonine kinase activity(GO:0004693) |
| 0.1 | 1.3 | GO:0050291 | sphingosine N-acyltransferase activity(GO:0050291) |
| 0.1 | 0.4 | GO:0102345 | 3-hydroxy-behenoyl-CoA dehydratase activity(GO:0102344) 3-hydroxy-lignoceroyl-CoA dehydratase activity(GO:0102345) |
| 0.1 | 0.5 | GO:0015252 | hydrogen ion channel activity(GO:0015252) |
| 0.1 | 3.9 | GO:0043539 | protein serine/threonine kinase activator activity(GO:0043539) |
| 0.1 | 0.4 | GO:0051425 | PTB domain binding(GO:0051425) |
| 0.1 | 0.4 | GO:0033691 | sialic acid binding(GO:0033691) |
| 0.1 | 2.4 | GO:0080025 | phosphatidylinositol-3,5-bisphosphate binding(GO:0080025) |
| 0.1 | 0.3 | GO:0008903 | hydroxypyruvate isomerase activity(GO:0008903) |
| 0.1 | 0.6 | GO:0016802 | adenosylhomocysteinase activity(GO:0004013) trialkylsulfonium hydrolase activity(GO:0016802) |
| 0.1 | 0.3 | GO:0004639 | phosphoribosylaminoimidazole carboxylase activity(GO:0004638) phosphoribosylaminoimidazolesuccinocarboxamide synthase activity(GO:0004639) |
| 0.1 | 0.5 | GO:0004311 | farnesyltranstransferase activity(GO:0004311) |
| 0.1 | 0.4 | GO:0035515 | oxidative RNA demethylase activity(GO:0035515) |
| 0.1 | 1.6 | GO:0016595 | glutamate binding(GO:0016595) |
| 0.1 | 0.4 | GO:0035497 | cAMP response element binding(GO:0035497) |
| 0.1 | 0.6 | GO:0042301 | phosphate ion binding(GO:0042301) |
| 0.1 | 0.1 | GO:0004614 | phosphoglucomutase activity(GO:0004614) |
| 0.1 | 0.7 | GO:0047499 | calcium-independent phospholipase A2 activity(GO:0047499) |
| 0.1 | 1.2 | GO:0005225 | volume-sensitive anion channel activity(GO:0005225) |
| 0.1 | 0.4 | GO:0071987 | WD40-repeat domain binding(GO:0071987) |
| 0.1 | 0.5 | GO:0047045 | testosterone 17-beta-dehydrogenase (NADP+) activity(GO:0047045) |
| 0.1 | 2.9 | GO:0097200 | cysteine-type endopeptidase activity involved in execution phase of apoptosis(GO:0097200) |
| 0.1 | 0.5 | GO:0033857 | diphosphoinositol-pentakisphosphate kinase activity(GO:0033857) |
| 0.1 | 2.2 | GO:0000175 | 3'-5'-exoribonuclease activity(GO:0000175) |
| 0.1 | 8.2 | GO:0001158 | enhancer sequence-specific DNA binding(GO:0001158) |
| 0.1 | 2.6 | GO:0005520 | insulin-like growth factor binding(GO:0005520) |
| 0.1 | 0.6 | GO:0036033 | mediator complex binding(GO:0036033) |
| 0.1 | 0.4 | GO:0016717 | stearoyl-CoA 9-desaturase activity(GO:0004768) acyl-CoA desaturase activity(GO:0016215) oxidoreductase activity, acting on paired donors, with oxidation of a pair of donors resulting in the reduction of molecular oxygen to two molecules of water(GO:0016717) |
| 0.1 | 4.7 | GO:0003899 | DNA-directed RNA polymerase activity(GO:0003899) |
| 0.1 | 0.7 | GO:0043426 | MRF binding(GO:0043426) |
| 0.1 | 0.6 | GO:0035326 | enhancer binding(GO:0035326) |
| 0.1 | 0.4 | GO:0042134 | rRNA primary transcript binding(GO:0042134) |
| 0.1 | 2.0 | GO:0070330 | aromatase activity(GO:0070330) |
| 0.1 | 0.3 | GO:1990259 | protein-glutamine N-methyltransferase activity(GO:0036009) histone-glutamine methyltransferase activity(GO:1990259) |
| 0.1 | 0.9 | GO:0015651 | quaternary ammonium group transmembrane transporter activity(GO:0015651) |
| 0.1 | 0.6 | GO:0008481 | sphinganine kinase activity(GO:0008481) D-erythro-sphingosine kinase activity(GO:0017050) |
| 0.1 | 0.1 | GO:0031208 | POZ domain binding(GO:0031208) |
| 0.1 | 0.9 | GO:0004957 | prostaglandin E receptor activity(GO:0004957) |
| 0.1 | 1.4 | GO:0005247 | voltage-gated chloride channel activity(GO:0005247) |
| 0.1 | 1.6 | GO:0097016 | L27 domain binding(GO:0097016) |
| 0.1 | 0.4 | GO:0001888 | glucuronyl-galactosyl-proteoglycan 4-alpha-N-acetylglucosaminyltransferase activity(GO:0001888) |
| 0.1 | 1.3 | GO:0005337 | nucleoside transmembrane transporter activity(GO:0005337) |
| 0.1 | 0.8 | GO:0048406 | nerve growth factor binding(GO:0048406) |
| 0.1 | 0.4 | GO:0016901 | glycerol-3-phosphate dehydrogenase activity(GO:0004368) oxidoreductase activity, acting on the CH-OH group of donors, quinone or similar compound as acceptor(GO:0016901) |
| 0.1 | 0.4 | GO:0004966 | galanin receptor activity(GO:0004966) |
| 0.1 | 0.3 | GO:0002094 | polyprenyltransferase activity(GO:0002094) |
| 0.1 | 33.6 | GO:0001077 | transcriptional activator activity, RNA polymerase II core promoter proximal region sequence-specific binding(GO:0001077) |
| 0.1 | 2.3 | GO:0005521 | lamin binding(GO:0005521) |
| 0.1 | 0.6 | GO:0010484 | H3 histone acetyltransferase activity(GO:0010484) |
| 0.1 | 0.5 | GO:0052848 | endopolyphosphatase activity(GO:0000298) diphosphoinositol-polyphosphate diphosphatase activity(GO:0008486) bis(5'-adenosyl)-hexaphosphatase activity(GO:0034431) bis(5'-adenosyl)-pentaphosphatase activity(GO:0034432) inositol diphosphate tetrakisphosphate diphosphatase activity(GO:0052840) inositol bisdiphosphate tetrakisphosphate diphosphatase activity(GO:0052841) inositol diphosphate pentakisphosphate diphosphatase activity(GO:0052842) inositol-1-diphosphate-2,3,4,5,6-pentakisphosphate diphosphatase activity(GO:0052843) inositol-3-diphosphate-1,2,4,5,6-pentakisphosphate diphosphatase activity(GO:0052844) inositol-5-diphosphate-1,2,3,4,6-pentakisphosphate diphosphatase activity(GO:0052845) inositol-1,5-bisdiphosphate-2,3,4,6-tetrakisphosphate 1-diphosphatase activity(GO:0052846) inositol-1,5-bisdiphosphate-2,3,4,6-tetrakisphosphate 5-diphosphatase activity(GO:0052847) inositol-3,5-bisdiphosphate-2,3,4,6-tetrakisphosphate 5-diphosphatase activity(GO:0052848) |
| 0.1 | 1.0 | GO:0016405 | CoA-ligase activity(GO:0016405) |
| 0.1 | 0.8 | GO:0016174 | NAD(P)H oxidase activity(GO:0016174) |
| 0.1 | 1.1 | GO:0045236 | CXCR chemokine receptor binding(GO:0045236) |
| 0.1 | 4.7 | GO:0070491 | repressing transcription factor binding(GO:0070491) |
| 0.1 | 0.4 | GO:0042015 | interleukin-20 binding(GO:0042015) |
| 0.1 | 1.3 | GO:0005351 | sugar:proton symporter activity(GO:0005351) cation:sugar symporter activity(GO:0005402) |
| 0.1 | 1.2 | GO:0045159 | myosin II binding(GO:0045159) |
| 0.1 | 0.3 | GO:0004001 | adenosine kinase activity(GO:0004001) |
| 0.1 | 0.3 | GO:0001135 | transcription factor activity, RNA polymerase II transcription factor recruiting(GO:0001135) |
| 0.1 | 2.8 | GO:0005086 | ARF guanyl-nucleotide exchange factor activity(GO:0005086) |
| 0.1 | 1.0 | GO:0000774 | adenyl-nucleotide exchange factor activity(GO:0000774) |
| 0.1 | 0.3 | GO:0047391 | alkylglycerophosphoethanolamine phosphodiesterase activity(GO:0047391) |
| 0.1 | 0.6 | GO:0090599 | alpha-glucosidase activity(GO:0090599) |
| 0.1 | 2.6 | GO:0001784 | phosphotyrosine binding(GO:0001784) |
| 0.1 | 0.2 | GO:0031626 | beta-endorphin binding(GO:0031626) |
| 0.1 | 2.3 | GO:0004198 | calcium-dependent cysteine-type endopeptidase activity(GO:0004198) |
| 0.1 | 0.5 | GO:0046976 | histone methyltransferase activity (H3-K27 specific)(GO:0046976) |
| 0.1 | 0.2 | GO:0015140 | malate transmembrane transporter activity(GO:0015140) |
| 0.1 | 0.7 | GO:0003810 | protein-glutamine gamma-glutamyltransferase activity(GO:0003810) |
| 0.1 | 0.2 | GO:0000386 | second spliceosomal transesterification activity(GO:0000386) |
| 0.1 | 0.7 | GO:0003876 | AMP deaminase activity(GO:0003876) adenosine-phosphate deaminase activity(GO:0047623) |
| 0.1 | 0.1 | GO:0019959 | interleukin-8 binding(GO:0019959) |
| 0.1 | 2.0 | GO:0001106 | RNA polymerase II transcription corepressor activity(GO:0001106) |
| 0.1 | 0.3 | GO:0035500 | MH2 domain binding(GO:0035500) |
| 0.1 | 0.1 | GO:0008309 | double-stranded DNA exodeoxyribonuclease activity(GO:0008309) |
| 0.1 | 0.1 | GO:0015489 | polyamine transmembrane transporter activity(GO:0015203) putrescine transmembrane transporter activity(GO:0015489) |
| 0.1 | 0.4 | GO:0008297 | single-stranded DNA exodeoxyribonuclease activity(GO:0008297) |
| 0.1 | 0.3 | GO:0008889 | glycerophosphodiester phosphodiesterase activity(GO:0008889) |
| 0.1 | 2.0 | GO:0005229 | intracellular calcium activated chloride channel activity(GO:0005229) |
| 0.1 | 0.1 | GO:0000035 | acyl binding(GO:0000035) |
| 0.1 | 0.1 | GO:0043559 | insulin binding(GO:0043559) |
| 0.1 | 2.3 | GO:0071889 | 14-3-3 protein binding(GO:0071889) |
| 0.1 | 5.5 | GO:0048306 | calcium-dependent protein binding(GO:0048306) |
| 0.1 | 0.2 | GO:0005011 | macrophage colony-stimulating factor receptor activity(GO:0005011) |
| 0.1 | 0.7 | GO:0016909 | JUN kinase activity(GO:0004705) SAP kinase activity(GO:0016909) |
| 0.1 | 0.1 | GO:0018812 | 3-hydroxyacyl-CoA dehydratase activity(GO:0018812) |
| 0.1 | 0.8 | GO:0098599 | palmitoyl-(protein) hydrolase activity(GO:0008474) palmitoyl hydrolase activity(GO:0098599) |
| 0.1 | 1.1 | GO:0002162 | dystroglycan binding(GO:0002162) |
| 0.1 | 0.3 | GO:0004146 | dihydrofolate reductase activity(GO:0004146) |
| 0.1 | 0.2 | GO:0045131 | pre-mRNA branch point binding(GO:0045131) |
| 0.1 | 0.4 | GO:1904288 | BAT3 complex binding(GO:1904288) |
| 0.1 | 0.6 | GO:0015277 | kainate selective glutamate receptor activity(GO:0015277) |
| 0.1 | 0.5 | GO:0015093 | ferrous iron transmembrane transporter activity(GO:0015093) |
| 0.1 | 0.4 | GO:0016273 | arginine N-methyltransferase activity(GO:0016273) protein-arginine N-methyltransferase activity(GO:0016274) |
| 0.1 | 0.4 | GO:0003993 | acid phosphatase activity(GO:0003993) |
| 0.1 | 0.6 | GO:0030548 | acetylcholine receptor regulator activity(GO:0030548) neurotransmitter receptor regulator activity(GO:0099602) |
| 0.1 | 0.7 | GO:0015129 | lactate transmembrane transporter activity(GO:0015129) |
| 0.1 | 0.2 | GO:1990189 | peptide-serine-N-acetyltransferase activity(GO:1990189) |
| 0.1 | 0.3 | GO:0017034 | Rap guanyl-nucleotide exchange factor activity(GO:0017034) |
| 0.1 | 1.5 | GO:0070888 | E-box binding(GO:0070888) |
| 0.1 | 0.3 | GO:0047066 | phospholipid-hydroperoxide glutathione peroxidase activity(GO:0047066) |
| 0.1 | 1.1 | GO:0019215 | intermediate filament binding(GO:0019215) |
| 0.1 | 0.2 | GO:0004021 | L-alanine:2-oxoglutarate aminotransferase activity(GO:0004021) alanine-oxo-acid transaminase activity(GO:0047635) |
| 0.1 | 0.4 | GO:0016805 | dipeptidase activity(GO:0016805) |
| 0.1 | 0.2 | GO:0000268 | peroxisome targeting sequence binding(GO:0000268) |
| 0.1 | 0.1 | GO:0016532 | superoxide dismutase copper chaperone activity(GO:0016532) |
| 0.1 | 0.8 | GO:0032454 | histone demethylase activity (H3-K9 specific)(GO:0032454) |
| 0.1 | 1.0 | GO:0019841 | retinol binding(GO:0019841) |
| 0.1 | 0.3 | GO:0030622 | U4atac snRNA binding(GO:0030622) |
| 0.1 | 0.8 | GO:0055103 | ligase regulator activity(GO:0055103) ubiquitin-protein transferase regulator activity(GO:0055106) |
| 0.1 | 0.2 | GO:0070180 | large ribosomal subunit rRNA binding(GO:0070180) |
| 0.1 | 2.0 | GO:0005184 | neuropeptide hormone activity(GO:0005184) |
| 0.1 | 0.1 | GO:0004803 | transposase activity(GO:0004803) |
| 0.1 | 2.7 | GO:0003684 | damaged DNA binding(GO:0003684) |
| 0.1 | 0.5 | GO:0004303 | estradiol 17-beta-dehydrogenase activity(GO:0004303) |
| 0.1 | 0.3 | GO:0003960 | NADPH:quinone reductase activity(GO:0003960) |
| 0.1 | 0.2 | GO:0001069 | regulatory region RNA binding(GO:0001069) |
| 0.1 | 1.0 | GO:0043325 | phosphatidylinositol-3,4-bisphosphate binding(GO:0043325) |
| 0.1 | 0.5 | GO:0004022 | alcohol dehydrogenase (NAD) activity(GO:0004022) |
| 0.1 | 0.1 | GO:0004955 | prostaglandin receptor activity(GO:0004955) |
| 0.1 | 0.6 | GO:0050072 | m7G(5')pppN diphosphatase activity(GO:0050072) |
| 0.1 | 0.5 | GO:0019784 | NEDD8-specific protease activity(GO:0019784) |
| 0.1 | 0.7 | GO:0008190 | eukaryotic initiation factor 4E binding(GO:0008190) |
| 0.1 | 0.3 | GO:0016749 | 5-aminolevulinate synthase activity(GO:0003870) N-succinyltransferase activity(GO:0016749) |
| 0.1 | 0.2 | GO:0004419 | hydroxymethylglutaryl-CoA lyase activity(GO:0004419) |
| 0.0 | 0.9 | GO:0005542 | folic acid binding(GO:0005542) |
| 0.0 | 0.1 | GO:0055100 | adiponectin binding(GO:0055100) |
| 0.0 | 1.8 | GO:0003785 | actin monomer binding(GO:0003785) |
| 0.0 | 0.1 | GO:0070404 | NADH binding(GO:0070404) |
| 0.0 | 0.2 | GO:0015562 | efflux transmembrane transporter activity(GO:0015562) |
| 0.0 | 0.2 | GO:0004667 | prostaglandin-D synthase activity(GO:0004667) |
| 0.0 | 0.7 | GO:0016290 | palmitoyl-CoA hydrolase activity(GO:0016290) |
| 0.0 | 1.1 | GO:0017166 | vinculin binding(GO:0017166) |
| 0.0 | 9.9 | GO:0004721 | phosphoprotein phosphatase activity(GO:0004721) |
| 0.0 | 0.1 | GO:0004750 | ribulose-phosphate 3-epimerase activity(GO:0004750) |
| 0.0 | 0.1 | GO:0047012 | C-3 sterol dehydrogenase (C-4 sterol decarboxylase) activity(GO:0000252) sterol-4-alpha-carboxylate 3-dehydrogenase (decarboxylating) activity(GO:0047012) |
| 0.0 | 1.8 | GO:0004181 | metallocarboxypeptidase activity(GO:0004181) |
| 0.0 | 0.4 | GO:0015349 | thyroid hormone transmembrane transporter activity(GO:0015349) |
| 0.0 | 0.2 | GO:0035529 | NADH pyrophosphatase activity(GO:0035529) |
| 0.0 | 0.6 | GO:0043548 | phosphatidylinositol 3-kinase binding(GO:0043548) |
| 0.0 | 0.1 | GO:0030348 | syntaxin-3 binding(GO:0030348) |
| 0.0 | 0.5 | GO:0035615 | clathrin adaptor activity(GO:0035615) endocytic adaptor activity(GO:0098748) |
| 0.0 | 0.8 | GO:0003951 | NAD+ kinase activity(GO:0003951) |
| 0.0 | 0.4 | GO:0030345 | extracellular matrix structural constituent conferring compression resistance(GO:0030021) structural constituent of tooth enamel(GO:0030345) |
| 0.0 | 0.9 | GO:0017091 | AU-rich element binding(GO:0017091) |
| 0.0 | 0.2 | GO:0010521 | telomerase inhibitor activity(GO:0010521) |
| 0.0 | 0.3 | GO:0030023 | extracellular matrix constituent conferring elasticity(GO:0030023) |
| 0.0 | 0.1 | GO:0033300 | dehydroascorbic acid transporter activity(GO:0033300) |
| 0.0 | 0.1 | GO:0032767 | copper-dependent protein binding(GO:0032767) |
| 0.0 | 1.3 | GO:0001530 | lipopolysaccharide binding(GO:0001530) |
| 0.0 | 0.2 | GO:0042954 | lipoprotein transporter activity(GO:0042954) |
| 0.0 | 0.1 | GO:0016262 | protein N-acetylglucosaminyltransferase activity(GO:0016262) |
| 0.0 | 0.8 | GO:0004653 | polypeptide N-acetylgalactosaminyltransferase activity(GO:0004653) |
| 0.0 | 0.3 | GO:0035173 | histone kinase activity(GO:0035173) |
| 0.0 | 0.4 | GO:0030020 | extracellular matrix structural constituent conferring tensile strength(GO:0030020) |
| 0.0 | 0.2 | GO:0001602 | pancreatic polypeptide receptor activity(GO:0001602) |
| 0.0 | 0.3 | GO:0003828 | alpha-N-acetylneuraminate alpha-2,8-sialyltransferase activity(GO:0003828) |
| 0.0 | 0.3 | GO:0019960 | C-X3-C chemokine binding(GO:0019960) |
| 0.0 | 0.2 | GO:0033823 | procollagen-lysine 5-dioxygenase activity(GO:0008475) procollagen glucosyltransferase activity(GO:0033823) |
| 0.0 | 0.5 | GO:0019869 | chloride channel inhibitor activity(GO:0019869) |
| 0.0 | 1.3 | GO:0016676 | cytochrome-c oxidase activity(GO:0004129) heme-copper terminal oxidase activity(GO:0015002) oxidoreductase activity, acting on a heme group of donors, oxygen as acceptor(GO:0016676) |
| 0.0 | 0.0 | GO:0038181 | bile acid receptor activity(GO:0038181) |
| 0.0 | 0.6 | GO:0005132 | type I interferon receptor binding(GO:0005132) |
| 0.0 | 0.5 | GO:0005003 | ephrin receptor activity(GO:0005003) |
| 0.0 | 0.1 | GO:0015205 | nucleobase transmembrane transporter activity(GO:0015205) |
| 0.0 | 0.4 | GO:0004623 | phospholipase A2 activity(GO:0004623) |
| 0.0 | 0.2 | GO:0015165 | pyrimidine nucleotide-sugar transmembrane transporter activity(GO:0015165) |
| 0.0 | 0.5 | GO:0048407 | platelet-derived growth factor binding(GO:0048407) |
| 0.0 | 0.7 | GO:0051400 | BH domain binding(GO:0051400) |
| 0.0 | 1.0 | GO:0008327 | methyl-CpG binding(GO:0008327) |
| 0.0 | 0.9 | GO:0004180 | carboxypeptidase activity(GO:0004180) |
| 0.0 | 1.7 | GO:0001786 | phosphatidylserine binding(GO:0001786) |
| 0.0 | 0.1 | GO:0004505 | phenylalanine 4-monooxygenase activity(GO:0004505) |
| 0.0 | 1.3 | GO:0030742 | GTP-dependent protein binding(GO:0030742) |
| 0.0 | 0.7 | GO:0032266 | phosphatidylinositol-3-phosphate binding(GO:0032266) |
| 0.0 | 2.3 | GO:0017112 | Rab guanyl-nucleotide exchange factor activity(GO:0017112) |
| 0.0 | 0.2 | GO:0005143 | interleukin-12 receptor binding(GO:0005143) |
| 0.0 | 0.5 | GO:0008484 | sulfuric ester hydrolase activity(GO:0008484) |
| 0.0 | 0.3 | GO:0016790 | thiolester hydrolase activity(GO:0016790) |
| 0.0 | 0.2 | GO:0004771 | sterol esterase activity(GO:0004771) |
| 0.0 | 1.5 | GO:0051393 | alpha-actinin binding(GO:0051393) |
| 0.0 | 26.4 | GO:0005509 | calcium ion binding(GO:0005509) |
| 0.0 | 4.9 | GO:0005089 | Rho guanyl-nucleotide exchange factor activity(GO:0005089) |
| 0.0 | 0.1 | GO:0017108 | 5'-flap endonuclease activity(GO:0017108) |
| 0.0 | 0.1 | GO:0002060 | nucleobase binding(GO:0002054) purine nucleobase binding(GO:0002060) |
| 0.0 | 0.2 | GO:0001591 | dopamine neurotransmitter receptor activity, coupled via Gi/Go(GO:0001591) |
| 0.0 | 0.2 | GO:0035325 | Toll-like receptor binding(GO:0035325) |
| 0.0 | 0.1 | GO:0004960 | thromboxane receptor activity(GO:0004960) thromboxane A2 receptor activity(GO:0004961) |
| 0.0 | 0.3 | GO:0004128 | cytochrome-b5 reductase activity, acting on NAD(P)H(GO:0004128) |
| 0.0 | 0.1 | GO:0050698 | proteoglycan sulfotransferase activity(GO:0050698) |
| 0.0 | 0.2 | GO:0008121 | ubiquinol-cytochrome-c reductase activity(GO:0008121) oxidoreductase activity, acting on diphenols and related substances as donors, cytochrome as acceptor(GO:0016681) |
| 0.0 | 0.1 | GO:0071209 | U7 snRNA binding(GO:0071209) |
| 0.0 | 0.2 | GO:0050664 | oxidoreductase activity, acting on NAD(P)H, oxygen as acceptor(GO:0050664) |
| 0.0 | 0.1 | GO:0033897 | ribonuclease T2 activity(GO:0033897) |
| 0.0 | 0.3 | GO:0043176 | amine binding(GO:0043176) serotonin binding(GO:0051378) |
| 0.0 | 0.3 | GO:0016783 | sulfurtransferase activity(GO:0016783) |
| 0.0 | 0.1 | GO:0050309 | glucose-6-phosphatase activity(GO:0004346) sugar-terminal-phosphatase activity(GO:0050309) |
| 0.0 | 0.7 | GO:0043015 | gamma-tubulin binding(GO:0043015) |
| 0.0 | 0.3 | GO:1990381 | ubiquitin-specific protease binding(GO:1990381) |
| 0.0 | 0.6 | GO:0017025 | TBP-class protein binding(GO:0017025) |
| 0.0 | 0.1 | GO:0035730 | S-nitrosoglutathione binding(GO:0035730) dinitrosyl-iron complex binding(GO:0035731) |
| 0.0 | 1.2 | GO:0016620 | oxidoreductase activity, acting on the aldehyde or oxo group of donors, NAD or NADP as acceptor(GO:0016620) |
| 0.0 | 0.8 | GO:0004714 | transmembrane receptor protein tyrosine kinase activity(GO:0004714) |
| 0.0 | 0.2 | GO:1990405 | protein antigen binding(GO:1990405) |
| 0.0 | 0.2 | GO:0004137 | deoxycytidine kinase activity(GO:0004137) |
| 0.0 | 0.1 | GO:0004465 | lipoprotein lipase activity(GO:0004465) |
| 0.0 | 0.1 | GO:0004967 | glucagon receptor activity(GO:0004967) |
| 0.0 | 0.3 | GO:0004985 | opioid receptor activity(GO:0004985) |
| 0.0 | 0.8 | GO:0004709 | MAP kinase kinase kinase activity(GO:0004709) |
| 0.0 | 0.3 | GO:0017110 | nucleoside-diphosphatase activity(GO:0017110) |
| 0.0 | 0.0 | GO:1990763 | arrestin family protein binding(GO:1990763) |
| 0.0 | 3.8 | GO:0000287 | magnesium ion binding(GO:0000287) |
| 0.0 | 6.5 | GO:0003682 | chromatin binding(GO:0003682) |
| 0.0 | 0.2 | GO:0070740 | tubulin-glutamic acid ligase activity(GO:0070740) |
| 0.0 | 0.3 | GO:0004568 | chitinase activity(GO:0004568) |
| 0.0 | 0.1 | GO:0015101 | organic cation transmembrane transporter activity(GO:0015101) |
| 0.0 | 0.1 | GO:0043515 | kinetochore binding(GO:0043515) |
| 0.0 | 0.6 | GO:0005385 | zinc ion transmembrane transporter activity(GO:0005385) |
| 0.0 | 0.1 | GO:0005000 | vasopressin receptor activity(GO:0005000) |
| 0.0 | 0.1 | GO:0070735 | protein-glycine ligase activity(GO:0070735) |
| 0.0 | 0.3 | GO:0001871 | pattern binding(GO:0001871) polysaccharide binding(GO:0030247) |
| 0.0 | 0.1 | GO:0016520 | growth hormone-releasing hormone receptor activity(GO:0016520) |
| 0.0 | 0.1 | GO:1901612 | cardiolipin binding(GO:1901612) |
| 0.0 | 0.1 | GO:0030144 | alpha-1,6-mannosylglycoprotein 6-beta-N-acetylglucosaminyltransferase activity(GO:0030144) |
| 0.0 | 0.2 | GO:0005412 | glucose:sodium symporter activity(GO:0005412) |
| 0.0 | 0.0 | GO:0045322 | unmethylated CpG binding(GO:0045322) |
| 0.0 | 0.3 | GO:0004435 | phosphatidylinositol phospholipase C activity(GO:0004435) |
| 0.0 | 1.0 | GO:0016655 | oxidoreductase activity, acting on NAD(P)H, quinone or similar compound as acceptor(GO:0016655) |
| 0.0 | 0.1 | GO:0019863 | IgE binding(GO:0019863) |
| 0.0 | 0.0 | GO:0016422 | mRNA (2'-O-methyladenosine-N6-)-methyltransferase activity(GO:0016422) |
| 0.0 | 0.1 | GO:0097603 | temperature-gated ion channel activity(GO:0097603) |
| 0.0 | 0.0 | GO:0004418 | hydroxymethylbilane synthase activity(GO:0004418) |
| 0.0 | 0.3 | GO:0005501 | retinoid binding(GO:0005501) |
| 0.0 | 0.1 | GO:0031013 | troponin I binding(GO:0031013) |
| 0.0 | 0.1 | GO:0015929 | hexosaminidase activity(GO:0015929) |
| 0.0 | 0.1 | GO:0008553 | hydrogen-exporting ATPase activity, phosphorylative mechanism(GO:0008553) |
| 0.0 | 0.1 | GO:0016671 | oxidoreductase activity, acting on a sulfur group of donors, disulfide as acceptor(GO:0016671) |
Gene overrepresentation in curated gene sets: canonical pathways category:
| Log-likelihood per target | Total log-likelihood | Term | Description |
|---|---|---|---|
| 0.7 | 17.3 | PID LPA4 PATHWAY | LPA4-mediated signaling events |
| 0.7 | 37.8 | PID TCR CALCIUM PATHWAY | Calcium signaling in the CD4+ TCR pathway |
| 0.6 | 8.1 | ST PAC1 RECEPTOR PATHWAY | PAC1 Receptor Pathway |
| 0.6 | 5.4 | PID ERBB2 ERBB3 PATHWAY | ErbB2/ErbB3 signaling events |
| 0.6 | 24.7 | PID HDAC CLASSIII PATHWAY | Signaling events mediated by HDAC Class III |
| 0.6 | 0.6 | PID RANBP2 PATHWAY | Sumoylation by RanBP2 regulates transcriptional repression |
| 0.5 | 41.2 | PID HNF3A PATHWAY | FOXA1 transcription factor network |
| 0.4 | 7.4 | PID ALK2 PATHWAY | ALK2 signaling events |
| 0.4 | 1.1 | PID THROMBIN PAR1 PATHWAY | PAR1-mediated thrombin signaling events |
| 0.4 | 5.7 | PID LYMPH ANGIOGENESIS PATHWAY | VEGFR3 signaling in lymphatic endothelium |
| 0.3 | 5.4 | PID VEGF VEGFR PATHWAY | VEGF and VEGFR signaling network |
| 0.3 | 3.2 | SA G2 AND M PHASES | Cdc25 activates the cdc2/cyclin B complex to induce the G2/M transition. |
| 0.3 | 33.5 | PID E2F PATHWAY | E2F transcription factor network |
| 0.3 | 7.7 | PID S1P S1P4 PATHWAY | S1P4 pathway |
| 0.3 | 6.3 | PID ALPHA SYNUCLEIN PATHWAY | Alpha-synuclein signaling |
| 0.2 | 9.9 | ST WNT CA2 CYCLIC GMP PATHWAY | Wnt/Ca2+/cyclic GMP signaling. |
| 0.2 | 4.5 | PID AP1 PATHWAY | AP-1 transcription factor network |
| 0.2 | 3.9 | PID TXA2PATHWAY | Thromboxane A2 receptor signaling |
| 0.2 | 2.5 | PID IL2 PI3K PATHWAY | IL2 signaling events mediated by PI3K |
| 0.2 | 12.4 | PID BMP PATHWAY | BMP receptor signaling |
| 0.2 | 4.8 | PID BARD1 PATHWAY | BARD1 signaling events |
| 0.2 | 1.5 | PID RETINOIC ACID PATHWAY | Retinoic acid receptors-mediated signaling |
| 0.2 | 2.4 | PID RAC1 PATHWAY | RAC1 signaling pathway |
| 0.2 | 8.3 | PID RXR VDR PATHWAY | RXR and RAR heterodimerization with other nuclear receptor |
| 0.2 | 0.2 | PID IGF1 PATHWAY | IGF1 pathway |
| 0.2 | 19.4 | PID CASPASE PATHWAY | Caspase cascade in apoptosis |
| 0.2 | 0.7 | PID GLYPICAN 1PATHWAY | Glypican 1 network |
| 0.2 | 7.1 | PID INSULIN PATHWAY | Insulin Pathway |
| 0.2 | 11.6 | PID CDC42 REG PATHWAY | Regulation of CDC42 activity |
| 0.2 | 8.7 | PID NFAT TFPATHWAY | Calcineurin-regulated NFAT-dependent transcription in lymphocytes |
| 0.2 | 3.7 | PID RET PATHWAY | Signaling events regulated by Ret tyrosine kinase |
| 0.2 | 2.4 | PID IL6 7 PATHWAY | IL6-mediated signaling events |
| 0.1 | 6.7 | PID SHP2 PATHWAY | SHP2 signaling |
| 0.1 | 0.1 | PID IL8 CXCR1 PATHWAY | IL8- and CXCR1-mediated signaling events |
| 0.1 | 2.7 | PID TCR JNK PATHWAY | JNK signaling in the CD4+ TCR pathway |
| 0.1 | 3.6 | PID NEPHRIN NEPH1 PATHWAY | Nephrin/Neph1 signaling in the kidney podocyte |
| 0.1 | 0.6 | ST P38 MAPK PATHWAY | p38 MAPK Pathway |
| 0.1 | 7.5 | PID EPO PATHWAY | EPO signaling pathway |
| 0.1 | 5.3 | PID EPHA FWDPATHWAY | EPHA forward signaling |
| 0.1 | 0.8 | SA CASPASE CASCADE | Apoptosis is mediated by caspases, cysteine proteases arranged in a proteolytic cascade. |
| 0.1 | 4.5 | PID WNT CANONICAL PATHWAY | Canonical Wnt signaling pathway |
| 0.1 | 1.1 | ST ADRENERGIC | Adrenergic Pathway |
| 0.1 | 3.0 | PID EPHRINB REV PATHWAY | Ephrin B reverse signaling |
| 0.1 | 0.9 | ST IL 13 PATHWAY | Interleukin 13 (IL-13) Pathway |
| 0.1 | 2.1 | PID KIT PATHWAY | Signaling events mediated by Stem cell factor receptor (c-Kit) |
| 0.1 | 3.9 | PID NCADHERIN PATHWAY | N-cadherin signaling events |
| 0.1 | 7.0 | PID ARF6 PATHWAY | Arf6 signaling events |
| 0.1 | 2.4 | PID SYNDECAN 3 PATHWAY | Syndecan-3-mediated signaling events |
| 0.1 | 0.5 | PID ECADHERIN KERATINOCYTE PATHWAY | E-cadherin signaling in keratinocytes |
| 0.1 | 6.7 | PID HNF3B PATHWAY | FOXA2 and FOXA3 transcription factor networks |
| 0.1 | 2.0 | PID PTP1B PATHWAY | Signaling events mediated by PTP1B |
| 0.1 | 3.8 | PID ERBB1 INTERNALIZATION PATHWAY | Internalization of ErbB1 |
| 0.1 | 4.6 | PID INTEGRIN A4B1 PATHWAY | Alpha4 beta1 integrin signaling events |
| 0.1 | 4.5 | PID P38 ALPHA BETA DOWNSTREAM PATHWAY | Signaling mediated by p38-alpha and p38-beta |
| 0.1 | 3.8 | PID HEDGEHOG GLI PATHWAY | Hedgehog signaling events mediated by Gli proteins |
| 0.1 | 4.2 | PID REG GR PATHWAY | Glucocorticoid receptor regulatory network |
| 0.1 | 2.2 | PID IL2 1PATHWAY | IL2-mediated signaling events |
| 0.1 | 2.4 | PID CERAMIDE PATHWAY | Ceramide signaling pathway |
| 0.1 | 0.7 | SA B CELL RECEPTOR COMPLEXES | Antigen binding to B cell receptors activates protein tyrosine kinases, such as the Src family, which ultimate activate MAP kinases. |
| 0.1 | 0.5 | PID WNT SIGNALING PATHWAY | Wnt signaling network |
| 0.1 | 6.8 | PID BETA CATENIN NUC PATHWAY | Regulation of nuclear beta catenin signaling and target gene transcription |
| 0.1 | 0.9 | PID INTEGRIN1 PATHWAY | Beta1 integrin cell surface interactions |
| 0.1 | 1.1 | PID PI3K PLC TRK PATHWAY | Trk receptor signaling mediated by PI3K and PLC-gamma |
| 0.1 | 2.1 | PID LYSOPHOSPHOLIPID PATHWAY | LPA receptor mediated events |
| 0.1 | 4.4 | PID NOTCH PATHWAY | Notch signaling pathway |
| 0.1 | 0.6 | PID REELIN PATHWAY | Reelin signaling pathway |
| 0.1 | 0.6 | PID MAPK TRK PATHWAY | Trk receptor signaling mediated by the MAPK pathway |
| 0.1 | 1.3 | PID P38 ALPHA BETA PATHWAY | Regulation of p38-alpha and p38-beta |
| 0.1 | 1.2 | PID ARF6 DOWNSTREAM PATHWAY | Arf6 downstream pathway |
| 0.1 | 0.3 | SIG CD40PATHWAYMAP | Genes related to CD40 signaling |
| 0.1 | 0.4 | ST G ALPHA S PATHWAY | G alpha s Pathway |
| 0.1 | 1.3 | PID FRA PATHWAY | Validated transcriptional targets of AP1 family members Fra1 and Fra2 |
| 0.1 | 1.8 | PID FANCONI PATHWAY | Fanconi anemia pathway |
| 0.0 | 0.4 | PID NFKAPPAB ATYPICAL PATHWAY | Atypical NF-kappaB pathway |
| 0.0 | 0.7 | PID ERB GENOMIC PATHWAY | Validated nuclear estrogen receptor beta network |
| 0.0 | 0.2 | PID VEGFR1 PATHWAY | VEGFR1 specific signals |
| 0.0 | 0.6 | PID P38 GAMMA DELTA PATHWAY | Signaling mediated by p38-gamma and p38-delta |
| 0.0 | 0.1 | ST STAT3 PATHWAY | STAT3 Pathway |
| 0.0 | 1.2 | SA MMP CYTOKINE CONNECTION | Cytokines can induce activation of matrix metalloproteinases, which degrade extracellular matrix. |
| 0.0 | 0.7 | PID FAS PATHWAY | FAS (CD95) signaling pathway |
| 0.0 | 0.0 | SIG BCR SIGNALING PATHWAY | Members of the BCR signaling pathway |
| 0.0 | 0.1 | SA PROGRAMMED CELL DEATH | Programmed cell death, or apoptosis, eliminates damaged or unneeded cells. |
| 0.0 | 0.2 | ST INTEGRIN SIGNALING PATHWAY | Integrin Signaling Pathway |
| 0.0 | 0.5 | PID INTEGRIN4 PATHWAY | Alpha6 beta4 integrin-ligand interactions |
| 0.0 | 1.0 | PID RB 1PATHWAY | Regulation of retinoblastoma protein |
| 0.0 | 0.7 | PID CONE PATHWAY | Visual signal transduction: Cones |
| 0.0 | 0.5 | PID ENDOTHELIN PATHWAY | Endothelins |
| 0.0 | 0.6 | PID AJDISS 2PATHWAY | Posttranslational regulation of adherens junction stability and dissassembly |
| 0.0 | 0.8 | NABA PROTEOGLYCANS | Genes encoding proteoglycans |
| 0.0 | 0.5 | PID FCER1 PATHWAY | Fc-epsilon receptor I signaling in mast cells |
| 0.0 | 0.2 | PID HIF1A PATHWAY | Hypoxic and oxygen homeostasis regulation of HIF-1-alpha |
| 0.0 | 0.2 | PID INTEGRIN3 PATHWAY | Beta3 integrin cell surface interactions |
Gene overrepresentation in curated gene sets: REACTOME pathways category:
| Log-likelihood per target | Total log-likelihood | Term | Description |
|---|---|---|---|
| 0.7 | 1.4 | REACTOME MEMBRANE BINDING AND TARGETTING OF GAG PROTEINS | Genes involved in Membrane binding and targetting of GAG proteins |
| 0.6 | 8.3 | REACTOME ETHANOL OXIDATION | Genes involved in Ethanol oxidation |
| 0.6 | 21.5 | REACTOME RNA POL III TRANSCRIPTION TERMINATION | Genes involved in RNA Polymerase III Transcription Termination |
| 0.6 | 19.2 | REACTOME GLUTAMATE NEUROTRANSMITTER RELEASE CYCLE | Genes involved in Glutamate Neurotransmitter Release Cycle |
| 0.6 | 18.7 | REACTOME ERK MAPK TARGETS | Genes involved in ERK/MAPK targets |
| 0.5 | 8.1 | REACTOME SIGNALING BY NOTCH4 | Genes involved in Signaling by NOTCH4 |
| 0.5 | 4.3 | REACTOME ACYL CHAIN REMODELLING OF PC | Genes involved in Acyl chain remodelling of PC |
| 0.5 | 2.5 | REACTOME ACYL CHAIN REMODELLING OF PI | Genes involved in Acyl chain remodelling of PI |
| 0.5 | 23.3 | REACTOME GROWTH HORMONE RECEPTOR SIGNALING | Genes involved in Growth hormone receptor signaling |
| 0.5 | 11.5 | REACTOME CHYLOMICRON MEDIATED LIPID TRANSPORT | Genes involved in Chylomicron-mediated lipid transport |
| 0.5 | 8.4 | REACTOME ACYL CHAIN REMODELLING OF PS | Genes involved in Acyl chain remodelling of PS |
| 0.5 | 7.8 | REACTOME RECRUITMENT OF NUMA TO MITOTIC CENTROSOMES | Genes involved in Recruitment of NuMA to mitotic centrosomes |
| 0.4 | 6.0 | REACTOME G ALPHA Z SIGNALLING EVENTS | Genes involved in G alpha (z) signalling events |
| 0.4 | 2.1 | REACTOME CROSS PRESENTATION OF SOLUBLE EXOGENOUS ANTIGENS ENDOSOMES | Genes involved in Cross-presentation of soluble exogenous antigens (endosomes) |
| 0.4 | 0.4 | REACTOME NFKB IS ACTIVATED AND SIGNALS SURVIVAL | Genes involved in NF-kB is activated and signals survival |
| 0.4 | 8.9 | REACTOME SYNTHESIS OF PA | Genes involved in Synthesis of PA |
| 0.4 | 25.7 | REACTOME DARPP 32 EVENTS | Genes involved in DARPP-32 events |
| 0.4 | 2.3 | REACTOME BINDING AND ENTRY OF HIV VIRION | Genes involved in Binding and entry of HIV virion |
| 0.4 | 5.3 | REACTOME G2 M DNA DAMAGE CHECKPOINT | Genes involved in G2/M DNA damage checkpoint |
| 0.4 | 15.4 | REACTOME CHOLESTEROL BIOSYNTHESIS | Genes involved in Cholesterol biosynthesis |
| 0.4 | 1.8 | REACTOME IL 6 SIGNALING | Genes involved in Interleukin-6 signaling |
| 0.4 | 1.4 | REACTOME NOREPINEPHRINE NEUROTRANSMITTER RELEASE CYCLE | Genes involved in Norepinephrine Neurotransmitter Release Cycle |
| 0.4 | 11.1 | REACTOME RNA POL I TRANSCRIPTION INITIATION | Genes involved in RNA Polymerase I Transcription Initiation |
| 0.4 | 7.8 | REACTOME ADENYLATE CYCLASE INHIBITORY PATHWAY | Genes involved in Adenylate cyclase inhibitory pathway |
| 0.3 | 0.3 | REACTOME JNK C JUN KINASES PHOSPHORYLATION AND ACTIVATION MEDIATED BY ACTIVATED HUMAN TAK1 | Genes involved in JNK (c-Jun kinases) phosphorylation and activation mediated by activated human TAK1 |
| 0.3 | 7.1 | REACTOME SYNTHESIS OF PE | Genes involved in Synthesis of PE |
| 0.3 | 8.9 | REACTOME SYNTHESIS OF GLYCOSYLPHOSPHATIDYLINOSITOL GPI | Genes involved in Synthesis of glycosylphosphatidylinositol (GPI) |
| 0.3 | 3.8 | REACTOME PLATELET SENSITIZATION BY LDL | Genes involved in Platelet sensitization by LDL |
| 0.3 | 9.2 | REACTOME BRANCHED CHAIN AMINO ACID CATABOLISM | Genes involved in Branched-chain amino acid catabolism |
| 0.3 | 0.6 | REACTOME PROLACTIN RECEPTOR SIGNALING | Genes involved in Prolactin receptor signaling |
| 0.3 | 0.6 | REACTOME RNA POL I TRANSCRIPTION | Genes involved in RNA Polymerase I Transcription |
| 0.3 | 5.6 | REACTOME SIGNALING BY FGFR1 MUTANTS | Genes involved in Signaling by FGFR1 mutants |
| 0.3 | 2.8 | REACTOME CS DS DEGRADATION | Genes involved in CS/DS degradation |
| 0.3 | 4.9 | REACTOME MITOCHONDRIAL FATTY ACID BETA OXIDATION | Genes involved in Mitochondrial Fatty Acid Beta-Oxidation |
| 0.3 | 4.3 | REACTOME PLATELET ADHESION TO EXPOSED COLLAGEN | Genes involved in Platelet Adhesion to exposed collagen |
| 0.3 | 1.1 | REACTOME ACTIVATED AMPK STIMULATES FATTY ACID OXIDATION IN MUSCLE | Genes involved in Activated AMPK stimulates fatty-acid oxidation in muscle |
| 0.3 | 0.8 | REACTOME PD1 SIGNALING | Genes involved in PD-1 signaling |
| 0.3 | 0.3 | REACTOME REGULATED PROTEOLYSIS OF P75NTR | Genes involved in Regulated proteolysis of p75NTR |
| 0.2 | 7.2 | REACTOME PEROXISOMAL LIPID METABOLISM | Genes involved in Peroxisomal lipid metabolism |
| 0.2 | 9.5 | REACTOME SPHINGOLIPID DE NOVO BIOSYNTHESIS | Genes involved in Sphingolipid de novo biosynthesis |
| 0.2 | 6.0 | REACTOME APOPTOTIC CLEAVAGE OF CELL ADHESION PROTEINS | Genes involved in Apoptotic cleavage of cell adhesion proteins |
| 0.2 | 4.7 | REACTOME SIGNALING BY ACTIVATED POINT MUTANTS OF FGFR1 | Genes involved in Signaling by activated point mutants of FGFR1 |
| 0.2 | 2.6 | REACTOME ACTIVATION OF NF KAPPAB IN B CELLS | Genes involved in Activation of NF-kappaB in B Cells |
| 0.2 | 2.9 | REACTOME SYNTHESIS OF BILE ACIDS AND BILE SALTS VIA 24 HYDROXYCHOLESTEROL | Genes involved in Synthesis of bile acids and bile salts via 24-hydroxycholesterol |
| 0.2 | 3.7 | REACTOME ROLE OF DCC IN REGULATING APOPTOSIS | Genes involved in Role of DCC in regulating apoptosis |
| 0.2 | 22.8 | REACTOME NUCLEAR RECEPTOR TRANSCRIPTION PATHWAY | Genes involved in Nuclear Receptor transcription pathway |
| 0.2 | 3.8 | REACTOME VEGF LIGAND RECEPTOR INTERACTIONS | Genes involved in VEGF ligand-receptor interactions |
| 0.2 | 4.0 | REACTOME GAMMA CARBOXYLATION TRANSPORT AND AMINO TERMINAL CLEAVAGE OF PROTEINS | Genes involved in Gamma-carboxylation, transport, and amino-terminal cleavage of proteins |
| 0.2 | 5.0 | REACTOME ZINC TRANSPORTERS | Genes involved in Zinc transporters |
| 0.2 | 8.8 | REACTOME SYNTHESIS OF PIPS AT THE PLASMA MEMBRANE | Genes involved in Synthesis of PIPs at the plasma membrane |
| 0.2 | 1.8 | REACTOME INHIBITION OF REPLICATION INITIATION OF DAMAGED DNA BY RB1 E2F1 | Genes involved in Inhibition of replication initiation of damaged DNA by RB1/E2F1 |
| 0.2 | 4.0 | REACTOME ANTIGEN ACTIVATES B CELL RECEPTOR LEADING TO GENERATION OF SECOND MESSENGERS | Genes involved in Antigen Activates B Cell Receptor Leading to Generation of Second Messengers |
| 0.2 | 1.7 | REACTOME APOBEC3G MEDIATED RESISTANCE TO HIV1 INFECTION | Genes involved in APOBEC3G mediated resistance to HIV-1 infection |
| 0.2 | 2.0 | REACTOME YAP1 AND WWTR1 TAZ STIMULATED GENE EXPRESSION | Genes involved in YAP1- and WWTR1 (TAZ)-stimulated gene expression |
| 0.2 | 5.0 | REACTOME INSULIN SYNTHESIS AND PROCESSING | Genes involved in Insulin Synthesis and Processing |
| 0.2 | 9.8 | REACTOME TRANSPORT TO THE GOLGI AND SUBSEQUENT MODIFICATION | Genes involved in Transport to the Golgi and subsequent modification |
| 0.2 | 4.7 | REACTOME TIE2 SIGNALING | Genes involved in Tie2 Signaling |
| 0.2 | 6.7 | REACTOME KINESINS | Genes involved in Kinesins |
| 0.2 | 3.2 | REACTOME ACTIVATION OF THE AP1 FAMILY OF TRANSCRIPTION FACTORS | Genes involved in Activation of the AP-1 family of transcription factors |
| 0.2 | 3.0 | REACTOME ADVANCED GLYCOSYLATION ENDPRODUCT RECEPTOR SIGNALING | Genes involved in Advanced glycosylation endproduct receptor signaling |
| 0.2 | 7.0 | REACTOME AMYLOIDS | Genes involved in Amyloids |
| 0.2 | 1.7 | REACTOME ELEVATION OF CYTOSOLIC CA2 LEVELS | Genes involved in Elevation of cytosolic Ca2+ levels |
| 0.2 | 3.0 | REACTOME PYRIMIDINE CATABOLISM | Genes involved in Pyrimidine catabolism |
| 0.2 | 2.0 | REACTOME IRAK1 RECRUITS IKK COMPLEX | Genes involved in IRAK1 recruits IKK complex |
| 0.2 | 0.6 | REACTOME MITOTIC G2 G2 M PHASES | Genes involved in Mitotic G2-G2/M phases |
| 0.2 | 0.2 | REACTOME TRAF6 MEDIATED IRF7 ACTIVATION IN TLR7 8 OR 9 SIGNALING | Genes involved in TRAF6 mediated IRF7 activation in TLR7/8 or 9 signaling |
| 0.2 | 2.7 | REACTOME REGULATION OF KIT SIGNALING | Genes involved in Regulation of KIT signaling |
| 0.2 | 2.3 | REACTOME P38MAPK EVENTS | Genes involved in p38MAPK events |
| 0.2 | 1.5 | REACTOME AQUAPORIN MEDIATED TRANSPORT | Genes involved in Aquaporin-mediated transport |
| 0.2 | 3.2 | REACTOME SIGNALING BY HIPPO | Genes involved in Signaling by Hippo |
| 0.1 | 5.6 | REACTOME CHONDROITIN SULFATE BIOSYNTHESIS | Genes involved in Chondroitin sulfate biosynthesis |
| 0.1 | 2.0 | REACTOME ACTIVATION OF CHAPERONE GENES BY ATF6 ALPHA | Genes involved in Activation of Chaperone Genes by ATF6-alpha |
| 0.1 | 2.8 | REACTOME BASE FREE SUGAR PHOSPHATE REMOVAL VIA THE SINGLE NUCLEOTIDE REPLACEMENT PATHWAY | Genes involved in Base-free sugar-phosphate removal via the single-nucleotide replacement pathway |
| 0.1 | 0.1 | REACTOME DOWNSTREAM SIGNALING OF ACTIVATED FGFR | Genes involved in Downstream signaling of activated FGFR |
| 0.1 | 16.1 | REACTOME TRANSCRIPTIONAL REGULATION OF WHITE ADIPOCYTE DIFFERENTIATION | Genes involved in Transcriptional Regulation of White Adipocyte Differentiation |
| 0.1 | 2.5 | REACTOME INHIBITION OF VOLTAGE GATED CA2 CHANNELS VIA GBETA GAMMA SUBUNITS | Genes involved in Inhibition of voltage gated Ca2+ channels via Gbeta/gamma subunits |
| 0.1 | 4.1 | REACTOME ADP SIGNALLING THROUGH P2RY1 | Genes involved in ADP signalling through P2Y purinoceptor 1 |
| 0.1 | 11.4 | REACTOME NRAGE SIGNALS DEATH THROUGH JNK | Genes involved in NRAGE signals death through JNK |
| 0.1 | 3.2 | REACTOME FANCONI ANEMIA PATHWAY | Genes involved in Fanconi Anemia pathway |
| 0.1 | 0.5 | REACTOME DESTABILIZATION OF MRNA BY AUF1 HNRNP D0 | Genes involved in Destabilization of mRNA by AUF1 (hnRNP D0) |
| 0.1 | 0.1 | REACTOME NEUROTRANSMITTER RECEPTOR BINDING AND DOWNSTREAM TRANSMISSION IN THE POSTSYNAPTIC CELL | Genes involved in Neurotransmitter Receptor Binding And Downstream Transmission In The Postsynaptic Cell |
| 0.1 | 8.8 | REACTOME NOTCH1 INTRACELLULAR DOMAIN REGULATES TRANSCRIPTION | Genes involved in NOTCH1 Intracellular Domain Regulates Transcription |
| 0.1 | 2.8 | REACTOME REGULATION OF INSULIN LIKE GROWTH FACTOR IGF ACTIVITY BY INSULIN LIKE GROWTH FACTOR BINDING PROTEINS IGFBPS | Genes involved in Regulation of Insulin-like Growth Factor (IGF) Activity by Insulin-like Growth Factor Binding Proteins (IGFBPs) |
| 0.1 | 2.2 | REACTOME REPAIR SYNTHESIS FOR GAP FILLING BY DNA POL IN TC NER | Genes involved in Repair synthesis for gap-filling by DNA polymerase in TC-NER |
| 0.1 | 0.7 | REACTOME NUCLEAR EVENTS KINASE AND TRANSCRIPTION FACTOR ACTIVATION | Genes involved in Nuclear Events (kinase and transcription factor activation) |
| 0.1 | 2.7 | REACTOME DESTABILIZATION OF MRNA BY TRISTETRAPROLIN TTP | Genes involved in Destabilization of mRNA by Tristetraprolin (TTP) |
| 0.1 | 0.9 | REACTOME HDL MEDIATED LIPID TRANSPORT | Genes involved in HDL-mediated lipid transport |
| 0.1 | 1.5 | REACTOME TGF BETA RECEPTOR SIGNALING IN EMT EPITHELIAL TO MESENCHYMAL TRANSITION | Genes involved in TGF-beta receptor signaling in EMT (epithelial to mesenchymal transition) |
| 0.1 | 0.4 | REACTOME PLC BETA MEDIATED EVENTS | Genes involved in PLC beta mediated events |
| 0.1 | 0.3 | REACTOME SIGNALING BY FGFR3 MUTANTS | Genes involved in Signaling by FGFR3 mutants |
| 0.1 | 3.0 | REACTOME CASPASE MEDIATED CLEAVAGE OF CYTOSKELETAL PROTEINS | Genes involved in Caspase-mediated cleavage of cytoskeletal proteins |
| 0.1 | 5.8 | REACTOME GOLGI ASSOCIATED VESICLE BIOGENESIS | Genes involved in Golgi Associated Vesicle Biogenesis |
| 0.1 | 4.4 | REACTOME AMINE COMPOUND SLC TRANSPORTERS | Genes involved in Amine compound SLC transporters |
| 0.1 | 0.4 | REACTOME DOPAMINE NEUROTRANSMITTER RELEASE CYCLE | Genes involved in Dopamine Neurotransmitter Release Cycle |
| 0.1 | 2.2 | REACTOME GAP JUNCTION ASSEMBLY | Genes involved in Gap junction assembly |
| 0.1 | 2.2 | REACTOME SIGNAL REGULATORY PROTEIN SIRP FAMILY INTERACTIONS | Genes involved in Signal regulatory protein (SIRP) family interactions |
| 0.1 | 2.2 | REACTOME REGULATION OF HYPOXIA INDUCIBLE FACTOR HIF BY OXYGEN | Genes involved in Regulation of Hypoxia-inducible Factor (HIF) by Oxygen |
| 0.1 | 5.8 | REACTOME O LINKED GLYCOSYLATION OF MUCINS | Genes involved in O-linked glycosylation of mucins |
| 0.1 | 2.0 | REACTOME FORMATION OF TRANSCRIPTION COUPLED NER TC NER REPAIR COMPLEX | Genes involved in Formation of transcription-coupled NER (TC-NER) repair complex |
| 0.1 | 0.3 | REACTOME FORMATION OF THE HIV1 EARLY ELONGATION COMPLEX | Genes involved in Formation of the HIV-1 Early Elongation Complex |
| 0.1 | 0.4 | REACTOME ALPHA LINOLENIC ACID ALA METABOLISM | Genes involved in alpha-linolenic acid (ALA) metabolism |
| 0.1 | 1.6 | REACTOME GABA SYNTHESIS RELEASE REUPTAKE AND DEGRADATION | Genes involved in GABA synthesis, release, reuptake and degradation |
| 0.1 | 3.1 | REACTOME SULFUR AMINO ACID METABOLISM | Genes involved in Sulfur amino acid metabolism |
| 0.1 | 0.7 | REACTOME AKT PHOSPHORYLATES TARGETS IN THE CYTOSOL | Genes involved in AKT phosphorylates targets in the cytosol |
| 0.1 | 2.7 | REACTOME DEGRADATION OF THE EXTRACELLULAR MATRIX | Genes involved in Degradation of the extracellular matrix |
| 0.1 | 5.2 | REACTOME SPHINGOLIPID METABOLISM | Genes involved in Sphingolipid metabolism |
| 0.1 | 1.3 | REACTOME PASSIVE TRANSPORT BY AQUAPORINS | Genes involved in Passive Transport by Aquaporins |
| 0.1 | 1.2 | REACTOME ASSOCIATION OF LICENSING FACTORS WITH THE PRE REPLICATIVE COMPLEX | Genes involved in Association of licensing factors with the pre-replicative complex |
| 0.1 | 1.7 | REACTOME GLYCOGEN BREAKDOWN GLYCOGENOLYSIS | Genes involved in Glycogen breakdown (glycogenolysis) |
| 0.1 | 1.5 | REACTOME RETROGRADE NEUROTROPHIN SIGNALLING | Genes involved in Retrograde neurotrophin signalling |
| 0.1 | 3.0 | REACTOME LYSOSOME VESICLE BIOGENESIS | Genes involved in Lysosome Vesicle Biogenesis |
| 0.1 | 0.6 | REACTOME CA DEPENDENT EVENTS | Genes involved in Ca-dependent events |
| 0.1 | 1.2 | REACTOME SIGNALING BY FGFR MUTANTS | Genes involved in Signaling by FGFR mutants |
| 0.1 | 2.0 | REACTOME CITRIC ACID CYCLE TCA CYCLE | Genes involved in Citric acid cycle (TCA cycle) |
| 0.1 | 1.1 | REACTOME REGULATORY RNA PATHWAYS | Genes involved in Regulatory RNA pathways |
| 0.1 | 0.9 | REACTOME MRNA CAPPING | Genes involved in mRNA Capping |
| 0.1 | 0.1 | REACTOME CELL DEATH SIGNALLING VIA NRAGE NRIF AND NADE | Genes involved in Cell death signalling via NRAGE, NRIF and NADE |
| 0.1 | 0.6 | REACTOME REGULATION OF MRNA STABILITY BY PROTEINS THAT BIND AU RICH ELEMENTS | Genes involved in Regulation of mRNA Stability by Proteins that Bind AU-rich Elements |
| 0.1 | 1.7 | REACTOME DEPOSITION OF NEW CENPA CONTAINING NUCLEOSOMES AT THE CENTROMERE | Genes involved in Deposition of New CENPA-containing Nucleosomes at the Centromere |
| 0.1 | 6.3 | REACTOME CLASS B 2 SECRETIN FAMILY RECEPTORS | Genes involved in Class B/2 (Secretin family receptors) |
| 0.1 | 3.6 | REACTOME TRAFFICKING OF AMPA RECEPTORS | Genes involved in Trafficking of AMPA receptors |
| 0.1 | 3.2 | REACTOME MYOGENESIS | Genes involved in Myogenesis |
| 0.1 | 1.4 | REACTOME PRE NOTCH PROCESSING IN GOLGI | Genes involved in Pre-NOTCH Processing in Golgi |
| 0.1 | 1.5 | REACTOME PURINE SALVAGE | Genes involved in Purine salvage |
| 0.1 | 1.2 | REACTOME PRESYNAPTIC NICOTINIC ACETYLCHOLINE RECEPTORS | Genes involved in Presynaptic nicotinic acetylcholine receptors |
| 0.1 | 0.3 | REACTOME SIGNALING BY SCF KIT | Genes involved in Signaling by SCF-KIT |
| 0.1 | 1.2 | REACTOME MITOCHONDRIAL TRNA AMINOACYLATION | Genes involved in Mitochondrial tRNA aminoacylation |
| 0.1 | 0.6 | REACTOME IKK COMPLEX RECRUITMENT MEDIATED BY RIP1 | Genes involved in IKK complex recruitment mediated by RIP1 |
| 0.1 | 0.4 | REACTOME EGFR DOWNREGULATION | Genes involved in EGFR downregulation |
| 0.1 | 0.1 | REACTOME PROSTACYCLIN SIGNALLING THROUGH PROSTACYCLIN RECEPTOR | Genes involved in Prostacyclin signalling through prostacyclin receptor |
| 0.1 | 2.7 | REACTOME TRANSPORT OF VITAMINS NUCLEOSIDES AND RELATED MOLECULES | Genes involved in Transport of vitamins, nucleosides, and related molecules |
| 0.1 | 1.2 | REACTOME MEIOTIC RECOMBINATION | Genes involved in Meiotic Recombination |
| 0.1 | 4.6 | REACTOME LOSS OF NLP FROM MITOTIC CENTROSOMES | Genes involved in Loss of Nlp from mitotic centrosomes |
| 0.1 | 1.6 | REACTOME FORMATION OF FIBRIN CLOT CLOTTING CASCADE | Genes involved in Formation of Fibrin Clot (Clotting Cascade) |
| 0.1 | 4.3 | REACTOME METABOLISM OF VITAMINS AND COFACTORS | Genes involved in Metabolism of vitamins and cofactors |
| 0.1 | 0.6 | REACTOME PROSTANOID LIGAND RECEPTORS | Genes involved in Prostanoid ligand receptors |
| 0.1 | 0.7 | REACTOME TRAFFICKING AND PROCESSING OF ENDOSOMAL TLR | Genes involved in Trafficking and processing of endosomal TLR |
| 0.0 | 3.0 | REACTOME CYTOCHROME P450 ARRANGED BY SUBSTRATE TYPE | Genes involved in Cytochrome P450 - arranged by substrate type |
| 0.0 | 1.3 | REACTOME APOPTOTIC CLEAVAGE OF CELLULAR PROTEINS | Genes involved in Apoptotic cleavage of cellular proteins |
| 0.0 | 1.8 | REACTOME GENERATION OF SECOND MESSENGER MOLECULES | Genes involved in Generation of second messenger molecules |
| 0.0 | 0.2 | REACTOME IL 7 SIGNALING | Genes involved in Interleukin-7 signaling |
| 0.0 | 2.8 | REACTOME ACTIVATION OF CHAPERONE GENES BY XBP1S | Genes involved in Activation of Chaperone Genes by XBP1(S) |
| 0.0 | 0.7 | REACTOME UNWINDING OF DNA | Genes involved in Unwinding of DNA |
| 0.0 | 1.0 | REACTOME NUCLEOTIDE LIKE PURINERGIC RECEPTORS | Genes involved in Nucleotide-like (purinergic) receptors |
| 0.0 | 0.6 | REACTOME REVERSIBLE HYDRATION OF CARBON DIOXIDE | Genes involved in Reversible Hydration of Carbon Dioxide |
| 0.0 | 0.4 | REACTOME DCC MEDIATED ATTRACTIVE SIGNALING | Genes involved in DCC mediated attractive signaling |
| 0.0 | 0.8 | REACTOME RNA POL II TRANSCRIPTION PRE INITIATION AND PROMOTER OPENING | Genes involved in RNA Polymerase II Transcription Pre-Initiation And Promoter Opening |
| 0.0 | 0.9 | REACTOME PHOSPHORYLATION OF THE APC C | Genes involved in Phosphorylation of the APC/C |
| 0.0 | 1.4 | REACTOME SIGNALING BY BMP | Genes involved in Signaling by BMP |
| 0.0 | 4.4 | REACTOME PEPTIDE CHAIN ELONGATION | Genes involved in Peptide chain elongation |
| 0.0 | 1.0 | REACTOME SYNTHESIS AND INTERCONVERSION OF NUCLEOTIDE DI AND TRIPHOSPHATES | Genes involved in Synthesis and interconversion of nucleotide di- and triphosphates |
| 0.0 | 3.0 | REACTOME FACTORS INVOLVED IN MEGAKARYOCYTE DEVELOPMENT AND PLATELET PRODUCTION | Genes involved in Factors involved in megakaryocyte development and platelet production |
| 0.0 | 0.4 | REACTOME THE NLRP3 INFLAMMASOME | Genes involved in The NLRP3 inflammasome |
| 0.0 | 0.1 | REACTOME GAP JUNCTION DEGRADATION | Genes involved in Gap junction degradation |
| 0.0 | 0.2 | REACTOME CTNNB1 PHOSPHORYLATION CASCADE | Genes involved in Beta-catenin phosphorylation cascade |
| 0.0 | 0.1 | REACTOME ACYL CHAIN REMODELLING OF PG | Genes involved in Acyl chain remodelling of PG |
| 0.0 | 0.1 | REACTOME P75NTR SIGNALS VIA NFKB | Genes involved in p75NTR signals via NF-kB |
| 0.0 | 0.6 | REACTOME METABOLISM OF PORPHYRINS | Genes involved in Metabolism of porphyrins |
| 0.0 | 0.1 | REACTOME ACTIVATION OF CHAPERONES BY ATF6 ALPHA | Genes involved in Activation of Chaperones by ATF6-alpha |
| 0.0 | 0.2 | REACTOME ANDROGEN BIOSYNTHESIS | Genes involved in Androgen biosynthesis |
| 0.0 | 1.5 | REACTOME RESPIRATORY ELECTRON TRANSPORT ATP SYNTHESIS BY CHEMIOSMOTIC COUPLING AND HEAT PRODUCTION BY UNCOUPLING PROTEINS | Genes involved in Respiratory electron transport, ATP synthesis by chemiosmotic coupling, and heat production by uncoupling proteins. |
| 0.0 | 0.2 | REACTOME CALNEXIN CALRETICULIN CYCLE | Genes involved in Calnexin/calreticulin cycle |
| 0.0 | 0.1 | REACTOME SIGNAL ATTENUATION | Genes involved in Signal attenuation |
| 0.0 | 0.2 | REACTOME REGULATION OF INSULIN SECRETION BY GLUCAGON LIKE PEPTIDE1 | Genes involved in Regulation of Insulin Secretion by Glucagon-like Peptide-1 |