Project
Inflammatory response time course, HUVEC (Wada, 2009)
Navigation
Downloads
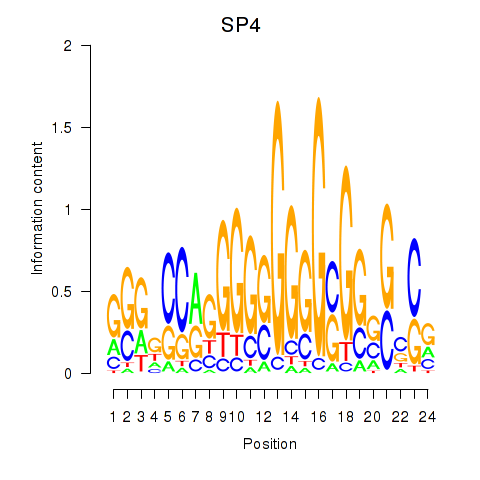
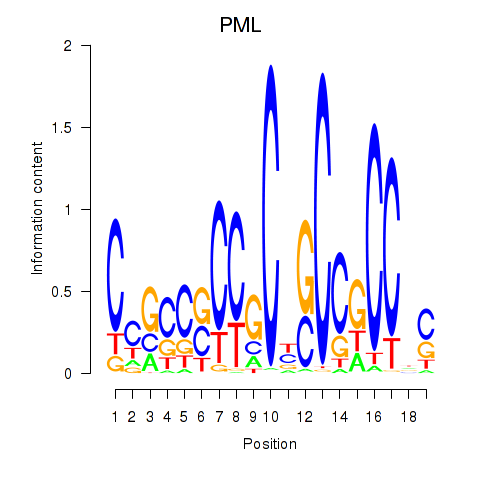
Results for SP4_PML
Z-value: 1.56
Motif logo
Transcription factors associated with SP4_PML
| Gene Symbol | Gene ID | Gene Info |
|---|---|---|
|
SP4
|
ENSG00000105866.15 | SP4 |
|
PML
|
ENSG00000140464.20 | PML |
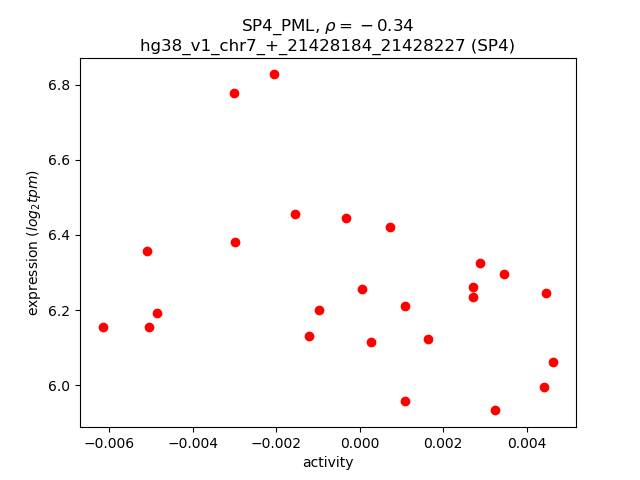
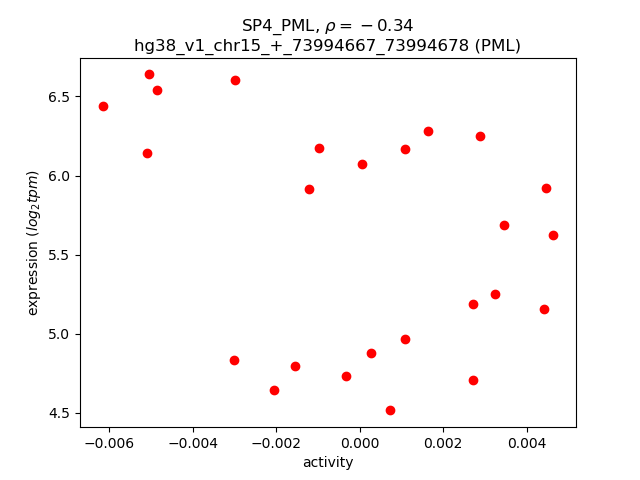
Activity-expression correlation:
| Gene | Promoter | Pearson corr. coef. | P-value | Plot |
|---|---|---|---|---|
| SP4 | hg38_v1_chr7_+_21428184_21428227 | -0.34 | 9.5e-02 | Click! |
| PML | hg38_v1_chr15_+_73994667_73994678 | -0.34 | 9.9e-02 | Click! |
Activity profile of SP4_PML motif
Sorted Z-values of SP4_PML motif
Network of associatons between targets according to the STRING database.
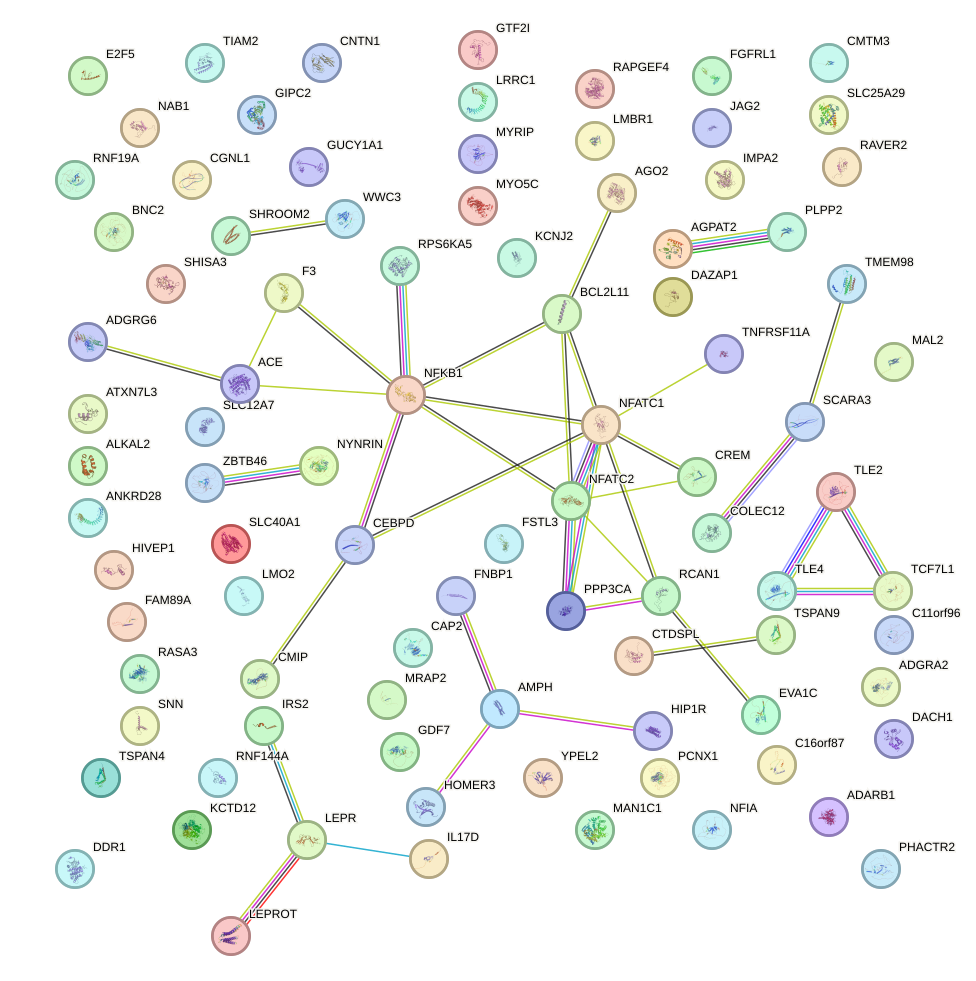
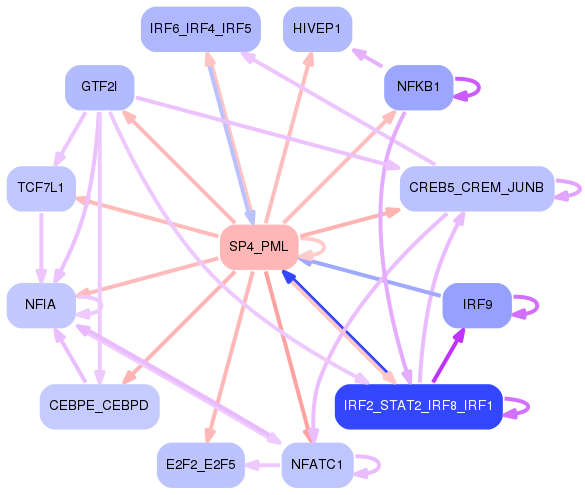
First level regulatory network of SP4_PML
| Promoter | Score | Transcript | Gene | Gene Info |
|---|---|---|---|---|
| chr18_+_79400274 | 7.94 |
ENST00000545796.5
ENST00000318065.9 ENST00000592223.5 ENST00000329101.8 ENST00000586434.1 |
NFATC1
|
nuclear factor of activated T cells 1 |
| chr18_+_79395856 | 7.03 |
ENST00000253506.9
ENST00000591814.5 ENST00000427363.7 |
NFATC1
|
nuclear factor of activated T cells 1 |
| chr4_+_41360759 | 6.73 |
ENST00000508501.5
ENST00000512946.5 ENST00000313860.11 ENST00000512632.5 ENST00000512820.5 |
LIMCH1
|
LIM and calponin homology domains 1 |
| chr4_+_155667654 | 5.25 |
ENST00000513574.1
|
GUCY1A1
|
guanylate cyclase 1 soluble subunit alpha 1 |
| chr1_+_25616780 | 5.23 |
ENST00000374332.9
|
MAN1C1
|
mannosidase alpha class 1C member 1 |
| chr19_+_1407731 | 5.02 |
ENST00000592453.2
|
DAZAP1
|
DAZ associated protein 1 |
| chr8_-_100309904 | 5.00 |
ENST00000523481.5
|
RNF19A
|
ring finger protein 19A, RBR E3 ubiquitin protein ligase |
| chr9_-_130043154 | 4.86 |
ENST00000355681.3
ENST00000446176.7 ENST00000443566.6 ENST00000420781.5 |
FNBP1
|
formin binding protein 1 |
| chr9_+_136712531 | 4.84 |
ENST00000371692.9
|
DIPK1B
|
divergent protein kinase domain 1B |
| chr2_+_20667136 | 4.81 |
ENST00000272224.5
|
GDF7
|
growth differentiation factor 7 |
| chr18_+_79395942 | 4.78 |
ENST00000397790.6
|
NFATC1
|
nuclear factor of activated T cells 1 |
| chr13_-_71866769 | 4.73 |
ENST00000619232.1
|
DACH1
|
dachshund family transcription factor 1 |
| chr6_+_142301926 | 4.73 |
ENST00000296932.13
ENST00000367609.8 |
ADGRG6
|
adhesion G protein-coupled receptor G6 |
| chr8_-_47738153 | 4.57 |
ENST00000408965.4
|
CEBPD
|
CCAAT enhancer binding protein delta |
| chr18_+_62325269 | 4.54 |
ENST00000639222.1
ENST00000269485.11 ENST00000616710.4 ENST00000617039.4 |
TNFRSF11A
|
TNF receptor superfamily member 11a |
| chr13_-_76886397 | 4.48 |
ENST00000377474.4
|
KCTD12
|
potassium channel tetramerization domain containing 12 |
| chr10_+_35127162 | 4.46 |
ENST00000354759.7
|
CREM
|
cAMP responsive element modulator |
| chr19_+_676385 | 4.40 |
ENST00000166139.9
|
FSTL3
|
follistatin like 3 |
| chr1_+_65525641 | 4.38 |
ENST00000344610.12
ENST00000616738.4 |
LEPR
|
leptin receptor |
| chr3_+_39809602 | 4.31 |
ENST00000302541.11
ENST00000396217.7 |
MYRIP
|
myosin VIIA and Rab interacting protein |
| chr18_+_62325294 | 4.19 |
ENST00000586569.3
|
TNFRSF11A
|
TNF receptor superfamily member 11a |
| chr20_-_63831214 | 4.16 |
ENST00000302995.2
ENST00000245663.9 |
ZBTB46
|
zinc finger and BTB domain containing 46 |
| chr5_+_122312229 | 4.05 |
ENST00000261368.13
|
SNCAIP
|
synuclein alpha interacting protein |
| chr8_+_85177225 | 4.02 |
ENST00000418930.6
|
E2F5
|
E2F transcription factor 5 |
| chr9_+_69325168 | 3.94 |
ENST00000303068.14
|
FAM189A2
|
family with sequence similarity 189 member A2 |
| chr5_+_122312164 | 3.92 |
ENST00000514497.6
ENST00000261367.11 |
SNCAIP
|
synuclein alpha interacting protein |
| chr8_+_27633863 | 3.91 |
ENST00000337221.8
|
SCARA3
|
scavenger receptor class A member 3 |
| chr1_+_78045956 | 3.88 |
ENST00000370759.4
|
GIPC2
|
GIPC PDZ domain containing family member 2 |
| chr2_+_172735838 | 3.84 |
ENST00000397081.8
|
RAPGEF4
|
Rap guanine nucleotide exchange factor 4 |
| chr2_+_190649062 | 3.84 |
ENST00000409581.5
ENST00000337386.10 |
NAB1
|
NGFI-A binding protein 1 |
| chr1_-_231040218 | 3.83 |
ENST00000366654.5
|
FAM89A
|
family with sequence similarity 89 member A |
| chr4_-_101347327 | 3.76 |
ENST00000394853.8
|
PPP3CA
|
protein phosphatase 3 catalytic subunit alpha |
| chr2_+_172735912 | 3.74 |
ENST00000409036.5
|
RAPGEF4
|
Rap guanine nucleotide exchange factor 4 |
| chr13_-_114132580 | 3.67 |
ENST00000334062.8
|
RASA3
|
RAS p21 protein activator 3 |
| chr14_-_105168753 | 3.67 |
ENST00000331782.8
ENST00000347004.2 |
JAG2
|
jagged canonical Notch ligand 2 |
| chr11_-_33869816 | 3.60 |
ENST00000395833.7
|
LMO2
|
LIM domain only 2 |
| chr11_+_43942627 | 3.55 |
ENST00000617612.3
|
C11orf96
|
chromosome 11 open reading frame 96 |
| chr8_+_85177135 | 3.54 |
ENST00000416274.7
|
E2F5
|
E2F transcription factor 5 |
| chr2_+_85133376 | 3.46 |
ENST00000282111.4
|
TCF7L1
|
transcription factor 7 like 1 |
| chr10_+_35127023 | 3.35 |
ENST00000429130.7
ENST00000469949.6 ENST00000460270.5 |
CREM
|
cAMP responsive element modulator |
| chr17_+_63477052 | 3.32 |
ENST00000290866.10
ENST00000428043.5 |
ACE
|
angiotensin I converting enzyme |
| chrX_+_9786420 | 3.32 |
ENST00000380913.8
|
SHROOM2
|
shroom family member 2 |
| chr12_+_122835426 | 3.32 |
ENST00000253083.9
|
HIP1R
|
huntingtin interacting protein 1 related |
| chr11_+_849816 | 3.30 |
ENST00000527644.1
|
TSPAN4
|
tetraspanin 4 |
| chr4_+_155667198 | 3.29 |
ENST00000296518.11
|
GUCY1A1
|
guanylate cyclase 1 soluble subunit alpha 1 |
| chr4_-_101347471 | 3.29 |
ENST00000323055.10
ENST00000512215.5 |
PPP3CA
|
protein phosphatase 3 catalytic subunit alpha |
| chr16_-_46831043 | 3.25 |
ENST00000565112.1
|
C16orf87
|
chromosome 16 open reading frame 87 |
| chr8_+_27633884 | 3.25 |
ENST00000301904.4
|
SCARA3
|
scavenger receptor class A member 3 |
| chr17_+_70169516 | 3.24 |
ENST00000243457.4
|
KCNJ2
|
potassium inwardly rectifying channel subfamily J member 2 |
| chr14_-_91060113 | 3.18 |
ENST00000536315.6
|
RPS6KA5
|
ribosomal protein S6 kinase A5 |
| chr1_+_61082398 | 3.16 |
ENST00000664149.1
|
NFIA
|
nuclear factor I A |
| chr6_+_17393657 | 3.16 |
ENST00000493172.5
ENST00000465994.5 |
CAP2
|
cyclase associated actin cytoskeleton regulatory protein 2 |
| chr6_+_142301854 | 3.16 |
ENST00000230173.10
ENST00000367608.6 |
ADGRG6
|
adhesion G protein-coupled receptor G6 |
| chr1_+_61082553 | 3.14 |
ENST00000403491.8
ENST00000371187.7 |
NFIA
|
nuclear factor I A |
| chr16_+_11668414 | 3.14 |
ENST00000329565.6
|
SNN
|
stannin |
| chr8_-_140635546 | 3.14 |
ENST00000519980.5
|
AGO2
|
argonaute RISC catalytic component 2 |
| chr19_-_18941117 | 3.13 |
ENST00000600077.5
|
HOMER3
|
homer scaffold protein 3 |
| chr4_-_101347492 | 3.13 |
ENST00000394854.8
|
PPP3CA
|
protein phosphatase 3 catalytic subunit alpha |
| chr8_+_37796850 | 3.11 |
ENST00000412232.3
|
ADGRA2
|
adhesion G protein-coupled receptor A2 |
| chr8_-_140635617 | 3.08 |
ENST00000220592.10
|
AGO2
|
argonaute RISC catalytic component 2 |
| chr19_-_18941184 | 3.08 |
ENST00000594794.5
ENST00000392351.8 ENST00000596482.5 |
HOMER3
|
homer scaffold protein 3 |
| chr8_+_141128581 | 3.03 |
ENST00000519811.6
|
DENND3
|
DENN domain containing 3 |
| chr7_+_74658004 | 3.03 |
ENST00000443166.5
|
GTF2I
|
general transcription factor IIi |
| chr14_-_100306430 | 3.02 |
ENST00000392908.7
ENST00000359232.8 |
SLC25A29
|
solute carrier family 25 member 29 |
| chr8_+_37796906 | 3.01 |
ENST00000315215.11
|
ADGRA2
|
adhesion G protein-coupled receptor A2 |
| chr17_-_44199206 | 2.99 |
ENST00000589805.1
|
ATXN7L3
|
ataxin 7 like 3 |
| chr2_-_189580773 | 2.99 |
ENST00000261024.7
|
SLC40A1
|
solute carrier family 40 member 1 |
| chr3_-_15859771 | 2.98 |
ENST00000399451.6
|
ANKRD28
|
ankyrin repeat domain 28 |
| chr14_+_24398986 | 2.97 |
ENST00000382554.4
|
NYNRIN
|
NYN domain and retroviral integrase containing |
| chr19_-_291365 | 2.97 |
ENST00000591572.2
ENST00000269812.7 ENST00000633125.1 ENST00000434325.7 |
PLPP2
|
phospholipid phosphatase 2 |
| chr7_-_38631356 | 2.93 |
ENST00000356264.7
ENST00000325590.9 |
AMPH
|
amphiphysin |
| chr14_+_70907661 | 2.92 |
ENST00000439984.7
|
PCNX1
|
pecanex 1 |
| chr3_+_37861849 | 2.92 |
ENST00000273179.10
|
CTDSPL
|
CTD small phosphatase like |
| chr4_+_1009954 | 2.91 |
ENST00000398484.6
|
FGFRL1
|
fibroblast growth factor receptor like 1 |
| chr4_+_42397473 | 2.91 |
ENST00000319234.5
|
SHISA3
|
shisa family member 3 |
| chr8_+_141128612 | 2.91 |
ENST00000518347.5
ENST00000262585.6 ENST00000520986.5 ENST00000523058.5 ENST00000518668.5 |
DENND3
|
DENN domain containing 3 |
| chr5_-_1112051 | 2.90 |
ENST00000264930.10
|
SLC12A7
|
solute carrier family 12 member 7 |
| chr10_+_35126791 | 2.88 |
ENST00000474362.5
ENST00000374721.7 |
CREM
|
cAMP responsive element modulator |
| chr5_+_122311740 | 2.86 |
ENST00000506272.5
ENST00000508681.5 ENST00000509154.6 |
SNCAIP
|
synuclein alpha interacting protein |
| chr18_-_500692 | 2.86 |
ENST00000400256.5
|
COLEC12
|
collectin subfamily member 12 |
| chr9_+_79573162 | 2.84 |
ENST00000425506.5
|
TLE4
|
TLE family member 4, transcriptional corepressor |
| chr6_+_30884353 | 2.83 |
ENST00000428153.6
ENST00000376568.8 ENST00000452441.5 ENST00000515219.5 |
DDR1
|
discoidin domain receptor tyrosine kinase 1 |
| chr18_+_11981488 | 2.83 |
ENST00000269159.8
|
IMPA2
|
inositol monophosphatase 2 |
| chr6_+_84033717 | 2.81 |
ENST00000257776.5
|
MRAP2
|
melanocortin 2 receptor accessory protein 2 |
| chr2_+_6917404 | 2.80 |
ENST00000320892.11
|
RNF144A
|
ring finger protein 144A |
| chr2_-_288056 | 2.79 |
ENST00000403610.9
|
ALKAL2
|
ALK and LTK ligand 2 |
| chr15_+_57376497 | 2.78 |
ENST00000281282.6
|
CGNL1
|
cingulin like 1 |
| chr8_-_100309926 | 2.72 |
ENST00000341084.7
|
RNF19A
|
ring finger protein 19A, RBR E3 ubiquitin protein ligase |
| chr6_+_143536811 | 2.72 |
ENST00000367584.8
|
PHACTR2
|
phosphatase and actin regulator 2 |
| chr16_+_66604782 | 2.71 |
ENST00000565003.5
|
CMTM3
|
CKLF like MARVEL transmembrane domain containing 3 |
| chr8_+_119208322 | 2.69 |
ENST00000614891.5
|
MAL2
|
mal, T cell differentiation protein 2 |
| chr2_-_101151253 | 2.68 |
ENST00000376840.8
ENST00000409318.2 |
TBC1D8
|
TBC1 domain family member 8 |
| chr21_-_34615103 | 2.68 |
ENST00000313806.9
|
RCAN1
|
regulator of calcineurin 1 |
| chr1_+_64745089 | 2.68 |
ENST00000294428.7
ENST00000371072.8 |
RAVER2
|
ribonucleoprotein, PTB binding 2 |
| chr6_+_154995258 | 2.67 |
ENST00000682666.1
|
TIAM2
|
TIAM Rac1 associated GEF 2 |
| chr13_+_20703677 | 2.66 |
ENST00000682841.1
|
IL17D
|
interleukin 17D |
| chr12_+_3077355 | 2.65 |
ENST00000537971.5
ENST00000011898.10 ENST00000649909.1 |
TSPAN9
|
tetraspanin 9 |
| chrX_+_10015226 | 2.64 |
ENST00000380861.9
|
WWC3
|
WWC family member 3 |
| chr4_+_102501298 | 2.64 |
ENST00000394820.8
ENST00000226574.9 ENST00000511926.5 ENST00000507079.5 |
NFKB1
|
nuclear factor kappa B subunit 1 |
| chr16_+_81444799 | 2.62 |
ENST00000537098.8
|
CMIP
|
c-Maf inducing protein |
| chr6_+_12012304 | 2.60 |
ENST00000379388.7
ENST00000627968.2 ENST00000541134.5 |
HIVEP1
|
HIVEP zinc finger 1 |
| chr13_-_106535653 | 2.59 |
ENST00000646441.1
|
EFNB2
|
ephrin B2 |
| chr6_-_142946312 | 2.59 |
ENST00000367604.6
|
HIVEP2
|
HIVEP zinc finger 2 |
| chr15_-_52295792 | 2.59 |
ENST00000261839.12
|
MYO5C
|
myosin VC |
| chr21_+_45074549 | 2.59 |
ENST00000348831.9
ENST00000437626.5 ENST00000389863.8 |
ADARB1
|
adenosine deaminase RNA specific B1 |
| chr7_-_156892987 | 2.59 |
ENST00000415428.5
|
LMBR1
|
limb development membrane protein 1 |
| chr17_+_32927910 | 2.59 |
ENST00000394642.7
|
TMEM98
|
transmembrane protein 98 |
| chr19_-_291132 | 2.56 |
ENST00000327790.7
|
PLPP2
|
phospholipid phosphatase 2 |
| chr3_+_53161120 | 2.56 |
ENST00000394729.6
ENST00000330452.8 ENST00000652449.1 |
PRKCD
|
protein kinase C delta |
| chr13_-_109786567 | 2.55 |
ENST00000375856.5
|
IRS2
|
insulin receptor substrate 2 |
| chr17_+_59331633 | 2.55 |
ENST00000312655.9
|
YPEL2
|
yippee like 2 |
| chr9_-_136687380 | 2.54 |
ENST00000538402.1
ENST00000371694.7 |
AGPAT2
|
1-acylglycerol-3-phosphate O-acyltransferase 2 |
| chr1_-_94541746 | 2.53 |
ENST00000334047.12
|
F3
|
coagulation factor III, tissue factor |
| chr20_-_51542658 | 2.53 |
ENST00000396009.7
ENST00000371564.8 ENST00000610033.5 |
NFATC2
|
nuclear factor of activated T cells 2 |
| chr19_-_3029013 | 2.52 |
ENST00000590536.5
ENST00000587137.5 ENST00000455444.6 |
TLE2
|
TLE family member 2, transcriptional corepressor |
| chr6_+_53794948 | 2.52 |
ENST00000370888.6
|
LRRC1
|
leucine rich repeat containing 1 |
| chr9_-_16870702 | 2.52 |
ENST00000380667.6
ENST00000545497.5 ENST00000486514.5 |
BNC2
|
basonuclin 2 |
| chr2_+_111120906 | 2.51 |
ENST00000337565.9
ENST00000357757.6 ENST00000308659.12 ENST00000393256.8 ENST00000610735.4 ENST00000615946.4 ENST00000619294.4 ENST00000620862.4 ENST00000621302.4 ENST00000622509.4 ENST00000622612.4 |
BCL2L11
|
BCL2 like 11 |
| chr3_+_53161241 | 2.50 |
ENST00000477794.2
ENST00000650739.1 |
PRKCD
|
protein kinase C delta |
| chr4_+_1011595 | 2.49 |
ENST00000510644.6
|
FGFRL1
|
fibroblast growth factor receptor like 1 |
| chr21_+_32412648 | 2.49 |
ENST00000401402.7
ENST00000382699.7 ENST00000300255.7 |
EVA1C
|
eva-1 homolog C |
| chr4_-_101346842 | 2.45 |
ENST00000507176.5
|
PPP3CA
|
protein phosphatase 3 catalytic subunit alpha |
| chr1_-_94541636 | 2.44 |
ENST00000370207.4
|
F3
|
coagulation factor III, tissue factor |
| chr10_-_124092445 | 2.44 |
ENST00000346248.7
|
CHST15
|
carbohydrate sulfotransferase 15 |
| chr11_-_45665578 | 2.43 |
ENST00000308064.7
|
CHST1
|
carbohydrate sulfotransferase 1 |
| chrX_-_118116746 | 2.43 |
ENST00000371882.5
ENST00000545703.5 ENST00000540167.5 |
KLHL13
|
kelch like family member 13 |
| chr7_-_11832190 | 2.42 |
ENST00000423059.9
ENST00000617773.1 |
THSD7A
|
thrombospondin type 1 domain containing 7A |
| chr18_+_11981548 | 2.41 |
ENST00000588927.5
|
IMPA2
|
inositol monophosphatase 2 |
| chr11_+_64234569 | 2.39 |
ENST00000309422.7
ENST00000426086.3 |
VEGFB
|
vascular endothelial growth factor B |
| chr14_-_50668287 | 2.37 |
ENST00000556735.1
ENST00000324679.5 |
SAV1
|
salvador family WW domain containing protein 1 |
| chr9_-_136687422 | 2.37 |
ENST00000371696.7
|
AGPAT2
|
1-acylglycerol-3-phosphate O-acyltransferase 2 |
| chr1_-_999981 | 2.36 |
ENST00000484667.2
|
HES4
|
hes family bHLH transcription factor 4 |
| chr14_+_104138578 | 2.34 |
ENST00000423312.7
|
KIF26A
|
kinesin family member 26A |
| chr6_+_14117764 | 2.34 |
ENST00000379153.4
|
CD83
|
CD83 molecule |
| chr8_+_30095649 | 2.33 |
ENST00000518192.5
|
LEPROTL1
|
leptin receptor overlapping transcript like 1 |
| chr8_+_97869040 | 2.33 |
ENST00000254898.7
ENST00000524308.5 ENST00000522025.6 |
MATN2
|
matrilin 2 |
| chr11_-_2139382 | 2.32 |
ENST00000416167.7
|
IGF2
|
insulin like growth factor 2 |
| chr17_+_32928126 | 2.32 |
ENST00000579849.6
ENST00000578289.5 ENST00000439138.5 |
TMEM98
|
transmembrane protein 98 |
| chr2_+_46297397 | 2.31 |
ENST00000263734.5
|
EPAS1
|
endothelial PAS domain protein 1 |
| chr7_-_32892015 | 2.30 |
ENST00000452926.1
|
KBTBD2
|
kelch repeat and BTB domain containing 2 |
| chr1_-_234609445 | 2.30 |
ENST00000366610.7
|
IRF2BP2
|
interferon regulatory factor 2 binding protein 2 |
| chr4_+_102501885 | 2.29 |
ENST00000505458.5
|
NFKB1
|
nuclear factor kappa B subunit 1 |
| chr2_-_234497035 | 2.29 |
ENST00000390645.2
ENST00000339728.6 |
ARL4C
|
ADP ribosylation factor like GTPase 4C |
| chr1_+_32539418 | 2.29 |
ENST00000373510.9
ENST00000316459.4 |
ZBTB8A
|
zinc finger and BTB domain containing 8A |
| chr11_-_119364166 | 2.28 |
ENST00000525735.1
|
USP2
|
ubiquitin specific peptidase 2 |
| chr2_+_86913812 | 2.27 |
ENST00000398193.8
|
RGPD1
|
RANBP2 like and GRIP domain containing 1 |
| chr19_+_1524068 | 2.27 |
ENST00000642079.2
ENST00000454744.7 ENST00000588430.3 |
PLK5
|
polo like kinase 5 (inactive) |
| chr5_-_38556625 | 2.27 |
ENST00000506990.5
ENST00000453190.7 |
LIFR
|
LIF receptor subunit alpha |
| chr1_+_32741779 | 2.26 |
ENST00000401073.7
|
KIAA1522
|
KIAA1522 |
| chr9_+_131096476 | 2.26 |
ENST00000372309.7
ENST00000247291.8 ENST00000372302.5 ENST00000372300.5 ENST00000372298.1 |
AIF1L
|
allograft inflammatory factor 1 like |
| chr3_+_37861926 | 2.26 |
ENST00000443503.6
|
CTDSPL
|
CTD small phosphatase like |
| chr6_-_13711817 | 2.25 |
ENST00000011619.6
|
RANBP9
|
RAN binding protein 9 |
| chr21_+_5022493 | 2.23 |
ENST00000612610.4
ENST00000620481.4 ENST00000623960.4 ENST00000623795.1 |
ENSG00000277117.5
|
novel protein, similar to inducible T-cell co-stimulator ligand ICOSLG |
| chr21_-_46228751 | 2.21 |
ENST00000450351.1
ENST00000397728.8 ENST00000522411.5 ENST00000356396.8 ENST00000457828.6 |
LSS
|
lanosterol synthase |
| chr16_-_87493013 | 2.21 |
ENST00000671377.2
|
ZCCHC14
|
zinc finger CCHC-type containing 14 |
| chr21_+_17513003 | 2.21 |
ENST00000284878.12
ENST00000400166.5 |
CXADR
|
CXADR Ig-like cell adhesion molecule |
| chr14_+_102777555 | 2.19 |
ENST00000539721.5
ENST00000560463.5 |
TRAF3
|
TNF receptor associated factor 3 |
| chr6_+_135181268 | 2.17 |
ENST00000341911.10
ENST00000442647.7 ENST00000618728.4 ENST00000316528.12 ENST00000616088.4 |
MYB
|
MYB proto-oncogene, transcription factor |
| chr1_-_207911027 | 2.16 |
ENST00000310833.12
|
CD34
|
CD34 molecule |
| chr13_-_113864062 | 2.16 |
ENST00000327773.7
|
GAS6
|
growth arrest specific 6 |
| chr1_+_81800906 | 2.16 |
ENST00000674393.1
ENST00000674208.1 |
ADGRL2
|
adhesion G protein-coupled receptor L2 |
| chr1_-_3611470 | 2.16 |
ENST00000356575.9
|
MEGF6
|
multiple EGF like domains 6 |
| chr9_-_78031775 | 2.15 |
ENST00000286548.9
|
GNAQ
|
G protein subunit alpha q |
| chr6_-_10412367 | 2.15 |
ENST00000379608.9
|
TFAP2A
|
transcription factor AP-2 alpha |
| chr12_-_95790755 | 2.14 |
ENST00000343702.9
ENST00000344911.8 |
NTN4
|
netrin 4 |
| chr17_-_17496387 | 2.13 |
ENST00000225688.4
ENST00000579152.1 |
RASD1
|
ras related dexamethasone induced 1 |
| chr5_+_1008794 | 2.13 |
ENST00000296849.10
|
NKD2
|
NKD inhibitor of WNT signaling pathway 2 |
| chr9_+_79572715 | 2.12 |
ENST00000265284.10
|
TLE4
|
TLE family member 4, transcriptional corepressor |
| chr7_+_48089257 | 2.12 |
ENST00000436673.5
ENST00000395564.9 |
UPP1
|
uridine phosphorylase 1 |
| chr15_-_38564635 | 2.11 |
ENST00000450598.6
ENST00000559830.5 ENST00000558164.5 ENST00000539159.5 ENST00000310803.10 |
RASGRP1
|
RAS guanyl releasing protein 1 |
| chr4_+_54657918 | 2.11 |
ENST00000412167.6
ENST00000288135.6 |
KIT
|
KIT proto-oncogene, receptor tyrosine kinase |
| chr8_-_80171106 | 2.10 |
ENST00000519303.6
|
TPD52
|
tumor protein D52 |
| chr20_-_48827992 | 2.10 |
ENST00000371941.4
|
PREX1
|
phosphatidylinositol-3,4,5-trisphosphate dependent Rac exchange factor 1 |
| chr2_-_159798043 | 2.08 |
ENST00000664982.1
ENST00000259053.6 |
ENSG00000287091.1
CD302
|
novel transcript, sense intronic to CD302and LY75-CD302 CD302 molecule |
| chr11_+_33376077 | 2.08 |
ENST00000658780.2
|
KIAA1549L
|
KIAA1549 like |
| chr17_+_83079595 | 2.07 |
ENST00000320095.12
|
METRNL
|
meteorin like, glial cell differentiation regulator |
| chr9_-_14322320 | 2.06 |
ENST00000606230.2
|
NFIB
|
nuclear factor I B |
| chr12_+_93571664 | 2.05 |
ENST00000622746.4
ENST00000548537.1 |
SOCS2
|
suppressor of cytokine signaling 2 |
| chr17_-_78782257 | 2.05 |
ENST00000591455.5
ENST00000446868.7 ENST00000361101.8 ENST00000589296.5 |
CYTH1
|
cytohesin 1 |
| chr5_+_10564064 | 2.04 |
ENST00000296657.7
|
ANKRD33B
|
ankyrin repeat domain 33B |
| chr4_-_76213724 | 2.04 |
ENST00000639738.1
|
SCARB2
|
scavenger receptor class B member 2 |
| chr19_+_680707 | 2.03 |
ENST00000592947.5
ENST00000588773.5 ENST00000591573.1 ENST00000605925.3 |
FSTL3
|
follistatin like 3 |
| chr6_+_125790922 | 2.02 |
ENST00000453302.5
ENST00000417494.5 ENST00000392477.7 ENST00000229634.13 |
NCOA7
|
nuclear receptor coactivator 7 |
| chr14_+_103123452 | 2.02 |
ENST00000558056.1
ENST00000560869.6 |
TNFAIP2
|
TNF alpha induced protein 2 |
| chr1_-_21937300 | 2.01 |
ENST00000374695.8
|
HSPG2
|
heparan sulfate proteoglycan 2 |
| chr6_+_17393576 | 2.01 |
ENST00000229922.7
ENST00000611958.4 |
CAP2
|
cyclase associated actin cytoskeleton regulatory protein 2 |
| chr11_+_125164743 | 2.00 |
ENST00000298282.14
|
PKNOX2
|
PBX/knotted 1 homeobox 2 |
| chr16_+_4316052 | 2.00 |
ENST00000433375.2
|
GLIS2
|
GLIS family zinc finger 2 |
| chr11_+_68312542 | 2.00 |
ENST00000294304.12
|
LRP5
|
LDL receptor related protein 5 |
| chr1_+_153775357 | 1.99 |
ENST00000624995.4
|
SLC27A3
|
solute carrier family 27 member 3 |
| chr16_-_30096170 | 1.98 |
ENST00000566134.5
ENST00000565110.5 ENST00000398841.6 ENST00000398838.8 |
YPEL3
|
yippee like 3 |
| chrX_+_136147465 | 1.98 |
ENST00000651929.2
|
FHL1
|
four and a half LIM domains 1 |
| chr3_-_71753582 | 1.98 |
ENST00000295612.7
|
EIF4E3
|
eukaryotic translation initiation factor 4E family member 3 |
| chr22_-_42720813 | 1.97 |
ENST00000381278.4
|
A4GALT
|
alpha 1,4-galactosyltransferase (P blood group) |
| chr6_+_30884063 | 1.97 |
ENST00000511510.5
ENST00000376569.7 ENST00000376570.8 ENST00000504927.5 |
DDR1
|
discoidin domain receptor tyrosine kinase 1 |
| chr13_+_31846713 | 1.97 |
ENST00000645780.1
|
FRY
|
FRY microtubule binding protein |
| chr13_-_21459226 | 1.97 |
ENST00000320220.13
|
ZDHHC20
|
zinc finger DHHC-type palmitoyltransferase 20 |
| chr19_-_14090695 | 1.96 |
ENST00000533683.7
|
SAMD1
|
sterile alpha motif domain containing 1 |
| chr1_+_89524871 | 1.96 |
ENST00000639264.1
|
LRRC8B
|
leucine rich repeat containing 8 VRAC subunit B |
| chr2_+_241558716 | 1.96 |
ENST00000318407.5
|
BOK
|
BCL2 family apoptosis regulator BOK |
Gene Ontology Analysis
Gene overrepresentation in biological process category:
| Log-likelihood per target | Total log-likelihood | Term | Description |
|---|---|---|---|
| 3.2 | 12.6 | GO:1905205 | positive regulation of connective tissue replacement(GO:1905205) |
| 2.9 | 8.7 | GO:0060086 | circadian temperature homeostasis(GO:0060086) |
| 2.0 | 2.0 | GO:0060994 | regulation of transcription from RNA polymerase II promoter involved in kidney development(GO:0060994) |
| 1.9 | 5.8 | GO:2000754 | regulation of phospholipid scramblase activity(GO:1900161) positive regulation of phospholipid scramblase activity(GO:1900163) regulation of glucosylceramide catabolic process(GO:2000752) positive regulation of glucosylceramide catabolic process(GO:2000753) regulation of sphingomyelin catabolic process(GO:2000754) positive regulation of sphingomyelin catabolic process(GO:2000755) |
| 1.9 | 1.9 | GO:2000137 | negative regulation of cell proliferation involved in heart morphogenesis(GO:2000137) |
| 1.6 | 6.6 | GO:1904381 | Golgi apparatus mannose trimming(GO:1904381) |
| 1.4 | 7.2 | GO:0035990 | tendon cell differentiation(GO:0035990) tendon formation(GO:0035992) |
| 1.4 | 4.3 | GO:0060139 | positive regulation by symbiont of host apoptotic process(GO:0052151) positive regulation of apoptotic process by virus(GO:0060139) |
| 1.4 | 4.2 | GO:1904897 | regulation of hepatic stellate cell proliferation(GO:1904897) positive regulation of hepatic stellate cell proliferation(GO:1904899) hepatic stellate cell proliferation(GO:1990922) |
| 1.4 | 4.2 | GO:0072254 | metanephric mesangial cell differentiation(GO:0072209) metanephric glomerular mesangial cell differentiation(GO:0072254) |
| 1.3 | 9.2 | GO:0010641 | positive regulation of platelet-derived growth factor receptor signaling pathway(GO:0010641) |
| 1.3 | 2.6 | GO:1905064 | negative regulation of vascular smooth muscle cell differentiation(GO:1905064) |
| 1.3 | 1.3 | GO:0031443 | fast-twitch skeletal muscle fiber contraction(GO:0031443) |
| 1.2 | 8.5 | GO:1905123 | regulation of glucosylceramidase activity(GO:1905123) |
| 1.2 | 6.0 | GO:0014886 | transition between slow and fast fiber(GO:0014886) |
| 1.2 | 4.7 | GO:1900127 | positive regulation of hyaluronan biosynthetic process(GO:1900127) |
| 1.1 | 6.7 | GO:0006021 | inositol biosynthetic process(GO:0006021) |
| 1.1 | 3.2 | GO:0034395 | regulation of transcription from RNA polymerase II promoter in response to iron(GO:0034395) |
| 1.0 | 1.0 | GO:0021840 | directional guidance of interneurons involved in migration from the subpallium to the cortex(GO:0021840) chemorepulsion involved in interneuron migration from the subpallium to the cortex(GO:0021842) |
| 1.0 | 3.0 | GO:0036304 | umbilical cord morphogenesis(GO:0036304) umbilical cord development(GO:0061027) |
| 1.0 | 6.9 | GO:0090210 | regulation of establishment of blood-brain barrier(GO:0090210) |
| 1.0 | 2.9 | GO:0021793 | chemorepulsion of branchiomotor axon(GO:0021793) |
| 1.0 | 2.9 | GO:1904772 | hepatocyte homeostasis(GO:0036333) response to tetrachloromethane(GO:1904772) |
| 1.0 | 2.9 | GO:1903400 | L-arginine transmembrane transport(GO:1903400) |
| 0.9 | 5.7 | GO:0032252 | secretory granule localization(GO:0032252) |
| 0.9 | 10.4 | GO:2000795 | negative regulation of epithelial cell proliferation involved in lung morphogenesis(GO:2000795) |
| 0.9 | 3.7 | GO:0060611 | positive regulation of odontogenesis of dentin-containing tooth(GO:0042488) mammary gland fat development(GO:0060611) positive regulation of macrophage colony-stimulating factor signaling pathway(GO:1902228) positive regulation of response to macrophage colony-stimulating factor(GO:1903971) positive regulation of cellular response to macrophage colony-stimulating factor stimulus(GO:1903974) positive regulation of microglial cell migration(GO:1904141) |
| 0.9 | 2.8 | GO:1902460 | regulation of mesenchymal stem cell proliferation(GO:1902460) positive regulation of mesenchymal stem cell proliferation(GO:1902462) |
| 0.9 | 2.7 | GO:0097252 | oligodendrocyte apoptotic process(GO:0097252) |
| 0.9 | 2.7 | GO:0046108 | uridine metabolic process(GO:0046108) |
| 0.9 | 3.5 | GO:0003409 | optic cup structural organization(GO:0003409) |
| 0.9 | 3.4 | GO:0090076 | relaxation of skeletal muscle(GO:0090076) |
| 0.9 | 2.6 | GO:0002416 | IgG immunoglobulin transcytosis in epithelial cells mediated by FcRn immunoglobulin receptor(GO:0002416) |
| 0.8 | 2.5 | GO:1901301 | regulation of cargo loading into COPII-coated vesicle(GO:1901301) |
| 0.8 | 4.2 | GO:0001575 | globoside metabolic process(GO:0001575) |
| 0.8 | 2.5 | GO:0097360 | chorionic trophoblast cell proliferation(GO:0097360) regulation of chorionic trophoblast cell proliferation(GO:1901382) |
| 0.8 | 5.7 | GO:0018211 | protein C-linked glycosylation(GO:0018103) peptidyl-tryptophan modification(GO:0018211) protein C-linked glycosylation via tryptophan(GO:0018317) protein C-linked glycosylation via 2'-alpha-mannosyl-L-tryptophan(GO:0018406) |
| 0.8 | 2.5 | GO:0042939 | glutathione transport(GO:0034635) tripeptide transport(GO:0042939) |
| 0.8 | 0.8 | GO:0003130 | BMP signaling pathway involved in heart induction(GO:0003130) endodermal-mesodermal cell signaling(GO:0003133) endodermal-mesodermal cell signaling involved in heart induction(GO:0003134) |
| 0.8 | 3.3 | GO:1904428 | negative regulation of tubulin deacetylation(GO:1904428) |
| 0.8 | 3.2 | GO:0009447 | putrescine catabolic process(GO:0009447) |
| 0.8 | 2.4 | GO:0019413 | acetate biosynthetic process(GO:0019413) acetyl-CoA biosynthetic process from acetate(GO:0019427) propionate biosynthetic process(GO:0019542) |
| 0.8 | 2.4 | GO:0070662 | mast cell proliferation(GO:0070662) |
| 0.8 | 2.4 | GO:0015917 | aminophospholipid transport(GO:0015917) |
| 0.8 | 2.4 | GO:0090038 | negative regulation of protein kinase C signaling(GO:0090038) |
| 0.8 | 7.2 | GO:0032511 | late endosome to vacuole transport via multivesicular body sorting pathway(GO:0032511) |
| 0.8 | 2.3 | GO:0043000 | Golgi to plasma membrane CFTR protein transport(GO:0043000) |
| 0.8 | 3.9 | GO:0043988 | histone H3-S28 phosphorylation(GO:0043988) |
| 0.7 | 3.0 | GO:1900224 | positive regulation of nodal signaling pathway involved in determination of lateral mesoderm left/right asymmetry(GO:1900224) |
| 0.7 | 0.7 | GO:0014004 | microglia differentiation(GO:0014004) microglia development(GO:0014005) |
| 0.7 | 1.4 | GO:2000562 | negative regulation of CD4-positive, alpha-beta T cell proliferation(GO:2000562) |
| 0.7 | 2.9 | GO:0006542 | glutamine biosynthetic process(GO:0006542) |
| 0.7 | 2.2 | GO:0015920 | lipopolysaccharide transport(GO:0015920) |
| 0.7 | 2.1 | GO:1903892 | negative regulation of ATF6-mediated unfolded protein response(GO:1903892) |
| 0.7 | 7.9 | GO:0030050 | vesicle transport along actin filament(GO:0030050) |
| 0.7 | 2.8 | GO:0042091 | interleukin-10 biosynthetic process(GO:0042091) regulation of interleukin-10 biosynthetic process(GO:0045074) |
| 0.7 | 2.8 | GO:0015910 | peroxisomal long-chain fatty acid import(GO:0015910) |
| 0.7 | 2.1 | GO:0030327 | prenylated protein catabolic process(GO:0030327) |
| 0.7 | 3.5 | GO:0002019 | regulation of renal output by angiotensin(GO:0002019) |
| 0.7 | 1.4 | GO:0061198 | fungiform papilla formation(GO:0061198) |
| 0.7 | 2.1 | GO:0072308 | negative regulation by virus of viral protein levels in host cell(GO:0046725) negative regulation of metanephric nephron tubule epithelial cell differentiation(GO:0072308) |
| 0.7 | 2.1 | GO:0001560 | regulation of cell growth by extracellular stimulus(GO:0001560) |
| 0.7 | 5.5 | GO:0090625 | mRNA cleavage involved in gene silencing by siRNA(GO:0090625) |
| 0.7 | 5.4 | GO:0038028 | insulin receptor signaling pathway via phosphatidylinositol 3-kinase(GO:0038028) |
| 0.7 | 0.7 | GO:0070384 | Harderian gland development(GO:0070384) |
| 0.7 | 2.6 | GO:0070378 | positive regulation of ERK5 cascade(GO:0070378) |
| 0.6 | 3.9 | GO:0090116 | C-5 methylation of cytosine(GO:0090116) |
| 0.6 | 3.8 | GO:0044332 | Wnt signaling pathway involved in dorsal/ventral axis specification(GO:0044332) |
| 0.6 | 1.9 | GO:0061394 | regulation of transcription from RNA polymerase II promoter in response to arsenic-containing substance(GO:0061394) |
| 0.6 | 2.5 | GO:0033306 | phytol metabolic process(GO:0033306) fatty alcohol metabolic process(GO:1903173) |
| 0.6 | 2.4 | GO:1990535 | neuron projection maintenance(GO:1990535) |
| 0.6 | 4.3 | GO:2000546 | positive regulation of cell chemotaxis to fibroblast growth factor(GO:1904849) positive regulation of endothelial cell chemotaxis to fibroblast growth factor(GO:2000546) |
| 0.6 | 2.4 | GO:0006172 | ADP biosynthetic process(GO:0006172) |
| 0.6 | 1.7 | GO:0035674 | tricarboxylic acid transmembrane transport(GO:0035674) |
| 0.6 | 4.1 | GO:0030421 | defecation(GO:0030421) |
| 0.6 | 4.6 | GO:0016129 | phytosteroid metabolic process(GO:0016128) phytosteroid biosynthetic process(GO:0016129) |
| 0.6 | 5.8 | GO:0008063 | Toll signaling pathway(GO:0008063) |
| 0.6 | 1.1 | GO:0075509 | receptor-mediated endocytosis of virus by host cell(GO:0019065) endocytosis involved in viral entry into host cell(GO:0075509) |
| 0.6 | 5.1 | GO:0061302 | smooth muscle cell-matrix adhesion(GO:0061302) |
| 0.6 | 2.8 | GO:0002357 | defense response to tumor cell(GO:0002357) |
| 0.6 | 1.7 | GO:0097187 | dentinogenesis(GO:0097187) |
| 0.6 | 2.2 | GO:0021965 | spinal cord ventral commissure morphogenesis(GO:0021965) |
| 0.6 | 8.3 | GO:0010578 | regulation of adenylate cyclase activity involved in G-protein coupled receptor signaling pathway(GO:0010578) positive regulation of adenylate cyclase activity involved in G-protein coupled receptor signaling pathway(GO:0010579) |
| 0.5 | 2.2 | GO:1903788 | mycotoxin catabolic process(GO:0043387) aflatoxin catabolic process(GO:0046223) organic heteropentacyclic compound catabolic process(GO:1901377) regulation of glutathione biosynthetic process(GO:1903786) positive regulation of glutathione biosynthetic process(GO:1903788) |
| 0.5 | 1.6 | GO:0001544 | initiation of primordial ovarian follicle growth(GO:0001544) |
| 0.5 | 2.1 | GO:0009439 | cyanate metabolic process(GO:0009439) cyanate catabolic process(GO:0009440) |
| 0.5 | 2.1 | GO:1900041 | negative regulation of interleukin-2 secretion(GO:1900041) |
| 0.5 | 5.7 | GO:1990791 | dorsal root ganglion development(GO:1990791) |
| 0.5 | 2.1 | GO:0090045 | positive regulation of deacetylase activity(GO:0090045) |
| 0.5 | 1.5 | GO:0036486 | trunk segmentation(GO:0035290) trunk neural crest cell migration(GO:0036484) ventral trunk neural crest cell migration(GO:0036486) |
| 0.5 | 2.5 | GO:0018243 | protein O-linked glycosylation via threonine(GO:0018243) |
| 0.5 | 2.5 | GO:0034959 | substance P catabolic process(GO:0010814) calcitonin catabolic process(GO:0010816) endothelin maturation(GO:0034959) |
| 0.5 | 2.5 | GO:1901350 | cell-cell signaling involved in cell-cell junction organization(GO:1901350) |
| 0.5 | 5.4 | GO:0038033 | positive regulation of endothelial cell chemotaxis by VEGF-activated vascular endothelial growth factor receptor signaling pathway(GO:0038033) |
| 0.5 | 1.0 | GO:0061188 | regulation of chromatin silencing at rDNA(GO:0061187) negative regulation of chromatin silencing at rDNA(GO:0061188) |
| 0.5 | 4.4 | GO:0060244 | negative regulation of cell proliferation involved in contact inhibition(GO:0060244) |
| 0.5 | 2.4 | GO:0032485 | Ral protein signal transduction(GO:0032484) regulation of Ral protein signal transduction(GO:0032485) |
| 0.5 | 1.4 | GO:0032417 | positive regulation of sodium:proton antiporter activity(GO:0032417) |
| 0.5 | 0.5 | GO:0010616 | negative regulation of cardiac muscle adaptation(GO:0010616) negative regulation of cardiac muscle hypertrophy in response to stress(GO:1903243) |
| 0.5 | 2.8 | GO:1901908 | diadenosine polyphosphate catabolic process(GO:0015961) diphosphoinositol polyphosphate metabolic process(GO:0071543) diadenosine pentaphosphate metabolic process(GO:1901906) diadenosine pentaphosphate catabolic process(GO:1901907) diadenosine hexaphosphate metabolic process(GO:1901908) diadenosine hexaphosphate catabolic process(GO:1901909) adenosine 5'-(hexahydrogen pentaphosphate) metabolic process(GO:1901910) adenosine 5'-(hexahydrogen pentaphosphate) catabolic process(GO:1901911) |
| 0.5 | 1.9 | GO:1900276 | regulation of proteinase activated receptor activity(GO:1900276) negative regulation of phospholipase C-activating G-protein coupled receptor signaling pathway(GO:1900737) |
| 0.5 | 3.2 | GO:0060715 | syncytiotrophoblast cell differentiation involved in labyrinthine layer development(GO:0060715) |
| 0.5 | 3.6 | GO:0007506 | gonadal mesoderm development(GO:0007506) |
| 0.5 | 0.9 | GO:0086021 | SA node cell to atrial cardiac muscle cell communication by electrical coupling(GO:0086021) |
| 0.4 | 3.1 | GO:0097338 | response to clozapine(GO:0097338) |
| 0.4 | 0.4 | GO:0006083 | acetate metabolic process(GO:0006083) |
| 0.4 | 1.3 | GO:0032474 | otolith morphogenesis(GO:0032474) |
| 0.4 | 0.4 | GO:0046878 | positive regulation of saliva secretion(GO:0046878) |
| 0.4 | 1.3 | GO:0046081 | dUTP metabolic process(GO:0046080) dUTP catabolic process(GO:0046081) |
| 0.4 | 1.3 | GO:0002316 | follicular B cell differentiation(GO:0002316) |
| 0.4 | 0.4 | GO:0021644 | vagus nerve morphogenesis(GO:0021644) |
| 0.4 | 1.7 | GO:0006663 | platelet activating factor biosynthetic process(GO:0006663) |
| 0.4 | 1.3 | GO:0031508 | pericentric heterochromatin assembly(GO:0031508) |
| 0.4 | 2.1 | GO:0008611 | ether lipid biosynthetic process(GO:0008611) glycerol ether biosynthetic process(GO:0046504) cellular lipid biosynthetic process(GO:0097384) ether biosynthetic process(GO:1901503) |
| 0.4 | 5.1 | GO:2001200 | positive regulation of dendritic cell differentiation(GO:2001200) |
| 0.4 | 1.7 | GO:0036146 | cellular response to mycotoxin(GO:0036146) |
| 0.4 | 7.7 | GO:0032926 | negative regulation of activin receptor signaling pathway(GO:0032926) |
| 0.4 | 3.8 | GO:2000601 | positive regulation of Arp2/3 complex-mediated actin nucleation(GO:2000601) |
| 0.4 | 0.8 | GO:0051097 | negative regulation of helicase activity(GO:0051097) |
| 0.4 | 2.1 | GO:0098904 | regulation of AV node cell action potential(GO:0098904) |
| 0.4 | 1.3 | GO:0044725 | chromatin reprogramming in the zygote(GO:0044725) |
| 0.4 | 4.6 | GO:0090336 | positive regulation of brown fat cell differentiation(GO:0090336) |
| 0.4 | 1.7 | GO:0090191 | negative regulation of branching involved in ureteric bud morphogenesis(GO:0090191) |
| 0.4 | 1.7 | GO:0071110 | protein biotinylation(GO:0009305) histone biotinylation(GO:0071110) |
| 0.4 | 2.5 | GO:0048861 | leukemia inhibitory factor signaling pathway(GO:0048861) |
| 0.4 | 1.2 | GO:0042727 | flavin-containing compound biosynthetic process(GO:0042727) |
| 0.4 | 1.6 | GO:0021592 | fourth ventricle development(GO:0021592) |
| 0.4 | 0.8 | GO:0015959 | diadenosine polyphosphate metabolic process(GO:0015959) |
| 0.4 | 2.4 | GO:0032487 | regulation of Rap protein signal transduction(GO:0032487) |
| 0.4 | 5.2 | GO:0031580 | membrane raft polarization(GO:0001766) membrane raft distribution(GO:0031580) |
| 0.4 | 1.2 | GO:0090118 | receptor-mediated endocytosis of low-density lipoprotein particle involved in cholesterol transport(GO:0090118) |
| 0.4 | 1.2 | GO:0015882 | L-ascorbic acid transport(GO:0015882) transepithelial L-ascorbic acid transport(GO:0070904) |
| 0.4 | 1.2 | GO:0061727 | methylglyoxal catabolic process to D-lactate via S-lactoyl-glutathione(GO:0019243) methylglyoxal catabolic process(GO:0051596) methylglyoxal catabolic process to lactate(GO:0061727) |
| 0.4 | 0.8 | GO:0001300 | chronological cell aging(GO:0001300) |
| 0.4 | 1.5 | GO:0046368 | GDP-L-fucose metabolic process(GO:0046368) |
| 0.4 | 4.2 | GO:0050861 | positive regulation of B cell receptor signaling pathway(GO:0050861) |
| 0.4 | 1.5 | GO:0090164 | asymmetric Golgi ribbon formation(GO:0090164) |
| 0.4 | 1.5 | GO:0046462 | monoacylglycerol metabolic process(GO:0046462) monoacylglycerol catabolic process(GO:0052651) |
| 0.4 | 0.4 | GO:0010730 | negative regulation of hydrogen peroxide biosynthetic process(GO:0010730) |
| 0.4 | 1.5 | GO:1903347 | negative regulation of bicellular tight junction assembly(GO:1903347) |
| 0.4 | 1.1 | GO:1900194 | negative regulation of oocyte maturation(GO:1900194) |
| 0.4 | 3.0 | GO:2000468 | regulation of peroxidase activity(GO:2000468) |
| 0.4 | 0.4 | GO:0036216 | response to stem cell factor(GO:0036215) cellular response to stem cell factor stimulus(GO:0036216) Kit signaling pathway(GO:0038109) |
| 0.4 | 1.5 | GO:0007181 | transforming growth factor beta receptor complex assembly(GO:0007181) |
| 0.4 | 3.3 | GO:1901725 | regulation of histone deacetylase activity(GO:1901725) |
| 0.4 | 1.1 | GO:0090271 | positive regulation of fibroblast growth factor production(GO:0090271) |
| 0.4 | 0.4 | GO:0090274 | regulation of somatostatin secretion(GO:0090273) positive regulation of somatostatin secretion(GO:0090274) |
| 0.4 | 3.7 | GO:0070673 | response to interleukin-18(GO:0070673) |
| 0.4 | 1.5 | GO:0010760 | negative regulation of macrophage chemotaxis(GO:0010760) |
| 0.4 | 4.0 | GO:0060352 | cell adhesion molecule production(GO:0060352) |
| 0.4 | 2.2 | GO:0010748 | regulation of plasma membrane long-chain fatty acid transport(GO:0010746) negative regulation of plasma membrane long-chain fatty acid transport(GO:0010748) |
| 0.4 | 4.8 | GO:0033210 | leptin-mediated signaling pathway(GO:0033210) |
| 0.4 | 0.7 | GO:0072179 | nephric duct formation(GO:0072179) |
| 0.4 | 4.0 | GO:0048386 | positive regulation of retinoic acid receptor signaling pathway(GO:0048386) |
| 0.4 | 1.8 | GO:0018076 | N-terminal peptidyl-lysine acetylation(GO:0018076) |
| 0.4 | 1.4 | GO:0001927 | exocyst assembly(GO:0001927) |
| 0.4 | 1.1 | GO:0061580 | colon epithelial cell migration(GO:0061580) |
| 0.4 | 2.8 | GO:0034773 | histone H4-K20 trimethylation(GO:0034773) |
| 0.4 | 1.1 | GO:1905247 | regulation of aspartic-type endopeptidase activity involved in amyloid precursor protein catabolic process(GO:1902959) positive regulation of aspartic-type endopeptidase activity involved in amyloid precursor protein catabolic process(GO:1902961) regulation of aspartic-type peptidase activity(GO:1905245) positive regulation of aspartic-type peptidase activity(GO:1905247) |
| 0.4 | 3.2 | GO:1905206 | positive regulation of hydrogen peroxide-induced cell death(GO:1905206) |
| 0.4 | 1.1 | GO:1990926 | short-term synaptic potentiation(GO:1990926) |
| 0.4 | 0.7 | GO:0009405 | pathogenesis(GO:0009405) |
| 0.3 | 0.7 | GO:1904048 | regulation of spontaneous neurotransmitter secretion(GO:1904048) |
| 0.3 | 4.2 | GO:0036089 | cleavage furrow formation(GO:0036089) |
| 0.3 | 2.4 | GO:0070537 | histone H2A K63-linked deubiquitination(GO:0070537) |
| 0.3 | 12.1 | GO:0090083 | regulation of inclusion body assembly(GO:0090083) |
| 0.3 | 1.4 | GO:0044313 | protein K6-linked deubiquitination(GO:0044313) |
| 0.3 | 3.4 | GO:0042985 | negative regulation of amyloid precursor protein biosynthetic process(GO:0042985) |
| 0.3 | 1.0 | GO:0051793 | medium-chain fatty acid catabolic process(GO:0051793) |
| 0.3 | 0.7 | GO:0071284 | cellular response to lead ion(GO:0071284) |
| 0.3 | 1.0 | GO:0035574 | histone H4-K20 demethylation(GO:0035574) |
| 0.3 | 5.7 | GO:0015871 | choline transport(GO:0015871) |
| 0.3 | 4.4 | GO:0090168 | Golgi reassembly(GO:0090168) |
| 0.3 | 2.7 | GO:0048170 | positive regulation of long-term neuronal synaptic plasticity(GO:0048170) |
| 0.3 | 1.7 | GO:1902255 | positive regulation of intrinsic apoptotic signaling pathway by p53 class mediator(GO:1902255) |
| 0.3 | 0.7 | GO:2000834 | androgen secretion(GO:0035935) regulation of androgen secretion(GO:2000834) positive regulation of androgen secretion(GO:2000836) |
| 0.3 | 1.0 | GO:0006679 | glucosylceramide biosynthetic process(GO:0006679) |
| 0.3 | 3.3 | GO:1904996 | positive regulation of leukocyte adhesion to vascular endothelial cell(GO:1904996) |
| 0.3 | 3.0 | GO:0000395 | mRNA 5'-splice site recognition(GO:0000395) |
| 0.3 | 3.9 | GO:0042492 | gamma-delta T cell differentiation(GO:0042492) |
| 0.3 | 1.3 | GO:0061034 | olfactory bulb mitral cell layer development(GO:0061034) |
| 0.3 | 1.0 | GO:0098746 | fast, calcium ion-dependent exocytosis of neurotransmitter(GO:0098746) |
| 0.3 | 0.6 | GO:0003221 | right ventricular cardiac muscle tissue morphogenesis(GO:0003221) |
| 0.3 | 1.6 | GO:2000286 | receptor internalization involved in canonical Wnt signaling pathway(GO:2000286) |
| 0.3 | 1.0 | GO:0042412 | taurine biosynthetic process(GO:0042412) |
| 0.3 | 1.6 | GO:0002678 | positive regulation of chronic inflammatory response(GO:0002678) |
| 0.3 | 1.0 | GO:0002528 | regulation of vascular permeability involved in acute inflammatory response(GO:0002528) |
| 0.3 | 1.0 | GO:0060268 | negative regulation of respiratory burst(GO:0060268) |
| 0.3 | 1.6 | GO:0016480 | negative regulation of transcription from RNA polymerase III promoter(GO:0016480) |
| 0.3 | 1.0 | GO:0006212 | uracil catabolic process(GO:0006212) |
| 0.3 | 1.0 | GO:2000564 | CD8-positive, alpha-beta T cell proliferation(GO:0035740) regulation of CD8-positive, alpha-beta T cell proliferation(GO:2000564) |
| 0.3 | 2.8 | GO:0019064 | fusion of virus membrane with host plasma membrane(GO:0019064) membrane fusion involved in viral entry into host cell(GO:0039663) multi-organism membrane fusion(GO:0044800) |
| 0.3 | 0.6 | GO:0002302 | CD8-positive, alpha-beta T cell differentiation involved in immune response(GO:0002302) |
| 0.3 | 0.3 | GO:0072709 | cellular response to sorbitol(GO:0072709) |
| 0.3 | 0.6 | GO:0003273 | cell migration involved in endocardial cushion formation(GO:0003273) |
| 0.3 | 1.6 | GO:0045079 | negative regulation of chemokine biosynthetic process(GO:0045079) |
| 0.3 | 1.9 | GO:0070495 | regulation of thrombin receptor signaling pathway(GO:0070494) negative regulation of thrombin receptor signaling pathway(GO:0070495) |
| 0.3 | 0.6 | GO:0051040 | regulation of calcium-independent cell-cell adhesion(GO:0051040) |
| 0.3 | 0.9 | GO:0046338 | phosphatidylethanolamine catabolic process(GO:0046338) |
| 0.3 | 2.5 | GO:0072178 | nephric duct morphogenesis(GO:0072178) |
| 0.3 | 0.3 | GO:1900084 | regulation of peptidyl-tyrosine autophosphorylation(GO:1900084) |
| 0.3 | 0.6 | GO:0007231 | osmosensory signaling pathway(GO:0007231) |
| 0.3 | 3.4 | GO:0048251 | elastic fiber assembly(GO:0048251) |
| 0.3 | 1.8 | GO:0044339 | canonical Wnt signaling pathway involved in osteoblast differentiation(GO:0044339) |
| 0.3 | 2.1 | GO:0034316 | negative regulation of Arp2/3 complex-mediated actin nucleation(GO:0034316) |
| 0.3 | 0.3 | GO:0023021 | termination of signal transduction(GO:0023021) |
| 0.3 | 0.3 | GO:0070433 | negative regulation of nucleotide-binding oligomerization domain containing signaling pathway(GO:0070425) negative regulation of nucleotide-binding oligomerization domain containing 2 signaling pathway(GO:0070433) |
| 0.3 | 0.6 | GO:0072197 | ureter morphogenesis(GO:0072197) |
| 0.3 | 0.9 | GO:0014876 | response to injury involved in regulation of muscle adaptation(GO:0014876) |
| 0.3 | 6.0 | GO:0040015 | negative regulation of multicellular organism growth(GO:0040015) |
| 0.3 | 0.9 | GO:0050717 | positive regulation of interleukin-1 alpha secretion(GO:0050717) |
| 0.3 | 17.2 | GO:0033173 | calcineurin-NFAT signaling cascade(GO:0033173) |
| 0.3 | 2.7 | GO:0098582 | innate vocalization behavior(GO:0098582) |
| 0.3 | 1.2 | GO:0033489 | cholesterol biosynthetic process via desmosterol(GO:0033489) cholesterol biosynthetic process via lathosterol(GO:0033490) |
| 0.3 | 4.1 | GO:1904424 | regulation of GTP binding(GO:1904424) |
| 0.3 | 1.5 | GO:0033088 | negative regulation of immature T cell proliferation in thymus(GO:0033088) |
| 0.3 | 0.6 | GO:0060978 | angiogenesis involved in coronary vascular morphogenesis(GO:0060978) |
| 0.3 | 1.5 | GO:0015692 | lead ion transport(GO:0015692) |
| 0.3 | 6.7 | GO:0034138 | toll-like receptor 3 signaling pathway(GO:0034138) |
| 0.3 | 0.6 | GO:0042270 | protection from natural killer cell mediated cytotoxicity(GO:0042270) |
| 0.3 | 1.8 | GO:0060754 | positive regulation of mast cell chemotaxis(GO:0060754) |
| 0.3 | 13.7 | GO:0048384 | retinoic acid receptor signaling pathway(GO:0048384) |
| 0.3 | 0.9 | GO:0050992 | dimethylallyl diphosphate biosynthetic process(GO:0050992) dimethylallyl diphosphate metabolic process(GO:0050993) |
| 0.3 | 0.9 | GO:1900169 | regulation of glucocorticoid mediated signaling pathway(GO:1900169) |
| 0.3 | 0.6 | GO:0036149 | phosphatidylinositol acyl-chain remodeling(GO:0036149) |
| 0.3 | 2.0 | GO:0033578 | protein glycosylation in Golgi(GO:0033578) |
| 0.3 | 1.7 | GO:0016036 | cellular response to phosphate starvation(GO:0016036) positive regulation of sulfur amino acid metabolic process(GO:0031337) negative regulation of catecholamine metabolic process(GO:0045914) negative regulation of dopamine metabolic process(GO:0045963) positive regulation of homocysteine metabolic process(GO:0050668) |
| 0.3 | 1.4 | GO:0044857 | plasma membrane raft assembly(GO:0044854) plasma membrane raft organization(GO:0044857) caveola assembly(GO:0070836) |
| 0.3 | 2.8 | GO:0045176 | apical protein localization(GO:0045176) |
| 0.3 | 1.1 | GO:1904245 | regulation of polynucleotide adenylyltransferase activity(GO:1904245) |
| 0.3 | 0.6 | GO:0072011 | glomerular endothelium development(GO:0072011) |
| 0.3 | 4.2 | GO:2001256 | regulation of store-operated calcium entry(GO:2001256) |
| 0.3 | 0.6 | GO:0003331 | regulation of extracellular matrix constituent secretion(GO:0003330) positive regulation of extracellular matrix constituent secretion(GO:0003331) |
| 0.3 | 1.7 | GO:1904684 | negative regulation of metalloendopeptidase activity(GO:1904684) |
| 0.3 | 0.8 | GO:1990737 | response to manganese-induced endoplasmic reticulum stress(GO:1990737) |
| 0.3 | 0.6 | GO:2000192 | negative regulation of fatty acid transport(GO:2000192) |
| 0.3 | 1.4 | GO:0051135 | positive regulation of NK T cell activation(GO:0051135) |
| 0.3 | 1.4 | GO:1901202 | negative regulation of extracellular matrix assembly(GO:1901202) |
| 0.3 | 0.8 | GO:1902365 | regulation of spindle elongation(GO:0032887) regulation of mitotic spindle elongation(GO:0032888) anastral spindle assembly(GO:0055048) protein localization to spindle pole body(GO:0071988) regulation of protein localization to spindle pole body(GO:1902363) positive regulation of protein localization to spindle pole body(GO:1902365) positive regulation of mitotic spindle elongation(GO:1902846) |
| 0.3 | 4.3 | GO:0040032 | post-embryonic body morphogenesis(GO:0040032) regulation of parathyroid hormone secretion(GO:2000828) |
| 0.3 | 1.4 | GO:0003065 | positive regulation of heart rate by epinephrine(GO:0003065) negative regulation of vascular associated smooth muscle cell migration(GO:1904753) |
| 0.3 | 3.2 | GO:0048625 | myoblast fate commitment(GO:0048625) |
| 0.3 | 1.1 | GO:0097089 | methyl-branched fatty acid metabolic process(GO:0097089) |
| 0.3 | 0.3 | GO:0006113 | fermentation(GO:0006113) regulation of fermentation(GO:0043465) |
| 0.3 | 1.6 | GO:0006196 | AMP catabolic process(GO:0006196) |
| 0.3 | 2.4 | GO:0006686 | sphingomyelin biosynthetic process(GO:0006686) |
| 0.3 | 4.5 | GO:1904778 | regulation of protein localization to cell cortex(GO:1904776) positive regulation of protein localization to cell cortex(GO:1904778) |
| 0.3 | 1.3 | GO:0051138 | positive regulation of NK T cell differentiation(GO:0051138) |
| 0.3 | 0.3 | GO:1904397 | negative regulation of neuromuscular junction development(GO:1904397) |
| 0.3 | 0.5 | GO:1902309 | negative regulation of peptidyl-serine dephosphorylation(GO:1902309) |
| 0.3 | 2.9 | GO:1902746 | regulation of lens fiber cell differentiation(GO:1902746) |
| 0.3 | 1.6 | GO:1903361 | protein localization to basolateral plasma membrane(GO:1903361) |
| 0.3 | 0.3 | GO:0003140 | determination of left/right asymmetry in lateral mesoderm(GO:0003140) |
| 0.3 | 0.8 | GO:0032776 | DNA methylation on cytosine(GO:0032776) |
| 0.3 | 2.1 | GO:2000586 | regulation of platelet-derived growth factor receptor-beta signaling pathway(GO:2000586) |
| 0.3 | 2.1 | GO:0097084 | vascular smooth muscle cell development(GO:0097084) |
| 0.3 | 1.0 | GO:0038018 | Wnt receptor catabolic process(GO:0038018) |
| 0.3 | 1.6 | GO:0060693 | regulation of branching involved in salivary gland morphogenesis(GO:0060693) |
| 0.3 | 0.3 | GO:0032902 | nerve growth factor production(GO:0032902) |
| 0.3 | 1.0 | GO:0018032 | protein amidation(GO:0018032) |
| 0.3 | 0.3 | GO:0071680 | response to indole-3-methanol(GO:0071680) cellular response to indole-3-methanol(GO:0071681) |
| 0.3 | 1.5 | GO:0075044 | autophagy of host cells involved in interaction with symbiont(GO:0075044) autophagy involved in symbiotic interaction(GO:0075071) |
| 0.3 | 4.4 | GO:2000480 | negative regulation of cAMP-dependent protein kinase activity(GO:2000480) |
| 0.3 | 2.3 | GO:0042373 | vitamin K metabolic process(GO:0042373) |
| 0.3 | 1.0 | GO:0048073 | regulation of eye pigmentation(GO:0048073) |
| 0.3 | 0.8 | GO:2000661 | positive regulation of interleukin-1-mediated signaling pathway(GO:2000661) |
| 0.3 | 0.3 | GO:0006668 | sphinganine-1-phosphate metabolic process(GO:0006668) |
| 0.3 | 0.8 | GO:2000176 | regulation of pro-T cell differentiation(GO:2000174) positive regulation of pro-T cell differentiation(GO:2000176) |
| 0.3 | 1.5 | GO:0034499 | late endosome to Golgi transport(GO:0034499) |
| 0.3 | 2.3 | GO:0032482 | Rab protein signal transduction(GO:0032482) |
| 0.3 | 0.8 | GO:1990637 | response to prolactin(GO:1990637) |
| 0.2 | 1.7 | GO:0048194 | Golgi vesicle budding(GO:0048194) |
| 0.2 | 0.7 | GO:0002086 | diaphragm contraction(GO:0002086) |
| 0.2 | 0.2 | GO:0060995 | cell-cell signaling involved in kidney development(GO:0060995) Wnt signaling pathway involved in kidney development(GO:0061289) canonical Wnt signaling pathway involved in metanephric kidney development(GO:0061290) cell-cell signaling involved in metanephros development(GO:0072204) |
| 0.2 | 6.2 | GO:0048268 | clathrin coat assembly(GO:0048268) |
| 0.2 | 0.7 | GO:0097680 | double-strand break repair via classical nonhomologous end joining(GO:0097680) |
| 0.2 | 0.7 | GO:0030505 | inorganic diphosphate transport(GO:0030505) |
| 0.2 | 1.7 | GO:0006931 | substrate-dependent cell migration, cell attachment to substrate(GO:0006931) |
| 0.2 | 1.7 | GO:0014916 | regulation of lung blood pressure(GO:0014916) |
| 0.2 | 1.0 | GO:0061762 | CAMKK-AMPK signaling cascade(GO:0061762) |
| 0.2 | 0.7 | GO:1901675 | negative regulation of histone H3-K27 acetylation(GO:1901675) |
| 0.2 | 1.2 | GO:0071802 | negative regulation of podosome assembly(GO:0071802) |
| 0.2 | 1.0 | GO:0045799 | positive regulation of chromatin assembly or disassembly(GO:0045799) |
| 0.2 | 1.5 | GO:0003415 | chondrocyte hypertrophy(GO:0003415) |
| 0.2 | 1.5 | GO:0038016 | insulin receptor internalization(GO:0038016) |
| 0.2 | 3.9 | GO:0042789 | mRNA transcription from RNA polymerase II promoter(GO:0042789) |
| 0.2 | 6.3 | GO:0072189 | ureter development(GO:0072189) |
| 0.2 | 0.7 | GO:0006097 | glyoxylate cycle(GO:0006097) |
| 0.2 | 1.4 | GO:1904016 | response to Thyroglobulin triiodothyronine(GO:1904016) |
| 0.2 | 0.7 | GO:0019287 | isopentenyl diphosphate biosynthetic process, mevalonate pathway(GO:0019287) |
| 0.2 | 1.2 | GO:0045634 | regulation of melanocyte differentiation(GO:0045634) |
| 0.2 | 1.2 | GO:0045204 | MAPK export from nucleus(GO:0045204) |
| 0.2 | 0.7 | GO:0070358 | actin polymerization-dependent cell motility(GO:0070358) |
| 0.2 | 2.1 | GO:1902527 | positive regulation of protein monoubiquitination(GO:1902527) |
| 0.2 | 1.2 | GO:1901662 | phylloquinone metabolic process(GO:0042374) phylloquinone catabolic process(GO:0042376) quinone catabolic process(GO:1901662) |
| 0.2 | 0.7 | GO:1904717 | excitatory chemical synaptic transmission(GO:0098976) regulation of AMPA glutamate receptor clustering(GO:1904717) positive regulation of AMPA glutamate receptor clustering(GO:1904719) |
| 0.2 | 1.6 | GO:0070560 | protein secretion by platelet(GO:0070560) |
| 0.2 | 2.6 | GO:1903944 | regulation of hepatocyte apoptotic process(GO:1903943) negative regulation of hepatocyte apoptotic process(GO:1903944) |
| 0.2 | 0.5 | GO:0007406 | negative regulation of neuroblast proliferation(GO:0007406) |
| 0.2 | 1.2 | GO:2001295 | malonyl-CoA biosynthetic process(GO:2001295) |
| 0.2 | 5.1 | GO:0034356 | NAD biosynthesis via nicotinamide riboside salvage pathway(GO:0034356) |
| 0.2 | 1.1 | GO:1902895 | positive regulation of pri-miRNA transcription from RNA polymerase II promoter(GO:1902895) |
| 0.2 | 1.4 | GO:0006574 | valine catabolic process(GO:0006574) |
| 0.2 | 0.9 | GO:0050822 | peptide stabilization(GO:0050822) peptide antigen stabilization(GO:0050823) |
| 0.2 | 1.1 | GO:0010533 | regulation of activation of Janus kinase activity(GO:0010533) |
| 0.2 | 0.2 | GO:0014718 | positive regulation of satellite cell activation involved in skeletal muscle regeneration(GO:0014718) |
| 0.2 | 0.7 | GO:0009720 | detection of hormone stimulus(GO:0009720) |
| 0.2 | 0.7 | GO:0060666 | dichotomous subdivision of terminal units involved in salivary gland branching(GO:0060666) |
| 0.2 | 0.7 | GO:0002582 | positive regulation of antigen processing and presentation of peptide or polysaccharide antigen via MHC class II(GO:0002582) positive regulation of antigen processing and presentation of peptide antigen(GO:0002585) positive regulation of antigen processing and presentation of peptide antigen via MHC class II(GO:0002588) |
| 0.2 | 0.2 | GO:0097676 | histone H3-K36 dimethylation(GO:0097676) |
| 0.2 | 0.5 | GO:0005988 | lactose metabolic process(GO:0005988) lactose biosynthetic process(GO:0005989) |
| 0.2 | 3.4 | GO:0015074 | DNA integration(GO:0015074) |
| 0.2 | 2.9 | GO:0032957 | inositol trisphosphate metabolic process(GO:0032957) |
| 0.2 | 1.6 | GO:0006269 | DNA replication, synthesis of RNA primer(GO:0006269) |
| 0.2 | 0.2 | GO:0035425 | autocrine signaling(GO:0035425) |
| 0.2 | 1.3 | GO:0033227 | dsRNA transport(GO:0033227) |
| 0.2 | 0.9 | GO:0098957 | anterograde axonal transport of mitochondrion(GO:0098957) |
| 0.2 | 0.7 | GO:0043490 | malate-aspartate shuttle(GO:0043490) |
| 0.2 | 0.9 | GO:0021691 | cerebellar Purkinje cell layer maturation(GO:0021691) |
| 0.2 | 0.9 | GO:0097069 | cellular response to thyroxine stimulus(GO:0097069) cellular response to L-phenylalanine derivative(GO:1904387) |
| 0.2 | 0.4 | GO:0071557 | histone H3-K27 demethylation(GO:0071557) |
| 0.2 | 0.4 | GO:0006740 | NADPH regeneration(GO:0006740) |
| 0.2 | 0.9 | GO:0008215 | spermine metabolic process(GO:0008215) |
| 0.2 | 2.6 | GO:0001731 | formation of translation preinitiation complex(GO:0001731) |
| 0.2 | 0.7 | GO:0006683 | galactosylceramide catabolic process(GO:0006683) |
| 0.2 | 0.2 | GO:0046709 | IDP metabolic process(GO:0046707) IDP catabolic process(GO:0046709) |
| 0.2 | 0.9 | GO:1902953 | positive regulation of ER to Golgi vesicle-mediated transport(GO:1902953) |
| 0.2 | 2.0 | GO:0051151 | negative regulation of smooth muscle cell differentiation(GO:0051151) |
| 0.2 | 1.3 | GO:0055005 | ventricular cardiac myofibril assembly(GO:0055005) |
| 0.2 | 2.0 | GO:0072307 | metanephric nephron tubule epithelial cell differentiation(GO:0072257) regulation of metanephric nephron tubule epithelial cell differentiation(GO:0072307) |
| 0.2 | 2.4 | GO:0030949 | positive regulation of vascular endothelial growth factor receptor signaling pathway(GO:0030949) |
| 0.2 | 0.4 | GO:0043335 | protein unfolding(GO:0043335) |
| 0.2 | 2.1 | GO:0043374 | CD8-positive, alpha-beta T cell differentiation(GO:0043374) |
| 0.2 | 0.2 | GO:0060931 | sinoatrial node cell development(GO:0060931) |
| 0.2 | 0.2 | GO:1903961 | positive regulation of anion channel activity(GO:1901529) positive regulation of anion transmembrane transport(GO:1903961) |
| 0.2 | 0.4 | GO:0002625 | regulation of T cell antigen processing and presentation(GO:0002625) |
| 0.2 | 0.4 | GO:0043382 | positive regulation of memory T cell differentiation(GO:0043382) |
| 0.2 | 1.5 | GO:0048050 | post-embryonic eye morphogenesis(GO:0048050) |
| 0.2 | 0.6 | GO:0033031 | neutrophil apoptotic process(GO:0001781) regulation of neutrophil apoptotic process(GO:0033029) positive regulation of neutrophil apoptotic process(GO:0033031) |
| 0.2 | 0.8 | GO:1904327 | protein localization to cytosolic proteasome complex(GO:1904327) protein localization to cytosolic proteasome complex involved in ERAD pathway(GO:1904379) |
| 0.2 | 2.9 | GO:0061179 | negative regulation of insulin secretion involved in cellular response to glucose stimulus(GO:0061179) |
| 0.2 | 0.8 | GO:0032916 | positive regulation of transforming growth factor beta3 production(GO:0032916) |
| 0.2 | 0.8 | GO:0090245 | axis elongation involved in somitogenesis(GO:0090245) |
| 0.2 | 7.0 | GO:0000301 | retrograde transport, vesicle recycling within Golgi(GO:0000301) |
| 0.2 | 5.4 | GO:0007216 | G-protein coupled glutamate receptor signaling pathway(GO:0007216) |
| 0.2 | 0.8 | GO:2000416 | regulation of eosinophil migration(GO:2000416) positive regulation of eosinophil migration(GO:2000418) |
| 0.2 | 1.6 | GO:0032525 | somite rostral/caudal axis specification(GO:0032525) |
| 0.2 | 0.8 | GO:0015770 | disaccharide transport(GO:0015766) sucrose transport(GO:0015770) oligosaccharide transport(GO:0015772) |
| 0.2 | 12.3 | GO:1904837 | beta-catenin-TCF complex assembly(GO:1904837) |
| 0.2 | 0.4 | GO:0075528 | induction by symbiont of host defense response(GO:0044416) induction of host immune response by virus(GO:0046730) active induction of host immune response by virus(GO:0046732) modulation by symbiont of host defense response(GO:0052031) induction by organism of defense response of other organism involved in symbiotic interaction(GO:0052251) modulation by organism of defense response of other organism involved in symbiotic interaction(GO:0052255) positive regulation by symbiont of host defense response(GO:0052509) positive regulation by organism of defense response of other organism involved in symbiotic interaction(GO:0052510) modulation by organism of immune response of other organism involved in symbiotic interaction(GO:0052552) modulation by symbiont of host immune response(GO:0052553) modulation by virus of host immune response(GO:0075528) |
| 0.2 | 1.0 | GO:0048669 | collateral sprouting in absence of injury(GO:0048669) |
| 0.2 | 1.4 | GO:0070314 | G1 to G0 transition(GO:0070314) |
| 0.2 | 1.8 | GO:0033623 | regulation of integrin activation(GO:0033623) |
| 0.2 | 2.0 | GO:0007217 | tachykinin receptor signaling pathway(GO:0007217) |
| 0.2 | 1.2 | GO:2000370 | positive regulation of clathrin-mediated endocytosis(GO:2000370) |
| 0.2 | 0.6 | GO:0044778 | meiotic DNA integrity checkpoint(GO:0044778) |
| 0.2 | 0.2 | GO:0006667 | sphinganine metabolic process(GO:0006667) |
| 0.2 | 1.0 | GO:0044789 | modulation by host of viral release from host cell(GO:0044789) positive regulation by host of viral release from host cell(GO:0044791) |
| 0.2 | 0.6 | GO:2001045 | negative regulation of integrin-mediated signaling pathway(GO:2001045) |
| 0.2 | 0.2 | GO:1903939 | regulation of TORC2 signaling(GO:1903939) |
| 0.2 | 0.6 | GO:1901389 | regulation of transforming growth factor beta activation(GO:1901388) negative regulation of transforming growth factor beta activation(GO:1901389) |
| 0.2 | 0.6 | GO:1903595 | positive regulation of histamine secretion by mast cell(GO:1903595) |
| 0.2 | 0.6 | GO:0090234 | regulation of kinetochore assembly(GO:0090234) |
| 0.2 | 0.2 | GO:0021699 | cerebellum maturation(GO:0021590) cerebellar cortex maturation(GO:0021699) |
| 0.2 | 0.4 | GO:0035494 | SNARE complex disassembly(GO:0035494) |
| 0.2 | 7.1 | GO:0001893 | maternal placenta development(GO:0001893) |
| 0.2 | 1.0 | GO:0009099 | branched-chain amino acid biosynthetic process(GO:0009082) leucine biosynthetic process(GO:0009098) valine biosynthetic process(GO:0009099) |
| 0.2 | 1.7 | GO:0098881 | exocytic insertion of neurotransmitter receptor to plasma membrane(GO:0098881) exocytic insertion of neurotransmitter receptor to postsynaptic membrane(GO:0098967) |
| 0.2 | 0.9 | GO:1903566 | positive regulation of protein localization to cilium(GO:1903566) |
| 0.2 | 0.4 | GO:0048104 | establishment of body hair or bristle planar orientation(GO:0048104) establishment of body hair planar orientation(GO:0048105) |
| 0.2 | 1.3 | GO:0010042 | response to manganese ion(GO:0010042) |
| 0.2 | 0.4 | GO:0002268 | follicular dendritic cell activation(GO:0002266) follicular dendritic cell differentiation(GO:0002268) |
| 0.2 | 0.6 | GO:2001153 | regulation of renal water transport(GO:2001151) positive regulation of renal water transport(GO:2001153) |
| 0.2 | 1.3 | GO:0015798 | myo-inositol transport(GO:0015798) |
| 0.2 | 0.6 | GO:0060392 | negative regulation of SMAD protein import into nucleus(GO:0060392) |
| 0.2 | 1.3 | GO:0002318 | myeloid progenitor cell differentiation(GO:0002318) |
| 0.2 | 1.3 | GO:0097105 | presynaptic membrane assembly(GO:0097105) |
| 0.2 | 1.1 | GO:0019509 | L-methionine biosynthetic process from methylthioadenosine(GO:0019509) |
| 0.2 | 0.2 | GO:0060769 | positive regulation of epithelial cell proliferation involved in prostate gland development(GO:0060769) |
| 0.2 | 0.9 | GO:0009128 | purine nucleoside monophosphate catabolic process(GO:0009128) |
| 0.2 | 0.6 | GO:1905075 | occluding junction disassembly(GO:1905071) regulation of occluding junction disassembly(GO:1905073) positive regulation of occluding junction disassembly(GO:1905075) |
| 0.2 | 0.4 | GO:0019254 | carnitine metabolic process, CoA-linked(GO:0019254) |
| 0.2 | 0.6 | GO:2000439 | positive regulation of monocyte extravasation(GO:2000439) |
| 0.2 | 0.4 | GO:0002036 | regulation of L-glutamate transport(GO:0002036) |
| 0.2 | 0.4 | GO:1905049 | negative regulation of metallopeptidase activity(GO:1905049) |
| 0.2 | 2.9 | GO:0014742 | positive regulation of cardiac muscle hypertrophy(GO:0010613) positive regulation of muscle hypertrophy(GO:0014742) |
| 0.2 | 1.3 | GO:0010499 | proteasomal ubiquitin-independent protein catabolic process(GO:0010499) |
| 0.2 | 0.5 | GO:2000561 | CD4-positive, alpha-beta T cell proliferation(GO:0035739) regulation of CD4-positive, alpha-beta T cell proliferation(GO:2000561) |
| 0.2 | 0.5 | GO:0061698 | protein demalonylation(GO:0036046) peptidyl-lysine demalonylation(GO:0036047) protein desuccinylation(GO:0036048) peptidyl-lysine desuccinylation(GO:0036049) protein deglutarylation(GO:0061698) peptidyl-lysine deglutarylation(GO:0061699) |
| 0.2 | 3.4 | GO:0006012 | galactose metabolic process(GO:0006012) |
| 0.2 | 0.4 | GO:1903826 | arginine transmembrane transport(GO:1903826) |
| 0.2 | 1.2 | GO:0001712 | ectoderm formation(GO:0001705) ectodermal cell fate commitment(GO:0001712) |
| 0.2 | 1.1 | GO:0015853 | adenine transport(GO:0015853) |
| 0.2 | 1.1 | GO:0071051 | polyadenylation-dependent snoRNA 3'-end processing(GO:0071051) |
| 0.2 | 0.2 | GO:0098905 | regulation of bundle of His cell action potential(GO:0098905) |
| 0.2 | 9.3 | GO:0045540 | regulation of cholesterol biosynthetic process(GO:0045540) |
| 0.2 | 4.0 | GO:0036152 | phosphatidylethanolamine acyl-chain remodeling(GO:0036152) |
| 0.2 | 1.2 | GO:0030309 | poly-N-acetyllactosamine metabolic process(GO:0030309) |
| 0.2 | 1.2 | GO:1900119 | positive regulation of execution phase of apoptosis(GO:1900119) |
| 0.2 | 1.0 | GO:0002249 | lymphocyte anergy(GO:0002249) regulation of T cell anergy(GO:0002667) T cell anergy(GO:0002870) regulation of lymphocyte anergy(GO:0002911) |
| 0.2 | 1.9 | GO:0001778 | plasma membrane repair(GO:0001778) |
| 0.2 | 1.7 | GO:0035767 | endothelial cell chemotaxis(GO:0035767) |
| 0.2 | 1.7 | GO:0048739 | cardiac muscle fiber development(GO:0048739) |
| 0.2 | 1.0 | GO:0035063 | nuclear speck organization(GO:0035063) |
| 0.2 | 0.5 | GO:0000103 | sulfate assimilation(GO:0000103) |
| 0.2 | 0.2 | GO:0060903 | positive regulation of meiosis I(GO:0060903) |
| 0.2 | 4.1 | GO:0046341 | CDP-diacylglycerol metabolic process(GO:0046341) |
| 0.2 | 0.5 | GO:0090182 | regulation of secretion of lysosomal enzymes(GO:0090182) |
| 0.2 | 0.7 | GO:1903070 | negative regulation of ER-associated ubiquitin-dependent protein catabolic process(GO:1903070) |
| 0.2 | 4.4 | GO:0046337 | phosphatidylethanolamine biosynthetic process(GO:0006646) phosphatidylethanolamine metabolic process(GO:0046337) |
| 0.2 | 2.2 | GO:2000781 | positive regulation of double-strand break repair(GO:2000781) |
| 0.2 | 1.8 | GO:0090037 | positive regulation of protein kinase C signaling(GO:0090037) |
| 0.2 | 3.5 | GO:0061470 | T follicular helper cell differentiation(GO:0061470) |
| 0.2 | 0.3 | GO:1905007 | positive regulation of epithelial to mesenchymal transition involved in endocardial cushion formation(GO:1905007) |
| 0.2 | 1.0 | GO:1904627 | response to phorbol 13-acetate 12-myristate(GO:1904627) cellular response to phorbol 13-acetate 12-myristate(GO:1904628) |
| 0.2 | 0.5 | GO:0031938 | regulation of chromatin silencing at telomere(GO:0031938) |
| 0.2 | 1.0 | GO:0009299 | mRNA transcription(GO:0009299) |
| 0.2 | 0.5 | GO:0042418 | epinephrine metabolic process(GO:0042414) epinephrine biosynthetic process(GO:0042418) |
| 0.2 | 1.5 | GO:0007168 | receptor guanylyl cyclase signaling pathway(GO:0007168) |
| 0.2 | 0.2 | GO:0031990 | mRNA export from nucleus in response to heat stress(GO:0031990) |
| 0.2 | 4.6 | GO:0045332 | phospholipid translocation(GO:0045332) |
| 0.2 | 0.5 | GO:0002384 | hepatic immune response(GO:0002384) |
| 0.2 | 0.3 | GO:1904322 | response to forskolin(GO:1904321) cellular response to forskolin(GO:1904322) |
| 0.2 | 2.1 | GO:0030422 | production of siRNA involved in RNA interference(GO:0030422) |
| 0.2 | 0.7 | GO:0060672 | epithelial cell differentiation involved in embryonic placenta development(GO:0060671) epithelial cell morphogenesis involved in placental branching(GO:0060672) |
| 0.2 | 3.7 | GO:0043372 | positive regulation of CD4-positive, alpha-beta T cell differentiation(GO:0043372) |
| 0.2 | 0.5 | GO:0097152 | mesenchymal cell apoptotic process(GO:0097152) |
| 0.2 | 0.3 | GO:0001828 | inner cell mass cellular morphogenesis(GO:0001828) |
| 0.2 | 2.1 | GO:0010457 | centriole-centriole cohesion(GO:0010457) |
| 0.2 | 0.2 | GO:1904437 | positive regulation of iron ion transport(GO:0034758) positive regulation of iron ion transmembrane transport(GO:0034761) regulation of iron ion import(GO:1900390) regulation of ferrous iron import into cell(GO:1903989) positive regulation of ferrous iron import into cell(GO:1903991) regulation of ferrous iron binding(GO:1904432) positive regulation of ferrous iron binding(GO:1904434) regulation of transferrin receptor binding(GO:1904435) positive regulation of transferrin receptor binding(GO:1904437) regulation of ferrous iron import across plasma membrane(GO:1904438) positive regulation of ferrous iron import across plasma membrane(GO:1904440) |
| 0.2 | 0.3 | GO:0002424 | T cell mediated immune response to tumor cell(GO:0002424) regulation of T cell mediated immune response to tumor cell(GO:0002840) |
| 0.2 | 2.4 | GO:0033235 | positive regulation of protein sumoylation(GO:0033235) |
| 0.2 | 0.2 | GO:2000777 | positive regulation of proteasomal ubiquitin-dependent protein catabolic process involved in cellular response to hypoxia(GO:2000777) |
| 0.2 | 0.5 | GO:1903676 | regulation of cap-dependent translational initiation(GO:1903674) positive regulation of cap-dependent translational initiation(GO:1903676) |
| 0.2 | 2.9 | GO:0035728 | response to hepatocyte growth factor(GO:0035728) |
| 0.2 | 1.7 | GO:0033234 | negative regulation of protein sumoylation(GO:0033234) |
| 0.2 | 0.8 | GO:0071894 | histone H2B conserved C-terminal lysine ubiquitination(GO:0071894) |
| 0.2 | 0.6 | GO:1904116 | response to vasopressin(GO:1904116) cellular response to vasopressin(GO:1904117) |
| 0.2 | 1.2 | GO:0038092 | nodal signaling pathway(GO:0038092) |
| 0.2 | 1.1 | GO:0006231 | dTMP biosynthetic process(GO:0006231) dTMP metabolic process(GO:0046073) |
| 0.2 | 0.2 | GO:0035766 | cell chemotaxis to fibroblast growth factor(GO:0035766) endothelial cell chemotaxis to fibroblast growth factor(GO:0035768) regulation of cell chemotaxis to fibroblast growth factor(GO:1904847) regulation of endothelial cell chemotaxis to fibroblast growth factor(GO:2000544) |
| 0.2 | 2.0 | GO:0006995 | cellular response to nitrogen starvation(GO:0006995) cellular response to nitrogen levels(GO:0043562) |
| 0.2 | 0.3 | GO:0090034 | regulation of chaperone-mediated protein complex assembly(GO:0090034) positive regulation of chaperone-mediated protein complex assembly(GO:0090035) |
| 0.2 | 0.5 | GO:0033037 | polysaccharide localization(GO:0033037) |
| 0.1 | 0.1 | GO:1903056 | regulation of melanosome organization(GO:1903056) |
| 0.1 | 3.9 | GO:0043567 | regulation of insulin-like growth factor receptor signaling pathway(GO:0043567) |
| 0.1 | 2.7 | GO:0009313 | oligosaccharide catabolic process(GO:0009313) |
| 0.1 | 1.8 | GO:0072553 | terminal button organization(GO:0072553) |
| 0.1 | 1.5 | GO:0031087 | deadenylation-independent decapping of nuclear-transcribed mRNA(GO:0031087) |
| 0.1 | 0.9 | GO:0033615 | mitochondrial proton-transporting ATP synthase complex assembly(GO:0033615) |
| 0.1 | 0.7 | GO:2000484 | positive regulation of interleukin-8 secretion(GO:2000484) |
| 0.1 | 0.7 | GO:2000767 | positive regulation of cytoplasmic translation(GO:2000767) |
| 0.1 | 0.9 | GO:0046092 | deoxycytidine metabolic process(GO:0046092) |
| 0.1 | 0.4 | GO:0016340 | calcium-dependent cell-matrix adhesion(GO:0016340) |
| 0.1 | 0.3 | GO:0015911 | plasma membrane long-chain fatty acid transport(GO:0015911) |
| 0.1 | 1.6 | GO:0035331 | negative regulation of hippo signaling(GO:0035331) |
| 0.1 | 0.3 | GO:1903778 | protein localization to vacuolar membrane(GO:1903778) |
| 0.1 | 0.6 | GO:2000681 | negative regulation of rubidium ion transport(GO:2000681) negative regulation of rubidium ion transmembrane transporter activity(GO:2000687) |
| 0.1 | 2.4 | GO:0030043 | actin filament fragmentation(GO:0030043) |
| 0.1 | 1.4 | GO:0061085 | regulation of histone H3-K27 methylation(GO:0061085) positive regulation of histone H3-K27 methylation(GO:0061087) |
| 0.1 | 3.7 | GO:0060412 | ventricular septum morphogenesis(GO:0060412) |
| 0.1 | 0.3 | GO:0060766 | negative regulation of androgen receptor signaling pathway(GO:0060766) |
| 0.1 | 0.6 | GO:0003199 | endocardial cushion to mesenchymal transition involved in heart valve formation(GO:0003199) |
| 0.1 | 0.3 | GO:0071372 | cellular response to follicle-stimulating hormone stimulus(GO:0071372) |
| 0.1 | 1.7 | GO:0000290 | deadenylation-dependent decapping of nuclear-transcribed mRNA(GO:0000290) |
| 0.1 | 1.0 | GO:0006729 | tetrahydrobiopterin biosynthetic process(GO:0006729) tetrahydrobiopterin metabolic process(GO:0046146) |
| 0.1 | 0.4 | GO:0071206 | establishment of protein localization to juxtaparanode region of axon(GO:0071206) |
| 0.1 | 0.8 | GO:0010668 | ectodermal cell differentiation(GO:0010668) |
| 0.1 | 0.7 | GO:2001137 | positive regulation of endocytic recycling(GO:2001137) |
| 0.1 | 0.3 | GO:0035521 | monoubiquitinated histone deubiquitination(GO:0035521) monoubiquitinated histone H2A deubiquitination(GO:0035522) |
| 0.1 | 1.0 | GO:0035886 | vascular smooth muscle cell differentiation(GO:0035886) |
| 0.1 | 1.6 | GO:0036120 | response to platelet-derived growth factor(GO:0036119) cellular response to platelet-derived growth factor stimulus(GO:0036120) |
| 0.1 | 0.5 | GO:0097498 | endothelial tube lumen extension(GO:0097498) |
| 0.1 | 0.5 | GO:0097112 | gamma-aminobutyric acid receptor clustering(GO:0097112) |
| 0.1 | 0.3 | GO:1902965 | regulation of protein localization to early endosome(GO:1902965) positive regulation of protein localization to early endosome(GO:1902966) |
| 0.1 | 0.7 | GO:0051971 | positive regulation of transmission of nerve impulse(GO:0051971) |
| 0.1 | 0.5 | GO:0048294 | negative regulation of isotype switching to IgE isotypes(GO:0048294) |
| 0.1 | 0.1 | GO:0070427 | nucleotide-binding oligomerization domain containing 1 signaling pathway(GO:0070427) |
| 0.1 | 1.4 | GO:0043249 | erythrocyte maturation(GO:0043249) |
| 0.1 | 1.8 | GO:0048227 | plasma membrane to endosome transport(GO:0048227) |
| 0.1 | 0.7 | GO:0019075 | virus maturation(GO:0019075) |
| 0.1 | 0.1 | GO:2000643 | positive regulation of early endosome to late endosome transport(GO:2000643) |
| 0.1 | 1.2 | GO:0071549 | cellular response to dexamethasone stimulus(GO:0071549) |
| 0.1 | 0.5 | GO:1904045 | cellular response to aldosterone(GO:1904045) |
| 0.1 | 0.4 | GO:0070973 | protein localization to endoplasmic reticulum exit site(GO:0070973) |
| 0.1 | 0.7 | GO:1902268 | negative regulation of polyamine transmembrane transport(GO:1902268) |
| 0.1 | 0.4 | GO:1900425 | negative regulation of defense response to bacterium(GO:1900425) |
| 0.1 | 0.8 | GO:0035610 | protein side chain deglutamylation(GO:0035610) |
| 0.1 | 1.0 | GO:0060025 | primary heart field specification(GO:0003138) sinoatrial valve development(GO:0003172) sinoatrial valve morphogenesis(GO:0003185) regulation of synaptic activity(GO:0060025) |
| 0.1 | 0.9 | GO:0060160 | negative regulation of dopamine receptor signaling pathway(GO:0060160) |
| 0.1 | 2.2 | GO:0060907 | positive regulation of macrophage cytokine production(GO:0060907) |
| 0.1 | 6.6 | GO:0071470 | cellular response to osmotic stress(GO:0071470) |
| 0.1 | 1.4 | GO:0003264 | cardioblast proliferation(GO:0003263) regulation of cardioblast proliferation(GO:0003264) |
| 0.1 | 0.9 | GO:0016584 | nucleosome positioning(GO:0016584) |
| 0.1 | 0.4 | GO:0036510 | trimming of terminal mannose on C branch(GO:0036510) |
| 0.1 | 2.3 | GO:0030497 | fatty acid elongation(GO:0030497) |
| 0.1 | 0.5 | GO:0061763 | multivesicular body-lysosome fusion(GO:0061763) |
| 0.1 | 0.8 | GO:0015014 | heparan sulfate proteoglycan biosynthetic process, polysaccharide chain biosynthetic process(GO:0015014) |
| 0.1 | 0.3 | GO:0061428 | negative regulation of transcription from RNA polymerase II promoter in response to hypoxia(GO:0061428) |
| 0.1 | 0.1 | GO:0006447 | regulation of translational initiation by iron(GO:0006447) |
| 0.1 | 0.1 | GO:0045829 | negative regulation of isotype switching(GO:0045829) |
| 0.1 | 0.3 | GO:0046379 | extracellular polysaccharide biosynthetic process(GO:0045226) extracellular polysaccharide metabolic process(GO:0046379) |
| 0.1 | 1.1 | GO:0031053 | primary miRNA processing(GO:0031053) |
| 0.1 | 0.1 | GO:0051533 | positive regulation of NFAT protein import into nucleus(GO:0051533) |
| 0.1 | 0.4 | GO:0035720 | intraciliary anterograde transport(GO:0035720) |
| 0.1 | 0.5 | GO:0045876 | positive regulation of sister chromatid cohesion(GO:0045876) |
| 0.1 | 1.4 | GO:0007258 | JUN phosphorylation(GO:0007258) |
| 0.1 | 0.1 | GO:1904933 | regulation of cell proliferation in midbrain(GO:1904933) |
| 0.1 | 0.2 | GO:0042182 | ketone catabolic process(GO:0042182) |
| 0.1 | 0.1 | GO:0031296 | B cell costimulation(GO:0031296) |
| 0.1 | 0.5 | GO:1904978 | regulation of endosome organization(GO:1904978) |
| 0.1 | 2.2 | GO:0034587 | piRNA metabolic process(GO:0034587) |
| 0.1 | 1.6 | GO:1902083 | negative regulation of peptidyl-cysteine S-nitrosylation(GO:1902083) |
| 0.1 | 2.6 | GO:0046051 | UTP metabolic process(GO:0046051) |
| 0.1 | 0.2 | GO:0017055 | negative regulation of RNA polymerase II transcriptional preinitiation complex assembly(GO:0017055) |
| 0.1 | 1.0 | GO:0050703 | interleukin-1 alpha secretion(GO:0050703) |
| 0.1 | 1.2 | GO:0050847 | progesterone receptor signaling pathway(GO:0050847) |
| 0.1 | 1.5 | GO:0007220 | Notch receptor processing(GO:0007220) |
| 0.1 | 0.4 | GO:0097343 | ripoptosome assembly(GO:0097343) ripoptosome assembly involved in necroptotic process(GO:1901026) |
| 0.1 | 0.5 | GO:0034134 | toll-like receptor 2 signaling pathway(GO:0034134) |
| 0.1 | 0.5 | GO:0035627 | ceramide transport(GO:0035627) |
| 0.1 | 1.1 | GO:0005984 | disaccharide metabolic process(GO:0005984) |
| 0.1 | 1.8 | GO:0051044 | positive regulation of membrane protein ectodomain proteolysis(GO:0051044) |
| 0.1 | 0.4 | GO:2000642 | negative regulation of early endosome to late endosome transport(GO:2000642) |
| 0.1 | 0.5 | GO:0044210 | 'de novo' CTP biosynthetic process(GO:0044210) |
| 0.1 | 5.1 | GO:0046329 | negative regulation of JNK cascade(GO:0046329) |
| 0.1 | 0.5 | GO:0010767 | regulation of transcription from RNA polymerase II promoter in response to UV-induced DNA damage(GO:0010767) |
| 0.1 | 0.8 | GO:0006655 | phosphatidylglycerol biosynthetic process(GO:0006655) cardiolipin biosynthetic process(GO:0032049) |
| 0.1 | 1.1 | GO:0097267 | omega-hydroxylase P450 pathway(GO:0097267) |
| 0.1 | 0.4 | GO:0045553 | TRAIL production(GO:0032639) regulation of TRAIL production(GO:0032679) positive regulation of TRAIL production(GO:0032759) TRAIL biosynthetic process(GO:0045553) regulation of TRAIL biosynthetic process(GO:0045554) positive regulation of TRAIL biosynthetic process(GO:0045556) |
| 0.1 | 1.2 | GO:0036444 | calcium ion transmembrane import into mitochondrion(GO:0036444) |
| 0.1 | 1.5 | GO:1903690 | negative regulation of wound healing, spreading of epidermal cells(GO:1903690) |
| 0.1 | 0.6 | GO:0060282 | positive regulation of oocyte development(GO:0060282) |
| 0.1 | 0.4 | GO:0090158 | endoplasmic reticulum membrane organization(GO:0090158) |
| 0.1 | 1.9 | GO:0031033 | myosin filament organization(GO:0031033) |
| 0.1 | 0.8 | GO:0072734 | response to staurosporine(GO:0072733) cellular response to staurosporine(GO:0072734) |
| 0.1 | 0.4 | GO:0071603 | endothelial cell-cell adhesion(GO:0071603) |
| 0.1 | 1.3 | GO:0006551 | leucine metabolic process(GO:0006551) |
| 0.1 | 0.3 | GO:0035732 | nitric oxide storage(GO:0035732) |
| 0.1 | 0.3 | GO:0060741 | prostate gland stromal morphogenesis(GO:0060741) |
| 0.1 | 0.3 | GO:1901143 | insulin catabolic process(GO:1901143) |
| 0.1 | 2.5 | GO:0035518 | histone H2A monoubiquitination(GO:0035518) |
| 0.1 | 0.7 | GO:0061734 | parkin-mediated mitophagy in response to mitochondrial depolarization(GO:0061734) |
| 0.1 | 0.7 | GO:0072393 | microtubule anchoring at microtubule organizing center(GO:0072393) |
| 0.1 | 0.3 | GO:0071962 | mitotic sister chromatid cohesion, centromeric(GO:0071962) |
| 0.1 | 1.5 | GO:0051601 | exocyst localization(GO:0051601) |
| 0.1 | 0.3 | GO:1903576 | response to L-arginine(GO:1903576) |
| 0.1 | 0.8 | GO:0043589 | skin morphogenesis(GO:0043589) |
| 0.1 | 0.2 | GO:0035261 | external genitalia morphogenesis(GO:0035261) |
| 0.1 | 0.2 | GO:0090521 | glomerular visceral epithelial cell migration(GO:0090521) |
| 0.1 | 0.3 | GO:0060633 | negative regulation of transcription initiation from RNA polymerase II promoter(GO:0060633) |
| 0.1 | 0.4 | GO:0002636 | positive regulation of germinal center formation(GO:0002636) |
| 0.1 | 0.2 | GO:0036091 | positive regulation of transcription from RNA polymerase II promoter in response to oxidative stress(GO:0036091) |
| 0.1 | 0.7 | GO:0006064 | glucuronate catabolic process(GO:0006064) glucuronate catabolic process to xylulose 5-phosphate(GO:0019640) xylulose 5-phosphate metabolic process(GO:0051167) xylulose 5-phosphate biosynthetic process(GO:1901159) |
| 0.1 | 0.1 | GO:1900223 | positive regulation of beta-amyloid clearance(GO:1900223) |
| 0.1 | 0.2 | GO:0060346 | bone trabecula formation(GO:0060346) |
| 0.1 | 0.7 | GO:0033567 | DNA replication, Okazaki fragment processing(GO:0033567) |
| 0.1 | 0.1 | GO:0002644 | negative regulation of tolerance induction(GO:0002644) |
| 0.1 | 0.7 | GO:0097327 | response to antineoplastic agent(GO:0097327) |
| 0.1 | 0.1 | GO:0055099 | response to high density lipoprotein particle(GO:0055099) |
| 0.1 | 1.5 | GO:0006975 | DNA damage induced protein phosphorylation(GO:0006975) |
| 0.1 | 2.3 | GO:2000811 | negative regulation of anoikis(GO:2000811) |
| 0.1 | 0.3 | GO:0097052 | L-kynurenine metabolic process(GO:0097052) |
| 0.1 | 2.0 | GO:0097094 | craniofacial suture morphogenesis(GO:0097094) |
| 0.1 | 0.7 | GO:0046007 | negative regulation of activated T cell proliferation(GO:0046007) |
| 0.1 | 2.0 | GO:0009435 | NAD biosynthetic process(GO:0009435) |
| 0.1 | 4.6 | GO:0030206 | chondroitin sulfate biosynthetic process(GO:0030206) |
| 0.1 | 0.5 | GO:1903385 | regulation of homophilic cell adhesion(GO:1903385) |
| 0.1 | 0.3 | GO:0031247 | actin rod assembly(GO:0031247) |
| 0.1 | 0.9 | GO:0035879 | plasma membrane lactate transport(GO:0035879) |
| 0.1 | 0.2 | GO:2000491 | positive regulation of hepatic stellate cell activation(GO:2000491) |
| 0.1 | 0.1 | GO:0021555 | midbrain-hindbrain boundary morphogenesis(GO:0021555) |
| 0.1 | 0.5 | GO:0072675 | multinuclear osteoclast differentiation(GO:0072674) osteoclast fusion(GO:0072675) |
| 0.1 | 0.3 | GO:0006788 | heme oxidation(GO:0006788) |
| 0.1 | 0.3 | GO:0006500 | N-terminal protein palmitoylation(GO:0006500) |
| 0.1 | 0.3 | GO:0014846 | esophagus smooth muscle contraction(GO:0014846) |
| 0.1 | 0.5 | GO:0045647 | negative regulation of erythrocyte differentiation(GO:0045647) |
| 0.1 | 0.4 | GO:0071787 | endoplasmic reticulum tubular network assembly(GO:0071787) |
| 0.1 | 1.8 | GO:0098868 | bone growth(GO:0098868) |
| 0.1 | 0.4 | GO:0048069 | eye pigmentation(GO:0048069) |
| 0.1 | 0.1 | GO:0032290 | peripheral nervous system myelin formation(GO:0032290) |
| 0.1 | 0.9 | GO:0000710 | meiotic mismatch repair(GO:0000710) |
| 0.1 | 0.5 | GO:0044314 | protein K27-linked ubiquitination(GO:0044314) |
| 0.1 | 0.8 | GO:0002191 | cap-dependent translational initiation(GO:0002191) |
| 0.1 | 0.1 | GO:1901421 | positive regulation of response to alcohol(GO:1901421) |
| 0.1 | 0.1 | GO:1903004 | regulation of protein K63-linked deubiquitination(GO:1903004) positive regulation of protein K63-linked deubiquitination(GO:1903006) |
| 0.1 | 2.4 | GO:0034389 | lipid particle organization(GO:0034389) |
| 0.1 | 0.4 | GO:0036058 | filtration diaphragm assembly(GO:0036058) slit diaphragm assembly(GO:0036060) |
| 0.1 | 0.6 | GO:0008218 | bioluminescence(GO:0008218) |
| 0.1 | 0.5 | GO:0048388 | endosomal lumen acidification(GO:0048388) |
| 0.1 | 1.2 | GO:0008090 | retrograde axonal transport(GO:0008090) |
| 0.1 | 0.5 | GO:0006573 | valine metabolic process(GO:0006573) |
| 0.1 | 0.7 | GO:0044130 | negative regulation of growth of symbiont in host(GO:0044130) |
| 0.1 | 0.1 | GO:1902525 | regulation of protein monoubiquitination(GO:1902525) |
| 0.1 | 0.5 | GO:1902612 | regulation of anti-Mullerian hormone signaling pathway(GO:1902612) negative regulation of anti-Mullerian hormone signaling pathway(GO:1902613) anti-Mullerian hormone signaling pathway(GO:1990262) |
| 0.1 | 0.4 | GO:0097032 | respiratory chain complex II assembly(GO:0034552) mitochondrial respiratory chain complex II assembly(GO:0034553) mitochondrial respiratory chain complex II biogenesis(GO:0097032) |
| 0.1 | 0.4 | GO:0016259 | selenocysteine metabolic process(GO:0016259) |
| 0.1 | 0.6 | GO:0030643 | cellular phosphate ion homeostasis(GO:0030643) cellular trivalent inorganic anion homeostasis(GO:0072502) |
| 0.1 | 0.2 | GO:0000350 | generation of catalytic spliceosome for second transesterification step(GO:0000350) |
| 0.1 | 2.4 | GO:0016254 | preassembly of GPI anchor in ER membrane(GO:0016254) |
| 0.1 | 0.2 | GO:0001994 | norepinephrine-epinephrine vasoconstriction involved in regulation of systemic arterial blood pressure(GO:0001994) |
| 0.1 | 0.5 | GO:2000381 | negative regulation of mesoderm development(GO:2000381) |
| 0.1 | 0.7 | GO:2000096 | positive regulation of Wnt signaling pathway, planar cell polarity pathway(GO:2000096) |
| 0.1 | 0.8 | GO:0033622 | integrin activation(GO:0033622) |
| 0.1 | 0.6 | GO:1990504 | dense core granule exocytosis(GO:1990504) |
| 0.1 | 0.5 | GO:0015688 | iron chelate transport(GO:0015688) siderophore transport(GO:0015891) |
| 0.1 | 0.3 | GO:0007440 | foregut morphogenesis(GO:0007440) |
| 0.1 | 0.1 | GO:0007113 | endomitotic cell cycle(GO:0007113) |
| 0.1 | 0.1 | GO:0035634 | response to stilbenoid(GO:0035634) |
| 0.1 | 0.2 | GO:0061643 | chemorepulsion of axon(GO:0061643) |
| 0.1 | 0.2 | GO:0006982 | response to lipid hydroperoxide(GO:0006982) |
| 0.1 | 1.3 | GO:0033081 | regulation of T cell differentiation in thymus(GO:0033081) regulation of thymocyte aggregation(GO:2000398) |
| 0.1 | 0.4 | GO:0009111 | vitamin catabolic process(GO:0009111) |
| 0.1 | 0.5 | GO:0046852 | positive regulation of bone resorption(GO:0045780) positive regulation of bone remodeling(GO:0046852) |
| 0.1 | 2.5 | GO:0006517 | protein deglycosylation(GO:0006517) |
| 0.1 | 3.5 | GO:0018345 | protein palmitoylation(GO:0018345) |
| 0.1 | 1.0 | GO:1904153 | negative regulation of protein exit from endoplasmic reticulum(GO:0070862) negative regulation of retrograde protein transport, ER to cytosol(GO:1904153) |
| 0.1 | 1.0 | GO:0031643 | positive regulation of myelination(GO:0031643) |
| 0.1 | 0.4 | GO:0032847 | regulation of cellular pH reduction(GO:0032847) |
| 0.1 | 0.7 | GO:0046951 | ketone body biosynthetic process(GO:0046951) |
| 0.1 | 0.1 | GO:0002188 | formation of cytoplasmic translation initiation complex(GO:0001732) translation reinitiation(GO:0002188) |
| 0.1 | 0.6 | GO:0033216 | ferric iron import(GO:0033216) ferric iron import into cell(GO:0097461) ferric iron import across plasma membrane(GO:0098706) |
| 0.1 | 0.2 | GO:0033591 | response to L-ascorbic acid(GO:0033591) |
| 0.1 | 0.5 | GO:0016139 | glycoside catabolic process(GO:0016139) |
| 0.1 | 0.2 | GO:0045653 | negative regulation of megakaryocyte differentiation(GO:0045653) |
| 0.1 | 0.3 | GO:1902544 | regulation of DNA N-glycosylase activity(GO:1902544) |
| 0.1 | 0.3 | GO:0050760 | negative regulation of thymidylate synthase biosynthetic process(GO:0050760) |
| 0.1 | 1.1 | GO:0015886 | heme transport(GO:0015886) |
| 0.1 | 0.5 | GO:1903553 | positive regulation of extracellular exosome assembly(GO:1903553) |
| 0.1 | 0.1 | GO:1904378 | maintenance of unfolded protein(GO:0036506) maintenance of unfolded protein involved in ERAD pathway(GO:1904378) |
| 0.1 | 0.7 | GO:0044362 | modulation of molecular function in other organism(GO:0044359) negative regulation of molecular function in other organism(GO:0044362) negative regulation of molecular function in other organism involved in symbiotic interaction(GO:0052204) modulation of molecular function in other organism involved in symbiotic interaction(GO:0052205) negative regulation by host of symbiont molecular function(GO:0052405) modification by host of symbiont molecular function(GO:0052428) |
| 0.1 | 0.7 | GO:0034380 | high-density lipoprotein particle assembly(GO:0034380) |
| 0.1 | 0.5 | GO:0090188 | negative regulation of pancreatic juice secretion(GO:0090188) |
| 0.1 | 0.3 | GO:0060279 | positive regulation of ovulation(GO:0060279) |
| 0.1 | 0.3 | GO:0090675 | intermicrovillar adhesion(GO:0090675) |
| 0.1 | 0.3 | GO:0044805 | late nucleophagy(GO:0044805) |
| 0.1 | 0.2 | GO:0014878 | response to electrical stimulus involved in regulation of muscle adaptation(GO:0014878) |
| 0.1 | 0.2 | GO:0031584 | activation of phospholipase D activity(GO:0031584) |
| 0.1 | 0.4 | GO:0035633 | maintenance of blood-brain barrier(GO:0035633) positive regulation of metalloendopeptidase activity(GO:1904685) |
| 0.1 | 1.0 | GO:0030473 | nucleokinesis involved in cell motility in cerebral cortex radial glia guided migration(GO:0021817) nuclear migration along microtubule(GO:0030473) |
| 0.1 | 0.2 | GO:0045953 | negative regulation of natural killer cell mediated cytotoxicity(GO:0045953) |
| 0.1 | 0.4 | GO:0034128 | negative regulation of MyD88-independent toll-like receptor signaling pathway(GO:0034128) |
| 0.1 | 0.4 | GO:0051409 | response to nitrosative stress(GO:0051409) |
| 0.1 | 0.5 | GO:0070940 | dephosphorylation of RNA polymerase II C-terminal domain(GO:0070940) |
| 0.1 | 0.4 | GO:2000535 | regulation of entry of bacterium into host cell(GO:2000535) |
| 0.1 | 2.7 | GO:0006695 | cholesterol biosynthetic process(GO:0006695) secondary alcohol biosynthetic process(GO:1902653) |
| 0.1 | 0.6 | GO:0060973 | cell migration involved in heart development(GO:0060973) |
| 0.1 | 0.3 | GO:0050976 | detection of mechanical stimulus involved in sensory perception of touch(GO:0050976) |
| 0.1 | 4.8 | GO:0010633 | negative regulation of epithelial cell migration(GO:0010633) |
| 0.1 | 0.4 | GO:0060370 | susceptibility to T cell mediated cytotoxicity(GO:0060370) |
| 0.1 | 2.3 | GO:0007020 | microtubule nucleation(GO:0007020) |
| 0.1 | 2.1 | GO:0009068 | aspartate family amino acid catabolic process(GO:0009068) |
| 0.1 | 0.3 | GO:1904578 | response to thapsigargin(GO:1904578) cellular response to thapsigargin(GO:1904579) |
| 0.1 | 0.2 | GO:0046222 | mycotoxin metabolic process(GO:0043385) aflatoxin metabolic process(GO:0046222) organic heteropentacyclic compound metabolic process(GO:1901376) |
| 0.1 | 0.7 | GO:2000346 | negative regulation of hepatocyte proliferation(GO:2000346) |
| 0.1 | 0.2 | GO:0009631 | cold acclimation(GO:0009631) |
| 0.1 | 1.6 | GO:0045116 | protein neddylation(GO:0045116) |
| 0.1 | 3.7 | GO:0007190 | activation of adenylate cyclase activity(GO:0007190) |
| 0.1 | 0.5 | GO:0051918 | negative regulation of fibrinolysis(GO:0051918) |
| 0.1 | 0.3 | GO:0032817 | regulation of natural killer cell proliferation(GO:0032817) positive regulation of natural killer cell proliferation(GO:0032819) |
| 0.1 | 0.1 | GO:0042983 | amyloid precursor protein biosynthetic process(GO:0042983) regulation of amyloid precursor protein biosynthetic process(GO:0042984) |
| 0.1 | 0.3 | GO:0046416 | D-amino acid metabolic process(GO:0046416) |
| 0.1 | 0.3 | GO:0035750 | protein localization to myelin sheath abaxonal region(GO:0035750) |
| 0.1 | 0.1 | GO:0045650 | negative regulation of macrophage differentiation(GO:0045650) |
| 0.1 | 1.7 | GO:0016578 | histone deubiquitination(GO:0016578) |
| 0.1 | 0.9 | GO:0043031 | negative regulation of macrophage activation(GO:0043031) |
| 0.1 | 1.8 | GO:0090162 | establishment of epithelial cell polarity(GO:0090162) |
| 0.1 | 0.3 | GO:0035520 | monoubiquitinated protein deubiquitination(GO:0035520) |
| 0.1 | 0.7 | GO:0051694 | pointed-end actin filament capping(GO:0051694) |
| 0.1 | 0.6 | GO:0031666 | positive regulation of lipopolysaccharide-mediated signaling pathway(GO:0031666) |
| 0.1 | 0.1 | GO:0038183 | bile acid signaling pathway(GO:0038183) |
| 0.1 | 0.3 | GO:1904751 | positive regulation of protein localization to nucleolus(GO:1904751) |
| 0.1 | 0.1 | GO:0090526 | regulation of gluconeogenesis involved in cellular glucose homeostasis(GO:0090526) |
| 0.1 | 0.4 | GO:1900016 | negative regulation of cytokine production involved in inflammatory response(GO:1900016) |
| 0.1 | 0.3 | GO:0021707 | cerebellar granular layer formation(GO:0021684) cerebellar granule cell differentiation(GO:0021707) |
| 0.1 | 0.2 | GO:0003406 | retinal pigment epithelium development(GO:0003406) |
| 0.1 | 1.6 | GO:0033540 | fatty acid beta-oxidation using acyl-CoA oxidase(GO:0033540) |
| 0.1 | 0.2 | GO:0071460 | cellular response to cell-matrix adhesion(GO:0071460) |
| 0.1 | 0.2 | GO:0032471 | negative regulation of endoplasmic reticulum calcium ion concentration(GO:0032471) |
| 0.1 | 0.5 | GO:0035434 | copper ion transmembrane transport(GO:0035434) |
| 0.1 | 0.1 | GO:0050747 | positive regulation of lipoprotein metabolic process(GO:0050747) regulation of protein lipidation(GO:1903059) positive regulation of protein lipidation(GO:1903061) |
| 0.1 | 0.7 | GO:0090036 | regulation of protein kinase C signaling(GO:0090036) |
| 0.1 | 0.2 | GO:0010643 | cell communication by chemical coupling(GO:0010643) |
| 0.1 | 0.1 | GO:2000525 | regulation of T cell costimulation(GO:2000523) positive regulation of T cell costimulation(GO:2000525) |
| 0.1 | 0.6 | GO:1904294 | positive regulation of ERAD pathway(GO:1904294) |
| 0.1 | 0.2 | GO:0070734 | histone H3-K27 methylation(GO:0070734) |
| 0.1 | 0.2 | GO:0099542 | trans-synaptic signaling by lipid(GO:0099541) trans-synaptic signaling by endocannabinoid(GO:0099542) trans-synaptic signalling, modulating synaptic transmission(GO:0099550) trans-synaptic signaling by lipid, modulating synaptic transmission(GO:0099552) trans-synaptic signaling by endocannabinoid, modulating synaptic transmission(GO:0099553) |
| 0.1 | 0.6 | GO:0090161 | Golgi ribbon formation(GO:0090161) |
| 0.1 | 0.2 | GO:0048368 | lateral mesoderm development(GO:0048368) |
| 0.1 | 0.5 | GO:0002138 | retinoic acid biosynthetic process(GO:0002138) |
| 0.1 | 0.3 | GO:0010387 | COP9 signalosome assembly(GO:0010387) |
| 0.1 | 0.2 | GO:1901874 | negative regulation of post-translational protein modification(GO:1901874) |
| 0.1 | 0.4 | GO:0034244 | negative regulation of transcription elongation from RNA polymerase II promoter(GO:0034244) |
| 0.1 | 0.3 | GO:0031642 | negative regulation of myelination(GO:0031642) |
| 0.1 | 0.6 | GO:0038063 | collagen-activated tyrosine kinase receptor signaling pathway(GO:0038063) |
| 0.1 | 0.1 | GO:0032909 | transforming growth factor beta2 production(GO:0032906) regulation of transforming growth factor beta2 production(GO:0032909) |
| 0.1 | 0.3 | GO:0046356 | acetyl-CoA catabolic process(GO:0046356) |
| 0.1 | 0.4 | GO:0051414 | response to cortisol(GO:0051414) |
| 0.1 | 0.1 | GO:0032229 | negative regulation of synaptic transmission, GABAergic(GO:0032229) |
| 0.1 | 0.5 | GO:1903433 | cytotoxic T cell degranulation(GO:0043316) regulation of constitutive secretory pathway(GO:1903433) positive regulation of constitutive secretory pathway(GO:1903435) |
| 0.1 | 0.2 | GO:0098974 | postsynaptic actin cytoskeleton organization(GO:0098974) |
| 0.1 | 0.6 | GO:0051574 | positive regulation of histone H3-K9 methylation(GO:0051574) |
| 0.1 | 0.2 | GO:0051695 | actin filament uncapping(GO:0051695) |
| 0.1 | 0.3 | GO:0016256 | N-glycan processing to lysosome(GO:0016256) |
| 0.1 | 0.5 | GO:0009597 | detection of virus(GO:0009597) |
| 0.1 | 0.5 | GO:0061469 | regulation of type B pancreatic cell proliferation(GO:0061469) |
| 0.1 | 0.2 | GO:0035791 | platelet-derived growth factor receptor-beta signaling pathway(GO:0035791) |
| 0.1 | 0.6 | GO:0010792 | DNA double-strand break processing involved in repair via single-strand annealing(GO:0010792) |
| 0.1 | 0.3 | GO:0033148 | positive regulation of intracellular estrogen receptor signaling pathway(GO:0033148) |
| 0.1 | 0.5 | GO:1904274 | tricellular tight junction assembly(GO:1904274) |
| 0.1 | 0.2 | GO:0006114 | glycerol biosynthetic process(GO:0006114) |
| 0.1 | 0.7 | GO:0090136 | epithelial cell-cell adhesion(GO:0090136) |
| 0.1 | 0.6 | GO:0021702 | cerebellar Purkinje cell layer formation(GO:0021694) cerebellar Purkinje cell differentiation(GO:0021702) |
| 0.1 | 0.2 | GO:0032240 | negative regulation of nucleobase-containing compound transport(GO:0032240) negative regulation of RNA export from nucleus(GO:0046832) |
| 0.1 | 0.5 | GO:0006768 | biotin metabolic process(GO:0006768) |
| 0.1 | 0.7 | GO:0031115 | negative regulation of microtubule polymerization(GO:0031115) |
| 0.1 | 0.7 | GO:0020027 | hemoglobin metabolic process(GO:0020027) |
| 0.1 | 0.3 | GO:0021553 | olfactory nerve development(GO:0021553) |
| 0.1 | 1.1 | GO:0071447 | cellular response to hydroperoxide(GO:0071447) |
| 0.1 | 1.1 | GO:0042994 | cytoplasmic sequestering of transcription factor(GO:0042994) |
| 0.1 | 0.5 | GO:0009048 | dosage compensation(GO:0007549) dosage compensation by inactivation of X chromosome(GO:0009048) |
| 0.1 | 0.2 | GO:0019919 | peptidyl-arginine methylation, to asymmetrical-dimethyl arginine(GO:0019919) |
| 0.1 | 0.5 | GO:0072600 | establishment of protein localization to Golgi(GO:0072600) |
| 0.1 | 0.4 | GO:0043402 | glucocorticoid mediated signaling pathway(GO:0043402) |
| 0.1 | 0.3 | GO:0010900 | negative regulation of phosphatidylcholine catabolic process(GO:0010900) |
| 0.1 | 0.4 | GO:1903416 | response to glycoside(GO:1903416) |
| 0.1 | 0.8 | GO:0003301 | physiological muscle hypertrophy(GO:0003298) physiological cardiac muscle hypertrophy(GO:0003301) cell growth involved in cardiac muscle cell development(GO:0061049) |
| 0.1 | 0.1 | GO:2000791 | regulation of mesenchymal cell proliferation involved in lung development(GO:2000790) negative regulation of mesenchymal cell proliferation involved in lung development(GO:2000791) |
| 0.1 | 0.2 | GO:0042421 | norepinephrine biosynthetic process(GO:0042421) |
| 0.1 | 0.3 | GO:0000973 | posttranscriptional tethering of RNA polymerase II gene DNA at nuclear periphery(GO:0000973) |
| 0.1 | 0.5 | GO:0043985 | histone H4-R3 methylation(GO:0043985) |
| 0.1 | 0.9 | GO:0051256 | mitotic spindle midzone assembly(GO:0051256) |
| 0.1 | 0.5 | GO:0016926 | protein desumoylation(GO:0016926) |
| 0.1 | 0.5 | GO:0010807 | regulation of synaptic vesicle priming(GO:0010807) |
| 0.1 | 0.3 | GO:0032185 | septin cytoskeleton organization(GO:0032185) |
| 0.1 | 0.3 | GO:0070345 | negative regulation of fat cell proliferation(GO:0070345) |
| 0.1 | 0.2 | GO:0038165 | oncostatin-M-mediated signaling pathway(GO:0038165) |
| 0.1 | 0.6 | GO:0061366 | behavioral response to chemical pain(GO:0061366) behavioral response to formalin induced pain(GO:0061368) |
| 0.1 | 3.2 | GO:0050434 | positive regulation of viral transcription(GO:0050434) |
| 0.1 | 0.5 | GO:1990253 | cellular response to leucine starvation(GO:1990253) |
| 0.1 | 0.5 | GO:0033689 | negative regulation of osteoblast proliferation(GO:0033689) |
| 0.1 | 0.4 | GO:0006432 | phenylalanyl-tRNA aminoacylation(GO:0006432) |
| 0.1 | 0.2 | GO:1902445 | regulation of mitochondrial membrane permeability involved in programmed necrotic cell death(GO:1902445) |
| 0.1 | 0.1 | GO:0002024 | diet induced thermogenesis(GO:0002024) |
| 0.1 | 0.7 | GO:0070986 | left/right axis specification(GO:0070986) |
| 0.1 | 0.3 | GO:0035608 | protein deglutamylation(GO:0035608) |
| 0.1 | 0.2 | GO:0050689 | negative regulation of defense response to virus by host(GO:0050689) |
| 0.1 | 0.3 | GO:0090235 | regulation of metaphase plate congression(GO:0090235) |
| 0.1 | 0.6 | GO:0060992 | response to fungicide(GO:0060992) |
| 0.1 | 0.7 | GO:0061744 | psychomotor behavior(GO:0036343) motor behavior(GO:0061744) |
| 0.1 | 0.1 | GO:1903301 | positive regulation of hexokinase activity(GO:1903301) |
| 0.1 | 0.3 | GO:0038060 | nitric oxide-cGMP-mediated signaling pathway(GO:0038060) |
| 0.1 | 0.2 | GO:0051562 | negative regulation of mitochondrial calcium ion concentration(GO:0051562) |
| 0.1 | 0.8 | GO:0030091 | protein repair(GO:0030091) |
| 0.1 | 1.3 | GO:0090557 | establishment of endothelial intestinal barrier(GO:0090557) |
| 0.1 | 0.8 | GO:0043162 | ubiquitin-dependent protein catabolic process via the multivesicular body sorting pathway(GO:0043162) |
| 0.1 | 0.1 | GO:0046121 | deoxyribonucleoside catabolic process(GO:0046121) |
| 0.1 | 0.8 | GO:0043983 | histone H4-K12 acetylation(GO:0043983) |
| 0.1 | 2.4 | GO:0043525 | positive regulation of neuron apoptotic process(GO:0043525) |
| 0.1 | 0.2 | GO:1901073 | N-acetylglucosamine biosynthetic process(GO:0006045) glucosamine-containing compound biosynthetic process(GO:1901073) |
| 0.1 | 1.1 | GO:0003334 | keratinocyte development(GO:0003334) |
| 0.1 | 0.1 | GO:0044240 | multicellular organism lipid catabolic process(GO:0044240) |
| 0.1 | 1.0 | GO:0007250 | activation of NF-kappaB-inducing kinase activity(GO:0007250) |
| 0.1 | 0.9 | GO:0034498 | early endosome to Golgi transport(GO:0034498) |
| 0.1 | 0.2 | GO:1990180 | mitochondrial tRNA 3'-end processing(GO:1990180) |
| 0.1 | 0.7 | GO:0033561 | regulation of water loss via skin(GO:0033561) establishment of skin barrier(GO:0061436) |
| 0.1 | 0.2 | GO:0033277 | abortive mitotic cell cycle(GO:0033277) |
| 0.1 | 0.4 | GO:0019359 | nicotinamide nucleotide biosynthetic process(GO:0019359) pyridine nucleotide biosynthetic process(GO:0019363) |
| 0.1 | 0.2 | GO:2000271 | positive regulation of fibroblast apoptotic process(GO:2000271) |
| 0.1 | 0.2 | GO:0070091 | glucagon secretion(GO:0070091) regulation of glucagon secretion(GO:0070092) |
| 0.1 | 0.6 | GO:0009437 | carnitine metabolic process(GO:0009437) |
| 0.1 | 0.1 | GO:0044126 | regulation of growth of symbiont in host(GO:0044126) |
| 0.1 | 0.2 | GO:0034242 | negative regulation of syncytium formation by plasma membrane fusion(GO:0034242) |
| 0.1 | 0.7 | GO:2001288 | positive regulation of caveolin-mediated endocytosis(GO:2001288) |
| 0.1 | 0.2 | GO:1901052 | sarcosine metabolic process(GO:1901052) sarcosine catabolic process(GO:1901053) |
| 0.1 | 1.7 | GO:0003016 | respiratory system process(GO:0003016) |
| 0.1 | 0.1 | GO:0043987 | histone H3-S10 phosphorylation(GO:0043987) |
| 0.1 | 0.6 | GO:0018214 | peptidyl-glutamic acid carboxylation(GO:0017187) protein carboxylation(GO:0018214) |
| 0.1 | 0.2 | GO:0061528 | negative regulation of gamma-aminobutyric acid secretion(GO:0014053) aspartate secretion(GO:0061528) regulation of aspartate secretion(GO:1904448) positive regulation of aspartate secretion(GO:1904450) |
| 0.1 | 0.2 | GO:0034378 | chylomicron assembly(GO:0034378) |
| 0.1 | 2.1 | GO:0030819 | positive regulation of cAMP biosynthetic process(GO:0030819) |
| 0.1 | 0.3 | GO:0007198 | adenylate cyclase-inhibiting serotonin receptor signaling pathway(GO:0007198) |
| 0.1 | 0.3 | GO:0071763 | nuclear membrane organization(GO:0071763) |
| 0.1 | 0.5 | GO:1902902 | negative regulation of autophagosome assembly(GO:1902902) |
| 0.1 | 0.3 | GO:0009838 | abscission(GO:0009838) |
| 0.1 | 0.7 | GO:0061088 | regulation of sequestering of zinc ion(GO:0061088) |
| 0.1 | 0.6 | GO:0019800 | peptide cross-linking via chondroitin 4-sulfate glycosaminoglycan(GO:0019800) |
| 0.1 | 0.4 | GO:0032495 | response to muramyl dipeptide(GO:0032495) |
| 0.1 | 0.2 | GO:0050932 | regulation of pigment cell differentiation(GO:0050932) |
| 0.1 | 1.0 | GO:0038003 | opioid receptor signaling pathway(GO:0038003) |
| 0.1 | 0.5 | GO:1901409 | positive regulation of phosphorylation of RNA polymerase II C-terminal domain(GO:1901409) |
| 0.1 | 0.2 | GO:0035246 | peptidyl-arginine N-methylation(GO:0035246) |
| 0.1 | 0.1 | GO:0010847 | regulation of chromatin assembly(GO:0010847) |
| 0.1 | 0.8 | GO:0045008 | depyrimidination(GO:0045008) |
| 0.1 | 0.7 | GO:0045078 | positive regulation of interferon-gamma biosynthetic process(GO:0045078) |
| 0.1 | 0.2 | GO:1904715 | negative regulation of chaperone-mediated autophagy(GO:1904715) |
| 0.1 | 0.2 | GO:0070914 | UV-damage excision repair(GO:0070914) |
| 0.1 | 0.4 | GO:0035583 | sequestering of TGFbeta in extracellular matrix(GO:0035583) |
| 0.1 | 0.1 | GO:2001025 | positive regulation of response to drug(GO:2001025) |
| 0.1 | 0.5 | GO:2000580 | regulation of ATP-dependent microtubule motor activity, plus-end-directed(GO:2000580) positive regulation of ATP-dependent microtubule motor activity, plus-end-directed(GO:2000582) |
| 0.1 | 0.2 | GO:0035573 | N-terminal protein amino acid methylation(GO:0006480) N-terminal peptidyl-alanine methylation(GO:0018011) N-terminal peptidyl-alanine trimethylation(GO:0018012) N-terminal peptidyl-glycine methylation(GO:0018013) N-terminal peptidyl-proline dimethylation(GO:0018016) peptidyl-alanine modification(GO:0018194) N-terminal peptidyl-proline methylation(GO:0035568) N-terminal peptidyl-serine methylation(GO:0035570) N-terminal peptidyl-serine dimethylation(GO:0035572) N-terminal peptidyl-serine trimethylation(GO:0035573) |
| 0.1 | 0.1 | GO:0010520 | regulation of reciprocal meiotic recombination(GO:0010520) |
| 0.1 | 0.2 | GO:0032873 | negative regulation of stress-activated MAPK cascade(GO:0032873) negative regulation of stress-activated protein kinase signaling cascade(GO:0070303) |
| 0.1 | 0.2 | GO:0038145 | macrophage colony-stimulating factor signaling pathway(GO:0038145) |
| 0.1 | 0.2 | GO:1903949 | positive regulation of cardiac conduction(GO:1903781) positive regulation of atrial cardiac muscle cell action potential(GO:1903949) |
| 0.1 | 0.1 | GO:0090611 | ubiquitin-independent protein catabolic process via the multivesicular body sorting pathway(GO:0090611) |
| 0.1 | 0.6 | GO:0098535 | de novo centriole assembly(GO:0098535) |
| 0.1 | 1.0 | GO:0010954 | positive regulation of protein processing(GO:0010954) |
| 0.1 | 0.2 | GO:0010133 | proline catabolic process(GO:0006562) proline catabolic process to glutamate(GO:0010133) |
| 0.1 | 0.3 | GO:0071027 | nuclear RNA surveillance(GO:0071027) nuclear mRNA surveillance(GO:0071028) |
| 0.1 | 0.2 | GO:0035544 | negative regulation of SNARE complex assembly(GO:0035544) |
| 0.1 | 0.1 | GO:0032571 | response to vitamin K(GO:0032571) |
| 0.1 | 0.5 | GO:0045292 | mRNA cis splicing, via spliceosome(GO:0045292) |
| 0.1 | 0.2 | GO:0051257 | meiotic metaphase I plate congression(GO:0043060) meiotic spindle midzone assembly(GO:0051257) meiotic metaphase plate congression(GO:0051311) |
| 0.1 | 0.1 | GO:0035948 | positive regulation of gluconeogenesis by positive regulation of transcription from RNA polymerase II promoter(GO:0035948) |
| 0.1 | 0.2 | GO:0033539 | fatty acid beta-oxidation using acyl-CoA dehydrogenase(GO:0033539) |
| 0.1 | 3.4 | GO:0018279 | peptidyl-asparagine modification(GO:0018196) protein N-linked glycosylation via asparagine(GO:0018279) |
| 0.1 | 0.3 | GO:0060455 | negative regulation of gastric acid secretion(GO:0060455) |
| 0.1 | 0.2 | GO:0001780 | neutrophil homeostasis(GO:0001780) |
| 0.1 | 0.3 | GO:0035022 | positive regulation of Rac protein signal transduction(GO:0035022) |
| 0.1 | 0.9 | GO:0007183 | SMAD protein complex assembly(GO:0007183) |
| 0.1 | 0.4 | GO:0033522 | histone H2A ubiquitination(GO:0033522) |
| 0.1 | 0.9 | GO:0000052 | citrulline metabolic process(GO:0000052) |
| 0.1 | 0.1 | GO:1903094 | regulation of protein K48-linked deubiquitination(GO:1903093) negative regulation of protein K48-linked deubiquitination(GO:1903094) negative regulation of ubiquitin-specific protease activity(GO:2000157) |
| 0.1 | 0.3 | GO:0032057 | negative regulation of translational initiation in response to stress(GO:0032057) |
| 0.1 | 0.5 | GO:0045793 | positive regulation of cell size(GO:0045793) |
| 0.1 | 0.1 | GO:0035330 | regulation of hippo signaling(GO:0035330) |
| 0.1 | 1.4 | GO:0042347 | negative regulation of NF-kappaB import into nucleus(GO:0042347) |
| 0.0 | 0.6 | GO:0042474 | middle ear morphogenesis(GO:0042474) |
| 0.0 | 0.5 | GO:0010818 | T cell chemotaxis(GO:0010818) |
| 0.0 | 1.7 | GO:0000186 | activation of MAPKK activity(GO:0000186) |
| 0.0 | 0.0 | GO:0044691 | tooth eruption(GO:0044691) |
| 0.0 | 0.9 | GO:0043984 | histone H4-K16 acetylation(GO:0043984) |
| 0.0 | 0.5 | GO:0042340 | keratan sulfate catabolic process(GO:0042340) |
| 0.0 | 0.5 | GO:0017062 | respiratory chain complex III assembly(GO:0017062) mitochondrial respiratory chain complex III assembly(GO:0034551) mitochondrial respiratory chain complex III biogenesis(GO:0097033) |
| 0.0 | 0.8 | GO:0051457 | maintenance of protein location in nucleus(GO:0051457) |
| 0.0 | 0.0 | GO:1902956 | regulation of mitochondrial electron transport, NADH to ubiquinone(GO:1902956) |
| 0.0 | 0.1 | GO:0051039 | histone displacement(GO:0001207) positive regulation of transcription involved in meiotic cell cycle(GO:0051039) |
| 0.0 | 0.3 | GO:0061042 | vascular wound healing(GO:0061042) |
| 0.0 | 0.2 | GO:0021830 | interneuron migration from the subpallium to the cortex(GO:0021830) |
| 0.0 | 0.6 | GO:0032836 | glomerular basement membrane development(GO:0032836) |
| 0.0 | 0.2 | GO:0006127 | glycerophosphate shuttle(GO:0006127) |
| 0.0 | 0.1 | GO:0015785 | UDP-galactose transport(GO:0015785) UDP-galactose transmembrane transport(GO:0072334) |
| 0.0 | 0.6 | GO:0016075 | rRNA catabolic process(GO:0016075) |
| 0.0 | 0.6 | GO:0006069 | ethanol oxidation(GO:0006069) |
| 0.0 | 0.3 | GO:0072383 | plus-end-directed vesicle transport along microtubule(GO:0072383) |
| 0.0 | 0.4 | GO:1901223 | negative regulation of NIK/NF-kappaB signaling(GO:1901223) |
| 0.0 | 0.0 | GO:0090325 | regulation of locomotion involved in locomotory behavior(GO:0090325) |
| 0.0 | 3.9 | GO:0032981 | NADH dehydrogenase complex assembly(GO:0010257) mitochondrial respiratory chain complex I assembly(GO:0032981) mitochondrial respiratory chain complex I biogenesis(GO:0097031) |
| 0.0 | 1.3 | GO:0070911 | global genome nucleotide-excision repair(GO:0070911) |
| 0.0 | 0.1 | GO:0070625 | zymogen granule exocytosis(GO:0070625) |
| 0.0 | 0.0 | GO:0043461 | proton-transporting ATP synthase complex assembly(GO:0043461) proton-transporting ATP synthase complex biogenesis(GO:0070272) |
| 0.0 | 0.0 | GO:0019747 | regulation of isoprenoid metabolic process(GO:0019747) |
| 0.0 | 1.4 | GO:0035455 | response to interferon-alpha(GO:0035455) |
| 0.0 | 1.8 | GO:0035735 | intraciliary transport involved in cilium morphogenesis(GO:0035735) |
| 0.0 | 0.1 | GO:0051987 | positive regulation of attachment of spindle microtubules to kinetochore(GO:0051987) |
| 0.0 | 0.0 | GO:1901620 | smoothened signaling pathway involved in dorsal/ventral neural tube patterning(GO:0060831) regulation of smoothened signaling pathway involved in dorsal/ventral neural tube patterning(GO:1901620) |
| 0.0 | 0.2 | GO:0051571 | positive regulation of histone H3-K4 methylation(GO:0051571) |
| 0.0 | 0.2 | GO:0070966 | nuclear-transcribed mRNA catabolic process, no-go decay(GO:0070966) |
| 0.0 | 0.5 | GO:0038203 | TORC2 signaling(GO:0038203) |
| 0.0 | 0.2 | GO:0006293 | nucleotide-excision repair, preincision complex stabilization(GO:0006293) |
| 0.0 | 0.8 | GO:0010569 | regulation of double-strand break repair via homologous recombination(GO:0010569) |
| 0.0 | 1.2 | GO:0042733 | embryonic digit morphogenesis(GO:0042733) |
| 0.0 | 0.0 | GO:0018171 | peptidyl-cysteine oxidation(GO:0018171) |
| 0.0 | 0.1 | GO:0045014 | carbon catabolite repression of transcription(GO:0045013) negative regulation of transcription by glucose(GO:0045014) |
| 0.0 | 0.1 | GO:2000909 | regulation of cholesterol import(GO:0060620) regulation of sterol import(GO:2000909) |
| 0.0 | 0.2 | GO:0032310 | prostaglandin secretion(GO:0032310) |
| 0.0 | 0.6 | GO:0030252 | growth hormone secretion(GO:0030252) |
| 0.0 | 0.3 | GO:0045654 | positive regulation of megakaryocyte differentiation(GO:0045654) |
| 0.0 | 1.3 | GO:0014823 | response to activity(GO:0014823) |
| 0.0 | 0.0 | GO:1904293 | negative regulation of ERAD pathway(GO:1904293) |
| 0.0 | 0.2 | GO:0035873 | lactate transport(GO:0015727) lactate transmembrane transport(GO:0035873) |
| 0.0 | 0.4 | GO:0072498 | embryonic skeletal joint development(GO:0072498) |
| 0.0 | 1.9 | GO:0071277 | cellular response to calcium ion(GO:0071277) |
| 0.0 | 0.0 | GO:0035726 | common myeloid progenitor cell proliferation(GO:0035726) |
| 0.0 | 0.3 | GO:0021756 | striatum development(GO:0021756) |
| 0.0 | 0.5 | GO:0006703 | estrogen biosynthetic process(GO:0006703) |
| 0.0 | 0.7 | GO:0006506 | GPI anchor metabolic process(GO:0006505) GPI anchor biosynthetic process(GO:0006506) |
| 0.0 | 0.5 | GO:0030149 | sphingolipid catabolic process(GO:0030149) |
| 0.0 | 0.3 | GO:0006651 | diacylglycerol biosynthetic process(GO:0006651) |
| 0.0 | 0.2 | GO:0042796 | snRNA transcription from RNA polymerase III promoter(GO:0042796) |
| 0.0 | 0.1 | GO:0002032 | desensitization of G-protein coupled receptor protein signaling pathway by arrestin(GO:0002032) |
| 0.0 | 0.4 | GO:0043306 | positive regulation of mast cell activation involved in immune response(GO:0033008) positive regulation of mast cell degranulation(GO:0043306) |
| 0.0 | 0.0 | GO:0033484 | nitric oxide homeostasis(GO:0033484) |
| 0.0 | 0.2 | GO:2000059 | negative regulation of protein ubiquitination involved in ubiquitin-dependent protein catabolic process(GO:2000059) |
| 0.0 | 0.4 | GO:0042532 | negative regulation of tyrosine phosphorylation of STAT protein(GO:0042532) |
| 0.0 | 0.1 | GO:0030576 | Cajal body organization(GO:0030576) |
| 0.0 | 0.1 | GO:1903259 | exon-exon junction complex disassembly(GO:1903259) |
| 0.0 | 0.1 | GO:0099566 | regulation of postsynaptic cytosolic calcium ion concentration(GO:0099566) |
| 0.0 | 0.1 | GO:0036500 | ATF6-mediated unfolded protein response(GO:0036500) |
| 0.0 | 0.1 | GO:0021849 | neuroblast division in subventricular zone(GO:0021849) |
| 0.0 | 0.1 | GO:1904383 | response to sodium phosphate(GO:1904383) |
| 0.0 | 0.1 | GO:1903348 | positive regulation of bicellular tight junction assembly(GO:1903348) |
| 0.0 | 0.3 | GO:0007256 | activation of JNKK activity(GO:0007256) |
| 0.0 | 0.2 | GO:0033004 | negative regulation of mast cell activation(GO:0033004) |
| 0.0 | 0.5 | GO:0032688 | negative regulation of interferon-beta production(GO:0032688) |
| 0.0 | 0.1 | GO:0034058 | endosomal vesicle fusion(GO:0034058) |
| 0.0 | 0.1 | GO:0070649 | formin-nucleated actin cable assembly(GO:0070649) |
| 0.0 | 0.8 | GO:0000291 | nuclear-transcribed mRNA catabolic process, exonucleolytic(GO:0000291) |
| 0.0 | 0.4 | GO:0007398 | ectoderm development(GO:0007398) |
| 0.0 | 1.8 | GO:0046839 | phospholipid dephosphorylation(GO:0046839) |
| 0.0 | 0.3 | GO:1904252 | negative regulation of bile acid biosynthetic process(GO:0070858) negative regulation of bile acid metabolic process(GO:1904252) |
| 0.0 | 0.1 | GO:0006295 | nucleotide-excision repair, DNA incision, 3'-to lesion(GO:0006295) |
| 0.0 | 0.1 | GO:2000152 | regulation of ubiquitin-specific protease activity(GO:2000152) |
| 0.0 | 0.2 | GO:1903142 | positive regulation of endothelial cell development(GO:1901552) positive regulation of establishment of endothelial barrier(GO:1903142) |
| 0.0 | 0.2 | GO:0007252 | I-kappaB phosphorylation(GO:0007252) |
| 0.0 | 0.1 | GO:0045743 | positive regulation of fibroblast growth factor receptor signaling pathway(GO:0045743) |
| 0.0 | 0.1 | GO:0046485 | ether lipid metabolic process(GO:0046485) |
| 0.0 | 0.8 | GO:0043277 | apoptotic cell clearance(GO:0043277) |
| 0.0 | 0.1 | GO:1904732 | regulation of electron carrier activity(GO:1904732) |
| 0.0 | 0.1 | GO:0021894 | cerebral cortex GABAergic interneuron development(GO:0021894) |
| 0.0 | 0.2 | GO:0090195 | chemokine secretion(GO:0090195) |
| 0.0 | 0.2 | GO:0050884 | neuromuscular process controlling posture(GO:0050884) |
| 0.0 | 0.0 | GO:0061550 | cranial ganglion development(GO:0061550) |
| 0.0 | 0.2 | GO:0097026 | dendritic cell dendrite assembly(GO:0097026) |
| 0.0 | 1.6 | GO:0008333 | endosome to lysosome transport(GO:0008333) |
| 0.0 | 0.2 | GO:0071318 | cellular response to ATP(GO:0071318) |
| 0.0 | 0.2 | GO:0009886 | post-embryonic morphogenesis(GO:0009886) |
| 0.0 | 0.0 | GO:2000254 | regulation of male germ cell proliferation(GO:2000254) |
| 0.0 | 0.2 | GO:0097062 | dendritic spine maintenance(GO:0097062) |
| 0.0 | 1.1 | GO:0009409 | response to cold(GO:0009409) |
| 0.0 | 0.1 | GO:0001920 | negative regulation of receptor recycling(GO:0001920) |
| 0.0 | 0.1 | GO:0016095 | polyprenol catabolic process(GO:0016095) |
| 0.0 | 0.1 | GO:0071376 | response to corticotropin-releasing hormone(GO:0043435) cellular response to corticotropin-releasing hormone stimulus(GO:0071376) |
| 0.0 | 0.1 | GO:0003084 | positive regulation of systemic arterial blood pressure(GO:0003084) |
| 0.0 | 0.2 | GO:1902035 | positive regulation of hematopoietic stem cell proliferation(GO:1902035) |
| 0.0 | 0.1 | GO:1903031 | regulation of microtubule plus-end binding(GO:1903031) positive regulation of microtubule plus-end binding(GO:1903033) |
| 0.0 | 0.1 | GO:1902992 | negative regulation of amyloid precursor protein catabolic process(GO:1902992) |
| 0.0 | 0.2 | GO:0018094 | protein polyglycylation(GO:0018094) |
| 0.0 | 0.9 | GO:0044458 | motile cilium assembly(GO:0044458) |
| 0.0 | 0.2 | GO:1900364 | negative regulation of mRNA polyadenylation(GO:1900364) |
| 0.0 | 0.2 | GO:0021902 | commitment of neuronal cell to specific neuron type in forebrain(GO:0021902) |
| 0.0 | 0.4 | GO:0035584 | calcium-mediated signaling using intracellular calcium source(GO:0035584) |
| 0.0 | 0.2 | GO:0001561 | fatty acid alpha-oxidation(GO:0001561) |
| 0.0 | 0.3 | GO:0044829 | positive regulation by host of viral genome replication(GO:0044829) |
| 0.0 | 0.4 | GO:0000244 | spliceosomal tri-snRNP complex assembly(GO:0000244) |
| 0.0 | 0.3 | GO:0006983 | ER overload response(GO:0006983) |
| 0.0 | 0.2 | GO:0006003 | fructose 2,6-bisphosphate metabolic process(GO:0006003) |
| 0.0 | 0.1 | GO:0090073 | positive regulation of protein homodimerization activity(GO:0090073) |
| 0.0 | 0.1 | GO:0002457 | T cell antigen processing and presentation(GO:0002457) |
| 0.0 | 0.4 | GO:0070934 | CRD-mediated mRNA stabilization(GO:0070934) |
| 0.0 | 0.6 | GO:0070423 | nucleotide-binding oligomerization domain containing signaling pathway(GO:0070423) |
| 0.0 | 1.9 | GO:0022900 | electron transport chain(GO:0022900) |
| 0.0 | 0.2 | GO:0000389 | mRNA 3'-splice site recognition(GO:0000389) |
| 0.0 | 0.4 | GO:0019532 | oxalate transport(GO:0019532) |
| 0.0 | 0.1 | GO:0030213 | hyaluronan biosynthetic process(GO:0030213) |
| 0.0 | 0.5 | GO:0015816 | glycine transport(GO:0015816) |
| 0.0 | 0.1 | GO:0010934 | macrophage cytokine production(GO:0010934) |
| 0.0 | 0.1 | GO:0002586 | regulation of antigen processing and presentation of peptide antigen via MHC class II(GO:0002586) |
| 0.0 | 0.0 | GO:0010607 | negative regulation of cytoplasmic mRNA processing body assembly(GO:0010607) |
| 0.0 | 0.3 | GO:0034312 | diol biosynthetic process(GO:0034312) sphingosine biosynthetic process(GO:0046512) |
| 0.0 | 2.5 | GO:0006911 | phagocytosis, engulfment(GO:0006911) |
| 0.0 | 0.1 | GO:1905146 | lysosomal protein catabolic process(GO:1905146) |
| 0.0 | 0.1 | GO:0010166 | wax biosynthetic process(GO:0010025) wax metabolic process(GO:0010166) |
| 0.0 | 0.1 | GO:0003413 | chondrocyte differentiation involved in endochondral bone morphogenesis(GO:0003413) |
| 0.0 | 0.0 | GO:0046078 | dUMP metabolic process(GO:0046078) |
| 0.0 | 0.1 | GO:0001999 | renal response to blood flow involved in circulatory renin-angiotensin regulation of systemic arterial blood pressure(GO:0001999) renin secretion into blood stream(GO:0002001) |
| 0.0 | 0.1 | GO:0093001 | glycolytic process through glucose-1-phosphate(GO:0061622) glycolysis from storage polysaccharide through glucose-1-phosphate(GO:0093001) |
| 0.0 | 0.0 | GO:0071469 | response to alkaline pH(GO:0010446) cellular response to alkaline pH(GO:0071469) |
| 0.0 | 0.1 | GO:0060316 | positive regulation of ryanodine-sensitive calcium-release channel activity(GO:0060316) |
| 0.0 | 0.0 | GO:0034350 | regulation of glial cell apoptotic process(GO:0034350) negative regulation of glial cell apoptotic process(GO:0034351) |
| 0.0 | 0.2 | GO:0002254 | thyroid hormone mediated signaling pathway(GO:0002154) regulation of thyroid hormone mediated signaling pathway(GO:0002155) kinin cascade(GO:0002254) plasma kallikrein-kinin cascade(GO:0002353) |
| 0.0 | 0.1 | GO:0030207 | chondroitin sulfate catabolic process(GO:0030207) |
| 0.0 | 0.0 | GO:0010735 | positive regulation of transcription via serum response element binding(GO:0010735) |
| 0.0 | 0.8 | GO:1901687 | glutathione derivative metabolic process(GO:1901685) glutathione derivative biosynthetic process(GO:1901687) |
| 0.0 | 1.4 | GO:0000413 | protein peptidyl-prolyl isomerization(GO:0000413) |
| 0.0 | 0.1 | GO:0015862 | uridine transport(GO:0015862) |
| 0.0 | 0.1 | GO:0030953 | astral microtubule organization(GO:0030953) |
| 0.0 | 0.0 | GO:0097374 | sensory neuron axon guidance(GO:0097374) |
| 0.0 | 0.0 | GO:0010430 | fatty acid omega-oxidation(GO:0010430) |
| 0.0 | 0.7 | GO:0032784 | regulation of DNA-templated transcription, elongation(GO:0032784) |
| 0.0 | 0.2 | GO:0050957 | equilibrioception(GO:0050957) |
| 0.0 | 0.4 | GO:0016574 | histone ubiquitination(GO:0016574) |
| 0.0 | 0.1 | GO:0097698 | telomere maintenance via base-excision repair(GO:0097698) |
| 0.0 | 0.2 | GO:1990822 | basic amino acid transmembrane transport(GO:1990822) |
| 0.0 | 0.3 | GO:0030970 | retrograde protein transport, ER to cytosol(GO:0030970) |
| 0.0 | 0.1 | GO:0070370 | heat acclimation(GO:0010286) cellular heat acclimation(GO:0070370) |
| 0.0 | 0.0 | GO:0046010 | positive regulation of circadian sleep/wake cycle, non-REM sleep(GO:0046010) |
| 0.0 | 0.2 | GO:0055091 | phospholipid homeostasis(GO:0055091) |
| 0.0 | 1.1 | GO:0032007 | negative regulation of TOR signaling(GO:0032007) |
| 0.0 | 0.0 | GO:0042732 | D-xylose metabolic process(GO:0042732) |
| 0.0 | 0.2 | GO:0045023 | G0 to G1 transition(GO:0045023) |
| 0.0 | 0.0 | GO:0021826 | substrate-independent telencephalic tangential migration(GO:0021826) substrate-independent telencephalic tangential interneuron migration(GO:0021843) |
| 0.0 | 0.1 | GO:0006662 | glycerol ether metabolic process(GO:0006662) |
| 0.0 | 0.4 | GO:0036066 | protein O-linked fucosylation(GO:0036066) |
| 0.0 | 0.0 | GO:0045348 | positive regulation of MHC class II biosynthetic process(GO:0045348) |
| 0.0 | 0.0 | GO:0042779 | tRNA 3'-trailer cleavage, endonucleolytic(GO:0034414) tRNA 3'-trailer cleavage(GO:0042779) |
| 0.0 | 0.1 | GO:0070681 | glutaminyl-tRNAGln biosynthesis via transamidation(GO:0070681) |
| 0.0 | 0.1 | GO:2000353 | positive regulation of endothelial cell apoptotic process(GO:2000353) |
| 0.0 | 0.9 | GO:1901222 | regulation of NIK/NF-kappaB signaling(GO:1901222) |
| 0.0 | 0.0 | GO:1990523 | bone regeneration(GO:1990523) |
| 0.0 | 0.2 | GO:0032876 | negative regulation of DNA endoreduplication(GO:0032876) |
| 0.0 | 0.1 | GO:2000270 | negative regulation of fibroblast apoptotic process(GO:2000270) |
| 0.0 | 0.0 | GO:0071499 | cellular response to laminar fluid shear stress(GO:0071499) |
| 0.0 | 0.1 | GO:0090646 | mitochondrial tRNA processing(GO:0090646) |
| 0.0 | 0.2 | GO:0034453 | microtubule anchoring(GO:0034453) |
| 0.0 | 0.1 | GO:0090156 | negative regulation of sphingolipid biosynthetic process(GO:0090155) cellular sphingolipid homeostasis(GO:0090156) negative regulation of ceramide biosynthetic process(GO:1900060) |
| 0.0 | 0.1 | GO:0006987 | activation of signaling protein activity involved in unfolded protein response(GO:0006987) |
| 0.0 | 0.3 | GO:0044803 | multi-organism membrane organization(GO:0044803) |
| 0.0 | 0.0 | GO:0006286 | base-excision repair, base-free sugar-phosphate removal(GO:0006286) |
| 0.0 | 0.1 | GO:0046104 | thymidine metabolic process(GO:0046104) pyrimidine deoxyribonucleoside metabolic process(GO:0046125) |
| 0.0 | 0.1 | GO:0006348 | chromatin silencing at telomere(GO:0006348) |
| 0.0 | 0.0 | GO:0042271 | susceptibility to natural killer cell mediated cytotoxicity(GO:0042271) |
| 0.0 | 0.1 | GO:0009730 | detection of carbohydrate stimulus(GO:0009730) detection of hexose stimulus(GO:0009732) detection of monosaccharide stimulus(GO:0034287) detection of glucose(GO:0051594) |
| 0.0 | 0.0 | GO:0001765 | membrane raft assembly(GO:0001765) |
| 0.0 | 0.1 | GO:0035021 | negative regulation of Rac protein signal transduction(GO:0035021) |
| 0.0 | 0.1 | GO:0045945 | positive regulation of transcription from RNA polymerase III promoter(GO:0045945) |
| 0.0 | 0.4 | GO:0006999 | nuclear pore organization(GO:0006999) |
| 0.0 | 0.0 | GO:1902896 | terminal web assembly(GO:1902896) |
| 0.0 | 0.0 | GO:1990502 | dense core granule maturation(GO:1990502) |
| 0.0 | 0.0 | GO:0060841 | venous blood vessel development(GO:0060841) |
| 0.0 | 0.0 | GO:0072697 | protein localization to cell cortex(GO:0072697) |
| 0.0 | 0.3 | GO:0042759 | long-chain fatty acid biosynthetic process(GO:0042759) |
| 0.0 | 0.1 | GO:0018197 | peptidyl-aspartic acid modification(GO:0018197) |
| 0.0 | 0.1 | GO:0018125 | peptidyl-cysteine methylation(GO:0018125) |
| 0.0 | 1.7 | GO:0006369 | termination of RNA polymerase II transcription(GO:0006369) |
| 0.0 | 0.3 | GO:0051290 | protein heterotetramerization(GO:0051290) |
| 0.0 | 0.1 | GO:0018343 | protein farnesylation(GO:0018343) |
| 0.0 | 0.1 | GO:2000312 | regulation of kainate selective glutamate receptor activity(GO:2000312) |
| 0.0 | 0.0 | GO:0070682 | proteasome regulatory particle assembly(GO:0070682) |
| 0.0 | 0.9 | GO:0003254 | regulation of membrane depolarization(GO:0003254) |
| 0.0 | 0.0 | GO:0072156 | distal tubule morphogenesis(GO:0072156) |
| 0.0 | 0.1 | GO:0048280 | vesicle fusion with Golgi apparatus(GO:0048280) |
| 0.0 | 0.1 | GO:0007023 | post-chaperonin tubulin folding pathway(GO:0007023) |
| 0.0 | 0.0 | GO:0033076 | isoquinoline alkaloid metabolic process(GO:0033076) |
| 0.0 | 0.2 | GO:0036150 | phosphatidylserine acyl-chain remodeling(GO:0036150) |
| 0.0 | 0.1 | GO:0002018 | renin-angiotensin regulation of aldosterone production(GO:0002018) |
| 0.0 | 0.1 | GO:0090042 | tubulin deacetylation(GO:0090042) |
| 0.0 | 0.0 | GO:0032911 | negative regulation of transforming growth factor beta1 production(GO:0032911) |
| 0.0 | 0.3 | GO:0060261 | positive regulation of transcription initiation from RNA polymerase II promoter(GO:0060261) |
| 0.0 | 0.2 | GO:0043691 | reverse cholesterol transport(GO:0043691) |
| 0.0 | 1.9 | GO:0070125 | mitochondrial translational elongation(GO:0070125) |
| 0.0 | 0.1 | GO:0071344 | diphosphate metabolic process(GO:0071344) |
| 0.0 | 0.0 | GO:0018242 | protein O-linked glycosylation via serine(GO:0018242) |
| 0.0 | 0.0 | GO:0002361 | CD4-positive, CD25-positive, alpha-beta regulatory T cell differentiation(GO:0002361) |
| 0.0 | 0.2 | GO:0021535 | cell migration in hindbrain(GO:0021535) |
| 0.0 | 0.0 | GO:0035989 | tendon development(GO:0035989) |
| 0.0 | 0.1 | GO:0097688 | AMPA glutamate receptor clustering(GO:0097113) glutamate receptor clustering(GO:0097688) |
| 0.0 | 0.0 | GO:0036480 | neuron intrinsic apoptotic signaling pathway in response to oxidative stress(GO:0036480) regulation of oxidative stress-induced neuron intrinsic apoptotic signaling pathway(GO:1903376) |
| 0.0 | 0.0 | GO:1902683 | regulation of receptor localization to synapse(GO:1902683) |
| 0.0 | 0.3 | GO:1901748 | leukotriene D4 metabolic process(GO:1901748) leukotriene D4 biosynthetic process(GO:1901750) |
| 0.0 | 0.1 | GO:0033353 | S-adenosylmethionine cycle(GO:0033353) |
| 0.0 | 0.1 | GO:0033131 | regulation of glucokinase activity(GO:0033131) regulation of hexokinase activity(GO:1903299) |
| 0.0 | 0.0 | GO:0052200 | response to defenses of other organism involved in symbiotic interaction(GO:0052173) response to host defenses(GO:0052200) response to immune response of other organism involved in symbiotic interaction(GO:0052564) response to host immune response(GO:0052572) response to host(GO:0075136) |
| 0.0 | 0.0 | GO:1904569 | regulation of selenocysteine incorporation(GO:1904569) |
| 0.0 | 0.3 | GO:0050855 | regulation of B cell receptor signaling pathway(GO:0050855) |
| 0.0 | 0.1 | GO:0009086 | methionine biosynthetic process(GO:0009086) |
| 0.0 | 0.2 | GO:0019373 | epoxygenase P450 pathway(GO:0019373) |
| 0.0 | 0.4 | GO:0034383 | low-density lipoprotein particle clearance(GO:0034383) |
| 0.0 | 0.7 | GO:0043966 | histone H3 acetylation(GO:0043966) |
| 0.0 | 0.0 | GO:0061084 | regulation of protein refolding(GO:0061083) negative regulation of protein refolding(GO:0061084) |
| 0.0 | 0.2 | GO:0006465 | signal peptide processing(GO:0006465) |
| 0.0 | 0.0 | GO:0035511 | oxidative DNA demethylation(GO:0035511) |
| 0.0 | 2.1 | GO:0006613 | cotranslational protein targeting to membrane(GO:0006613) |
| 0.0 | 0.1 | GO:0038170 | somatostatin receptor signaling pathway(GO:0038169) somatostatin signaling pathway(GO:0038170) |
| 0.0 | 0.2 | GO:0060330 | regulation of response to interferon-gamma(GO:0060330) |
| 0.0 | 0.0 | GO:0042636 | negative regulation of hair cycle(GO:0042636) |
| 0.0 | 0.9 | GO:0043044 | ATP-dependent chromatin remodeling(GO:0043044) |
| 0.0 | 0.1 | GO:2000505 | regulation of energy homeostasis(GO:2000505) |
| 0.0 | 0.1 | GO:0099500 | synaptic vesicle fusion to presynaptic active zone membrane(GO:0031629) vesicle fusion to plasma membrane(GO:0099500) |
| 0.0 | 0.0 | GO:0009125 | nucleoside monophosphate catabolic process(GO:0009125) |
| 0.0 | 0.0 | GO:0019303 | D-ribose catabolic process(GO:0019303) |
| 0.0 | 0.0 | GO:0060484 | lung-associated mesenchyme development(GO:0060484) |
| 0.0 | 0.0 | GO:0014809 | regulation of skeletal muscle contraction by regulation of release of sequestered calcium ion(GO:0014809) |
| 0.0 | 0.0 | GO:0048852 | diencephalon morphogenesis(GO:0048852) |
| 0.0 | 0.1 | GO:0014051 | gamma-aminobutyric acid secretion(GO:0014051) |
| 0.0 | 0.0 | GO:0035754 | B cell chemotaxis(GO:0035754) |
| 0.0 | 0.0 | GO:0021562 | vestibulocochlear nerve development(GO:0021562) |
| 0.0 | 0.1 | GO:1901142 | insulin metabolic process(GO:1901142) |
| 0.0 | 0.0 | GO:0009404 | toxin metabolic process(GO:0009404) |
| 0.0 | 0.3 | GO:0007041 | lysosomal transport(GO:0007041) |
| 0.0 | 0.0 | GO:2000328 | peptidyl-lysine oxidation(GO:0018057) regulation of T-helper 17 cell lineage commitment(GO:2000328) negative regulation of T-helper 17 cell lineage commitment(GO:2000329) |
| 0.0 | 0.1 | GO:0014841 | skeletal muscle satellite cell proliferation(GO:0014841) |
| 0.0 | 0.0 | GO:0007056 | spindle assembly involved in female meiosis(GO:0007056) |
| 0.0 | 0.0 | GO:0042427 | serotonin biosynthetic process(GO:0042427) |
| 0.0 | 0.1 | GO:0006600 | creatine metabolic process(GO:0006600) |
Gene overrepresentation in cellular component category:
| Log-likelihood per target | Total log-likelihood | Term | Description |
|---|---|---|---|
| 1.0 | 11.2 | GO:0005955 | calcineurin complex(GO:0005955) |
| 0.8 | 3.1 | GO:0032937 | SREBP-SCAP-Insig complex(GO:0032937) |
| 0.8 | 6.1 | GO:0098560 | cytoplasmic side of late endosome membrane(GO:0098560) |
| 0.7 | 9.1 | GO:0033256 | I-kappaB/NF-kappaB complex(GO:0033256) |
| 0.7 | 2.0 | GO:0071148 | TEAD-1-YAP complex(GO:0071148) |
| 0.6 | 3.7 | GO:1990682 | CSF1-CSF1R complex(GO:1990682) |
| 0.6 | 2.9 | GO:0032444 | activin responsive factor complex(GO:0032444) |
| 0.6 | 0.6 | GO:0019034 | viral replication complex(GO:0019034) |
| 0.6 | 2.3 | GO:1990851 | Wnt-Frizzled-LRP5/6 complex(GO:1990851) |
| 0.6 | 2.8 | GO:1990796 | photoreceptor cell terminal bouton(GO:1990796) |
| 0.6 | 1.7 | GO:0008623 | CHRAC(GO:0008623) |
| 0.5 | 1.6 | GO:0044753 | amphisome(GO:0044753) |
| 0.5 | 1.6 | GO:1990622 | CHOP-ATF3 complex(GO:1990622) |
| 0.5 | 0.5 | GO:0035867 | alphav-beta3 integrin-IGF-1-IGF1R complex(GO:0035867) |
| 0.5 | 2.5 | GO:0031302 | intrinsic component of endosome membrane(GO:0031302) |
| 0.5 | 1.9 | GO:0039713 | viral factory(GO:0039713) cytoplasmic viral factory(GO:0039714) host cell viral assembly compartment(GO:0072517) |
| 0.5 | 1.8 | GO:0098592 | cytoplasmic side of apical plasma membrane(GO:0098592) |
| 0.4 | 1.8 | GO:0097196 | Shu complex(GO:0097196) |
| 0.4 | 7.9 | GO:0035631 | CD40 receptor complex(GO:0035631) |
| 0.4 | 1.7 | GO:0035517 | PR-DUB complex(GO:0035517) |
| 0.4 | 7.6 | GO:0070578 | RISC-loading complex(GO:0070578) |
| 0.4 | 1.7 | GO:0005595 | collagen type XII trimer(GO:0005595) |
| 0.4 | 5.0 | GO:0032593 | insulin-responsive compartment(GO:0032593) |
| 0.4 | 1.2 | GO:0097135 | cyclin E2-CDK2 complex(GO:0097135) |
| 0.4 | 2.0 | GO:1902560 | GMP reductase complex(GO:1902560) |
| 0.4 | 9.7 | GO:0044300 | cerebellar mossy fiber(GO:0044300) |
| 0.4 | 1.4 | GO:0097629 | extrinsic component of omegasome membrane(GO:0097629) |
| 0.4 | 1.1 | GO:1990590 | ATF1-ATF4 transcription factor complex(GO:1990590) |
| 0.4 | 1.1 | GO:0098559 | cytoplasmic side of early endosome membrane(GO:0098559) |
| 0.3 | 5.9 | GO:0016600 | flotillin complex(GO:0016600) |
| 0.3 | 3.1 | GO:0071953 | elastic fiber(GO:0071953) |
| 0.3 | 1.7 | GO:0097513 | myosin II filament(GO:0097513) |
| 0.3 | 1.7 | GO:0005927 | muscle tendon junction(GO:0005927) |
| 0.3 | 4.3 | GO:0097136 | Bcl-2 family protein complex(GO:0097136) |
| 0.3 | 2.0 | GO:0070022 | transforming growth factor beta receptor homodimeric complex(GO:0070022) |
| 0.3 | 9.1 | GO:0035098 | ESC/E(Z) complex(GO:0035098) |
| 0.3 | 3.2 | GO:0097443 | sorting endosome(GO:0097443) |
| 0.3 | 10.9 | GO:0016327 | apicolateral plasma membrane(GO:0016327) |
| 0.3 | 6.9 | GO:0005952 | cAMP-dependent protein kinase complex(GO:0005952) |
| 0.3 | 0.6 | GO:0000805 | X chromosome(GO:0000805) |
| 0.3 | 3.1 | GO:0016589 | NURF complex(GO:0016589) |
| 0.3 | 1.5 | GO:0070826 | paraferritin complex(GO:0070826) |
| 0.3 | 2.0 | GO:0000308 | cytoplasmic cyclin-dependent protein kinase holoenzyme complex(GO:0000308) |
| 0.3 | 0.8 | GO:0060187 | cell pole(GO:0060187) |
| 0.3 | 1.4 | GO:0072558 | NLRP1 inflammasome complex(GO:0072558) |
| 0.3 | 0.8 | GO:0055028 | cortical microtubule(GO:0055028) |
| 0.3 | 2.4 | GO:0070531 | BRCA1-A complex(GO:0070531) |
| 0.3 | 7.2 | GO:0000145 | exocyst(GO:0000145) |
| 0.3 | 3.2 | GO:0000322 | storage vacuole(GO:0000322) |
| 0.2 | 4.9 | GO:0000177 | cytoplasmic exosome (RNase complex)(GO:0000177) |
| 0.2 | 1.5 | GO:0009331 | glycerol-3-phosphate dehydrogenase complex(GO:0009331) |
| 0.2 | 1.0 | GO:0005899 | insulin receptor complex(GO:0005899) |
| 0.2 | 2.7 | GO:0097470 | ribbon synapse(GO:0097470) |
| 0.2 | 2.4 | GO:0002116 | semaphorin receptor complex(GO:0002116) |
| 0.2 | 2.1 | GO:0001940 | male pronucleus(GO:0001940) |
| 0.2 | 2.1 | GO:0016012 | sarcoglycan complex(GO:0016012) |
| 0.2 | 2.1 | GO:0071546 | pi-body(GO:0071546) |
| 0.2 | 4.5 | GO:0001741 | XY body(GO:0001741) |
| 0.2 | 0.4 | GO:0071437 | invadopodium(GO:0071437) |
| 0.2 | 0.9 | GO:0017109 | glutamate-cysteine ligase complex(GO:0017109) |
| 0.2 | 0.7 | GO:0071062 | alphav-beta3 integrin-vitronectin complex(GO:0071062) |
| 0.2 | 1.8 | GO:0097197 | tetraspanin-enriched microdomain(GO:0097197) |
| 0.2 | 1.9 | GO:0000125 | PCAF complex(GO:0000125) |
| 0.2 | 12.6 | GO:0030173 | integral component of Golgi membrane(GO:0030173) |
| 0.2 | 0.8 | GO:1990589 | ATF4-CREB1 transcription factor complex(GO:1990589) |
| 0.2 | 0.6 | GO:0005900 | oncostatin-M receptor complex(GO:0005900) |
| 0.2 | 2.4 | GO:0000124 | SAGA complex(GO:0000124) |
| 0.2 | 1.8 | GO:1990761 | growth cone lamellipodium(GO:1990761) |
| 0.2 | 0.6 | GO:1990917 | sperm head plasma membrane(GO:1990913) ooplasm(GO:1990917) |
| 0.2 | 0.9 | GO:0032301 | MutSalpha complex(GO:0032301) |
| 0.2 | 0.4 | GO:0016011 | dystroglycan complex(GO:0016011) |
| 0.2 | 1.8 | GO:0042584 | chromaffin granule membrane(GO:0042584) |
| 0.2 | 2.8 | GO:0031209 | SCAR complex(GO:0031209) |
| 0.2 | 1.6 | GO:0098845 | postsynaptic endosome(GO:0098845) |
| 0.2 | 0.2 | GO:1902710 | GABA receptor complex(GO:1902710) |
| 0.2 | 1.8 | GO:0005964 | phosphorylase kinase complex(GO:0005964) |
| 0.2 | 0.5 | GO:0035068 | micro-ribonucleoprotein complex(GO:0035068) |
| 0.2 | 0.4 | GO:0034686 | integrin alphav-beta8 complex(GO:0034686) |
| 0.2 | 16.8 | GO:0045178 | basal part of cell(GO:0045178) |
| 0.2 | 0.7 | GO:0020018 | ciliary pocket(GO:0020016) ciliary pocket membrane(GO:0020018) |
| 0.2 | 0.9 | GO:0048179 | activin receptor complex(GO:0048179) |
| 0.2 | 2.8 | GO:0042555 | MCM complex(GO:0042555) |
| 0.2 | 0.5 | GO:0070195 | growth hormone receptor complex(GO:0070195) |
| 0.2 | 0.8 | GO:0042567 | insulin-like growth factor ternary complex(GO:0042567) |
| 0.2 | 1.7 | GO:0061689 | tricellular tight junction(GO:0061689) |
| 0.2 | 1.3 | GO:0032777 | Piccolo NuA4 histone acetyltransferase complex(GO:0032777) |
| 0.2 | 11.4 | GO:0031907 | peroxisomal matrix(GO:0005782) microbody lumen(GO:0031907) |
| 0.2 | 1.6 | GO:0051286 | cell tip(GO:0051286) |
| 0.2 | 0.5 | GO:0036387 | nuclear pre-replicative complex(GO:0005656) pre-replicative complex(GO:0036387) |
| 0.2 | 0.8 | GO:0034991 | nuclear meiotic cohesin complex(GO:0034991) |
| 0.2 | 0.5 | GO:0035189 | Rb-E2F complex(GO:0035189) |
| 0.2 | 5.7 | GO:0032839 | dendrite cytoplasm(GO:0032839) |
| 0.2 | 0.2 | GO:0030981 | cortical microtubule cytoskeleton(GO:0030981) |
| 0.2 | 3.5 | GO:0097342 | ripoptosome(GO:0097342) |
| 0.2 | 0.9 | GO:0071144 | SMAD2-SMAD3 protein complex(GO:0071144) |
| 0.1 | 0.9 | GO:1990246 | uniplex complex(GO:1990246) |
| 0.1 | 0.1 | GO:0070552 | BRISC complex(GO:0070552) |
| 0.1 | 1.2 | GO:1903440 | calcitonin family receptor complex(GO:1903439) amylin receptor complex(GO:1903440) |
| 0.1 | 0.3 | GO:0044326 | dendritic spine neck(GO:0044326) |
| 0.1 | 1.3 | GO:0070765 | gamma-secretase complex(GO:0070765) |
| 0.1 | 1.3 | GO:0030061 | mitochondrial crista(GO:0030061) |
| 0.1 | 1.5 | GO:0031465 | Cul4B-RING E3 ubiquitin ligase complex(GO:0031465) |
| 0.1 | 1.5 | GO:0000931 | gamma-tubulin large complex(GO:0000931) gamma-tubulin ring complex(GO:0008274) |
| 0.1 | 6.7 | GO:0099738 | cell cortex region(GO:0099738) |
| 0.1 | 0.5 | GO:0044307 | dendritic branch(GO:0044307) |
| 0.1 | 3.1 | GO:0042405 | nuclear inclusion body(GO:0042405) |
| 0.1 | 2.0 | GO:1990023 | mitotic spindle midzone(GO:1990023) |
| 0.1 | 0.5 | GO:0090498 | extrinsic component of Golgi membrane(GO:0090498) |
| 0.1 | 0.5 | GO:0098554 | cytoplasmic side of endoplasmic reticulum membrane(GO:0098554) |
| 0.1 | 0.3 | GO:0031510 | SUMO activating enzyme complex(GO:0031510) |
| 0.1 | 0.6 | GO:0005854 | nascent polypeptide-associated complex(GO:0005854) |
| 0.1 | 1.0 | GO:0002169 | 3-methylcrotonyl-CoA carboxylase complex, mitochondrial(GO:0002169) methylcrotonoyl-CoA carboxylase complex(GO:1905202) |
| 0.1 | 0.3 | GO:0036117 | hyaluranon cable(GO:0036117) |
| 0.1 | 17.4 | GO:0070821 | tertiary granule membrane(GO:0070821) |
| 0.1 | 1.8 | GO:0070775 | H3 histone acetyltransferase complex(GO:0070775) MOZ/MORF histone acetyltransferase complex(GO:0070776) |
| 0.1 | 1.1 | GO:0031211 | serine C-palmitoyltransferase complex(GO:0017059) endoplasmic reticulum palmitoyltransferase complex(GO:0031211) |
| 0.1 | 1.6 | GO:0098647 | collagen type VI trimer(GO:0005589) collagen beaded filament(GO:0098647) |
| 0.1 | 0.5 | GO:0005896 | interleukin-6 receptor complex(GO:0005896) |
| 0.1 | 4.6 | GO:0000421 | autophagosome membrane(GO:0000421) |
| 0.1 | 1.8 | GO:0051233 | spindle midzone(GO:0051233) |
| 0.1 | 3.0 | GO:0035327 | transcriptionally active chromatin(GO:0035327) |
| 0.1 | 1.4 | GO:0000506 | glycosylphosphatidylinositol-N-acetylglucosaminyltransferase (GPI-GnT) complex(GO:0000506) |
| 0.1 | 0.3 | GO:0097057 | TRAF2-GSTP1 complex(GO:0097057) |
| 0.1 | 17.5 | GO:0043202 | lysosomal lumen(GO:0043202) |
| 0.1 | 0.2 | GO:1990723 | cytoplasmic periphery of the nuclear pore complex(GO:1990723) |
| 0.1 | 1.8 | GO:0034518 | RNA cap binding complex(GO:0034518) |
| 0.1 | 0.1 | GO:0048237 | rough endoplasmic reticulum lumen(GO:0048237) |
| 0.1 | 2.5 | GO:0043218 | compact myelin(GO:0043218) |
| 0.1 | 1.1 | GO:0045252 | oxoglutarate dehydrogenase complex(GO:0045252) |
| 0.1 | 1.2 | GO:0042382 | paraspeckles(GO:0042382) |
| 0.1 | 0.8 | GO:0097442 | CA3 pyramidal cell dendrite(GO:0097442) |
| 0.1 | 8.4 | GO:0030864 | cortical actin cytoskeleton(GO:0030864) |
| 0.1 | 0.3 | GO:0005953 | CAAX-protein geranylgeranyltransferase complex(GO:0005953) |
| 0.1 | 0.6 | GO:0005797 | Golgi medial cisterna(GO:0005797) |
| 0.1 | 1.4 | GO:0005785 | signal recognition particle receptor complex(GO:0005785) |
| 0.1 | 2.0 | GO:0097386 | glial cell projection(GO:0097386) |
| 0.1 | 0.6 | GO:1990131 | Gtr1-Gtr2 GTPase complex(GO:1990131) |
| 0.1 | 3.1 | GO:0090545 | NuRD complex(GO:0016581) CHD-type complex(GO:0090545) |
| 0.1 | 1.1 | GO:0005577 | fibrinogen complex(GO:0005577) |
| 0.1 | 1.2 | GO:0060091 | kinocilium(GO:0060091) |
| 0.1 | 4.2 | GO:0034451 | centriolar satellite(GO:0034451) |
| 0.1 | 0.9 | GO:0072487 | MSL complex(GO:0072487) |
| 0.1 | 14.0 | GO:0030175 | filopodium(GO:0030175) |
| 0.1 | 0.5 | GO:0042643 | actomyosin, actin portion(GO:0042643) |
| 0.1 | 1.8 | GO:0016281 | eukaryotic translation initiation factor 4F complex(GO:0016281) |
| 0.1 | 0.1 | GO:1903349 | omegasome membrane(GO:1903349) |
| 0.1 | 0.8 | GO:0042406 | extrinsic component of endoplasmic reticulum membrane(GO:0042406) |
| 0.1 | 3.9 | GO:0005921 | gap junction(GO:0005921) |
| 0.1 | 0.5 | GO:0032449 | CBM complex(GO:0032449) |
| 0.1 | 0.7 | GO:0071664 | catenin-TCF7L2 complex(GO:0071664) |
| 0.1 | 1.5 | GO:0000813 | ESCRT I complex(GO:0000813) |
| 0.1 | 0.4 | GO:0005784 | Sec61 translocon complex(GO:0005784) translocon complex(GO:0071256) |
| 0.1 | 1.2 | GO:0016461 | unconventional myosin complex(GO:0016461) |
| 0.1 | 1.5 | GO:0031528 | microvillus membrane(GO:0031528) |
| 0.1 | 2.3 | GO:0005686 | U2 snRNP(GO:0005686) |
| 0.1 | 3.0 | GO:0031233 | intrinsic component of external side of plasma membrane(GO:0031233) |
| 0.1 | 6.0 | GO:0035579 | specific granule membrane(GO:0035579) |
| 0.1 | 1.2 | GO:0033180 | proton-transporting V-type ATPase, V1 domain(GO:0033180) |
| 0.1 | 0.1 | GO:0000839 | Hrd1p ubiquitin ligase ERAD-L complex(GO:0000839) |
| 0.1 | 0.4 | GO:0042583 | chromaffin granule(GO:0042583) |
| 0.1 | 0.4 | GO:0070381 | endosome to plasma membrane transport vesicle(GO:0070381) |
| 0.1 | 0.6 | GO:0032021 | NELF complex(GO:0032021) |
| 0.1 | 2.0 | GO:0001527 | microfibril(GO:0001527) fibril(GO:0043205) |
| 0.1 | 3.6 | GO:0031092 | platelet alpha granule membrane(GO:0031092) |
| 0.1 | 8.6 | GO:0031093 | platelet alpha granule lumen(GO:0031093) |
| 0.1 | 3.0 | GO:0042629 | mast cell granule(GO:0042629) |
| 0.1 | 8.0 | GO:0031463 | Cul3-RING ubiquitin ligase complex(GO:0031463) |
| 0.1 | 0.4 | GO:0036396 | MIS complex(GO:0036396) mRNA editing complex(GO:0045293) |
| 0.1 | 0.9 | GO:0035253 | ciliary rootlet(GO:0035253) |
| 0.1 | 0.9 | GO:0016593 | Cdc73/Paf1 complex(GO:0016593) |
| 0.1 | 0.6 | GO:0071438 | invadopodium membrane(GO:0071438) |
| 0.1 | 0.5 | GO:0005958 | DNA-dependent protein kinase-DNA ligase 4 complex(GO:0005958) |
| 0.1 | 0.5 | GO:0097255 | R2TP complex(GO:0097255) |
| 0.1 | 2.9 | GO:0030140 | trans-Golgi network transport vesicle(GO:0030140) |
| 0.1 | 1.0 | GO:0043020 | NADPH oxidase complex(GO:0043020) |
| 0.1 | 13.4 | GO:0000932 | cytoplasmic mRNA processing body(GO:0000932) |
| 0.1 | 0.6 | GO:0034663 | endoplasmic reticulum chaperone complex(GO:0034663) |
| 0.1 | 6.2 | GO:0016459 | myosin complex(GO:0016459) |
| 0.1 | 0.2 | GO:0071149 | TEAD-2-YAP complex(GO:0071149) |
| 0.1 | 0.4 | GO:0032044 | DSIF complex(GO:0032044) |
| 0.1 | 0.2 | GO:0044611 | nuclear pore inner ring(GO:0044611) |
| 0.1 | 7.0 | GO:0033116 | endoplasmic reticulum-Golgi intermediate compartment membrane(GO:0033116) |
| 0.1 | 0.2 | GO:0042612 | MHC class I protein complex(GO:0042612) |
| 0.1 | 3.1 | GO:0005801 | cis-Golgi network(GO:0005801) |
| 0.1 | 1.0 | GO:0031906 | late endosome lumen(GO:0031906) |
| 0.1 | 1.6 | GO:0031235 | intrinsic component of the cytoplasmic side of the plasma membrane(GO:0031235) |
| 0.1 | 1.5 | GO:0030122 | AP-2 adaptor complex(GO:0030122) |
| 0.1 | 3.7 | GO:0045171 | intercellular bridge(GO:0045171) |
| 0.1 | 2.0 | GO:0001891 | phagocytic cup(GO:0001891) |
| 0.1 | 0.1 | GO:0005687 | U4 snRNP(GO:0005687) |
| 0.1 | 0.6 | GO:0030896 | checkpoint clamp complex(GO:0030896) |
| 0.1 | 0.8 | GO:0014731 | spectrin-associated cytoskeleton(GO:0014731) |
| 0.1 | 2.5 | GO:0071564 | npBAF complex(GO:0071564) |
| 0.1 | 0.5 | GO:0005885 | Arp2/3 protein complex(GO:0005885) |
| 0.1 | 1.0 | GO:0005862 | muscle thin filament tropomyosin(GO:0005862) |
| 0.1 | 0.3 | GO:0002079 | inner acrosomal membrane(GO:0002079) |
| 0.1 | 1.4 | GO:0060077 | inhibitory synapse(GO:0060077) |
| 0.1 | 1.6 | GO:0005942 | phosphatidylinositol 3-kinase complex(GO:0005942) |
| 0.1 | 0.8 | GO:0033588 | Elongator holoenzyme complex(GO:0033588) |
| 0.1 | 0.3 | GO:0071001 | U4/U6 snRNP(GO:0071001) |
| 0.1 | 0.4 | GO:0089701 | U2AF(GO:0089701) |
| 0.1 | 2.8 | GO:0031201 | SNARE complex(GO:0031201) |
| 0.1 | 7.1 | GO:0005581 | collagen trimer(GO:0005581) |
| 0.1 | 1.5 | GO:0005790 | smooth endoplasmic reticulum(GO:0005790) |
| 0.1 | 0.7 | GO:0005641 | nuclear envelope lumen(GO:0005641) |
| 0.1 | 0.1 | GO:0071598 | neuronal ribonucleoprotein granule(GO:0071598) |
| 0.1 | 0.7 | GO:0031088 | platelet dense granule membrane(GO:0031088) |
| 0.1 | 0.2 | GO:0032116 | SMC loading complex(GO:0032116) |
| 0.1 | 9.0 | GO:0016363 | nuclear matrix(GO:0016363) |
| 0.1 | 0.5 | GO:0005787 | signal peptidase complex(GO:0005787) |
| 0.1 | 0.5 | GO:0097038 | perinuclear endoplasmic reticulum(GO:0097038) |
| 0.1 | 26.9 | GO:0005667 | transcription factor complex(GO:0005667) |
| 0.1 | 1.7 | GO:0031672 | A band(GO:0031672) |
| 0.1 | 0.2 | GO:0000923 | equatorial microtubule organizing center(GO:0000923) |
| 0.1 | 0.2 | GO:0030312 | external encapsulating structure(GO:0030312) |
| 0.1 | 0.2 | GO:0032144 | 4-aminobutyrate transaminase complex(GO:0032144) |
| 0.1 | 10.0 | GO:0030176 | integral component of endoplasmic reticulum membrane(GO:0030176) |
| 0.1 | 1.6 | GO:0002080 | acrosomal membrane(GO:0002080) |
| 0.1 | 1.1 | GO:0005682 | U5 snRNP(GO:0005682) |
| 0.1 | 0.7 | GO:0034098 | VCP-NPL4-UFD1 AAA ATPase complex(GO:0034098) |
| 0.1 | 0.4 | GO:0043541 | UDP-N-acetylglucosamine transferase complex(GO:0043541) |
| 0.1 | 0.9 | GO:0034045 | pre-autophagosomal structure membrane(GO:0034045) |
| 0.1 | 0.2 | GO:0072357 | PTW/PP1 phosphatase complex(GO:0072357) |
| 0.1 | 1.2 | GO:0000780 | condensed nuclear chromosome, centromeric region(GO:0000780) |
| 0.1 | 0.4 | GO:0033093 | Weibel-Palade body(GO:0033093) |
| 0.1 | 0.2 | GO:0005715 | late recombination nodule(GO:0005715) |
| 0.1 | 2.0 | GO:0043034 | costamere(GO:0043034) |
| 0.1 | 0.3 | GO:0071012 | catalytic step 1 spliceosome(GO:0071012) |
| 0.1 | 0.2 | GO:1990879 | CST complex(GO:1990879) |
| 0.1 | 0.2 | GO:0097224 | sperm connecting piece(GO:0097224) |
| 0.1 | 0.4 | GO:0005851 | eukaryotic translation initiation factor 2B complex(GO:0005851) |
| 0.1 | 0.2 | GO:0071920 | cleavage body(GO:0071920) |
| 0.0 | 0.5 | GO:0097440 | apical dendrite(GO:0097440) |
| 0.0 | 0.3 | GO:0044294 | dendritic growth cone(GO:0044294) |
| 0.0 | 0.7 | GO:0000164 | protein phosphatase type 1 complex(GO:0000164) |
| 0.0 | 0.0 | GO:0035061 | interchromatin granule(GO:0035061) |
| 0.0 | 0.5 | GO:0048500 | signal recognition particle, endoplasmic reticulum targeting(GO:0005786) signal recognition particle(GO:0048500) |
| 0.0 | 0.1 | GO:0016938 | kinesin I complex(GO:0016938) |
| 0.0 | 0.3 | GO:0031415 | NatA complex(GO:0031415) |
| 0.0 | 0.1 | GO:1990730 | VCP-NSFL1C complex(GO:1990730) |
| 0.0 | 1.0 | GO:0097025 | MPP7-DLG1-LIN7 complex(GO:0097025) |
| 0.0 | 0.2 | GO:0000243 | commitment complex(GO:0000243) |
| 0.0 | 2.8 | GO:0005905 | clathrin-coated pit(GO:0005905) |
| 0.0 | 5.3 | GO:0016605 | PML body(GO:0016605) |
| 0.0 | 0.6 | GO:0008290 | F-actin capping protein complex(GO:0008290) |
| 0.0 | 0.2 | GO:0043291 | RAVE complex(GO:0043291) |
| 0.0 | 0.3 | GO:0005685 | U1 snRNP(GO:0005685) |
| 0.0 | 23.8 | GO:0005925 | focal adhesion(GO:0005925) |
| 0.0 | 1.1 | GO:0034361 | very-low-density lipoprotein particle(GO:0034361) triglyceride-rich lipoprotein particle(GO:0034385) |
| 0.0 | 1.4 | GO:0008023 | transcription elongation factor complex(GO:0008023) |
| 0.0 | 0.3 | GO:0044615 | nuclear pore nuclear basket(GO:0044615) |
| 0.0 | 0.1 | GO:0045323 | interleukin-1 receptor complex(GO:0045323) |
| 0.0 | 0.1 | GO:0034657 | GID complex(GO:0034657) |
| 0.0 | 0.2 | GO:0000176 | nuclear exosome (RNase complex)(GO:0000176) |
| 0.0 | 0.2 | GO:0031466 | Cul5-RING ubiquitin ligase complex(GO:0031466) |
| 0.0 | 0.6 | GO:0005833 | hemoglobin complex(GO:0005833) |
| 0.0 | 0.4 | GO:0042641 | actomyosin(GO:0042641) |
| 0.0 | 0.3 | GO:0042588 | zymogen granule(GO:0042588) |
| 0.0 | 0.1 | GO:0071817 | MMXD complex(GO:0071817) |
| 0.0 | 0.8 | GO:0005779 | integral component of peroxisomal membrane(GO:0005779) intrinsic component of peroxisomal membrane(GO:0031231) |
| 0.0 | 0.2 | GO:0030906 | retromer, cargo-selective complex(GO:0030906) |
| 0.0 | 0.5 | GO:0032045 | guanyl-nucleotide exchange factor complex(GO:0032045) |
| 0.0 | 0.2 | GO:0045281 | mitochondrial respiratory chain complex II, succinate dehydrogenase complex (ubiquinone)(GO:0005749) succinate dehydrogenase complex (ubiquinone)(GO:0045257) respiratory chain complex II(GO:0045273) succinate dehydrogenase complex(GO:0045281) fumarate reductase complex(GO:0045283) |
| 0.0 | 2.0 | GO:0045271 | mitochondrial respiratory chain complex I(GO:0005747) NADH dehydrogenase complex(GO:0030964) respiratory chain complex I(GO:0045271) |
| 0.0 | 0.0 | GO:0042721 | mitochondrial inner membrane protein insertion complex(GO:0042721) |
| 0.0 | 0.2 | GO:0008622 | epsilon DNA polymerase complex(GO:0008622) |
| 0.0 | 0.1 | GO:0031205 | endoplasmic reticulum Sec complex(GO:0031205) |
| 0.0 | 0.4 | GO:0008385 | IkappaB kinase complex(GO:0008385) |
| 0.0 | 0.4 | GO:0070937 | CRD-mediated mRNA stability complex(GO:0070937) |
| 0.0 | 0.5 | GO:0090544 | BAF-type complex(GO:0090544) |
| 0.0 | 0.7 | GO:0005665 | DNA-directed RNA polymerase II, core complex(GO:0005665) |
| 0.0 | 0.1 | GO:0030915 | Smc5-Smc6 complex(GO:0030915) |
| 0.0 | 0.1 | GO:0097165 | nuclear stress granule(GO:0097165) |
| 0.0 | 0.3 | GO:0033018 | sarcoplasmic reticulum lumen(GO:0033018) |
| 0.0 | 0.1 | GO:0032389 | MutLalpha complex(GO:0032389) |
| 0.0 | 3.4 | GO:0044306 | neuron projection terminus(GO:0044306) |
| 0.0 | 0.2 | GO:0098536 | deuterosome(GO:0098536) |
| 0.0 | 0.2 | GO:0036157 | outer dynein arm(GO:0036157) |
| 0.0 | 0.4 | GO:0061700 | GATOR2 complex(GO:0061700) |
| 0.0 | 0.0 | GO:0097598 | sperm cytoplasmic droplet(GO:0097598) |
| 0.0 | 0.5 | GO:0031011 | Ino80 complex(GO:0031011) DNA helicase complex(GO:0033202) |
| 0.0 | 0.4 | GO:0031089 | platelet dense granule lumen(GO:0031089) |
| 0.0 | 0.1 | GO:0030956 | glutamyl-tRNA(Gln) amidotransferase complex(GO:0030956) |
| 0.0 | 1.5 | GO:0005834 | heterotrimeric G-protein complex(GO:0005834) |
| 0.0 | 0.0 | GO:0034715 | pICln-Sm protein complex(GO:0034715) |
| 0.0 | 0.2 | GO:0030863 | cortical cytoskeleton(GO:0030863) |
| 0.0 | 0.1 | GO:0030678 | mitochondrial ribonuclease P complex(GO:0030678) |
| 0.0 | 0.1 | GO:0071752 | dimeric IgA immunoglobulin complex(GO:0071750) secretory dimeric IgA immunoglobulin complex(GO:0071752) |
| 0.0 | 0.2 | GO:0010369 | chromocenter(GO:0010369) |
| 0.0 | 0.1 | GO:0034455 | t-UTP complex(GO:0034455) |
| 0.0 | 0.2 | GO:0000808 | origin recognition complex(GO:0000808) nuclear origin of replication recognition complex(GO:0005664) |
| 0.0 | 1.5 | GO:0000315 | organellar large ribosomal subunit(GO:0000315) mitochondrial large ribosomal subunit(GO:0005762) |
| 0.0 | 0.1 | GO:0005947 | mitochondrial alpha-ketoglutarate dehydrogenase complex(GO:0005947) |
| 0.0 | 0.4 | GO:0035102 | PRC1 complex(GO:0035102) |
| 0.0 | 1.9 | GO:0005758 | mitochondrial intermembrane space(GO:0005758) |
| 0.0 | 0.6 | GO:0097381 | photoreceptor disc membrane(GO:0097381) |
| 0.0 | 0.3 | GO:0034364 | high-density lipoprotein particle(GO:0034364) |
| 0.0 | 0.1 | GO:1990075 | periciliary membrane compartment(GO:1990075) |
| 0.0 | 1.0 | GO:1904724 | tertiary granule lumen(GO:1904724) |
| 0.0 | 0.3 | GO:0071682 | endocytic vesicle lumen(GO:0071682) |
| 0.0 | 0.0 | GO:0000798 | nuclear cohesin complex(GO:0000798) |
| 0.0 | 0.0 | GO:0001674 | female germ cell nucleus(GO:0001674) |
| 0.0 | 0.2 | GO:0044352 | pinosome(GO:0044352) macropinosome(GO:0044354) |
| 0.0 | 0.2 | GO:0030123 | AP-3 adaptor complex(GO:0030123) |
| 0.0 | 0.1 | GO:0060293 | P granule(GO:0043186) pole plasm(GO:0045495) germ plasm(GO:0060293) |
| 0.0 | 0.3 | GO:0005847 | mRNA cleavage and polyadenylation specificity factor complex(GO:0005847) |
| 0.0 | 0.2 | GO:0008540 | proteasome regulatory particle, base subcomplex(GO:0008540) |
| 0.0 | 0.4 | GO:0005614 | interstitial matrix(GO:0005614) |
| 0.0 | 0.7 | GO:0005761 | organellar ribosome(GO:0000313) mitochondrial ribosome(GO:0005761) |
| 0.0 | 0.2 | GO:0042105 | alpha-beta T cell receptor complex(GO:0042105) |
| 0.0 | 0.2 | GO:0030897 | HOPS complex(GO:0030897) |
| 0.0 | 2.2 | GO:0030027 | lamellipodium(GO:0030027) |
| 0.0 | 0.1 | GO:0032009 | early phagosome(GO:0032009) |
| 0.0 | 0.0 | GO:0098576 | lumenal side of membrane(GO:0098576) |
| 0.0 | 0.1 | GO:0071986 | Ragulator complex(GO:0071986) |
| 0.0 | 0.4 | GO:0044322 | endoplasmic reticulum quality control compartment(GO:0044322) |
| 0.0 | 0.1 | GO:0042611 | MHC protein complex(GO:0042611) |
| 0.0 | 0.3 | GO:0031932 | TORC2 complex(GO:0031932) |
| 0.0 | 0.1 | GO:0072559 | NLRP3 inflammasome complex(GO:0072559) |
| 0.0 | 1.2 | GO:0034707 | chloride channel complex(GO:0034707) |
| 0.0 | 0.1 | GO:0034464 | BBSome(GO:0034464) |
| 0.0 | 0.0 | GO:0046696 | lipopolysaccharide receptor complex(GO:0046696) |
| 0.0 | 0.9 | GO:0031902 | late endosome membrane(GO:0031902) |
| 0.0 | 0.7 | GO:0016529 | sarcoplasmic reticulum(GO:0016529) |
Gene overrepresentation in molecular function category:
| Log-likelihood per target | Total log-likelihood | Term | Description |
|---|---|---|---|
| 2.9 | 20.6 | GO:0001225 | RNA polymerase II transcription coactivator binding(GO:0001225) |
| 1.6 | 6.2 | GO:0098808 | mRNA cap binding(GO:0098808) |
| 1.3 | 11.8 | GO:0033192 | calmodulin-dependent protein phosphatase activity(GO:0033192) |
| 1.1 | 6.8 | GO:0004699 | calcium-independent protein kinase C activity(GO:0004699) |
| 1.1 | 5.4 | GO:0047280 | nicotinamide phosphoribosyltransferase activity(GO:0047280) |
| 1.0 | 3.1 | GO:1904928 | coreceptor activity involved in canonical Wnt signaling pathway(GO:1904928) |
| 1.0 | 4.0 | GO:0016524 | latrotoxin receptor activity(GO:0016524) |
| 1.0 | 5.9 | GO:0050659 | N-acetylgalactosamine 4-sulfate 6-O-sulfotransferase activity(GO:0050659) |
| 1.0 | 2.9 | GO:0005292 | high-affinity basic amino acid transmembrane transporter activity(GO:0005287) high-affinity arginine transmembrane transporter activity(GO:0005289) high-affinity lysine transmembrane transporter activity(GO:0005292) |
| 1.0 | 4.8 | GO:0070573 | metallodipeptidase activity(GO:0070573) |
| 0.9 | 2.8 | GO:0031783 | corticotropin hormone receptor binding(GO:0031780) type 5 melanocortin receptor binding(GO:0031783) |
| 0.9 | 2.7 | GO:0004850 | uridine phosphorylase activity(GO:0004850) |
| 0.9 | 2.6 | GO:0072590 | N-acetyl-L-aspartate-L-glutamate ligase activity(GO:0072590) |
| 0.8 | 3.3 | GO:0004306 | ethanolamine-phosphate cytidylyltransferase activity(GO:0004306) |
| 0.8 | 4.9 | GO:0038062 | protein tyrosine kinase collagen receptor activity(GO:0038062) |
| 0.8 | 3.3 | GO:0022865 | transmembrane electron transfer carrier(GO:0022865) |
| 0.8 | 2.3 | GO:0080023 | 3R-hydroxyacyl-CoA dehydratase activity(GO:0080023) |
| 0.8 | 4.6 | GO:0042392 | sphingosine-1-phosphate phosphatase activity(GO:0042392) |
| 0.8 | 3.0 | GO:0035939 | microsatellite binding(GO:0035939) |
| 0.8 | 2.3 | GO:0046577 | long-chain-alcohol oxidase activity(GO:0046577) |
| 0.8 | 1.5 | GO:0017002 | activin-activated receptor activity(GO:0017002) |
| 0.8 | 12.8 | GO:0008140 | cAMP response element binding protein binding(GO:0008140) |
| 0.7 | 6.7 | GO:0004571 | mannosyl-oligosaccharide 1,2-alpha-mannosidase activity(GO:0004571) |
| 0.7 | 5.9 | GO:0008269 | JAK pathway signal transduction adaptor activity(GO:0008269) |
| 0.7 | 2.9 | GO:0061769 | ribosylnicotinamide kinase activity(GO:0050262) ribosylnicotinate kinase activity(GO:0061769) |
| 0.7 | 3.6 | GO:0004719 | protein-L-isoaspartate (D-aspartate) O-methyltransferase activity(GO:0004719) |
| 0.7 | 2.9 | GO:0016211 | glutamate-ammonia ligase activity(GO:0004356) ammonia ligase activity(GO:0016211) acid-ammonia (or amide) ligase activity(GO:0016880) |
| 0.7 | 2.2 | GO:0070506 | high-density lipoprotein particle receptor activity(GO:0070506) |
| 0.7 | 2.7 | GO:0004923 | leukemia inhibitory factor receptor activity(GO:0004923) |
| 0.7 | 2.0 | GO:0008431 | vitamin E binding(GO:0008431) |
| 0.7 | 5.2 | GO:0009008 | DNA-methyltransferase activity(GO:0009008) |
| 0.6 | 5.1 | GO:0008934 | inositol monophosphate 1-phosphatase activity(GO:0008934) inositol monophosphate 3-phosphatase activity(GO:0052832) inositol monophosphate 4-phosphatase activity(GO:0052833) inositol monophosphate phosphatase activity(GO:0052834) |
| 0.6 | 2.6 | GO:0019770 | IgG receptor activity(GO:0019770) |
| 0.6 | 1.9 | GO:0042008 | interleukin-18 receptor activity(GO:0042008) |
| 0.6 | 2.4 | GO:0052901 | polyamine oxidase activity(GO:0046592) spermine:oxygen oxidoreductase (spermidine-forming) activity(GO:0052901) |
| 0.6 | 2.4 | GO:0003987 | acetate-CoA ligase activity(GO:0003987) |
| 0.6 | 2.3 | GO:0035033 | histone deacetylase regulator activity(GO:0035033) |
| 0.6 | 1.7 | GO:0051990 | (R)-2-hydroxyglutarate dehydrogenase activity(GO:0051990) |
| 0.6 | 2.9 | GO:0004905 | type I interferon receptor activity(GO:0004905) |
| 0.6 | 1.7 | GO:0004531 | deoxyribonuclease II activity(GO:0004531) |
| 0.6 | 2.2 | GO:0047192 | 1-alkylglycerophosphocholine O-acetyltransferase activity(GO:0047192) |
| 0.6 | 6.1 | GO:0032051 | clathrin light chain binding(GO:0032051) |
| 0.5 | 3.3 | GO:0071074 | eukaryotic initiation factor eIF2 binding(GO:0071074) |
| 0.5 | 2.2 | GO:0051765 | inositol tetrakisphosphate kinase activity(GO:0051765) |
| 0.5 | 1.6 | GO:0008903 | hydroxypyruvate isomerase activity(GO:0008903) |
| 0.5 | 3.7 | GO:0005157 | macrophage colony-stimulating factor receptor binding(GO:0005157) |
| 0.5 | 2.6 | GO:0030298 | receptor signaling protein tyrosine kinase activator activity(GO:0030298) |
| 0.5 | 3.1 | GO:0039552 | RIG-I binding(GO:0039552) |
| 0.5 | 4.1 | GO:0015235 | cobalamin transporter activity(GO:0015235) |
| 0.5 | 2.0 | GO:0003943 | N-acetylgalactosamine-4-sulfatase activity(GO:0003943) |
| 0.5 | 1.5 | GO:0005010 | insulin-like growth factor-activated receptor activity(GO:0005010) |
| 0.5 | 2.5 | GO:0001888 | glucuronyl-galactosyl-proteoglycan 4-alpha-N-acetylglucosaminyltransferase activity(GO:0001888) |
| 0.5 | 3.9 | GO:0015093 | ferrous iron transmembrane transporter activity(GO:0015093) |
| 0.5 | 2.4 | GO:0005087 | Ran guanyl-nucleotide exchange factor activity(GO:0005087) |
| 0.5 | 1.9 | GO:1904408 | dihydronicotinamide riboside quinone reductase activity(GO:0001512) melatonin binding(GO:1904408) |
| 0.5 | 1.4 | GO:0050613 | delta14-sterol reductase activity(GO:0050613) |
| 0.5 | 2.8 | GO:0004310 | farnesyl-diphosphate farnesyltransferase activity(GO:0004310) squalene synthase activity(GO:0051996) |
| 0.5 | 2.8 | GO:0008486 | endopolyphosphatase activity(GO:0000298) diphosphoinositol-polyphosphate diphosphatase activity(GO:0008486) bis(5'-adenosyl)-hexaphosphatase activity(GO:0034431) bis(5'-adenosyl)-pentaphosphatase activity(GO:0034432) inositol diphosphate tetrakisphosphate diphosphatase activity(GO:0052840) inositol bisdiphosphate tetrakisphosphate diphosphatase activity(GO:0052841) inositol diphosphate pentakisphosphate diphosphatase activity(GO:0052842) inositol-1-diphosphate-2,3,4,5,6-pentakisphosphate diphosphatase activity(GO:0052843) inositol-3-diphosphate-1,2,4,5,6-pentakisphosphate diphosphatase activity(GO:0052844) inositol-5-diphosphate-1,2,3,4,6-pentakisphosphate diphosphatase activity(GO:0052845) inositol-1,5-bisdiphosphate-2,3,4,6-tetrakisphosphate 1-diphosphatase activity(GO:0052846) inositol-1,5-bisdiphosphate-2,3,4,6-tetrakisphosphate 5-diphosphatase activity(GO:0052847) inositol-3,5-bisdiphosphate-2,3,4,6-tetrakisphosphate 5-diphosphatase activity(GO:0052848) |
| 0.5 | 1.8 | GO:0003985 | acetyl-CoA C-acetyltransferase activity(GO:0003985) |
| 0.5 | 0.9 | GO:0086020 | gap junction channel activity involved in SA node cell-atrial cardiac muscle cell electrical coupling(GO:0086020) |
| 0.4 | 3.1 | GO:0016900 | oxidoreductase activity, acting on the CH-OH group of donors, disulfide as acceptor(GO:0016900) vitamin-K-epoxide reductase (warfarin-sensitive) activity(GO:0047057) |
| 0.4 | 1.3 | GO:0004170 | dUTP diphosphatase activity(GO:0004170) |
| 0.4 | 2.2 | GO:0043183 | vascular endothelial growth factor receptor 1 binding(GO:0043183) |
| 0.4 | 1.3 | GO:0000253 | 3-keto sterol reductase activity(GO:0000253) |
| 0.4 | 1.3 | GO:0034602 | oxoglutarate dehydrogenase (NAD+) activity(GO:0034602) |
| 0.4 | 4.3 | GO:0005114 | type II transforming growth factor beta receptor binding(GO:0005114) |
| 0.4 | 0.9 | GO:0004999 | vasoactive intestinal polypeptide receptor activity(GO:0004999) |
| 0.4 | 1.3 | GO:0047256 | beta-galactosyl-N-acetylglucosaminylgalactosylglucosyl-ceramide beta-1,3-acetylglucosaminyltransferase activity(GO:0008457) lactosylceramide 1,3-N-acetyl-beta-D-glucosaminyltransferase activity(GO:0047256) |
| 0.4 | 5.5 | GO:0071933 | Arp2/3 complex binding(GO:0071933) |
| 0.4 | 3.4 | GO:0005534 | galactose binding(GO:0005534) |
| 0.4 | 1.3 | GO:0015189 | L-lysine transmembrane transporter activity(GO:0015189) |
| 0.4 | 1.7 | GO:0047493 | sphingomyelin synthase activity(GO:0033188) ceramide cholinephosphotransferase activity(GO:0047493) |
| 0.4 | 2.1 | GO:0004792 | thiosulfate sulfurtransferase activity(GO:0004792) |
| 0.4 | 7.5 | GO:0031996 | thioesterase binding(GO:0031996) |
| 0.4 | 1.7 | GO:0034186 | apolipoprotein A-I binding(GO:0034186) |
| 0.4 | 1.7 | GO:0004078 | biotin-[acetyl-CoA-carboxylase] ligase activity(GO:0004077) biotin-[methylcrotonoyl-CoA-carboxylase] ligase activity(GO:0004078) biotin-[methylmalonyl-CoA-carboxytransferase] ligase activity(GO:0004079) biotin-[propionyl-CoA-carboxylase (ATP-hydrolyzing)] ligase activity(GO:0004080) biotin-protein ligase activity(GO:0018271) |
| 0.4 | 1.6 | GO:0004906 | interferon-gamma receptor activity(GO:0004906) |
| 0.4 | 1.2 | GO:0047012 | C-3 sterol dehydrogenase (C-4 sterol decarboxylase) activity(GO:0000252) sterol-4-alpha-carboxylate 3-dehydrogenase (decarboxylating) activity(GO:0047012) |
| 0.4 | 2.8 | GO:0005324 | long-chain fatty acid transporter activity(GO:0005324) |
| 0.4 | 8.4 | GO:0070878 | primary miRNA binding(GO:0070878) |
| 0.4 | 1.2 | GO:0015229 | L-ascorbate:sodium symporter activity(GO:0008520) L-ascorbic acid transporter activity(GO:0015229) sodium-dependent L-ascorbate transmembrane transporter activity(GO:0070890) |
| 0.4 | 1.2 | GO:0047750 | cholestenol delta-isomerase activity(GO:0047750) |
| 0.4 | 1.2 | GO:0004416 | hydroxyacylglutathione hydrolase activity(GO:0004416) |
| 0.4 | 3.9 | GO:0043199 | sulfate binding(GO:0043199) |
| 0.4 | 2.0 | GO:0016657 | GMP reductase activity(GO:0003920) oxidoreductase activity, acting on NAD(P)H, nitrogenous group as acceptor(GO:0016657) |
| 0.4 | 1.9 | GO:0047066 | phospholipid-hydroperoxide glutathione peroxidase activity(GO:0047066) |
| 0.4 | 1.1 | GO:1904713 | beta-catenin destruction complex binding(GO:1904713) |
| 0.4 | 1.1 | GO:0035259 | glucocorticoid receptor binding(GO:0035259) |
| 0.4 | 4.5 | GO:0005021 | vascular endothelial growth factor-activated receptor activity(GO:0005021) |
| 0.4 | 1.5 | GO:0045569 | TRAIL binding(GO:0045569) |
| 0.4 | 1.5 | GO:0005163 | nerve growth factor receptor binding(GO:0005163) |
| 0.4 | 11.0 | GO:0005545 | 1-phosphatidylinositol binding(GO:0005545) |
| 0.4 | 1.8 | GO:0080019 | fatty-acyl-CoA reductase (alcohol-forming) activity(GO:0080019) |
| 0.4 | 0.4 | GO:0000247 | C-8 sterol isomerase activity(GO:0000247) |
| 0.4 | 6.8 | GO:0008179 | adenylate cyclase binding(GO:0008179) |
| 0.4 | 0.4 | GO:0015181 | arginine transmembrane transporter activity(GO:0015181) |
| 0.4 | 1.1 | GO:0004315 | 3-oxoacyl-[acyl-carrier-protein] synthase activity(GO:0004315) |
| 0.4 | 1.4 | GO:0031826 | type 2A serotonin receptor binding(GO:0031826) |
| 0.3 | 1.7 | GO:1903135 | cupric ion binding(GO:1903135) |
| 0.3 | 1.0 | GO:0035575 | histone demethylase activity (H4-K20 specific)(GO:0035575) |
| 0.3 | 5.0 | GO:0005007 | fibroblast growth factor-activated receptor activity(GO:0005007) |
| 0.3 | 1.0 | GO:0008267 | poly-glutamine tract binding(GO:0008267) |
| 0.3 | 2.0 | GO:0060961 | phospholipase D inhibitor activity(GO:0060961) |
| 0.3 | 5.3 | GO:0001206 | transcriptional repressor activity, RNA polymerase II distal enhancer sequence-specific binding(GO:0001206) |
| 0.3 | 3.6 | GO:0031995 | insulin-like growth factor II binding(GO:0031995) |
| 0.3 | 5.2 | GO:0019911 | structural constituent of myelin sheath(GO:0019911) |
| 0.3 | 2.9 | GO:0008597 | calcium-dependent protein serine/threonine phosphatase regulator activity(GO:0008597) |
| 0.3 | 1.9 | GO:0008532 | N-acetyllactosaminide beta-1,3-N-acetylglucosaminyltransferase activity(GO:0008532) |
| 0.3 | 1.0 | GO:0070052 | collagen V binding(GO:0070052) |
| 0.3 | 1.3 | GO:0000285 | 1-phosphatidylinositol-3-phosphate 5-kinase activity(GO:0000285) |
| 0.3 | 0.6 | GO:0017099 | very-long-chain-acyl-CoA dehydrogenase activity(GO:0017099) |
| 0.3 | 1.6 | GO:0003896 | DNA primase activity(GO:0003896) |
| 0.3 | 0.6 | GO:0010858 | calcium-dependent protein kinase inhibitor activity(GO:0008427) calcium-dependent protein kinase regulator activity(GO:0010858) |
| 0.3 | 5.2 | GO:0035256 | G-protein coupled glutamate receptor binding(GO:0035256) |
| 0.3 | 0.9 | GO:0033142 | progesterone receptor binding(GO:0033142) |
| 0.3 | 0.9 | GO:0003829 | beta-1,3-galactosyl-O-glycosyl-glycoprotein beta-1,6-N-acetylglucosaminyltransferase activity(GO:0003829) |
| 0.3 | 4.9 | GO:0001075 | transcription factor activity, RNA polymerase II core promoter sequence-specific binding involved in preinitiation complex assembly(GO:0001075) |
| 0.3 | 2.1 | GO:0016618 | hydroxypyruvate reductase activity(GO:0016618) glyoxylate reductase (NADP) activity(GO:0030267) |
| 0.3 | 3.5 | GO:0039706 | co-receptor binding(GO:0039706) |
| 0.3 | 3.5 | GO:0001135 | transcription factor activity, RNA polymerase II transcription factor recruiting(GO:0001135) |
| 0.3 | 1.5 | GO:0046624 | sphingolipid transporter activity(GO:0046624) |
| 0.3 | 9.0 | GO:0005035 | tumor necrosis factor-activated receptor activity(GO:0005031) death receptor activity(GO:0005035) |
| 0.3 | 0.9 | GO:0004452 | isopentenyl-diphosphate delta-isomerase activity(GO:0004452) |
| 0.3 | 0.9 | GO:0050509 | N-acetylglucosaminyl-proteoglycan 4-beta-glucuronosyltransferase activity(GO:0050509) |
| 0.3 | 0.6 | GO:0003996 | acyl-CoA ligase activity(GO:0003996) |
| 0.3 | 1.7 | GO:0015137 | citrate transmembrane transporter activity(GO:0015137) tricarboxylic acid transmembrane transporter activity(GO:0015142) |
| 0.3 | 0.8 | GO:0070704 | C-5 sterol desaturase activity(GO:0000248) sterol desaturase activity(GO:0070704) |
| 0.3 | 1.1 | GO:0070991 | medium-chain-acyl-CoA dehydrogenase activity(GO:0070991) |
| 0.3 | 2.5 | GO:0043237 | laminin-1 binding(GO:0043237) |
| 0.3 | 0.8 | GO:0004782 | sulfinoalanine decarboxylase activity(GO:0004782) |
| 0.3 | 4.5 | GO:0015643 | toxic substance binding(GO:0015643) |
| 0.3 | 1.1 | GO:0016717 | stearoyl-CoA 9-desaturase activity(GO:0004768) acyl-CoA desaturase activity(GO:0016215) oxidoreductase activity, acting on paired donors, with oxidation of a pair of donors resulting in the reduction of molecular oxygen to two molecules of water(GO:0016717) |
| 0.3 | 2.1 | GO:0050733 | RS domain binding(GO:0050733) |
| 0.3 | 1.3 | GO:0004301 | epoxide hydrolase activity(GO:0004301) |
| 0.3 | 0.8 | GO:0005055 | laminin receptor activity(GO:0005055) |
| 0.3 | 1.0 | GO:0034046 | poly(G) binding(GO:0034046) |
| 0.3 | 2.3 | GO:0015220 | choline transmembrane transporter activity(GO:0015220) |
| 0.3 | 0.3 | GO:0048406 | nerve growth factor binding(GO:0048406) |
| 0.3 | 1.0 | GO:0004504 | peptidylglycine monooxygenase activity(GO:0004504) peptidylamidoglycolate lyase activity(GO:0004598) |
| 0.3 | 1.8 | GO:0031871 | proteinase activated receptor binding(GO:0031871) |
| 0.3 | 0.8 | GO:0005275 | amine transmembrane transporter activity(GO:0005275) |
| 0.3 | 3.0 | GO:0048185 | activin binding(GO:0048185) |
| 0.2 | 7.2 | GO:0004012 | phospholipid-translocating ATPase activity(GO:0004012) |
| 0.2 | 1.0 | GO:0047708 | biotinidase activity(GO:0047708) |
| 0.2 | 1.0 | GO:0008426 | protein kinase C inhibitor activity(GO:0008426) |
| 0.2 | 0.7 | GO:0032090 | Pyrin domain binding(GO:0032090) |
| 0.2 | 1.0 | GO:0016262 | protein N-acetylglucosaminyltransferase activity(GO:0016262) |
| 0.2 | 0.7 | GO:0016401 | palmitoyl-CoA oxidase activity(GO:0016401) |
| 0.2 | 5.9 | GO:0019992 | diacylglycerol binding(GO:0019992) |
| 0.2 | 1.9 | GO:0015923 | mannosidase activity(GO:0015923) |
| 0.2 | 2.4 | GO:0071253 | connexin binding(GO:0071253) |
| 0.2 | 3.8 | GO:0005225 | volume-sensitive anion channel activity(GO:0005225) |
| 0.2 | 3.3 | GO:0015379 | potassium:chloride symporter activity(GO:0015379) potassium ion symporter activity(GO:0022820) |
| 0.2 | 0.2 | GO:0005017 | platelet-derived growth factor-activated receptor activity(GO:0005017) |
| 0.2 | 2.1 | GO:0004727 | prenylated protein tyrosine phosphatase activity(GO:0004727) |
| 0.2 | 1.2 | GO:0003989 | acetyl-CoA carboxylase activity(GO:0003989) |
| 0.2 | 0.7 | GO:0004165 | dodecenoyl-CoA delta-isomerase activity(GO:0004165) |
| 0.2 | 2.5 | GO:0017034 | Rap guanyl-nucleotide exchange factor activity(GO:0017034) |
| 0.2 | 0.2 | GO:0043813 | phosphatidylinositol-3,5-bisphosphate 5-phosphatase activity(GO:0043813) |
| 0.2 | 7.2 | GO:0050431 | transforming growth factor beta binding(GO:0050431) |
| 0.2 | 1.1 | GO:0016941 | natriuretic peptide receptor activity(GO:0016941) |
| 0.2 | 1.8 | GO:0001025 | RNA polymerase III transcription factor binding(GO:0001025) |
| 0.2 | 0.9 | GO:0004357 | glutamate-cysteine ligase activity(GO:0004357) |
| 0.2 | 0.7 | GO:0055100 | adiponectin binding(GO:0055100) |
| 0.2 | 1.5 | GO:0001609 | G-protein coupled adenosine receptor activity(GO:0001609) |
| 0.2 | 0.7 | GO:0004336 | galactosylceramidase activity(GO:0004336) |
| 0.2 | 0.9 | GO:0004609 | phosphatidylserine decarboxylase activity(GO:0004609) |
| 0.2 | 0.6 | GO:0005150 | interleukin-1, Type I receptor binding(GO:0005150) |
| 0.2 | 1.1 | GO:0008453 | alanine-glyoxylate transaminase activity(GO:0008453) |
| 0.2 | 1.7 | GO:0017040 | ceramidase activity(GO:0017040) |
| 0.2 | 0.6 | GO:0052857 | NADHX epimerase activity(GO:0052856) NADPHX epimerase activity(GO:0052857) |
| 0.2 | 1.1 | GO:0030171 | voltage-gated proton channel activity(GO:0030171) |
| 0.2 | 4.8 | GO:0008349 | MAP kinase kinase kinase kinase activity(GO:0008349) |
| 0.2 | 0.6 | GO:0003860 | 3-hydroxyisobutyryl-CoA hydrolase activity(GO:0003860) |
| 0.2 | 1.2 | GO:0010465 | nerve growth factor receptor activity(GO:0010465) |
| 0.2 | 1.0 | GO:0004758 | serine C-palmitoyltransferase activity(GO:0004758) C-palmitoyltransferase activity(GO:0016454) |
| 0.2 | 1.2 | GO:0003835 | beta-galactoside alpha-2,6-sialyltransferase activity(GO:0003835) |
| 0.2 | 1.8 | GO:0036042 | long-chain fatty acyl-CoA binding(GO:0036042) |
| 0.2 | 0.8 | GO:0008506 | sucrose:proton symporter activity(GO:0008506) sucrose transmembrane transporter activity(GO:0008515) disaccharide transmembrane transporter activity(GO:0015154) oligosaccharide transmembrane transporter activity(GO:0015157) |
| 0.2 | 4.3 | GO:0004653 | polypeptide N-acetylgalactosaminyltransferase activity(GO:0004653) |
| 0.2 | 3.2 | GO:0015280 | ligand-gated sodium channel activity(GO:0015280) |
| 0.2 | 2.6 | GO:0097100 | supercoiled DNA binding(GO:0097100) |
| 0.2 | 1.2 | GO:0051033 | nucleic acid transmembrane transporter activity(GO:0051032) RNA transmembrane transporter activity(GO:0051033) |
| 0.2 | 2.2 | GO:0032027 | myosin light chain binding(GO:0032027) |
| 0.2 | 0.6 | GO:0060001 | minus-end directed microfilament motor activity(GO:0060001) |
| 0.2 | 0.4 | GO:0052827 | inositol pentakisphosphate phosphatase activity(GO:0052827) |
| 0.2 | 1.0 | GO:0016936 | galactoside binding(GO:0016936) |
| 0.2 | 1.0 | GO:0004882 | androgen receptor activity(GO:0004882) |
| 0.2 | 0.6 | GO:0002135 | CTP binding(GO:0002135) |
| 0.2 | 0.8 | GO:0042282 | hydroxymethylglutaryl-CoA reductase (NADPH) activity(GO:0004420) hydroxymethylglutaryl-CoA reductase activity(GO:0042282) |
| 0.2 | 0.6 | GO:0005128 | erythropoietin receptor binding(GO:0005128) |
| 0.2 | 1.5 | GO:0051766 | inositol trisphosphate kinase activity(GO:0051766) |
| 0.2 | 0.8 | GO:0004909 | interleukin-1, Type I, activating receptor activity(GO:0004909) |
| 0.2 | 1.0 | GO:0052655 | branched-chain-amino-acid transaminase activity(GO:0004084) L-leucine transaminase activity(GO:0052654) L-valine transaminase activity(GO:0052655) L-isoleucine transaminase activity(GO:0052656) |
| 0.2 | 0.4 | GO:0033265 | choline binding(GO:0033265) |
| 0.2 | 1.5 | GO:0004468 | lysine N-acetyltransferase activity, acting on acetyl phosphate as donor(GO:0004468) |
| 0.2 | 0.9 | GO:0032143 | single thymine insertion binding(GO:0032143) |
| 0.2 | 3.9 | GO:0001087 | transcription factor activity, sequence-specific DNA binding, RNA polymerase recruiting(GO:0001011) transcription factor activity, TFIIB-class binding(GO:0001087) |
| 0.2 | 0.6 | GO:0008384 | IkappaB kinase activity(GO:0008384) |
| 0.2 | 1.3 | GO:0016805 | dipeptidase activity(GO:0016805) |
| 0.2 | 0.7 | GO:0032450 | maltose alpha-glucosidase activity(GO:0032450) |
| 0.2 | 1.3 | GO:0009374 | biotin carboxylase activity(GO:0004075) biotin binding(GO:0009374) |
| 0.2 | 2.4 | GO:0043522 | leucine zipper domain binding(GO:0043522) |
| 0.2 | 0.9 | GO:0008263 | pyrimidine-specific mismatch base pair DNA N-glycosylase activity(GO:0008263) |
| 0.2 | 2.3 | GO:0048407 | platelet-derived growth factor binding(GO:0048407) |
| 0.2 | 0.5 | GO:0061697 | protein-malonyllysine demalonylase activity(GO:0036054) protein-succinyllysine desuccinylase activity(GO:0036055) protein-glutaryllysine deglutarylase activity(GO:0061697) |
| 0.2 | 0.5 | GO:0017116 | single-stranded DNA-dependent ATP-dependent DNA helicase activity(GO:0017116) |
| 0.2 | 1.2 | GO:0008454 | alpha-1,3-mannosylglycoprotein 4-beta-N-acetylglucosaminyltransferase activity(GO:0008454) |
| 0.2 | 2.1 | GO:0031386 | protein tag(GO:0031386) |
| 0.2 | 1.8 | GO:0004689 | phosphorylase kinase activity(GO:0004689) |
| 0.2 | 1.9 | GO:0010857 | calcium-dependent protein serine/threonine kinase activity(GO:0009931) calcium-dependent protein kinase activity(GO:0010857) |
| 0.2 | 0.5 | GO:0008424 | glycoprotein 6-alpha-L-fucosyltransferase activity(GO:0008424) alpha-(1->6)-fucosyltransferase activity(GO:0046921) |
| 0.2 | 0.5 | GO:0050692 | DBD domain binding(GO:0050692) |
| 0.2 | 2.6 | GO:0098748 | clathrin adaptor activity(GO:0035615) endocytic adaptor activity(GO:0098748) |
| 0.2 | 0.7 | GO:0098770 | FBXO family protein binding(GO:0098770) |
| 0.2 | 1.0 | GO:0004563 | beta-N-acetylhexosaminidase activity(GO:0004563) |
| 0.2 | 0.9 | GO:0031750 | D3 dopamine receptor binding(GO:0031750) |
| 0.2 | 0.7 | GO:0071558 | histone demethylase activity (H3-K27 specific)(GO:0071558) |
| 0.2 | 0.5 | GO:0017095 | heparan sulfate 6-O-sulfotransferase activity(GO:0017095) |
| 0.2 | 7.2 | GO:0005159 | insulin-like growth factor receptor binding(GO:0005159) |
| 0.2 | 0.7 | GO:0032767 | copper-dependent protein binding(GO:0032767) |
| 0.2 | 1.2 | GO:1904288 | BAT3 complex binding(GO:1904288) |
| 0.2 | 1.8 | GO:0070181 | small ribosomal subunit rRNA binding(GO:0070181) |
| 0.2 | 8.9 | GO:0001205 | transcriptional activator activity, RNA polymerase II distal enhancer sequence-specific binding(GO:0001205) |
| 0.2 | 0.2 | GO:0004450 | isocitrate dehydrogenase (NADP+) activity(GO:0004450) |
| 0.2 | 1.0 | GO:0003998 | acylphosphatase activity(GO:0003998) |
| 0.2 | 0.5 | GO:0004915 | interleukin-6 receptor activity(GO:0004915) interleukin-6 binding(GO:0019981) ciliary neurotrophic factor binding(GO:0070119) |
| 0.2 | 3.1 | GO:0050750 | low-density lipoprotein particle receptor binding(GO:0050750) |
| 0.2 | 0.8 | GO:0047179 | platelet-activating factor acetyltransferase activity(GO:0047179) |
| 0.2 | 0.8 | GO:0050254 | rhodopsin kinase activity(GO:0050254) |
| 0.2 | 0.5 | GO:0090541 | MIT domain binding(GO:0090541) |
| 0.2 | 0.6 | GO:0008798 | beta-aspartyl-peptidase activity(GO:0008798) |
| 0.2 | 1.4 | GO:0016206 | catechol O-methyltransferase activity(GO:0016206) |
| 0.2 | 0.8 | GO:0032810 | sterol response element binding(GO:0032810) |
| 0.2 | 1.3 | GO:0016403 | dimethylargininase activity(GO:0016403) |
| 0.2 | 3.0 | GO:0061578 | Lys63-specific deubiquitinase activity(GO:0061578) |
| 0.2 | 0.6 | GO:0052812 | phosphatidylinositol-3,4-bisphosphate 5-kinase activity(GO:0052812) |
| 0.2 | 0.6 | GO:0033829 | O-fucosylpeptide 3-beta-N-acetylglucosaminyltransferase activity(GO:0033829) |
| 0.2 | 0.5 | GO:0047389 | glycerophosphocholine phosphodiesterase activity(GO:0047389) |
| 0.2 | 0.9 | GO:0043398 | HLH domain binding(GO:0043398) |
| 0.2 | 0.5 | GO:0008746 | NAD(P)+ transhydrogenase activity(GO:0008746) oxidoreductase activity, acting on NAD(P)H, NAD(P) as acceptor(GO:0016652) |
| 0.2 | 0.8 | GO:0008113 | peptide-methionine (S)-S-oxide reductase activity(GO:0008113) |
| 0.2 | 0.8 | GO:0047288 | monosialoganglioside sialyltransferase activity(GO:0047288) |
| 0.2 | 0.5 | GO:0004421 | hydroxymethylglutaryl-CoA synthase activity(GO:0004421) |
| 0.2 | 4.7 | GO:0000030 | mannosyltransferase activity(GO:0000030) |
| 0.1 | 1.0 | GO:0005143 | interleukin-12 receptor binding(GO:0005143) |
| 0.1 | 0.7 | GO:0008449 | N-acetylglucosamine-6-sulfatase activity(GO:0008449) |
| 0.1 | 12.4 | GO:0070491 | repressing transcription factor binding(GO:0070491) |
| 0.1 | 0.4 | GO:0004874 | aryl hydrocarbon receptor activity(GO:0004874) |
| 0.1 | 2.8 | GO:0015467 | G-protein activated inward rectifier potassium channel activity(GO:0015467) |
| 0.1 | 1.2 | GO:0097643 | amylin receptor activity(GO:0097643) |
| 0.1 | 1.0 | GO:0001517 | N-acetylglucosamine 6-O-sulfotransferase activity(GO:0001517) |
| 0.1 | 0.4 | GO:0030272 | 5-formyltetrahydrofolate cyclo-ligase activity(GO:0030272) |
| 0.1 | 3.2 | GO:0035613 | RNA stem-loop binding(GO:0035613) |
| 0.1 | 1.3 | GO:0003726 | double-stranded RNA adenosine deaminase activity(GO:0003726) |
| 0.1 | 2.3 | GO:0050544 | icosatetraenoic acid binding(GO:0050543) arachidonic acid binding(GO:0050544) |
| 0.1 | 1.4 | GO:0031434 | mitogen-activated protein kinase kinase binding(GO:0031434) |
| 0.1 | 1.6 | GO:0008301 | DNA binding, bending(GO:0008301) |
| 0.1 | 1.6 | GO:1904264 | ubiquitin protein ligase activity involved in ERAD pathway(GO:1904264) |
| 0.1 | 0.7 | GO:1990460 | leptin receptor binding(GO:1990460) |
| 0.1 | 0.6 | GO:0001588 | dopamine neurotransmitter receptor activity, coupled via Gs(GO:0001588) |
| 0.1 | 3.2 | GO:0005527 | macrolide binding(GO:0005527) FK506 binding(GO:0005528) |
| 0.1 | 1.4 | GO:0035005 | 1-phosphatidylinositol-4-phosphate 3-kinase activity(GO:0035005) |
| 0.1 | 0.4 | GO:0004534 | 5'-3' exoribonuclease activity(GO:0004534) |
| 0.1 | 0.4 | GO:0008240 | tripeptidyl-peptidase activity(GO:0008240) |
| 0.1 | 0.5 | GO:0015207 | ATP:ADP antiporter activity(GO:0005471) adenine transmembrane transporter activity(GO:0015207) |
| 0.1 | 0.5 | GO:0034041 | sterol-transporting ATPase activity(GO:0034041) |
| 0.1 | 0.8 | GO:0036033 | mediator complex binding(GO:0036033) |
| 0.1 | 1.8 | GO:0002151 | G-quadruplex RNA binding(GO:0002151) |
| 0.1 | 0.5 | GO:0032440 | 2-alkenal reductase [NAD(P)] activity(GO:0032440) |
| 0.1 | 0.7 | GO:0034481 | chondroitin sulfotransferase activity(GO:0034481) chondroitin 4-sulfotransferase activity(GO:0047756) |
| 0.1 | 0.1 | GO:0016453 | C-acetyltransferase activity(GO:0016453) |
| 0.1 | 0.5 | GO:0070404 | NADH binding(GO:0070404) |
| 0.1 | 6.6 | GO:0044390 | ubiquitin-like protein conjugating enzyme binding(GO:0044390) |
| 0.1 | 4.0 | GO:0071617 | 1-acylglycerol-3-phosphate O-acyltransferase activity(GO:0003841) lysophosphatidic acid acyltransferase activity(GO:0042171) lysophospholipid acyltransferase activity(GO:0071617) |
| 0.1 | 0.8 | GO:0046935 | 1-phosphatidylinositol-3-kinase regulator activity(GO:0046935) |
| 0.1 | 25.4 | GO:0002020 | protease binding(GO:0002020) |
| 0.1 | 0.4 | GO:0030549 | acetylcholine receptor activator activity(GO:0030549) |
| 0.1 | 3.5 | GO:0005112 | Notch binding(GO:0005112) |
| 0.1 | 0.9 | GO:0004797 | thymidine kinase activity(GO:0004797) |
| 0.1 | 0.8 | GO:0004522 | ribonuclease A activity(GO:0004522) |
| 0.1 | 1.3 | GO:0017176 | phosphatidylinositol N-acetylglucosaminyltransferase activity(GO:0017176) |
| 0.1 | 0.4 | GO:0033981 | D-dopachrome decarboxylase activity(GO:0033981) |
| 0.1 | 4.1 | GO:0004707 | MAP kinase activity(GO:0004707) |
| 0.1 | 1.9 | GO:0017154 | semaphorin receptor activity(GO:0017154) |
| 0.1 | 3.4 | GO:0034236 | protein kinase A catalytic subunit binding(GO:0034236) |
| 0.1 | 0.5 | GO:0005375 | copper ion transmembrane transporter activity(GO:0005375) |
| 0.1 | 0.7 | GO:0008073 | ornithine decarboxylase inhibitor activity(GO:0008073) |
| 0.1 | 1.4 | GO:0004726 | non-membrane spanning protein tyrosine phosphatase activity(GO:0004726) |
| 0.1 | 0.4 | GO:0015275 | stretch-activated, cation-selective, calcium channel activity(GO:0015275) |
| 0.1 | 0.4 | GO:0004886 | 9-cis retinoic acid receptor activity(GO:0004886) |
| 0.1 | 0.5 | GO:0030274 | LIM domain binding(GO:0030274) |
| 0.1 | 0.5 | GO:0005111 | type 2 fibroblast growth factor receptor binding(GO:0005111) |
| 0.1 | 0.5 | GO:0102345 | 3-hydroxy-behenoyl-CoA dehydratase activity(GO:0102344) 3-hydroxy-lignoceroyl-CoA dehydratase activity(GO:0102345) |
| 0.1 | 0.5 | GO:1990430 | extracellular matrix protein binding(GO:1990430) |
| 0.1 | 0.4 | GO:0045145 | single-stranded DNA 5'-3' exodeoxyribonuclease activity(GO:0045145) |
| 0.1 | 1.1 | GO:0001665 | alpha-N-acetylgalactosaminide alpha-2,6-sialyltransferase activity(GO:0001665) |
| 0.1 | 0.4 | GO:0005483 | soluble NSF attachment protein activity(GO:0005483) |
| 0.1 | 0.9 | GO:0004873 | asialoglycoprotein receptor activity(GO:0004873) |
| 0.1 | 2.8 | GO:0016864 | protein disulfide isomerase activity(GO:0003756) intramolecular oxidoreductase activity, transposing S-S bonds(GO:0016864) |
| 0.1 | 1.3 | GO:0047134 | protein-disulfide reductase activity(GO:0047134) |
| 0.1 | 2.5 | GO:0001223 | transcription coactivator binding(GO:0001223) |
| 0.1 | 0.4 | GO:0061599 | nitrate reductase activity(GO:0008940) molybdopterin adenylyltransferase activity(GO:0061598) molybdopterin molybdotransferase activity(GO:0061599) |
| 0.1 | 0.4 | GO:0051377 | mannose-ethanolamine phosphotransferase activity(GO:0051377) |
| 0.1 | 0.4 | GO:0008534 | oxidized purine nucleobase lesion DNA N-glycosylase activity(GO:0008534) |
| 0.1 | 0.7 | GO:0003960 | NADPH:quinone reductase activity(GO:0003960) |
| 0.1 | 2.5 | GO:0030957 | Tat protein binding(GO:0030957) |
| 0.1 | 1.4 | GO:0042731 | PH domain binding(GO:0042731) |
| 0.1 | 1.1 | GO:0030976 | thiamine pyrophosphate binding(GO:0030976) |
| 0.1 | 0.4 | GO:0031753 | endothelial differentiation G-protein coupled receptor binding(GO:0031753) Edg-2 lysophosphatidic acid receptor binding(GO:0031755) |
| 0.1 | 0.5 | GO:0003883 | CTP synthase activity(GO:0003883) |
| 0.1 | 0.5 | GO:0051499 | D-aminoacyl-tRNA deacylase activity(GO:0051499) D-tyrosyl-tRNA(Tyr) deacylase activity(GO:0051500) |
| 0.1 | 1.0 | GO:0030160 | GKAP/Homer scaffold activity(GO:0030160) |
| 0.1 | 1.4 | GO:0003857 | 3-hydroxyacyl-CoA dehydrogenase activity(GO:0003857) |
| 0.1 | 0.6 | GO:0046975 | histone methyltransferase activity (H3-K36 specific)(GO:0046975) |
| 0.1 | 0.3 | GO:0035730 | S-nitrosoglutathione binding(GO:0035730) dinitrosyl-iron complex binding(GO:0035731) |
| 0.1 | 0.3 | GO:0031626 | beta-endorphin binding(GO:0031626) |
| 0.1 | 0.3 | GO:0052858 | peptidyl-lysine N-acetyltransferase activity, acting on acetyl phosphate as donor(GO:0052858) |
| 0.1 | 4.5 | GO:0016303 | 1-phosphatidylinositol-3-kinase activity(GO:0016303) |
| 0.1 | 1.8 | GO:0043225 | anion transmembrane-transporting ATPase activity(GO:0043225) |
| 0.1 | 0.5 | GO:0034353 | RNA pyrophosphohydrolase activity(GO:0034353) |
| 0.1 | 4.0 | GO:0070840 | dynein complex binding(GO:0070840) |
| 0.1 | 1.1 | GO:0004064 | arylesterase activity(GO:0004064) |
| 0.1 | 0.4 | GO:0004487 | methylenetetrahydrofolate dehydrogenase (NAD+) activity(GO:0004487) |
| 0.1 | 0.3 | GO:0005519 | cytoskeletal regulatory protein binding(GO:0005519) |
| 0.1 | 0.3 | GO:0019777 | Atg12 transferase activity(GO:0019777) |
| 0.1 | 1.9 | GO:0004439 | phosphatidylinositol-4,5-bisphosphate 5-phosphatase activity(GO:0004439) |
| 0.1 | 0.3 | GO:0047315 | kynurenine-glyoxylate transaminase activity(GO:0047315) |
| 0.1 | 0.3 | GO:0008670 | 2,4-dienoyl-CoA reductase (NADPH) activity(GO:0008670) |
| 0.1 | 0.3 | GO:0030158 | protein xylosyltransferase activity(GO:0030158) |
| 0.1 | 1.1 | GO:0000182 | rDNA binding(GO:0000182) |
| 0.1 | 0.1 | GO:0098811 | transcriptional activator activity, RNA polymerase II transcription factor binding(GO:0001190) transcriptional repressor activity, RNA polymerase II activating transcription factor binding(GO:0098811) |
| 0.1 | 1.4 | GO:0031078 | histone deacetylase activity (H3-K14 specific)(GO:0031078) NAD-dependent histone deacetylase activity (H3-K14 specific)(GO:0032041) |
| 0.1 | 0.6 | GO:0008823 | cupric reductase activity(GO:0008823) ferric-chelate reductase (NADPH) activity(GO:0052851) |
| 0.1 | 0.2 | GO:0008494 | translation activator activity(GO:0008494) |
| 0.1 | 0.1 | GO:0005105 | type 1 fibroblast growth factor receptor binding(GO:0005105) |
| 0.1 | 0.8 | GO:0003910 | DNA ligase (ATP) activity(GO:0003910) |
| 0.1 | 0.1 | GO:0097677 | STAT family protein binding(GO:0097677) |
| 0.1 | 2.7 | GO:0070330 | aromatase activity(GO:0070330) |
| 0.1 | 0.6 | GO:0003873 | 6-phosphofructo-2-kinase activity(GO:0003873) |
| 0.1 | 0.3 | GO:0004662 | CAAX-protein geranylgeranyltransferase activity(GO:0004662) |
| 0.1 | 0.5 | GO:0098519 | nucleotide phosphatase activity, acting on free nucleotides(GO:0098519) |
| 0.1 | 0.2 | GO:0051021 | GDP-dissociation inhibitor binding(GO:0051021) Rho GDP-dissociation inhibitor binding(GO:0051022) |
| 0.1 | 0.2 | GO:0001016 | RNA polymerase III regulatory region DNA binding(GO:0001016) |
| 0.1 | 0.6 | GO:0004793 | glycine hydroxymethyltransferase activity(GO:0004372) threonine aldolase activity(GO:0004793) L-allo-threonine aldolase activity(GO:0008732) |
| 0.1 | 0.5 | GO:0004392 | heme oxygenase (decyclizing) activity(GO:0004392) |
| 0.1 | 0.7 | GO:0004771 | sterol esterase activity(GO:0004771) |
| 0.1 | 1.7 | GO:0051400 | BH domain binding(GO:0051400) |
| 0.1 | 0.3 | GO:0016715 | oxidoreductase activity, acting on paired donors, with incorporation or reduction of molecular oxygen, reduced ascorbate as one donor, and incorporation of one atom of oxygen(GO:0016715) |
| 0.1 | 1.3 | GO:0008432 | JUN kinase binding(GO:0008432) |
| 0.1 | 4.2 | GO:0030676 | Rac guanyl-nucleotide exchange factor activity(GO:0030676) |
| 0.1 | 0.3 | GO:0005113 | patched binding(GO:0005113) |
| 0.1 | 1.1 | GO:0015232 | heme transporter activity(GO:0015232) |
| 0.1 | 0.4 | GO:0010521 | telomerase inhibitor activity(GO:0010521) |
| 0.1 | 1.5 | GO:0016892 | endoribonuclease activity, producing 3'-phosphomonoesters(GO:0016892) |
| 0.1 | 1.1 | GO:0034618 | arginine binding(GO:0034618) |
| 0.1 | 0.2 | GO:0004924 | oncostatin-M receptor activity(GO:0004924) |
| 0.1 | 3.2 | GO:0019198 | transmembrane receptor protein tyrosine phosphatase activity(GO:0005001) transmembrane receptor protein phosphatase activity(GO:0019198) |
| 0.1 | 1.5 | GO:0000014 | single-stranded DNA endodeoxyribonuclease activity(GO:0000014) |
| 0.1 | 0.8 | GO:0016929 | SUMO-specific protease activity(GO:0016929) |
| 0.1 | 1.1 | GO:0070883 | pre-miRNA binding(GO:0070883) |
| 0.1 | 0.7 | GO:0019788 | NEDD8 transferase activity(GO:0019788) |
| 0.1 | 1.7 | GO:1901611 | phosphatidylglycerol binding(GO:1901611) |
| 0.1 | 0.9 | GO:0019869 | chloride channel inhibitor activity(GO:0019869) |
| 0.1 | 0.3 | GO:0045182 | translation regulator activity(GO:0045182) |
| 0.1 | 0.6 | GO:0001849 | complement component C1q binding(GO:0001849) |
| 0.1 | 0.2 | GO:0004677 | DNA-dependent protein kinase activity(GO:0004677) |
| 0.1 | 3.0 | GO:0008327 | methyl-CpG binding(GO:0008327) |
| 0.1 | 0.6 | GO:0004652 | polynucleotide adenylyltransferase activity(GO:0004652) |
| 0.1 | 0.5 | GO:0070579 | methylcytosine dioxygenase activity(GO:0070579) |
| 0.1 | 6.3 | GO:0005044 | scavenger receptor activity(GO:0005044) |
| 0.1 | 0.7 | GO:0034235 | GPI anchor binding(GO:0034235) |
| 0.1 | 1.0 | GO:0030020 | extracellular matrix structural constituent conferring tensile strength(GO:0030020) |
| 0.1 | 2.9 | GO:0051019 | mitogen-activated protein kinase binding(GO:0051019) |
| 0.1 | 2.2 | GO:0043236 | laminin binding(GO:0043236) |
| 0.1 | 2.3 | GO:0031432 | titin binding(GO:0031432) |
| 0.1 | 0.3 | GO:0042284 | sphingolipid delta-4 desaturase activity(GO:0042284) |
| 0.1 | 1.0 | GO:0015129 | lactate transmembrane transporter activity(GO:0015129) |
| 0.1 | 0.9 | GO:0002162 | dystroglycan binding(GO:0002162) |
| 0.1 | 2.5 | GO:0070530 | K63-linked polyubiquitin binding(GO:0070530) |
| 0.1 | 1.4 | GO:0004691 | cAMP-dependent protein kinase activity(GO:0004691) |
| 0.1 | 2.6 | GO:0046875 | ephrin receptor binding(GO:0046875) |
| 0.1 | 0.8 | GO:0008420 | CTD phosphatase activity(GO:0008420) |
| 0.1 | 1.0 | GO:0047498 | calcium-dependent phospholipase A2 activity(GO:0047498) |
| 0.1 | 0.6 | GO:0032050 | clathrin heavy chain binding(GO:0032050) |
| 0.1 | 0.6 | GO:0051787 | misfolded protein binding(GO:0051787) |
| 0.1 | 0.3 | GO:0004741 | [pyruvate dehydrogenase (lipoamide)] phosphatase activity(GO:0004741) |
| 0.1 | 0.1 | GO:0038181 | bile acid receptor activity(GO:0038181) |
| 0.1 | 0.7 | GO:0004983 | neuropeptide Y receptor activity(GO:0004983) |
| 0.1 | 0.7 | GO:0016413 | O-acetyltransferase activity(GO:0016413) |
| 0.1 | 0.1 | GO:0016708 | nitric oxide dioxygenase activity(GO:0008941) oxidoreductase activity, acting on paired donors, with incorporation or reduction of molecular oxygen, NAD(P)H as one donor, and incorporation of two atoms of oxygen into one donor(GO:0016708) |
| 0.1 | 0.2 | GO:0004967 | glucagon receptor activity(GO:0004967) |
| 0.1 | 0.8 | GO:0046703 | natural killer cell lectin-like receptor binding(GO:0046703) |
| 0.1 | 0.9 | GO:0042609 | CD4 receptor binding(GO:0042609) |
| 0.1 | 0.4 | GO:0008142 | oxysterol binding(GO:0008142) |
| 0.1 | 2.1 | GO:0043027 | cysteine-type endopeptidase inhibitor activity involved in apoptotic process(GO:0043027) |
| 0.1 | 0.3 | GO:0030620 | U2 snRNA binding(GO:0030620) |
| 0.1 | 0.3 | GO:0043560 | insulin receptor substrate binding(GO:0043560) |
| 0.1 | 1.0 | GO:0050786 | RAGE receptor binding(GO:0050786) |
| 0.1 | 0.6 | GO:0033743 | peptide-methionine (R)-S-oxide reductase activity(GO:0033743) |
| 0.1 | 1.1 | GO:0003995 | acyl-CoA dehydrogenase activity(GO:0003995) |
| 0.1 | 0.7 | GO:0005068 | transmembrane receptor protein tyrosine kinase adaptor activity(GO:0005068) |
| 0.1 | 1.7 | GO:0004535 | poly(A)-specific ribonuclease activity(GO:0004535) |
| 0.1 | 0.2 | GO:0000293 | ferric-chelate reductase activity(GO:0000293) |
| 0.1 | 0.2 | GO:1902271 | D3 vitamins binding(GO:1902271) |
| 0.1 | 0.2 | GO:0004608 | phosphatidyl-N-methylethanolamine N-methyltransferase activity(GO:0000773) phosphatidylethanolamine N-methyltransferase activity(GO:0004608) phosphatidyl-N-dimethylethanolamine N-methyltransferase activity(GO:0080101) |
| 0.1 | 0.6 | GO:0061665 | SUMO ligase activity(GO:0061665) |
| 0.1 | 0.9 | GO:0001221 | transcription cofactor binding(GO:0001221) |
| 0.1 | 0.5 | GO:0016312 | inositol bisphosphate phosphatase activity(GO:0016312) |
| 0.1 | 0.8 | GO:0070016 | armadillo repeat domain binding(GO:0070016) |
| 0.1 | 0.6 | GO:0019863 | IgE binding(GO:0019863) |
| 0.1 | 0.6 | GO:0030346 | protein phosphatase 2B binding(GO:0030346) |
| 0.1 | 0.8 | GO:0051425 | PTB domain binding(GO:0051425) |
| 0.1 | 0.5 | GO:0043996 | histone acetyltransferase activity (H4-K5 specific)(GO:0043995) histone acetyltransferase activity (H4-K8 specific)(GO:0043996) histone acetyltransferase activity (H4-K16 specific)(GO:0046972) |
| 0.1 | 0.3 | GO:0050698 | proteoglycan sulfotransferase activity(GO:0050698) |
| 0.1 | 0.3 | GO:0008665 | 2'-phosphotransferase activity(GO:0008665) |
| 0.1 | 1.3 | GO:0097200 | cysteine-type endopeptidase activity involved in execution phase of apoptosis(GO:0097200) |
| 0.1 | 0.1 | GO:1990763 | arrestin family protein binding(GO:1990763) |
| 0.1 | 0.9 | GO:0016846 | carbon-sulfur lyase activity(GO:0016846) |
| 0.1 | 0.7 | GO:0016670 | oxidoreductase activity, acting on a sulfur group of donors, oxygen as acceptor(GO:0016670) |
| 0.1 | 0.4 | GO:0038051 | glucocorticoid receptor activity(GO:0004883) glucocorticoid-activated RNA polymerase II transcription factor binding transcription factor activity(GO:0038051) |
| 0.1 | 0.2 | GO:0071987 | WD40-repeat domain binding(GO:0071987) |
| 0.1 | 2.4 | GO:0001671 | ATPase activator activity(GO:0001671) |
| 0.1 | 0.4 | GO:1990226 | histone methyltransferase binding(GO:1990226) |
| 0.1 | 0.9 | GO:0031821 | G-protein coupled serotonin receptor binding(GO:0031821) |
| 0.1 | 0.9 | GO:0004030 | aldehyde dehydrogenase [NAD(P)+] activity(GO:0004030) |
| 0.1 | 0.6 | GO:0042975 | peroxisome proliferator activated receptor binding(GO:0042975) |
| 0.1 | 0.1 | GO:0004904 | interferon receptor activity(GO:0004904) |
| 0.1 | 0.2 | GO:0004132 | dCMP deaminase activity(GO:0004132) |
| 0.1 | 0.2 | GO:0061505 | DNA topoisomerase type II (ATP-hydrolyzing) activity(GO:0003918) DNA topoisomerase II activity(GO:0061505) |
| 0.1 | 0.1 | GO:0035662 | Toll-like receptor 4 binding(GO:0035662) |
| 0.1 | 0.8 | GO:0047760 | butyrate-CoA ligase activity(GO:0047760) |
| 0.1 | 1.4 | GO:0031492 | nucleosomal DNA binding(GO:0031492) |
| 0.1 | 0.2 | GO:0016165 | linoleate 13S-lipoxygenase activity(GO:0016165) |
| 0.1 | 0.3 | GO:0016004 | phospholipase activator activity(GO:0016004) |
| 0.1 | 0.3 | GO:0052591 | sn-glycerol-3-phosphate:ubiquinone oxidoreductase activity(GO:0052590) sn-glycerol-3-phosphate:ubiquinone-8 oxidoreductase activity(GO:0052591) |
| 0.1 | 0.1 | GO:0004566 | beta-glucuronidase activity(GO:0004566) |
| 0.1 | 0.2 | GO:0043035 | chromatin insulator sequence binding(GO:0043035) |
| 0.1 | 0.4 | GO:0004826 | phenylalanine-tRNA ligase activity(GO:0004826) |
| 0.1 | 1.1 | GO:0008484 | sulfuric ester hydrolase activity(GO:0008484) |
| 0.1 | 1.5 | GO:0051010 | microtubule plus-end binding(GO:0051010) |
| 0.1 | 0.2 | GO:0004711 | ribosomal protein S6 kinase activity(GO:0004711) |
| 0.1 | 4.5 | GO:0004180 | carboxypeptidase activity(GO:0004180) |
| 0.1 | 0.3 | GO:0097108 | hedgehog family protein binding(GO:0097108) |
| 0.1 | 3.2 | GO:0016409 | palmitoyltransferase activity(GO:0016409) |
| 0.1 | 0.5 | GO:0070628 | proteasome binding(GO:0070628) |
| 0.1 | 0.5 | GO:0004614 | phosphoglucomutase activity(GO:0004614) |
| 0.1 | 0.2 | GO:0033677 | DNA/RNA helicase activity(GO:0033677) |
| 0.1 | 0.2 | GO:0097604 | temperature-gated cation channel activity(GO:0097604) |
| 0.1 | 0.5 | GO:1990239 | steroid hormone binding(GO:1990239) |
| 0.1 | 30.0 | GO:0001077 | transcriptional activator activity, RNA polymerase II core promoter proximal region sequence-specific binding(GO:0001077) |
| 0.1 | 2.0 | GO:0001784 | phosphotyrosine binding(GO:0001784) |
| 0.1 | 1.3 | GO:0070064 | proline-rich region binding(GO:0070064) |
| 0.1 | 6.0 | GO:0008307 | structural constituent of muscle(GO:0008307) |
| 0.1 | 0.3 | GO:0003976 | UDP-N-acetylglucosamine-lysosomal-enzyme N-acetylglucosaminephosphotransferase activity(GO:0003976) |
| 0.1 | 1.0 | GO:0004985 | opioid receptor activity(GO:0004985) |
| 0.1 | 1.1 | GO:0050321 | tau-protein kinase activity(GO:0050321) |
| 0.1 | 0.2 | GO:0004937 | alpha1-adrenergic receptor activity(GO:0004937) |
| 0.1 | 1.4 | GO:0016896 | 3'-5'-exoribonuclease activity(GO:0000175) exoribonuclease activity, producing 5'-phosphomonoesters(GO:0016896) |
| 0.1 | 0.2 | GO:0004119 | cGMP-inhibited cyclic-nucleotide phosphodiesterase activity(GO:0004119) |
| 0.1 | 0.2 | GO:0071566 | UFM1 activating enzyme activity(GO:0071566) |
| 0.1 | 0.2 | GO:0003863 | alpha-ketoacid dehydrogenase activity(GO:0003826) 3-methyl-2-oxobutanoate dehydrogenase (2-methylpropanoyl-transferring) activity(GO:0003863) |
| 0.1 | 0.2 | GO:0050309 | glucose-6-phosphatase activity(GO:0004346) sugar-terminal-phosphatase activity(GO:0050309) |
| 0.1 | 0.1 | GO:0032795 | heterotrimeric G-protein binding(GO:0032795) |
| 0.1 | 7.5 | GO:0101005 | ubiquitinyl hydrolase activity(GO:0101005) |
| 0.1 | 0.4 | GO:0004844 | uracil DNA N-glycosylase activity(GO:0004844) deaminated base DNA N-glycosylase activity(GO:0097506) |
| 0.1 | 0.8 | GO:0043422 | protein kinase B binding(GO:0043422) |
| 0.1 | 0.7 | GO:0050072 | m7G(5')pppN diphosphatase activity(GO:0050072) |
| 0.1 | 0.5 | GO:0036312 | phosphatidylinositol 3-kinase regulatory subunit binding(GO:0036312) |
| 0.1 | 0.4 | GO:0004096 | catalase activity(GO:0004096) |
| 0.1 | 0.1 | GO:0032564 | adenyl deoxyribonucleotide binding(GO:0032558) dATP binding(GO:0032564) |
| 0.1 | 1.4 | GO:0051059 | NF-kappaB binding(GO:0051059) |
| 0.1 | 0.5 | GO:0030942 | endoplasmic reticulum signal peptide binding(GO:0030942) |
| 0.1 | 0.2 | GO:0019797 | procollagen-proline 3-dioxygenase activity(GO:0019797) |
| 0.1 | 1.5 | GO:0031491 | nucleosome binding(GO:0031491) |
| 0.1 | 0.6 | GO:0042799 | histone methyltransferase activity (H4-K20 specific)(GO:0042799) |
| 0.1 | 7.6 | GO:0005089 | Rho guanyl-nucleotide exchange factor activity(GO:0005089) |
| 0.1 | 0.6 | GO:0035240 | dopamine binding(GO:0035240) |
| 0.1 | 0.3 | GO:0015433 | peptide antigen-transporting ATPase activity(GO:0015433) |
| 0.1 | 1.6 | GO:0017025 | TBP-class protein binding(GO:0017025) |
| 0.1 | 0.6 | GO:0019957 | C-C chemokine binding(GO:0019957) |
| 0.1 | 4.1 | GO:0003743 | translation initiation factor activity(GO:0003743) |
| 0.1 | 0.2 | GO:0008480 | sarcosine dehydrogenase activity(GO:0008480) |
| 0.1 | 0.8 | GO:0017134 | fibroblast growth factor binding(GO:0017134) |
| 0.1 | 0.4 | GO:0004305 | ethanolamine kinase activity(GO:0004305) |
| 0.1 | 0.2 | GO:0017077 | oxidative phosphorylation uncoupler activity(GO:0017077) |
| 0.1 | 0.8 | GO:0031435 | mitogen-activated protein kinase kinase kinase binding(GO:0031435) |
| 0.1 | 0.2 | GO:0032145 | 4-aminobutyrate transaminase activity(GO:0003867) succinate-semialdehyde dehydrogenase binding(GO:0032145) (S)-3-amino-2-methylpropionate transaminase activity(GO:0047298) |
| 0.1 | 0.3 | GO:0015183 | L-aspartate transmembrane transporter activity(GO:0015183) |
| 0.1 | 0.5 | GO:0046976 | histone methyltransferase activity (H3-K27 specific)(GO:0046976) |
| 0.1 | 0.5 | GO:0070569 | uridylyltransferase activity(GO:0070569) |
| 0.1 | 0.5 | GO:0047499 | calcium-independent phospholipase A2 activity(GO:0047499) |
| 0.1 | 0.8 | GO:0033549 | MAP kinase phosphatase activity(GO:0033549) |
| 0.1 | 0.2 | GO:0003839 | gamma-glutamylcyclotransferase activity(GO:0003839) |
| 0.1 | 0.3 | GO:0032052 | bile acid binding(GO:0032052) |
| 0.1 | 0.2 | GO:0003680 | AT DNA binding(GO:0003680) |
| 0.1 | 0.2 | GO:0003941 | L-serine ammonia-lyase activity(GO:0003941) |
| 0.1 | 0.3 | GO:0004111 | creatine kinase activity(GO:0004111) |
| 0.1 | 0.1 | GO:0016838 | carbon-oxygen lyase activity, acting on phosphates(GO:0016838) |
| 0.1 | 0.2 | GO:0030348 | syntaxin-3 binding(GO:0030348) |
| 0.1 | 0.7 | GO:0016174 | NAD(P)H oxidase activity(GO:0016174) |
| 0.1 | 2.1 | GO:0051018 | protein kinase A binding(GO:0051018) |
| 0.1 | 1.8 | GO:0035326 | enhancer binding(GO:0035326) |
| 0.1 | 1.0 | GO:0008253 | 5'-nucleotidase activity(GO:0008253) |
| 0.1 | 2.7 | GO:0033613 | activating transcription factor binding(GO:0033613) |
| 0.1 | 0.2 | GO:0071885 | N-terminal protein N-methyltransferase activity(GO:0071885) |
| 0.1 | 1.5 | GO:0070001 | aspartic-type endopeptidase activity(GO:0004190) aspartic-type peptidase activity(GO:0070001) |
| 0.1 | 0.2 | GO:0061575 | cyclin-dependent protein serine/threonine kinase activator activity(GO:0061575) |
| 0.1 | 0.2 | GO:0005011 | macrophage colony-stimulating factor receptor activity(GO:0005011) |
| 0.1 | 0.3 | GO:0047429 | nucleoside-triphosphate diphosphatase activity(GO:0047429) |
| 0.1 | 1.1 | GO:0030544 | Hsp70 protein binding(GO:0030544) |
| 0.1 | 0.2 | GO:0044020 | histone methyltransferase activity (H4-R3 specific)(GO:0044020) |
| 0.1 | 0.9 | GO:0097016 | L27 domain binding(GO:0097016) |
| 0.1 | 0.2 | GO:0003847 | 1-alkyl-2-acetylglycerophosphocholine esterase activity(GO:0003847) |
| 0.1 | 0.7 | GO:0030306 | ADP-ribosylation factor binding(GO:0030306) |
| 0.1 | 0.5 | GO:0045159 | myosin II binding(GO:0045159) |
| 0.1 | 0.2 | GO:0004461 | lactose synthase activity(GO:0004461) |
| 0.1 | 0.7 | GO:0045504 | dynein heavy chain binding(GO:0045504) |
| 0.1 | 0.2 | GO:0004146 | dihydrofolate reductase activity(GO:0004146) |
| 0.1 | 0.1 | GO:0036435 | K48-linked polyubiquitin binding(GO:0036435) |
| 0.1 | 0.5 | GO:0001042 | RNA polymerase I core binding(GO:0001042) |
| 0.1 | 1.5 | GO:0016538 | cyclin-dependent protein serine/threonine kinase regulator activity(GO:0016538) |
| 0.1 | 0.1 | GO:0031177 | phosphopantetheine binding(GO:0031177) |
| 0.0 | 2.1 | GO:0005160 | transforming growth factor beta receptor binding(GO:0005160) |
| 0.0 | 1.4 | GO:0016628 | oxidoreductase activity, acting on the CH-CH group of donors, NAD or NADP as acceptor(GO:0016628) |
| 0.0 | 1.9 | GO:0017046 | peptide hormone binding(GO:0017046) |
| 0.0 | 0.1 | GO:0016497 | substance K receptor activity(GO:0016497) |
| 0.0 | 0.2 | GO:0000179 | rRNA (adenine-N6,N6-)-dimethyltransferase activity(GO:0000179) |
| 0.0 | 0.2 | GO:0015056 | corticotrophin-releasing factor receptor activity(GO:0015056) |
| 0.0 | 0.6 | GO:0032036 | myosin heavy chain binding(GO:0032036) |
| 0.0 | 15.1 | GO:0008134 | transcription factor binding(GO:0008134) |
| 0.0 | 1.8 | GO:0005484 | SNAP receptor activity(GO:0005484) |
| 0.0 | 0.2 | GO:0070891 | lipoteichoic acid binding(GO:0070891) |
| 0.0 | 3.2 | GO:0035064 | methylated histone binding(GO:0035064) |
| 0.0 | 3.0 | GO:0017112 | Rab guanyl-nucleotide exchange factor activity(GO:0017112) |
| 0.0 | 0.1 | GO:0070576 | vitamin D 24-hydroxylase activity(GO:0070576) |
| 0.0 | 1.5 | GO:0003785 | actin monomer binding(GO:0003785) |
| 0.0 | 3.2 | GO:0004004 | ATP-dependent RNA helicase activity(GO:0004004) |
| 0.0 | 0.1 | GO:0003923 | GPI-anchor transamidase activity(GO:0003923) |
| 0.0 | 0.1 | GO:0003845 | 11-beta-hydroxysteroid dehydrogenase [NAD(P)] activity(GO:0003845) |
| 0.0 | 0.9 | GO:0009881 | photoreceptor activity(GO:0009881) |
| 0.0 | 0.1 | GO:0016803 | ether hydrolase activity(GO:0016803) |
| 0.0 | 0.2 | GO:0070320 | inward rectifier potassium channel inhibitor activity(GO:0070320) |
| 0.0 | 0.3 | GO:0003964 | telomerase activity(GO:0003720) RNA-directed DNA polymerase activity(GO:0003964) |
| 0.0 | 0.2 | GO:0004022 | alcohol dehydrogenase (NAD) activity(GO:0004022) |
| 0.0 | 0.5 | GO:0017049 | GTP-Rho binding(GO:0017049) |
| 0.0 | 0.2 | GO:0016230 | sphingomyelin phosphodiesterase activator activity(GO:0016230) |
| 0.0 | 3.1 | GO:0032947 | protein complex scaffold(GO:0032947) |
| 0.0 | 0.5 | GO:0004623 | phospholipase A2 activity(GO:0004623) |
| 0.0 | 0.5 | GO:0019531 | oxalate transmembrane transporter activity(GO:0019531) |
| 0.0 | 1.6 | GO:0004402 | histone acetyltransferase activity(GO:0004402) |
| 0.0 | 0.1 | GO:0018812 | 3-hydroxyacyl-CoA dehydratase activity(GO:0018812) |
| 0.0 | 2.5 | GO:0004693 | cyclin-dependent protein serine/threonine kinase activity(GO:0004693) |
| 0.0 | 0.2 | GO:0097001 | ceramide binding(GO:0097001) |
| 0.0 | 0.2 | GO:0097027 | ubiquitin-protein transferase activator activity(GO:0097027) |
| 0.0 | 2.4 | GO:0043621 | protein self-association(GO:0043621) |
| 0.0 | 0.3 | GO:0004565 | beta-galactosidase activity(GO:0004565) |
| 0.0 | 0.2 | GO:0047045 | testosterone 17-beta-dehydrogenase (NADP+) activity(GO:0047045) |
| 0.0 | 0.3 | GO:0019534 | toxin transporter activity(GO:0019534) |
| 0.0 | 0.1 | GO:0004514 | nicotinate-nucleotide diphosphorylase (carboxylating) activity(GO:0004514) |
| 0.0 | 0.2 | GO:0004853 | uroporphyrinogen decarboxylase activity(GO:0004853) |
| 0.0 | 0.2 | GO:0051373 | FATZ binding(GO:0051373) |
| 0.0 | 0.1 | GO:0004157 | dihydropyrimidinase activity(GO:0004157) |
| 0.0 | 0.2 | GO:0015562 | efflux transmembrane transporter activity(GO:0015562) |
| 0.0 | 0.1 | GO:1903763 | gap junction channel activity involved in cell communication by electrical coupling(GO:1903763) |
| 0.0 | 0.2 | GO:0016933 | extracellular-glycine-gated ion channel activity(GO:0016933) extracellular-glycine-gated chloride channel activity(GO:0016934) |
| 0.0 | 0.5 | GO:1990841 | promoter-specific chromatin binding(GO:1990841) |
| 0.0 | 0.1 | GO:0004583 | dolichyl-phosphate-glucose-glycolipid alpha-glucosyltransferase activity(GO:0004583) |
| 0.0 | 2.5 | GO:0004497 | monooxygenase activity(GO:0004497) |
| 0.0 | 0.8 | GO:0098641 | cadherin binding involved in cell-cell adhesion(GO:0098641) |
| 0.0 | 0.1 | GO:0070180 | large ribosomal subunit rRNA binding(GO:0070180) |
| 0.0 | 0.9 | GO:0043014 | alpha-tubulin binding(GO:0043014) |
| 0.0 | 0.7 | GO:0004745 | retinol dehydrogenase activity(GO:0004745) |
| 0.0 | 0.1 | GO:0016922 | ligand-dependent nuclear receptor binding(GO:0016922) |
| 0.0 | 0.2 | GO:0070735 | protein-glycine ligase activity(GO:0070735) |
| 0.0 | 0.1 | GO:0016531 | copper chaperone activity(GO:0016531) |
| 0.0 | 0.0 | GO:0005168 | neurotrophin TRKA receptor binding(GO:0005168) |
| 0.0 | 0.1 | GO:0051380 | beta-adrenergic receptor activity(GO:0004939) norepinephrine binding(GO:0051380) |
| 0.0 | 0.5 | GO:0004089 | carbonate dehydratase activity(GO:0004089) |
| 0.0 | 0.1 | GO:0005459 | UDP-galactose transmembrane transporter activity(GO:0005459) |
| 0.0 | 1.2 | GO:0000146 | microfilament motor activity(GO:0000146) |
| 0.0 | 0.2 | GO:0000104 | succinate dehydrogenase activity(GO:0000104) |
| 0.0 | 0.8 | GO:0001972 | retinoic acid binding(GO:0001972) |
| 0.0 | 0.2 | GO:0048495 | Roundabout binding(GO:0048495) |
| 0.0 | 0.4 | GO:0004697 | protein kinase C activity(GO:0004697) |
| 0.0 | 0.8 | GO:0022848 | acetylcholine-gated cation channel activity(GO:0022848) |
| 0.0 | 0.2 | GO:0030628 | pre-mRNA 3'-splice site binding(GO:0030628) |
| 0.0 | 0.1 | GO:0042134 | rRNA primary transcript binding(GO:0042134) |
| 0.0 | 0.3 | GO:0043274 | phospholipase binding(GO:0043274) |
| 0.0 | 0.6 | GO:0031957 | very long-chain fatty acid-CoA ligase activity(GO:0031957) |
| 0.0 | 0.8 | GO:0030371 | translation repressor activity(GO:0030371) |
| 0.0 | 0.4 | GO:0070492 | oligosaccharide binding(GO:0070492) |
| 0.0 | 1.6 | GO:0050136 | NADH dehydrogenase (ubiquinone) activity(GO:0008137) NADH dehydrogenase (quinone) activity(GO:0050136) |
| 0.0 | 0.2 | GO:0000774 | adenyl-nucleotide exchange factor activity(GO:0000774) |
| 0.0 | 0.3 | GO:0016286 | small conductance calcium-activated potassium channel activity(GO:0016286) |
| 0.0 | 0.1 | GO:0004949 | cannabinoid receptor activity(GO:0004949) |
| 0.0 | 0.5 | GO:0050811 | GABA receptor binding(GO:0050811) |
| 0.0 | 0.2 | GO:0045029 | UDP-activated nucleotide receptor activity(GO:0045029) |
| 0.0 | 1.0 | GO:0050699 | WW domain binding(GO:0050699) |
| 0.0 | 0.1 | GO:0060422 | peptidyl-dipeptidase inhibitor activity(GO:0060422) |
| 0.0 | 0.1 | GO:0090599 | alpha-glucosidase activity(GO:0090599) |
| 0.0 | 0.6 | GO:0019206 | nucleoside kinase activity(GO:0019206) |
| 0.0 | 0.3 | GO:0098847 | sequence-specific single stranded DNA binding(GO:0098847) |
| 0.0 | 0.2 | GO:0003810 | protein-glutamine gamma-glutamyltransferase activity(GO:0003810) |
| 0.0 | 0.6 | GO:0051537 | 2 iron, 2 sulfur cluster binding(GO:0051537) |
| 0.0 | 0.5 | GO:0005537 | mannose binding(GO:0005537) |
| 0.0 | 0.0 | GO:0016422 | mRNA (2'-O-methyladenosine-N6-)-methyltransferase activity(GO:0016422) |
| 0.0 | 0.1 | GO:0035497 | cAMP response element binding(GO:0035497) |
| 0.0 | 0.1 | GO:0050567 | glutaminyl-tRNA synthase (glutamine-hydrolyzing) activity(GO:0050567) |
| 0.0 | 0.1 | GO:0034647 | histone demethylase activity (H3-trimethyl-K4 specific)(GO:0034647) |
| 0.0 | 0.1 | GO:0004427 | inorganic diphosphatase activity(GO:0004427) |
| 0.0 | 0.3 | GO:0001968 | fibronectin binding(GO:0001968) |
| 0.0 | 0.2 | GO:0055131 | C3HC4-type RING finger domain binding(GO:0055131) |
| 0.0 | 0.1 | GO:0070990 | snRNP binding(GO:0070990) |
| 0.0 | 0.4 | GO:0001055 | RNA polymerase II activity(GO:0001055) |
| 0.0 | 0.2 | GO:0048039 | ubiquinone binding(GO:0048039) |
| 0.0 | 0.1 | GO:0016624 | oxidoreductase activity, acting on the aldehyde or oxo group of donors, disulfide as acceptor(GO:0016624) |
| 0.0 | 0.1 | GO:0008967 | phosphoglycolate phosphatase activity(GO:0008967) DNA 5'-adenosine monophosphate hydrolase activity(GO:0033699) |
| 0.0 | 1.0 | GO:0004364 | glutathione transferase activity(GO:0004364) |
| 0.0 | 0.3 | GO:0044213 | intronic transcription regulatory region sequence-specific DNA binding(GO:0001161) intronic transcription regulatory region DNA binding(GO:0044213) |
| 0.0 | 0.1 | GO:0008353 | RNA polymerase II carboxy-terminal domain kinase activity(GO:0008353) |
| 0.0 | 1.4 | GO:0004553 | hydrolase activity, hydrolyzing O-glycosyl compounds(GO:0004553) |
| 0.0 | 0.9 | GO:0051219 | phosphoprotein binding(GO:0051219) |
| 0.0 | 0.3 | GO:0034450 | ubiquitin-ubiquitin ligase activity(GO:0034450) |
| 0.0 | 0.1 | GO:0008379 | thioredoxin peroxidase activity(GO:0008379) |
| 0.0 | 0.2 | GO:0060228 | phosphatidylcholine-sterol O-acyltransferase activator activity(GO:0060228) |
| 0.0 | 0.1 | GO:0070039 | rRNA (guanosine-2'-O-)-methyltransferase activity(GO:0070039) |
| 0.0 | 0.2 | GO:0008430 | selenium binding(GO:0008430) |
| 0.0 | 0.1 | GO:0030144 | alpha-1,6-mannosylglycoprotein 6-beta-N-acetylglucosaminyltransferase activity(GO:0030144) |
| 0.0 | 0.1 | GO:0000829 | inositol-1,3,4,5,6-pentakisphosphate kinase activity(GO:0000827) inositol hexakisphosphate kinase activity(GO:0000828) inositol heptakisphosphate kinase activity(GO:0000829) inositol hexakisphosphate 5-kinase activity(GO:0000832) inositol hexakisphosphate 1-kinase activity(GO:0052723) inositol hexakisphosphate 3-kinase activity(GO:0052724) |
| 0.0 | 0.1 | GO:0005000 | vasopressin receptor activity(GO:0005000) |
| 0.0 | 0.0 | GO:0036009 | protein-glutamine N-methyltransferase activity(GO:0036009) histone-glutamine methyltransferase activity(GO:1990259) |
| 0.0 | 0.3 | GO:0019870 | potassium channel inhibitor activity(GO:0019870) |
| 0.0 | 0.1 | GO:0048027 | mRNA 5'-UTR binding(GO:0048027) |
| 0.0 | 0.2 | GO:0022851 | GABA-gated chloride ion channel activity(GO:0022851) |
| 0.0 | 0.0 | GO:0050436 | microfibril binding(GO:0050436) |
| 0.0 | 0.1 | GO:0002094 | polyprenyltransferase activity(GO:0002094) |
| 0.0 | 0.2 | GO:0003678 | DNA helicase activity(GO:0003678) |
| 0.0 | 0.1 | GO:0004668 | protein-arginine deiminase activity(GO:0004668) |
| 0.0 | 0.1 | GO:0045131 | pre-mRNA branch point binding(GO:0045131) |
| 0.0 | 1.8 | GO:0003730 | mRNA 3'-UTR binding(GO:0003730) |
| 0.0 | 0.2 | GO:0017091 | AU-rich element binding(GO:0017091) |
| 0.0 | 0.3 | GO:0070412 | R-SMAD binding(GO:0070412) |
| 0.0 | 0.1 | GO:0031812 | G-protein coupled nucleotide receptor binding(GO:0031811) P2Y1 nucleotide receptor binding(GO:0031812) |
| 0.0 | 3.5 | GO:0003735 | structural constituent of ribosome(GO:0003735) |
| 0.0 | 0.3 | GO:0036374 | glutathione hydrolase activity(GO:0036374) |
| 0.0 | 0.1 | GO:0004419 | hydroxymethylglutaryl-CoA lyase activity(GO:0004419) |
| 0.0 | 0.1 | GO:0016802 | adenosylhomocysteinase activity(GO:0004013) trialkylsulfonium hydrolase activity(GO:0016802) |
| 0.0 | 0.1 | GO:0016813 | hydrolase activity, acting on carbon-nitrogen (but not peptide) bonds, in linear amidines(GO:0016813) |
| 0.0 | 0.0 | GO:0003858 | 3-hydroxybutyrate dehydrogenase activity(GO:0003858) |
| 0.0 | 0.3 | GO:0015278 | calcium-release channel activity(GO:0015278) ligand-gated calcium channel activity(GO:0099604) |
| 0.0 | 0.1 | GO:0030197 | extracellular matrix constituent, lubricant activity(GO:0030197) |
| 0.0 | 0.3 | GO:0004806 | triglyceride lipase activity(GO:0004806) |
| 0.0 | 0.0 | GO:0035514 | DNA demethylase activity(GO:0035514) DNA-N1-methyladenine dioxygenase activity(GO:0043734) |
| 0.0 | 0.0 | GO:0016520 | growth hormone-releasing hormone receptor activity(GO:0016520) |
| 0.0 | 0.1 | GO:0004994 | somatostatin receptor activity(GO:0004994) |
| 0.0 | 0.0 | GO:0044388 | small protein activating enzyme binding(GO:0044388) |
| 0.0 | 0.1 | GO:0046933 | proton-transporting ATP synthase activity, rotational mechanism(GO:0046933) |
| 0.0 | 0.7 | GO:0034987 | immunoglobulin receptor binding(GO:0034987) |
| 0.0 | 0.0 | GO:0031748 | D1 dopamine receptor binding(GO:0031748) |
| 0.0 | 0.3 | GO:0033130 | acetylcholine receptor binding(GO:0033130) |
| 0.0 | 0.4 | GO:0004003 | ATP-dependent DNA helicase activity(GO:0004003) |
| 0.0 | 0.1 | GO:0005047 | signal recognition particle binding(GO:0005047) |
| 0.0 | 2.6 | GO:0003713 | transcription coactivator activity(GO:0003713) |
| 0.0 | 0.1 | GO:0004594 | pantothenate kinase activity(GO:0004594) |
| 0.0 | 0.0 | GO:0070051 | fibrinogen binding(GO:0070051) |
| 0.0 | 0.0 | GO:0042781 | 3'-tRNA processing endoribonuclease activity(GO:0042781) |
| 0.0 | 0.1 | GO:0016655 | oxidoreductase activity, acting on NAD(P)H, quinone or similar compound as acceptor(GO:0016655) |
| 0.0 | 0.0 | GO:0015375 | glycine:sodium symporter activity(GO:0015375) |
| 0.0 | 0.0 | GO:0008169 | C-methyltransferase activity(GO:0008169) |
| 0.0 | 0.3 | GO:0042043 | neurexin family protein binding(GO:0042043) |
| 0.0 | 0.0 | GO:0043184 | vascular endothelial growth factor receptor 2 binding(GO:0043184) |
| 0.0 | 1.8 | GO:0003823 | antigen binding(GO:0003823) |
| 0.0 | 0.1 | GO:0005004 | GPI-linked ephrin receptor activity(GO:0005004) |
| 0.0 | 1.2 | GO:0051082 | unfolded protein binding(GO:0051082) |
| 0.0 | 0.2 | GO:0051371 | muscle alpha-actinin binding(GO:0051371) |
| 0.0 | 0.1 | GO:0008109 | N-acetyllactosaminide beta-1,6-N-acetylglucosaminyltransferase activity(GO:0008109) |
| 0.0 | 0.1 | GO:0015217 | ATP transmembrane transporter activity(GO:0005347) ADP transmembrane transporter activity(GO:0015217) |
| 0.0 | 1.3 | GO:0003774 | motor activity(GO:0003774) |
| 0.0 | 0.0 | GO:0005277 | acetylcholine transmembrane transporter activity(GO:0005277) acetate ester transmembrane transporter activity(GO:1901375) |
| 0.0 | 0.3 | GO:0051879 | Hsp90 protein binding(GO:0051879) |
| 0.0 | 1.8 | GO:0008022 | protein C-terminus binding(GO:0008022) |
| 0.0 | 0.2 | GO:0043495 | protein anchor(GO:0043495) |
Gene overrepresentation in curated gene sets: canonical pathways category:
| Log-likelihood per target | Total log-likelihood | Term | Description |
|---|---|---|---|
| 0.7 | 41.9 | PID TCR CALCIUM PATHWAY | Calcium signaling in the CD4+ TCR pathway |
| 0.7 | 1.3 | PID GLYPICAN 1PATHWAY | Glypican 1 network |
| 0.4 | 22.6 | PID ALPHA SYNUCLEIN PATHWAY | Alpha-synuclein signaling |
| 0.4 | 6.1 | PID VEGF VEGFR PATHWAY | VEGF and VEGFR signaling network |
| 0.4 | 4.6 | ST PAC1 RECEPTOR PATHWAY | PAC1 Receptor Pathway |
| 0.3 | 8.9 | PID NFKAPPAB ATYPICAL PATHWAY | Atypical NF-kappaB pathway |
| 0.3 | 2.0 | PID VEGFR1 PATHWAY | VEGFR1 specific signals |
| 0.3 | 1.0 | PID LYMPH ANGIOGENESIS PATHWAY | VEGFR3 signaling in lymphatic endothelium |
| 0.2 | 1.7 | PID PI3KCI PATHWAY | Class I PI3K signaling events |
| 0.2 | 13.9 | ST ERK1 ERK2 MAPK PATHWAY | ERK1/ERK2 MAPK Pathway |
| 0.2 | 21.0 | PID HNF3A PATHWAY | FOXA1 transcription factor network |
| 0.2 | 8.5 | PID SMAD2 3PATHWAY | Regulation of cytoplasmic and nuclear SMAD2/3 signaling |
| 0.2 | 0.7 | SA CASPASE CASCADE | Apoptosis is mediated by caspases, cysteine proteases arranged in a proteolytic cascade. |
| 0.2 | 3.3 | PID IL2 PI3K PATHWAY | IL2 signaling events mediated by PI3K |
| 0.2 | 2.8 | SA PROGRAMMED CELL DEATH | Programmed cell death, or apoptosis, eliminates damaged or unneeded cells. |
| 0.2 | 4.6 | PID IL3 PATHWAY | IL3-mediated signaling events |
| 0.2 | 7.2 | SA MMP CYTOKINE CONNECTION | Cytokines can induce activation of matrix metalloproteinases, which degrade extracellular matrix. |
| 0.2 | 5.5 | PID EPHRINB REV PATHWAY | Ephrin B reverse signaling |
| 0.2 | 9.5 | PID EPO PATHWAY | EPO signaling pathway |
| 0.2 | 5.3 | PID IL6 7 PATHWAY | IL6-mediated signaling events |
| 0.2 | 1.9 | ST IL 13 PATHWAY | Interleukin 13 (IL-13) Pathway |
| 0.2 | 5.7 | PID IGF1 PATHWAY | IGF1 pathway |
| 0.2 | 2.8 | PID ALK2 PATHWAY | ALK2 signaling events |
| 0.2 | 1.8 | PID PDGFRA PATHWAY | PDGFR-alpha signaling pathway |
| 0.2 | 8.1 | PID P38 ALPHA BETA DOWNSTREAM PATHWAY | Signaling mediated by p38-alpha and p38-beta |
| 0.2 | 1.4 | ST PHOSPHOINOSITIDE 3 KINASE PATHWAY | PI3K Pathway |
| 0.2 | 17.1 | PID E2F PATHWAY | E2F transcription factor network |
| 0.1 | 3.7 | PID NECTIN PATHWAY | Nectin adhesion pathway |
| 0.1 | 8.8 | PID HES HEY PATHWAY | Notch-mediated HES/HEY network |
| 0.1 | 12.5 | PID RAC1 REG PATHWAY | Regulation of RAC1 activity |
| 0.1 | 6.5 | PID HIF2PATHWAY | HIF-2-alpha transcription factor network |
| 0.1 | 5.8 | PID TRAIL PATHWAY | TRAIL signaling pathway |
| 0.1 | 1.5 | PID RANBP2 PATHWAY | Sumoylation by RanBP2 regulates transcriptional repression |
| 0.1 | 4.6 | PID IL2 1PATHWAY | IL2-mediated signaling events |
| 0.1 | 2.9 | PID S1P S1P1 PATHWAY | S1P1 pathway |
| 0.1 | 1.1 | ST INTERFERON GAMMA PATHWAY | Interferon gamma pathway. |
| 0.1 | 0.8 | PID WNT SIGNALING PATHWAY | Wnt signaling network |
| 0.1 | 10.2 | PID CASPASE PATHWAY | Caspase cascade in apoptosis |
| 0.1 | 5.2 | PID SYNDECAN 4 PATHWAY | Syndecan-4-mediated signaling events |
| 0.1 | 4.2 | PID SYNDECAN 2 PATHWAY | Syndecan-2-mediated signaling events |
| 0.1 | 2.5 | PID NEPHRIN NEPH1 PATHWAY | Nephrin/Neph1 signaling in the kidney podocyte |
| 0.1 | 0.6 | ST TUMOR NECROSIS FACTOR PATHWAY | Tumor Necrosis Factor Pathway. |
| 0.1 | 4.6 | PID TNF PATHWAY | TNF receptor signaling pathway |
| 0.1 | 2.6 | ST GA13 PATHWAY | G alpha 13 Pathway |
| 0.1 | 1.9 | PID NFKAPPAB CANONICAL PATHWAY | Canonical NF-kappaB pathway |
| 0.1 | 2.6 | SIG CD40PATHWAYMAP | Genes related to CD40 signaling |
| 0.1 | 13.2 | PID BETA CATENIN NUC PATHWAY | Regulation of nuclear beta catenin signaling and target gene transcription |
| 0.1 | 1.9 | PID PI3K PLC TRK PATHWAY | Trk receptor signaling mediated by PI3K and PLC-gamma |
| 0.1 | 1.8 | NABA BASEMENT MEMBRANES | Genes encoding structural components of basement membranes |
| 0.1 | 4.5 | SIG INSULIN RECEPTOR PATHWAY IN CARDIAC MYOCYTES | Genes related to the insulin receptor pathway |
| 0.1 | 2.0 | PID INTEGRIN A9B1 PATHWAY | Alpha9 beta1 integrin signaling events |
| 0.1 | 1.6 | PID WNT CANONICAL PATHWAY | Canonical Wnt signaling pathway |
| 0.1 | 0.8 | PID AMB2 NEUTROPHILS PATHWAY | amb2 Integrin signaling |
| 0.1 | 0.7 | PID FOXO PATHWAY | FoxO family signaling |
| 0.1 | 1.1 | PID NFAT 3PATHWAY | Role of Calcineurin-dependent NFAT signaling in lymphocytes |
| 0.1 | 0.6 | PID IL2 STAT5 PATHWAY | IL2 signaling events mediated by STAT5 |
| 0.1 | 0.4 | ST G ALPHA S PATHWAY | G alpha s Pathway |
| 0.1 | 3.4 | PID AP1 PATHWAY | AP-1 transcription factor network |
| 0.1 | 0.6 | PID KIT PATHWAY | Signaling events mediated by Stem cell factor receptor (c-Kit) |
| 0.1 | 0.9 | PID ARF6 DOWNSTREAM PATHWAY | Arf6 downstream pathway |
| 0.1 | 0.9 | PID HDAC CLASSIII PATHWAY | Signaling events mediated by HDAC Class III |
| 0.1 | 1.5 | PID TOLL ENDOGENOUS PATHWAY | Endogenous TLR signaling |
| 0.1 | 1.4 | PID PTP1B PATHWAY | Signaling events mediated by PTP1B |
| 0.1 | 3.2 | PID TGFBR PATHWAY | TGF-beta receptor signaling |
| 0.1 | 0.8 | PID EPHB FWD PATHWAY | EPHB forward signaling |
| 0.1 | 1.3 | PID P38 ALPHA BETA PATHWAY | Regulation of p38-alpha and p38-beta |
| 0.1 | 1.2 | PID INTEGRIN A4B1 PATHWAY | Alpha4 beta1 integrin signaling events |
| 0.1 | 0.1 | PID EPHA2 FWD PATHWAY | EPHA2 forward signaling |
| 0.1 | 3.5 | PID NOTCH PATHWAY | Notch signaling pathway |
| 0.1 | 2.3 | ST T CELL SIGNAL TRANSDUCTION | T Cell Signal Transduction |
| 0.1 | 4.0 | PID CMYB PATHWAY | C-MYB transcription factor network |
| 0.1 | 1.8 | PID RB 1PATHWAY | Regulation of retinoblastoma protein |
| 0.0 | 3.4 | PID HDAC CLASSI PATHWAY | Signaling events mediated by HDAC Class I |
| 0.0 | 0.1 | PID PS1 PATHWAY | Presenilin action in Notch and Wnt signaling |
| 0.0 | 2.5 | PID AR PATHWAY | Coregulation of Androgen receptor activity |
| 0.0 | 0.0 | SA G2 AND M PHASES | Cdc25 activates the cdc2/cyclin B complex to induce the G2/M transition. |
| 0.0 | 0.8 | PID FAK PATHWAY | Signaling events mediated by focal adhesion kinase |
| 0.0 | 0.7 | PID ERBB1 DOWNSTREAM PATHWAY | ErbB1 downstream signaling |
| 0.0 | 1.0 | PID NCADHERIN PATHWAY | N-cadherin signaling events |
| 0.0 | 1.0 | PID IL23 PATHWAY | IL23-mediated signaling events |
| 0.0 | 2.0 | PID HNF3B PATHWAY | FOXA2 and FOXA3 transcription factor networks |
| 0.0 | 0.8 | PID PRL SIGNALING EVENTS PATHWAY | Signaling events mediated by PRL |
| 0.0 | 0.6 | PID ANTHRAX PATHWAY | Cellular roles of Anthrax toxin |
| 0.0 | 0.4 | SA G1 AND S PHASES | Cdk2, 4, and 6 bind cyclin D in G1, while cdk2/cyclin E promotes the G1/S transition. |
| 0.0 | 0.5 | PID ERBB4 PATHWAY | ErbB4 signaling events |
| 0.0 | 1.2 | PID CD8 TCR DOWNSTREAM PATHWAY | Downstream signaling in naïve CD8+ T cells |
| 0.0 | 0.6 | PID BCR 5PATHWAY | BCR signaling pathway |
| 0.0 | 1.1 | PID CONE PATHWAY | Visual signal transduction: Cones |
| 0.0 | 0.6 | PID NETRIN PATHWAY | Netrin-mediated signaling events |
| 0.0 | 0.4 | PID ERB GENOMIC PATHWAY | Validated nuclear estrogen receptor beta network |
| 0.0 | 0.2 | PID TCPTP PATHWAY | Signaling events mediated by TCPTP |
| 0.0 | 0.6 | PID REG GR PATHWAY | Glucocorticoid receptor regulatory network |
| 0.0 | 0.7 | PID IL12 2PATHWAY | IL12-mediated signaling events |
| 0.0 | 0.5 | PID ANGIOPOIETIN RECEPTOR PATHWAY | Angiopoietin receptor Tie2-mediated signaling |
| 0.0 | 0.8 | PID ATM PATHWAY | ATM pathway |
| 0.0 | 0.4 | PID CERAMIDE PATHWAY | Ceramide signaling pathway |
| 0.0 | 1.2 | NABA PROTEOGLYCANS | Genes encoding proteoglycans |
| 0.0 | 6.3 | NABA ECM GLYCOPROTEINS | Genes encoding structural ECM glycoproteins |
| 0.0 | 0.3 | PID P38 MK2 PATHWAY | p38 signaling mediated by MAPKAP kinases |
| 0.0 | 0.5 | PID ERBB1 INTERNALIZATION PATHWAY | Internalization of ErbB1 |
| 0.0 | 0.0 | PID GMCSF PATHWAY | GMCSF-mediated signaling events |
| 0.0 | 0.2 | PID FRA PATHWAY | Validated transcriptional targets of AP1 family members Fra1 and Fra2 |
| 0.0 | 0.2 | SIG PIP3 SIGNALING IN CARDIAC MYOCTES | Genes related to PIP3 signaling in cardiac myocytes |
| 0.0 | 0.1 | PID AR NONGENOMIC PATHWAY | Nongenotropic Androgen signaling |
| 0.0 | 0.0 | SIG IL4RECEPTOR IN B LYPHOCYTES | Genes related to IL4 rceptor signaling in B lymphocytes |
| 0.0 | 1.2 | PID MYC REPRESS PATHWAY | Validated targets of C-MYC transcriptional repression |
| 0.0 | 0.1 | PID FAS PATHWAY | FAS (CD95) signaling pathway |
| 0.0 | 4.1 | NABA SECRETED FACTORS | Genes encoding secreted soluble factors |
| 0.0 | 0.1 | PID ERBB2 ERBB3 PATHWAY | ErbB2/ErbB3 signaling events |
Gene overrepresentation in curated gene sets: REACTOME pathways category:
| Log-likelihood per target | Total log-likelihood | Term | Description |
|---|---|---|---|
| 0.4 | 2.4 | REACTOME BINDING AND ENTRY OF HIV VIRION | Genes involved in Binding and entry of HIV virion |
| 0.4 | 14.7 | REACTOME CHOLESTEROL BIOSYNTHESIS | Genes involved in Cholesterol biosynthesis |
| 0.3 | 1.0 | REACTOME DESTABILIZATION OF MRNA BY AUF1 HNRNP D0 | Genes involved in Destabilization of mRNA by AUF1 (hnRNP D0) |
| 0.3 | 2.3 | REACTOME IRAK2 MEDIATED ACTIVATION OF TAK1 COMPLEX UPON TLR7 8 OR 9 STIMULATION | Genes involved in IRAK2 mediated activation of TAK1 complex upon TLR7/8 or 9 stimulation |
| 0.3 | 13.3 | REACTOME SMAD2 SMAD3 SMAD4 HETEROTRIMER REGULATES TRANSCRIPTION | Genes involved in SMAD2/SMAD3:SMAD4 heterotrimer regulates transcription |
| 0.3 | 3.1 | REACTOME CS DS DEGRADATION | Genes involved in CS/DS degradation |
| 0.3 | 7.5 | REACTOME REGULATION OF INSULIN LIKE GROWTH FACTOR IGF ACTIVITY BY INSULIN LIKE GROWTH FACTOR BINDING PROTEINS IGFBPS | Genes involved in Regulation of Insulin-like Growth Factor (IGF) Activity by Insulin-like Growth Factor Binding Proteins (IGFBPs) |
| 0.3 | 0.6 | REACTOME ACYL CHAIN REMODELLING OF PI | Genes involved in Acyl chain remodelling of PI |
| 0.3 | 6.0 | REACTOME SIGNAL ATTENUATION | Genes involved in Signal attenuation |
| 0.3 | 18.1 | REACTOME DARPP 32 EVENTS | Genes involved in DARPP-32 events |
| 0.3 | 8.2 | REACTOME RAP1 SIGNALLING | Genes involved in Rap1 signalling |
| 0.3 | 4.1 | REACTOME SIGNALING BY NOTCH3 | Genes involved in Signaling by NOTCH3 |
| 0.3 | 11.6 | REACTOME GROWTH HORMONE RECEPTOR SIGNALING | Genes involved in Growth hormone receptor signaling |
| 0.3 | 6.3 | REACTOME ACTIVATION OF BH3 ONLY PROTEINS | Genes involved in Activation of BH3-only proteins |
| 0.3 | 9.6 | REACTOME RNA POL III TRANSCRIPTION TERMINATION | Genes involved in RNA Polymerase III Transcription Termination |
| 0.2 | 4.3 | REACTOME PYRIMIDINE CATABOLISM | Genes involved in Pyrimidine catabolism |
| 0.2 | 1.2 | REACTOME ADP SIGNALLING THROUGH P2RY1 | Genes involved in ADP signalling through P2Y purinoceptor 1 |
| 0.2 | 1.9 | REACTOME ADP SIGNALLING THROUGH P2RY12 | Genes involved in ADP signalling through P2Y purinoceptor 12 |
| 0.2 | 4.4 | REACTOME ACTIVATION OF IRF3 IRF7 MEDIATED BY TBK1 IKK EPSILON | Genes involved in Activation of IRF3/IRF7 mediated by TBK1/IKK epsilon |
| 0.2 | 0.7 | REACTOME SPRY REGULATION OF FGF SIGNALING | Genes involved in Spry regulation of FGF signaling |
| 0.2 | 20.5 | REACTOME NOTCH1 INTRACELLULAR DOMAIN REGULATES TRANSCRIPTION | Genes involved in NOTCH1 Intracellular Domain Regulates Transcription |
| 0.2 | 3.0 | REACTOME ETHANOL OXIDATION | Genes involved in Ethanol oxidation |
| 0.2 | 2.1 | REACTOME CD28 DEPENDENT PI3K AKT SIGNALING | Genes involved in CD28 dependent PI3K/Akt signaling |
| 0.2 | 4.1 | REACTOME SYNTHESIS OF PE | Genes involved in Synthesis of PE |
| 0.2 | 1.1 | REACTOME IKK COMPLEX RECRUITMENT MEDIATED BY RIP1 | Genes involved in IKK complex recruitment mediated by RIP1 |
| 0.2 | 5.1 | REACTOME PROTEOLYTIC CLEAVAGE OF SNARE COMPLEX PROTEINS | Genes involved in Proteolytic cleavage of SNARE complex proteins |
| 0.2 | 5.1 | REACTOME ACYL CHAIN REMODELLING OF PC | Genes involved in Acyl chain remodelling of PC |
| 0.2 | 1.8 | REACTOME PECAM1 INTERACTIONS | Genes involved in PECAM1 interactions |
| 0.2 | 4.3 | REACTOME SIGNALING BY FGFR1 FUSION MUTANTS | Genes involved in Signaling by FGFR1 fusion mutants |
| 0.2 | 3.2 | REACTOME VEGF LIGAND RECEPTOR INTERACTIONS | Genes involved in VEGF ligand-receptor interactions |
| 0.2 | 5.8 | REACTOME PEROXISOMAL LIPID METABOLISM | Genes involved in Peroxisomal lipid metabolism |
| 0.2 | 7.2 | REACTOME NUCLEAR EVENTS KINASE AND TRANSCRIPTION FACTOR ACTIVATION | Genes involved in Nuclear Events (kinase and transcription factor activation) |
| 0.2 | 2.4 | REACTOME GLYCEROPHOSPHOLIPID BIOSYNTHESIS | Genes involved in Glycerophospholipid biosynthesis |
| 0.2 | 3.8 | REACTOME SYNTHESIS OF PA | Genes involved in Synthesis of PA |
| 0.2 | 4.1 | REACTOME HDL MEDIATED LIPID TRANSPORT | Genes involved in HDL-mediated lipid transport |
| 0.2 | 6.4 | REACTOME CHONDROITIN SULFATE BIOSYNTHESIS | Genes involved in Chondroitin sulfate biosynthesis |
| 0.2 | 0.2 | REACTOME TRANSPORT OF MATURE MRNA DERIVED FROM AN INTRONLESS TRANSCRIPT | Genes involved in Transport of Mature mRNA Derived from an Intronless Transcript |
| 0.2 | 2.8 | REACTOME ROLE OF DCC IN REGULATING APOPTOSIS | Genes involved in Role of DCC in regulating apoptosis |
| 0.2 | 3.0 | REACTOME CHYLOMICRON MEDIATED LIPID TRANSPORT | Genes involved in Chylomicron-mediated lipid transport |
| 0.2 | 0.8 | REACTOME CROSS PRESENTATION OF SOLUBLE EXOGENOUS ANTIGENS ENDOSOMES | Genes involved in Cross-presentation of soluble exogenous antigens (endosomes) |
| 0.2 | 5.0 | REACTOME RECYCLING PATHWAY OF L1 | Genes involved in Recycling pathway of L1 |
| 0.2 | 4.0 | REACTOME APOPTOTIC CLEAVAGE OF CELL ADHESION PROTEINS | Genes involved in Apoptotic cleavage of cell adhesion proteins |
| 0.2 | 1.0 | REACTOME IL 6 SIGNALING | Genes involved in Interleukin-6 signaling |
| 0.1 | 2.6 | REACTOME P38MAPK EVENTS | Genes involved in p38MAPK events |
| 0.1 | 1.7 | REACTOME SEMA3A PLEXIN REPULSION SIGNALING BY INHIBITING INTEGRIN ADHESION | Genes involved in SEMA3A-Plexin repulsion signaling by inhibiting Integrin adhesion |
| 0.1 | 6.5 | REACTOME ABC FAMILY PROTEINS MEDIATED TRANSPORT | Genes involved in ABC-family proteins mediated transport |
| 0.1 | 0.5 | REACTOME FGFR4 LIGAND BINDING AND ACTIVATION | Genes involved in FGFR4 ligand binding and activation |
| 0.1 | 2.5 | REACTOME THE NLRP3 INFLAMMASOME | Genes involved in The NLRP3 inflammasome |
| 0.1 | 14.3 | REACTOME TRANS GOLGI NETWORK VESICLE BUDDING | Genes involved in trans-Golgi Network Vesicle Budding |
| 0.1 | 6.1 | REACTOME FORMATION OF FIBRIN CLOT CLOTTING CASCADE | Genes involved in Formation of Fibrin Clot (Clotting Cascade) |
| 0.1 | 10.1 | REACTOME APOPTOTIC CLEAVAGE OF CELLULAR PROTEINS | Genes involved in Apoptotic cleavage of cellular proteins |
| 0.1 | 0.9 | REACTOME PLATELET ADHESION TO EXPOSED COLLAGEN | Genes involved in Platelet Adhesion to exposed collagen |
| 0.1 | 8.7 | REACTOME O LINKED GLYCOSYLATION OF MUCINS | Genes involved in O-linked glycosylation of mucins |
| 0.1 | 0.5 | REACTOME NRIF SIGNALS CELL DEATH FROM THE NUCLEUS | Genes involved in NRIF signals cell death from the nucleus |
| 0.1 | 4.3 | REACTOME SYNTHESIS AND INTERCONVERSION OF NUCLEOTIDE DI AND TRIPHOSPHATES | Genes involved in Synthesis and interconversion of nucleotide di- and triphosphates |
| 0.1 | 3.2 | REACTOME INSULIN SYNTHESIS AND PROCESSING | Genes involved in Insulin Synthesis and Processing |
| 0.1 | 3.6 | REACTOME BRANCHED CHAIN AMINO ACID CATABOLISM | Genes involved in Branched-chain amino acid catabolism |
| 0.1 | 1.2 | REACTOME GAP JUNCTION DEGRADATION | Genes involved in Gap junction degradation |
| 0.1 | 1.1 | REACTOME GPVI MEDIATED ACTIVATION CASCADE | Genes involved in GPVI-mediated activation cascade |
| 0.1 | 2.1 | REACTOME SIGNALING BY HIPPO | Genes involved in Signaling by Hippo |
| 0.1 | 2.0 | REACTOME MITOCHONDRIAL FATTY ACID BETA OXIDATION | Genes involved in Mitochondrial Fatty Acid Beta-Oxidation |
| 0.1 | 0.8 | REACTOME PRE NOTCH PROCESSING IN GOLGI | Genes involved in Pre-NOTCH Processing in Golgi |
| 0.1 | 1.0 | REACTOME IL 7 SIGNALING | Genes involved in Interleukin-7 signaling |
| 0.1 | 1.9 | REACTOME ADVANCED GLYCOSYLATION ENDPRODUCT RECEPTOR SIGNALING | Genes involved in Advanced glycosylation endproduct receptor signaling |
| 0.1 | 2.4 | REACTOME REGULATION OF IFNA SIGNALING | Genes involved in Regulation of IFNA signaling |
| 0.1 | 0.1 | REACTOME P75NTR RECRUITS SIGNALLING COMPLEXES | Genes involved in p75NTR recruits signalling complexes |
| 0.1 | 0.4 | REACTOME REGULATION OF KIT SIGNALING | Genes involved in Regulation of KIT signaling |
| 0.1 | 0.2 | REACTOME ALPHA LINOLENIC ACID ALA METABOLISM | Genes involved in alpha-linolenic acid (ALA) metabolism |
| 0.1 | 1.9 | REACTOME EARLY PHASE OF HIV LIFE CYCLE | Genes involved in Early Phase of HIV Life Cycle |
| 0.1 | 1.2 | REACTOME YAP1 AND WWTR1 TAZ STIMULATED GENE EXPRESSION | Genes involved in YAP1- and WWTR1 (TAZ)-stimulated gene expression |
| 0.1 | 0.6 | REACTOME SIGNALLING TO P38 VIA RIT AND RIN | Genes involved in Signalling to p38 via RIT and RIN |
| 0.1 | 1.7 | REACTOME JNK C JUN KINASES PHOSPHORYLATION AND ACTIVATION MEDIATED BY ACTIVATED HUMAN TAK1 | Genes involved in JNK (c-Jun kinases) phosphorylation and activation mediated by activated human TAK1 |
| 0.1 | 1.2 | REACTOME REGULATION OF IFNG SIGNALING | Genes involved in Regulation of IFNG signaling |
| 0.1 | 1.0 | REACTOME TETRAHYDROBIOPTERIN BH4 SYNTHESIS RECYCLING SALVAGE AND REGULATION | Genes involved in Tetrahydrobiopterin (BH4) synthesis, recycling, salvage and regulation |
| 0.1 | 1.9 | REACTOME GAP JUNCTION TRAFFICKING | Genes involved in Gap junction trafficking |
| 0.1 | 3.8 | REACTOME PROSTACYCLIN SIGNALLING THROUGH PROSTACYCLIN RECEPTOR | Genes involved in Prostacyclin signalling through prostacyclin receptor |
| 0.1 | 1.9 | REACTOME DESTABILIZATION OF MRNA BY TRISTETRAPROLIN TTP | Genes involved in Destabilization of mRNA by Tristetraprolin (TTP) |
| 0.1 | 6.8 | REACTOME CELL DEATH SIGNALLING VIA NRAGE NRIF AND NADE | Genes involved in Cell death signalling via NRAGE, NRIF and NADE |
| 0.1 | 1.3 | REACTOME TIE2 SIGNALING | Genes involved in Tie2 Signaling |
| 0.1 | 2.1 | REACTOME SYNTHESIS OF GLYCOSYLPHOSPHATIDYLINOSITOL GPI | Genes involved in Synthesis of glycosylphosphatidylinositol (GPI) |
| 0.1 | 0.8 | REACTOME SIGNALING BY CONSTITUTIVELY ACTIVE EGFR | Genes involved in Signaling by constitutively active EGFR |
| 0.1 | 1.1 | REACTOME TRAFFICKING AND PROCESSING OF ENDOSOMAL TLR | Genes involved in Trafficking and processing of endosomal TLR |
| 0.1 | 1.5 | REACTOME SIGNALING BY FGFR1 MUTANTS | Genes involved in Signaling by FGFR1 mutants |
| 0.1 | 1.6 | REACTOME GLUCAGON TYPE LIGAND RECEPTORS | Genes involved in Glucagon-type ligand receptors |
| 0.1 | 0.3 | REACTOME ACTIVATED TAK1 MEDIATES P38 MAPK ACTIVATION | Genes involved in activated TAK1 mediates p38 MAPK activation |
| 0.1 | 1.2 | REACTOME UNWINDING OF DNA | Genes involved in Unwinding of DNA |
| 0.1 | 1.1 | REACTOME TGF BETA RECEPTOR SIGNALING IN EMT EPITHELIAL TO MESENCHYMAL TRANSITION | Genes involved in TGF-beta receptor signaling in EMT (epithelial to mesenchymal transition) |
| 0.1 | 3.4 | REACTOME TRANSPORT TO THE GOLGI AND SUBSEQUENT MODIFICATION | Genes involved in Transport to the Golgi and subsequent modification |
| 0.1 | 9.1 | REACTOME FACTORS INVOLVED IN MEGAKARYOCYTE DEVELOPMENT AND PLATELET PRODUCTION | Genes involved in Factors involved in megakaryocyte development and platelet production |
| 0.1 | 0.3 | REACTOME THROMBOXANE SIGNALLING THROUGH TP RECEPTOR | Genes involved in Thromboxane signalling through TP receptor |
| 0.1 | 0.8 | REACTOME NOD1 2 SIGNALING PATHWAY | Genes involved in NOD1/2 Signaling Pathway |
| 0.1 | 1.1 | REACTOME KERATAN SULFATE KERATIN METABOLISM | Genes involved in Keratan sulfate/keratin metabolism |
| 0.1 | 1.2 | REACTOME MTORC1 MEDIATED SIGNALLING | Genes involved in mTORC1-mediated signalling |
| 0.1 | 0.5 | REACTOME REGULATION OF MRNA STABILITY BY PROTEINS THAT BIND AU RICH ELEMENTS | Genes involved in Regulation of mRNA Stability by Proteins that Bind AU-rich Elements |
| 0.1 | 0.2 | REACTOME CYCLIN E ASSOCIATED EVENTS DURING G1 S TRANSITION | Genes involved in Cyclin E associated events during G1/S transition |
| 0.1 | 0.5 | REACTOME SIGNALLING BY NGF | Genes involved in Signalling by NGF |
| 0.1 | 1.1 | REACTOME BASE FREE SUGAR PHOSPHATE REMOVAL VIA THE SINGLE NUCLEOTIDE REPLACEMENT PATHWAY | Genes involved in Base-free sugar-phosphate removal via the single-nucleotide replacement pathway |
| 0.1 | 1.2 | REACTOME SYNTHESIS OF PC | Genes involved in Synthesis of PC |
| 0.1 | 0.2 | REACTOME BOTULINUM NEUROTOXICITY | Genes involved in Botulinum neurotoxicity |
| 0.1 | 1.0 | REACTOME GENERATION OF SECOND MESSENGER MOLECULES | Genes involved in Generation of second messenger molecules |
| 0.1 | 0.8 | REACTOME ACTIVATION OF CHAPERONES BY ATF6 ALPHA | Genes involved in Activation of Chaperones by ATF6-alpha |
| 0.0 | 1.3 | REACTOME PYRIMIDINE METABOLISM | Genes involved in Pyrimidine metabolism |
| 0.0 | 0.2 | REACTOME APC C CDH1 MEDIATED DEGRADATION OF CDC20 AND OTHER APC C CDH1 TARGETED PROTEINS IN LATE MITOSIS EARLY G1 | Genes involved in APC/C:Cdh1 mediated degradation of Cdc20 and other APC/C:Cdh1 targeted proteins in late mitosis/early G1 |
| 0.0 | 0.4 | REACTOME PROSTANOID LIGAND RECEPTORS | Genes involved in Prostanoid ligand receptors |
| 0.0 | 0.4 | REACTOME CTLA4 INHIBITORY SIGNALING | Genes involved in CTLA4 inhibitory signaling |
| 0.0 | 0.3 | REACTOME GRB2 SOS PROVIDES LINKAGE TO MAPK SIGNALING FOR INTERGRINS | Genes involved in GRB2:SOS provides linkage to MAPK signaling for Intergrins |
| 0.0 | 0.5 | REACTOME SYNTHESIS OF BILE ACIDS AND BILE SALTS VIA 7ALPHA HYDROXYCHOLESTEROL | Genes involved in Synthesis of bile acids and bile salts via 7alpha-hydroxycholesterol |
| 0.0 | 1.0 | REACTOME ABORTIVE ELONGATION OF HIV1 TRANSCRIPT IN THE ABSENCE OF TAT | Genes involved in Abortive elongation of HIV-1 transcript in the absence of Tat |
| 0.0 | 1.0 | REACTOME INHIBITION OF VOLTAGE GATED CA2 CHANNELS VIA GBETA GAMMA SUBUNITS | Genes involved in Inhibition of voltage gated Ca2+ channels via Gbeta/gamma subunits |
| 0.0 | 0.3 | REACTOME GAMMA CARBOXYLATION TRANSPORT AND AMINO TERMINAL CLEAVAGE OF PROTEINS | Genes involved in Gamma-carboxylation, transport, and amino-terminal cleavage of proteins |
| 0.0 | 2.4 | REACTOME TRAFFICKING OF AMPA RECEPTORS | Genes involved in Trafficking of AMPA receptors |
| 0.0 | 0.0 | REACTOME ACETYLCHOLINE NEUROTRANSMITTER RELEASE CYCLE | Genes involved in Acetylcholine Neurotransmitter Release Cycle |
| 0.0 | 0.7 | REACTOME RECRUITMENT OF NUMA TO MITOTIC CENTROSOMES | Genes involved in Recruitment of NuMA to mitotic centrosomes |
| 0.0 | 0.9 | REACTOME REGULATION OF COMPLEMENT CASCADE | Genes involved in Regulation of Complement cascade |
| 0.0 | 0.3 | REACTOME REGULATION OF THE FANCONI ANEMIA PATHWAY | Genes involved in Regulation of the Fanconi anemia pathway |
| 0.0 | 1.6 | REACTOME INTERACTIONS OF VPR WITH HOST CELLULAR PROTEINS | Genes involved in Interactions of Vpr with host cellular proteins |
| 0.0 | 0.8 | REACTOME PRESYNAPTIC NICOTINIC ACETYLCHOLINE RECEPTORS | Genes involved in Presynaptic nicotinic acetylcholine receptors |
| 0.0 | 0.2 | REACTOME RETROGRADE NEUROTROPHIN SIGNALLING | Genes involved in Retrograde neurotrophin signalling |
| 0.0 | 0.3 | REACTOME SEMA3A PAK DEPENDENT AXON REPULSION | Genes involved in Sema3A PAK dependent Axon repulsion |
| 0.0 | 3.0 | REACTOME PHASE1 FUNCTIONALIZATION OF COMPOUNDS | Genes involved in Phase 1 - Functionalization of compounds |
| 0.0 | 1.4 | REACTOME SEMA4D IN SEMAPHORIN SIGNALING | Genes involved in Sema4D in semaphorin signaling |
| 0.0 | 0.4 | REACTOME CALNEXIN CALRETICULIN CYCLE | Genes involved in Calnexin/calreticulin cycle |
| 0.0 | 0.6 | REACTOME SIGNAL TRANSDUCTION BY L1 | Genes involved in Signal transduction by L1 |
| 0.0 | 1.3 | REACTOME SPHINGOLIPID DE NOVO BIOSYNTHESIS | Genes involved in Sphingolipid de novo biosynthesis |
| 0.0 | 2.1 | REACTOME ION TRANSPORT BY P TYPE ATPASES | Genes involved in Ion transport by P-type ATPases |
| 0.0 | 1.1 | REACTOME DEGRADATION OF THE EXTRACELLULAR MATRIX | Genes involved in Degradation of the extracellular matrix |
| 0.0 | 0.4 | REACTOME ENOS ACTIVATION AND REGULATION | Genes involved in eNOS activation and regulation |
| 0.0 | 1.4 | REACTOME GLUTATHIONE CONJUGATION | Genes involved in Glutathione conjugation |
| 0.0 | 0.5 | REACTOME REVERSIBLE HYDRATION OF CARBON DIOXIDE | Genes involved in Reversible Hydration of Carbon Dioxide |
| 0.0 | 1.6 | REACTOME MEIOTIC SYNAPSIS | Genes involved in Meiotic Synapsis |
| 0.0 | 3.0 | REACTOME IMMUNOREGULATORY INTERACTIONS BETWEEN A LYMPHOID AND A NON LYMPHOID CELL | Genes involved in Immunoregulatory interactions between a Lymphoid and a non-Lymphoid cell |
| 0.0 | 1.7 | REACTOME ACTIVATION OF CHAPERONE GENES BY XBP1S | Genes involved in Activation of Chaperone Genes by XBP1(S) |
| 0.0 | 1.8 | REACTOME PYRUVATE METABOLISM AND CITRIC ACID TCA CYCLE | Genes involved in Pyruvate metabolism and Citric Acid (TCA) cycle |
| 0.0 | 2.2 | REACTOME LOSS OF NLP FROM MITOTIC CENTROSOMES | Genes involved in Loss of Nlp from mitotic centrosomes |
| 0.0 | 1.4 | REACTOME IRON UPTAKE AND TRANSPORT | Genes involved in Iron uptake and transport |
| 0.0 | 0.2 | REACTOME G PROTEIN ACTIVATION | Genes involved in G-protein activation |
| 0.0 | 0.7 | REACTOME MRNA SPLICING MINOR PATHWAY | Genes involved in mRNA Splicing - Minor Pathway |
| 0.0 | 0.4 | REACTOME NEPHRIN INTERACTIONS | Genes involved in Nephrin interactions |
| 0.0 | 0.5 | REACTOME OTHER SEMAPHORIN INTERACTIONS | Genes involved in Other semaphorin interactions |
| 0.0 | 0.8 | REACTOME PI3K AKT ACTIVATION | Genes involved in PI3K/AKT activation |
| 0.0 | 0.1 | REACTOME TRAF6 MEDIATED IRF7 ACTIVATION | Genes involved in TRAF6 mediated IRF7 activation |
| 0.0 | 0.3 | REACTOME PEPTIDE HORMONE BIOSYNTHESIS | Genes involved in Peptide hormone biosynthesis |
| 0.0 | 0.1 | REACTOME ELONGATION ARREST AND RECOVERY | Genes involved in Elongation arrest and recovery |
| 0.0 | 0.4 | REACTOME TRAF6 MEDIATED NFKB ACTIVATION | Genes involved in TRAF6 mediated NF-kB activation |
| 0.0 | 0.3 | REACTOME DOWNREGULATION OF TGF BETA RECEPTOR SIGNALING | Genes involved in Downregulation of TGF-beta receptor signaling |
| 0.0 | 0.6 | REACTOME COSTIMULATION BY THE CD28 FAMILY | Genes involved in Costimulation by the CD28 family |
| 0.0 | 2.2 | REACTOME TRANSCRIPTIONAL REGULATION OF WHITE ADIPOCYTE DIFFERENTIATION | Genes involved in Transcriptional Regulation of White Adipocyte Differentiation |
| 0.0 | 0.1 | REACTOME REGULATION OF GLUCOKINASE BY GLUCOKINASE REGULATORY PROTEIN | Genes involved in Regulation of Glucokinase by Glucokinase Regulatory Protein |
| 0.0 | 1.6 | REACTOME RESPIRATORY ELECTRON TRANSPORT | Genes involved in Respiratory electron transport |
| 0.0 | 0.4 | REACTOME GLYCOGEN BREAKDOWN GLYCOGENOLYSIS | Genes involved in Glycogen breakdown (glycogenolysis) |
| 0.0 | 0.1 | REACTOME IRAK1 RECRUITS IKK COMPLEX | Genes involved in IRAK1 recruits IKK complex |
| 0.0 | 0.3 | REACTOME VITAMIN B5 PANTOTHENATE METABOLISM | Genes involved in Vitamin B5 (pantothenate) metabolism |
| 0.0 | 3.7 | REACTOME TRANSLATION | Genes involved in Translation |
| 0.0 | 0.1 | REACTOME INHIBITION OF REPLICATION INITIATION OF DAMAGED DNA BY RB1 E2F1 | Genes involved in Inhibition of replication initiation of damaged DNA by RB1/E2F1 |
| 0.0 | 0.1 | REACTOME ACETYLCHOLINE BINDING AND DOWNSTREAM EVENTS | Genes involved in Acetylcholine Binding And Downstream Events |
| 0.0 | 0.1 | REACTOME POST TRANSLATIONAL MODIFICATION SYNTHESIS OF GPI ANCHORED PROTEINS | Genes involved in Post-translational modification: synthesis of GPI-anchored proteins |
| 0.0 | 0.5 | REACTOME MRNA 3 END PROCESSING | Genes involved in mRNA 3'-end processing |
| 0.0 | 0.7 | REACTOME BIOLOGICAL OXIDATIONS | Genes involved in Biological oxidations |
| 0.0 | 0.3 | REACTOME ZINC TRANSPORTERS | Genes involved in Zinc transporters |
| 0.0 | 0.7 | REACTOME CHEMOKINE RECEPTORS BIND CHEMOKINES | Genes involved in Chemokine receptors bind chemokines |
| 0.0 | 0.1 | REACTOME SIGNAL REGULATORY PROTEIN SIRP FAMILY INTERACTIONS | Genes involved in Signal regulatory protein (SIRP) family interactions |
| 0.0 | 0.0 | REACTOME ACYL CHAIN REMODELLING OF PE | Genes involved in Acyl chain remodelling of PE |