Project
Inflammatory response time course, HUVEC (Wada, 2009)
Navigation
Downloads
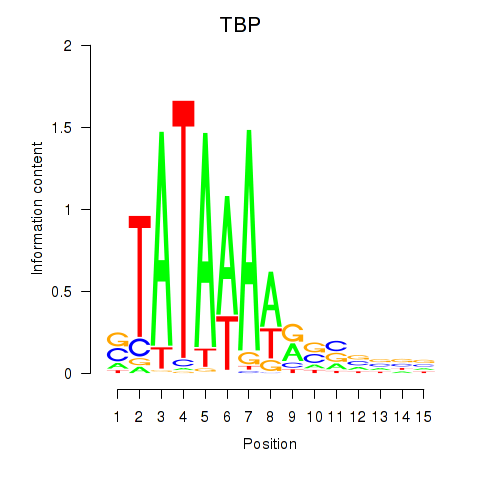
Results for TBP
Z-value: 2.09
Motif logo
Transcription factors associated with TBP
| Gene Symbol | Gene ID | Gene Info |
|---|---|---|
|
TBP
|
ENSG00000112592.14 | TBP |
Activity-expression correlation:
| Gene | Promoter | Pearson corr. coef. | P-value | Plot |
|---|---|---|---|---|
| TBP | hg38_v1_chr6_+_170554333_170554396 | -0.23 | 2.8e-01 | Click! |
Activity profile of TBP motif
Sorted Z-values of TBP motif
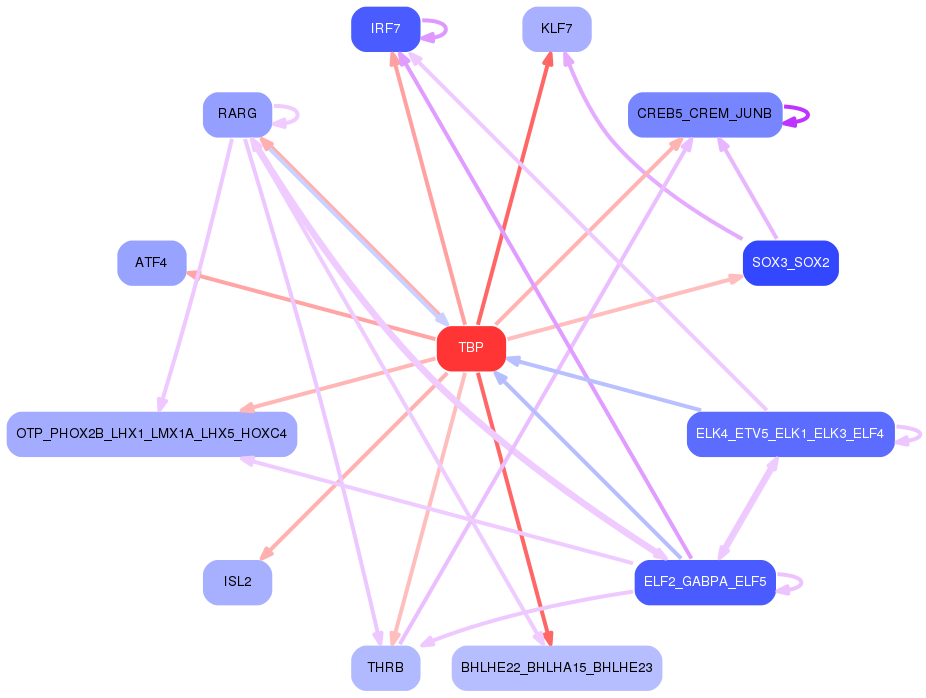
Network of associatons between targets according to the STRING database.

First level regulatory network of TBP
Gene Ontology Analysis
Gene overrepresentation in biological process category:
| Log-likelihood per target | Total log-likelihood | Term | Description |
|---|---|---|---|
| 11.6 | 34.7 | GO:0051040 | regulation of calcium-independent cell-cell adhesion(GO:0051040) |
| 3.7 | 18.5 | GO:0097368 | establishment of Sertoli cell barrier(GO:0097368) |
| 3.6 | 14.6 | GO:0002541 | activation of plasma proteins involved in acute inflammatory response(GO:0002541) |
| 1.1 | 3.3 | GO:0061182 | negative regulation of chondrocyte development(GO:0061182) |
| 1.1 | 1.1 | GO:2000405 | negative regulation of T cell migration(GO:2000405) |
| 1.1 | 38.3 | GO:0090023 | positive regulation of neutrophil chemotaxis(GO:0090023) |
| 1.1 | 3.2 | GO:0071676 | negative regulation of mononuclear cell migration(GO:0071676) |
| 1.1 | 2.1 | GO:2000562 | negative regulation of CD4-positive, alpha-beta T cell proliferation(GO:2000562) |
| 1.1 | 24.3 | GO:0002523 | leukocyte migration involved in inflammatory response(GO:0002523) |
| 1.0 | 3.1 | GO:0060722 | spongiotrophoblast cell proliferation(GO:0060720) regulation of spongiotrophoblast cell proliferation(GO:0060721) cell proliferation involved in embryonic placenta development(GO:0060722) regulation of cell proliferation involved in embryonic placenta development(GO:0060723) |
| 1.0 | 7.2 | GO:2000110 | negative regulation of macrophage apoptotic process(GO:2000110) |
| 1.0 | 4.0 | GO:0051795 | positive regulation of catagen(GO:0051795) |
| 1.0 | 2.9 | GO:0035498 | carnosine metabolic process(GO:0035498) |
| 1.0 | 5.7 | GO:0060356 | leucine import(GO:0060356) |
| 0.9 | 7.4 | GO:0014916 | tetrahydrobiopterin biosynthetic process(GO:0006729) regulation of lung blood pressure(GO:0014916) tetrahydrobiopterin metabolic process(GO:0046146) |
| 0.9 | 2.6 | GO:0051097 | negative regulation of helicase activity(GO:0051097) |
| 0.8 | 3.3 | GO:0045065 | cytotoxic T cell differentiation(GO:0045065) |
| 0.8 | 8.1 | GO:0043950 | positive regulation of cAMP-mediated signaling(GO:0043950) |
| 0.8 | 2.4 | GO:1902310 | positive regulation of peptidyl-serine dephosphorylation(GO:1902310) |
| 0.8 | 21.0 | GO:0071294 | cellular response to zinc ion(GO:0071294) |
| 0.8 | 11.3 | GO:0035457 | cellular response to interferon-alpha(GO:0035457) |
| 0.7 | 2.1 | GO:1902269 | positive regulation of polyamine transmembrane transport(GO:1902269) |
| 0.6 | 1.9 | GO:0061394 | regulation of transcription from RNA polymerase II promoter in response to arsenic-containing substance(GO:0061394) |
| 0.6 | 3.1 | GO:0035962 | response to interleukin-13(GO:0035962) |
| 0.6 | 2.2 | GO:0003430 | growth plate cartilage chondrocyte growth(GO:0003430) |
| 0.6 | 3.9 | GO:2000860 | positive regulation of mineralocorticoid secretion(GO:2000857) positive regulation of aldosterone secretion(GO:2000860) |
| 0.5 | 1.6 | GO:1903281 | regulation of the force of heart contraction by cardiac conduction(GO:0086092) positive regulation of calcium:sodium antiporter activity(GO:1903281) |
| 0.5 | 4.4 | GO:2001137 | positive regulation of endocytic recycling(GO:2001137) |
| 0.5 | 2.1 | GO:1990868 | response to chemokine(GO:1990868) cellular response to chemokine(GO:1990869) |
| 0.5 | 1.4 | GO:0009106 | lipoate metabolic process(GO:0009106) |
| 0.5 | 1.4 | GO:0000103 | sulfate assimilation(GO:0000103) |
| 0.5 | 2.3 | GO:0035106 | operant conditioning(GO:0035106) |
| 0.5 | 1.4 | GO:0021524 | visceral motor neuron differentiation(GO:0021524) |
| 0.5 | 1.4 | GO:0006566 | threonine metabolic process(GO:0006566) |
| 0.4 | 1.3 | GO:1900154 | regulation of bone trabecula formation(GO:1900154) negative regulation of bone trabecula formation(GO:1900155) |
| 0.4 | 1.7 | GO:0018199 | peptidyl-glutamine modification(GO:0018199) |
| 0.4 | 3.5 | GO:0070294 | renal sodium ion absorption(GO:0070294) |
| 0.4 | 5.2 | GO:0046689 | response to mercury ion(GO:0046689) |
| 0.4 | 1.8 | GO:0090131 | mesenchyme migration(GO:0090131) |
| 0.4 | 0.7 | GO:0070093 | negative regulation of glucagon secretion(GO:0070093) |
| 0.4 | 1.1 | GO:1903937 | response to acrylamide(GO:1903937) |
| 0.4 | 1.1 | GO:0002728 | negative regulation of natural killer cell cytokine production(GO:0002728) |
| 0.4 | 11.2 | GO:0003351 | epithelial cilium movement(GO:0003351) |
| 0.3 | 1.4 | GO:0098923 | retrograde trans-synaptic signaling by soluble gas(GO:0098923) trans-synaptic signaling by soluble gas(GO:0099543) |
| 0.3 | 1.7 | GO:0021888 | hypothalamus gonadotrophin-releasing hormone neuron differentiation(GO:0021886) hypothalamus gonadotrophin-releasing hormone neuron development(GO:0021888) |
| 0.3 | 0.7 | GO:0032277 | negative regulation of gonadotropin secretion(GO:0032277) |
| 0.3 | 1.3 | GO:0006556 | S-adenosylmethionine biosynthetic process(GO:0006556) |
| 0.3 | 2.6 | GO:0042483 | negative regulation of odontogenesis(GO:0042483) |
| 0.3 | 1.0 | GO:0001207 | histone displacement(GO:0001207) positive regulation of transcription involved in meiotic cell cycle(GO:0051039) |
| 0.3 | 1.6 | GO:0035948 | positive regulation of gluconeogenesis by positive regulation of transcription from RNA polymerase II promoter(GO:0035948) |
| 0.3 | 1.9 | GO:1900383 | regulation of synaptic plasticity by receptor localization to synapse(GO:1900383) |
| 0.3 | 0.6 | GO:0014806 | smooth muscle hyperplasia(GO:0014806) |
| 0.3 | 3.7 | GO:0018401 | peptidyl-proline hydroxylation to 4-hydroxy-L-proline(GO:0018401) |
| 0.3 | 0.9 | GO:0061026 | cardiac muscle tissue regeneration(GO:0061026) |
| 0.3 | 0.6 | GO:2000510 | positive regulation of dendritic cell chemotaxis(GO:2000510) |
| 0.3 | 9.4 | GO:0030728 | ovulation(GO:0030728) |
| 0.3 | 3.6 | GO:1902669 | positive regulation of axon guidance(GO:1902669) |
| 0.3 | 0.8 | GO:0006579 | amino-acid betaine catabolic process(GO:0006579) |
| 0.3 | 1.3 | GO:0035359 | negative regulation of peroxisome proliferator activated receptor signaling pathway(GO:0035359) |
| 0.2 | 1.0 | GO:0006542 | glutamine biosynthetic process(GO:0006542) |
| 0.2 | 0.5 | GO:0042270 | protection from natural killer cell mediated cytotoxicity(GO:0042270) |
| 0.2 | 1.2 | GO:0007056 | spindle assembly involved in female meiosis(GO:0007056) |
| 0.2 | 1.0 | GO:1990167 | protein K27-linked deubiquitination(GO:1990167) protein K33-linked deubiquitination(GO:1990168) |
| 0.2 | 0.7 | GO:1901492 | positive regulation of lymphangiogenesis(GO:1901492) |
| 0.2 | 0.7 | GO:0060127 | subthalamic nucleus development(GO:0021763) prolactin secreting cell differentiation(GO:0060127) pulmonary vein morphogenesis(GO:0060577) superior vena cava morphogenesis(GO:0060578) |
| 0.2 | 1.6 | GO:0016098 | monoterpenoid metabolic process(GO:0016098) |
| 0.2 | 1.1 | GO:1900738 | positive regulation of phospholipase C-activating G-protein coupled receptor signaling pathway(GO:1900738) |
| 0.2 | 1.3 | GO:0060298 | positive regulation of sarcomere organization(GO:0060298) |
| 0.2 | 1.9 | GO:1904798 | positive regulation of core promoter binding(GO:1904798) |
| 0.2 | 0.6 | GO:0021530 | spinal cord oligodendrocyte cell differentiation(GO:0021529) spinal cord oligodendrocyte cell fate specification(GO:0021530) |
| 0.2 | 0.6 | GO:0098507 | polynucleotide 5' dephosphorylation(GO:0098507) |
| 0.2 | 0.6 | GO:0015670 | carbon dioxide transport(GO:0015670) |
| 0.2 | 1.2 | GO:0045410 | positive regulation of interleukin-6 biosynthetic process(GO:0045410) |
| 0.2 | 0.6 | GO:0006059 | hexitol metabolic process(GO:0006059) |
| 0.2 | 0.6 | GO:0001978 | regulation of systemic arterial blood pressure by carotid sinus baroreceptor feedback(GO:0001978) baroreceptor response to increased systemic arterial blood pressure(GO:0001983) |
| 0.2 | 2.1 | GO:0035585 | calcium-mediated signaling using extracellular calcium source(GO:0035585) |
| 0.2 | 0.5 | GO:0003218 | cardiac left ventricle formation(GO:0003218) |
| 0.2 | 1.2 | GO:0006931 | substrate-dependent cell migration, cell attachment to substrate(GO:0006931) |
| 0.2 | 0.5 | GO:0060300 | regulation of cytokine activity(GO:0060300) |
| 0.2 | 1.2 | GO:0008050 | female courtship behavior(GO:0008050) |
| 0.2 | 0.7 | GO:0051801 | cytolysis by symbiont of host cells(GO:0001897) regulation of cytolysis in other organism(GO:0051710) cytolysis in other organism involved in symbiotic interaction(GO:0051801) |
| 0.2 | 11.1 | GO:0048791 | calcium ion-regulated exocytosis of neurotransmitter(GO:0048791) |
| 0.2 | 0.8 | GO:0002933 | lipid hydroxylation(GO:0002933) |
| 0.2 | 1.2 | GO:0086073 | bundle of His cell-Purkinje myocyte adhesion involved in cell communication(GO:0086073) |
| 0.2 | 1.2 | GO:0006880 | intracellular sequestering of iron ion(GO:0006880) sequestering of iron ion(GO:0097577) |
| 0.2 | 0.9 | GO:0009438 | methylglyoxal metabolic process(GO:0009438) |
| 0.1 | 2.4 | GO:1903764 | regulation of potassium ion export across plasma membrane(GO:1903764) |
| 0.1 | 1.2 | GO:0070995 | NADPH oxidation(GO:0070995) |
| 0.1 | 0.6 | GO:2000077 | negative regulation of dopaminergic neuron differentiation(GO:1904339) negative regulation of type B pancreatic cell development(GO:2000077) |
| 0.1 | 0.7 | GO:0043126 | regulation of 1-phosphatidylinositol 4-kinase activity(GO:0043126) positive regulation of 1-phosphatidylinositol 4-kinase activity(GO:0043128) |
| 0.1 | 1.0 | GO:0038031 | non-canonical Wnt signaling pathway via JNK cascade(GO:0038031) |
| 0.1 | 0.1 | GO:0060460 | left lung development(GO:0060459) left lung morphogenesis(GO:0060460) |
| 0.1 | 0.5 | GO:0006617 | SRP-dependent cotranslational protein targeting to membrane, signal sequence recognition(GO:0006617) |
| 0.1 | 0.5 | GO:2000503 | positive regulation of natural killer cell chemotaxis(GO:2000503) |
| 0.1 | 1.1 | GO:0090232 | positive regulation of spindle checkpoint(GO:0090232) |
| 0.1 | 1.5 | GO:2001288 | positive regulation of caveolin-mediated endocytosis(GO:2001288) |
| 0.1 | 0.9 | GO:2000645 | negative regulation of receptor catabolic process(GO:2000645) |
| 0.1 | 0.6 | GO:0000270 | peptidoglycan metabolic process(GO:0000270) peptidoglycan catabolic process(GO:0009253) |
| 0.1 | 0.1 | GO:0070295 | renal water absorption(GO:0070295) |
| 0.1 | 0.5 | GO:0060437 | lung growth(GO:0060437) |
| 0.1 | 0.9 | GO:0035931 | mineralocorticoid secretion(GO:0035931) aldosterone secretion(GO:0035932) regulation of mineralocorticoid secretion(GO:2000855) regulation of aldosterone secretion(GO:2000858) |
| 0.1 | 0.2 | GO:1990535 | neuron projection maintenance(GO:1990535) |
| 0.1 | 0.9 | GO:0048251 | elastic fiber assembly(GO:0048251) |
| 0.1 | 2.9 | GO:0030199 | collagen fibril organization(GO:0030199) |
| 0.1 | 1.8 | GO:0046784 | viral mRNA export from host cell nucleus(GO:0046784) |
| 0.1 | 10.9 | GO:0030574 | collagen catabolic process(GO:0030574) |
| 0.1 | 1.7 | GO:0001867 | complement activation, lectin pathway(GO:0001867) |
| 0.1 | 2.2 | GO:0090084 | negative regulation of inclusion body assembly(GO:0090084) |
| 0.1 | 4.0 | GO:1903206 | negative regulation of hydrogen peroxide-induced cell death(GO:1903206) |
| 0.1 | 0.3 | GO:0021526 | medial motor column neuron differentiation(GO:0021526) |
| 0.1 | 5.0 | GO:0070884 | regulation of calcineurin-NFAT signaling cascade(GO:0070884) |
| 0.1 | 0.7 | GO:0008295 | spermidine biosynthetic process(GO:0008295) |
| 0.1 | 2.9 | GO:0031581 | hemidesmosome assembly(GO:0031581) |
| 0.1 | 0.6 | GO:1900133 | regulation of renin secretion into blood stream(GO:1900133) |
| 0.1 | 1.7 | GO:0061635 | regulation of protein complex stability(GO:0061635) |
| 0.1 | 2.0 | GO:0035589 | G-protein coupled purinergic nucleotide receptor signaling pathway(GO:0035589) |
| 0.1 | 0.3 | GO:0035606 | peptidyl-cysteine S-trans-nitrosylation(GO:0035606) |
| 0.1 | 3.5 | GO:0008045 | motor neuron axon guidance(GO:0008045) |
| 0.1 | 1.9 | GO:0061365 | positive regulation of triglyceride lipase activity(GO:0061365) |
| 0.1 | 2.5 | GO:0008211 | glucocorticoid metabolic process(GO:0008211) |
| 0.1 | 0.4 | GO:1904222 | regulation of CDP-diacylglycerol-serine O-phosphatidyltransferase activity(GO:1904217) positive regulation of CDP-diacylglycerol-serine O-phosphatidyltransferase activity(GO:1904219) positive regulation of serine C-palmitoyltransferase activity(GO:1904222) |
| 0.1 | 1.6 | GO:0045109 | intermediate filament organization(GO:0045109) |
| 0.1 | 1.9 | GO:0007250 | activation of NF-kappaB-inducing kinase activity(GO:0007250) |
| 0.1 | 1.3 | GO:0010667 | negative regulation of cardiac muscle cell apoptotic process(GO:0010667) |
| 0.1 | 1.6 | GO:0018298 | protein-chromophore linkage(GO:0018298) |
| 0.1 | 0.3 | GO:0036414 | protein citrullination(GO:0018101) histone citrullination(GO:0036414) |
| 0.1 | 0.1 | GO:0030185 | nitric oxide transport(GO:0030185) |
| 0.1 | 0.5 | GO:0016045 | detection of bacterium(GO:0016045) |
| 0.1 | 0.3 | GO:0032747 | positive regulation of interleukin-23 production(GO:0032747) |
| 0.1 | 0.8 | GO:0046125 | thymidine metabolic process(GO:0046104) pyrimidine deoxyribonucleoside metabolic process(GO:0046125) |
| 0.1 | 0.4 | GO:0032929 | negative regulation of superoxide anion generation(GO:0032929) |
| 0.1 | 0.9 | GO:0042048 | olfactory behavior(GO:0042048) |
| 0.1 | 0.9 | GO:0031284 | positive regulation of guanylate cyclase activity(GO:0031284) |
| 0.1 | 1.2 | GO:0006776 | vitamin A metabolic process(GO:0006776) |
| 0.1 | 1.7 | GO:0006346 | methylation-dependent chromatin silencing(GO:0006346) |
| 0.1 | 0.4 | GO:0016554 | cytidine to uridine editing(GO:0016554) |
| 0.1 | 1.3 | GO:0034587 | piRNA metabolic process(GO:0034587) |
| 0.1 | 0.5 | GO:0060699 | regulation of endoribonuclease activity(GO:0060699) |
| 0.1 | 0.7 | GO:1903003 | positive regulation of protein deubiquitination(GO:1903003) |
| 0.1 | 2.8 | GO:0048247 | lymphocyte chemotaxis(GO:0048247) |
| 0.1 | 0.3 | GO:0038169 | somatostatin receptor signaling pathway(GO:0038169) somatostatin signaling pathway(GO:0038170) |
| 0.1 | 0.9 | GO:0003334 | keratinocyte development(GO:0003334) |
| 0.1 | 1.7 | GO:0061436 | establishment of skin barrier(GO:0061436) |
| 0.1 | 0.2 | GO:0070837 | dehydroascorbic acid transport(GO:0070837) |
| 0.1 | 0.4 | GO:0035879 | plasma membrane lactate transport(GO:0035879) |
| 0.0 | 1.2 | GO:0071786 | endoplasmic reticulum tubular network organization(GO:0071786) |
| 0.0 | 2.9 | GO:0030212 | hyaluronan metabolic process(GO:0030212) |
| 0.0 | 0.3 | GO:0006001 | fructose catabolic process(GO:0006001) fructose catabolic process to hydroxyacetone phosphate and glyceraldehyde-3-phosphate(GO:0061624) |
| 0.0 | 0.5 | GO:2000400 | positive regulation of T cell differentiation in thymus(GO:0033089) positive regulation of thymocyte aggregation(GO:2000400) |
| 0.0 | 3.7 | GO:0010830 | regulation of myotube differentiation(GO:0010830) |
| 0.0 | 0.4 | GO:0061737 | leukotriene signaling pathway(GO:0061737) |
| 0.0 | 0.7 | GO:0061000 | negative regulation of dendritic spine development(GO:0061000) |
| 0.0 | 0.5 | GO:0019441 | tryptophan catabolic process to kynurenine(GO:0019441) |
| 0.0 | 0.3 | GO:0006102 | isocitrate metabolic process(GO:0006102) response to isolation stress(GO:0035900) |
| 0.0 | 0.3 | GO:2000852 | regulation of corticosterone secretion(GO:2000852) |
| 0.0 | 0.4 | GO:0071421 | manganese ion transmembrane transport(GO:0071421) |
| 0.0 | 0.3 | GO:0055064 | chloride ion homeostasis(GO:0055064) |
| 0.0 | 1.5 | GO:0071108 | protein K48-linked deubiquitination(GO:0071108) |
| 0.0 | 0.5 | GO:0070857 | regulation of bile acid biosynthetic process(GO:0070857) |
| 0.0 | 0.2 | GO:1904179 | regulation of adipose tissue development(GO:1904177) positive regulation of adipose tissue development(GO:1904179) |
| 0.0 | 0.4 | GO:0035986 | senescence-associated heterochromatin focus assembly(GO:0035986) |
| 0.0 | 0.2 | GO:0002357 | defense response to tumor cell(GO:0002357) |
| 0.0 | 0.9 | GO:0070262 | peptidyl-serine dephosphorylation(GO:0070262) |
| 0.0 | 0.7 | GO:0035269 | protein O-linked mannosylation(GO:0035269) |
| 0.0 | 0.3 | GO:0045876 | positive regulation of sister chromatid cohesion(GO:0045876) |
| 0.0 | 0.7 | GO:0008228 | opsonization(GO:0008228) |
| 0.0 | 4.4 | GO:0051965 | positive regulation of synapse assembly(GO:0051965) |
| 0.0 | 2.4 | GO:0051489 | regulation of filopodium assembly(GO:0051489) |
| 0.0 | 2.5 | GO:0051865 | protein autoubiquitination(GO:0051865) |
| 0.0 | 0.4 | GO:0051005 | negative regulation of lipoprotein lipase activity(GO:0051005) |
| 0.0 | 0.7 | GO:0007076 | mitotic chromosome condensation(GO:0007076) |
| 0.0 | 2.5 | GO:0042246 | tissue regeneration(GO:0042246) |
| 0.0 | 0.1 | GO:0010536 | positive regulation of activation of Janus kinase activity(GO:0010536) |
| 0.0 | 0.4 | GO:0045950 | negative regulation of mitotic recombination(GO:0045950) |
| 0.0 | 0.9 | GO:0071420 | cellular response to histamine(GO:0071420) |
| 0.0 | 3.8 | GO:0010923 | negative regulation of phosphatase activity(GO:0010923) |
| 0.0 | 0.3 | GO:0000395 | mRNA 5'-splice site recognition(GO:0000395) |
| 0.0 | 0.8 | GO:0006123 | mitochondrial electron transport, cytochrome c to oxygen(GO:0006123) |
| 0.0 | 0.7 | GO:0015669 | gas transport(GO:0015669) |
| 0.0 | 0.4 | GO:0098870 | neuronal action potential propagation(GO:0019227) action potential propagation(GO:0098870) |
| 0.0 | 0.3 | GO:0050957 | equilibrioception(GO:0050957) |
| 0.0 | 1.7 | GO:0050918 | positive chemotaxis(GO:0050918) |
| 0.0 | 0.7 | GO:0021854 | hypothalamus development(GO:0021854) |
| 0.0 | 0.5 | GO:0006883 | cellular sodium ion homeostasis(GO:0006883) |
| 0.0 | 0.3 | GO:0060992 | response to fungicide(GO:0060992) |
| 0.0 | 0.2 | GO:0032445 | fructose transport(GO:0015755) fructose import(GO:0032445) carbohydrate import into cell(GO:0097319) carbohydrate import across plasma membrane(GO:0098704) fructose import across plasma membrane(GO:1990539) |
| 0.0 | 1.7 | GO:2000273 | positive regulation of receptor activity(GO:2000273) |
| 0.0 | 0.1 | GO:0061073 | ciliary body morphogenesis(GO:0061073) |
| 0.0 | 0.5 | GO:0035414 | negative regulation of catenin import into nucleus(GO:0035414) |
| 0.0 | 3.2 | GO:0042303 | molting cycle(GO:0042303) hair cycle(GO:0042633) |
| 0.0 | 0.1 | GO:0046968 | peptide antigen transport(GO:0046968) |
| 0.0 | 0.3 | GO:0070327 | thyroid hormone transport(GO:0070327) |
| 0.0 | 0.2 | GO:0044341 | sodium-dependent phosphate transport(GO:0044341) |
| 0.0 | 0.7 | GO:0015721 | bile acid and bile salt transport(GO:0015721) |
| 0.0 | 0.8 | GO:0019433 | triglyceride catabolic process(GO:0019433) |
| 0.0 | 2.0 | GO:0009301 | snRNA transcription(GO:0009301) snRNA transcription from RNA polymerase II promoter(GO:0042795) |
| 0.0 | 0.2 | GO:0006537 | glutamate biosynthetic process(GO:0006537) |
| 0.0 | 0.7 | GO:0009435 | NAD biosynthetic process(GO:0009435) |
| 0.0 | 0.5 | GO:0089711 | L-glutamate transmembrane transport(GO:0089711) |
| 0.0 | 0.3 | GO:0045324 | late endosome to vacuole transport(GO:0045324) |
| 0.0 | 0.3 | GO:0019373 | epoxygenase P450 pathway(GO:0019373) |
| 0.0 | 1.8 | GO:0006970 | response to osmotic stress(GO:0006970) |
| 0.0 | 0.3 | GO:0031629 | synaptic vesicle fusion to presynaptic active zone membrane(GO:0031629) vesicle fusion to plasma membrane(GO:0099500) |
| 0.0 | 0.1 | GO:0032971 | regulation of muscle filament sliding(GO:0032971) |
| 0.0 | 0.8 | GO:0014047 | glutamate secretion(GO:0014047) |
| 0.0 | 1.0 | GO:0006891 | intra-Golgi vesicle-mediated transport(GO:0006891) |
| 0.0 | 1.6 | GO:0031338 | regulation of vesicle fusion(GO:0031338) |
| 0.0 | 1.0 | GO:0051496 | positive regulation of stress fiber assembly(GO:0051496) |
| 0.0 | 0.9 | GO:0003009 | skeletal muscle contraction(GO:0003009) |
| 0.0 | 0.1 | GO:0060158 | phospholipase C-activating dopamine receptor signaling pathway(GO:0060158) |
| 0.0 | 0.3 | GO:0072678 | T cell migration(GO:0072678) |
| 0.0 | 1.0 | GO:0042267 | natural killer cell mediated cytotoxicity(GO:0042267) |
| 0.0 | 0.4 | GO:0000717 | nucleotide-excision repair, DNA duplex unwinding(GO:0000717) |
| 0.0 | 1.8 | GO:1900034 | regulation of cellular response to heat(GO:1900034) |
| 0.0 | 0.2 | GO:0039536 | negative regulation of RIG-I signaling pathway(GO:0039536) |
| 0.0 | 1.2 | GO:0006369 | termination of RNA polymerase II transcription(GO:0006369) |
| 0.0 | 2.1 | GO:0035335 | peptidyl-tyrosine dephosphorylation(GO:0035335) |
| 0.0 | 0.9 | GO:0000245 | spliceosomal complex assembly(GO:0000245) |
| 0.0 | 0.4 | GO:0034694 | response to prostaglandin(GO:0034694) |
| 0.0 | 1.2 | GO:0006368 | transcription elongation from RNA polymerase II promoter(GO:0006368) |
| 0.0 | 0.2 | GO:0006228 | UTP biosynthetic process(GO:0006228) |
| 0.0 | 0.4 | GO:0007214 | gamma-aminobutyric acid signaling pathway(GO:0007214) |
| 0.0 | 0.1 | GO:0031666 | B cell proliferation involved in immune response(GO:0002322) positive regulation of lipopolysaccharide-mediated signaling pathway(GO:0031666) |
| 0.0 | 0.8 | GO:0006968 | cellular defense response(GO:0006968) |
| 0.0 | 2.6 | GO:0043627 | response to estrogen(GO:0043627) |
| 0.0 | 0.5 | GO:1901385 | regulation of voltage-gated calcium channel activity(GO:1901385) |
| 0.0 | 0.4 | GO:0045124 | regulation of bone resorption(GO:0045124) |
| 0.0 | 0.1 | GO:0099639 | neurotransmitter receptor transport, endosome to postsynaptic membrane(GO:0098887) neurotransmitter receptor transport, endosome to plasma membrane(GO:0099639) |
| 0.0 | 0.2 | GO:0055003 | cardiac myofibril assembly(GO:0055003) |
Gene overrepresentation in cellular component category:
| Log-likelihood per target | Total log-likelihood | Term | Description |
|---|---|---|---|
| 2.8 | 11.2 | GO:0097229 | sperm end piece(GO:0097229) |
| 1.2 | 3.7 | GO:0016222 | procollagen-proline 4-dioxygenase complex(GO:0016222) |
| 0.7 | 4.4 | GO:0020018 | ciliary pocket(GO:0020016) ciliary pocket membrane(GO:0020018) |
| 0.6 | 1.9 | GO:1990590 | ATF1-ATF4 transcription factor complex(GO:1990590) |
| 0.6 | 1.7 | GO:0044753 | amphisome(GO:0044753) |
| 0.5 | 2.0 | GO:0070876 | SOSS complex(GO:0070876) |
| 0.5 | 1.4 | GO:0043159 | acrosomal matrix(GO:0043159) |
| 0.4 | 1.3 | GO:0048269 | methionine adenosyltransferase complex(GO:0048269) |
| 0.4 | 2.9 | GO:0005610 | laminin-5 complex(GO:0005610) |
| 0.4 | 14.6 | GO:0031233 | intrinsic component of external side of plasma membrane(GO:0031233) |
| 0.4 | 3.7 | GO:0072687 | meiotic spindle(GO:0072687) |
| 0.3 | 1.2 | GO:0008043 | intracellular ferritin complex(GO:0008043) ferritin complex(GO:0070288) |
| 0.3 | 21.0 | GO:0001772 | immunological synapse(GO:0001772) |
| 0.3 | 1.1 | GO:0033596 | TSC1-TSC2 complex(GO:0033596) |
| 0.2 | 1.2 | GO:0045272 | plasma membrane respiratory chain complex I(GO:0045272) |
| 0.2 | 1.4 | GO:0030485 | smooth muscle contractile fiber(GO:0030485) |
| 0.2 | 2.1 | GO:0042406 | extrinsic component of endoplasmic reticulum membrane(GO:0042406) |
| 0.2 | 1.2 | GO:1990031 | pinceau fiber(GO:1990031) |
| 0.2 | 1.2 | GO:0042589 | zymogen granule membrane(GO:0042589) |
| 0.2 | 0.6 | GO:0097454 | Schwann cell microvillus(GO:0097454) |
| 0.2 | 1.9 | GO:0097550 | transcriptional preinitiation complex(GO:0097550) |
| 0.2 | 0.7 | GO:0071001 | U4/U6 snRNP(GO:0071001) |
| 0.2 | 23.1 | GO:0005901 | caveola(GO:0005901) |
| 0.2 | 3.8 | GO:0032433 | filopodium tip(GO:0032433) |
| 0.2 | 5.0 | GO:0002080 | acrosomal membrane(GO:0002080) |
| 0.1 | 0.1 | GO:0070195 | growth hormone receptor complex(GO:0070195) |
| 0.1 | 2.4 | GO:0000164 | protein phosphatase type 1 complex(GO:0000164) |
| 0.1 | 0.5 | GO:0097441 | basilar dendrite(GO:0097441) |
| 0.1 | 10.2 | GO:1904724 | tertiary granule lumen(GO:1904724) |
| 0.1 | 0.5 | GO:0071942 | XPC complex(GO:0071942) |
| 0.1 | 1.5 | GO:0016013 | syntrophin complex(GO:0016013) |
| 0.1 | 0.3 | GO:0034272 | phosphatidylinositol 3-kinase complex, class III, type I(GO:0034271) phosphatidylinositol 3-kinase complex, class III, type II(GO:0034272) |
| 0.1 | 2.1 | GO:1990454 | L-type voltage-gated calcium channel complex(GO:1990454) |
| 0.1 | 1.6 | GO:0090533 | cation-transporting ATPase complex(GO:0090533) |
| 0.1 | 0.4 | GO:0030895 | apolipoprotein B mRNA editing enzyme complex(GO:0030895) |
| 0.1 | 1.1 | GO:0070449 | elongin complex(GO:0070449) |
| 0.1 | 4.6 | GO:0001533 | cornified envelope(GO:0001533) |
| 0.1 | 0.5 | GO:0072557 | IPAF inflammasome complex(GO:0072557) |
| 0.1 | 0.9 | GO:0030061 | mitochondrial crista(GO:0030061) |
| 0.1 | 1.8 | GO:0000346 | transcription export complex(GO:0000346) |
| 0.1 | 0.8 | GO:0097486 | multivesicular body lumen(GO:0097486) |
| 0.1 | 0.4 | GO:0042643 | actomyosin, actin portion(GO:0042643) |
| 0.1 | 0.6 | GO:0042824 | MHC class I peptide loading complex(GO:0042824) |
| 0.1 | 1.2 | GO:0030127 | COPII vesicle coat(GO:0030127) |
| 0.1 | 1.2 | GO:0005916 | fascia adherens(GO:0005916) |
| 0.1 | 1.0 | GO:0030126 | COPI vesicle coat(GO:0030126) |
| 0.1 | 1.2 | GO:0035631 | CD40 receptor complex(GO:0035631) |
| 0.1 | 2.6 | GO:0000159 | protein phosphatase type 2A complex(GO:0000159) |
| 0.1 | 0.8 | GO:0005750 | mitochondrial respiratory chain complex III(GO:0005750) respiratory chain complex III(GO:0045275) |
| 0.1 | 0.5 | GO:0005579 | membrane attack complex(GO:0005579) |
| 0.1 | 0.6 | GO:1990909 | Wnt signalosome(GO:1990909) |
| 0.0 | 1.0 | GO:0097386 | glial cell projection(GO:0097386) |
| 0.0 | 1.6 | GO:0097381 | photoreceptor disc membrane(GO:0097381) |
| 0.0 | 0.7 | GO:0005833 | hemoglobin complex(GO:0005833) |
| 0.0 | 0.5 | GO:0005786 | signal recognition particle, endoplasmic reticulum targeting(GO:0005786) |
| 0.0 | 3.0 | GO:0031093 | platelet alpha granule lumen(GO:0031093) |
| 0.0 | 1.6 | GO:0044322 | endoplasmic reticulum quality control compartment(GO:0044322) |
| 0.0 | 0.4 | GO:0032593 | insulin-responsive compartment(GO:0032593) |
| 0.0 | 1.5 | GO:0034364 | high-density lipoprotein particle(GO:0034364) |
| 0.0 | 0.6 | GO:0036056 | filtration diaphragm(GO:0036056) slit diaphragm(GO:0036057) |
| 0.0 | 5.3 | GO:0005581 | collagen trimer(GO:0005581) |
| 0.0 | 0.4 | GO:0035985 | senescence-associated heterochromatin focus(GO:0035985) |
| 0.0 | 0.9 | GO:0043205 | microfibril(GO:0001527) fibril(GO:0043205) |
| 0.0 | 0.2 | GO:0034715 | pICln-Sm protein complex(GO:0034715) |
| 0.0 | 0.8 | GO:0032591 | dendritic spine membrane(GO:0032591) |
| 0.0 | 1.9 | GO:0005771 | multivesicular body(GO:0005771) |
| 0.0 | 38.0 | GO:0009986 | cell surface(GO:0009986) |
| 0.0 | 0.5 | GO:0031616 | spindle pole centrosome(GO:0031616) |
| 0.0 | 1.2 | GO:0071782 | endoplasmic reticulum tubular network(GO:0071782) |
| 0.0 | 14.4 | GO:0005578 | proteinaceous extracellular matrix(GO:0005578) |
| 0.0 | 1.7 | GO:0016592 | mediator complex(GO:0016592) |
| 0.0 | 0.3 | GO:0000243 | commitment complex(GO:0000243) |
| 0.0 | 30.4 | GO:0048471 | perinuclear region of cytoplasm(GO:0048471) |
| 0.0 | 1.2 | GO:0002102 | podosome(GO:0002102) |
| 0.0 | 1.5 | GO:0016235 | aggresome(GO:0016235) |
| 0.0 | 0.6 | GO:0005686 | U2 snRNP(GO:0005686) |
| 0.0 | 1.3 | GO:1902711 | GABA-A receptor complex(GO:1902711) |
| 0.0 | 0.1 | GO:0005863 | striated muscle myosin thick filament(GO:0005863) |
| 0.0 | 2.6 | GO:0043657 | host(GO:0018995) host cell(GO:0043657) |
| 0.0 | 2.6 | GO:0032432 | actin filament bundle(GO:0032432) |
| 0.0 | 0.2 | GO:0034098 | VCP-NPL4-UFD1 AAA ATPase complex(GO:0034098) |
| 0.0 | 1.3 | GO:0014704 | intercalated disc(GO:0014704) |
| 0.0 | 4.6 | GO:0044306 | neuron projection terminus(GO:0044306) |
| 0.0 | 0.1 | GO:0000798 | nuclear cohesin complex(GO:0000798) |
| 0.0 | 1.6 | GO:0005881 | cytoplasmic microtubule(GO:0005881) |
| 0.0 | 1.5 | GO:0015030 | Cajal body(GO:0015030) |
| 0.0 | 0.4 | GO:0044224 | juxtaparanode region of axon(GO:0044224) |
| 0.0 | 9.4 | GO:0005874 | microtubule(GO:0005874) |
| 0.0 | 0.4 | GO:0005942 | phosphatidylinositol 3-kinase complex(GO:0005942) |
| 0.0 | 1.9 | GO:0043209 | myelin sheath(GO:0043209) |
| 0.0 | 0.1 | GO:0098845 | postsynaptic endosome(GO:0098845) |
| 0.0 | 0.2 | GO:0042382 | paraspeckles(GO:0042382) |
| 0.0 | 1.1 | GO:0005811 | lipid particle(GO:0005811) |
| 0.0 | 0.1 | GO:0097209 | epidermal lamellar body(GO:0097209) |
| 0.0 | 0.6 | GO:0045171 | intercellular bridge(GO:0045171) |
| 0.0 | 0.9 | GO:0001750 | photoreceptor outer segment(GO:0001750) |
| 0.0 | 18.5 | GO:0005615 | extracellular space(GO:0005615) |
| 0.0 | 2.0 | GO:0000932 | cytoplasmic mRNA processing body(GO:0000932) |
| 0.0 | 3.0 | GO:0009898 | cytoplasmic side of plasma membrane(GO:0009898) |
| 0.0 | 0.5 | GO:0005791 | rough endoplasmic reticulum(GO:0005791) |
| 0.0 | 0.3 | GO:0034451 | centriolar satellite(GO:0034451) |
| 0.0 | 1.6 | GO:0005923 | bicellular tight junction(GO:0005923) |
Gene overrepresentation in molecular function category:
| Log-likelihood per target | Total log-likelihood | Term | Description |
|---|---|---|---|
| 3.0 | 45.0 | GO:0045236 | CXCR chemokine receptor binding(GO:0045236) |
| 1.9 | 22.3 | GO:0033691 | sialic acid binding(GO:0033691) |
| 1.2 | 46.8 | GO:0008009 | chemokine activity(GO:0008009) |
| 0.8 | 7.4 | GO:0019238 | cyclohydrolase activity(GO:0019238) |
| 0.6 | 3.7 | GO:0004656 | procollagen-proline 4-dioxygenase activity(GO:0004656) |
| 0.6 | 5.0 | GO:0008597 | calcium-dependent protein serine/threonine phosphatase regulator activity(GO:0008597) |
| 0.5 | 3.0 | GO:0004720 | protein-lysine 6-oxidase activity(GO:0004720) |
| 0.5 | 2.8 | GO:0034714 | type III transforming growth factor beta receptor binding(GO:0034714) |
| 0.5 | 2.3 | GO:0004995 | tachykinin receptor activity(GO:0004995) |
| 0.4 | 3.2 | GO:0043237 | laminin-1 binding(GO:0043237) Roundabout binding(GO:0048495) |
| 0.4 | 2.1 | GO:0048030 | disaccharide binding(GO:0048030) |
| 0.3 | 1.7 | GO:0010861 | thyroid hormone receptor activator activity(GO:0010861) thyroid hormone receptor coactivator activity(GO:0030375) |
| 0.3 | 5.7 | GO:0005432 | calcium:sodium antiporter activity(GO:0005432) |
| 0.3 | 1.0 | GO:1904455 | ubiquitin-specific protease activity involved in negative regulation of ERAD pathway(GO:1904455) |
| 0.3 | 2.1 | GO:0042978 | ornithine decarboxylase activator activity(GO:0042978) |
| 0.3 | 2.4 | GO:0060002 | plus-end directed microfilament motor activity(GO:0060002) |
| 0.3 | 1.0 | GO:0061769 | ribosylnicotinamide kinase activity(GO:0050262) ribosylnicotinate kinase activity(GO:0061769) |
| 0.2 | 1.0 | GO:0004356 | glutamate-ammonia ligase activity(GO:0004356) ammonia ligase activity(GO:0016211) acid-ammonia (or amide) ligase activity(GO:0016880) |
| 0.2 | 3.0 | GO:0030280 | structural constituent of epidermis(GO:0030280) |
| 0.2 | 1.4 | GO:0030060 | L-malate dehydrogenase activity(GO:0030060) |
| 0.2 | 2.4 | GO:0072542 | protein phosphatase activator activity(GO:0072542) |
| 0.2 | 0.6 | GO:0004651 | polynucleotide 5'-phosphatase activity(GO:0004651) |
| 0.2 | 8.2 | GO:0005540 | hyaluronic acid binding(GO:0005540) |
| 0.2 | 1.2 | GO:0004966 | galanin receptor activity(GO:0004966) |
| 0.2 | 4.3 | GO:0005537 | mannose binding(GO:0005537) |
| 0.2 | 1.3 | GO:0035662 | Toll-like receptor 4 binding(GO:0035662) |
| 0.2 | 0.9 | GO:0017018 | myosin phosphatase activity(GO:0017018) |
| 0.2 | 1.4 | GO:0004738 | pyruvate dehydrogenase activity(GO:0004738) pyruvate dehydrogenase [NAD(P)+] activity(GO:0034603) pyruvate dehydrogenase (NAD+) activity(GO:0034604) |
| 0.2 | 1.2 | GO:0035473 | lipase binding(GO:0035473) |
| 0.2 | 0.8 | GO:0033695 | oxidoreductase activity, acting on CH or CH2 groups, quinone or similar compound as acceptor(GO:0033695) caffeine oxidase activity(GO:0034875) |
| 0.2 | 0.7 | GO:0008508 | bile acid:sodium symporter activity(GO:0008508) |
| 0.2 | 1.2 | GO:0004322 | ferroxidase activity(GO:0004322) oxidoreductase activity, oxidizing metal ions, oxygen as acceptor(GO:0016724) |
| 0.2 | 1.2 | GO:0086083 | cell adhesive protein binding involved in bundle of His cell-Purkinje myocyte communication(GO:0086083) |
| 0.1 | 0.6 | GO:0031716 | calcitonin receptor binding(GO:0031716) |
| 0.1 | 2.3 | GO:0043522 | leucine zipper domain binding(GO:0043522) |
| 0.1 | 17.9 | GO:0001618 | virus receptor activity(GO:0001618) |
| 0.1 | 2.1 | GO:0086056 | voltage-gated calcium channel activity involved in AV node cell action potential(GO:0086056) |
| 0.1 | 1.6 | GO:0015386 | potassium:proton antiporter activity(GO:0015386) |
| 0.1 | 0.5 | GO:0017159 | pantetheine hydrolase activity(GO:0017159) |
| 0.1 | 0.6 | GO:0004392 | heme oxygenase (decyclizing) activity(GO:0004392) |
| 0.1 | 3.5 | GO:0017081 | chloride channel regulator activity(GO:0017081) |
| 0.1 | 11.1 | GO:0005544 | calcium-dependent phospholipid binding(GO:0005544) |
| 0.1 | 6.2 | GO:0005164 | tumor necrosis factor receptor binding(GO:0005164) |
| 0.1 | 0.8 | GO:0004797 | thymidine kinase activity(GO:0004797) |
| 0.1 | 3.3 | GO:0031005 | filamin binding(GO:0031005) |
| 0.1 | 1.6 | GO:0008020 | G-protein coupled photoreceptor activity(GO:0008020) |
| 0.1 | 0.3 | GO:0061609 | fructose-1-phosphate aldolase activity(GO:0061609) |
| 0.1 | 5.4 | GO:0046875 | ephrin receptor binding(GO:0046875) |
| 0.1 | 1.0 | GO:0043533 | inositol 1,3,4,5 tetrakisphosphate binding(GO:0043533) |
| 0.1 | 1.1 | GO:1990825 | sequence-specific mRNA binding(GO:1990825) |
| 0.1 | 1.9 | GO:0097016 | L27 domain binding(GO:0097016) |
| 0.1 | 1.9 | GO:0008391 | arachidonic acid monooxygenase activity(GO:0008391) arachidonic acid epoxygenase activity(GO:0008392) |
| 0.1 | 2.0 | GO:0003708 | retinoic acid receptor activity(GO:0003708) |
| 0.1 | 0.2 | GO:0016639 | oxidoreductase activity, acting on the CH-NH2 group of donors, NAD or NADP as acceptor(GO:0016639) |
| 0.1 | 0.8 | GO:0008172 | S-methyltransferase activity(GO:0008172) |
| 0.1 | 2.2 | GO:0004185 | serine-type carboxypeptidase activity(GO:0004185) |
| 0.1 | 0.9 | GO:0005237 | inhibitory extracellular ligand-gated ion channel activity(GO:0005237) |
| 0.1 | 0.3 | GO:0035605 | peptidyl-cysteine S-nitrosylase activity(GO:0035605) |
| 0.1 | 2.1 | GO:0035613 | RNA stem-loop binding(GO:0035613) |
| 0.1 | 1.4 | GO:0042043 | neurexin family protein binding(GO:0042043) |
| 0.1 | 1.5 | GO:0061578 | Lys63-specific deubiquitinase activity(GO:0061578) |
| 0.1 | 0.9 | GO:0010853 | cyclase activator activity(GO:0010853) guanylate cyclase activator activity(GO:0030250) |
| 0.1 | 1.2 | GO:0070324 | thyroid hormone binding(GO:0070324) |
| 0.1 | 1.3 | GO:0001730 | 2'-5'-oligoadenylate synthetase activity(GO:0001730) |
| 0.1 | 27.1 | GO:0004252 | serine-type endopeptidase activity(GO:0004252) |
| 0.1 | 2.0 | GO:0045028 | G-protein coupled nucleotide receptor activity(GO:0001608) G-protein coupled purinergic nucleotide receptor activity(GO:0045028) |
| 0.1 | 1.3 | GO:0031433 | telethonin binding(GO:0031433) |
| 0.1 | 0.6 | GO:0030492 | hemoglobin binding(GO:0030492) |
| 0.1 | 0.3 | GO:0004668 | protein-arginine deiminase activity(GO:0004668) |
| 0.1 | 2.9 | GO:0016881 | acid-amino acid ligase activity(GO:0016881) |
| 0.1 | 0.3 | GO:0051538 | 3 iron, 4 sulfur cluster binding(GO:0051538) |
| 0.1 | 0.4 | GO:0042015 | interleukin-20 binding(GO:0042015) |
| 0.1 | 0.9 | GO:0004716 | receptor signaling protein tyrosine kinase activity(GO:0004716) |
| 0.1 | 5.7 | GO:0001105 | RNA polymerase II transcription coactivator activity(GO:0001105) |
| 0.1 | 1.5 | GO:0019870 | potassium channel inhibitor activity(GO:0019870) |
| 0.1 | 3.4 | GO:0005159 | insulin-like growth factor receptor binding(GO:0005159) |
| 0.1 | 0.5 | GO:0003956 | NAD(P)+-protein-arginine ADP-ribosyltransferase activity(GO:0003956) |
| 0.1 | 1.4 | GO:0070566 | adenylyltransferase activity(GO:0070566) |
| 0.1 | 0.7 | GO:0016861 | intramolecular oxidoreductase activity, interconverting aldoses and ketoses(GO:0016861) |
| 0.1 | 2.2 | GO:0042056 | chemoattractant activity(GO:0042056) |
| 0.1 | 0.4 | GO:0016416 | O-palmitoyltransferase activity(GO:0016416) |
| 0.1 | 0.3 | GO:1990446 | U1 snRNP binding(GO:1990446) |
| 0.1 | 0.3 | GO:0004994 | somatostatin receptor activity(GO:0004994) |
| 0.1 | 0.6 | GO:0004032 | alditol:NADP+ 1-oxidoreductase activity(GO:0004032) |
| 0.1 | 1.7 | GO:0070530 | K63-linked polyubiquitin binding(GO:0070530) |
| 0.1 | 0.2 | GO:0033300 | dehydroascorbic acid transporter activity(GO:0033300) |
| 0.1 | 0.5 | GO:0070097 | delta-catenin binding(GO:0070097) |
| 0.1 | 1.5 | GO:0004806 | triglyceride lipase activity(GO:0004806) |
| 0.1 | 0.2 | GO:0030550 | acetylcholine receptor inhibitor activity(GO:0030550) |
| 0.1 | 0.4 | GO:0035005 | 1-phosphatidylinositol-4-phosphate 3-kinase activity(GO:0035005) |
| 0.0 | 0.3 | GO:0015168 | glycerol transmembrane transporter activity(GO:0015168) |
| 0.0 | 1.9 | GO:0046966 | thyroid hormone receptor binding(GO:0046966) |
| 0.0 | 11.2 | GO:0017124 | SH3 domain binding(GO:0017124) |
| 0.0 | 1.7 | GO:0008327 | methyl-CpG binding(GO:0008327) |
| 0.0 | 0.3 | GO:0070996 | type 1 melanocortin receptor binding(GO:0070996) |
| 0.0 | 1.1 | GO:0043274 | phospholipase binding(GO:0043274) |
| 0.0 | 0.4 | GO:0005384 | manganese ion transmembrane transporter activity(GO:0005384) |
| 0.0 | 0.5 | GO:0008312 | 7S RNA binding(GO:0008312) |
| 0.0 | 1.2 | GO:0051537 | 2 iron, 2 sulfur cluster binding(GO:0051537) |
| 0.0 | 1.2 | GO:0070001 | aspartic-type endopeptidase activity(GO:0004190) aspartic-type peptidase activity(GO:0070001) |
| 0.0 | 0.4 | GO:0022889 | L-serine transmembrane transporter activity(GO:0015194) serine transmembrane transporter activity(GO:0022889) |
| 0.0 | 0.9 | GO:0052629 | phosphatidylinositol-3,5-bisphosphate 3-phosphatase activity(GO:0052629) |
| 0.0 | 1.0 | GO:0042813 | Wnt-activated receptor activity(GO:0042813) |
| 0.0 | 0.7 | GO:0017070 | U6 snRNA binding(GO:0017070) ubiquitin-specific protease binding(GO:1990381) |
| 0.0 | 1.1 | GO:0005212 | structural constituent of eye lens(GO:0005212) |
| 0.0 | 1.0 | GO:0017166 | vinculin binding(GO:0017166) |
| 0.0 | 0.4 | GO:0015129 | lactate transmembrane transporter activity(GO:0015129) |
| 0.0 | 15.3 | GO:0003924 | GTPase activity(GO:0003924) |
| 0.0 | 0.6 | GO:0003707 | steroid hormone receptor activity(GO:0003707) |
| 0.0 | 0.1 | GO:0005148 | prolactin receptor binding(GO:0005148) |
| 0.0 | 0.4 | GO:0097157 | pre-mRNA intronic binding(GO:0097157) |
| 0.0 | 1.1 | GO:0005035 | tumor necrosis factor-activated receptor activity(GO:0005031) death receptor activity(GO:0005035) |
| 0.0 | 1.0 | GO:0005528 | macrolide binding(GO:0005527) FK506 binding(GO:0005528) |
| 0.0 | 0.2 | GO:0042289 | MHC class II protein binding(GO:0042289) |
| 0.0 | 1.2 | GO:0004033 | aldo-keto reductase (NADP) activity(GO:0004033) |
| 0.0 | 0.4 | GO:0055056 | D-glucose transmembrane transporter activity(GO:0055056) |
| 0.0 | 4.2 | GO:0004867 | serine-type endopeptidase inhibitor activity(GO:0004867) |
| 0.0 | 1.6 | GO:0000049 | tRNA binding(GO:0000049) |
| 0.0 | 1.0 | GO:0070577 | lysine-acetylated histone binding(GO:0070577) |
| 0.0 | 0.3 | GO:0046974 | histone methyltransferase activity (H3-K9 specific)(GO:0046974) |
| 0.0 | 0.9 | GO:0008301 | DNA binding, bending(GO:0008301) |
| 0.0 | 2.1 | GO:0008138 | protein tyrosine/serine/threonine phosphatase activity(GO:0008138) |
| 0.0 | 6.0 | GO:0017137 | Rab GTPase binding(GO:0017137) |
| 0.0 | 0.6 | GO:0004653 | polypeptide N-acetylgalactosaminyltransferase activity(GO:0004653) |
| 0.0 | 0.2 | GO:0015321 | sodium-dependent phosphate transmembrane transporter activity(GO:0015321) |
| 0.0 | 0.2 | GO:0036435 | K48-linked polyubiquitin binding(GO:0036435) |
| 0.0 | 0.2 | GO:0016176 | superoxide-generating NADPH oxidase activator activity(GO:0016176) |
| 0.0 | 0.2 | GO:0005353 | fructose transmembrane transporter activity(GO:0005353) |
| 0.0 | 0.4 | GO:0022851 | GABA-gated chloride ion channel activity(GO:0022851) |
| 0.0 | 0.8 | GO:0015002 | cytochrome-c oxidase activity(GO:0004129) heme-copper terminal oxidase activity(GO:0015002) oxidoreductase activity, acting on a heme group of donors, oxygen as acceptor(GO:0016676) |
| 0.0 | 0.9 | GO:0051059 | NF-kappaB binding(GO:0051059) |
| 0.0 | 0.5 | GO:0008331 | high voltage-gated calcium channel activity(GO:0008331) |
| 0.0 | 0.6 | GO:0022840 | leak channel activity(GO:0022840) narrow pore channel activity(GO:0022842) |
| 0.0 | 0.5 | GO:0008395 | steroid hydroxylase activity(GO:0008395) |
| 0.0 | 0.2 | GO:0043008 | ATP-dependent protein binding(GO:0043008) |
| 0.0 | 0.5 | GO:0031593 | polyubiquitin binding(GO:0031593) |
| 0.0 | 0.9 | GO:0031624 | ubiquitin conjugating enzyme binding(GO:0031624) |
| 0.0 | 0.1 | GO:0001591 | dopamine neurotransmitter receptor activity, coupled via Gi/Go(GO:0001591) |
| 0.0 | 0.6 | GO:0071837 | HMG box domain binding(GO:0071837) |
| 0.0 | 0.2 | GO:0048407 | platelet-derived growth factor binding(GO:0048407) |
| 0.0 | 0.5 | GO:0015172 | L-glutamate transmembrane transporter activity(GO:0005313) acidic amino acid transmembrane transporter activity(GO:0015172) |
| 0.0 | 0.3 | GO:0031404 | chloride ion binding(GO:0031404) |
| 0.0 | 0.4 | GO:0005247 | voltage-gated chloride channel activity(GO:0005247) |
| 0.0 | 1.9 | GO:0019888 | protein phosphatase regulator activity(GO:0019888) |
| 0.0 | 0.5 | GO:0043027 | cysteine-type endopeptidase inhibitor activity involved in apoptotic process(GO:0043027) |
| 0.0 | 15.3 | GO:0008270 | zinc ion binding(GO:0008270) |
| 0.0 | 0.2 | GO:1901612 | cardiolipin binding(GO:1901612) |
| 0.0 | 0.9 | GO:0015485 | cholesterol binding(GO:0015485) |
| 0.0 | 0.2 | GO:0005344 | oxygen transporter activity(GO:0005344) |
| 0.0 | 0.2 | GO:0004568 | chitinase activity(GO:0004568) |
| 0.0 | 0.1 | GO:0070697 | activin receptor binding(GO:0070697) |
| 0.0 | 0.4 | GO:0001106 | RNA polymerase II transcription corepressor activity(GO:0001106) |
| 0.0 | 0.5 | GO:0043425 | bHLH transcription factor binding(GO:0043425) |
| 0.0 | 0.7 | GO:0051018 | protein kinase A binding(GO:0051018) |
| 0.0 | 1.1 | GO:0101005 | thiol-dependent ubiquitinyl hydrolase activity(GO:0036459) ubiquitinyl hydrolase activity(GO:0101005) |
| 0.0 | 0.1 | GO:0032051 | clathrin light chain binding(GO:0032051) |
| 0.0 | 0.5 | GO:0017022 | myosin binding(GO:0017022) |
| 0.0 | 0.4 | GO:0004385 | guanylate kinase activity(GO:0004385) |
| 0.0 | 0.1 | GO:0003810 | protein-glutamine gamma-glutamyltransferase activity(GO:0003810) |
Gene overrepresentation in curated gene sets: canonical pathways category:
| Log-likelihood per target | Total log-likelihood | Term | Description |
|---|---|---|---|
| 0.4 | 40.8 | PID TXA2PATHWAY | Thromboxane A2 receptor signaling |
| 0.3 | 5.0 | PID TCR CALCIUM PATHWAY | Calcium signaling in the CD4+ TCR pathway |
| 0.2 | 98.9 | NABA SECRETED FACTORS | Genes encoding secreted soluble factors |
| 0.2 | 2.9 | PID INTEGRIN4 PATHWAY | Alpha6 beta4 integrin-ligand interactions |
| 0.1 | 3.2 | PID GLYPICAN 1PATHWAY | Glypican 1 network |
| 0.1 | 10.6 | PID NFAT TFPATHWAY | Calcineurin-regulated NFAT-dependent transcription in lymphocytes |
| 0.1 | 3.4 | PID INSULIN GLUCOSE PATHWAY | Insulin-mediated glucose transport |
| 0.1 | 5.5 | PID INTEGRIN A4B1 PATHWAY | Alpha4 beta1 integrin signaling events |
| 0.1 | 5.2 | PID SYNDECAN 1 PATHWAY | Syndecan-1-mediated signaling events |
| 0.1 | 2.3 | PID PRL SIGNALING EVENTS PATHWAY | Signaling events mediated by PRL |
| 0.1 | 3.4 | PID RXR VDR PATHWAY | RXR and RAR heterodimerization with other nuclear receptor |
| 0.1 | 0.9 | PID ERBB NETWORK PATHWAY | ErbB receptor signaling network |
| 0.1 | 21.2 | NABA ECM REGULATORS | Genes encoding enzymes and their regulators involved in the remodeling of the extracellular matrix |
| 0.1 | 2.9 | PID IL1 PATHWAY | IL1-mediated signaling events |
| 0.1 | 2.4 | PID NETRIN PATHWAY | Netrin-mediated signaling events |
| 0.1 | 3.5 | PID PI3KCI PATHWAY | Class I PI3K signaling events |
| 0.1 | 3.3 | ST DIFFERENTIATION PATHWAY IN PC12 CELLS | Differentiation Pathway in PC12 Cells; this is a specific case of PAC1 Receptor Pathway. |
| 0.0 | 1.9 | PID FRA PATHWAY | Validated transcriptional targets of AP1 family members Fra1 and Fra2 |
| 0.0 | 1.0 | PID WNT SIGNALING PATHWAY | Wnt signaling network |
| 0.0 | 3.8 | PID TGFBR PATHWAY | TGF-beta receptor signaling |
| 0.0 | 3.3 | PID HDAC CLASSII PATHWAY | Signaling events mediated by HDAC Class II |
| 0.0 | 3.7 | PID RAC1 REG PATHWAY | Regulation of RAC1 activity |
| 0.0 | 1.0 | PID ARF 3PATHWAY | Arf1 pathway |
| 0.0 | 1.4 | ST JNK MAPK PATHWAY | JNK MAPK Pathway |
| 0.0 | 1.9 | PID ECADHERIN NASCENT AJ PATHWAY | E-cadherin signaling in the nascent adherens junction |
| 0.0 | 1.6 | PID RHOA PATHWAY | RhoA signaling pathway |
| 0.0 | 1.3 | NABA PROTEOGLYCANS | Genes encoding proteoglycans |
| 0.0 | 0.7 | ST ADRENERGIC | Adrenergic Pathway |
| 0.0 | 2.3 | PID SMAD2 3NUCLEAR PATHWAY | Regulation of nuclear SMAD2/3 signaling |
| 0.0 | 0.6 | PID CONE PATHWAY | Visual signal transduction: Cones |
| 0.0 | 4.5 | NABA MATRISOME ASSOCIATED | Ensemble of genes encoding ECM-associated proteins including ECM-affilaited proteins, ECM regulators and secreted factors |
| 0.0 | 1.5 | PID HIF1 TFPATHWAY | HIF-1-alpha transcription factor network |
| 0.0 | 1.6 | PID PDGFRB PATHWAY | PDGFR-beta signaling pathway |
| 0.0 | 0.7 | PID IL6 7 PATHWAY | IL6-mediated signaling events |
| 0.0 | 0.8 | PID HNF3B PATHWAY | FOXA2 and FOXA3 transcription factor networks |
| 0.0 | 0.5 | PID AP1 PATHWAY | AP-1 transcription factor network |
| 0.0 | 3.3 | NABA ECM GLYCOPROTEINS | Genes encoding structural ECM glycoproteins |
| 0.0 | 0.5 | PID REG GR PATHWAY | Glucocorticoid receptor regulatory network |
Gene overrepresentation in curated gene sets: REACTOME pathways category:
| Log-likelihood per target | Total log-likelihood | Term | Description |
|---|---|---|---|
| 1.1 | 76.0 | REACTOME CHEMOKINE RECEPTORS BIND CHEMOKINES | Genes involved in Chemokine receptors bind chemokines |
| 0.4 | 4.5 | REACTOME TRAF6 MEDIATED IRF7 ACTIVATION IN TLR7 8 OR 9 SIGNALING | Genes involved in TRAF6 mediated IRF7 activation in TLR7/8 or 9 signaling |
| 0.4 | 10.5 | REACTOME POST CHAPERONIN TUBULIN FOLDING PATHWAY | Genes involved in Post-chaperonin tubulin folding pathway |
| 0.4 | 7.4 | REACTOME TETRAHYDROBIOPTERIN BH4 SYNTHESIS RECYCLING SALVAGE AND REGULATION | Genes involved in Tetrahydrobiopterin (BH4) synthesis, recycling, salvage and regulation |
| 0.3 | 15.2 | REACTOME FORMATION OF FIBRIN CLOT CLOTTING CASCADE | Genes involved in Formation of Fibrin Clot (Clotting Cascade) |
| 0.3 | 12.3 | REACTOME DEGRADATION OF THE EXTRACELLULAR MATRIX | Genes involved in Degradation of the extracellular matrix |
| 0.2 | 6.9 | REACTOME PYRUVATE METABOLISM | Genes involved in Pyruvate metabolism |
| 0.2 | 2.5 | REACTOME ACTIVATION OF CHAPERONE GENES BY ATF6 ALPHA | Genes involved in Activation of Chaperone Genes by ATF6-alpha |
| 0.2 | 1.7 | REACTOME P75NTR RECRUITS SIGNALLING COMPLEXES | Genes involved in p75NTR recruits signalling complexes |
| 0.2 | 17.7 | REACTOME IMMUNOREGULATORY INTERACTIONS BETWEEN A LYMPHOID AND A NON LYMPHOID CELL | Genes involved in Immunoregulatory interactions between a Lymphoid and a non-Lymphoid cell |
| 0.2 | 5.7 | REACTOME BASIGIN INTERACTIONS | Genes involved in Basigin interactions |
| 0.1 | 2.4 | REACTOME XENOBIOTICS | Genes involved in Xenobiotics |
| 0.1 | 3.2 | REACTOME ACTIVATION OF RAC | Genes involved in Activation of Rac |
| 0.1 | 1.6 | REACTOME OPSINS | Genes involved in Opsins |
| 0.1 | 10.8 | REACTOME INTERFERON ALPHA BETA SIGNALING | Genes involved in Interferon alpha/beta signaling |
| 0.1 | 1.0 | REACTOME COPI MEDIATED TRANSPORT | Genes involved in COPI Mediated Transport |
| 0.1 | 3.7 | REACTOME METABOLISM OF STEROID HORMONES AND VITAMINS A AND D | Genes involved in Metabolism of steroid hormones and vitamins A and D |
| 0.1 | 2.1 | REACTOME AMINO ACID SYNTHESIS AND INTERCONVERSION TRANSAMINATION | Genes involved in Amino acid synthesis and interconversion (transamination) |
| 0.1 | 1.2 | REACTOME SYNTHESIS OF PIPS AT THE LATE ENDOSOME MEMBRANE | Genes involved in Synthesis of PIPs at the late endosome membrane |
| 0.1 | 1.6 | REACTOME HYALURONAN UPTAKE AND DEGRADATION | Genes involved in Hyaluronan uptake and degradation |
| 0.1 | 1.9 | REACTOME IONOTROPIC ACTIVITY OF KAINATE RECEPTORS | Genes involved in Ionotropic activity of Kainate Receptors |
| 0.1 | 3.4 | REACTOME INCRETIN SYNTHESIS SECRETION AND INACTIVATION | Genes involved in Incretin Synthesis, Secretion, and Inactivation |
| 0.1 | 2.1 | REACTOME SULFUR AMINO ACID METABOLISM | Genes involved in Sulfur amino acid metabolism |
| 0.1 | 1.4 | REACTOME CYCLIN A B1 ASSOCIATED EVENTS DURING G2 M TRANSITION | Genes involved in Cyclin A/B1 associated events during G2/M transition |
| 0.1 | 2.4 | REACTOME DOWNREGULATION OF TGF BETA RECEPTOR SIGNALING | Genes involved in Downregulation of TGF-beta receptor signaling |
| 0.1 | 0.6 | REACTOME NEPHRIN INTERACTIONS | Genes involved in Nephrin interactions |
| 0.1 | 0.2 | REACTOME SHC RELATED EVENTS | Genes involved in SHC-related events |
| 0.1 | 0.7 | REACTOME METABOLISM OF POLYAMINES | Genes involved in Metabolism of polyamines |
| 0.1 | 0.5 | REACTOME ENDOGENOUS STEROLS | Genes involved in Endogenous sterols |
| 0.1 | 1.4 | REACTOME CYTOSOLIC SULFONATION OF SMALL MOLECULES | Genes involved in Cytosolic sulfonation of small molecules |
| 0.1 | 0.7 | REACTOME CREATION OF C4 AND C2 ACTIVATORS | Genes involved in Creation of C4 and C2 activators |
| 0.0 | 2.4 | REACTOME SMOOTH MUSCLE CONTRACTION | Genes involved in Smooth Muscle Contraction |
| 0.0 | 0.4 | REACTOME NRAGE SIGNALS DEATH THROUGH JNK | Genes involved in NRAGE signals death through JNK |
| 0.0 | 0.7 | REACTOME RECYCLING OF BILE ACIDS AND SALTS | Genes involved in Recycling of bile acids and salts |
| 0.0 | 2.4 | REACTOME NETRIN1 SIGNALING | Genes involved in Netrin-1 signaling |
| 0.0 | 2.9 | REACTOME CELL SURFACE INTERACTIONS AT THE VASCULAR WALL | Genes involved in Cell surface interactions at the vascular wall |
| 0.0 | 1.3 | REACTOME GABA A RECEPTOR ACTIVATION | Genes involved in GABA A receptor activation |
| 0.0 | 2.0 | REACTOME RNA POL II TRANSCRIPTION PRE INITIATION AND PROMOTER OPENING | Genes involved in RNA Polymerase II Transcription Pre-Initiation And Promoter Opening |
| 0.0 | 5.6 | REACTOME FACTORS INVOLVED IN MEGAKARYOCYTE DEVELOPMENT AND PLATELET PRODUCTION | Genes involved in Factors involved in megakaryocyte development and platelet production |
| 0.0 | 0.8 | REACTOME FACILITATIVE NA INDEPENDENT GLUCOSE TRANSPORTERS | Genes involved in Facilitative Na+-independent glucose transporters |
| 0.0 | 1.1 | REACTOME RAS ACTIVATION UOPN CA2 INFUX THROUGH NMDA RECEPTOR | Genes involved in Ras activation uopn Ca2+ infux through NMDA receptor |
| 0.0 | 3.9 | REACTOME CELL JUNCTION ORGANIZATION | Genes involved in Cell junction organization |
| 0.0 | 0.2 | REACTOME INITIAL TRIGGERING OF COMPLEMENT | Genes involved in Initial triggering of complement |
| 0.0 | 0.9 | REACTOME SHC1 EVENTS IN ERBB4 SIGNALING | Genes involved in SHC1 events in ERBB4 signaling |
| 0.0 | 1.5 | REACTOME GLUCONEOGENESIS | Genes involved in Gluconeogenesis |
| 0.0 | 3.7 | REACTOME PEPTIDE LIGAND BINDING RECEPTORS | Genes involved in Peptide ligand-binding receptors |
| 0.0 | 0.3 | REACTOME PASSIVE TRANSPORT BY AQUAPORINS | Genes involved in Passive Transport by Aquaporins |
| 0.0 | 0.4 | REACTOME SYNTHESIS OF PIPS AT THE GOLGI MEMBRANE | Genes involved in Synthesis of PIPs at the Golgi membrane |
| 0.0 | 0.6 | REACTOME METABOLISM OF PORPHYRINS | Genes involved in Metabolism of porphyrins |
| 0.0 | 1.4 | REACTOME REGULATION OF ORNITHINE DECARBOXYLASE ODC | Genes involved in Regulation of ornithine decarboxylase (ODC) |
| 0.0 | 1.0 | REACTOME MRNA 3 END PROCESSING | Genes involved in mRNA 3'-end processing |
| 0.0 | 0.8 | REACTOME PYRIMIDINE METABOLISM | Genes involved in Pyrimidine metabolism |
| 0.0 | 1.1 | REACTOME NEGATIVE REGULATORS OF RIG I MDA5 SIGNALING | Genes involved in Negative regulators of RIG-I/MDA5 signaling |
| 0.0 | 1.2 | REACTOME VOLTAGE GATED POTASSIUM CHANNELS | Genes involved in Voltage gated Potassium channels |
| 0.0 | 0.2 | REACTOME CLEAVAGE OF GROWING TRANSCRIPT IN THE TERMINATION REGION | Genes involved in Cleavage of Growing Transcript in the Termination Region |
| 0.0 | 0.4 | REACTOME REGULATION OF GENE EXPRESSION IN BETA CELLS | Genes involved in Regulation of gene expression in beta cells |
| 0.0 | 0.7 | REACTOME AMINE COMPOUND SLC TRANSPORTERS | Genes involved in Amine compound SLC transporters |
| 0.0 | 0.2 | REACTOME TRYPTOPHAN CATABOLISM | Genes involved in Tryptophan catabolism |
| 0.0 | 1.7 | REACTOME CLASS B 2 SECRETIN FAMILY RECEPTORS | Genes involved in Class B/2 (Secretin family receptors) |
| 0.0 | 0.5 | REACTOME YAP1 AND WWTR1 TAZ STIMULATED GENE EXPRESSION | Genes involved in YAP1- and WWTR1 (TAZ)-stimulated gene expression |
| 0.0 | 0.3 | REACTOME CITRIC ACID CYCLE TCA CYCLE | Genes involved in Citric acid cycle (TCA cycle) |
| 0.0 | 1.1 | REACTOME MRNA SPLICING | Genes involved in mRNA Splicing |
| 0.0 | 1.5 | REACTOME SIGNALING BY PDGF | Genes involved in Signaling by PDGF |
| 0.0 | 0.4 | REACTOME TRANSCRIPTIONAL REGULATION OF WHITE ADIPOCYTE DIFFERENTIATION | Genes involved in Transcriptional Regulation of White Adipocyte Differentiation |
| 0.0 | 1.1 | REACTOME GOLGI ASSOCIATED VESICLE BIOGENESIS | Genes involved in Golgi Associated Vesicle Biogenesis |