| 5.1 |
15.3 |
GO:2000755 |
regulation of phospholipid scramblase activity(GO:1900161) positive regulation of phospholipid scramblase activity(GO:1900163) regulation of glucosylceramide catabolic process(GO:2000752) positive regulation of glucosylceramide catabolic process(GO:2000753) regulation of sphingomyelin catabolic process(GO:2000754) positive regulation of sphingomyelin catabolic process(GO:2000755) |
| 4.4 |
17.4 |
GO:0000738 |
DNA catabolic process, exonucleolytic(GO:0000738) |
| 3.3 |
13.3 |
GO:0050822 |
peptide stabilization(GO:0050822) peptide antigen stabilization(GO:0050823) |
| 3.1 |
9.2 |
GO:0085032 |
modulation of signal transduction in other organism(GO:0044501) modulation by symbiont of host signal transduction pathway(GO:0052027) modulation of signal transduction in other organism involved in symbiotic interaction(GO:0052250) modulation by symbiont of host I-kappaB kinase/NF-kappaB cascade(GO:0085032) |
| 3.0 |
8.9 |
GO:0051040 |
regulation of calcium-independent cell-cell adhesion(GO:0051040) |
| 2.9 |
8.6 |
GO:0046967 |
cytosol to ER transport(GO:0046967) |
| 2.8 |
8.4 |
GO:1901899 |
positive regulation of relaxation of cardiac muscle(GO:1901899) |
| 2.4 |
12.2 |
GO:0033159 |
negative regulation of protein import into nucleus, translocation(GO:0033159) |
| 2.4 |
7.1 |
GO:0043006 |
activation of phospholipase A2 activity by calcium-mediated signaling(GO:0043006) |
| 2.4 |
7.1 |
GO:0061394 |
regulation of transcription from RNA polymerase II promoter in response to arsenic-containing substance(GO:0061394) |
| 2.4 |
11.8 |
GO:0032730 |
positive regulation of interleukin-1 alpha production(GO:0032730) |
| 2.3 |
9.1 |
GO:0046035 |
CMP salvage(GO:0006238) CMP biosynthetic process(GO:0009224) CMP metabolic process(GO:0046035) |
| 2.2 |
8.9 |
GO:0002296 |
T-helper 1 cell lineage commitment(GO:0002296) |
| 2.1 |
14.6 |
GO:2000857 |
positive regulation of mineralocorticoid secretion(GO:2000857) positive regulation of aldosterone secretion(GO:2000860) |
| 2.1 |
8.3 |
GO:1902228 |
positive regulation of odontogenesis of dentin-containing tooth(GO:0042488) mammary gland fat development(GO:0060611) positive regulation of macrophage colony-stimulating factor signaling pathway(GO:1902228) positive regulation of response to macrophage colony-stimulating factor(GO:1903971) positive regulation of cellular response to macrophage colony-stimulating factor stimulus(GO:1903974) positive regulation of microglial cell migration(GO:1904141) |
| 2.0 |
8.1 |
GO:0032954 |
regulation of cytokinetic process(GO:0032954) regulation of mitotic cytokinetic process(GO:1903436) positive regulation of mitotic cytokinetic process(GO:1903438) positive regulation of mitotic cytokinesis(GO:1903490) |
| 2.0 |
11.8 |
GO:0061767 |
negative regulation of lung blood pressure(GO:0061767) |
| 1.9 |
7.6 |
GO:0050925 |
negative regulation of negative chemotaxis(GO:0050925) |
| 1.9 |
7.5 |
GO:0002268 |
follicular dendritic cell differentiation(GO:0002268) |
| 1.9 |
7.5 |
GO:0002541 |
activation of plasma proteins involved in acute inflammatory response(GO:0002541) |
| 1.8 |
5.4 |
GO:1905006 |
negative regulation of epithelial to mesenchymal transition involved in endocardial cushion formation(GO:1905006) |
| 1.7 |
6.9 |
GO:0003409 |
optic cup structural organization(GO:0003409) |
| 1.7 |
18.8 |
GO:1904996 |
positive regulation of leukocyte adhesion to vascular endothelial cell(GO:1904996) |
| 1.6 |
4.9 |
GO:0009720 |
detection of hormone stimulus(GO:0009720) |
| 1.6 |
4.9 |
GO:2000097 |
regulation of smooth muscle cell-matrix adhesion(GO:2000097) |
| 1.6 |
4.7 |
GO:0061182 |
negative regulation of chondrocyte development(GO:0061182) |
| 1.5 |
7.6 |
GO:1900127 |
positive regulation of hyaluronan biosynthetic process(GO:1900127) |
| 1.5 |
4.5 |
GO:1901492 |
positive regulation of lymphangiogenesis(GO:1901492) |
| 1.4 |
2.9 |
GO:0033590 |
response to cobalamin(GO:0033590) |
| 1.4 |
4.1 |
GO:0048250 |
mitochondrial iron ion transport(GO:0048250) |
| 1.4 |
4.1 |
GO:0003221 |
right ventricular cardiac muscle tissue morphogenesis(GO:0003221) |
| 1.3 |
1.3 |
GO:1902669 |
positive regulation of axon guidance(GO:1902669) |
| 1.3 |
9.4 |
GO:0035655 |
interleukin-18-mediated signaling pathway(GO:0035655) |
| 1.3 |
15.9 |
GO:1901740 |
negative regulation of myoblast fusion(GO:1901740) |
| 1.3 |
6.5 |
GO:2000418 |
positive regulation of eosinophil migration(GO:2000418) |
| 1.3 |
11.7 |
GO:0045084 |
positive regulation of interleukin-12 biosynthetic process(GO:0045084) |
| 1.3 |
3.9 |
GO:0045062 |
extrathymic T cell selection(GO:0045062) |
| 1.3 |
3.8 |
GO:0032912 |
negative regulation of transforming growth factor beta2 production(GO:0032912) |
| 1.3 |
6.3 |
GO:0007571 |
age-dependent response to oxidative stress(GO:0001306) age-dependent response to reactive oxygen species(GO:0001315) regulation of systemic arterial blood pressure by acetylcholine(GO:0003068) vasodilation by acetylcholine involved in regulation of systemic arterial blood pressure(GO:0003069) regulation of systemic arterial blood pressure by neurotransmitter(GO:0003070) age-dependent general metabolic decline(GO:0007571) |
| 1.2 |
4.8 |
GO:1990108 |
protein linear deubiquitination(GO:1990108) |
| 1.2 |
3.6 |
GO:2000502 |
negative regulation of natural killer cell chemotaxis(GO:2000502) |
| 1.2 |
3.5 |
GO:0051939 |
gamma-aminobutyric acid import(GO:0051939) |
| 1.2 |
3.5 |
GO:0046521 |
sphingoid catabolic process(GO:0046521) |
| 1.1 |
4.5 |
GO:1904116 |
response to vasopressin(GO:1904116) cellular response to vasopressin(GO:1904117) |
| 1.1 |
6.7 |
GO:0003431 |
growth plate cartilage chondrocyte development(GO:0003431) |
| 1.1 |
4.4 |
GO:0030037 |
actin filament reorganization involved in cell cycle(GO:0030037) |
| 1.1 |
3.3 |
GO:0032289 |
central nervous system myelin formation(GO:0032289) |
| 1.1 |
3.3 |
GO:0014028 |
notochord formation(GO:0014028) |
| 1.1 |
7.6 |
GO:0001705 |
ectoderm formation(GO:0001705) ectodermal cell fate commitment(GO:0001712) |
| 1.1 |
16.8 |
GO:0021796 |
cerebral cortex regionalization(GO:0021796) |
| 1.0 |
2.0 |
GO:0060697 |
positive regulation of phospholipid catabolic process(GO:0060697) |
| 1.0 |
3.0 |
GO:0071224 |
cellular response to peptidoglycan(GO:0071224) |
| 1.0 |
2.9 |
GO:0019364 |
NADP catabolic process(GO:0006742) pyridine nucleotide catabolic process(GO:0019364) |
| 1.0 |
2.0 |
GO:0035419 |
activation of MAPK activity involved in innate immune response(GO:0035419) |
| 1.0 |
1.9 |
GO:0002537 |
nitric oxide production involved in inflammatory response(GO:0002537) |
| 1.0 |
1.0 |
GO:0009826 |
unidimensional cell growth(GO:0009826) |
| 1.0 |
1.9 |
GO:0021823 |
cerebral cortex tangential migration using cell-cell interactions(GO:0021823) postnatal olfactory bulb interneuron migration(GO:0021827) chemorepulsion involved in postnatal olfactory bulb interneuron migration(GO:0021836) |
| 1.0 |
7.6 |
GO:0031444 |
slow-twitch skeletal muscle fiber contraction(GO:0031444) |
| 0.9 |
3.8 |
GO:0043311 |
positive regulation of eosinophil degranulation(GO:0043311) positive regulation of eosinophil activation(GO:1902568) |
| 0.9 |
8.4 |
GO:0070212 |
protein poly-ADP-ribosylation(GO:0070212) |
| 0.9 |
0.9 |
GO:0042323 |
negative regulation of circadian sleep/wake cycle, non-REM sleep(GO:0042323) negative regulation of mucus secretion(GO:0070256) |
| 0.9 |
0.9 |
GO:0003404 |
optic vesicle morphogenesis(GO:0003404) |
| 0.9 |
2.6 |
GO:0016094 |
polyprenol biosynthetic process(GO:0016094) |
| 0.9 |
2.6 |
GO:0038043 |
interleukin-5-mediated signaling pathway(GO:0038043) |
| 0.9 |
10.3 |
GO:0055118 |
negative regulation of cardiac muscle contraction(GO:0055118) |
| 0.8 |
8.4 |
GO:0002480 |
antigen processing and presentation of exogenous peptide antigen via MHC class I, TAP-independent(GO:0002480) |
| 0.8 |
3.3 |
GO:0070982 |
L-asparagine biosynthetic process(GO:0070981) L-asparagine metabolic process(GO:0070982) |
| 0.8 |
4.1 |
GO:0043974 |
histone H3-K27 acetylation(GO:0043974) regulation of histone H3-K27 acetylation(GO:1901674) |
| 0.8 |
5.7 |
GO:0034141 |
positive regulation of toll-like receptor 3 signaling pathway(GO:0034141) |
| 0.8 |
1.6 |
GO:0098712 |
L-glutamate import across plasma membrane(GO:0098712) |
| 0.8 |
2.4 |
GO:2000661 |
positive regulation of interleukin-1-mediated signaling pathway(GO:2000661) |
| 0.8 |
6.3 |
GO:0048743 |
positive regulation of skeletal muscle fiber development(GO:0048743) |
| 0.8 |
3.1 |
GO:0097045 |
phosphatidylserine exposure on blood platelet(GO:0097045) |
| 0.8 |
6.9 |
GO:0035087 |
siRNA loading onto RISC involved in RNA interference(GO:0035087) |
| 0.8 |
0.8 |
GO:0002756 |
MyD88-independent toll-like receptor signaling pathway(GO:0002756) |
| 0.8 |
6.1 |
GO:0070842 |
aggresome assembly(GO:0070842) |
| 0.8 |
2.3 |
GO:0046586 |
regulation of calcium-dependent cell-cell adhesion(GO:0046586) |
| 0.8 |
2.3 |
GO:0003050 |
regulation of systemic arterial blood pressure by atrial natriuretic peptide(GO:0003050) |
| 0.8 |
2.3 |
GO:0038195 |
urokinase plasminogen activator signaling pathway(GO:0038195) |
| 0.8 |
12.9 |
GO:0072619 |
interleukin-21 production(GO:0032625) interleukin-21 secretion(GO:0072619) |
| 0.8 |
8.3 |
GO:0042256 |
mature ribosome assembly(GO:0042256) |
| 0.7 |
0.7 |
GO:1904933 |
regulation of cell proliferation in midbrain(GO:1904933) |
| 0.7 |
0.7 |
GO:1904674 |
positive regulation of somatic stem cell population maintenance(GO:1904674) |
| 0.7 |
1.5 |
GO:0014916 |
regulation of lung blood pressure(GO:0014916) |
| 0.7 |
5.2 |
GO:0010813 |
neuropeptide catabolic process(GO:0010813) |
| 0.7 |
2.2 |
GO:0060458 |
right lung development(GO:0060458) |
| 0.7 |
2.2 |
GO:0003342 |
proepicardium development(GO:0003342) septum transversum development(GO:0003343) |
| 0.7 |
2.9 |
GO:0045763 |
negative regulation of cellular amino acid metabolic process(GO:0045763) |
| 0.7 |
24.6 |
GO:0042347 |
negative regulation of NF-kappaB import into nucleus(GO:0042347) |
| 0.7 |
2.2 |
GO:1904719 |
excitatory chemical synaptic transmission(GO:0098976) regulation of AMPA glutamate receptor clustering(GO:1904717) positive regulation of AMPA glutamate receptor clustering(GO:1904719) |
| 0.7 |
2.2 |
GO:1990764 |
regulation of myofibroblast contraction(GO:1904328) myofibroblast contraction(GO:1990764) |
| 0.7 |
4.3 |
GO:0022614 |
membrane to membrane docking(GO:0022614) |
| 0.7 |
0.7 |
GO:0002408 |
myeloid dendritic cell chemotaxis(GO:0002408) |
| 0.7 |
2.8 |
GO:0090086 |
negative regulation of protein deubiquitination(GO:0090086) |
| 0.7 |
0.7 |
GO:2001180 |
negative regulation of interleukin-10 secretion(GO:2001180) negative regulation of interleukin-12 secretion(GO:2001183) |
| 0.7 |
4.2 |
GO:0061762 |
CAMKK-AMPK signaling cascade(GO:0061762) |
| 0.7 |
2.1 |
GO:0052151 |
positive regulation by symbiont of host apoptotic process(GO:0052151) positive regulation of apoptotic process by virus(GO:0060139) |
| 0.7 |
2.8 |
GO:2000329 |
negative regulation of T-helper 17 cell lineage commitment(GO:2000329) |
| 0.7 |
2.7 |
GO:0031049 |
mesodermal-endodermal cell signaling(GO:0003131) programmed DNA elimination(GO:0031049) chromosome breakage(GO:0031052) histone H2A-S139 phosphorylation(GO:0035978) positive regulation of cellular response to X-ray(GO:2000685) |
| 0.7 |
0.7 |
GO:1904798 |
positive regulation of core promoter binding(GO:1904798) |
| 0.7 |
8.1 |
GO:0032782 |
bile acid secretion(GO:0032782) |
| 0.7 |
2.7 |
GO:1990834 |
response to odorant(GO:1990834) |
| 0.7 |
2.6 |
GO:0001915 |
negative regulation of T cell mediated cytotoxicity(GO:0001915) |
| 0.7 |
5.3 |
GO:0061734 |
parkin-mediated mitophagy in response to mitochondrial depolarization(GO:0061734) |
| 0.7 |
1.3 |
GO:0097252 |
oligodendrocyte apoptotic process(GO:0097252) |
| 0.7 |
2.6 |
GO:1903860 |
negative regulation of dendrite extension(GO:1903860) regulation of neuron remodeling(GO:1904799) negative regulation of neuron remodeling(GO:1904800) negative regulation of branching morphogenesis of a nerve(GO:2000173) |
| 0.7 |
8.5 |
GO:0036155 |
acylglycerol acyl-chain remodeling(GO:0036155) |
| 0.6 |
1.9 |
GO:1902528 |
regulation of protein linear polyubiquitination(GO:1902528) positive regulation of protein linear polyubiquitination(GO:1902530) |
| 0.6 |
0.6 |
GO:0045626 |
negative regulation of T-helper 1 cell differentiation(GO:0045626) |
| 0.6 |
1.9 |
GO:0051463 |
negative regulation of cortisol secretion(GO:0051463) |
| 0.6 |
1.3 |
GO:0045351 |
type I interferon biosynthetic process(GO:0045351) |
| 0.6 |
1.9 |
GO:0035281 |
pre-miRNA export from nucleus(GO:0035281) |
| 0.6 |
1.9 |
GO:0008065 |
establishment of blood-nerve barrier(GO:0008065) |
| 0.6 |
7.0 |
GO:0098870 |
neuronal action potential propagation(GO:0019227) action potential propagation(GO:0098870) |
| 0.6 |
6.3 |
GO:0060020 |
Bergmann glial cell differentiation(GO:0060020) |
| 0.6 |
3.1 |
GO:2000325 |
regulation of ligand-dependent nuclear receptor transcription coactivator activity(GO:2000325) positive regulation of ligand-dependent nuclear receptor transcription coactivator activity(GO:2000327) |
| 0.6 |
1.2 |
GO:0075509 |
receptor-mediated endocytosis of virus by host cell(GO:0019065) endocytosis involved in viral entry into host cell(GO:0075509) |
| 0.6 |
5.0 |
GO:0030578 |
PML body organization(GO:0030578) |
| 0.6 |
3.1 |
GO:2000834 |
androgen secretion(GO:0035935) regulation of androgen secretion(GO:2000834) positive regulation of androgen secretion(GO:2000836) |
| 0.6 |
8.0 |
GO:0021842 |
directional guidance of interneurons involved in migration from the subpallium to the cortex(GO:0021840) chemorepulsion involved in interneuron migration from the subpallium to the cortex(GO:0021842) |
| 0.6 |
3.0 |
GO:0097577 |
intracellular sequestering of iron ion(GO:0006880) sequestering of iron ion(GO:0097577) |
| 0.6 |
3.0 |
GO:0035962 |
response to interleukin-13(GO:0035962) |
| 0.6 |
3.0 |
GO:0071918 |
urea transmembrane transport(GO:0071918) |
| 0.6 |
0.6 |
GO:1905237 |
response to cyclosporin A(GO:1905237) |
| 0.6 |
1.8 |
GO:0045643 |
regulation of eosinophil differentiation(GO:0045643) positive regulation of eosinophil differentiation(GO:0045645) |
| 0.6 |
1.8 |
GO:1902310 |
positive regulation of peptidyl-serine dephosphorylation(GO:1902310) |
| 0.6 |
2.4 |
GO:0009436 |
glyoxylate catabolic process(GO:0009436) |
| 0.6 |
3.5 |
GO:0038172 |
interleukin-33-mediated signaling pathway(GO:0038172) |
| 0.6 |
0.6 |
GO:0032808 |
lacrimal gland development(GO:0032808) |
| 0.6 |
1.2 |
GO:0002879 |
positive regulation of acute inflammatory response to non-antigenic stimulus(GO:0002879) |
| 0.6 |
7.0 |
GO:2001288 |
positive regulation of caveolin-mediated endocytosis(GO:2001288) |
| 0.6 |
5.2 |
GO:2000286 |
receptor internalization involved in canonical Wnt signaling pathway(GO:2000286) |
| 0.6 |
2.3 |
GO:0099558 |
maintenance of synapse structure(GO:0099558) |
| 0.6 |
1.7 |
GO:1903570 |
regulation of protein kinase D signaling(GO:1903570) positive regulation of protein kinase D signaling(GO:1903572) |
| 0.6 |
1.7 |
GO:1902269 |
positive regulation of polyamine transmembrane transport(GO:1902269) |
| 0.6 |
0.6 |
GO:1904862 |
inhibitory synapse assembly(GO:1904862) |
| 0.6 |
3.4 |
GO:0001554 |
luteolysis(GO:0001554) |
| 0.6 |
3.4 |
GO:0042746 |
regulation of circadian sleep/wake cycle, wakefulness(GO:0010840) circadian sleep/wake cycle, wakefulness(GO:0042746) |
| 0.6 |
1.7 |
GO:0071962 |
mitotic sister chromatid cohesion, centromeric(GO:0071962) |
| 0.6 |
3.4 |
GO:0035549 |
positive regulation of interferon-beta secretion(GO:0035549) |
| 0.6 |
0.6 |
GO:0060279 |
positive regulation of ovulation(GO:0060279) |
| 0.6 |
2.8 |
GO:0097527 |
necroptotic signaling pathway(GO:0097527) |
| 0.6 |
2.8 |
GO:0042360 |
vitamin E metabolic process(GO:0042360) |
| 0.6 |
3.9 |
GO:0021957 |
corticospinal tract morphogenesis(GO:0021957) |
| 0.6 |
8.9 |
GO:0045636 |
positive regulation of melanocyte differentiation(GO:0045636) |
| 0.6 |
2.2 |
GO:0072086 |
specification of loop of Henle identity(GO:0072086) |
| 0.6 |
1.7 |
GO:0035054 |
embryonic heart tube anterior/posterior pattern specification(GO:0035054) |
| 0.5 |
2.7 |
GO:0034421 |
post-translational protein acetylation(GO:0034421) |
| 0.5 |
0.5 |
GO:0048242 |
regulation of epinephrine secretion(GO:0014060) epinephrine secretion(GO:0048242) |
| 0.5 |
1.6 |
GO:0036304 |
umbilical cord morphogenesis(GO:0036304) umbilical cord development(GO:0061027) |
| 0.5 |
3.2 |
GO:1903435 |
positive regulation of constitutive secretory pathway(GO:1903435) |
| 0.5 |
1.6 |
GO:0070079 |
peptidyl-lysine hydroxylation to 5-hydroxy-L-lysine(GO:0018395) histone arginine demethylation(GO:0070077) histone H3-R2 demethylation(GO:0070078) histone H4-R3 demethylation(GO:0070079) |
| 0.5 |
2.1 |
GO:0030035 |
microspike assembly(GO:0030035) |
| 0.5 |
1.6 |
GO:0070634 |
transepithelial ammonium transport(GO:0070634) |
| 0.5 |
2.1 |
GO:0060715 |
syncytiotrophoblast cell differentiation involved in labyrinthine layer development(GO:0060715) |
| 0.5 |
1.6 |
GO:0035498 |
carnosine metabolic process(GO:0035498) |
| 0.5 |
1.1 |
GO:0032831 |
regulation of CD4-positive, CD25-positive, alpha-beta regulatory T cell differentiation(GO:0032829) positive regulation of CD4-positive, CD25-positive, alpha-beta regulatory T cell differentiation(GO:0032831) |
| 0.5 |
4.2 |
GO:0032713 |
negative regulation of interleukin-4 production(GO:0032713) |
| 0.5 |
7.8 |
GO:0046007 |
negative regulation of activated T cell proliferation(GO:0046007) |
| 0.5 |
3.1 |
GO:0071105 |
response to interleukin-11(GO:0071105) |
| 0.5 |
3.1 |
GO:0003025 |
regulation of systemic arterial blood pressure by baroreceptor feedback(GO:0003025) |
| 0.5 |
1.5 |
GO:0001544 |
initiation of primordial ovarian follicle growth(GO:0001544) |
| 0.5 |
2.0 |
GO:0002215 |
defense response to nematode(GO:0002215) |
| 0.5 |
1.5 |
GO:1900111 |
positive regulation of histone H3-K9 dimethylation(GO:1900111) |
| 0.5 |
1.5 |
GO:0044691 |
tooth eruption(GO:0044691) |
| 0.5 |
1.5 |
GO:0002339 |
B cell selection(GO:0002339) |
| 0.5 |
1.5 |
GO:0090187 |
positive regulation of pancreatic juice secretion(GO:0090187) |
| 0.5 |
2.0 |
GO:2000687 |
negative regulation of rubidium ion transport(GO:2000681) negative regulation of rubidium ion transmembrane transporter activity(GO:2000687) |
| 0.5 |
1.0 |
GO:0070100 |
negative regulation of chemokine-mediated signaling pathway(GO:0070100) |
| 0.5 |
3.0 |
GO:1903935 |
response to sodium arsenite(GO:1903935) |
| 0.5 |
1.0 |
GO:1901204 |
regulation of adrenergic receptor signaling pathway involved in heart process(GO:1901204) negative regulation of adrenergic receptor signaling pathway involved in heart process(GO:1901205) |
| 0.5 |
2.5 |
GO:0035747 |
natural killer cell chemotaxis(GO:0035747) |
| 0.5 |
1.5 |
GO:0070625 |
zymogen granule exocytosis(GO:0070625) |
| 0.5 |
1.5 |
GO:1903281 |
positive regulation of calcium:sodium antiporter activity(GO:1903281) |
| 0.5 |
1.0 |
GO:0009946 |
proximal/distal axis specification(GO:0009946) |
| 0.5 |
1.5 |
GO:0006478 |
peptidyl-tyrosine sulfation(GO:0006478) |
| 0.5 |
2.4 |
GO:1904398 |
positive regulation of neuromuscular junction development(GO:1904398) |
| 0.5 |
1.0 |
GO:0033387 |
putrescine biosynthetic process from ornithine(GO:0033387) |
| 0.5 |
2.4 |
GO:2001074 |
regulation of metanephric ureteric bud development(GO:2001074) positive regulation of metanephric ureteric bud development(GO:2001076) |
| 0.5 |
1.4 |
GO:0051232 |
meiotic spindle elongation(GO:0051232) meiotic cell cycle process involved in oocyte maturation(GO:1903537) regulation of meiotic cell cycle process involved in oocyte maturation(GO:1903538) |
| 0.5 |
6.7 |
GO:0000290 |
deadenylation-dependent decapping of nuclear-transcribed mRNA(GO:0000290) |
| 0.5 |
1.9 |
GO:0001866 |
NK T cell proliferation(GO:0001866) |
| 0.5 |
9.9 |
GO:0071493 |
cellular response to UV-B(GO:0071493) |
| 0.5 |
2.4 |
GO:0035986 |
senescence-associated heterochromatin focus assembly(GO:0035986) |
| 0.5 |
0.5 |
GO:0036438 |
maintenance of lens transparency(GO:0036438) |
| 0.5 |
0.5 |
GO:0051795 |
positive regulation of catagen(GO:0051795) |
| 0.5 |
0.5 |
GO:1901382 |
chorionic trophoblast cell proliferation(GO:0097360) regulation of chorionic trophoblast cell proliferation(GO:1901382) |
| 0.5 |
1.9 |
GO:2001226 |
negative regulation of chloride transport(GO:2001226) |
| 0.5 |
0.9 |
GO:0070836 |
caveola assembly(GO:0070836) |
| 0.5 |
5.6 |
GO:1900625 |
regulation of monocyte aggregation(GO:1900623) positive regulation of monocyte aggregation(GO:1900625) |
| 0.5 |
2.8 |
GO:1900748 |
positive regulation of vascular endothelial growth factor signaling pathway(GO:1900748) |
| 0.5 |
2.3 |
GO:0032470 |
positive regulation of endoplasmic reticulum calcium ion concentration(GO:0032470) |
| 0.5 |
2.3 |
GO:0001575 |
globoside metabolic process(GO:0001575) |
| 0.5 |
1.8 |
GO:0032747 |
positive regulation of interleukin-23 production(GO:0032747) |
| 0.5 |
3.2 |
GO:2000814 |
regulation of unidimensional cell growth(GO:0051510) negative regulation of unidimensional cell growth(GO:0051511) establishment of cell polarity regulating cell shape(GO:0071964) regulation of establishment or maintenance of cell polarity regulating cell shape(GO:2000769) positive regulation of establishment or maintenance of cell polarity regulating cell shape(GO:2000771) regulation of establishment of cell polarity regulating cell shape(GO:2000782) positive regulation of establishment of cell polarity regulating cell shape(GO:2000784) positive regulation of barbed-end actin filament capping(GO:2000814) |
| 0.5 |
2.7 |
GO:0060370 |
susceptibility to T cell mediated cytotoxicity(GO:0060370) |
| 0.5 |
5.4 |
GO:0071550 |
death-inducing signaling complex assembly(GO:0071550) |
| 0.5 |
1.4 |
GO:0032223 |
negative regulation of synaptic transmission, cholinergic(GO:0032223) neurotransmitter receptor biosynthetic process(GO:0045212) |
| 0.4 |
2.2 |
GO:0021764 |
amygdala development(GO:0021764) |
| 0.4 |
1.3 |
GO:0090176 |
microtubule cytoskeleton organization involved in establishment of planar polarity(GO:0090176) |
| 0.4 |
0.9 |
GO:0032909 |
transforming growth factor beta2 production(GO:0032906) regulation of transforming growth factor beta2 production(GO:0032909) |
| 0.4 |
1.3 |
GO:0021526 |
medial motor column neuron differentiation(GO:0021526) |
| 0.4 |
14.8 |
GO:1902624 |
positive regulation of neutrophil migration(GO:1902624) |
| 0.4 |
0.4 |
GO:0010847 |
regulation of chromatin assembly(GO:0010847) |
| 0.4 |
3.1 |
GO:1903237 |
negative regulation of leukocyte tethering or rolling(GO:1903237) |
| 0.4 |
1.3 |
GO:0043323 |
regulation of natural killer cell degranulation(GO:0043321) positive regulation of natural killer cell degranulation(GO:0043323) |
| 0.4 |
1.8 |
GO:0003350 |
pulmonary myocardium development(GO:0003350) |
| 0.4 |
2.6 |
GO:0035105 |
sterol regulatory element binding protein import into nucleus(GO:0035105) |
| 0.4 |
1.3 |
GO:1902766 |
skeletal muscle satellite cell migration(GO:1902766) |
| 0.4 |
2.6 |
GO:0007296 |
vitellogenesis(GO:0007296) |
| 0.4 |
1.3 |
GO:0060011 |
Sertoli cell proliferation(GO:0060011) |
| 0.4 |
1.3 |
GO:0061026 |
cardiac muscle tissue regeneration(GO:0061026) |
| 0.4 |
0.4 |
GO:1990086 |
lens fiber cell apoptotic process(GO:1990086) |
| 0.4 |
1.3 |
GO:1904692 |
positive regulation of type B pancreatic cell proliferation(GO:1904692) |
| 0.4 |
0.4 |
GO:0001560 |
regulation of cell growth by extracellular stimulus(GO:0001560) |
| 0.4 |
3.4 |
GO:0071315 |
cellular response to morphine(GO:0071315) cellular response to isoquinoline alkaloid(GO:0071317) |
| 0.4 |
1.7 |
GO:0010900 |
negative regulation of phosphatidylcholine catabolic process(GO:0010900) |
| 0.4 |
1.7 |
GO:1901662 |
phylloquinone metabolic process(GO:0042374) phylloquinone catabolic process(GO:0042376) quinone catabolic process(GO:1901662) |
| 0.4 |
2.5 |
GO:0002225 |
positive regulation of antimicrobial peptide production(GO:0002225) positive regulation of antibacterial peptide production(GO:0002803) |
| 0.4 |
6.3 |
GO:0002315 |
marginal zone B cell differentiation(GO:0002315) |
| 0.4 |
0.4 |
GO:0042271 |
susceptibility to natural killer cell mediated cytotoxicity(GO:0042271) |
| 0.4 |
0.4 |
GO:1990785 |
response to water-immersion restraint stress(GO:1990785) |
| 0.4 |
2.5 |
GO:1901097 |
negative regulation of autophagosome maturation(GO:1901097) |
| 0.4 |
1.7 |
GO:0090095 |
regulation of metanephric cap mesenchymal cell proliferation(GO:0090095) positive regulation of metanephric cap mesenchymal cell proliferation(GO:0090096) |
| 0.4 |
1.2 |
GO:0003218 |
cardiac left ventricle formation(GO:0003218) |
| 0.4 |
2.1 |
GO:0010836 |
negative regulation of protein ADP-ribosylation(GO:0010836) |
| 0.4 |
4.1 |
GO:1900223 |
positive regulation of beta-amyloid clearance(GO:1900223) |
| 0.4 |
0.8 |
GO:1900147 |
Schwann cell migration(GO:0036135) regulation of Schwann cell migration(GO:1900147) |
| 0.4 |
6.6 |
GO:0045063 |
T-helper 1 cell differentiation(GO:0045063) |
| 0.4 |
4.1 |
GO:1902866 |
regulation of retina development in camera-type eye(GO:1902866) |
| 0.4 |
2.9 |
GO:0043932 |
ossification involved in bone remodeling(GO:0043932) |
| 0.4 |
2.0 |
GO:0003383 |
apical constriction(GO:0003383) |
| 0.4 |
6.9 |
GO:0042940 |
D-amino acid transport(GO:0042940) |
| 0.4 |
4.5 |
GO:0008635 |
activation of cysteine-type endopeptidase activity involved in apoptotic process by cytochrome c(GO:0008635) |
| 0.4 |
1.6 |
GO:0019072 |
viral genome packaging(GO:0019072) viral RNA genome packaging(GO:0019074) |
| 0.4 |
2.0 |
GO:0033029 |
regulation of neutrophil apoptotic process(GO:0033029) |
| 0.4 |
5.7 |
GO:0045078 |
positive regulation of interferon-gamma biosynthetic process(GO:0045078) |
| 0.4 |
0.8 |
GO:0002361 |
CD4-positive, CD25-positive, alpha-beta regulatory T cell differentiation(GO:0002361) |
| 0.4 |
2.4 |
GO:0035617 |
stress granule disassembly(GO:0035617) |
| 0.4 |
2.0 |
GO:0071802 |
negative regulation of podosome assembly(GO:0071802) |
| 0.4 |
2.8 |
GO:0061052 |
negative regulation of cell growth involved in cardiac muscle cell development(GO:0061052) |
| 0.4 |
5.5 |
GO:1990573 |
potassium ion import across plasma membrane(GO:1990573) |
| 0.4 |
0.4 |
GO:0048817 |
negative regulation of hair follicle maturation(GO:0048817) |
| 0.4 |
1.2 |
GO:0075732 |
viral penetration into host nucleus(GO:0075732) multi-organism nuclear import(GO:1902594) |
| 0.4 |
1.6 |
GO:0035385 |
Roundabout signaling pathway(GO:0035385) |
| 0.4 |
0.8 |
GO:0009750 |
response to fructose(GO:0009750) |
| 0.4 |
1.2 |
GO:0060339 |
negative regulation of type I interferon-mediated signaling pathway(GO:0060339) |
| 0.4 |
1.5 |
GO:0060743 |
epithelial cell maturation involved in prostate gland development(GO:0060743) |
| 0.4 |
6.1 |
GO:0030208 |
dermatan sulfate biosynthetic process(GO:0030208) |
| 0.4 |
1.1 |
GO:0097212 |
lysosomal membrane organization(GO:0097212) |
| 0.4 |
1.5 |
GO:0060414 |
aorta smooth muscle tissue morphogenesis(GO:0060414) |
| 0.4 |
1.1 |
GO:0071930 |
negative regulation of transcription involved in G1/S transition of mitotic cell cycle(GO:0071930) |
| 0.4 |
0.4 |
GO:0034146 |
toll-like receptor 5 signaling pathway(GO:0034146) |
| 0.4 |
0.4 |
GO:1903347 |
negative regulation of bicellular tight junction assembly(GO:1903347) |
| 0.4 |
1.1 |
GO:0002184 |
cytoplasmic translational termination(GO:0002184) |
| 0.4 |
4.2 |
GO:0098914 |
membrane repolarization during atrial cardiac muscle cell action potential(GO:0098914) |
| 0.4 |
0.7 |
GO:0070309 |
lens fiber cell morphogenesis(GO:0070309) |
| 0.4 |
0.4 |
GO:0006679 |
glucosylceramide biosynthetic process(GO:0006679) |
| 0.4 |
1.5 |
GO:0045065 |
cytotoxic T cell differentiation(GO:0045065) |
| 0.4 |
4.8 |
GO:0043249 |
erythrocyte maturation(GO:0043249) |
| 0.4 |
1.1 |
GO:0090222 |
centrosome-templated microtubule nucleation(GO:0090222) |
| 0.4 |
2.6 |
GO:0032439 |
endosome localization(GO:0032439) |
| 0.4 |
1.1 |
GO:0086097 |
phospholipase C-activating angiotensin-activated signaling pathway(GO:0086097) |
| 0.4 |
1.5 |
GO:2001247 |
positive regulation of phosphatidylcholine biosynthetic process(GO:2001247) |
| 0.4 |
0.7 |
GO:0033634 |
positive regulation of cell-cell adhesion mediated by integrin(GO:0033634) |
| 0.4 |
1.8 |
GO:0035359 |
negative regulation of peroxisome proliferator activated receptor signaling pathway(GO:0035359) |
| 0.4 |
3.6 |
GO:0072553 |
terminal button organization(GO:0072553) |
| 0.4 |
2.9 |
GO:0043402 |
glucocorticoid mediated signaling pathway(GO:0043402) |
| 0.4 |
1.8 |
GO:2000382 |
positive regulation of mesoderm development(GO:2000382) |
| 0.4 |
1.1 |
GO:1902941 |
positive regulation of cyclic nucleotide-gated ion channel activity(GO:1902161) regulation of voltage-gated chloride channel activity(GO:1902941) positive regulation of voltage-gated chloride channel activity(GO:1902943) |
| 0.4 |
3.2 |
GO:0014012 |
peripheral nervous system axon regeneration(GO:0014012) |
| 0.4 |
1.1 |
GO:0070352 |
positive regulation of white fat cell proliferation(GO:0070352) |
| 0.4 |
5.0 |
GO:0086103 |
G-protein coupled receptor signaling pathway involved in heart process(GO:0086103) |
| 0.4 |
0.4 |
GO:2000848 |
positive regulation of corticosteroid hormone secretion(GO:2000848) |
| 0.4 |
17.7 |
GO:0007214 |
gamma-aminobutyric acid signaling pathway(GO:0007214) |
| 0.4 |
0.4 |
GO:0021784 |
postganglionic parasympathetic fiber development(GO:0021784) |
| 0.4 |
0.7 |
GO:0071898 |
regulation of estrogen receptor binding(GO:0071898) negative regulation of estrogen receptor binding(GO:0071899) |
| 0.4 |
0.4 |
GO:1904393 |
regulation of skeletal muscle acetylcholine-gated channel clustering(GO:1904393) negative regulation of neuromuscular junction development(GO:1904397) |
| 0.4 |
1.4 |
GO:0044333 |
Wnt signaling pathway involved in digestive tract morphogenesis(GO:0044333) |
| 0.4 |
1.8 |
GO:0071034 |
CUT catabolic process(GO:0071034) CUT metabolic process(GO:0071043) |
| 0.4 |
2.1 |
GO:0006477 |
protein sulfation(GO:0006477) |
| 0.4 |
2.5 |
GO:2000324 |
positive regulation of glucocorticoid receptor signaling pathway(GO:2000324) |
| 0.3 |
1.7 |
GO:0050689 |
negative regulation of defense response to virus by host(GO:0050689) |
| 0.3 |
1.4 |
GO:0098957 |
anterograde axonal transport of mitochondrion(GO:0098957) |
| 0.3 |
1.0 |
GO:0030860 |
regulation of polarized epithelial cell differentiation(GO:0030860) |
| 0.3 |
0.3 |
GO:0048319 |
axial mesoderm morphogenesis(GO:0048319) |
| 0.3 |
0.7 |
GO:1904684 |
negative regulation of metalloendopeptidase activity(GO:1904684) |
| 0.3 |
3.1 |
GO:0038110 |
interleukin-2-mediated signaling pathway(GO:0038110) |
| 0.3 |
2.4 |
GO:0033504 |
floor plate development(GO:0033504) |
| 0.3 |
2.4 |
GO:2001137 |
positive regulation of endocytic recycling(GO:2001137) |
| 0.3 |
0.7 |
GO:0061056 |
sclerotome development(GO:0061056) |
| 0.3 |
0.7 |
GO:1902523 |
positive regulation of protein K63-linked ubiquitination(GO:1902523) |
| 0.3 |
0.7 |
GO:1902953 |
positive regulation of ER to Golgi vesicle-mediated transport(GO:1902953) |
| 0.3 |
1.0 |
GO:0015882 |
L-ascorbic acid transport(GO:0015882) transepithelial L-ascorbic acid transport(GO:0070904) |
| 0.3 |
0.3 |
GO:1903056 |
regulation of melanosome organization(GO:1903056) |
| 0.3 |
1.0 |
GO:0000967 |
endonucleolytic cleavage to generate mature 5'-end of SSU-rRNA from (SSU-rRNA, 5.8S rRNA, LSU-rRNA)(GO:0000472) rRNA 5'-end processing(GO:0000967) ncRNA 5'-end processing(GO:0034471) |
| 0.3 |
3.7 |
GO:2001171 |
positive regulation of ATP biosynthetic process(GO:2001171) |
| 0.3 |
0.7 |
GO:1902218 |
regulation of intrinsic apoptotic signaling pathway in response to osmotic stress(GO:1902218) negative regulation of intrinsic apoptotic signaling pathway in response to osmotic stress(GO:1902219) |
| 0.3 |
0.7 |
GO:1903422 |
negative regulation of synaptic vesicle recycling(GO:1903422) |
| 0.3 |
0.7 |
GO:1904529 |
regulation of actin filament binding(GO:1904529) regulation of actin binding(GO:1904616) |
| 0.3 |
2.0 |
GO:0051012 |
microtubule sliding(GO:0051012) |
| 0.3 |
5.6 |
GO:0046069 |
cGMP catabolic process(GO:0046069) |
| 0.3 |
0.3 |
GO:0043376 |
regulation of CD8-positive, alpha-beta T cell differentiation(GO:0043376) |
| 0.3 |
0.7 |
GO:0035413 |
positive regulation of catenin import into nucleus(GO:0035413) |
| 0.3 |
2.6 |
GO:0015760 |
hexose phosphate transport(GO:0015712) glucose-6-phosphate transport(GO:0015760) |
| 0.3 |
5.9 |
GO:0002523 |
leukocyte migration involved in inflammatory response(GO:0002523) |
| 0.3 |
6.9 |
GO:0008228 |
opsonization(GO:0008228) |
| 0.3 |
5.6 |
GO:0006048 |
UDP-N-acetylglucosamine biosynthetic process(GO:0006048) |
| 0.3 |
1.3 |
GO:1903070 |
negative regulation of ER-associated ubiquitin-dependent protein catabolic process(GO:1903070) |
| 0.3 |
2.3 |
GO:0034349 |
glial cell apoptotic process(GO:0034349) |
| 0.3 |
1.3 |
GO:0043314 |
negative regulation of neutrophil degranulation(GO:0043314) |
| 0.3 |
1.6 |
GO:0046208 |
spermine catabolic process(GO:0046208) |
| 0.3 |
2.3 |
GO:0042117 |
monocyte activation(GO:0042117) |
| 0.3 |
2.6 |
GO:0090166 |
Golgi disassembly(GO:0090166) |
| 0.3 |
2.6 |
GO:1902525 |
regulation of protein monoubiquitination(GO:1902525) |
| 0.3 |
1.0 |
GO:0046108 |
uridine metabolic process(GO:0046108) |
| 0.3 |
1.0 |
GO:0021979 |
hypothalamus cell differentiation(GO:0021979) |
| 0.3 |
1.0 |
GO:1901656 |
glucoside transport(GO:0042946) glycoside transport(GO:1901656) |
| 0.3 |
0.3 |
GO:0034653 |
diterpenoid catabolic process(GO:0016103) retinoic acid catabolic process(GO:0034653) |
| 0.3 |
0.3 |
GO:0045918 |
negative regulation of cytolysis(GO:0045918) |
| 0.3 |
0.6 |
GO:0045054 |
constitutive secretory pathway(GO:0045054) |
| 0.3 |
8.9 |
GO:0031581 |
hemidesmosome assembly(GO:0031581) |
| 0.3 |
4.1 |
GO:1900029 |
positive regulation of ruffle assembly(GO:1900029) |
| 0.3 |
0.6 |
GO:0048311 |
mitochondrion distribution(GO:0048311) |
| 0.3 |
1.0 |
GO:0044278 |
cell wall disruption in other organism(GO:0044278) |
| 0.3 |
0.3 |
GO:0055099 |
response to high density lipoprotein particle(GO:0055099) |
| 0.3 |
1.6 |
GO:0042986 |
positive regulation of amyloid precursor protein biosynthetic process(GO:0042986) |
| 0.3 |
2.8 |
GO:0061484 |
hematopoietic stem cell homeostasis(GO:0061484) |
| 0.3 |
1.2 |
GO:1900738 |
positive regulation of phospholipase C-activating G-protein coupled receptor signaling pathway(GO:1900738) |
| 0.3 |
0.9 |
GO:1900126 |
negative regulation of hyaluronan biosynthetic process(GO:1900126) |
| 0.3 |
0.3 |
GO:0018307 |
enzyme active site formation(GO:0018307) |
| 0.3 |
1.6 |
GO:0035624 |
receptor transactivation(GO:0035624) |
| 0.3 |
2.2 |
GO:0006003 |
fructose 2,6-bisphosphate metabolic process(GO:0006003) |
| 0.3 |
4.9 |
GO:0051601 |
exocyst localization(GO:0051601) |
| 0.3 |
0.6 |
GO:0031860 |
telomeric 3' overhang formation(GO:0031860) |
| 0.3 |
0.6 |
GO:0030910 |
olfactory placode formation(GO:0030910) olfactory placode development(GO:0071698) olfactory placode morphogenesis(GO:0071699) |
| 0.3 |
0.9 |
GO:1901253 |
negative regulation of intracellular transport of viral material(GO:1901253) |
| 0.3 |
2.7 |
GO:0080009 |
mRNA methylation(GO:0080009) |
| 0.3 |
0.9 |
GO:0002774 |
Fc receptor mediated inhibitory signaling pathway(GO:0002774) |
| 0.3 |
1.8 |
GO:1901509 |
regulation of endothelial tube morphogenesis(GO:1901509) |
| 0.3 |
1.2 |
GO:1902100 |
negative regulation of mitotic metaphase/anaphase transition(GO:0045841) mitotic spindle checkpoint(GO:0071174) negative regulation of metaphase/anaphase transition of cell cycle(GO:1902100) |
| 0.3 |
0.9 |
GO:0051821 |
negative regulation of transcription from RNA polymerase II promoter in response to UV-induced DNA damage(GO:0010768) transmission of virus(GO:0019089) dissemination or transmission of symbiont from host(GO:0044007) dissemination or transmission of organism from other organism involved in symbiotic interaction(GO:0051821) |
| 0.3 |
0.9 |
GO:0010992 |
ubiquitin homeostasis(GO:0010992) |
| 0.3 |
0.9 |
GO:1990737 |
response to manganese-induced endoplasmic reticulum stress(GO:1990737) |
| 0.3 |
0.9 |
GO:0060166 |
olfactory pit development(GO:0060166) |
| 0.3 |
3.9 |
GO:0046940 |
nucleoside monophosphate phosphorylation(GO:0046940) |
| 0.3 |
0.3 |
GO:0002589 |
regulation of antigen processing and presentation of peptide antigen via MHC class I(GO:0002589) negative regulation of antigen processing and presentation of peptide antigen via MHC class I(GO:0002590) |
| 0.3 |
0.9 |
GO:0048691 |
modulation by virus of host transcription(GO:0019056) positive regulation of sprouting of injured axon(GO:0048687) positive regulation of axon extension involved in regeneration(GO:0048691) modulation by symbiont of host transcription(GO:0052026) |
| 0.3 |
0.9 |
GO:0070966 |
nuclear-transcribed mRNA catabolic process, no-go decay(GO:0070966) |
| 0.3 |
6.3 |
GO:0019800 |
peptide cross-linking via chondroitin 4-sulfate glycosaminoglycan(GO:0019800) |
| 0.3 |
2.1 |
GO:0016344 |
meiotic chromosome movement towards spindle pole(GO:0016344) |
| 0.3 |
1.5 |
GO:1903588 |
negative regulation of blood vessel endothelial cell proliferation involved in sprouting angiogenesis(GO:1903588) |
| 0.3 |
1.8 |
GO:0055005 |
ventricular cardiac myofibril assembly(GO:0055005) |
| 0.3 |
0.6 |
GO:0060313 |
negative regulation of blood vessel remodeling(GO:0060313) |
| 0.3 |
5.6 |
GO:0048172 |
regulation of short-term neuronal synaptic plasticity(GO:0048172) |
| 0.3 |
3.8 |
GO:0010818 |
T cell chemotaxis(GO:0010818) |
| 0.3 |
1.5 |
GO:0015870 |
acetylcholine transport(GO:0015870) |
| 0.3 |
0.3 |
GO:2001023 |
regulation of response to drug(GO:2001023) |
| 0.3 |
2.3 |
GO:0070995 |
NADPH oxidation(GO:0070995) |
| 0.3 |
0.6 |
GO:0097116 |
gephyrin clustering involved in postsynaptic density assembly(GO:0097116) |
| 0.3 |
1.2 |
GO:0046900 |
tetrahydrofolylpolyglutamate metabolic process(GO:0046900) |
| 0.3 |
2.3 |
GO:0086073 |
bundle of His cell-Purkinje myocyte adhesion involved in cell communication(GO:0086073) |
| 0.3 |
2.0 |
GO:0030259 |
lipid glycosylation(GO:0030259) |
| 0.3 |
2.3 |
GO:0010961 |
cellular magnesium ion homeostasis(GO:0010961) |
| 0.3 |
2.0 |
GO:0050847 |
progesterone receptor signaling pathway(GO:0050847) |
| 0.3 |
0.6 |
GO:0002357 |
defense response to tumor cell(GO:0002357) |
| 0.3 |
1.2 |
GO:0016333 |
morphogenesis of follicular epithelium(GO:0016333) establishment or maintenance of polarity of follicular epithelium(GO:0016334) establishment of planar polarity of follicular epithelium(GO:0042247) |
| 0.3 |
2.0 |
GO:0097680 |
double-strand break repair via classical nonhomologous end joining(GO:0097680) |
| 0.3 |
1.7 |
GO:0039019 |
pronephric nephron development(GO:0039019) |
| 0.3 |
1.2 |
GO:0018199 |
peptidyl-glutamine modification(GO:0018199) |
| 0.3 |
0.6 |
GO:0010902 |
positive regulation of very-low-density lipoprotein particle remodeling(GO:0010902) |
| 0.3 |
2.3 |
GO:0032218 |
riboflavin transport(GO:0032218) |
| 0.3 |
0.9 |
GO:2000275 |
regulation of oxidative phosphorylation uncoupler activity(GO:2000275) |
| 0.3 |
0.3 |
GO:0060309 |
elastin catabolic process(GO:0060309) |
| 0.3 |
0.6 |
GO:0051885 |
positive regulation of anagen(GO:0051885) |
| 0.3 |
1.2 |
GO:0000454 |
snoRNA guided rRNA pseudouridine synthesis(GO:0000454) |
| 0.3 |
1.2 |
GO:0034334 |
adherens junction maintenance(GO:0034334) |
| 0.3 |
1.1 |
GO:0031427 |
response to methotrexate(GO:0031427) |
| 0.3 |
0.6 |
GO:0031394 |
positive regulation of prostaglandin biosynthetic process(GO:0031394) positive regulation of unsaturated fatty acid biosynthetic process(GO:2001280) |
| 0.3 |
1.1 |
GO:1900041 |
negative regulation of interleukin-2 secretion(GO:1900041) |
| 0.3 |
1.1 |
GO:0071409 |
cellular response to cycloheximide(GO:0071409) |
| 0.3 |
0.3 |
GO:0002692 |
negative regulation of cellular extravasation(GO:0002692) |
| 0.3 |
5.1 |
GO:1901750 |
leukotriene D4 metabolic process(GO:1901748) leukotriene D4 biosynthetic process(GO:1901750) |
| 0.3 |
0.6 |
GO:1903862 |
positive regulation of oxidative phosphorylation(GO:1903862) |
| 0.3 |
1.4 |
GO:1904683 |
regulation of metalloendopeptidase activity(GO:1904683) |
| 0.3 |
0.8 |
GO:1903949 |
positive regulation of atrial cardiac muscle cell action potential(GO:1903949) |
| 0.3 |
0.3 |
GO:0044335 |
canonical Wnt signaling pathway involved in neural crest cell differentiation(GO:0044335) |
| 0.3 |
2.0 |
GO:0051121 |
hepoxilin metabolic process(GO:0051121) hepoxilin biosynthetic process(GO:0051122) |
| 0.3 |
2.0 |
GO:0035934 |
corticosterone secretion(GO:0035934) |
| 0.3 |
2.5 |
GO:0042904 |
9-cis-retinoic acid biosynthetic process(GO:0042904) 9-cis-retinoic acid metabolic process(GO:0042905) |
| 0.3 |
5.0 |
GO:0034356 |
NAD biosynthesis via nicotinamide riboside salvage pathway(GO:0034356) |
| 0.3 |
0.5 |
GO:0060710 |
chorio-allantoic fusion(GO:0060710) |
| 0.3 |
0.3 |
GO:0060666 |
dichotomous subdivision of terminal units involved in salivary gland branching(GO:0060666) |
| 0.3 |
4.1 |
GO:0051561 |
positive regulation of mitochondrial calcium ion concentration(GO:0051561) |
| 0.3 |
0.5 |
GO:0021849 |
neuroblast division in subventricular zone(GO:0021849) |
| 0.3 |
4.0 |
GO:0031293 |
membrane protein intracellular domain proteolysis(GO:0031293) |
| 0.3 |
3.0 |
GO:0007252 |
I-kappaB phosphorylation(GO:0007252) |
| 0.3 |
2.7 |
GO:0034116 |
positive regulation of heterotypic cell-cell adhesion(GO:0034116) |
| 0.3 |
2.4 |
GO:0043697 |
dedifferentiation(GO:0043696) cell dedifferentiation(GO:0043697) |
| 0.3 |
0.8 |
GO:0036466 |
synaptic vesicle recycling via endosome(GO:0036466) |
| 0.3 |
0.8 |
GO:0051039 |
histone displacement(GO:0001207) positive regulation of transcription involved in meiotic cell cycle(GO:0051039) |
| 0.3 |
2.1 |
GO:0002175 |
protein localization to paranode region of axon(GO:0002175) |
| 0.3 |
1.1 |
GO:1900827 |
maintenance of protein location in membrane(GO:0072658) maintenance of protein location in plasma membrane(GO:0072660) positive regulation of membrane depolarization during cardiac muscle cell action potential(GO:1900827) |
| 0.3 |
0.5 |
GO:0060369 |
positive regulation of Fc receptor mediated stimulatory signaling pathway(GO:0060369) |
| 0.3 |
0.8 |
GO:0042137 |
sequestering of neurotransmitter(GO:0042137) |
| 0.3 |
1.6 |
GO:0045653 |
negative regulation of megakaryocyte differentiation(GO:0045653) |
| 0.3 |
0.8 |
GO:0048852 |
diencephalon morphogenesis(GO:0048852) |
| 0.3 |
0.5 |
GO:0044771 |
meiotic cell cycle phase transition(GO:0044771) regulation of meiotic cell cycle phase transition(GO:1901993) negative regulation of meiotic cell cycle phase transition(GO:1901994) |
| 0.3 |
0.8 |
GO:1904640 |
response to methionine(GO:1904640) |
| 0.3 |
2.6 |
GO:0050861 |
positive regulation of B cell receptor signaling pathway(GO:0050861) |
| 0.3 |
0.3 |
GO:0043553 |
negative regulation of phosphatidylinositol 3-kinase activity(GO:0043553) |
| 0.3 |
0.5 |
GO:0032304 |
negative regulation of icosanoid secretion(GO:0032304) |
| 0.3 |
0.5 |
GO:0050902 |
leukocyte adhesive activation(GO:0050902) |
| 0.3 |
0.8 |
GO:0007406 |
negative regulation of neuroblast proliferation(GO:0007406) |
| 0.3 |
0.5 |
GO:0070318 |
positive regulation of G0 to G1 transition(GO:0070318) |
| 0.3 |
1.5 |
GO:0002353 |
kinin cascade(GO:0002254) plasma kallikrein-kinin cascade(GO:0002353) |
| 0.3 |
5.6 |
GO:0071294 |
cellular response to zinc ion(GO:0071294) |
| 0.3 |
2.5 |
GO:0021633 |
optic nerve structural organization(GO:0021633) |
| 0.3 |
4.6 |
GO:0030277 |
maintenance of gastrointestinal epithelium(GO:0030277) |
| 0.3 |
2.0 |
GO:0046476 |
galactosylceramide biosynthetic process(GO:0006682) galactolipid biosynthetic process(GO:0019375) glycosylceramide biosynthetic process(GO:0046476) |
| 0.3 |
1.0 |
GO:1901377 |
mycotoxin catabolic process(GO:0043387) aflatoxin catabolic process(GO:0046223) organic heteropentacyclic compound catabolic process(GO:1901377) regulation of glutathione biosynthetic process(GO:1903786) positive regulation of glutathione biosynthetic process(GO:1903788) |
| 0.3 |
2.3 |
GO:0090336 |
positive regulation of brown fat cell differentiation(GO:0090336) |
| 0.3 |
4.3 |
GO:0007196 |
adenylate cyclase-inhibiting G-protein coupled glutamate receptor signaling pathway(GO:0007196) |
| 0.3 |
3.3 |
GO:0048387 |
negative regulation of retinoic acid receptor signaling pathway(GO:0048387) |
| 0.3 |
1.0 |
GO:0045875 |
negative regulation of sister chromatid cohesion(GO:0045875) |
| 0.2 |
3.2 |
GO:2001199 |
negative regulation of dendritic cell differentiation(GO:2001199) |
| 0.2 |
0.7 |
GO:0099566 |
regulation of postsynaptic cytosolic calcium ion concentration(GO:0099566) |
| 0.2 |
2.5 |
GO:0038166 |
angiotensin-activated signaling pathway(GO:0038166) |
| 0.2 |
0.5 |
GO:0003415 |
chondrocyte hypertrophy(GO:0003415) |
| 0.2 |
0.7 |
GO:0014707 |
branchiomeric skeletal muscle development(GO:0014707) |
| 0.2 |
0.2 |
GO:0021555 |
midbrain-hindbrain boundary morphogenesis(GO:0021555) |
| 0.2 |
0.5 |
GO:1901978 |
positive regulation of cell cycle checkpoint(GO:1901978) |
| 0.2 |
1.7 |
GO:0044334 |
canonical Wnt signaling pathway involved in positive regulation of epithelial to mesenchymal transition(GO:0044334) |
| 0.2 |
0.5 |
GO:0021622 |
oculomotor nerve morphogenesis(GO:0021622) oculomotor nerve formation(GO:0021623) |
| 0.2 |
1.2 |
GO:0097296 |
activation of cysteine-type endopeptidase activity involved in apoptotic signaling pathway(GO:0097296) |
| 0.2 |
2.5 |
GO:0032020 |
ISG15-protein conjugation(GO:0032020) |
| 0.2 |
23.8 |
GO:0042590 |
antigen processing and presentation of exogenous peptide antigen via MHC class I(GO:0042590) |
| 0.2 |
2.4 |
GO:0034244 |
negative regulation of transcription elongation from RNA polymerase II promoter(GO:0034244) |
| 0.2 |
1.7 |
GO:0051177 |
meiotic sister chromatid cohesion(GO:0051177) |
| 0.2 |
1.0 |
GO:1901842 |
negative regulation of high voltage-gated calcium channel activity(GO:1901842) |
| 0.2 |
1.0 |
GO:0090427 |
activation of meiosis(GO:0090427) |
| 0.2 |
3.4 |
GO:0051386 |
regulation of neurotrophin TRK receptor signaling pathway(GO:0051386) |
| 0.2 |
0.5 |
GO:0014054 |
positive regulation of gamma-aminobutyric acid secretion(GO:0014054) |
| 0.2 |
5.1 |
GO:0032515 |
negative regulation of phosphoprotein phosphatase activity(GO:0032515) |
| 0.2 |
3.9 |
GO:0045793 |
positive regulation of cell size(GO:0045793) |
| 0.2 |
1.0 |
GO:1904744 |
positive regulation of telomeric DNA binding(GO:1904744) |
| 0.2 |
1.2 |
GO:0019050 |
suppression by virus of host apoptotic process(GO:0019050) modulation by virus of host apoptotic process(GO:0039526) response to cycloheximide(GO:0046898) |
| 0.2 |
1.4 |
GO:0014827 |
intestine smooth muscle contraction(GO:0014827) |
| 0.2 |
2.1 |
GO:2001206 |
positive regulation of osteoclast development(GO:2001206) |
| 0.2 |
1.0 |
GO:0090131 |
mesenchyme migration(GO:0090131) |
| 0.2 |
0.7 |
GO:1905150 |
regulation of voltage-gated sodium channel activity(GO:1905150) |
| 0.2 |
0.7 |
GO:0034769 |
basement membrane disassembly(GO:0034769) |
| 0.2 |
1.7 |
GO:0071420 |
cellular response to histamine(GO:0071420) |
| 0.2 |
0.7 |
GO:0009608 |
response to symbiont(GO:0009608) response to symbiotic bacterium(GO:0009609) positive regulation of fibril organization(GO:1902905) |
| 0.2 |
4.3 |
GO:1904251 |
regulation of bile acid metabolic process(GO:1904251) |
| 0.2 |
0.9 |
GO:0090156 |
cellular sphingolipid homeostasis(GO:0090156) |
| 0.2 |
1.4 |
GO:0060356 |
leucine import(GO:0060356) |
| 0.2 |
0.5 |
GO:2000437 |
regulation of monocyte extravasation(GO:2000437) positive regulation of monocyte extravasation(GO:2000439) |
| 0.2 |
0.7 |
GO:0021965 |
spinal cord ventral commissure morphogenesis(GO:0021965) |
| 0.2 |
0.7 |
GO:0035573 |
N-terminal protein amino acid methylation(GO:0006480) N-terminal peptidyl-alanine methylation(GO:0018011) N-terminal peptidyl-alanine trimethylation(GO:0018012) N-terminal peptidyl-glycine methylation(GO:0018013) N-terminal peptidyl-proline dimethylation(GO:0018016) peptidyl-alanine modification(GO:0018194) N-terminal peptidyl-proline methylation(GO:0035568) N-terminal peptidyl-serine methylation(GO:0035570) N-terminal peptidyl-serine dimethylation(GO:0035572) N-terminal peptidyl-serine trimethylation(GO:0035573) |
| 0.2 |
0.5 |
GO:0035425 |
autocrine signaling(GO:0035425) |
| 0.2 |
1.2 |
GO:0071494 |
cellular response to UV-C(GO:0071494) |
| 0.2 |
0.2 |
GO:0060057 |
apoptotic process involved in mammary gland involution(GO:0060057) positive regulation of apoptotic process involved in mammary gland involution(GO:0060058) positive regulation of apoptotic process involved in morphogenesis(GO:1902339) regulation of mammary gland involution(GO:1903519) positive regulation of mammary gland involution(GO:1903521) positive regulation of apoptotic process involved in development(GO:1904747) |
| 0.2 |
0.7 |
GO:0045629 |
negative regulation of T-helper 2 cell differentiation(GO:0045629) |
| 0.2 |
0.7 |
GO:0043497 |
regulation of protein heterodimerization activity(GO:0043497) |
| 0.2 |
0.7 |
GO:1901165 |
positive regulation of trophoblast cell migration(GO:1901165) |
| 0.2 |
1.6 |
GO:1903859 |
regulation of dendrite extension(GO:1903859) positive regulation of dendrite extension(GO:1903861) |
| 0.2 |
1.2 |
GO:0045204 |
MAPK export from nucleus(GO:0045204) |
| 0.2 |
0.2 |
GO:0019262 |
N-acetylneuraminate catabolic process(GO:0019262) |
| 0.2 |
2.5 |
GO:0045217 |
cell-cell junction maintenance(GO:0045217) |
| 0.2 |
0.7 |
GO:0060907 |
positive regulation of macrophage cytokine production(GO:0060907) |
| 0.2 |
0.5 |
GO:1905033 |
positive regulation of voltage-gated potassium channel activity involved in ventricular cardiac muscle cell action potential repolarization(GO:1903762) positive regulation of ventricular cardiac muscle cell action potential(GO:1903947) positive regulation of membrane repolarization during ventricular cardiac muscle cell action potential(GO:1905026) positive regulation of membrane repolarization during cardiac muscle cell action potential(GO:1905033) |
| 0.2 |
3.9 |
GO:0051256 |
mitotic spindle midzone assembly(GO:0051256) |
| 0.2 |
0.9 |
GO:0002018 |
renin-angiotensin regulation of aldosterone production(GO:0002018) |
| 0.2 |
0.2 |
GO:1901896 |
positive regulation of calcium-transporting ATPase activity(GO:1901896) |
| 0.2 |
1.4 |
GO:0031438 |
negative regulation of mRNA cleavage(GO:0031438) negative regulation of mRNA endonucleolytic cleavage involved in unfolded protein response(GO:1904721) |
| 0.2 |
3.0 |
GO:0035095 |
behavioral response to nicotine(GO:0035095) |
| 0.2 |
1.8 |
GO:0031053 |
primary miRNA processing(GO:0031053) |
| 0.2 |
3.6 |
GO:0006878 |
cellular copper ion homeostasis(GO:0006878) |
| 0.2 |
2.0 |
GO:1901552 |
positive regulation of endothelial cell development(GO:1901552) positive regulation of establishment of endothelial barrier(GO:1903142) |
| 0.2 |
0.9 |
GO:2000484 |
positive regulation of interleukin-8 secretion(GO:2000484) |
| 0.2 |
0.9 |
GO:0035522 |
monoubiquitinated histone deubiquitination(GO:0035521) monoubiquitinated histone H2A deubiquitination(GO:0035522) |
| 0.2 |
0.2 |
GO:0031335 |
regulation of sulfur amino acid metabolic process(GO:0031335) regulation of homocysteine metabolic process(GO:0050666) |
| 0.2 |
2.9 |
GO:0031274 |
positive regulation of pseudopodium assembly(GO:0031274) |
| 0.2 |
0.7 |
GO:1901052 |
sarcosine metabolic process(GO:1901052) sarcosine catabolic process(GO:1901053) |
| 0.2 |
3.8 |
GO:0007021 |
tubulin complex assembly(GO:0007021) |
| 0.2 |
1.1 |
GO:0072396 |
response to cell cycle checkpoint signaling(GO:0072396) response to DNA integrity checkpoint signaling(GO:0072402) response to DNA damage checkpoint signaling(GO:0072423) |
| 0.2 |
1.1 |
GO:0072675 |
multinuclear osteoclast differentiation(GO:0072674) osteoclast fusion(GO:0072675) |
| 0.2 |
1.1 |
GO:0033632 |
regulation of cell-cell adhesion mediated by integrin(GO:0033632) |
| 0.2 |
0.7 |
GO:0015840 |
urea transport(GO:0015840) |
| 0.2 |
0.4 |
GO:0060903 |
positive regulation of meiosis I(GO:0060903) |
| 0.2 |
6.8 |
GO:0070423 |
nucleotide-binding oligomerization domain containing signaling pathway(GO:0070423) |
| 0.2 |
1.8 |
GO:0034773 |
histone H4-K20 trimethylation(GO:0034773) |
| 0.2 |
2.0 |
GO:0042670 |
retinal cone cell differentiation(GO:0042670) retinal cone cell development(GO:0046549) |
| 0.2 |
0.4 |
GO:0016198 |
axon choice point recognition(GO:0016198) |
| 0.2 |
1.5 |
GO:0044146 |
negative regulation of growth of symbiont involved in interaction with host(GO:0044146) |
| 0.2 |
1.5 |
GO:2000587 |
negative regulation of platelet-derived growth factor receptor-beta signaling pathway(GO:2000587) |
| 0.2 |
0.2 |
GO:0072513 |
positive regulation of secondary heart field cardioblast proliferation(GO:0072513) |
| 0.2 |
1.1 |
GO:0044314 |
protein K27-linked ubiquitination(GO:0044314) |
| 0.2 |
0.4 |
GO:0032764 |
negative regulation of mast cell cytokine production(GO:0032764) |
| 0.2 |
0.6 |
GO:0070676 |
intralumenal vesicle formation(GO:0070676) |
| 0.2 |
0.9 |
GO:0045651 |
positive regulation of macrophage differentiation(GO:0045651) |
| 0.2 |
0.6 |
GO:0002322 |
B cell proliferation involved in immune response(GO:0002322) |
| 0.2 |
0.6 |
GO:1900042 |
positive regulation of interleukin-2 secretion(GO:1900042) |
| 0.2 |
4.3 |
GO:0021681 |
cerebellar granular layer development(GO:0021681) |
| 0.2 |
0.8 |
GO:0032650 |
regulation of interleukin-1 alpha production(GO:0032650) |
| 0.2 |
1.5 |
GO:1903912 |
negative regulation of endoplasmic reticulum stress-induced eIF2 alpha phosphorylation(GO:1903912) |
| 0.2 |
0.6 |
GO:0035574 |
histone H4-K20 demethylation(GO:0035574) |
| 0.2 |
0.4 |
GO:0043950 |
positive regulation of cAMP-mediated signaling(GO:0043950) |
| 0.2 |
1.0 |
GO:0031120 |
snRNA pseudouridine synthesis(GO:0031120) |
| 0.2 |
0.2 |
GO:0001834 |
trophectodermal cell proliferation(GO:0001834) |
| 0.2 |
2.7 |
GO:0033601 |
positive regulation of mammary gland epithelial cell proliferation(GO:0033601) |
| 0.2 |
2.5 |
GO:0034720 |
histone H3-K4 demethylation(GO:0034720) |
| 0.2 |
1.2 |
GO:0060028 |
convergent extension involved in axis elongation(GO:0060028) |
| 0.2 |
0.4 |
GO:0046110 |
xanthine metabolic process(GO:0046110) |
| 0.2 |
1.0 |
GO:0035881 |
amacrine cell differentiation(GO:0035881) |
| 0.2 |
0.6 |
GO:0001732 |
formation of cytoplasmic translation initiation complex(GO:0001732) |
| 0.2 |
1.6 |
GO:0007197 |
adenylate cyclase-inhibiting G-protein coupled acetylcholine receptor signaling pathway(GO:0007197) |
| 0.2 |
6.4 |
GO:0035590 |
purinergic nucleotide receptor signaling pathway(GO:0035590) |
| 0.2 |
0.2 |
GO:0071393 |
cellular response to progesterone stimulus(GO:0071393) |
| 0.2 |
1.4 |
GO:0000255 |
allantoin metabolic process(GO:0000255) |
| 0.2 |
0.4 |
GO:0021529 |
spinal cord oligodendrocyte cell differentiation(GO:0021529) spinal cord oligodendrocyte cell fate specification(GO:0021530) |
| 0.2 |
2.5 |
GO:0035092 |
sperm chromatin condensation(GO:0035092) |
| 0.2 |
1.2 |
GO:0001996 |
positive regulation of heart rate by epinephrine-norepinephrine(GO:0001996) |
| 0.2 |
1.0 |
GO:0060700 |
regulation of ribonuclease activity(GO:0060700) |
| 0.2 |
0.2 |
GO:0051595 |
response to methylglyoxal(GO:0051595) |
| 0.2 |
1.2 |
GO:1903377 |
negative regulation of oxidative stress-induced neuron intrinsic apoptotic signaling pathway(GO:1903377) |
| 0.2 |
0.8 |
GO:0048549 |
positive regulation of pinocytosis(GO:0048549) |
| 0.2 |
1.6 |
GO:0061737 |
leukotriene signaling pathway(GO:0061737) |
| 0.2 |
0.6 |
GO:0001545 |
primary ovarian follicle growth(GO:0001545) |
| 0.2 |
2.4 |
GO:1904869 |
regulation of protein localization to Cajal body(GO:1904869) positive regulation of protein localization to Cajal body(GO:1904871) |
| 0.2 |
5.8 |
GO:0031954 |
positive regulation of protein autophosphorylation(GO:0031954) |
| 0.2 |
1.0 |
GO:0030581 |
intracellular transport of viral protein in host cell(GO:0019060) symbiont intracellular protein transport in host(GO:0030581) intracellular protein transport in other organism involved in symbiotic interaction(GO:0051708) |
| 0.2 |
0.6 |
GO:0015785 |
UDP-galactose transport(GO:0015785) UDP-galactose transmembrane transport(GO:0072334) |
| 0.2 |
1.0 |
GO:1903069 |
regulation of ER-associated ubiquitin-dependent protein catabolic process(GO:1903069) positive regulation of ER-associated ubiquitin-dependent protein catabolic process(GO:1903071) |
| 0.2 |
0.6 |
GO:0033078 |
extrathymic T cell differentiation(GO:0033078) |
| 0.2 |
4.4 |
GO:0042753 |
positive regulation of circadian rhythm(GO:0042753) |
| 0.2 |
3.2 |
GO:0051292 |
nuclear pore complex assembly(GO:0051292) |
| 0.2 |
1.0 |
GO:0008295 |
spermidine biosynthetic process(GO:0008295) |
| 0.2 |
1.0 |
GO:0048680 |
positive regulation of axon regeneration(GO:0048680) |
| 0.2 |
2.0 |
GO:0002475 |
antigen processing and presentation via MHC class Ib(GO:0002475) antigen processing and presentation of lipid antigen via MHC class Ib(GO:0048003) antigen processing and presentation, exogenous lipid antigen via MHC class Ib(GO:0048007) |
| 0.2 |
0.6 |
GO:0042357 |
thiamine diphosphate metabolic process(GO:0042357) |
| 0.2 |
1.2 |
GO:0060988 |
lipid tube assembly(GO:0060988) |
| 0.2 |
1.4 |
GO:0010460 |
positive regulation of heart rate(GO:0010460) |
| 0.2 |
0.8 |
GO:2000313 |
fibroblast growth factor receptor signaling pathway involved in neural plate anterior/posterior pattern formation(GO:0060825) regulation of neural crest formation(GO:0090299) negative regulation of neural crest formation(GO:0090301) regulation of fibroblast growth factor receptor signaling pathway involved in neural plate anterior/posterior pattern formation(GO:2000313) negative regulation of fibroblast growth factor receptor signaling pathway involved in neural plate anterior/posterior pattern formation(GO:2000314) |
| 0.2 |
1.0 |
GO:0010763 |
positive regulation of fibroblast migration(GO:0010763) |
| 0.2 |
6.8 |
GO:0044458 |
motile cilium assembly(GO:0044458) |
| 0.2 |
0.6 |
GO:0080154 |
regulation of fertilization(GO:0080154) |
| 0.2 |
0.4 |
GO:0032849 |
positive regulation of cellular pH reduction(GO:0032849) |
| 0.2 |
0.4 |
GO:0036166 |
phenotypic switching(GO:0036166) regulation of phenotypic switching(GO:1900239) |
| 0.2 |
1.0 |
GO:0048664 |
neuron fate determination(GO:0048664) |
| 0.2 |
0.8 |
GO:0009822 |
alkaloid catabolic process(GO:0009822) |
| 0.2 |
0.9 |
GO:0009111 |
vitamin catabolic process(GO:0009111) |
| 0.2 |
0.6 |
GO:0019676 |
ammonia assimilation cycle(GO:0019676) |
| 0.2 |
7.4 |
GO:1900739 |
regulation of protein insertion into mitochondrial membrane involved in apoptotic signaling pathway(GO:1900739) positive regulation of protein insertion into mitochondrial membrane involved in apoptotic signaling pathway(GO:1900740) |
| 0.2 |
3.0 |
GO:0010839 |
negative regulation of keratinocyte proliferation(GO:0010839) |
| 0.2 |
0.2 |
GO:0034128 |
negative regulation of MyD88-independent toll-like receptor signaling pathway(GO:0034128) |
| 0.2 |
0.6 |
GO:0050928 |
negative regulation of positive chemotaxis(GO:0050928) |
| 0.2 |
0.6 |
GO:0071947 |
protein deubiquitination involved in ubiquitin-dependent protein catabolic process(GO:0071947) |
| 0.2 |
1.3 |
GO:0038165 |
oncostatin-M-mediated signaling pathway(GO:0038165) |
| 0.2 |
2.2 |
GO:0031665 |
negative regulation of lipopolysaccharide-mediated signaling pathway(GO:0031665) |
| 0.2 |
0.2 |
GO:1900154 |
regulation of bone trabecula formation(GO:1900154) negative regulation of bone trabecula formation(GO:1900155) |
| 0.2 |
0.6 |
GO:1903251 |
multi-ciliated epithelial cell differentiation(GO:1903251) |
| 0.2 |
1.1 |
GO:0075525 |
viral translational termination-reinitiation(GO:0075525) |
| 0.2 |
0.4 |
GO:0090237 |
regulation of arachidonic acid secretion(GO:0090237) |
| 0.2 |
0.7 |
GO:0042450 |
arginine biosynthetic process via ornithine(GO:0042450) |
| 0.2 |
0.4 |
GO:0021834 |
chemorepulsion involved in embryonic olfactory bulb interneuron precursor migration(GO:0021834) |
| 0.2 |
0.4 |
GO:0060528 |
secretory columnal luminar epithelial cell differentiation involved in prostate glandular acinus development(GO:0060528) |
| 0.2 |
0.4 |
GO:0097051 |
establishment of protein localization to endoplasmic reticulum membrane(GO:0097051) |
| 0.2 |
0.2 |
GO:0090526 |
regulation of gluconeogenesis involved in cellular glucose homeostasis(GO:0090526) |
| 0.2 |
2.3 |
GO:0032780 |
negative regulation of ATPase activity(GO:0032780) |
| 0.2 |
0.9 |
GO:0034227 |
tRNA thio-modification(GO:0034227) |
| 0.2 |
5.2 |
GO:1903204 |
negative regulation of oxidative stress-induced neuron death(GO:1903204) |
| 0.2 |
6.6 |
GO:0050832 |
defense response to fungus(GO:0050832) |
| 0.2 |
0.5 |
GO:2000110 |
negative regulation of macrophage apoptotic process(GO:2000110) |
| 0.2 |
1.8 |
GO:0043951 |
negative regulation of cAMP-mediated signaling(GO:0043951) |
| 0.2 |
1.8 |
GO:0061087 |
positive regulation of histone H3-K27 methylation(GO:0061087) |
| 0.2 |
0.5 |
GO:0001828 |
inner cell mass cellular morphogenesis(GO:0001828) |
| 0.2 |
2.3 |
GO:0070445 |
oligodendrocyte progenitor proliferation(GO:0070444) regulation of oligodendrocyte progenitor proliferation(GO:0070445) |
| 0.2 |
1.9 |
GO:2001204 |
regulation of osteoclast development(GO:2001204) |
| 0.2 |
0.7 |
GO:0036269 |
swimming behavior(GO:0036269) |
| 0.2 |
0.4 |
GO:0045085 |
negative regulation of interleukin-2 biosynthetic process(GO:0045085) |
| 0.2 |
1.1 |
GO:1900038 |
negative regulation of cellular response to hypoxia(GO:1900038) |
| 0.2 |
0.7 |
GO:0045836 |
positive regulation of meiotic nuclear division(GO:0045836) |
| 0.2 |
0.7 |
GO:0042713 |
sperm ejaculation(GO:0042713) |
| 0.2 |
1.4 |
GO:2000304 |
positive regulation of sphingolipid biosynthetic process(GO:0090154) positive regulation of ceramide biosynthetic process(GO:2000304) |
| 0.2 |
0.3 |
GO:0048241 |
epinephrine transport(GO:0048241) |
| 0.2 |
4.0 |
GO:0030033 |
microvillus assembly(GO:0030033) |
| 0.2 |
1.0 |
GO:0036480 |
neuron intrinsic apoptotic signaling pathway in response to oxidative stress(GO:0036480) regulation of oxidative stress-induced neuron intrinsic apoptotic signaling pathway(GO:1903376) positive regulation of oxidative stress-induced neuron intrinsic apoptotic signaling pathway(GO:1903378) |
| 0.2 |
0.3 |
GO:0003095 |
pressure natriuresis(GO:0003095) |
| 0.2 |
0.7 |
GO:0034628 |
nicotinamide nucleotide biosynthetic process from aspartate(GO:0019355) 'de novo' NAD biosynthetic process from aspartate(GO:0034628) |
| 0.2 |
0.7 |
GO:0070378 |
positive regulation of ERK5 cascade(GO:0070378) |
| 0.2 |
0.5 |
GO:0070105 |
regulation of interleukin-6-mediated signaling pathway(GO:0070103) positive regulation of interleukin-6-mediated signaling pathway(GO:0070105) |
| 0.2 |
3.1 |
GO:0032060 |
bleb assembly(GO:0032060) |
| 0.2 |
0.2 |
GO:0070898 |
RNA polymerase III transcriptional preinitiation complex assembly(GO:0070898) |
| 0.2 |
2.6 |
GO:0071578 |
zinc II ion transmembrane import(GO:0071578) |
| 0.2 |
0.9 |
GO:0043456 |
regulation of pentose-phosphate shunt(GO:0043456) |
| 0.2 |
0.2 |
GO:0015670 |
carbon dioxide transport(GO:0015670) |
| 0.2 |
1.2 |
GO:0046061 |
dATP catabolic process(GO:0046061) |
| 0.2 |
1.0 |
GO:1902731 |
negative regulation of chondrocyte proliferation(GO:1902731) |
| 0.2 |
0.5 |
GO:0010224 |
response to UV-B(GO:0010224) |
| 0.2 |
16.3 |
GO:0006890 |
retrograde vesicle-mediated transport, Golgi to ER(GO:0006890) |
| 0.2 |
1.0 |
GO:2000773 |
negative regulation of cellular senescence(GO:2000773) |
| 0.2 |
0.7 |
GO:0034445 |
regulation of plasma lipoprotein particle oxidation(GO:0034444) negative regulation of plasma lipoprotein particle oxidation(GO:0034445) |
| 0.2 |
1.2 |
GO:0097623 |
potassium ion export across plasma membrane(GO:0097623) |
| 0.2 |
1.3 |
GO:0000012 |
single strand break repair(GO:0000012) |
| 0.2 |
0.5 |
GO:0071486 |
cellular response to light intensity(GO:0071484) cellular response to high light intensity(GO:0071486) retinal rod cell apoptotic process(GO:0097473) retinal cell apoptotic process(GO:1990009) |
| 0.2 |
0.5 |
GO:0039534 |
negative regulation of MDA-5 signaling pathway(GO:0039534) |
| 0.2 |
3.0 |
GO:0098911 |
regulation of ventricular cardiac muscle cell action potential(GO:0098911) |
| 0.2 |
0.8 |
GO:0042776 |
mitochondrial ATP synthesis coupled proton transport(GO:0042776) |
| 0.2 |
0.3 |
GO:0072641 |
type I interferon secretion(GO:0072641) |
| 0.2 |
1.0 |
GO:0010815 |
bradykinin catabolic process(GO:0010815) |
| 0.2 |
0.7 |
GO:0032241 |
positive regulation of nucleobase-containing compound transport(GO:0032241) |
| 0.2 |
0.3 |
GO:0046730 |
induction by symbiont of host defense response(GO:0044416) induction of host immune response by virus(GO:0046730) active induction of host immune response by virus(GO:0046732) modulation by symbiont of host defense response(GO:0052031) induction by organism of defense response of other organism involved in symbiotic interaction(GO:0052251) modulation by organism of defense response of other organism involved in symbiotic interaction(GO:0052255) positive regulation by symbiont of host defense response(GO:0052509) positive regulation by organism of defense response of other organism involved in symbiotic interaction(GO:0052510) modulation by organism of immune response of other organism involved in symbiotic interaction(GO:0052552) modulation by symbiont of host immune response(GO:0052553) modulation by virus of host immune response(GO:0075528) |
| 0.2 |
1.3 |
GO:0042797 |
5S class rRNA transcription from RNA polymerase III type 1 promoter(GO:0042791) tRNA transcription from RNA polymerase III promoter(GO:0042797) |
| 0.2 |
0.3 |
GO:1901857 |
positive regulation of cellular respiration(GO:1901857) |
| 0.2 |
0.5 |
GO:0090230 |
regulation of centromere complex assembly(GO:0090230) |
| 0.2 |
1.8 |
GO:0006054 |
N-acetylneuraminate metabolic process(GO:0006054) |
| 0.2 |
0.2 |
GO:0033152 |
immunoglobulin V(D)J recombination(GO:0033152) |
| 0.2 |
0.2 |
GO:0043313 |
regulation of neutrophil degranulation(GO:0043313) |
| 0.2 |
2.3 |
GO:0006883 |
cellular sodium ion homeostasis(GO:0006883) |
| 0.2 |
0.8 |
GO:0046689 |
response to mercury ion(GO:0046689) |
| 0.2 |
0.5 |
GO:1902283 |
negative regulation of primary amine oxidase activity(GO:1902283) |
| 0.2 |
1.3 |
GO:1901741 |
positive regulation of myoblast fusion(GO:1901741) |
| 0.2 |
0.3 |
GO:0097278 |
complement-dependent cytotoxicity(GO:0097278) regulation of complement-dependent cytotoxicity(GO:1903659) |
| 0.2 |
0.5 |
GO:0015855 |
pyrimidine nucleobase transport(GO:0015855) purine nucleobase transmembrane transport(GO:1904823) |
| 0.2 |
0.6 |
GO:0002483 |
antigen processing and presentation of endogenous peptide antigen(GO:0002483) |
| 0.2 |
1.1 |
GO:0045743 |
positive regulation of fibroblast growth factor receptor signaling pathway(GO:0045743) |
| 0.2 |
5.3 |
GO:1901998 |
toxin transport(GO:1901998) |
| 0.2 |
0.3 |
GO:0045590 |
negative regulation of regulatory T cell differentiation(GO:0045590) |
| 0.2 |
0.5 |
GO:0090258 |
negative regulation of mitochondrial fission(GO:0090258) |
| 0.2 |
3.1 |
GO:0032211 |
negative regulation of telomere maintenance via telomerase(GO:0032211) |
| 0.2 |
1.8 |
GO:0021854 |
hypothalamus development(GO:0021854) |
| 0.2 |
0.3 |
GO:2000403 |
positive regulation of lymphocyte migration(GO:2000403) |
| 0.2 |
0.3 |
GO:0046203 |
spermidine catabolic process(GO:0046203) |
| 0.2 |
0.2 |
GO:1900673 |
olefin metabolic process(GO:1900673) |
| 0.2 |
0.6 |
GO:0097531 |
mast cell chemotaxis(GO:0002551) mast cell migration(GO:0097531) |
| 0.2 |
2.4 |
GO:0000244 |
spliceosomal tri-snRNP complex assembly(GO:0000244) |
| 0.2 |
0.5 |
GO:0007174 |
epidermal growth factor catabolic process(GO:0007174) |
| 0.2 |
0.2 |
GO:0035089 |
establishment of apical/basal cell polarity(GO:0035089) |
| 0.2 |
0.5 |
GO:0035063 |
nuclear speck organization(GO:0035063) |
| 0.2 |
0.5 |
GO:0008355 |
olfactory learning(GO:0008355) |
| 0.2 |
0.2 |
GO:0061162 |
establishment of monopolar cell polarity(GO:0061162) |
| 0.2 |
0.6 |
GO:2000158 |
positive regulation of ubiquitin-specific protease activity(GO:2000158) |
| 0.2 |
0.3 |
GO:0045819 |
positive regulation of glycogen catabolic process(GO:0045819) |
| 0.2 |
0.3 |
GO:1901894 |
regulation of calcium-transporting ATPase activity(GO:1901894) |
| 0.2 |
0.3 |
GO:1901355 |
response to rapamycin(GO:1901355) |
| 0.2 |
2.2 |
GO:1902222 |
L-phenylalanine metabolic process(GO:0006558) L-phenylalanine catabolic process(GO:0006559) erythrose 4-phosphate/phosphoenolpyruvate family amino acid metabolic process(GO:1902221) erythrose 4-phosphate/phosphoenolpyruvate family amino acid catabolic process(GO:1902222) |
| 0.2 |
0.6 |
GO:0048630 |
skeletal muscle tissue growth(GO:0048630) |
| 0.2 |
0.6 |
GO:0010759 |
positive regulation of macrophage chemotaxis(GO:0010759) |
| 0.2 |
0.5 |
GO:0070407 |
oxidation-dependent protein catabolic process(GO:0070407) |
| 0.2 |
1.2 |
GO:0043248 |
proteasome assembly(GO:0043248) |
| 0.2 |
1.1 |
GO:1902259 |
regulation of delayed rectifier potassium channel activity(GO:1902259) |
| 0.2 |
0.9 |
GO:0006642 |
triglyceride mobilization(GO:0006642) |
| 0.2 |
0.5 |
GO:1903232 |
melanosome assembly(GO:1903232) |
| 0.2 |
0.6 |
GO:0038161 |
prolactin signaling pathway(GO:0038161) |
| 0.2 |
0.5 |
GO:1904732 |
regulation of electron carrier activity(GO:1904732) |
| 0.2 |
1.1 |
GO:0060478 |
acrosomal vesicle exocytosis(GO:0060478) |
| 0.2 |
5.6 |
GO:0090383 |
phagosome acidification(GO:0090383) |
| 0.2 |
0.3 |
GO:1904204 |
regulation of skeletal muscle hypertrophy(GO:1904204) |
| 0.2 |
0.6 |
GO:0016098 |
monoterpenoid metabolic process(GO:0016098) |
| 0.2 |
1.7 |
GO:0033689 |
negative regulation of osteoblast proliferation(GO:0033689) |
| 0.2 |
0.2 |
GO:0032425 |
positive regulation of mismatch repair(GO:0032425) |
| 0.2 |
1.5 |
GO:0031642 |
negative regulation of myelination(GO:0031642) |
| 0.1 |
0.4 |
GO:0032727 |
positive regulation of interferon-alpha production(GO:0032727) |
| 0.1 |
0.3 |
GO:1904924 |
negative regulation of mitophagy in response to mitochondrial depolarization(GO:1904924) |
| 0.1 |
1.8 |
GO:0034501 |
protein localization to kinetochore(GO:0034501) |
| 0.1 |
0.7 |
GO:0033058 |
directional locomotion(GO:0033058) |
| 0.1 |
0.9 |
GO:1900383 |
regulation of synaptic plasticity by receptor localization to synapse(GO:1900383) |
| 0.1 |
0.3 |
GO:0030656 |
regulation of vitamin metabolic process(GO:0030656) |
| 0.1 |
0.9 |
GO:0030859 |
polarized epithelial cell differentiation(GO:0030859) |
| 0.1 |
0.7 |
GO:0042866 |
pyruvate biosynthetic process(GO:0042866) |
| 0.1 |
0.9 |
GO:0006287 |
base-excision repair, gap-filling(GO:0006287) |
| 0.1 |
1.3 |
GO:0031087 |
nuclear-transcribed mRNA catabolic process, deadenylation-independent decay(GO:0031086) deadenylation-independent decapping of nuclear-transcribed mRNA(GO:0031087) |
| 0.1 |
0.3 |
GO:0044752 |
response to human chorionic gonadotropin(GO:0044752) |
| 0.1 |
0.4 |
GO:0072023 |
thick ascending limb development(GO:0072023) metanephric thick ascending limb development(GO:0072233) |
| 0.1 |
0.1 |
GO:0036245 |
cellular response to menadione(GO:0036245) |
| 0.1 |
2.9 |
GO:0006957 |
complement activation, alternative pathway(GO:0006957) |
| 0.1 |
3.1 |
GO:0030322 |
stabilization of membrane potential(GO:0030322) |
| 0.1 |
0.9 |
GO:0035604 |
fibroblast growth factor receptor signaling pathway involved in negative regulation of apoptotic process in bone marrow(GO:0035602) fibroblast growth factor receptor signaling pathway involved in hemopoiesis(GO:0035603) fibroblast growth factor receptor signaling pathway involved in positive regulation of cell proliferation in bone marrow(GO:0035604) fibroblast growth factor receptor signaling pathway involved in mammary gland specification(GO:0060595) mammary gland bud formation(GO:0060615) branch elongation involved in salivary gland morphogenesis(GO:0060667) mesenchymal cell differentiation involved in lung development(GO:0060915) |
| 0.1 |
0.4 |
GO:0070458 |
detoxification of nitrogen compound(GO:0051410) cellular detoxification of nitrogen compound(GO:0070458) |
| 0.1 |
0.9 |
GO:0002887 |
negative regulation of myeloid leukocyte mediated immunity(GO:0002887) |
| 0.1 |
0.6 |
GO:0030579 |
ubiquitin-dependent SMAD protein catabolic process(GO:0030579) |
| 0.1 |
3.1 |
GO:0006851 |
mitochondrial calcium ion transport(GO:0006851) |
| 0.1 |
0.1 |
GO:0060392 |
negative regulation of SMAD protein import into nucleus(GO:0060392) |
| 0.1 |
0.4 |
GO:0001994 |
norepinephrine-epinephrine vasoconstriction involved in regulation of systemic arterial blood pressure(GO:0001994) |
| 0.1 |
1.0 |
GO:0035616 |
histone H2B conserved C-terminal lysine deubiquitination(GO:0035616) |
| 0.1 |
0.3 |
GO:1902031 |
regulation of NADP metabolic process(GO:1902031) |
| 0.1 |
0.7 |
GO:0006824 |
cobalt ion transport(GO:0006824) |
| 0.1 |
0.4 |
GO:0035720 |
intraciliary anterograde transport(GO:0035720) |
| 0.1 |
1.0 |
GO:0048712 |
negative regulation of astrocyte differentiation(GO:0048712) |
| 0.1 |
1.1 |
GO:0036010 |
protein localization to endosome(GO:0036010) |
| 0.1 |
0.3 |
GO:0014878 |
response to electrical stimulus involved in regulation of muscle adaptation(GO:0014878) |
| 0.1 |
0.4 |
GO:0044336 |
embryonic genitalia morphogenesis(GO:0030538) canonical Wnt signaling pathway involved in negative regulation of apoptotic process(GO:0044336) |
| 0.1 |
0.1 |
GO:0090170 |
regulation of Golgi inheritance(GO:0090170) |
| 0.1 |
0.6 |
GO:0002925 |
positive regulation of humoral immune response mediated by circulating immunoglobulin(GO:0002925) |
| 0.1 |
0.1 |
GO:0071635 |
negative regulation of transforming growth factor beta production(GO:0071635) |
| 0.1 |
1.1 |
GO:0015811 |
L-cystine transport(GO:0015811) |
| 0.1 |
1.5 |
GO:1904153 |
negative regulation of protein exit from endoplasmic reticulum(GO:0070862) negative regulation of retrograde protein transport, ER to cytosol(GO:1904153) |
| 0.1 |
1.1 |
GO:0031536 |
positive regulation of exit from mitosis(GO:0031536) |
| 0.1 |
10.0 |
GO:0000381 |
regulation of alternative mRNA splicing, via spliceosome(GO:0000381) |
| 0.1 |
0.7 |
GO:2000312 |
regulation of kainate selective glutamate receptor activity(GO:2000312) |
| 0.1 |
1.6 |
GO:0070935 |
3'-UTR-mediated mRNA stabilization(GO:0070935) |
| 0.1 |
0.1 |
GO:0071350 |
interleukin-15-mediated signaling pathway(GO:0035723) cellular response to interleukin-15(GO:0071350) |
| 0.1 |
0.7 |
GO:0046073 |
dTMP biosynthetic process(GO:0006231) dTMP metabolic process(GO:0046073) |
| 0.1 |
1.1 |
GO:0048280 |
vesicle fusion with Golgi apparatus(GO:0048280) |
| 0.1 |
0.7 |
GO:0047484 |
regulation of response to osmotic stress(GO:0047484) |
| 0.1 |
0.3 |
GO:2000077 |
negative regulation of dopaminergic neuron differentiation(GO:1904339) negative regulation of type B pancreatic cell development(GO:2000077) |
| 0.1 |
3.0 |
GO:0048846 |
axon extension involved in axon guidance(GO:0048846) neuron projection extension involved in neuron projection guidance(GO:1902284) |
| 0.1 |
0.7 |
GO:0006177 |
GMP biosynthetic process(GO:0006177) |
| 0.1 |
0.5 |
GO:1903182 |
regulation of SUMO transferase activity(GO:1903182) positive regulation of SUMO transferase activity(GO:1903755) |
| 0.1 |
0.5 |
GO:0090136 |
epithelial cell-cell adhesion(GO:0090136) |
| 0.1 |
1.1 |
GO:0070544 |
histone H3-K36 demethylation(GO:0070544) |
| 0.1 |
0.3 |
GO:0060481 |
lobar bronchus epithelium development(GO:0060481) |
| 0.1 |
0.3 |
GO:0048318 |
axial mesoderm development(GO:0048318) |
| 0.1 |
0.4 |
GO:0000103 |
sulfate assimilation(GO:0000103) |
| 0.1 |
0.4 |
GO:0031117 |
positive regulation of microtubule depolymerization(GO:0031117) |
| 0.1 |
2.5 |
GO:0048714 |
positive regulation of oligodendrocyte differentiation(GO:0048714) |
| 0.1 |
0.9 |
GO:1904352 |
positive regulation of protein catabolic process in the vacuole(GO:1904352) |
| 0.1 |
1.2 |
GO:0001768 |
establishment of T cell polarity(GO:0001768) |
| 0.1 |
0.3 |
GO:0021524 |
visceral motor neuron differentiation(GO:0021524) |
| 0.1 |
0.3 |
GO:0098937 |
dendritic transport(GO:0098935) anterograde dendritic transport(GO:0098937) |
| 0.1 |
0.4 |
GO:0042631 |
cellular response to water deprivation(GO:0042631) |
| 0.1 |
1.2 |
GO:0032927 |
positive regulation of activin receptor signaling pathway(GO:0032927) |
| 0.1 |
2.0 |
GO:0007614 |
short-term memory(GO:0007614) |
| 0.1 |
0.5 |
GO:0009236 |
cobalamin biosynthetic process(GO:0009236) |
| 0.1 |
0.9 |
GO:2000543 |
positive regulation of gastrulation(GO:2000543) |
| 0.1 |
0.4 |
GO:0032423 |
regulation of mismatch repair(GO:0032423) |
| 0.1 |
0.3 |
GO:0042090 |
interleukin-12 biosynthetic process(GO:0042090) regulation of interleukin-12 biosynthetic process(GO:0045075) |
| 0.1 |
1.2 |
GO:0045187 |
regulation of circadian sleep/wake cycle, sleep(GO:0045187) |
| 0.1 |
0.4 |
GO:0019046 |
release from viral latency(GO:0019046) |
| 0.1 |
0.8 |
GO:1904220 |
regulation of serine C-palmitoyltransferase activity(GO:1904220) |
| 0.1 |
0.6 |
GO:0014807 |
regulation of somitogenesis(GO:0014807) |
| 0.1 |
1.2 |
GO:0071044 |
histone mRNA catabolic process(GO:0071044) |
| 0.1 |
1.4 |
GO:0060088 |
auditory receptor cell stereocilium organization(GO:0060088) |
| 0.1 |
0.1 |
GO:0072695 |
negative regulation of DNA recombination at telomere(GO:0048239) regulation of DNA recombination at telomere(GO:0072695) |
| 0.1 |
0.5 |
GO:0032907 |
transforming growth factor beta3 production(GO:0032907) regulation of transforming growth factor beta3 production(GO:0032910) |
| 0.1 |
0.4 |
GO:1903644 |
regulation of chaperone-mediated protein folding(GO:1903644) |
| 0.1 |
0.8 |
GO:0051182 |
coenzyme transport(GO:0051182) |
| 0.1 |
0.1 |
GO:1901228 |
positive regulation of transcription from RNA polymerase II promoter involved in myocardial precursor cell differentiation(GO:0003257) negative regulation of beta-amyloid clearance(GO:1900222) positive regulation of transcription from RNA polymerase II promoter involved in heart development(GO:1901228) |
| 0.1 |
0.1 |
GO:0009441 |
glycolate metabolic process(GO:0009441) |
| 0.1 |
0.4 |
GO:0071880 |
adenylate cyclase-activating adrenergic receptor signaling pathway(GO:0071880) |
| 0.1 |
0.9 |
GO:1900121 |
negative regulation of receptor binding(GO:1900121) |
| 0.1 |
1.4 |
GO:0060124 |
positive regulation of growth hormone secretion(GO:0060124) |
| 0.1 |
0.2 |
GO:0007000 |
nucleolus organization(GO:0007000) |
| 0.1 |
0.6 |
GO:0007256 |
activation of JNKK activity(GO:0007256) |
| 0.1 |
0.4 |
GO:0098974 |
postsynaptic actin cytoskeleton organization(GO:0098974) |
| 0.1 |
0.5 |
GO:0042997 |
negative regulation of Golgi to plasma membrane protein transport(GO:0042997) |
| 0.1 |
0.5 |
GO:2000297 |
negative regulation of synapse maturation(GO:2000297) |
| 0.1 |
0.4 |
GO:0046416 |
D-amino acid metabolic process(GO:0046416) |
| 0.1 |
0.2 |
GO:1904751 |
positive regulation of protein localization to nucleolus(GO:1904751) |
| 0.1 |
1.1 |
GO:0046604 |
positive regulation of mitotic centrosome separation(GO:0046604) |
| 0.1 |
0.1 |
GO:2000686 |
regulation of rubidium ion transmembrane transporter activity(GO:2000686) |
| 0.1 |
0.4 |
GO:1900425 |
negative regulation of defense response to bacterium(GO:1900425) |
| 0.1 |
0.6 |
GO:0035434 |
lead ion transport(GO:0015692) copper ion transmembrane transport(GO:0035434) |
| 0.1 |
2.4 |
GO:0045589 |
regulatory T cell differentiation(GO:0045066) regulation of regulatory T cell differentiation(GO:0045589) |
| 0.1 |
0.1 |
GO:0002625 |
regulation of T cell antigen processing and presentation(GO:0002625) |
| 0.1 |
0.4 |
GO:0002071 |
glandular epithelial cell maturation(GO:0002071) |
| 0.1 |
0.1 |
GO:0006123 |
mitochondrial electron transport, cytochrome c to oxygen(GO:0006123) |
| 0.1 |
0.4 |
GO:0034196 |
acylglycerol transport(GO:0034196) triglyceride transport(GO:0034197) |
| 0.1 |
0.4 |
GO:0044828 |
negative regulation by host of viral genome replication(GO:0044828) |
| 0.1 |
0.2 |
GO:1902732 |
positive regulation of chondrocyte proliferation(GO:1902732) |
| 0.1 |
0.1 |
GO:0033133 |
positive regulation of glucokinase activity(GO:0033133) |
| 0.1 |
0.2 |
GO:2000196 |
positive regulation of female gonad development(GO:2000196) |
| 0.1 |
2.1 |
GO:0018298 |
protein-chromophore linkage(GO:0018298) |
| 0.1 |
2.7 |
GO:0060134 |
prepulse inhibition(GO:0060134) |
| 0.1 |
1.4 |
GO:0060670 |
branching involved in labyrinthine layer morphogenesis(GO:0060670) |
| 0.1 |
0.8 |
GO:0009253 |
peptidoglycan metabolic process(GO:0000270) peptidoglycan catabolic process(GO:0009253) |
| 0.1 |
0.4 |
GO:0035048 |
splicing factor protein import into nucleus(GO:0035048) |
| 0.1 |
0.8 |
GO:0016926 |
protein desumoylation(GO:0016926) |
| 0.1 |
1.5 |
GO:0006032 |
chitin metabolic process(GO:0006030) chitin catabolic process(GO:0006032) |
| 0.1 |
0.2 |
GO:0070572 |
positive regulation of neuron projection regeneration(GO:0070572) |
| 0.1 |
3.4 |
GO:0035666 |
TRIF-dependent toll-like receptor signaling pathway(GO:0035666) |
| 0.1 |
0.2 |
GO:0070376 |
regulation of ERK5 cascade(GO:0070376) |
| 0.1 |
1.0 |
GO:0048149 |
behavioral response to ethanol(GO:0048149) |
| 0.1 |
0.3 |
GO:1902857 |
positive regulation of nonmotile primary cilium assembly(GO:1902857) |
| 0.1 |
0.6 |
GO:0002934 |
desmosome organization(GO:0002934) |
| 0.1 |
0.8 |
GO:0050957 |
equilibrioception(GO:0050957) |
| 0.1 |
0.3 |
GO:0046968 |
peptide antigen transport(GO:0046968) |
| 0.1 |
0.9 |
GO:0070863 |
positive regulation of protein exit from endoplasmic reticulum(GO:0070863) |
| 0.1 |
0.5 |
GO:1903803 |
glutamine secretion(GO:0010585) L-glutamine import(GO:0036229) L-glutamine import into cell(GO:1903803) |
| 0.1 |
1.0 |
GO:0002084 |
protein depalmitoylation(GO:0002084) |
| 0.1 |
0.8 |
GO:0032287 |
peripheral nervous system myelin maintenance(GO:0032287) |
| 0.1 |
1.0 |
GO:0034723 |
DNA replication-dependent nucleosome assembly(GO:0006335) DNA replication-dependent nucleosome organization(GO:0034723) |
| 0.1 |
0.3 |
GO:0032785 |
negative regulation of DNA-templated transcription, elongation(GO:0032785) |
| 0.1 |
0.8 |
GO:1902723 |
negative regulation of skeletal muscle cell proliferation(GO:0014859) negative regulation of skeletal muscle satellite cell proliferation(GO:1902723) |
| 0.1 |
0.5 |
GO:1902713 |
regulation of interferon-gamma secretion(GO:1902713) |
| 0.1 |
0.7 |
GO:0098795 |
mRNA cleavage involved in gene silencing by miRNA(GO:0035279) mRNA cleavage involved in gene silencing(GO:0098795) |
| 0.1 |
0.3 |
GO:1904245 |
regulation of polynucleotide adenylyltransferase activity(GO:1904245) positive regulation of polynucleotide adenylyltransferase activity(GO:1904247) |
| 0.1 |
0.3 |
GO:0097476 |
spinal cord motor neuron migration(GO:0097476) |
| 0.1 |
0.3 |
GO:0042335 |
cuticle development(GO:0042335) |
| 0.1 |
0.6 |
GO:0071894 |
histone H2B conserved C-terminal lysine ubiquitination(GO:0071894) |
| 0.1 |
0.2 |
GO:0070943 |
neutrophil mediated cytotoxicity(GO:0070942) neutrophil mediated killing of symbiont cell(GO:0070943) neutrophil mediated killing of bacterium(GO:0070944) |
| 0.1 |
0.4 |
GO:0046166 |
glyceraldehyde-3-phosphate biosynthetic process(GO:0046166) |
| 0.1 |
0.4 |
GO:0001957 |
intramembranous ossification(GO:0001957) direct ossification(GO:0036072) |
| 0.1 |
1.6 |
GO:0060575 |
intestinal epithelial cell differentiation(GO:0060575) |
| 0.1 |
0.6 |
GO:0030885 |
regulation of myeloid dendritic cell activation(GO:0030885) |
| 0.1 |
3.7 |
GO:0097503 |
sialylation(GO:0097503) |
| 0.1 |
0.1 |
GO:1904181 |
positive regulation of membrane depolarization(GO:1904181) |
| 0.1 |
4.6 |
GO:0030199 |
collagen fibril organization(GO:0030199) |
| 0.1 |
0.8 |
GO:0009414 |
response to water deprivation(GO:0009414) |
| 0.1 |
0.4 |
GO:0048073 |
regulation of eye pigmentation(GO:0048073) |
| 0.1 |
0.4 |
GO:0009443 |
pyridoxal 5'-phosphate salvage(GO:0009443) |
| 0.1 |
0.2 |
GO:0060708 |
spongiotrophoblast differentiation(GO:0060708) |
| 0.1 |
0.3 |
GO:0033512 |
L-lysine catabolic process to acetyl-CoA via saccharopine(GO:0033512) |
| 0.1 |
0.7 |
GO:0043619 |
regulation of transcription from RNA polymerase II promoter in response to oxidative stress(GO:0043619) |
| 0.1 |
0.2 |
GO:0007518 |
myoblast fate determination(GO:0007518) |
| 0.1 |
0.2 |
GO:0007343 |
egg activation(GO:0007343) |
| 0.1 |
0.1 |
GO:0006106 |
fumarate metabolic process(GO:0006106) |
| 0.1 |
0.7 |
GO:1904274 |
tricellular tight junction assembly(GO:1904274) |
| 0.1 |
0.8 |
GO:0070164 |
adiponectin secretion(GO:0070162) regulation of adiponectin secretion(GO:0070163) negative regulation of adiponectin secretion(GO:0070164) |
| 0.1 |
1.2 |
GO:0006449 |
regulation of translational termination(GO:0006449) |
| 0.1 |
0.4 |
GO:0010587 |
miRNA catabolic process(GO:0010587) |
| 0.1 |
0.2 |
GO:1901858 |
regulation of mitochondrial DNA metabolic process(GO:1901858) |
| 0.1 |
0.3 |
GO:0033037 |
polysaccharide localization(GO:0033037) |
| 0.1 |
0.4 |
GO:0000961 |
negative regulation of mitochondrial RNA catabolic process(GO:0000961) |
| 0.1 |
2.0 |
GO:0034389 |
lipid particle organization(GO:0034389) |
| 0.1 |
0.2 |
GO:0090080 |
positive regulation of MAPKKK cascade by fibroblast growth factor receptor signaling pathway(GO:0090080) |
| 0.1 |
0.5 |
GO:0019919 |
peptidyl-arginine methylation, to asymmetrical-dimethyl arginine(GO:0019919) |
| 0.1 |
1.3 |
GO:0070327 |
thyroid hormone transport(GO:0070327) |
| 0.1 |
0.2 |
GO:0010966 |
regulation of phosphate transport(GO:0010966) |
| 0.1 |
0.2 |
GO:0030974 |
thiamine pyrophosphate transport(GO:0030974) |
| 0.1 |
0.5 |
GO:2000425 |
regulation of apoptotic cell clearance(GO:2000425) |
| 0.1 |
1.0 |
GO:0090557 |
establishment of endothelial intestinal barrier(GO:0090557) |
| 0.1 |
0.6 |
GO:0035865 |
cellular response to potassium ion(GO:0035865) |
| 0.1 |
0.5 |
GO:0033313 |
meiotic cell cycle checkpoint(GO:0033313) |
| 0.1 |
0.4 |
GO:0009257 |
10-formyltetrahydrofolate biosynthetic process(GO:0009257) |
| 0.1 |
0.4 |
GO:0010668 |
ectodermal cell differentiation(GO:0010668) |
| 0.1 |
1.0 |
GO:0086045 |
membrane depolarization during AV node cell action potential(GO:0086045) |
| 0.1 |
1.7 |
GO:0040032 |
post-embryonic body morphogenesis(GO:0040032) |
| 0.1 |
0.3 |
GO:0019064 |
fusion of virus membrane with host plasma membrane(GO:0019064) membrane fusion involved in viral entry into host cell(GO:0039663) multi-organism membrane fusion(GO:0044800) |
| 0.1 |
1.0 |
GO:0060180 |
female mating behavior(GO:0060180) |
| 0.1 |
0.4 |
GO:2000535 |
regulation of entry of bacterium into host cell(GO:2000535) |
| 0.1 |
0.3 |
GO:0030432 |
peristalsis(GO:0030432) |
| 0.1 |
0.4 |
GO:0098989 |
NMDA selective glutamate receptor signaling pathway(GO:0098989) |
| 0.1 |
0.2 |
GO:0048619 |
embryonic hindgut morphogenesis(GO:0048619) |
| 0.1 |
0.5 |
GO:0006651 |
diacylglycerol biosynthetic process(GO:0006651) |
| 0.1 |
0.8 |
GO:0042483 |
negative regulation of odontogenesis(GO:0042483) |
| 0.1 |
0.1 |
GO:0070346 |
positive regulation of fat cell proliferation(GO:0070346) |
| 0.1 |
0.2 |
GO:0002457 |
T cell antigen processing and presentation(GO:0002457) |
| 0.1 |
1.3 |
GO:0001867 |
complement activation, lectin pathway(GO:0001867) |
| 0.1 |
1.0 |
GO:0051964 |
negative regulation of synapse assembly(GO:0051964) |
| 0.1 |
3.4 |
GO:0010803 |
regulation of tumor necrosis factor-mediated signaling pathway(GO:0010803) |
| 0.1 |
0.3 |
GO:0071896 |
protein localization to adherens junction(GO:0071896) |
| 0.1 |
0.7 |
GO:0046598 |
positive regulation of viral entry into host cell(GO:0046598) |
| 0.1 |
0.1 |
GO:1903015 |
regulation of exo-alpha-sialidase activity(GO:1903015) |
| 0.1 |
2.5 |
GO:0051764 |
actin crosslink formation(GO:0051764) |
| 0.1 |
0.5 |
GO:0061668 |
mitochondrial ribosome assembly(GO:0061668) |
| 0.1 |
1.1 |
GO:0031119 |
tRNA pseudouridine synthesis(GO:0031119) |
| 0.1 |
0.4 |
GO:1902856 |
negative regulation of nonmotile primary cilium assembly(GO:1902856) |
| 0.1 |
0.6 |
GO:0002191 |
cap-dependent translational initiation(GO:0002191) |
| 0.1 |
0.3 |
GO:0061107 |
seminal vesicle development(GO:0061107) |
| 0.1 |
0.3 |
GO:1900109 |
regulation of histone H3-K9 dimethylation(GO:1900109) |
| 0.1 |
0.4 |
GO:0060059 |
embryonic retina morphogenesis in camera-type eye(GO:0060059) |
| 0.1 |
6.5 |
GO:0015701 |
bicarbonate transport(GO:0015701) |
| 0.1 |
0.3 |
GO:0099551 |
synaptic signaling via neuropeptide(GO:0099538) trans-synaptic signaling by neuropeptide(GO:0099540) trans-synaptic signaling by neuropeptide, modulating synaptic transmission(GO:0099551) |
| 0.1 |
0.2 |
GO:0003062 |
regulation of heart rate by chemical signal(GO:0003062) |
| 0.1 |
0.4 |
GO:0035544 |
negative regulation of SNARE complex assembly(GO:0035544) |
| 0.1 |
0.2 |
GO:1904781 |
positive regulation of protein localization to centrosome(GO:1904781) |
| 0.1 |
0.8 |
GO:1901522 |
positive regulation of transcription from RNA polymerase II promoter involved in cellular response to chemical stimulus(GO:1901522) |
| 0.1 |
0.3 |
GO:2000616 |
negative regulation of histone H3-K9 acetylation(GO:2000616) |
| 0.1 |
0.8 |
GO:0035414 |
negative regulation of catenin import into nucleus(GO:0035414) |
| 0.1 |
1.5 |
GO:0016973 |
poly(A)+ mRNA export from nucleus(GO:0016973) |
| 0.1 |
0.3 |
GO:0001831 |
trophectodermal cellular morphogenesis(GO:0001831) |
| 0.1 |
0.4 |
GO:0048749 |
compound eye development(GO:0048749) |
| 0.1 |
0.8 |
GO:0055129 |
L-proline biosynthetic process(GO:0055129) |
| 0.1 |
2.5 |
GO:0008038 |
neuron recognition(GO:0008038) |
| 0.1 |
0.5 |
GO:0046167 |
glycerol-3-phosphate biosynthetic process(GO:0046167) |
| 0.1 |
0.2 |
GO:1904417 |
regulation of xenophagy(GO:1904415) positive regulation of xenophagy(GO:1904417) |
| 0.1 |
0.7 |
GO:0018230 |
peptidyl-L-cysteine S-palmitoylation(GO:0018230) peptidyl-S-diacylglycerol-L-cysteine biosynthetic process from peptidyl-cysteine(GO:0018231) |
| 0.1 |
0.4 |
GO:0006556 |
S-adenosylmethionine biosynthetic process(GO:0006556) |
| 0.1 |
0.1 |
GO:1900113 |
negative regulation of histone H3-K9 trimethylation(GO:1900113) |
| 0.1 |
0.5 |
GO:1902044 |
regulation of Fas signaling pathway(GO:1902044) |
| 0.1 |
1.2 |
GO:0048025 |
negative regulation of mRNA splicing, via spliceosome(GO:0048025) |
| 0.1 |
0.6 |
GO:0009438 |
methylglyoxal metabolic process(GO:0009438) |
| 0.1 |
0.6 |
GO:0046015 |
regulation of transcription by glucose(GO:0046015) |
| 0.1 |
0.4 |
GO:2000232 |
regulation of rRNA processing(GO:2000232) |
| 0.1 |
1.5 |
GO:0002474 |
antigen processing and presentation of peptide antigen via MHC class I(GO:0002474) |
| 0.1 |
0.1 |
GO:0048686 |
regulation of sprouting of injured axon(GO:0048686) regulation of axon extension involved in regeneration(GO:0048690) |
| 0.1 |
0.6 |
GO:0090116 |
C-5 methylation of cytosine(GO:0090116) |
| 0.1 |
2.1 |
GO:0048240 |
sperm capacitation(GO:0048240) |
| 0.1 |
0.7 |
GO:0043985 |
histone H4-R3 methylation(GO:0043985) |
| 0.1 |
0.2 |
GO:1902174 |
positive regulation of keratinocyte apoptotic process(GO:1902174) |
| 0.1 |
0.5 |
GO:0042699 |
follicle-stimulating hormone signaling pathway(GO:0042699) |
| 0.1 |
0.5 |
GO:0015862 |
uridine transport(GO:0015862) pyrimidine nucleoside transport(GO:0015864) |
| 0.1 |
0.8 |
GO:0070934 |
CRD-mediated mRNA stabilization(GO:0070934) |
| 0.1 |
0.8 |
GO:0019236 |
response to pheromone(GO:0019236) |
| 0.1 |
1.0 |
GO:0009957 |
epidermal cell fate specification(GO:0009957) |
| 0.1 |
3.4 |
GO:0071173 |
spindle assembly checkpoint(GO:0071173) |
| 0.1 |
0.5 |
GO:0042921 |
glucocorticoid receptor signaling pathway(GO:0042921) |
| 0.1 |
0.7 |
GO:0051197 |
positive regulation of cofactor metabolic process(GO:0051194) positive regulation of coenzyme metabolic process(GO:0051197) |
| 0.1 |
1.3 |
GO:0016576 |
histone dephosphorylation(GO:0016576) |
| 0.1 |
1.2 |
GO:1901838 |
positive regulation of transcription of nuclear large rRNA transcript from RNA polymerase I promoter(GO:1901838) |
| 0.1 |
0.8 |
GO:0010571 |
positive regulation of nuclear cell cycle DNA replication(GO:0010571) |
| 0.1 |
0.3 |
GO:1903576 |
response to L-arginine(GO:1903576) |
| 0.1 |
0.1 |
GO:0000960 |
mitochondrial RNA catabolic process(GO:0000957) regulation of mitochondrial RNA catabolic process(GO:0000960) |
| 0.1 |
1.1 |
GO:2000622 |
regulation of nuclear-transcribed mRNA catabolic process, nonsense-mediated decay(GO:2000622) negative regulation of nuclear-transcribed mRNA catabolic process, nonsense-mediated decay(GO:2000623) |
| 0.1 |
0.2 |
GO:0097368 |
establishment of Sertoli cell barrier(GO:0097368) |
| 0.1 |
0.3 |
GO:0008354 |
germ cell migration(GO:0008354) |
| 0.1 |
1.1 |
GO:1901017 |
negative regulation of potassium ion transmembrane transporter activity(GO:1901017) |
| 0.1 |
1.2 |
GO:0006972 |
hyperosmotic response(GO:0006972) |
| 0.1 |
0.5 |
GO:0032468 |
Golgi calcium ion homeostasis(GO:0032468) |
| 0.1 |
0.5 |
GO:0048537 |
mucosal-associated lymphoid tissue development(GO:0048537) Peyer's patch development(GO:0048541) |
| 0.1 |
0.4 |
GO:0006049 |
UDP-N-acetylglucosamine catabolic process(GO:0006049) |
| 0.1 |
0.7 |
GO:0035879 |
plasma membrane lactate transport(GO:0035879) |
| 0.1 |
0.7 |
GO:0018344 |
protein geranylgeranylation(GO:0018344) |
| 0.1 |
0.5 |
GO:1903715 |
regulation of aerobic respiration(GO:1903715) |
| 0.1 |
0.3 |
GO:0006931 |
substrate-dependent cell migration, cell attachment to substrate(GO:0006931) |
| 0.1 |
1.0 |
GO:1903206 |
negative regulation of hydrogen peroxide-induced cell death(GO:1903206) |
| 0.1 |
0.3 |
GO:0072526 |
pyridine-containing compound catabolic process(GO:0072526) |
| 0.1 |
0.6 |
GO:1900017 |
positive regulation of cytokine production involved in inflammatory response(GO:1900017) |
| 0.1 |
0.6 |
GO:0010954 |
positive regulation of protein processing(GO:0010954) |
| 0.1 |
0.3 |
GO:0014810 |
positive regulation of skeletal muscle contraction by regulation of release of sequestered calcium ion(GO:0014810) |
| 0.1 |
0.2 |
GO:0017185 |
peptidyl-lysine hydroxylation(GO:0017185) |
| 0.1 |
0.8 |
GO:2001241 |
positive regulation of extrinsic apoptotic signaling pathway in absence of ligand(GO:2001241) |
| 0.1 |
1.1 |
GO:0001682 |
tRNA 5'-leader removal(GO:0001682) |
| 0.1 |
0.7 |
GO:0071803 |
positive regulation of podosome assembly(GO:0071803) |
| 0.1 |
0.2 |
GO:0042748 |
circadian sleep/wake cycle, non-REM sleep(GO:0042748) |
| 0.1 |
0.4 |
GO:1904378 |
maintenance of unfolded protein(GO:0036506) maintenance of unfolded protein involved in ERAD pathway(GO:1904378) |
| 0.1 |
0.8 |
GO:0061051 |
positive regulation of cell growth involved in cardiac muscle cell development(GO:0061051) |
| 0.1 |
0.1 |
GO:1903217 |
regulation of protein processing involved in protein targeting to mitochondrion(GO:1903216) negative regulation of protein processing involved in protein targeting to mitochondrion(GO:1903217) |
| 0.1 |
0.7 |
GO:0048742 |
regulation of skeletal muscle fiber development(GO:0048742) |
| 0.1 |
0.3 |
GO:0043455 |
regulation of secondary metabolic process(GO:0043455) |
| 0.1 |
0.3 |
GO:2001188 |
regulation of T cell activation via T cell receptor contact with antigen bound to MHC molecule on antigen presenting cell(GO:2001188) |
| 0.1 |
0.5 |
GO:1901096 |
regulation of autophagosome maturation(GO:1901096) |
| 0.1 |
0.6 |
GO:0097052 |
L-kynurenine metabolic process(GO:0097052) |
| 0.1 |
0.3 |
GO:0015742 |
alpha-ketoglutarate transport(GO:0015742) |
| 0.1 |
0.7 |
GO:0042262 |
DNA protection(GO:0042262) |
| 0.1 |
0.5 |
GO:1903553 |
positive regulation of extracellular exosome assembly(GO:1903553) |
| 0.1 |
2.5 |
GO:0043252 |
sodium-independent organic anion transport(GO:0043252) |
| 0.1 |
0.5 |
GO:0007042 |
lysosomal lumen acidification(GO:0007042) |
| 0.1 |
0.1 |
GO:0046271 |
phenylpropanoid catabolic process(GO:0046271) |
| 0.1 |
0.8 |
GO:0031915 |
positive regulation of synaptic plasticity(GO:0031915) |
| 0.1 |
0.3 |
GO:0031508 |
pericentric heterochromatin assembly(GO:0031508) |
| 0.1 |
0.5 |
GO:0072502 |
cellular phosphate ion homeostasis(GO:0030643) cellular trivalent inorganic anion homeostasis(GO:0072502) |
| 0.1 |
1.8 |
GO:0090004 |
positive regulation of establishment of protein localization to plasma membrane(GO:0090004) |
| 0.1 |
1.0 |
GO:0007258 |
JUN phosphorylation(GO:0007258) |
| 0.1 |
0.7 |
GO:0046149 |
porphyrin-containing compound catabolic process(GO:0006787) tetrapyrrole catabolic process(GO:0033015) heme catabolic process(GO:0042167) pigment catabolic process(GO:0046149) |
| 0.1 |
1.8 |
GO:0019835 |
cytolysis(GO:0019835) |
| 0.1 |
0.1 |
GO:0061086 |
negative regulation of histone H3-K27 methylation(GO:0061086) |
| 0.1 |
0.4 |
GO:0045040 |
protein import into mitochondrial outer membrane(GO:0045040) |
| 0.1 |
0.1 |
GO:1904430 |
negative regulation of t-circle formation(GO:1904430) |
| 0.1 |
0.7 |
GO:0042269 |
regulation of natural killer cell mediated cytotoxicity(GO:0042269) |
| 0.1 |
0.9 |
GO:0000463 |
maturation of LSU-rRNA from tricistronic rRNA transcript (SSU-rRNA, 5.8S rRNA, LSU-rRNA)(GO:0000463) |
| 0.1 |
0.2 |
GO:0009146 |
purine nucleoside triphosphate catabolic process(GO:0009146) |
| 0.1 |
0.2 |
GO:1903031 |
regulation of microtubule plus-end binding(GO:1903031) positive regulation of microtubule plus-end binding(GO:1903033) |
| 0.1 |
0.7 |
GO:0000160 |
phosphorelay signal transduction system(GO:0000160) |
| 0.1 |
0.4 |
GO:0016480 |
negative regulation of transcription from RNA polymerase III promoter(GO:0016480) |
| 0.1 |
0.5 |
GO:0032239 |
regulation of nucleobase-containing compound transport(GO:0032239) |
| 0.1 |
0.2 |
GO:0042939 |
glutathione transport(GO:0034635) tripeptide transport(GO:0042939) |
| 0.1 |
0.2 |
GO:0071963 |
establishment or maintenance of cell polarity regulating cell shape(GO:0071963) |
| 0.1 |
0.2 |
GO:1900145 |
regulation of nodal signaling pathway involved in determination of left/right asymmetry(GO:1900145) regulation of nodal signaling pathway involved in determination of lateral mesoderm left/right asymmetry(GO:1900175) |
| 0.1 |
0.1 |
GO:0048165 |
ovarian cumulus expansion(GO:0001550) fused antrum stage(GO:0048165) |
| 0.1 |
0.1 |
GO:0097374 |
sensory neuron axon guidance(GO:0097374) |
| 0.1 |
0.9 |
GO:0035331 |
negative regulation of hippo signaling(GO:0035331) |
| 0.1 |
0.5 |
GO:1990001 |
inhibition of cysteine-type endopeptidase activity involved in apoptotic process(GO:1990001) |
| 0.1 |
0.1 |
GO:0036023 |
limb joint morphogenesis(GO:0036022) embryonic skeletal limb joint morphogenesis(GO:0036023) |
| 0.1 |
0.1 |
GO:0061034 |
olfactory bulb mitral cell layer development(GO:0061034) |
| 0.1 |
0.2 |
GO:0034441 |
plasma lipoprotein particle oxidation(GO:0034441) |
| 0.1 |
0.2 |
GO:0035587 |
purinergic receptor signaling pathway(GO:0035587) |
| 0.1 |
0.9 |
GO:0010586 |
miRNA metabolic process(GO:0010586) |
| 0.1 |
0.8 |
GO:0006829 |
zinc II ion transport(GO:0006829) |
| 0.1 |
0.5 |
GO:0071233 |
cellular response to leucine(GO:0071233) |
| 0.1 |
0.2 |
GO:0060722 |
spongiotrophoblast cell proliferation(GO:0060720) regulation of spongiotrophoblast cell proliferation(GO:0060721) cell proliferation involved in embryonic placenta development(GO:0060722) regulation of cell proliferation involved in embryonic placenta development(GO:0060723) |
| 0.1 |
0.2 |
GO:0009138 |
pyrimidine nucleoside diphosphate metabolic process(GO:0009138) |
| 0.1 |
0.1 |
GO:0043366 |
beta selection(GO:0043366) |
| 0.1 |
0.3 |
GO:0016256 |
N-glycan processing to lysosome(GO:0016256) |
| 0.1 |
0.2 |
GO:0033033 |
negative regulation of myeloid cell apoptotic process(GO:0033033) |
| 0.1 |
0.2 |
GO:0071169 |
establishment of protein localization to chromatin(GO:0071169) |
| 0.1 |
1.5 |
GO:0002091 |
negative regulation of receptor internalization(GO:0002091) |
| 0.1 |
0.4 |
GO:0055059 |
asymmetric neuroblast division(GO:0055059) |
| 0.1 |
0.4 |
GO:0060159 |
regulation of dopamine receptor signaling pathway(GO:0060159) |
| 0.1 |
0.2 |
GO:0048254 |
snoRNA localization(GO:0048254) |
| 0.1 |
0.3 |
GO:1905229 |
cellular response to glycoprotein(GO:1904588) cellular response to thyrotropin-releasing hormone(GO:1905229) |
| 0.1 |
0.3 |
GO:2001034 |
positive regulation of double-strand break repair via nonhomologous end joining(GO:2001034) |
| 0.1 |
0.1 |
GO:0071426 |
ribonucleoprotein complex export from nucleus(GO:0071426) |
| 0.1 |
0.1 |
GO:0060434 |
bronchus morphogenesis(GO:0060434) |
| 0.1 |
0.7 |
GO:0071526 |
semaphorin-plexin signaling pathway(GO:0071526) |
| 0.1 |
0.2 |
GO:1903259 |
exon-exon junction complex disassembly(GO:1903259) |
| 0.1 |
1.6 |
GO:0099517 |
anterograde synaptic vesicle transport(GO:0048490) synaptic vesicle cytoskeletal transport(GO:0099514) synaptic vesicle transport along microtubule(GO:0099517) |
| 0.1 |
0.3 |
GO:0098886 |
modification of dendritic spine(GO:0098886) |
| 0.1 |
0.1 |
GO:2000642 |
negative regulation of early endosome to late endosome transport(GO:2000642) |
| 0.1 |
0.2 |
GO:0050747 |
positive regulation of lipoprotein metabolic process(GO:0050747) |
| 0.1 |
0.1 |
GO:0001692 |
histamine metabolic process(GO:0001692) |
| 0.1 |
1.2 |
GO:0090200 |
positive regulation of release of cytochrome c from mitochondria(GO:0090200) |
| 0.1 |
0.3 |
GO:0006621 |
protein retention in ER lumen(GO:0006621) maintenance of protein localization in endoplasmic reticulum(GO:0035437) |
| 0.1 |
0.5 |
GO:0006990 |
positive regulation of transcription from RNA polymerase II promoter involved in unfolded protein response(GO:0006990) |
| 0.1 |
1.4 |
GO:0009303 |
rRNA transcription(GO:0009303) |
| 0.1 |
1.6 |
GO:0021680 |
cerebellar Purkinje cell layer development(GO:0021680) |
| 0.1 |
0.2 |
GO:0002538 |
arachidonic acid metabolite production involved in inflammatory response(GO:0002538) leukotriene production involved in inflammatory response(GO:0002540) |
| 0.1 |
1.1 |
GO:0000470 |
maturation of LSU-rRNA(GO:0000470) |
| 0.1 |
0.3 |
GO:0032581 |
ER-dependent peroxisome organization(GO:0032581) |
| 0.1 |
0.1 |
GO:0035712 |
T-helper 2 cell activation(GO:0035712) regulation of T-helper 2 cell activation(GO:2000569) positive regulation of T-helper 2 cell activation(GO:2000570) |
| 0.1 |
0.1 |
GO:0006528 |
asparagine metabolic process(GO:0006528) |
| 0.1 |
1.1 |
GO:0055069 |
zinc ion homeostasis(GO:0055069) |
| 0.1 |
0.1 |
GO:0021897 |
forebrain astrocyte differentiation(GO:0021896) forebrain astrocyte development(GO:0021897) |
| 0.1 |
1.2 |
GO:0097120 |
receptor localization to synapse(GO:0097120) |
| 0.1 |
0.1 |
GO:0098735 |
positive regulation of the force of heart contraction(GO:0098735) |
| 0.1 |
1.5 |
GO:0031146 |
SCF-dependent proteasomal ubiquitin-dependent protein catabolic process(GO:0031146) |
| 0.1 |
0.1 |
GO:0032025 |
response to cobalt ion(GO:0032025) |
| 0.1 |
3.7 |
GO:0030490 |
maturation of SSU-rRNA(GO:0030490) |
| 0.1 |
2.2 |
GO:0071431 |
tRNA export from nucleus(GO:0006409) tRNA-containing ribonucleoprotein complex export from nucleus(GO:0071431) |
| 0.1 |
0.1 |
GO:0051673 |
membrane disruption in other organism(GO:0051673) |
| 0.1 |
0.4 |
GO:0048339 |
paraxial mesoderm development(GO:0048339) |
| 0.1 |
0.3 |
GO:0001787 |
natural killer cell proliferation(GO:0001787) |
| 0.1 |
0.1 |
GO:1903012 |
positive regulation of bone development(GO:1903012) |
| 0.1 |
0.2 |
GO:0006729 |
tetrahydrobiopterin biosynthetic process(GO:0006729) tetrahydrobiopterin metabolic process(GO:0046146) |
| 0.1 |
0.1 |
GO:0044026 |
DNA hypermethylation(GO:0044026) |
| 0.1 |
0.3 |
GO:0038018 |
Wnt receptor catabolic process(GO:0038018) |
| 0.1 |
0.1 |
GO:0010536 |
positive regulation of activation of Janus kinase activity(GO:0010536) |
| 0.1 |
0.3 |
GO:0070086 |
ubiquitin-dependent endocytosis(GO:0070086) |
| 0.1 |
0.3 |
GO:2000833 |
positive regulation of steroid hormone secretion(GO:2000833) |
| 0.1 |
0.5 |
GO:0007035 |
vacuolar acidification(GO:0007035) |
| 0.1 |
0.6 |
GO:0017196 |
N-terminal peptidyl-methionine acetylation(GO:0017196) |
| 0.1 |
0.2 |
GO:0086048 |
membrane depolarization during bundle of His cell action potential(GO:0086048) |
| 0.1 |
2.7 |
GO:0010501 |
RNA secondary structure unwinding(GO:0010501) |
| 0.1 |
0.1 |
GO:0035872 |
nucleotide-binding domain, leucine rich repeat containing receptor signaling pathway(GO:0035872) |
| 0.1 |
1.1 |
GO:0048757 |
endosome to melanosome transport(GO:0035646) endosome to pigment granule transport(GO:0043485) pigment granule maturation(GO:0048757) |
| 0.1 |
0.3 |
GO:0048105 |
establishment of body hair or bristle planar orientation(GO:0048104) establishment of body hair planar orientation(GO:0048105) |
| 0.1 |
0.8 |
GO:0019373 |
epoxygenase P450 pathway(GO:0019373) |
| 0.1 |
1.4 |
GO:0070816 |
phosphorylation of RNA polymerase II C-terminal domain(GO:0070816) |
| 0.1 |
0.2 |
GO:0007315 |
oocyte construction(GO:0007308) oocyte axis specification(GO:0007309) oocyte anterior/posterior axis specification(GO:0007314) pole plasm assembly(GO:0007315) maternal determination of anterior/posterior axis, embryo(GO:0008358) P granule organization(GO:0030719) |
| 0.1 |
0.2 |
GO:1902544 |
regulation of DNA N-glycosylase activity(GO:1902544) |
| 0.1 |
0.1 |
GO:0002378 |
immunoglobulin biosynthetic process(GO:0002378) |
| 0.1 |
0.1 |
GO:0043324 |
eye pigment biosynthetic process(GO:0006726) eye pigment metabolic process(GO:0042441) pigment metabolic process involved in developmental pigmentation(GO:0043324) pigment metabolic process involved in pigmentation(GO:0043474) |
| 0.1 |
1.2 |
GO:0070884 |
regulation of calcineurin-NFAT signaling cascade(GO:0070884) |
| 0.1 |
0.9 |
GO:0031069 |
hair follicle morphogenesis(GO:0031069) |
| 0.1 |
0.1 |
GO:0072610 |
interleukin-12 secretion(GO:0072610) |
| 0.1 |
0.1 |
GO:2000053 |
regulation of Wnt signaling pathway involved in dorsal/ventral axis specification(GO:2000053) |
| 0.1 |
0.2 |
GO:0048304 |
positive regulation of isotype switching to IgG isotypes(GO:0048304) |
| 0.1 |
4.1 |
GO:0030574 |
collagen catabolic process(GO:0030574) |
| 0.1 |
0.3 |
GO:0070535 |
histone H2A K63-linked ubiquitination(GO:0070535) |
| 0.1 |
0.2 |
GO:0035803 |
egg coat formation(GO:0035803) |
| 0.1 |
0.7 |
GO:0097340 |
inhibition of cysteine-type endopeptidase activity(GO:0097340) zymogen inhibition(GO:0097341) |
| 0.1 |
0.2 |
GO:1904158 |
axonemal central apparatus assembly(GO:1904158) |
| 0.1 |
0.6 |
GO:0001675 |
acrosome assembly(GO:0001675) |
| 0.1 |
0.2 |
GO:0034402 |
recruitment of 3'-end processing factors to RNA polymerase II holoenzyme complex(GO:0034402) |
| 0.1 |
0.1 |
GO:0045448 |
regulation of mitotic cell cycle, embryonic(GO:0009794) mitotic cell cycle, embryonic(GO:0045448) |
| 0.1 |
0.3 |
GO:1902969 |
mitotic DNA replication(GO:1902969) |
| 0.1 |
0.1 |
GO:0045715 |
negative regulation of low-density lipoprotein particle receptor biosynthetic process(GO:0045715) |
| 0.1 |
0.2 |
GO:1903575 |
cornified envelope assembly(GO:1903575) |
| 0.1 |
0.9 |
GO:0048934 |
peripheral nervous system neuron differentiation(GO:0048934) peripheral nervous system neuron development(GO:0048935) |
| 0.1 |
0.2 |
GO:0003366 |
cell-matrix adhesion involved in ameboidal cell migration(GO:0003366) |
| 0.1 |
0.1 |
GO:1900108 |
negative regulation of nodal signaling pathway(GO:1900108) |
| 0.1 |
0.2 |
GO:0098502 |
DNA dephosphorylation(GO:0098502) |
| 0.1 |
0.7 |
GO:0006582 |
melanin metabolic process(GO:0006582) |
| 0.1 |
0.2 |
GO:0035405 |
histone-threonine phosphorylation(GO:0035405) |
| 0.1 |
0.1 |
GO:0002101 |
tRNA wobble cytosine modification(GO:0002101) |
| 0.1 |
0.2 |
GO:0006857 |
oligopeptide transport(GO:0006857) |
| 0.1 |
0.2 |
GO:1901387 |
positive regulation of voltage-gated calcium channel activity(GO:1901387) |
| 0.1 |
0.5 |
GO:0038203 |
TORC2 signaling(GO:0038203) |
| 0.1 |
0.1 |
GO:0045345 |
positive regulation of MHC class I biosynthetic process(GO:0045345) |
| 0.1 |
1.7 |
GO:0035036 |
sperm-egg recognition(GO:0035036) |
| 0.1 |
0.1 |
GO:0043605 |
cellular amide catabolic process(GO:0043605) |
| 0.1 |
2.2 |
GO:0000413 |
protein peptidyl-prolyl isomerization(GO:0000413) |
| 0.1 |
0.1 |
GO:0031077 |
post-embryonic camera-type eye development(GO:0031077) |
| 0.1 |
0.2 |
GO:0038163 |
thrombopoietin-mediated signaling pathway(GO:0038163) |
| 0.1 |
0.1 |
GO:1990036 |
calcium ion import into sarcoplasmic reticulum(GO:1990036) |
| 0.1 |
0.2 |
GO:0021781 |
glial cell fate commitment(GO:0021781) |
| 0.1 |
0.1 |
GO:0002314 |
germinal center B cell differentiation(GO:0002314) |
| 0.1 |
0.6 |
GO:0030046 |
parallel actin filament bundle assembly(GO:0030046) |
| 0.1 |
0.2 |
GO:0071529 |
cementum mineralization(GO:0071529) |
| 0.1 |
0.2 |
GO:0042816 |
vitamin B6 metabolic process(GO:0042816) |
| 0.1 |
0.5 |
GO:0044539 |
long-chain fatty acid import(GO:0044539) |
| 0.1 |
0.8 |
GO:0015671 |
gas transport(GO:0015669) oxygen transport(GO:0015671) |
| 0.1 |
0.3 |
GO:0046654 |
tetrahydrofolate biosynthetic process(GO:0046654) |
| 0.1 |
0.1 |
GO:0043615 |
astrocyte cell migration(GO:0043615) |
| 0.1 |
0.3 |
GO:0035988 |
chondrocyte proliferation(GO:0035988) |
| 0.1 |
0.2 |
GO:0030950 |
establishment or maintenance of actin cytoskeleton polarity(GO:0030950) |
| 0.1 |
0.7 |
GO:0032435 |
negative regulation of proteasomal ubiquitin-dependent protein catabolic process(GO:0032435) |
| 0.1 |
0.3 |
GO:0002158 |
osteoclast proliferation(GO:0002158) |
| 0.1 |
0.1 |
GO:0021794 |
thalamus development(GO:0021794) |
| 0.1 |
1.8 |
GO:0006405 |
RNA export from nucleus(GO:0006405) |
| 0.1 |
0.4 |
GO:0006828 |
manganese ion transport(GO:0006828) |
| 0.1 |
0.2 |
GO:0010609 |
mRNA localization resulting in posttranscriptional regulation of gene expression(GO:0010609) |
| 0.1 |
0.3 |
GO:0036376 |
sodium ion export from cell(GO:0036376) |
| 0.1 |
0.3 |
GO:0042255 |
ribosome assembly(GO:0042255) |
| 0.1 |
0.5 |
GO:0034465 |
response to carbon monoxide(GO:0034465) |
| 0.1 |
0.2 |
GO:0021999 |
neural plate anterior/posterior regionalization(GO:0021999) |
| 0.1 |
1.3 |
GO:0050885 |
neuromuscular process controlling balance(GO:0050885) |
| 0.1 |
0.1 |
GO:2001267 |
regulation of cysteine-type endopeptidase activity involved in apoptotic signaling pathway(GO:2001267) |
| 0.1 |
0.4 |
GO:0000055 |
ribosomal large subunit export from nucleus(GO:0000055) |
| 0.1 |
0.1 |
GO:0086036 |
regulation of cardiac muscle cell membrane potential(GO:0086036) |
| 0.1 |
0.2 |
GO:2000819 |
regulation of nucleotide-excision repair(GO:2000819) |
| 0.1 |
0.4 |
GO:0019336 |
phenol-containing compound catabolic process(GO:0019336) catechol-containing compound catabolic process(GO:0019614) catecholamine catabolic process(GO:0042424) |
| 0.1 |
0.5 |
GO:0046087 |
cytidine catabolic process(GO:0006216) cytidine deamination(GO:0009972) cytidine metabolic process(GO:0046087) pyrimidine ribonucleoside catabolic process(GO:0046133) |
| 0.1 |
0.2 |
GO:1904808 |
regulation of protein oxidation(GO:1904806) positive regulation of protein oxidation(GO:1904808) |
| 0.1 |
0.1 |
GO:0002884 |
regulation of type IV hypersensitivity(GO:0001807) negative regulation of type IV hypersensitivity(GO:0001808) negative regulation of hypersensitivity(GO:0002884) |
| 0.1 |
0.2 |
GO:0006108 |
malate metabolic process(GO:0006108) |
| 0.0 |
0.1 |
GO:0007056 |
spindle assembly involved in female meiosis(GO:0007056) |
| 0.0 |
0.1 |
GO:0072344 |
rescue of stalled ribosome(GO:0072344) |
| 0.0 |
0.1 |
GO:0060762 |
regulation of branching involved in mammary gland duct morphogenesis(GO:0060762) |
| 0.0 |
0.0 |
GO:0072387 |
flavin adenine dinucleotide metabolic process(GO:0072387) |
| 0.0 |
1.0 |
GO:0035235 |
ionotropic glutamate receptor signaling pathway(GO:0035235) |
| 0.0 |
0.6 |
GO:0001731 |
formation of translation preinitiation complex(GO:0001731) |
| 0.0 |
0.0 |
GO:0090309 |
positive regulation of methylation-dependent chromatin silencing(GO:0090309) |
| 0.0 |
0.2 |
GO:0072656 |
maintenance of protein location in mitochondrion(GO:0072656) |
| 0.0 |
0.3 |
GO:0002755 |
MyD88-dependent toll-like receptor signaling pathway(GO:0002755) |
| 0.0 |
0.6 |
GO:0089711 |
L-glutamate transmembrane transport(GO:0089711) |
| 0.0 |
0.2 |
GO:0006348 |
chromatin silencing at telomere(GO:0006348) |
| 0.0 |
0.4 |
GO:0006554 |
lysine catabolic process(GO:0006554) |
| 0.0 |
0.2 |
GO:0001971 |
activation of membrane attack complex(GO:0001905) regulation of activation of membrane attack complex(GO:0001969) negative regulation of activation of membrane attack complex(GO:0001971) |
| 0.0 |
0.9 |
GO:0003310 |
pancreatic A cell differentiation(GO:0003310) |
| 0.0 |
0.1 |
GO:0031577 |
spindle checkpoint(GO:0031577) |
| 0.0 |
0.0 |
GO:0009233 |
menaquinone metabolic process(GO:0009233) |
| 0.0 |
0.1 |
GO:0008272 |
sulfate transport(GO:0008272) |
| 0.0 |
0.7 |
GO:0070262 |
peptidyl-serine dephosphorylation(GO:0070262) |
| 0.0 |
0.1 |
GO:0006391 |
transcription initiation from mitochondrial promoter(GO:0006391) |
| 0.0 |
0.2 |
GO:1902412 |
regulation of mitotic cytokinesis(GO:1902412) |
| 0.0 |
0.5 |
GO:0006107 |
oxaloacetate metabolic process(GO:0006107) |
| 0.0 |
0.1 |
GO:1902630 |
regulation of membrane hyperpolarization(GO:1902630) |
| 0.0 |
0.2 |
GO:0090315 |
negative regulation of protein targeting to membrane(GO:0090315) |
| 0.0 |
2.5 |
GO:0006968 |
cellular defense response(GO:0006968) |
| 0.0 |
1.4 |
GO:0018149 |
peptide cross-linking(GO:0018149) |
| 0.0 |
0.2 |
GO:0006982 |
response to lipid hydroperoxide(GO:0006982) |
| 0.0 |
0.8 |
GO:0006183 |
GTP biosynthetic process(GO:0006183) |
| 0.0 |
0.4 |
GO:0051725 |
protein de-ADP-ribosylation(GO:0051725) |
| 0.0 |
0.4 |
GO:0007144 |
female meiosis I(GO:0007144) |
| 0.0 |
0.7 |
GO:0050482 |
arachidonic acid secretion(GO:0050482) arachidonate transport(GO:1903963) |
| 0.0 |
0.3 |
GO:0098700 |
neurotransmitter loading into synaptic vesicle(GO:0098700) |
| 0.0 |
0.1 |
GO:0018874 |
benzoate metabolic process(GO:0018874) |
| 0.0 |
0.2 |
GO:0032971 |
regulation of muscle filament sliding(GO:0032971) |
| 0.0 |
2.7 |
GO:0045071 |
negative regulation of viral genome replication(GO:0045071) |
| 0.0 |
0.2 |
GO:0043152 |
induction of bacterial agglutination(GO:0043152) |
| 0.0 |
0.1 |
GO:0002933 |
lipid hydroxylation(GO:0002933) |
| 0.0 |
0.5 |
GO:0017182 |
peptidyl-diphthamide metabolic process(GO:0017182) peptidyl-diphthamide biosynthetic process from peptidyl-histidine(GO:0017183) |
| 0.0 |
0.2 |
GO:0061073 |
ciliary body morphogenesis(GO:0061073) |
| 0.0 |
0.4 |
GO:0098780 |
response to mitochondrial depolarisation(GO:0098780) |
| 0.0 |
0.2 |
GO:0045835 |
negative regulation of meiotic nuclear division(GO:0045835) |
| 0.0 |
0.5 |
GO:0000338 |
protein deneddylation(GO:0000338) |
| 0.0 |
1.1 |
GO:0017004 |
cytochrome complex assembly(GO:0017004) |
| 0.0 |
0.2 |
GO:1905224 |
clathrin-coated pit assembly(GO:1905224) |
| 0.0 |
0.3 |
GO:0035641 |
locomotory exploration behavior(GO:0035641) |
| 0.0 |
0.1 |
GO:0097274 |
urea homeostasis(GO:0097274) |
| 0.0 |
0.2 |
GO:0045903 |
positive regulation of translational fidelity(GO:0045903) |
| 0.0 |
0.5 |
GO:0019852 |
L-ascorbic acid metabolic process(GO:0019852) |
| 0.0 |
0.6 |
GO:0048247 |
lymphocyte chemotaxis(GO:0048247) |
| 0.0 |
0.0 |
GO:0060546 |
negative regulation of necroptotic process(GO:0060546) |
| 0.0 |
0.1 |
GO:0018916 |
nitrobenzene metabolic process(GO:0018916) |
| 0.0 |
0.1 |
GO:0030186 |
melatonin metabolic process(GO:0030186) melatonin biosynthetic process(GO:0030187) |
| 0.0 |
1.3 |
GO:0050690 |
regulation of defense response to virus by virus(GO:0050690) |
| 0.0 |
1.0 |
GO:0072600 |
establishment of protein localization to Golgi(GO:0072600) |
| 0.0 |
0.2 |
GO:1902902 |
negative regulation of autophagosome assembly(GO:1902902) |
| 0.0 |
0.4 |
GO:0042759 |
long-chain fatty acid biosynthetic process(GO:0042759) |
| 0.0 |
0.3 |
GO:0048312 |
intracellular distribution of mitochondria(GO:0048312) |
| 0.0 |
0.7 |
GO:0042149 |
cellular response to glucose starvation(GO:0042149) |
| 0.0 |
0.1 |
GO:0002904 |
positive regulation of B cell apoptotic process(GO:0002904) |
| 0.0 |
0.1 |
GO:0006421 |
asparaginyl-tRNA aminoacylation(GO:0006421) |
| 0.0 |
4.5 |
GO:0038096 |
immune response-regulating cell surface receptor signaling pathway involved in phagocytosis(GO:0002433) Fc-gamma receptor signaling pathway involved in phagocytosis(GO:0038096) |
| 0.0 |
0.5 |
GO:0000028 |
ribosomal small subunit assembly(GO:0000028) |
| 0.0 |
3.9 |
GO:0015992 |
proton transport(GO:0015992) |
| 0.0 |
0.2 |
GO:0090344 |
negative regulation of cell aging(GO:0090344) |
| 0.0 |
0.5 |
GO:0048298 |
positive regulation of isotype switching to IgA isotypes(GO:0048298) |
| 0.0 |
0.2 |
GO:2000270 |
negative regulation of fibroblast apoptotic process(GO:2000270) |
| 0.0 |
0.1 |
GO:0044362 |
modulation of molecular function in other organism(GO:0044359) negative regulation of molecular function in other organism(GO:0044362) negative regulation of molecular function in other organism involved in symbiotic interaction(GO:0052204) modulation of molecular function in other organism involved in symbiotic interaction(GO:0052205) modification by host of symbiont molecular function(GO:0052428) |
| 0.0 |
0.2 |
GO:0097049 |
motor neuron apoptotic process(GO:0097049) |
| 0.0 |
1.2 |
GO:0000188 |
inactivation of MAPK activity(GO:0000188) |
| 0.0 |
0.2 |
GO:0072718 |
response to cisplatin(GO:0072718) |
| 0.0 |
1.0 |
GO:0010591 |
regulation of lamellipodium assembly(GO:0010591) |
| 0.0 |
0.1 |
GO:0038193 |
thromboxane A2 signaling pathway(GO:0038193) |
| 0.0 |
0.3 |
GO:0051560 |
mitochondrial calcium ion homeostasis(GO:0051560) |
| 0.0 |
0.7 |
GO:0070534 |
protein K63-linked ubiquitination(GO:0070534) |
| 0.0 |
0.4 |
GO:0071712 |
ER-associated misfolded protein catabolic process(GO:0071712) |
| 0.0 |
0.7 |
GO:1903830 |
magnesium ion transmembrane transport(GO:1903830) |
| 0.0 |
0.1 |
GO:1901799 |
negative regulation of proteasomal protein catabolic process(GO:1901799) |
| 0.0 |
0.6 |
GO:0007158 |
neuron cell-cell adhesion(GO:0007158) |
| 0.0 |
0.2 |
GO:0000491 |
small nucleolar ribonucleoprotein complex assembly(GO:0000491) |
| 0.0 |
0.0 |
GO:0072076 |
nephrogenic mesenchyme development(GO:0072076) |
| 0.0 |
0.1 |
GO:0002118 |
aggressive behavior(GO:0002118) |
| 0.0 |
0.3 |
GO:0002943 |
tRNA dihydrouridine synthesis(GO:0002943) |
| 0.0 |
0.4 |
GO:0042340 |
keratan sulfate catabolic process(GO:0042340) |
| 0.0 |
0.2 |
GO:0035524 |
proline transmembrane transport(GO:0035524) |
| 0.0 |
0.2 |
GO:0071799 |
response to prostaglandin D(GO:0071798) cellular response to prostaglandin D stimulus(GO:0071799) |
| 0.0 |
0.1 |
GO:0006398 |
mRNA 3'-end processing by stem-loop binding and cleavage(GO:0006398) |
| 0.0 |
0.1 |
GO:0009730 |
detection of carbohydrate stimulus(GO:0009730) detection of hexose stimulus(GO:0009732) detection of monosaccharide stimulus(GO:0034287) detection of glucose(GO:0051594) |
| 0.0 |
0.1 |
GO:0035564 |
regulation of kidney size(GO:0035564) |
| 0.0 |
0.1 |
GO:1904526 |
regulation of microtubule binding(GO:1904526) |
| 0.0 |
0.0 |
GO:0035523 |
protein K29-linked deubiquitination(GO:0035523) protein K33-linked deubiquitination(GO:1990168) |
| 0.0 |
0.3 |
GO:0051988 |
regulation of attachment of spindle microtubules to kinetochore(GO:0051988) |
| 0.0 |
0.4 |
GO:0046794 |
transport of virus(GO:0046794) |
| 0.0 |
0.1 |
GO:0097475 |
motor neuron migration(GO:0097475) |
| 0.0 |
0.4 |
GO:2000059 |
negative regulation of protein ubiquitination involved in ubiquitin-dependent protein catabolic process(GO:2000059) |
| 0.0 |
10.0 |
GO:0000377 |
RNA splicing, via transesterification reactions with bulged adenosine as nucleophile(GO:0000377) mRNA splicing, via spliceosome(GO:0000398) |
| 0.0 |
0.6 |
GO:0043171 |
peptide catabolic process(GO:0043171) |
| 0.0 |
0.3 |
GO:0044003 |
modification by symbiont of host morphology or physiology(GO:0044003) |
| 0.0 |
0.1 |
GO:0006147 |
guanine catabolic process(GO:0006147) |
| 0.0 |
0.2 |
GO:0000727 |
double-strand break repair via break-induced replication(GO:0000727) |
| 0.0 |
0.0 |
GO:0007143 |
female meiotic division(GO:0007143) |
| 0.0 |
0.1 |
GO:0061502 |
early endosome to recycling endosome transport(GO:0061502) |
| 0.0 |
0.4 |
GO:0006098 |
pentose-phosphate shunt(GO:0006098) |
| 0.0 |
0.1 |
GO:0070172 |
positive regulation of tooth mineralization(GO:0070172) |
| 0.0 |
0.1 |
GO:0050917 |
sensory perception of umami taste(GO:0050917) |
| 0.0 |
0.1 |
GO:0070861 |
regulation of protein exit from endoplasmic reticulum(GO:0070861) |
| 0.0 |
0.3 |
GO:0090204 |
protein localization to nuclear pore(GO:0090204) |
| 0.0 |
0.1 |
GO:0071168 |
protein localization to chromatin(GO:0071168) |
| 0.0 |
0.1 |
GO:0090119 |
vesicle-mediated cholesterol transport(GO:0090119) |
| 0.0 |
0.1 |
GO:0010917 |
negative regulation of mitochondrial membrane potential(GO:0010917) negative regulation of membrane potential(GO:0045837) |
| 0.0 |
0.1 |
GO:0035790 |
platelet-derived growth factor receptor-alpha signaling pathway(GO:0035790) |
| 0.0 |
0.5 |
GO:0045116 |
protein neddylation(GO:0045116) |
| 0.0 |
0.9 |
GO:0022400 |
regulation of rhodopsin mediated signaling pathway(GO:0022400) |
| 0.0 |
0.3 |
GO:0006268 |
DNA unwinding involved in DNA replication(GO:0006268) |
| 0.0 |
0.1 |
GO:0022027 |
interkinetic nuclear migration(GO:0022027) |
| 0.0 |
0.4 |
GO:0070932 |
histone H3 deacetylation(GO:0070932) |
| 0.0 |
0.1 |
GO:0071763 |
nuclear membrane organization(GO:0071763) |
| 0.0 |
0.1 |
GO:0021548 |
pons development(GO:0021548) |
| 0.0 |
0.1 |
GO:1990123 |
amino acid import into cell(GO:1902837) L-glutamate(1-) import into cell(GO:1903802) L-glutamate import into cell(GO:1990123) |
| 0.0 |
0.3 |
GO:0034498 |
early endosome to Golgi transport(GO:0034498) |
| 0.0 |
0.3 |
GO:0045948 |
positive regulation of translational initiation(GO:0045948) |
| 0.0 |
1.4 |
GO:0046580 |
negative regulation of Ras protein signal transduction(GO:0046580) negative regulation of small GTPase mediated signal transduction(GO:0051058) |
| 0.0 |
0.1 |
GO:0042346 |
positive regulation of NF-kappaB import into nucleus(GO:0042346) |
| 0.0 |
0.1 |
GO:0003164 |
His-Purkinje system development(GO:0003164) |
| 0.0 |
0.2 |
GO:0035635 |
entry of bacterium into host cell(GO:0035635) |
| 0.0 |
0.1 |
GO:1900191 |
biofilm formation(GO:0042710) single-species biofilm formation(GO:0044010) single-species biofilm formation in or on host organism(GO:0044407) regulation of single-species biofilm formation(GO:1900190) negative regulation of single-species biofilm formation(GO:1900191) regulation of single-species biofilm formation in or on host organism(GO:1900228) negative regulation of single-species biofilm formation in or on host organism(GO:1900229) |
| 0.0 |
0.1 |
GO:0071955 |
recycling endosome to Golgi transport(GO:0071955) |
| 0.0 |
0.1 |
GO:0046462 |
monoacylglycerol metabolic process(GO:0046462) monoacylglycerol catabolic process(GO:0052651) |
| 0.0 |
0.2 |
GO:0006089 |
lactate metabolic process(GO:0006089) |
| 0.0 |
0.1 |
GO:0038060 |
nitric oxide-cGMP-mediated signaling pathway(GO:0038060) |
| 0.0 |
1.5 |
GO:0048791 |
calcium ion-regulated exocytosis of neurotransmitter(GO:0048791) |
| 0.0 |
0.1 |
GO:0060054 |
positive regulation of epithelial cell proliferation involved in wound healing(GO:0060054) |
| 0.0 |
0.0 |
GO:0051919 |
positive regulation of fibrinolysis(GO:0051919) |
| 0.0 |
0.8 |
GO:1904837 |
beta-catenin-TCF complex assembly(GO:1904837) |
| 0.0 |
0.0 |
GO:0044205 |
'de novo' UMP biosynthetic process(GO:0044205) |
| 0.0 |
0.1 |
GO:0006065 |
UDP-glucuronate biosynthetic process(GO:0006065) |
| 0.0 |
0.1 |
GO:0032055 |
negative regulation of translation in response to stress(GO:0032055) |
| 0.0 |
0.2 |
GO:0009226 |
nucleotide-sugar biosynthetic process(GO:0009226) |
| 0.0 |
0.1 |
GO:0021891 |
olfactory bulb interneuron development(GO:0021891) |
| 0.0 |
0.1 |
GO:0072237 |
metanephric proximal tubule development(GO:0072237) |
| 0.0 |
0.0 |
GO:0070142 |
synaptic vesicle budding(GO:0070142) |
| 0.0 |
0.0 |
GO:0003245 |
cardiac muscle tissue growth involved in heart morphogenesis(GO:0003245) |
| 0.0 |
0.0 |
GO:1900020 |
regulation of protein kinase C activity(GO:1900019) positive regulation of protein kinase C activity(GO:1900020) |
| 0.0 |
0.4 |
GO:0010569 |
regulation of double-strand break repair via homologous recombination(GO:0010569) |
| 0.0 |
0.1 |
GO:0019747 |
regulation of isoprenoid metabolic process(GO:0019747) |
| 0.0 |
0.6 |
GO:1904659 |
hexose transmembrane transport(GO:0035428) glucose transmembrane transport(GO:1904659) |
| 0.0 |
0.1 |
GO:1903543 |
positive regulation of exosomal secretion(GO:1903543) |
| 0.0 |
0.2 |
GO:0044375 |
regulation of peroxisome size(GO:0044375) |
| 0.0 |
0.1 |
GO:0097500 |
receptor localization to nonmotile primary cilium(GO:0097500) |
| 0.0 |
0.6 |
GO:0010761 |
fibroblast migration(GO:0010761) |
| 0.0 |
0.1 |
GO:0070307 |
lens fiber cell development(GO:0070307) |
| 0.0 |
0.2 |
GO:0042059 |
negative regulation of epidermal growth factor receptor signaling pathway(GO:0042059) |
| 0.0 |
0.0 |
GO:2000660 |
negative regulation of interleukin-1-mediated signaling pathway(GO:2000660) |
| 0.0 |
0.1 |
GO:0071073 |
positive regulation of phospholipid biosynthetic process(GO:0071073) |
| 0.0 |
0.3 |
GO:0043562 |
cellular response to nitrogen starvation(GO:0006995) cellular response to nitrogen levels(GO:0043562) |
| 0.0 |
0.1 |
GO:0060525 |
prostate glandular acinus development(GO:0060525) prostate gland morphogenetic growth(GO:0060737) |
| 0.0 |
0.1 |
GO:0006616 |
SRP-dependent cotranslational protein targeting to membrane, translocation(GO:0006616) |
| 0.0 |
0.0 |
GO:0071874 |
response to norepinephrine(GO:0071873) cellular response to norepinephrine stimulus(GO:0071874) |
| 0.0 |
0.1 |
GO:0015015 |
heparan sulfate proteoglycan biosynthetic process, enzymatic modification(GO:0015015) |
| 0.0 |
0.0 |
GO:1901563 |
response to camptothecin(GO:1901563) |
| 0.0 |
0.1 |
GO:1900118 |
negative regulation of execution phase of apoptosis(GO:1900118) |
| 0.0 |
0.1 |
GO:0042345 |
regulation of NF-kappaB import into nucleus(GO:0042345) NF-kappaB import into nucleus(GO:0042348) |
| 0.0 |
0.1 |
GO:0046322 |
negative regulation of fatty acid oxidation(GO:0046322) |
| 0.0 |
0.2 |
GO:0045039 |
protein import into mitochondrial inner membrane(GO:0045039) |
| 0.0 |
0.2 |
GO:0038003 |
opioid receptor signaling pathway(GO:0038003) |
| 0.0 |
0.1 |
GO:0046102 |
inosine metabolic process(GO:0046102) |
| 0.0 |
0.0 |
GO:0090435 |
protein localization to nuclear envelope(GO:0090435) |
| 0.0 |
0.1 |
GO:0000212 |
meiotic spindle organization(GO:0000212) |
| 0.0 |
0.1 |
GO:0044571 |
[2Fe-2S] cluster assembly(GO:0044571) |
| 0.0 |
0.2 |
GO:0034397 |
telomere localization(GO:0034397) |
| 0.0 |
0.2 |
GO:0000052 |
citrulline metabolic process(GO:0000052) |
| 0.0 |
2.0 |
GO:0008360 |
regulation of cell shape(GO:0008360) |
| 0.0 |
0.8 |
GO:0042273 |
ribosomal large subunit biogenesis(GO:0042273) |
| 0.0 |
0.1 |
GO:0045346 |
MHC class II biosynthetic process(GO:0045342) regulation of MHC class II biosynthetic process(GO:0045346) |
| 0.0 |
0.0 |
GO:0033119 |
negative regulation of RNA splicing(GO:0033119) |
| 0.0 |
0.0 |
GO:0097283 |
keratinocyte apoptotic process(GO:0097283) regulation of keratinocyte apoptotic process(GO:1902172) |
| 0.0 |
0.0 |
GO:1903412 |
response to bile acid(GO:1903412) |
| 0.0 |
0.0 |
GO:0060298 |
positive regulation of sarcomere organization(GO:0060298) |
| 0.0 |
0.3 |
GO:0000768 |
syncytium formation by plasma membrane fusion(GO:0000768) |
| 0.0 |
0.2 |
GO:2000479 |
regulation of cAMP-dependent protein kinase activity(GO:2000479) |
| 0.0 |
0.0 |
GO:0055070 |
copper ion homeostasis(GO:0055070) |
| 0.0 |
0.1 |
GO:0042539 |
hypotonic salinity response(GO:0042539) cellular hypotonic salinity response(GO:0071477) |
| 0.0 |
0.1 |
GO:0046504 |
ether lipid biosynthetic process(GO:0008611) glycerol ether biosynthetic process(GO:0046504) ether biosynthetic process(GO:1901503) |
| 0.0 |
0.1 |
GO:0046726 |
positive regulation by virus of viral protein levels in host cell(GO:0046726) |
| 0.0 |
0.0 |
GO:2000870 |
regulation of progesterone secretion(GO:2000870) |
| 0.0 |
0.3 |
GO:0061099 |
negative regulation of protein tyrosine kinase activity(GO:0061099) |
| 0.0 |
0.0 |
GO:0035897 |
proteolysis in other organism(GO:0035897) |
| 0.0 |
0.1 |
GO:2000210 |
positive regulation of anoikis(GO:2000210) |
| 0.0 |
0.0 |
GO:0010935 |
regulation of macrophage cytokine production(GO:0010935) |
| 0.0 |
0.0 |
GO:0060484 |
lung-associated mesenchyme development(GO:0060484) |
| 0.0 |
0.0 |
GO:1903348 |
positive regulation of bicellular tight junction assembly(GO:1903348) |
| 0.0 |
0.3 |
GO:0070286 |
axonemal dynein complex assembly(GO:0070286) |
| 0.0 |
0.1 |
GO:0009988 |
cell-cell recognition(GO:0009988) |
| 0.0 |
0.0 |
GO:0034134 |
toll-like receptor 2 signaling pathway(GO:0034134) |
| 0.0 |
0.1 |
GO:1904707 |
positive regulation of vascular smooth muscle cell proliferation(GO:1904707) |
| 0.0 |
0.1 |
GO:0035995 |
detection of muscle stretch(GO:0035995) |
| 0.0 |
0.1 |
GO:0017121 |
phospholipid scrambling(GO:0017121) |
| 0.0 |
0.3 |
GO:0018345 |
protein palmitoylation(GO:0018345) |
| 0.0 |
0.0 |
GO:0048867 |
stem cell fate determination(GO:0048867) |
| 0.0 |
0.7 |
GO:0035308 |
negative regulation of protein dephosphorylation(GO:0035308) |
| 0.0 |
0.6 |
GO:1903749 |
positive regulation of establishment of protein localization to mitochondrion(GO:1903749) |
| 0.0 |
0.1 |
GO:0007191 |
adenylate cyclase-activating dopamine receptor signaling pathway(GO:0007191) |
| 0.0 |
0.0 |
GO:0003419 |
growth plate cartilage chondrocyte proliferation(GO:0003419) |
| 0.0 |
0.0 |
GO:0042737 |
drug catabolic process(GO:0042737) |
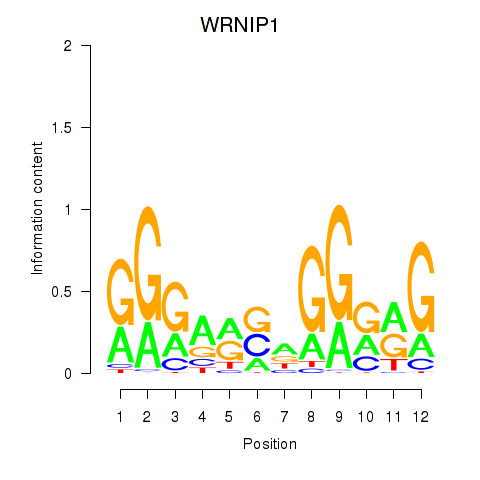
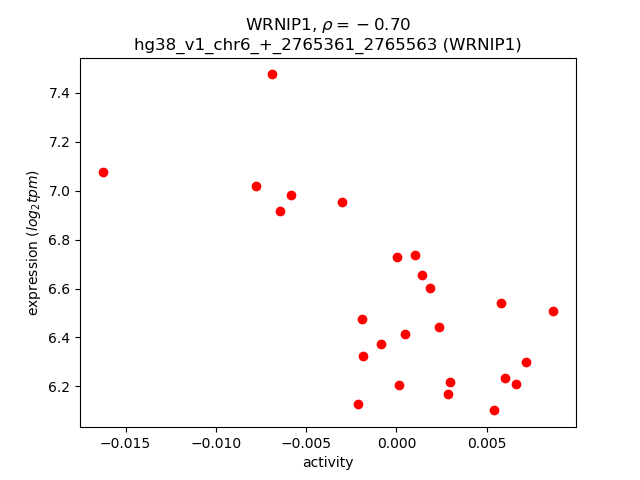

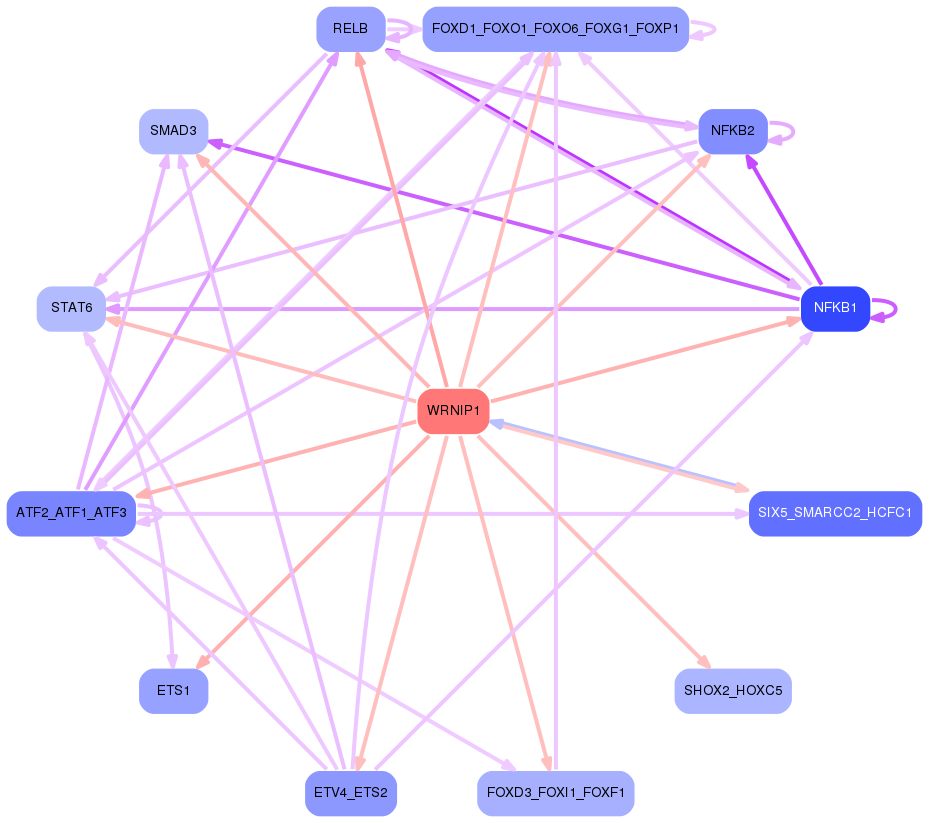