Project
Inflammatory response time course, HUVEC (Wada, 2009)
Navigation
Downloads
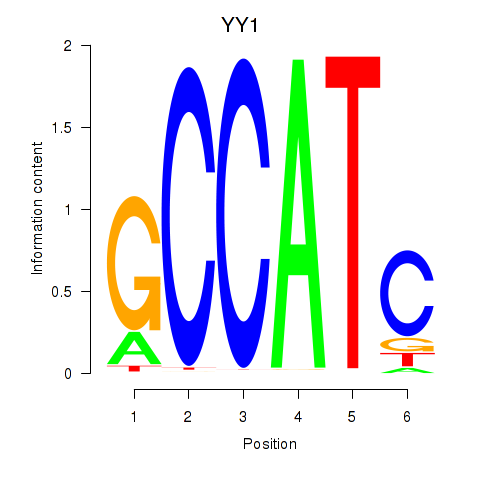
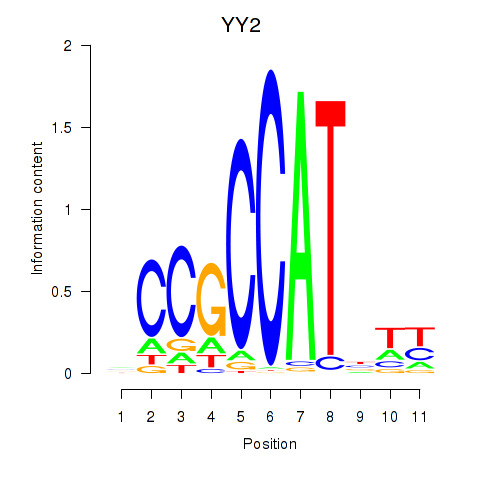
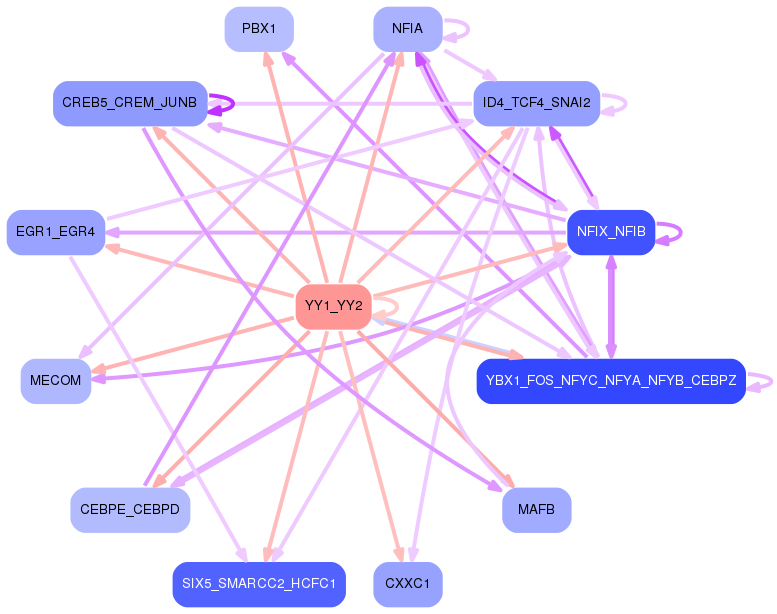
Results for YY1_YY2
Z-value: 1.05
Motif logo
Transcription factors associated with YY1_YY2
| Gene Symbol | Gene ID | Gene Info |
|---|---|---|
|
YY1
|
ENSG00000100811.14 | YY1 |
|
YY2
|
ENSG00000230797.3 | YY2 |
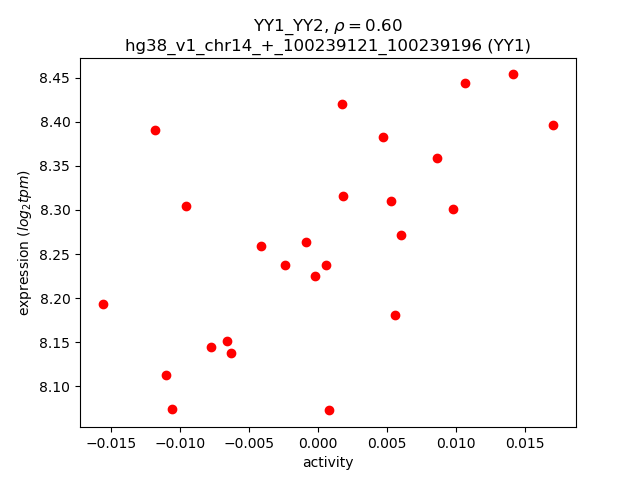
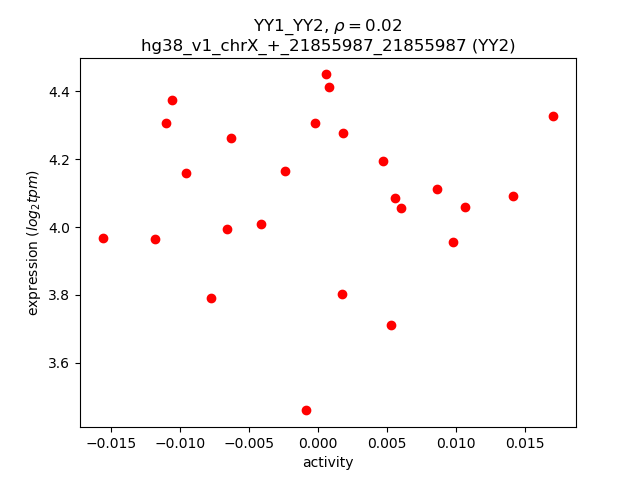
Activity-expression correlation:
| Gene | Promoter | Pearson corr. coef. | P-value | Plot |
|---|---|---|---|---|
| YY1 | hg38_v1_chr14_+_100239121_100239196 | 0.60 | 1.6e-03 | Click! |
| YY2 | hg38_v1_chrX_+_21855987_21855987 | 0.02 | 9.1e-01 | Click! |
Activity profile of YY1_YY2 motif
Sorted Z-values of YY1_YY2 motif
Network of associatons between targets according to the STRING database.

First level regulatory network of YY1_YY2
Gene Ontology Analysis
Gene overrepresentation in biological process category:
| Log-likelihood per target | Total log-likelihood | Term | Description |
|---|---|---|---|
| 1.3 | 4.0 | GO:0090341 | negative regulation of secretion of lysosomal enzymes(GO:0090341) |
| 1.1 | 3.3 | GO:0072720 | response to dithiothreitol(GO:0072720) |
| 1.0 | 2.9 | GO:0099557 | trans-synaptic signaling by trans-synaptic complex, modulating synaptic transmission(GO:0099557) |
| 0.7 | 2.8 | GO:0030472 | mitotic spindle organization in nucleus(GO:0030472) |
| 0.7 | 2.0 | GO:0090285 | negative regulation of protein glycosylation in Golgi(GO:0090285) |
| 0.6 | 2.6 | GO:1904428 | negative regulation of tubulin deacetylation(GO:1904428) |
| 0.6 | 1.8 | GO:0071288 | nitric oxide transport(GO:0030185) cerebrospinal fluid secretion(GO:0033326) cellular response to mercury ion(GO:0071288) proximal convoluted tubule development(GO:0072019) metanephric proximal convoluted tubule development(GO:0072229) |
| 0.6 | 1.7 | GO:0048213 | Golgi vesicle prefusion complex stabilization(GO:0048213) |
| 0.5 | 2.8 | GO:0038016 | insulin receptor internalization(GO:0038016) |
| 0.4 | 1.3 | GO:1901491 | negative regulation of lymphangiogenesis(GO:1901491) |
| 0.4 | 1.2 | GO:0006683 | galactosylceramide catabolic process(GO:0006683) |
| 0.4 | 1.2 | GO:0019427 | acetate biosynthetic process(GO:0019413) acetyl-CoA biosynthetic process from acetate(GO:0019427) propionate biosynthetic process(GO:0019542) |
| 0.4 | 4.0 | GO:0097646 | calcitonin family receptor signaling pathway(GO:0097646) amylin receptor signaling pathway(GO:0097647) |
| 0.4 | 1.6 | GO:0035284 | rhombomere 5 development(GO:0021571) central nervous system segmentation(GO:0035283) brain segmentation(GO:0035284) |
| 0.4 | 2.6 | GO:0060282 | positive regulation of oocyte development(GO:0060282) |
| 0.4 | 2.6 | GO:0090245 | axis elongation involved in somitogenesis(GO:0090245) |
| 0.4 | 1.5 | GO:1903756 | regulation of transcription from RNA polymerase II promoter by histone modification(GO:1903756) negative regulation of transcription from RNA polymerase II promoter by histone modification(GO:1903758) |
| 0.4 | 1.4 | GO:1903173 | phytol metabolic process(GO:0033306) fatty alcohol metabolic process(GO:1903173) |
| 0.3 | 1.0 | GO:0010520 | regulation of reciprocal meiotic recombination(GO:0010520) |
| 0.3 | 1.0 | GO:0050720 | regulation of interleukin-1 biosynthetic process(GO:0045360) positive regulation of interleukin-1 biosynthetic process(GO:0045362) interleukin-1 beta biosynthetic process(GO:0050720) response to interleukin-8(GO:0098758) cellular response to interleukin-8(GO:0098759) |
| 0.3 | 1.6 | GO:0043988 | histone H3-S28 phosphorylation(GO:0043988) |
| 0.3 | 1.1 | GO:0002541 | activation of plasma proteins involved in acute inflammatory response(GO:0002541) |
| 0.2 | 0.7 | GO:0046709 | IDP metabolic process(GO:0046707) IDP catabolic process(GO:0046709) |
| 0.2 | 1.2 | GO:0043504 | mitochondrial DNA repair(GO:0043504) |
| 0.2 | 1.2 | GO:1901202 | negative regulation of extracellular matrix assembly(GO:1901202) |
| 0.2 | 0.7 | GO:0035494 | SNARE complex disassembly(GO:0035494) |
| 0.2 | 1.3 | GO:0071051 | polyadenylation-dependent snoRNA 3'-end processing(GO:0071051) |
| 0.2 | 1.1 | GO:0002545 | chronic inflammatory response to non-antigenic stimulus(GO:0002545) regulation of chronic inflammatory response to non-antigenic stimulus(GO:0002880) |
| 0.2 | 1.5 | GO:0016584 | nucleosome positioning(GO:0016584) |
| 0.2 | 1.7 | GO:0089700 | protein kinase D signaling(GO:0089700) |
| 0.2 | 0.6 | GO:0002585 | positive regulation of antigen processing and presentation of peptide or polysaccharide antigen via MHC class II(GO:0002582) positive regulation of antigen processing and presentation of peptide antigen(GO:0002585) positive regulation of antigen processing and presentation of peptide antigen via MHC class II(GO:0002588) |
| 0.2 | 0.6 | GO:1904772 | hepatocyte homeostasis(GO:0036333) response to tetrachloromethane(GO:1904772) |
| 0.2 | 1.1 | GO:0016036 | cellular response to phosphate starvation(GO:0016036) positive regulation of sulfur amino acid metabolic process(GO:0031337) positive regulation of homocysteine metabolic process(GO:0050668) |
| 0.2 | 0.5 | GO:0097156 | fasciculation of motor neuron axon(GO:0097156) |
| 0.2 | 1.0 | GO:0071461 | cellular response to redox state(GO:0071461) |
| 0.2 | 1.8 | GO:0051344 | negative regulation of cyclic-nucleotide phosphodiesterase activity(GO:0051344) |
| 0.2 | 1.6 | GO:0006627 | protein processing involved in protein targeting to mitochondrion(GO:0006627) |
| 0.2 | 0.6 | GO:0044313 | protein K6-linked deubiquitination(GO:0044313) |
| 0.2 | 0.5 | GO:0010808 | positive regulation of synaptic vesicle priming(GO:0010808) |
| 0.2 | 1.4 | GO:0001661 | conditioned taste aversion(GO:0001661) |
| 0.2 | 0.5 | GO:1904604 | regulation of connective tissue replacement involved in inflammatory response wound healing(GO:1904596) negative regulation of connective tissue replacement involved in inflammatory response wound healing(GO:1904597) regulation of advanced glycation end-product receptor activity(GO:1904603) negative regulation of advanced glycation end-product receptor activity(GO:1904604) negative regulation of connective tissue replacement(GO:1905204) |
| 0.2 | 0.6 | GO:0044416 | induction by symbiont of host defense response(GO:0044416) induction of host immune response by virus(GO:0046730) active induction of host immune response by virus(GO:0046732) modulation by symbiont of host defense response(GO:0052031) induction by organism of defense response of other organism involved in symbiotic interaction(GO:0052251) modulation by organism of defense response of other organism involved in symbiotic interaction(GO:0052255) positive regulation by symbiont of host defense response(GO:0052509) positive regulation by organism of defense response of other organism involved in symbiotic interaction(GO:0052510) modulation by organism of immune response of other organism involved in symbiotic interaction(GO:0052552) modulation by symbiont of host immune response(GO:0052553) modulation by virus of host immune response(GO:0075528) |
| 0.2 | 0.8 | GO:0019626 | short-chain fatty acid catabolic process(GO:0019626) |
| 0.2 | 2.3 | GO:0019388 | galactose catabolic process(GO:0019388) |
| 0.1 | 1.9 | GO:0043983 | histone H4-K12 acetylation(GO:0043983) |
| 0.1 | 0.7 | GO:0018076 | N-terminal peptidyl-lysine acetylation(GO:0018076) |
| 0.1 | 2.1 | GO:0000338 | protein deneddylation(GO:0000338) |
| 0.1 | 0.8 | GO:0070940 | dephosphorylation of RNA polymerase II C-terminal domain(GO:0070940) |
| 0.1 | 0.7 | GO:0015742 | alpha-ketoglutarate transport(GO:0015742) |
| 0.1 | 1.5 | GO:0006552 | leucine catabolic process(GO:0006552) |
| 0.1 | 0.4 | GO:0051596 | methylglyoxal catabolic process to D-lactate via S-lactoyl-glutathione(GO:0019243) methylglyoxal catabolic process(GO:0051596) methylglyoxal catabolic process to lactate(GO:0061727) |
| 0.1 | 1.7 | GO:1900028 | negative regulation of ruffle assembly(GO:1900028) |
| 0.1 | 0.4 | GO:1903004 | regulation of protein K63-linked deubiquitination(GO:1903004) positive regulation of protein K63-linked deubiquitination(GO:1903006) |
| 0.1 | 1.3 | GO:0070417 | cellular response to cold(GO:0070417) |
| 0.1 | 0.9 | GO:0043461 | proton-transporting ATP synthase complex assembly(GO:0043461) proton-transporting ATP synthase complex biogenesis(GO:0070272) |
| 0.1 | 0.4 | GO:0046416 | D-amino acid metabolic process(GO:0046416) |
| 0.1 | 0.6 | GO:1901503 | ether lipid biosynthetic process(GO:0008611) glycerol ether biosynthetic process(GO:0046504) ether biosynthetic process(GO:1901503) |
| 0.1 | 1.1 | GO:0006335 | DNA replication-dependent nucleosome assembly(GO:0006335) DNA replication-dependent nucleosome organization(GO:0034723) |
| 0.1 | 0.5 | GO:0070221 | sulfide oxidation(GO:0019418) sulfide oxidation, using sulfide:quinone oxidoreductase(GO:0070221) |
| 0.1 | 0.5 | GO:0005986 | sucrose biosynthetic process(GO:0005986) |
| 0.1 | 0.4 | GO:0097187 | dentinogenesis(GO:0097187) |
| 0.1 | 0.7 | GO:0030311 | poly-N-acetyllactosamine biosynthetic process(GO:0030311) |
| 0.1 | 0.5 | GO:0051562 | negative regulation of mitochondrial calcium ion concentration(GO:0051562) |
| 0.1 | 0.5 | GO:0006121 | mitochondrial electron transport, succinate to ubiquinone(GO:0006121) |
| 0.1 | 1.2 | GO:0060005 | vestibular reflex(GO:0060005) |
| 0.1 | 2.1 | GO:0098909 | regulation of cardiac muscle cell action potential involved in regulation of contraction(GO:0098909) |
| 0.1 | 0.3 | GO:1904899 | regulation of hepatic stellate cell proliferation(GO:1904897) positive regulation of hepatic stellate cell proliferation(GO:1904899) hepatic stellate cell proliferation(GO:1990922) |
| 0.1 | 0.3 | GO:0030505 | inorganic diphosphate transport(GO:0030505) |
| 0.1 | 0.8 | GO:0045541 | negative regulation of cholesterol biosynthetic process(GO:0045541) negative regulation of cholesterol metabolic process(GO:0090206) |
| 0.1 | 0.3 | GO:0060995 | cell-cell signaling involved in kidney development(GO:0060995) Wnt signaling pathway involved in kidney development(GO:0061289) canonical Wnt signaling pathway involved in metanephric kidney development(GO:0061290) cell-cell signaling involved in metanephros development(GO:0072204) |
| 0.1 | 1.1 | GO:0061469 | regulation of type B pancreatic cell proliferation(GO:0061469) |
| 0.1 | 0.3 | GO:0060392 | negative regulation of SMAD protein import into nucleus(GO:0060392) |
| 0.1 | 1.1 | GO:0016255 | attachment of GPI anchor to protein(GO:0016255) |
| 0.1 | 1.0 | GO:2001206 | positive regulation of osteoclast development(GO:2001206) |
| 0.1 | 0.4 | GO:0006669 | sphinganine-1-phosphate biosynthetic process(GO:0006669) |
| 0.1 | 0.4 | GO:0006210 | pyrimidine nucleobase catabolic process(GO:0006208) thymine catabolic process(GO:0006210) thymine metabolic process(GO:0019859) |
| 0.1 | 0.5 | GO:2001295 | malonyl-CoA biosynthetic process(GO:2001295) |
| 0.1 | 0.3 | GO:0070682 | proteasome regulatory particle assembly(GO:0070682) |
| 0.1 | 0.3 | GO:0050760 | negative regulation of thymidylate synthase biosynthetic process(GO:0050760) |
| 0.1 | 0.6 | GO:0070829 | response to vitamin B2(GO:0033274) heterochromatin maintenance(GO:0070829) |
| 0.1 | 0.3 | GO:1905053 | regulation of base-excision repair(GO:1905051) positive regulation of base-excision repair(GO:1905053) |
| 0.1 | 0.3 | GO:0014846 | esophagus smooth muscle contraction(GO:0014846) |
| 0.1 | 0.8 | GO:0031022 | nuclear migration along microfilament(GO:0031022) |
| 0.1 | 1.0 | GO:2000601 | positive regulation of Arp2/3 complex-mediated actin nucleation(GO:2000601) |
| 0.1 | 0.3 | GO:0046077 | dUDP biosynthetic process(GO:0006227) dTDP biosynthetic process(GO:0006233) pyrimidine nucleoside diphosphate biosynthetic process(GO:0009139) pyrimidine deoxyribonucleoside diphosphate metabolic process(GO:0009196) pyrimidine deoxyribonucleoside diphosphate biosynthetic process(GO:0009197) dTDP metabolic process(GO:0046072) dUDP metabolic process(GO:0046077) |
| 0.1 | 0.6 | GO:0072367 | regulation of lipid transport by regulation of transcription from RNA polymerase II promoter(GO:0072367) |
| 0.1 | 1.1 | GO:0017062 | respiratory chain complex III assembly(GO:0017062) mitochondrial respiratory chain complex III assembly(GO:0034551) |
| 0.1 | 0.3 | GO:1990926 | short-term synaptic potentiation(GO:1990926) |
| 0.1 | 0.6 | GO:1903012 | positive regulation of bone development(GO:1903012) |
| 0.1 | 1.0 | GO:1904885 | beta-catenin destruction complex assembly(GO:1904885) |
| 0.1 | 0.5 | GO:0090521 | glomerular visceral epithelial cell migration(GO:0090521) |
| 0.1 | 0.3 | GO:0061428 | negative regulation of transcription from RNA polymerase II promoter in response to hypoxia(GO:0061428) |
| 0.1 | 0.1 | GO:0045039 | protein import into mitochondrial inner membrane(GO:0045039) |
| 0.1 | 1.9 | GO:0009083 | branched-chain amino acid catabolic process(GO:0009083) |
| 0.1 | 0.5 | GO:0015680 | intracellular copper ion transport(GO:0015680) |
| 0.1 | 0.3 | GO:1900276 | regulation of proteinase activated receptor activity(GO:1900276) negative regulation of phospholipase C-activating G-protein coupled receptor signaling pathway(GO:1900737) |
| 0.1 | 1.0 | GO:0001955 | blood vessel maturation(GO:0001955) |
| 0.1 | 0.3 | GO:0030576 | Cajal body organization(GO:0030576) |
| 0.1 | 0.7 | GO:0002329 | pre-B cell differentiation(GO:0002329) |
| 0.1 | 0.4 | GO:0044240 | multicellular organism lipid catabolic process(GO:0044240) |
| 0.1 | 0.7 | GO:0007185 | transmembrane receptor protein tyrosine phosphatase signaling pathway(GO:0007185) |
| 0.1 | 0.2 | GO:2000793 | cell proliferation involved in heart valve development(GO:2000793) |
| 0.1 | 0.2 | GO:0051695 | actin filament uncapping(GO:0051695) |
| 0.1 | 1.1 | GO:0007288 | sperm axoneme assembly(GO:0007288) |
| 0.1 | 0.5 | GO:0006432 | phenylalanyl-tRNA aminoacylation(GO:0006432) |
| 0.1 | 0.9 | GO:2000795 | negative regulation of epithelial cell proliferation involved in lung morphogenesis(GO:2000795) |
| 0.1 | 0.3 | GO:0033484 | nitric oxide homeostasis(GO:0033484) |
| 0.1 | 0.2 | GO:0061114 | optic placode formation(GO:0001743) hepatocyte cell migration(GO:0002194) otic placode formation(GO:0043049) optic placode formation involved in camera-type eye formation(GO:0046619) branching involved in pancreas morphogenesis(GO:0061114) acinar cell differentiation(GO:0090425) positive regulation of forebrain neuron differentiation(GO:2000979) |
| 0.1 | 0.2 | GO:0046005 | positive regulation of circadian sleep/wake cycle, REM sleep(GO:0046005) |
| 0.1 | 0.4 | GO:0070358 | actin polymerization-dependent cell motility(GO:0070358) |
| 0.1 | 0.5 | GO:0048549 | positive regulation of pinocytosis(GO:0048549) |
| 0.1 | 0.3 | GO:0007538 | primary sex determination(GO:0007538) |
| 0.1 | 0.4 | GO:0045925 | positive regulation of female receptivity(GO:0045925) |
| 0.1 | 0.3 | GO:0021555 | midbrain-hindbrain boundary morphogenesis(GO:0021555) fourth ventricle development(GO:0021592) |
| 0.1 | 0.3 | GO:0021678 | third ventricle development(GO:0021678) |
| 0.1 | 0.4 | GO:0034499 | late endosome to Golgi transport(GO:0034499) |
| 0.1 | 0.2 | GO:0031393 | negative regulation of prostaglandin biosynthetic process(GO:0031393) negative regulation of helicase activity(GO:0051097) negative regulation of response to alcohol(GO:1901420) |
| 0.1 | 0.2 | GO:0061386 | closure of optic fissure(GO:0061386) negative regulation of integrin-mediated signaling pathway(GO:2001045) |
| 0.1 | 0.1 | GO:1903094 | regulation of protein K48-linked deubiquitination(GO:1903093) negative regulation of protein K48-linked deubiquitination(GO:1903094) negative regulation of ubiquitin-specific protease activity(GO:2000157) |
| 0.1 | 0.4 | GO:0010032 | meiotic chromosome condensation(GO:0010032) |
| 0.1 | 0.3 | GO:2001181 | positive regulation of interleukin-10 secretion(GO:2001181) |
| 0.1 | 1.0 | GO:0006975 | DNA damage induced protein phosphorylation(GO:0006975) |
| 0.1 | 0.3 | GO:0042695 | thelarche(GO:0042695) mammary gland branching involved in thelarche(GO:0060744) |
| 0.1 | 0.3 | GO:0046668 | regulation of retinal cell programmed cell death(GO:0046668) |
| 0.1 | 0.1 | GO:0010793 | regulation of mRNA export from nucleus(GO:0010793) |
| 0.1 | 0.3 | GO:1901164 | negative regulation of trophoblast cell migration(GO:1901164) |
| 0.1 | 0.3 | GO:0061187 | regulation of chromatin silencing at rDNA(GO:0061187) negative regulation of chromatin silencing at rDNA(GO:0061188) |
| 0.1 | 0.1 | GO:0048319 | axial mesoderm morphogenesis(GO:0048319) |
| 0.1 | 0.2 | GO:1904247 | positive regulation of polynucleotide adenylyltransferase activity(GO:1904247) |
| 0.1 | 1.7 | GO:0034389 | lipid particle organization(GO:0034389) |
| 0.1 | 0.5 | GO:0038028 | insulin receptor signaling pathway via phosphatidylinositol 3-kinase(GO:0038028) |
| 0.1 | 0.2 | GO:0042412 | taurine biosynthetic process(GO:0042412) |
| 0.1 | 0.1 | GO:0006447 | regulation of translational initiation by iron(GO:0006447) |
| 0.1 | 0.2 | GO:1902775 | mitochondrial large ribosomal subunit assembly(GO:1902775) |
| 0.1 | 0.6 | GO:0032049 | cardiolipin biosynthetic process(GO:0032049) |
| 0.1 | 0.4 | GO:0010757 | negative regulation of plasminogen activation(GO:0010757) |
| 0.1 | 1.4 | GO:0016254 | preassembly of GPI anchor in ER membrane(GO:0016254) |
| 0.1 | 1.0 | GO:0070389 | chaperone cofactor-dependent protein refolding(GO:0070389) |
| 0.1 | 0.2 | GO:0052651 | monoacylglycerol metabolic process(GO:0046462) monoacylglycerol catabolic process(GO:0052651) |
| 0.1 | 0.2 | GO:0034729 | histone H3-K79 methylation(GO:0034729) |
| 0.1 | 0.2 | GO:0071418 | cellular response to amine stimulus(GO:0071418) |
| 0.1 | 0.7 | GO:0044342 | type B pancreatic cell proliferation(GO:0044342) |
| 0.1 | 0.4 | GO:1902231 | positive regulation of intrinsic apoptotic signaling pathway in response to DNA damage(GO:1902231) |
| 0.1 | 0.4 | GO:0000389 | mRNA 3'-splice site recognition(GO:0000389) |
| 0.1 | 0.1 | GO:1904397 | negative regulation of neuromuscular junction development(GO:1904397) |
| 0.1 | 0.4 | GO:0033578 | protein glycosylation in Golgi(GO:0033578) |
| 0.1 | 0.2 | GO:0019520 | aldonic acid metabolic process(GO:0019520) D-gluconate metabolic process(GO:0019521) |
| 0.1 | 0.5 | GO:0070649 | formin-nucleated actin cable assembly(GO:0070649) |
| 0.1 | 0.1 | GO:0046601 | positive regulation of centriole replication(GO:0046601) |
| 0.1 | 0.3 | GO:0071543 | diadenosine polyphosphate catabolic process(GO:0015961) diphosphoinositol polyphosphate metabolic process(GO:0071543) diadenosine pentaphosphate metabolic process(GO:1901906) diadenosine pentaphosphate catabolic process(GO:1901907) diadenosine hexaphosphate metabolic process(GO:1901908) diadenosine hexaphosphate catabolic process(GO:1901909) adenosine 5'-(hexahydrogen pentaphosphate) metabolic process(GO:1901910) adenosine 5'-(hexahydrogen pentaphosphate) catabolic process(GO:1901911) |
| 0.1 | 0.7 | GO:0015985 | energy coupled proton transport, down electrochemical gradient(GO:0015985) ATP synthesis coupled proton transport(GO:0015986) |
| 0.1 | 1.2 | GO:0035518 | histone H2A monoubiquitination(GO:0035518) |
| 0.1 | 0.8 | GO:0051256 | mitotic spindle midzone assembly(GO:0051256) |
| 0.1 | 0.2 | GO:1904908 | negative regulation of maintenance of sister chromatid cohesion(GO:0034092) negative regulation of maintenance of mitotic sister chromatid cohesion(GO:0034183) maintenance of mitotic sister chromatid cohesion, telomeric(GO:0099403) mitotic sister chromatid cohesion, telomeric(GO:0099404) regulation of maintenance of mitotic sister chromatid cohesion, telomeric(GO:1904907) negative regulation of maintenance of mitotic sister chromatid cohesion, telomeric(GO:1904908) |
| 0.1 | 0.2 | GO:0001544 | initiation of primordial ovarian follicle growth(GO:0001544) |
| 0.1 | 0.4 | GO:0035583 | sequestering of TGFbeta in extracellular matrix(GO:0035583) |
| 0.1 | 0.2 | GO:0046909 | intermembrane transport(GO:0046909) protein transport from ciliary membrane to plasma membrane(GO:1903445) |
| 0.1 | 0.2 | GO:0072365 | regulation of cellular ketone metabolic process by negative regulation of transcription from RNA polymerase II promoter(GO:0072365) |
| 0.1 | 1.1 | GO:0021514 | ventral spinal cord interneuron differentiation(GO:0021514) |
| 0.1 | 0.4 | GO:0051418 | interphase microtubule nucleation by interphase microtubule organizing center(GO:0051415) microtubule nucleation by microtubule organizing center(GO:0051418) |
| 0.1 | 0.2 | GO:0060689 | cell differentiation involved in salivary gland development(GO:0060689) |
| 0.1 | 0.6 | GO:0001731 | formation of translation preinitiation complex(GO:0001731) |
| 0.1 | 0.5 | GO:0006122 | mitochondrial electron transport, ubiquinol to cytochrome c(GO:0006122) |
| 0.1 | 0.2 | GO:0043335 | protein unfolding(GO:0043335) |
| 0.0 | 0.6 | GO:0003406 | retinal pigment epithelium development(GO:0003406) |
| 0.0 | 3.7 | GO:0006120 | mitochondrial electron transport, NADH to ubiquinone(GO:0006120) |
| 0.0 | 0.3 | GO:0035507 | regulation of myosin-light-chain-phosphatase activity(GO:0035507) |
| 0.0 | 0.2 | GO:0035726 | common myeloid progenitor cell proliferation(GO:0035726) |
| 0.0 | 2.6 | GO:0045599 | negative regulation of fat cell differentiation(GO:0045599) |
| 0.0 | 0.2 | GO:0002032 | desensitization of G-protein coupled receptor protein signaling pathway by arrestin(GO:0002032) |
| 0.0 | 0.2 | GO:0010157 | response to chlorate(GO:0010157) |
| 0.0 | 0.4 | GO:0043129 | surfactant homeostasis(GO:0043129) |
| 0.0 | 0.1 | GO:0052047 | interaction with other organism via secreted substance involved in symbiotic interaction(GO:0052047) |
| 0.0 | 0.2 | GO:0046391 | 5-phosphoribose 1-diphosphate biosynthetic process(GO:0006015) 5-phosphoribose 1-diphosphate metabolic process(GO:0046391) |
| 0.0 | 0.8 | GO:1902659 | regulation of glucose mediated signaling pathway(GO:1902659) |
| 0.0 | 0.4 | GO:0017196 | N-terminal peptidyl-methionine acetylation(GO:0017196) |
| 0.0 | 0.1 | GO:1904253 | positive regulation of bile acid biosynthetic process(GO:0070859) positive regulation of bile acid metabolic process(GO:1904253) |
| 0.0 | 0.7 | GO:0006782 | protoporphyrinogen IX biosynthetic process(GO:0006782) |
| 0.0 | 0.2 | GO:0007228 | positive regulation of hh target transcription factor activity(GO:0007228) |
| 0.0 | 0.8 | GO:1900747 | negative regulation of vascular endothelial growth factor signaling pathway(GO:1900747) |
| 0.0 | 0.2 | GO:0090063 | positive regulation of microtubule nucleation(GO:0090063) |
| 0.0 | 0.7 | GO:0098719 | sodium ion import across plasma membrane(GO:0098719) sodium ion import into cell(GO:1990118) |
| 0.0 | 0.2 | GO:1904491 | protein localization to ciliary transition zone(GO:1904491) |
| 0.0 | 0.3 | GO:0006543 | glutamine catabolic process(GO:0006543) |
| 0.0 | 0.2 | GO:0007113 | endomitotic cell cycle(GO:0007113) |
| 0.0 | 0.5 | GO:0015886 | heme transport(GO:0015886) |
| 0.0 | 0.3 | GO:0045901 | positive regulation of translational elongation(GO:0045901) |
| 0.0 | 0.3 | GO:0070091 | glucagon secretion(GO:0070091) regulation of glucagon secretion(GO:0070092) |
| 0.0 | 0.9 | GO:0016180 | snRNA processing(GO:0016180) |
| 0.0 | 0.3 | GO:0046092 | deoxycytidine metabolic process(GO:0046092) |
| 0.0 | 0.2 | GO:0046203 | spermidine catabolic process(GO:0046203) |
| 0.0 | 0.3 | GO:0023021 | termination of signal transduction(GO:0023021) |
| 0.0 | 0.2 | GO:0097167 | circadian regulation of translation(GO:0097167) |
| 0.0 | 0.3 | GO:0097026 | dendritic cell dendrite assembly(GO:0097026) |
| 0.0 | 0.2 | GO:0003057 | regulation of the force of heart contraction by chemical signal(GO:0003057) |
| 0.0 | 0.1 | GO:0061073 | ciliary body morphogenesis(GO:0061073) |
| 0.0 | 0.2 | GO:0035927 | RNA import into mitochondrion(GO:0035927) |
| 0.0 | 1.4 | GO:0010971 | positive regulation of G2/M transition of mitotic cell cycle(GO:0010971) |
| 0.0 | 0.2 | GO:1903799 | negative regulation of production of miRNAs involved in gene silencing by miRNA(GO:1903799) |
| 0.0 | 0.2 | GO:0000414 | regulation of histone H3-K36 methylation(GO:0000414) |
| 0.0 | 0.7 | GO:0006853 | carnitine shuttle(GO:0006853) |
| 0.0 | 0.4 | GO:0046600 | negative regulation of centriole replication(GO:0046600) |
| 0.0 | 0.4 | GO:1902414 | protein localization to cell junction(GO:1902414) |
| 0.0 | 0.2 | GO:1903566 | positive regulation of protein localization to cilium(GO:1903566) |
| 0.0 | 0.7 | GO:0016446 | somatic hypermutation of immunoglobulin genes(GO:0016446) |
| 0.0 | 1.0 | GO:0034453 | microtubule anchoring(GO:0034453) |
| 0.0 | 0.2 | GO:1990414 | replication-born double-strand break repair via sister chromatid exchange(GO:1990414) |
| 0.0 | 1.1 | GO:0090140 | regulation of mitochondrial fission(GO:0090140) |
| 0.0 | 0.8 | GO:0035435 | phosphate ion transmembrane transport(GO:0035435) |
| 0.0 | 0.2 | GO:0008626 | granzyme-mediated apoptotic signaling pathway(GO:0008626) |
| 0.0 | 0.2 | GO:2000620 | positive regulation of histone H4-K16 acetylation(GO:2000620) |
| 0.0 | 1.0 | GO:0032495 | response to muramyl dipeptide(GO:0032495) |
| 0.0 | 0.5 | GO:2000096 | positive regulation of Wnt signaling pathway, planar cell polarity pathway(GO:2000096) |
| 0.0 | 0.2 | GO:0010286 | heat acclimation(GO:0010286) cellular heat acclimation(GO:0070370) |
| 0.0 | 0.2 | GO:1904781 | positive regulation of protein localization to centrosome(GO:1904781) |
| 0.0 | 0.4 | GO:0042407 | cristae formation(GO:0042407) |
| 0.0 | 0.1 | GO:0007181 | transforming growth factor beta receptor complex assembly(GO:0007181) |
| 0.0 | 0.9 | GO:0051457 | maintenance of protein location in nucleus(GO:0051457) |
| 0.0 | 0.1 | GO:0046952 | ketone body catabolic process(GO:0046952) |
| 0.0 | 1.0 | GO:0097067 | cellular response to thyroid hormone stimulus(GO:0097067) |
| 0.0 | 0.3 | GO:2000270 | negative regulation of fibroblast apoptotic process(GO:2000270) |
| 0.0 | 1.4 | GO:2000300 | regulation of synaptic vesicle exocytosis(GO:2000300) |
| 0.0 | 0.4 | GO:0071550 | death-inducing signaling complex assembly(GO:0071550) |
| 0.0 | 0.1 | GO:0060029 | convergent extension involved in organogenesis(GO:0060029) |
| 0.0 | 0.2 | GO:1903265 | positive regulation of tumor necrosis factor-mediated signaling pathway(GO:1903265) |
| 0.0 | 0.1 | GO:0007056 | spindle assembly involved in female meiosis(GO:0007056) |
| 0.0 | 0.1 | GO:2001166 | regulation of histone H2B ubiquitination(GO:2001166) positive regulation of histone H2B ubiquitination(GO:2001168) |
| 0.0 | 0.1 | GO:1902445 | regulation of mitochondrial membrane permeability involved in programmed necrotic cell death(GO:1902445) |
| 0.0 | 0.1 | GO:0034427 | nuclear-transcribed mRNA catabolic process, exonucleolytic, 3'-5'(GO:0034427) |
| 0.0 | 0.3 | GO:0044211 | CTP salvage(GO:0044211) |
| 0.0 | 0.3 | GO:0035413 | positive regulation of catenin import into nucleus(GO:0035413) |
| 0.0 | 0.3 | GO:0035694 | mitochondrial protein catabolic process(GO:0035694) |
| 0.0 | 0.1 | GO:0042427 | serotonin biosynthetic process(GO:0042427) |
| 0.0 | 0.0 | GO:1903436 | regulation of cytokinetic process(GO:0032954) regulation of mitotic cytokinetic process(GO:1903436) positive regulation of mitotic cytokinetic process(GO:1903438) positive regulation of mitotic cytokinesis(GO:1903490) |
| 0.0 | 1.7 | GO:0060074 | synapse maturation(GO:0060074) |
| 0.0 | 0.3 | GO:0072553 | terminal button organization(GO:0072553) |
| 0.0 | 0.3 | GO:0007144 | female meiosis I(GO:0007144) |
| 0.0 | 0.6 | GO:0048243 | norepinephrine secretion(GO:0048243) |
| 0.0 | 0.1 | GO:0061086 | negative regulation of histone H3-K27 methylation(GO:0061086) |
| 0.0 | 1.1 | GO:0071425 | hematopoietic stem cell proliferation(GO:0071425) |
| 0.0 | 0.5 | GO:0090190 | positive regulation of branching involved in ureteric bud morphogenesis(GO:0090190) |
| 0.0 | 0.8 | GO:0006337 | nucleosome disassembly(GO:0006337) |
| 0.0 | 0.3 | GO:0010936 | negative regulation of macrophage cytokine production(GO:0010936) |
| 0.0 | 0.1 | GO:1904715 | negative regulation of chaperone-mediated autophagy(GO:1904715) |
| 0.0 | 0.1 | GO:0046338 | phosphatidylethanolamine catabolic process(GO:0046338) |
| 0.0 | 0.1 | GO:0097695 | establishment of RNA localization to telomere(GO:0097694) establishment of macromolecular complex localization to telomere(GO:0097695) |
| 0.0 | 0.2 | GO:0048861 | leukemia inhibitory factor signaling pathway(GO:0048861) |
| 0.0 | 0.2 | GO:0046512 | diol biosynthetic process(GO:0034312) sphingosine biosynthetic process(GO:0046512) |
| 0.0 | 0.3 | GO:0007256 | activation of JNKK activity(GO:0007256) |
| 0.0 | 0.5 | GO:0045116 | protein neddylation(GO:0045116) |
| 0.0 | 0.2 | GO:0070987 | error-free translesion synthesis(GO:0070987) |
| 0.0 | 0.1 | GO:0097056 | selenocysteinyl-tRNA(Sec) biosynthetic process(GO:0097056) |
| 0.0 | 0.2 | GO:0070269 | pyroptosis(GO:0070269) |
| 0.0 | 0.1 | GO:0019747 | regulation of isoprenoid metabolic process(GO:0019747) |
| 0.0 | 0.3 | GO:0045899 | positive regulation of RNA polymerase II transcriptional preinitiation complex assembly(GO:0045899) |
| 0.0 | 0.6 | GO:0031293 | membrane protein intracellular domain proteolysis(GO:0031293) |
| 0.0 | 0.8 | GO:0051016 | barbed-end actin filament capping(GO:0051016) |
| 0.0 | 0.3 | GO:0044598 | polyketide metabolic process(GO:0030638) aminoglycoside antibiotic metabolic process(GO:0030647) daunorubicin metabolic process(GO:0044597) doxorubicin metabolic process(GO:0044598) |
| 0.0 | 0.1 | GO:0010621 | negative regulation of transcription by transcription factor localization(GO:0010621) |
| 0.0 | 1.4 | GO:0042769 | DNA damage response, detection of DNA damage(GO:0042769) |
| 0.0 | 0.1 | GO:1901874 | negative regulation of post-translational protein modification(GO:1901874) |
| 0.0 | 0.2 | GO:0090315 | negative regulation of protein targeting to membrane(GO:0090315) |
| 0.0 | 0.1 | GO:0060448 | dichotomous subdivision of terminal units involved in lung branching(GO:0060448) |
| 0.0 | 0.2 | GO:0097384 | cellular lipid biosynthetic process(GO:0097384) |
| 0.0 | 0.4 | GO:0035372 | protein localization to microtubule(GO:0035372) |
| 0.0 | 0.2 | GO:0048341 | paraxial mesoderm formation(GO:0048341) |
| 0.0 | 0.1 | GO:0060068 | vagina development(GO:0060068) |
| 0.0 | 0.2 | GO:0016139 | glycoside catabolic process(GO:0016139) |
| 0.0 | 0.6 | GO:0018027 | peptidyl-lysine dimethylation(GO:0018027) |
| 0.0 | 1.3 | GO:0010611 | regulation of cardiac muscle hypertrophy(GO:0010611) |
| 0.0 | 0.1 | GO:0090214 | spongiotrophoblast layer developmental growth(GO:0090214) |
| 0.0 | 0.1 | GO:1900738 | positive regulation of phospholipase C-activating G-protein coupled receptor signaling pathway(GO:1900738) |
| 0.0 | 0.5 | GO:0060044 | negative regulation of cardiac muscle cell proliferation(GO:0060044) |
| 0.0 | 0.2 | GO:0006642 | triglyceride mobilization(GO:0006642) |
| 0.0 | 0.3 | GO:0010755 | regulation of plasminogen activation(GO:0010755) positive regulation of plasminogen activation(GO:0010756) |
| 0.0 | 0.1 | GO:1901377 | mycotoxin catabolic process(GO:0043387) aflatoxin catabolic process(GO:0046223) organic heteropentacyclic compound catabolic process(GO:1901377) regulation of glutathione biosynthetic process(GO:1903786) positive regulation of glutathione biosynthetic process(GO:1903788) |
| 0.0 | 0.1 | GO:0033037 | polysaccharide localization(GO:0033037) |
| 0.0 | 0.4 | GO:0001780 | neutrophil homeostasis(GO:0001780) |
| 0.0 | 0.7 | GO:0045880 | positive regulation of smoothened signaling pathway(GO:0045880) |
| 0.0 | 0.5 | GO:0015937 | coenzyme A biosynthetic process(GO:0015937) |
| 0.0 | 4.2 | GO:0006614 | SRP-dependent cotranslational protein targeting to membrane(GO:0006614) |
| 0.0 | 0.1 | GO:0090158 | endoplasmic reticulum membrane organization(GO:0090158) |
| 0.0 | 0.2 | GO:0046146 | tetrahydrobiopterin biosynthetic process(GO:0006729) tetrahydrobiopterin metabolic process(GO:0046146) |
| 0.0 | 0.1 | GO:0035234 | ectopic germ cell programmed cell death(GO:0035234) |
| 0.0 | 0.3 | GO:0051451 | myoblast migration(GO:0051451) |
| 0.0 | 0.4 | GO:0030043 | actin filament fragmentation(GO:0030043) |
| 0.0 | 0.1 | GO:1902309 | regulation of heart rate by hormone(GO:0003064) negative regulation of peptidyl-serine dephosphorylation(GO:1902309) |
| 0.0 | 0.2 | GO:0006506 | GPI anchor biosynthetic process(GO:0006506) |
| 0.0 | 0.8 | GO:0051693 | actin filament capping(GO:0051693) |
| 0.0 | 0.4 | GO:0043555 | regulation of translation in response to stress(GO:0043555) |
| 0.0 | 0.8 | GO:0043968 | histone H2A acetylation(GO:0043968) |
| 0.0 | 0.1 | GO:0038031 | non-canonical Wnt signaling pathway via JNK cascade(GO:0038031) |
| 0.0 | 0.2 | GO:0018206 | peptidyl-methionine modification(GO:0018206) |
| 0.0 | 0.2 | GO:0033689 | negative regulation of osteoblast proliferation(GO:0033689) |
| 0.0 | 0.6 | GO:0035728 | response to hepatocyte growth factor(GO:0035728) |
| 0.0 | 0.2 | GO:0006268 | DNA unwinding involved in DNA replication(GO:0006268) |
| 0.0 | 0.2 | GO:1905146 | lysosomal protein catabolic process(GO:1905146) |
| 0.0 | 0.5 | GO:0033539 | fatty acid beta-oxidation using acyl-CoA dehydrogenase(GO:0033539) |
| 0.0 | 0.2 | GO:0036500 | ATF6-mediated unfolded protein response(GO:0036500) |
| 0.0 | 0.1 | GO:0016259 | selenocysteine metabolic process(GO:0016259) |
| 0.0 | 0.3 | GO:0021800 | cerebral cortex tangential migration(GO:0021800) |
| 0.0 | 0.3 | GO:0006554 | lysine catabolic process(GO:0006554) |
| 0.0 | 0.4 | GO:0006293 | nucleotide-excision repair, preincision complex stabilization(GO:0006293) |
| 0.0 | 0.4 | GO:1904380 | endoplasmic reticulum mannose trimming(GO:1904380) |
| 0.0 | 0.2 | GO:0006104 | succinyl-CoA metabolic process(GO:0006104) |
| 0.0 | 0.2 | GO:0010159 | specification of organ position(GO:0010159) |
| 0.0 | 0.1 | GO:0010607 | negative regulation of cytoplasmic mRNA processing body assembly(GO:0010607) |
| 0.0 | 1.5 | GO:0043966 | histone H3 acetylation(GO:0043966) |
| 0.0 | 0.1 | GO:0006421 | asparaginyl-tRNA aminoacylation(GO:0006421) |
| 0.0 | 0.2 | GO:1902746 | regulation of lens fiber cell differentiation(GO:1902746) |
| 0.0 | 0.2 | GO:0018401 | peptidyl-proline hydroxylation to 4-hydroxy-L-proline(GO:0018401) |
| 0.0 | 0.1 | GO:0019287 | isopentenyl diphosphate biosynthetic process, mevalonate pathway(GO:0019287) |
| 0.0 | 0.3 | GO:0015781 | pyrimidine nucleotide-sugar transport(GO:0015781) |
| 0.0 | 0.1 | GO:0036265 | RNA (guanine-N7)-methylation(GO:0036265) rRNA (guanine-N7)-methylation(GO:0070476) |
| 0.0 | 0.3 | GO:0021930 | cell proliferation in external granule layer(GO:0021924) cerebellar granule cell precursor proliferation(GO:0021930) |
| 0.0 | 0.5 | GO:0034356 | NAD biosynthesis via nicotinamide riboside salvage pathway(GO:0034356) |
| 0.0 | 0.2 | GO:0000712 | resolution of meiotic recombination intermediates(GO:0000712) |
| 0.0 | 0.1 | GO:1900222 | negative regulation of beta-amyloid clearance(GO:1900222) |
| 0.0 | 0.3 | GO:0007095 | mitotic G2 DNA damage checkpoint(GO:0007095) |
| 0.0 | 0.1 | GO:0048619 | hindgut morphogenesis(GO:0007442) embryonic hindgut morphogenesis(GO:0048619) hindgut development(GO:0061525) |
| 0.0 | 0.2 | GO:0034638 | phosphatidylcholine catabolic process(GO:0034638) |
| 0.0 | 0.4 | GO:0034975 | protein folding in endoplasmic reticulum(GO:0034975) |
| 0.0 | 0.0 | GO:0010225 | response to UV-C(GO:0010225) |
| 0.0 | 0.1 | GO:0044806 | G-quadruplex DNA unwinding(GO:0044806) |
| 0.0 | 0.1 | GO:1901350 | cell-cell signaling involved in cell-cell junction organization(GO:1901350) |
| 0.0 | 0.6 | GO:0042501 | serine phosphorylation of STAT protein(GO:0042501) |
| 0.0 | 1.1 | GO:0030512 | negative regulation of transforming growth factor beta receptor signaling pathway(GO:0030512) |
| 0.0 | 0.1 | GO:0038193 | thromboxane A2 signaling pathway(GO:0038193) |
| 0.0 | 0.6 | GO:2000651 | positive regulation of sodium ion transmembrane transporter activity(GO:2000651) |
| 0.0 | 0.9 | GO:0006270 | DNA replication initiation(GO:0006270) |
| 0.0 | 0.4 | GO:0002230 | positive regulation of defense response to virus by host(GO:0002230) |
| 0.0 | 1.2 | GO:0045652 | regulation of megakaryocyte differentiation(GO:0045652) |
| 0.0 | 3.4 | GO:0065004 | protein-DNA complex assembly(GO:0065004) |
| 0.0 | 0.4 | GO:1904030 | negative regulation of cyclin-dependent protein serine/threonine kinase activity(GO:0045736) negative regulation of cyclin-dependent protein kinase activity(GO:1904030) |
| 0.0 | 0.1 | GO:0032510 | endosome to lysosome transport via multivesicular body sorting pathway(GO:0032510) |
| 0.0 | 0.1 | GO:1903377 | negative regulation of oxidative stress-induced neuron intrinsic apoptotic signaling pathway(GO:1903377) |
| 0.0 | 0.4 | GO:0072321 | chaperone-mediated protein transport(GO:0072321) |
| 0.0 | 0.1 | GO:0050942 | positive regulation of pigment cell differentiation(GO:0050942) |
| 0.0 | 0.1 | GO:0070197 | meiotic telomere tethering at nuclear periphery(GO:0044821) meiotic attachment of telomere to nuclear envelope(GO:0070197) chromosome attachment to the nuclear envelope(GO:0097240) |
| 0.0 | 0.3 | GO:1903608 | protein localization to cytoplasmic stress granule(GO:1903608) |
| 0.0 | 0.1 | GO:0042539 | hypotonic salinity response(GO:0042539) cellular hypotonic salinity response(GO:0071477) |
| 0.0 | 0.2 | GO:0046784 | viral mRNA export from host cell nucleus(GO:0046784) |
| 0.0 | 0.2 | GO:0003215 | cardiac right ventricle morphogenesis(GO:0003215) |
| 0.0 | 0.3 | GO:0006600 | creatine metabolic process(GO:0006600) |
| 0.0 | 0.1 | GO:0031936 | negative regulation of chromatin silencing(GO:0031936) |
| 0.0 | 0.2 | GO:0046475 | glycerophospholipid catabolic process(GO:0046475) |
| 0.0 | 0.3 | GO:0042178 | xenobiotic catabolic process(GO:0042178) |
| 0.0 | 0.1 | GO:0006679 | glucosylceramide biosynthetic process(GO:0006679) |
| 0.0 | 0.2 | GO:0033148 | positive regulation of intracellular estrogen receptor signaling pathway(GO:0033148) |
| 0.0 | 0.5 | GO:0039694 | viral RNA genome replication(GO:0039694) RNA replication(GO:0039703) |
| 0.0 | 0.0 | GO:0044205 | 'de novo' UMP biosynthetic process(GO:0044205) |
| 0.0 | 0.2 | GO:0008298 | intracellular mRNA localization(GO:0008298) |
| 0.0 | 0.2 | GO:1904896 | ESCRT complex disassembly(GO:1904896) ESCRT III complex disassembly(GO:1904903) |
| 0.0 | 0.1 | GO:0002225 | positive regulation of antimicrobial peptide production(GO:0002225) positive regulation of antibacterial peptide production(GO:0002803) |
| 0.0 | 0.2 | GO:2000774 | positive regulation of cellular senescence(GO:2000774) |
| 0.0 | 0.4 | GO:0051290 | protein heterotetramerization(GO:0051290) |
| 0.0 | 1.0 | GO:0006635 | fatty acid beta-oxidation(GO:0006635) |
| 0.0 | 0.0 | GO:1903679 | regulation of cap-independent translational initiation(GO:1903677) positive regulation of cap-independent translational initiation(GO:1903679) regulation of cytoplasmic translational initiation(GO:1904688) positive regulation of cytoplasmic translational initiation(GO:1904690) |
| 0.0 | 0.1 | GO:0032661 | regulation of interleukin-18 production(GO:0032661) |
| 0.0 | 0.5 | GO:0032508 | DNA duplex unwinding(GO:0032508) |
| 0.0 | 0.0 | GO:1902499 | positive regulation of protein autoubiquitination(GO:1902499) |
| 0.0 | 0.2 | GO:0000920 | cell separation after cytokinesis(GO:0000920) |
| 0.0 | 0.3 | GO:0036152 | phosphatidylethanolamine acyl-chain remodeling(GO:0036152) |
| 0.0 | 0.2 | GO:0030091 | protein repair(GO:0030091) |
| 0.0 | 0.2 | GO:0036371 | T-tubule organization(GO:0033292) protein localization to T-tubule(GO:0036371) |
| 0.0 | 0.1 | GO:0015860 | purine nucleoside transmembrane transport(GO:0015860) |
| 0.0 | 0.5 | GO:0000301 | retrograde transport, vesicle recycling within Golgi(GO:0000301) |
| 0.0 | 0.0 | GO:1901389 | regulation of transforming growth factor beta activation(GO:1901388) negative regulation of transforming growth factor beta activation(GO:1901389) |
| 0.0 | 0.1 | GO:0006105 | succinate metabolic process(GO:0006105) |
| 0.0 | 0.1 | GO:0045007 | depurination(GO:0045007) |
| 0.0 | 0.1 | GO:0033088 | negative regulation of immature T cell proliferation in thymus(GO:0033088) |
| 0.0 | 0.1 | GO:0002322 | B cell proliferation involved in immune response(GO:0002322) |
| 0.0 | 0.0 | GO:1904562 | phosphatidylinositol 5-phosphate metabolic process(GO:1904562) |
| 0.0 | 0.3 | GO:0030497 | fatty acid elongation(GO:0030497) |
| 0.0 | 0.1 | GO:0035897 | proteolysis in other organism(GO:0035897) |
| 0.0 | 0.5 | GO:0060765 | regulation of androgen receptor signaling pathway(GO:0060765) |
| 0.0 | 0.0 | GO:0048867 | stem cell fate determination(GO:0048867) |
| 0.0 | 0.2 | GO:1904294 | positive regulation of ERAD pathway(GO:1904294) |
| 0.0 | 0.2 | GO:0070193 | synaptonemal complex assembly(GO:0007130) synaptonemal complex organization(GO:0070193) |
| 0.0 | 0.1 | GO:0032929 | negative regulation of superoxide anion generation(GO:0032929) |
| 0.0 | 0.2 | GO:0060632 | regulation of microtubule-based movement(GO:0060632) |
| 0.0 | 1.4 | GO:0006687 | glycosphingolipid metabolic process(GO:0006687) |
| 0.0 | 0.1 | GO:0051593 | response to folic acid(GO:0051593) |
| 0.0 | 0.1 | GO:0001886 | endothelial cell morphogenesis(GO:0001886) |
| 0.0 | 0.2 | GO:0035269 | protein O-linked mannosylation(GO:0035269) |
| 0.0 | 0.3 | GO:0016024 | CDP-diacylglycerol biosynthetic process(GO:0016024) |
| 0.0 | 0.2 | GO:0061298 | retina vasculature development in camera-type eye(GO:0061298) |
| 0.0 | 1.1 | GO:0032436 | positive regulation of proteasomal ubiquitin-dependent protein catabolic process(GO:0032436) |
| 0.0 | 0.3 | GO:0045947 | negative regulation of translational initiation(GO:0045947) |
| 0.0 | 0.4 | GO:0007263 | nitric oxide mediated signal transduction(GO:0007263) |
| 0.0 | 0.0 | GO:1901029 | adenine transport(GO:0015853) negative regulation of mitochondrial outer membrane permeabilization involved in apoptotic signaling pathway(GO:1901029) |
| 0.0 | 0.5 | GO:0008206 | bile acid metabolic process(GO:0008206) |
| 0.0 | 0.1 | GO:0052696 | flavonoid glucuronidation(GO:0052696) xenobiotic glucuronidation(GO:0052697) |
| 0.0 | 0.1 | GO:0061624 | fructose catabolic process(GO:0006001) fructose catabolic process to hydroxyacetone phosphate and glyceraldehyde-3-phosphate(GO:0061624) |
| 0.0 | 0.0 | GO:0060298 | positive regulation of sarcomere organization(GO:0060298) |
| 0.0 | 0.4 | GO:0016339 | calcium-dependent cell-cell adhesion via plasma membrane cell adhesion molecules(GO:0016339) |
| 0.0 | 0.4 | GO:0045737 | positive regulation of cyclin-dependent protein serine/threonine kinase activity(GO:0045737) |
| 0.0 | 0.4 | GO:0001881 | receptor recycling(GO:0001881) |
| 0.0 | 0.2 | GO:0090266 | regulation of mitotic cell cycle spindle assembly checkpoint(GO:0090266) regulation of mitotic spindle checkpoint(GO:1903504) |
| 0.0 | 0.1 | GO:0097369 | sodium ion import(GO:0097369) |
| 0.0 | 0.1 | GO:2000786 | positive regulation of autophagosome assembly(GO:2000786) |
| 0.0 | 0.1 | GO:0031444 | slow-twitch skeletal muscle fiber contraction(GO:0031444) |
| 0.0 | 0.2 | GO:0035999 | tetrahydrofolate interconversion(GO:0035999) |
| 0.0 | 0.2 | GO:0006123 | mitochondrial electron transport, cytochrome c to oxygen(GO:0006123) |
| 0.0 | 0.1 | GO:2000381 | negative regulation of mesoderm development(GO:2000381) |
| 0.0 | 0.1 | GO:0008063 | Toll signaling pathway(GO:0008063) |
Gene overrepresentation in cellular component category:
| Log-likelihood per target | Total log-likelihood | Term | Description |
|---|---|---|---|
| 0.5 | 4.0 | GO:1903439 | calcitonin family receptor complex(GO:1903439) amylin receptor complex(GO:1903440) |
| 0.4 | 1.8 | GO:0020003 | symbiont-containing vacuole(GO:0020003) |
| 0.4 | 2.0 | GO:0072558 | NLRP1 inflammasome complex(GO:0072558) |
| 0.4 | 1.6 | GO:0042720 | mitochondrial inner membrane peptidase complex(GO:0042720) |
| 0.3 | 1.4 | GO:0097196 | Shu complex(GO:0097196) |
| 0.3 | 1.9 | GO:0005947 | mitochondrial alpha-ketoglutarate dehydrogenase complex(GO:0005947) |
| 0.2 | 1.0 | GO:0044307 | dendritic branch(GO:0044307) |
| 0.2 | 2.0 | GO:0005797 | Golgi medial cisterna(GO:0005797) |
| 0.2 | 1.9 | GO:0035976 | AP1 complex(GO:0035976) |
| 0.2 | 1.9 | GO:0034751 | aryl hydrocarbon receptor complex(GO:0034751) |
| 0.2 | 1.0 | GO:0032301 | MutSalpha complex(GO:0032301) MutSbeta complex(GO:0032302) |
| 0.2 | 1.1 | GO:0042765 | GPI-anchor transamidase complex(GO:0042765) |
| 0.2 | 1.1 | GO:0031417 | NatC complex(GO:0031417) |
| 0.2 | 0.2 | GO:0030062 | mitochondrial tricarboxylic acid cycle enzyme complex(GO:0030062) |
| 0.2 | 0.7 | GO:1990423 | RZZ complex(GO:1990423) |
| 0.2 | 1.8 | GO:0031465 | Cul4B-RING E3 ubiquitin ligase complex(GO:0031465) |
| 0.2 | 0.5 | GO:0044611 | nuclear pore inner ring(GO:0044611) |
| 0.1 | 0.7 | GO:0045281 | mitochondrial respiratory chain complex II, succinate dehydrogenase complex (ubiquinone)(GO:0005749) succinate dehydrogenase complex (ubiquinone)(GO:0045257) respiratory chain complex II(GO:0045273) succinate dehydrogenase complex(GO:0045281) fumarate reductase complex(GO:0045283) |
| 0.1 | 1.5 | GO:0048188 | Set1C/COMPASS complex(GO:0048188) |
| 0.1 | 1.2 | GO:0042406 | extrinsic component of endoplasmic reticulum membrane(GO:0042406) |
| 0.1 | 1.6 | GO:0033588 | Elongator holoenzyme complex(GO:0033588) |
| 0.1 | 0.9 | GO:0097442 | CA3 pyramidal cell dendrite(GO:0097442) |
| 0.1 | 0.7 | GO:0033553 | rDNA heterochromatin(GO:0033553) |
| 0.1 | 0.7 | GO:0071256 | Sec61 translocon complex(GO:0005784) translocon complex(GO:0071256) |
| 0.1 | 0.3 | GO:0030849 | autosome(GO:0030849) |
| 0.1 | 1.5 | GO:0000176 | nuclear exosome (RNase complex)(GO:0000176) |
| 0.1 | 1.2 | GO:0033256 | I-kappaB/NF-kappaB complex(GO:0033256) |
| 0.1 | 3.4 | GO:0071564 | npBAF complex(GO:0071564) |
| 0.1 | 0.3 | GO:0000799 | nuclear condensin complex(GO:0000799) |
| 0.1 | 0.3 | GO:0039714 | viral factory(GO:0039713) cytoplasmic viral factory(GO:0039714) host cell viral assembly compartment(GO:0072517) |
| 0.1 | 0.5 | GO:0016035 | zeta DNA polymerase complex(GO:0016035) |
| 0.1 | 0.4 | GO:0008275 | gamma-tubulin small complex(GO:0008275) |
| 0.1 | 0.2 | GO:0070931 | Golgi-associated vesicle lumen(GO:0070931) |
| 0.1 | 0.5 | GO:0031467 | Cul7-RING ubiquitin ligase complex(GO:0031467) |
| 0.1 | 1.4 | GO:0005847 | mRNA cleavage and polyadenylation specificity factor complex(GO:0005847) |
| 0.1 | 0.5 | GO:0000308 | cytoplasmic cyclin-dependent protein kinase holoenzyme complex(GO:0000308) |
| 0.1 | 1.2 | GO:0017119 | Golgi transport complex(GO:0017119) |
| 0.1 | 1.2 | GO:0042555 | MCM complex(GO:0042555) |
| 0.1 | 0.2 | GO:0097058 | CRLF-CLCF1 complex(GO:0097058) |
| 0.1 | 2.8 | GO:0090665 | dystrophin-associated glycoprotein complex(GO:0016010) glycoprotein complex(GO:0090665) |
| 0.1 | 1.0 | GO:0070776 | H3 histone acetyltransferase complex(GO:0070775) MOZ/MORF histone acetyltransferase complex(GO:0070776) |
| 0.1 | 0.8 | GO:0005742 | mitochondrial outer membrane translocase complex(GO:0005742) |
| 0.1 | 0.5 | GO:0000836 | ER ubiquitin ligase complex(GO:0000835) Hrd1p ubiquitin ligase complex(GO:0000836) |
| 0.1 | 1.1 | GO:0032039 | integrator complex(GO:0032039) |
| 0.1 | 0.4 | GO:0071458 | integral component of cytoplasmic side of endoplasmic reticulum membrane(GO:0071458) |
| 0.1 | 0.7 | GO:0060091 | kinocilium(GO:0060091) |
| 0.1 | 0.6 | GO:0042719 | mitochondrial intermembrane space protein transporter complex(GO:0042719) |
| 0.1 | 0.6 | GO:0061574 | ASAP complex(GO:0061574) |
| 0.1 | 0.3 | GO:0019034 | viral replication complex(GO:0019034) |
| 0.1 | 0.3 | GO:0002189 | ribose phosphate diphosphokinase complex(GO:0002189) |
| 0.1 | 1.0 | GO:0031209 | SCAR complex(GO:0031209) |
| 0.1 | 0.1 | GO:1990111 | spermatoproteasome complex(GO:1990111) |
| 0.1 | 1.1 | GO:0032426 | stereocilium tip(GO:0032426) |
| 0.1 | 0.2 | GO:0098799 | outer mitochondrial membrane protein complex(GO:0098799) |
| 0.1 | 0.8 | GO:0033180 | proton-transporting V-type ATPase, V1 domain(GO:0033180) |
| 0.1 | 0.4 | GO:0000110 | nucleotide-excision repair factor 1 complex(GO:0000110) |
| 0.1 | 0.7 | GO:0016602 | CCAAT-binding factor complex(GO:0016602) |
| 0.1 | 0.4 | GO:0002169 | 3-methylcrotonyl-CoA carboxylase complex, mitochondrial(GO:0002169) methylcrotonoyl-CoA carboxylase complex(GO:1905202) |
| 0.1 | 0.2 | GO:0031510 | SUMO activating enzyme complex(GO:0031510) |
| 0.1 | 0.7 | GO:0098647 | collagen type VI trimer(GO:0005589) collagen beaded filament(GO:0098647) |
| 0.1 | 0.8 | GO:0008290 | F-actin capping protein complex(GO:0008290) |
| 0.1 | 2.7 | GO:0016592 | mediator complex(GO:0016592) |
| 0.1 | 0.6 | GO:0016593 | Cdc73/Paf1 complex(GO:0016593) |
| 0.1 | 0.4 | GO:0002177 | manchette(GO:0002177) |
| 0.1 | 0.2 | GO:0034365 | discoidal high-density lipoprotein particle(GO:0034365) |
| 0.1 | 0.2 | GO:0071920 | cleavage body(GO:0071920) |
| 0.1 | 0.2 | GO:0000333 | telomerase catalytic core complex(GO:0000333) |
| 0.1 | 0.3 | GO:0031501 | mannosyltransferase complex(GO:0031501) |
| 0.0 | 0.7 | GO:0019774 | proteasome core complex, beta-subunit complex(GO:0019774) |
| 0.0 | 0.2 | GO:0032044 | DSIF complex(GO:0032044) |
| 0.0 | 0.2 | GO:0005971 | ribonucleoside-diphosphate reductase complex(GO:0005971) |
| 0.0 | 3.4 | GO:0005747 | mitochondrial respiratory chain complex I(GO:0005747) NADH dehydrogenase complex(GO:0030964) respiratory chain complex I(GO:0045271) |
| 0.0 | 0.4 | GO:0030121 | AP-1 adaptor complex(GO:0030121) |
| 0.0 | 0.3 | GO:0001652 | granular component(GO:0001652) |
| 0.0 | 0.2 | GO:1990769 | proximal neuron projection(GO:1990769) |
| 0.0 | 0.3 | GO:1990812 | growth cone filopodium(GO:1990812) |
| 0.0 | 0.4 | GO:0071953 | elastic fiber(GO:0071953) |
| 0.0 | 0.8 | GO:0034992 | microtubule organizing center attachment site(GO:0034992) LINC complex(GO:0034993) |
| 0.0 | 0.1 | GO:0005760 | gamma DNA polymerase complex(GO:0005760) |
| 0.0 | 0.2 | GO:0005873 | plus-end kinesin complex(GO:0005873) |
| 0.0 | 0.1 | GO:0030678 | mitochondrial ribonuclease P complex(GO:0030678) |
| 0.0 | 0.2 | GO:0034274 | Atg12-Atg5-Atg16 complex(GO:0034274) |
| 0.0 | 0.1 | GO:0070685 | macropinocytic cup(GO:0070685) |
| 0.0 | 1.0 | GO:0036038 | MKS complex(GO:0036038) |
| 0.0 | 0.3 | GO:0032584 | growth cone membrane(GO:0032584) |
| 0.0 | 0.2 | GO:0089717 | spanning component of plasma membrane(GO:0044214) spanning component of membrane(GO:0089717) |
| 0.0 | 0.2 | GO:0005854 | nascent polypeptide-associated complex(GO:0005854) |
| 0.0 | 2.7 | GO:0043198 | dendritic shaft(GO:0043198) |
| 0.0 | 0.4 | GO:0032541 | cortical endoplasmic reticulum(GO:0032541) |
| 0.0 | 1.7 | GO:0000159 | protein phosphatase type 2A complex(GO:0000159) |
| 0.0 | 0.2 | GO:0071821 | FANCM-MHF complex(GO:0071821) |
| 0.0 | 0.6 | GO:0000812 | Swr1 complex(GO:0000812) |
| 0.0 | 0.6 | GO:0008540 | proteasome regulatory particle, base subcomplex(GO:0008540) |
| 0.0 | 0.2 | GO:0070032 | synaptobrevin 2-SNAP-25-syntaxin-1a-complexin I complex(GO:0070032) |
| 0.0 | 0.5 | GO:0032009 | early phagosome(GO:0032009) |
| 0.0 | 0.3 | GO:0016514 | SWI/SNF complex(GO:0016514) |
| 0.0 | 0.9 | GO:0044300 | cerebellar mossy fiber(GO:0044300) |
| 0.0 | 0.1 | GO:0055087 | Ski complex(GO:0055087) |
| 0.0 | 1.4 | GO:0016591 | DNA-directed RNA polymerase II, holoenzyme(GO:0016591) |
| 0.0 | 1.3 | GO:0005746 | mitochondrial respiratory chain(GO:0005746) |
| 0.0 | 0.4 | GO:0072546 | ER membrane protein complex(GO:0072546) |
| 0.0 | 0.2 | GO:0014802 | terminal cisterna(GO:0014802) |
| 0.0 | 0.4 | GO:0044666 | MLL3/4 complex(GO:0044666) |
| 0.0 | 0.4 | GO:0000506 | glycosylphosphatidylinositol-N-acetylglucosaminyltransferase (GPI-GnT) complex(GO:0000506) |
| 0.0 | 0.1 | GO:0030289 | protein phosphatase 4 complex(GO:0030289) |
| 0.0 | 0.2 | GO:0000796 | condensin complex(GO:0000796) |
| 0.0 | 0.3 | GO:0035253 | ciliary rootlet(GO:0035253) |
| 0.0 | 0.2 | GO:0017101 | aminoacyl-tRNA synthetase multienzyme complex(GO:0017101) |
| 0.0 | 3.3 | GO:0022625 | cytosolic large ribosomal subunit(GO:0022625) |
| 0.0 | 0.5 | GO:0000974 | Prp19 complex(GO:0000974) |
| 0.0 | 1.0 | GO:0031233 | intrinsic component of external side of plasma membrane(GO:0031233) |
| 0.0 | 4.5 | GO:0043202 | lysosomal lumen(GO:0043202) |
| 0.0 | 0.2 | GO:0031262 | Ndc80 complex(GO:0031262) |
| 0.0 | 0.2 | GO:0032777 | Piccolo NuA4 histone acetyltransferase complex(GO:0032777) |
| 0.0 | 0.2 | GO:0030905 | retromer, tubulation complex(GO:0030905) |
| 0.0 | 0.3 | GO:0070652 | HAUS complex(GO:0070652) |
| 0.0 | 0.3 | GO:0019773 | proteasome core complex, alpha-subunit complex(GO:0019773) |
| 0.0 | 0.4 | GO:0005833 | hemoglobin complex(GO:0005833) |
| 0.0 | 0.2 | GO:0031464 | Cul4A-RING E3 ubiquitin ligase complex(GO:0031464) |
| 0.0 | 0.3 | GO:0072357 | PTW/PP1 phosphatase complex(GO:0072357) |
| 0.0 | 0.0 | GO:0071817 | MMXD complex(GO:0071817) |
| 0.0 | 2.5 | GO:0000123 | histone acetyltransferase complex(GO:0000123) |
| 0.0 | 0.5 | GO:0097539 | ciliary transition fiber(GO:0097539) |
| 0.0 | 1.8 | GO:0022627 | cytosolic small ribosomal subunit(GO:0022627) |
| 0.0 | 0.2 | GO:0061617 | MICOS complex(GO:0061617) |
| 0.0 | 0.2 | GO:0045179 | apical cortex(GO:0045179) |
| 0.0 | 0.2 | GO:0097209 | epidermal lamellar body(GO:0097209) |
| 0.0 | 0.9 | GO:0000421 | autophagosome membrane(GO:0000421) |
| 0.0 | 0.1 | GO:0034991 | nuclear meiotic cohesin complex(GO:0034991) |
| 0.0 | 0.1 | GO:0045323 | interleukin-1 receptor complex(GO:0045323) |
| 0.0 | 0.1 | GO:0000788 | nuclear nucleosome(GO:0000788) |
| 0.0 | 0.2 | GO:0044352 | pinosome(GO:0044352) macropinosome(GO:0044354) |
| 0.0 | 9.2 | GO:0005667 | transcription factor complex(GO:0005667) |
| 0.0 | 0.1 | GO:0043625 | delta DNA polymerase complex(GO:0043625) |
| 0.0 | 0.2 | GO:0000445 | THO complex(GO:0000347) THO complex part of transcription export complex(GO:0000445) |
| 0.0 | 0.6 | GO:0005763 | organellar small ribosomal subunit(GO:0000314) mitochondrial small ribosomal subunit(GO:0005763) |
| 0.0 | 0.5 | GO:0031083 | BLOC-1 complex(GO:0031083) |
| 0.0 | 0.2 | GO:0071986 | Ragulator complex(GO:0071986) |
| 0.0 | 0.4 | GO:0043205 | microfibril(GO:0001527) fibril(GO:0043205) |
| 0.0 | 0.1 | GO:0070695 | FHF complex(GO:0070695) |
| 0.0 | 1.1 | GO:0008180 | COP9 signalosome(GO:0008180) |
| 0.0 | 0.0 | GO:0070939 | Dsl1p complex(GO:0070939) |
| 0.0 | 0.1 | GO:0042824 | MHC class I peptide loading complex(GO:0042824) |
| 0.0 | 0.4 | GO:0031011 | Ino80 complex(GO:0031011) DNA helicase complex(GO:0033202) INO80-type complex(GO:0097346) |
| 0.0 | 0.3 | GO:0034098 | VCP-NPL4-UFD1 AAA ATPase complex(GO:0034098) |
| 0.0 | 0.3 | GO:0000242 | pericentriolar material(GO:0000242) |
| 0.0 | 0.2 | GO:0043240 | Fanconi anaemia nuclear complex(GO:0043240) |
| 0.0 | 0.4 | GO:0005686 | U2 snRNP(GO:0005686) |
| 0.0 | 0.7 | GO:0034451 | centriolar satellite(GO:0034451) |
| 0.0 | 1.4 | GO:0000118 | histone deacetylase complex(GO:0000118) |
| 0.0 | 2.7 | GO:0016363 | nuclear matrix(GO:0016363) |
| 0.0 | 0.2 | GO:0005662 | DNA replication factor A complex(GO:0005662) |
| 0.0 | 0.5 | GO:0035098 | ESC/E(Z) complex(GO:0035098) |
| 0.0 | 0.3 | GO:0042622 | photoreceptor outer segment membrane(GO:0042622) |
| 0.0 | 0.1 | GO:0033503 | HULC complex(GO:0033503) |
| 0.0 | 0.3 | GO:0010369 | chromocenter(GO:0010369) |
| 0.0 | 0.5 | GO:0031092 | platelet alpha granule membrane(GO:0031092) |
| 0.0 | 1.0 | GO:0031907 | peroxisomal matrix(GO:0005782) microbody lumen(GO:0031907) |
| 0.0 | 1.4 | GO:0045334 | clathrin-coated endocytic vesicle(GO:0045334) |
| 0.0 | 0.2 | GO:0005720 | nuclear heterochromatin(GO:0005720) |
| 0.0 | 0.4 | GO:0042629 | mast cell granule(GO:0042629) |
| 0.0 | 2.2 | GO:0031901 | early endosome membrane(GO:0031901) |
| 0.0 | 0.2 | GO:0045254 | pyruvate dehydrogenase complex(GO:0045254) |
| 0.0 | 0.8 | GO:0030173 | integral component of Golgi membrane(GO:0030173) |
| 0.0 | 0.5 | GO:0031519 | PcG protein complex(GO:0031519) |
| 0.0 | 0.1 | GO:0005577 | fibrinogen complex(GO:0005577) |
| 0.0 | 0.2 | GO:0030904 | retromer complex(GO:0030904) |
| 0.0 | 0.1 | GO:0071001 | U4/U6 snRNP(GO:0071001) |
| 0.0 | 0.1 | GO:0036128 | CatSper complex(GO:0036128) |
| 0.0 | 0.2 | GO:0000930 | gamma-tubulin complex(GO:0000930) |
| 0.0 | 1.8 | GO:0005777 | peroxisome(GO:0005777) microbody(GO:0042579) |
| 0.0 | 0.7 | GO:0033017 | sarcoplasmic reticulum membrane(GO:0033017) |
| 0.0 | 0.0 | GO:0032116 | SMC loading complex(GO:0032116) |
| 0.0 | 0.5 | GO:0097546 | ciliary base(GO:0097546) |
| 0.0 | 0.1 | GO:0031673 | H zone(GO:0031673) |
| 0.0 | 0.1 | GO:0070552 | BRISC complex(GO:0070552) |
| 0.0 | 0.2 | GO:0031307 | integral component of mitochondrial outer membrane(GO:0031307) |
| 0.0 | 0.2 | GO:0005832 | chaperonin-containing T-complex(GO:0005832) |
| 0.0 | 0.3 | GO:0016327 | apicolateral plasma membrane(GO:0016327) |
| 0.0 | 0.1 | GO:0044294 | dendritic growth cone(GO:0044294) |
| 0.0 | 0.3 | GO:0097381 | photoreceptor disc membrane(GO:0097381) |
| 0.0 | 0.1 | GO:0070187 | telosome(GO:0070187) |
Gene overrepresentation in molecular function category:
| Log-likelihood per target | Total log-likelihood | Term | Description |
|---|---|---|---|
| 0.9 | 2.6 | GO:0004119 | cGMP-inhibited cyclic-nucleotide phosphodiesterase activity(GO:0004119) |
| 0.8 | 4.0 | GO:0032810 | sterol response element binding(GO:0032810) |
| 0.7 | 2.1 | GO:0003863 | alpha-ketoacid dehydrogenase activity(GO:0003826) 3-methyl-2-oxobutanoate dehydrogenase (2-methylpropanoyl-transferring) activity(GO:0003863) |
| 0.6 | 2.8 | GO:0008160 | protein tyrosine phosphatase activator activity(GO:0008160) |
| 0.5 | 4.0 | GO:0097643 | amylin receptor activity(GO:0097643) |
| 0.5 | 1.4 | GO:0046577 | long-chain-alcohol oxidase activity(GO:0046577) |
| 0.4 | 1.2 | GO:0004336 | galactosylceramidase activity(GO:0004336) |
| 0.4 | 1.8 | GO:0005223 | intracellular cGMP activated cation channel activity(GO:0005223) |
| 0.3 | 2.8 | GO:0015235 | cobalamin transporter activity(GO:0015235) |
| 0.3 | 2.3 | GO:0004614 | phosphoglucomutase activity(GO:0004614) |
| 0.3 | 1.2 | GO:0003987 | acetate-CoA ligase activity(GO:0003987) |
| 0.3 | 2.9 | GO:0008046 | axon guidance receptor activity(GO:0008046) |
| 0.3 | 0.8 | GO:0015140 | malate transmembrane transporter activity(GO:0015140) |
| 0.2 | 0.7 | GO:0004165 | dodecenoyl-CoA delta-isomerase activity(GO:0004165) |
| 0.2 | 0.7 | GO:0043035 | chromatin insulator sequence binding(GO:0043035) |
| 0.2 | 3.6 | GO:0003688 | DNA replication origin binding(GO:0003688) |
| 0.2 | 4.4 | GO:0001011 | transcription factor activity, sequence-specific DNA binding, RNA polymerase recruiting(GO:0001011) transcription factor activity, TFIIB-class binding(GO:0001087) |
| 0.2 | 1.0 | GO:0032143 | double-strand/single-strand DNA junction binding(GO:0000406) single thymine insertion binding(GO:0032143) dinucleotide repeat insertion binding(GO:0032181) |
| 0.2 | 0.6 | GO:0051377 | mannose-ethanolamine phosphotransferase activity(GO:0051377) |
| 0.2 | 0.6 | GO:0032090 | Pyrin domain binding(GO:0032090) |
| 0.2 | 0.7 | GO:0019144 | ADP-sugar diphosphatase activity(GO:0019144) |
| 0.2 | 1.1 | GO:0003923 | GPI-anchor transamidase activity(GO:0003923) |
| 0.2 | 0.7 | GO:0045322 | unmethylated CpG binding(GO:0045322) |
| 0.2 | 1.0 | GO:0044729 | hemi-methylated DNA-binding(GO:0044729) |
| 0.2 | 0.3 | GO:0047025 | 3-oxoacyl-[acyl-carrier-protein] reductase (NADH) activity(GO:0047025) |
| 0.2 | 0.5 | GO:1904599 | advanced glycation end-product binding(GO:1904599) |
| 0.2 | 0.6 | GO:0008177 | succinate dehydrogenase (ubiquinone) activity(GO:0008177) |
| 0.1 | 0.4 | GO:0004584 | dolichyl-phosphate-mannose-glycolipid alpha-mannosyltransferase activity(GO:0004584) |
| 0.1 | 0.6 | GO:0052836 | inositol 5-diphosphate pentakisphosphate 5-kinase activity(GO:0052836) inositol diphosphate tetrakisphosphate kinase activity(GO:0052839) |
| 0.1 | 0.8 | GO:0004095 | carnitine O-palmitoyltransferase activity(GO:0004095) |
| 0.1 | 0.4 | GO:0004416 | hydroxyacylglutathione hydrolase activity(GO:0004416) |
| 0.1 | 0.5 | GO:0004419 | hydroxymethylglutaryl-CoA lyase activity(GO:0004419) |
| 0.1 | 0.8 | GO:0008532 | N-acetyllactosaminide beta-1,3-N-acetylglucosaminyltransferase activity(GO:0008532) |
| 0.1 | 1.6 | GO:0008607 | phosphorylase kinase regulator activity(GO:0008607) |
| 0.1 | 2.6 | GO:0042809 | vitamin D receptor binding(GO:0042809) |
| 0.1 | 0.4 | GO:0045131 | pre-mRNA branch point binding(GO:0045131) |
| 0.1 | 0.4 | GO:0003941 | L-serine ammonia-lyase activity(GO:0003941) |
| 0.1 | 1.5 | GO:0004075 | biotin carboxylase activity(GO:0004075) |
| 0.1 | 1.9 | GO:0017162 | aryl hydrocarbon receptor binding(GO:0017162) |
| 0.1 | 0.5 | GO:0003985 | acetyl-CoA C-acetyltransferase activity(GO:0003985) |
| 0.1 | 0.5 | GO:0004853 | uroporphyrinogen decarboxylase activity(GO:0004853) |
| 0.1 | 0.5 | GO:0070404 | NADH binding(GO:0070404) |
| 0.1 | 1.9 | GO:0003993 | acid phosphatase activity(GO:0003993) |
| 0.1 | 0.5 | GO:0042132 | fructose 1,6-bisphosphate 1-phosphatase activity(GO:0042132) |
| 0.1 | 0.7 | GO:0004749 | ribose phosphate diphosphokinase activity(GO:0004749) |
| 0.1 | 0.5 | GO:0000822 | inositol hexakisphosphate binding(GO:0000822) |
| 0.1 | 1.1 | GO:0016206 | catechol O-methyltransferase activity(GO:0016206) |
| 0.1 | 0.4 | GO:0004739 | pyruvate dehydrogenase (acetyl-transferring) activity(GO:0004739) |
| 0.1 | 0.4 | GO:0046933 | proton-transporting ATP synthase activity, rotational mechanism(GO:0046933) |
| 0.1 | 1.1 | GO:0001609 | G-protein coupled adenosine receptor activity(GO:0001609) |
| 0.1 | 0.5 | GO:0016532 | superoxide dismutase copper chaperone activity(GO:0016532) |
| 0.1 | 0.6 | GO:0004489 | methylenetetrahydrofolate reductase (NAD(P)H) activity(GO:0004489) |
| 0.1 | 0.3 | GO:0052857 | NADHX epimerase activity(GO:0052856) NADPHX epimerase activity(GO:0052857) |
| 0.1 | 0.8 | GO:0016681 | ubiquinol-cytochrome-c reductase activity(GO:0008121) oxidoreductase activity, acting on diphenols and related substances as donors, cytochrome as acceptor(GO:0016681) |
| 0.1 | 0.8 | GO:0036132 | 13-prostaglandin reductase activity(GO:0036132) 15-oxoprostaglandin 13-oxidase activity(GO:0047522) |
| 0.1 | 0.3 | GO:0004798 | thymidylate kinase activity(GO:0004798) |
| 0.1 | 0.6 | GO:0034714 | type III transforming growth factor beta receptor binding(GO:0034714) |
| 0.1 | 0.5 | GO:0016520 | growth hormone-releasing hormone receptor activity(GO:0016520) |
| 0.1 | 0.6 | GO:1904288 | BAT3 complex binding(GO:1904288) |
| 0.1 | 1.2 | GO:0008381 | mechanically-gated ion channel activity(GO:0008381) mechanically gated channel activity(GO:0022833) |
| 0.1 | 0.5 | GO:0005315 | inorganic phosphate transmembrane transporter activity(GO:0005315) |
| 0.1 | 0.4 | GO:0050436 | microfibril binding(GO:0050436) |
| 0.1 | 0.1 | GO:0000104 | succinate dehydrogenase activity(GO:0000104) |
| 0.1 | 0.5 | GO:0004826 | phenylalanine-tRNA ligase activity(GO:0004826) |
| 0.1 | 0.8 | GO:0005094 | Rho GDP-dissociation inhibitor activity(GO:0005094) |
| 0.1 | 0.2 | GO:0016608 | growth hormone-releasing hormone activity(GO:0016608) |
| 0.1 | 3.1 | GO:0070577 | lysine-acetylated histone binding(GO:0070577) |
| 0.1 | 0.7 | GO:0070740 | tubulin-glutamic acid ligase activity(GO:0070740) |
| 0.1 | 1.0 | GO:0015266 | protein channel activity(GO:0015266) |
| 0.1 | 0.3 | GO:0008184 | glycogen phosphorylase activity(GO:0008184) |
| 0.1 | 0.9 | GO:0008297 | single-stranded DNA exodeoxyribonuclease activity(GO:0008297) |
| 0.1 | 0.6 | GO:0019788 | NEDD8 transferase activity(GO:0019788) |
| 0.1 | 2.0 | GO:0070008 | serine-type exopeptidase activity(GO:0070008) |
| 0.1 | 0.6 | GO:0019784 | NEDD8-specific protease activity(GO:0019784) |
| 0.1 | 0.6 | GO:0004468 | lysine N-acetyltransferase activity, acting on acetyl phosphate as donor(GO:0004468) |
| 0.1 | 1.9 | GO:0004697 | protein kinase C activity(GO:0004697) |
| 0.1 | 0.3 | GO:0004706 | JUN kinase kinase kinase activity(GO:0004706) |
| 0.1 | 0.7 | GO:0046974 | histone methyltransferase activity (H3-K9 specific)(GO:0046974) |
| 0.1 | 0.3 | GO:0032184 | SUMO polymer binding(GO:0032184) |
| 0.1 | 0.9 | GO:0008097 | 5S rRNA binding(GO:0008097) |
| 0.1 | 0.3 | GO:0008453 | alanine-glyoxylate transaminase activity(GO:0008453) |
| 0.1 | 0.1 | GO:0016890 | site-specific endodeoxyribonuclease activity, specific for altered base(GO:0016890) |
| 0.1 | 0.5 | GO:0004300 | enoyl-CoA hydratase activity(GO:0004300) |
| 0.1 | 1.1 | GO:0016755 | transferase activity, transferring amino-acyl groups(GO:0016755) |
| 0.1 | 0.1 | GO:0042903 | tubulin deacetylase activity(GO:0042903) |
| 0.1 | 0.3 | GO:0008410 | CoA-transferase activity(GO:0008410) |
| 0.1 | 0.4 | GO:0001165 | RNA polymerase I upstream control element sequence-specific DNA binding(GO:0001165) |
| 0.1 | 0.8 | GO:0016413 | O-acetyltransferase activity(GO:0016413) |
| 0.1 | 0.3 | GO:0005119 | smoothened binding(GO:0005119) |
| 0.1 | 0.2 | GO:0005163 | nerve growth factor receptor binding(GO:0005163) |
| 0.1 | 0.4 | GO:0008481 | sphinganine kinase activity(GO:0008481) D-erythro-sphingosine kinase activity(GO:0017050) |
| 0.1 | 0.5 | GO:0005005 | transmembrane-ephrin receptor activity(GO:0005005) |
| 0.1 | 0.7 | GO:0031995 | insulin-like growth factor II binding(GO:0031995) |
| 0.1 | 0.3 | GO:0008449 | N-acetylglucosamine-6-sulfatase activity(GO:0008449) |
| 0.1 | 0.2 | GO:0004782 | sulfinoalanine decarboxylase activity(GO:0004782) |
| 0.1 | 0.2 | GO:0008798 | beta-aspartyl-peptidase activity(GO:0008798) |
| 0.1 | 0.2 | GO:0031531 | thyrotropin-releasing hormone receptor binding(GO:0031531) |
| 0.1 | 0.4 | GO:0030144 | alpha-1,6-mannosylglycoprotein 6-beta-N-acetylglucosaminyltransferase activity(GO:0030144) |
| 0.1 | 3.7 | GO:0003954 | NADH dehydrogenase activity(GO:0003954) |
| 0.1 | 0.6 | GO:0015038 | glutathione disulfide oxidoreductase activity(GO:0015038) |
| 0.1 | 0.2 | GO:0070326 | very-low-density lipoprotein particle receptor binding(GO:0070326) |
| 0.1 | 0.3 | GO:0071074 | eukaryotic initiation factor eIF2 binding(GO:0071074) |
| 0.1 | 0.2 | GO:0004852 | uroporphyrinogen-III synthase activity(GO:0004852) |
| 0.1 | 1.0 | GO:0008140 | cAMP response element binding protein binding(GO:0008140) |
| 0.1 | 0.7 | GO:0015386 | potassium:proton antiporter activity(GO:0015386) |
| 0.1 | 0.2 | GO:0031753 | endothelial differentiation G-protein coupled receptor binding(GO:0031753) Edg-2 lysophosphatidic acid receptor binding(GO:0031755) |
| 0.1 | 0.6 | GO:0004844 | uracil DNA N-glycosylase activity(GO:0004844) deaminated base DNA N-glycosylase activity(GO:0097506) |
| 0.1 | 0.2 | GO:0080023 | 3R-hydroxyacyl-CoA dehydratase activity(GO:0080023) |
| 0.1 | 0.4 | GO:0005127 | ciliary neurotrophic factor receptor binding(GO:0005127) |
| 0.1 | 3.3 | GO:0018024 | histone-lysine N-methyltransferase activity(GO:0018024) |
| 0.1 | 0.3 | GO:0052841 | endopolyphosphatase activity(GO:0000298) diphosphoinositol-polyphosphate diphosphatase activity(GO:0008486) bis(5'-adenosyl)-hexaphosphatase activity(GO:0034431) bis(5'-adenosyl)-pentaphosphatase activity(GO:0034432) inositol diphosphate tetrakisphosphate diphosphatase activity(GO:0052840) inositol bisdiphosphate tetrakisphosphate diphosphatase activity(GO:0052841) inositol diphosphate pentakisphosphate diphosphatase activity(GO:0052842) inositol-1-diphosphate-2,3,4,5,6-pentakisphosphate diphosphatase activity(GO:0052843) inositol-3-diphosphate-1,2,4,5,6-pentakisphosphate diphosphatase activity(GO:0052844) inositol-5-diphosphate-1,2,3,4,6-pentakisphosphate diphosphatase activity(GO:0052845) inositol-1,5-bisdiphosphate-2,3,4,6-tetrakisphosphate 1-diphosphatase activity(GO:0052846) inositol-1,5-bisdiphosphate-2,3,4,6-tetrakisphosphate 5-diphosphatase activity(GO:0052847) inositol-3,5-bisdiphosphate-2,3,4,6-tetrakisphosphate 5-diphosphatase activity(GO:0052848) |
| 0.1 | 0.3 | GO:0035497 | cAMP response element binding(GO:0035497) |
| 0.1 | 0.3 | GO:0042954 | lipoprotein transporter activity(GO:0042954) |
| 0.1 | 0.2 | GO:0030272 | 5-formyltetrahydrofolate cyclo-ligase activity(GO:0030272) |
| 0.1 | 2.1 | GO:0017134 | fibroblast growth factor binding(GO:0017134) |
| 0.1 | 0.2 | GO:0047184 | 1-acylglycerophosphocholine O-acyltransferase activity(GO:0047184) |
| 0.1 | 0.2 | GO:0016524 | latrotoxin receptor activity(GO:0016524) |
| 0.1 | 0.2 | GO:0004609 | phosphatidylserine decarboxylase activity(GO:0004609) |
| 0.0 | 0.2 | GO:0004583 | dolichyl-phosphate-glucose-glycolipid alpha-glucosyltransferase activity(GO:0004583) |
| 0.0 | 1.2 | GO:0008191 | metalloendopeptidase inhibitor activity(GO:0008191) |
| 0.0 | 0.2 | GO:0004748 | ribonucleoside-diphosphate reductase activity, thioredoxin disulfide as acceptor(GO:0004748) oxidoreductase activity, acting on CH or CH2 groups, disulfide as acceptor(GO:0016728) ribonucleoside-diphosphate reductase activity(GO:0061731) |
| 0.0 | 1.0 | GO:0019871 | sodium channel inhibitor activity(GO:0019871) |
| 0.0 | 0.3 | GO:0031871 | proteinase activated receptor binding(GO:0031871) |
| 0.0 | 0.5 | GO:0019826 | oxygen sensor activity(GO:0019826) |
| 0.0 | 0.3 | GO:0003998 | acylphosphatase activity(GO:0003998) |
| 0.0 | 0.5 | GO:0008420 | CTD phosphatase activity(GO:0008420) |
| 0.0 | 1.3 | GO:0008656 | cysteine-type endopeptidase activator activity involved in apoptotic process(GO:0008656) |
| 0.0 | 0.4 | GO:0050815 | phosphoserine binding(GO:0050815) |
| 0.0 | 0.3 | GO:0004359 | glutaminase activity(GO:0004359) |
| 0.0 | 4.1 | GO:0001190 | transcriptional activator activity, RNA polymerase II transcription factor binding(GO:0001190) transcriptional repressor activity, RNA polymerase II activating transcription factor binding(GO:0098811) |
| 0.0 | 0.3 | GO:1990254 | keratin filament binding(GO:1990254) |
| 0.0 | 0.2 | GO:0004773 | steryl-sulfatase activity(GO:0004773) |
| 0.0 | 0.5 | GO:0015232 | heme transporter activity(GO:0015232) |
| 0.0 | 1.0 | GO:0008093 | cytoskeletal adaptor activity(GO:0008093) |
| 0.0 | 0.5 | GO:0098599 | palmitoyl-(protein) hydrolase activity(GO:0008474) palmitoyl hydrolase activity(GO:0098599) |
| 0.0 | 0.7 | GO:0005225 | volume-sensitive anion channel activity(GO:0005225) |
| 0.0 | 0.1 | GO:0015616 | DNA translocase activity(GO:0015616) |
| 0.0 | 1.3 | GO:0070530 | K63-linked polyubiquitin binding(GO:0070530) |
| 0.0 | 1.1 | GO:0004298 | threonine-type endopeptidase activity(GO:0004298) threonine-type peptidase activity(GO:0070003) |
| 0.0 | 0.1 | GO:0016309 | 1-phosphatidylinositol-5-phosphate 4-kinase activity(GO:0016309) |
| 0.0 | 0.7 | GO:0005049 | nuclear export signal receptor activity(GO:0005049) |
| 0.0 | 0.7 | GO:0004861 | cyclin-dependent protein serine/threonine kinase inhibitor activity(GO:0004861) |
| 0.0 | 0.4 | GO:0017176 | phosphatidylinositol N-acetylglucosaminyltransferase activity(GO:0017176) |
| 0.0 | 0.5 | GO:0051011 | microtubule minus-end binding(GO:0051011) |
| 0.0 | 0.2 | GO:0072542 | protein phosphatase activator activity(GO:0072542) |
| 0.0 | 0.1 | GO:0032093 | SAM domain binding(GO:0032093) |
| 0.0 | 0.3 | GO:0004797 | deoxycytidine kinase activity(GO:0004137) thymidine kinase activity(GO:0004797) |
| 0.0 | 0.2 | GO:0004719 | protein-L-isoaspartate (D-aspartate) O-methyltransferase activity(GO:0004719) |
| 0.0 | 1.2 | GO:0004707 | MAP kinase activity(GO:0004707) |
| 0.0 | 0.1 | GO:0004939 | beta-adrenergic receptor activity(GO:0004939) |
| 0.0 | 0.2 | GO:0016421 | CoA carboxylase activity(GO:0016421) ligase activity, forming carbon-carbon bonds(GO:0016885) |
| 0.0 | 0.4 | GO:0050291 | sphingosine N-acyltransferase activity(GO:0050291) |
| 0.0 | 1.5 | GO:0000175 | 3'-5'-exoribonuclease activity(GO:0000175) |
| 0.0 | 0.2 | GO:0004774 | succinate-CoA ligase activity(GO:0004774) |
| 0.0 | 2.7 | GO:0035064 | methylated histone binding(GO:0035064) |
| 0.0 | 0.4 | GO:0016634 | oxidoreductase activity, acting on the CH-CH group of donors, oxygen as acceptor(GO:0016634) |
| 0.0 | 0.2 | GO:0050254 | rhodopsin kinase activity(GO:0050254) |
| 0.0 | 0.4 | GO:0097602 | cullin family protein binding(GO:0097602) |
| 0.0 | 2.8 | GO:0001540 | beta-amyloid binding(GO:0001540) |
| 0.0 | 0.7 | GO:0051787 | misfolded protein binding(GO:0051787) |
| 0.0 | 0.2 | GO:0004694 | eukaryotic translation initiation factor 2alpha kinase activity(GO:0004694) |
| 0.0 | 0.3 | GO:0003831 | beta-N-acetylglucosaminylglycopeptide beta-1,4-galactosyltransferase activity(GO:0003831) |
| 0.0 | 0.1 | GO:0051185 | coenzyme transporter activity(GO:0051185) |
| 0.0 | 1.0 | GO:0051059 | NF-kappaB binding(GO:0051059) |
| 0.0 | 0.2 | GO:1990460 | leptin receptor binding(GO:1990460) |
| 0.0 | 0.1 | GO:0071987 | WD40-repeat domain binding(GO:0071987) |
| 0.0 | 0.2 | GO:0004528 | phosphodiesterase I activity(GO:0004528) |
| 0.0 | 0.9 | GO:0002162 | dystroglycan binding(GO:0002162) |
| 0.0 | 0.2 | GO:0033677 | DNA/RNA helicase activity(GO:0033677) |
| 0.0 | 1.8 | GO:0004407 | histone deacetylase activity(GO:0004407) |
| 0.0 | 0.3 | GO:0070181 | small ribosomal subunit rRNA binding(GO:0070181) |
| 0.0 | 1.5 | GO:0044390 | ubiquitin-like protein conjugating enzyme binding(GO:0044390) |
| 0.0 | 0.5 | GO:0004439 | phosphatidylinositol-4,5-bisphosphate 5-phosphatase activity(GO:0004439) |
| 0.0 | 0.5 | GO:0034450 | ubiquitin-ubiquitin ligase activity(GO:0034450) |
| 0.0 | 0.2 | GO:0051996 | farnesyl-diphosphate farnesyltransferase activity(GO:0004310) squalene synthase activity(GO:0051996) |
| 0.0 | 0.2 | GO:0016435 | rRNA (guanine) methyltransferase activity(GO:0016435) |
| 0.0 | 0.2 | GO:0017040 | ceramidase activity(GO:0017040) |
| 0.0 | 0.6 | GO:0008253 | 5'-nucleotidase activity(GO:0008253) |
| 0.0 | 0.3 | GO:0001135 | transcription factor activity, RNA polymerase II transcription factor recruiting(GO:0001135) |
| 0.0 | 1.2 | GO:0003785 | actin monomer binding(GO:0003785) |
| 0.0 | 6.3 | GO:0003735 | structural constituent of ribosome(GO:0003735) |
| 0.0 | 0.1 | GO:0061609 | fructose-1-phosphate aldolase activity(GO:0061609) |
| 0.0 | 0.6 | GO:0005402 | sugar:proton symporter activity(GO:0005351) cation:sugar symporter activity(GO:0005402) |
| 0.0 | 0.2 | GO:0009378 | four-way junction helicase activity(GO:0009378) |
| 0.0 | 0.2 | GO:1904264 | ubiquitin protein ligase activity involved in ERAD pathway(GO:1904264) |
| 0.0 | 0.3 | GO:0035198 | miRNA binding(GO:0035198) |
| 0.0 | 0.5 | GO:0017166 | vinculin binding(GO:0017166) |
| 0.0 | 0.1 | GO:0004803 | transposase activity(GO:0004803) |
| 0.0 | 0.3 | GO:0045504 | dynein heavy chain binding(GO:0045504) |
| 0.0 | 0.1 | GO:0032406 | MutLbeta complex binding(GO:0032406) MutSbeta complex binding(GO:0032408) |
| 0.0 | 0.3 | GO:0004849 | uridine kinase activity(GO:0004849) |
| 0.0 | 0.2 | GO:0051575 | 5'-deoxyribose-5-phosphate lyase activity(GO:0051575) |
| 0.0 | 0.2 | GO:0098821 | BMP receptor activity(GO:0098821) |
| 0.0 | 0.4 | GO:0070628 | proteasome binding(GO:0070628) |
| 0.0 | 0.1 | GO:0015207 | ATP:ADP antiporter activity(GO:0005471) adenine transmembrane transporter activity(GO:0015207) |
| 0.0 | 0.2 | GO:0047144 | 2-acylglycerol-3-phosphate O-acyltransferase activity(GO:0047144) |
| 0.0 | 0.6 | GO:0016278 | lysine N-methyltransferase activity(GO:0016278) |
| 0.0 | 0.3 | GO:0004767 | sphingomyelin phosphodiesterase activity(GO:0004767) |
| 0.0 | 0.2 | GO:0009008 | DNA-methyltransferase activity(GO:0009008) |
| 0.0 | 0.2 | GO:0047499 | calcium-independent phospholipase A2 activity(GO:0047499) |
| 0.0 | 0.2 | GO:0050692 | DBD domain binding(GO:0050692) LBD domain binding(GO:0050693) |
| 0.0 | 0.1 | GO:0003943 | N-acetylgalactosamine-4-sulfatase activity(GO:0003943) |
| 0.0 | 0.6 | GO:0070001 | aspartic-type endopeptidase activity(GO:0004190) aspartic-type peptidase activity(GO:0070001) |
| 0.0 | 0.1 | GO:0030348 | syntaxin-3 binding(GO:0030348) |
| 0.0 | 0.2 | GO:0004128 | cytochrome-b5 reductase activity, acting on NAD(P)H(GO:0004128) |
| 0.0 | 0.2 | GO:0090599 | alpha-glucosidase activity(GO:0090599) |
| 0.0 | 0.1 | GO:0019797 | procollagen-proline 3-dioxygenase activity(GO:0019797) |
| 0.0 | 0.9 | GO:0031492 | nucleosomal DNA binding(GO:0031492) |
| 0.0 | 0.1 | GO:0008401 | retinoic acid 4-hydroxylase activity(GO:0008401) |
| 0.0 | 0.5 | GO:0016805 | dipeptidase activity(GO:0016805) |
| 0.0 | 0.6 | GO:0071949 | FAD binding(GO:0071949) |
| 0.0 | 0.5 | GO:0000993 | RNA polymerase II core binding(GO:0000993) |
| 0.0 | 1.4 | GO:0004712 | protein serine/threonine/tyrosine kinase activity(GO:0004712) |
| 0.0 | 0.3 | GO:0004791 | thioredoxin-disulfide reductase activity(GO:0004791) |
| 0.0 | 0.1 | GO:0010385 | double-stranded methylated DNA binding(GO:0010385) |
| 0.0 | 0.2 | GO:0004687 | myosin light chain kinase activity(GO:0004687) |
| 0.0 | 0.2 | GO:0004514 | nicotinate-nucleotide diphosphorylase (carboxylating) activity(GO:0004514) |
| 0.0 | 0.9 | GO:0051959 | dynein light intermediate chain binding(GO:0051959) |
| 0.0 | 0.1 | GO:0061575 | cyclin-dependent protein serine/threonine kinase activator activity(GO:0061575) |
| 0.0 | 0.7 | GO:0017025 | TBP-class protein binding(GO:0017025) |
| 0.0 | 0.1 | GO:0004971 | AMPA glutamate receptor activity(GO:0004971) |
| 0.0 | 0.3 | GO:0005132 | type I interferon receptor binding(GO:0005132) |
| 0.0 | 0.5 | GO:0016881 | acid-amino acid ligase activity(GO:0016881) |
| 0.0 | 0.5 | GO:0019992 | diacylglycerol binding(GO:0019992) |
| 0.0 | 0.1 | GO:0004961 | thromboxane receptor activity(GO:0004960) thromboxane A2 receptor activity(GO:0004961) |
| 0.0 | 0.1 | GO:0016714 | oxidoreductase activity, acting on paired donors, with incorporation or reduction of molecular oxygen, reduced pteridine as one donor, and incorporation of one atom of oxygen(GO:0016714) |
| 0.0 | 0.1 | GO:0015277 | kainate selective glutamate receptor activity(GO:0015277) |
| 0.0 | 0.1 | GO:0051379 | epinephrine binding(GO:0051379) |
| 0.0 | 0.2 | GO:0019870 | potassium channel inhibitor activity(GO:0019870) |
| 0.0 | 0.2 | GO:0071933 | Arp2/3 complex binding(GO:0071933) |
| 0.0 | 0.1 | GO:0034191 | apolipoprotein A-I receptor binding(GO:0034191) |
| 0.0 | 8.2 | GO:0001077 | transcriptional activator activity, RNA polymerase II core promoter proximal region sequence-specific binding(GO:0001077) |
| 0.0 | 0.1 | GO:0099609 | microtubule lateral binding(GO:0099609) |
| 0.0 | 0.1 | GO:0003872 | 6-phosphofructokinase activity(GO:0003872) |
| 0.0 | 0.1 | GO:0035500 | MH2 domain binding(GO:0035500) |
| 0.0 | 0.1 | GO:0032551 | pyrimidine nucleoside binding(GO:0001884) UTP binding(GO:0002134) pyrimidine ribonucleoside binding(GO:0032551) |
| 0.0 | 0.4 | GO:0008408 | 3'-5' exonuclease activity(GO:0008408) |
| 0.0 | 0.4 | GO:0017056 | structural constituent of nuclear pore(GO:0017056) |
| 0.0 | 0.1 | GO:0097322 | 7SK snRNA binding(GO:0097322) |
| 0.0 | 0.1 | GO:0005497 | androgen binding(GO:0005497) |
| 0.0 | 0.2 | GO:0019869 | chloride channel inhibitor activity(GO:0019869) |
| 0.0 | 0.1 | GO:0071532 | ankyrin repeat binding(GO:0071532) |
| 0.0 | 0.1 | GO:0061665 | SUMO ligase activity(GO:0061665) |
| 0.0 | 0.1 | GO:0001849 | complement component C1q binding(GO:0001849) |
| 0.0 | 0.9 | GO:0051393 | alpha-actinin binding(GO:0051393) |
| 0.0 | 0.5 | GO:0004622 | lysophospholipase activity(GO:0004622) |
| 0.0 | 0.2 | GO:0001223 | transcription coactivator binding(GO:0001223) |
| 0.0 | 0.4 | GO:0001103 | RNA polymerase II repressing transcription factor binding(GO:0001103) |
| 0.0 | 0.4 | GO:0042043 | neurexin family protein binding(GO:0042043) |
| 0.0 | 0.4 | GO:0044769 | ATPase activity, coupled to transmembrane movement of ions, rotational mechanism(GO:0044769) proton-transporting ATPase activity, rotational mechanism(GO:0046961) |
| 0.0 | 0.1 | GO:1990829 | C-rich single-stranded DNA binding(GO:1990829) |
| 0.0 | 0.2 | GO:0051864 | histone demethylase activity (H3-K36 specific)(GO:0051864) |
| 0.0 | 0.1 | GO:0016300 | tRNA (uracil) methyltransferase activity(GO:0016300) |
| 0.0 | 0.0 | GO:0004711 | ribosomal protein S6 kinase activity(GO:0004711) |
| 0.0 | 0.0 | GO:0060422 | peptidyl-dipeptidase inhibitor activity(GO:0060422) |
| 0.0 | 0.0 | GO:0004886 | 9-cis retinoic acid receptor activity(GO:0004886) |
| 0.0 | 0.3 | GO:0003841 | 1-acylglycerol-3-phosphate O-acyltransferase activity(GO:0003841) |
| 0.0 | 0.6 | GO:0030676 | Rac guanyl-nucleotide exchange factor activity(GO:0030676) |
| 0.0 | 0.1 | GO:0046624 | sphingolipid transporter activity(GO:0046624) |
| 0.0 | 0.1 | GO:0043141 | ATP-dependent 5'-3' DNA helicase activity(GO:0043141) |
| 0.0 | 0.1 | GO:0050659 | N-acetylgalactosamine 4-sulfate 6-O-sulfotransferase activity(GO:0050659) |
| 0.0 | 0.1 | GO:0003857 | 3-hydroxyacyl-CoA dehydrogenase activity(GO:0003857) |
| 0.0 | 0.2 | GO:0016538 | cyclin-dependent protein serine/threonine kinase regulator activity(GO:0016538) |
| 0.0 | 0.0 | GO:0071209 | U7 snRNA binding(GO:0071209) |
| 0.0 | 0.1 | GO:0005113 | patched binding(GO:0005113) |
| 0.0 | 0.2 | GO:0008171 | O-methyltransferase activity(GO:0008171) |
| 0.0 | 0.4 | GO:0005229 | intracellular calcium activated chloride channel activity(GO:0005229) |
| 0.0 | 0.2 | GO:0000774 | adenyl-nucleotide exchange factor activity(GO:0000774) |
| 0.0 | 0.1 | GO:0033592 | RNA strand annealing activity(GO:0033592) |
| 0.0 | 0.2 | GO:0015114 | phosphate ion transmembrane transporter activity(GO:0015114) |
| 0.0 | 0.8 | GO:0001158 | enhancer sequence-specific DNA binding(GO:0001158) |
| 0.0 | 0.5 | GO:0016702 | oxidoreductase activity, acting on single donors with incorporation of molecular oxygen, incorporation of two atoms of oxygen(GO:0016702) |
| 0.0 | 0.1 | GO:0030492 | hemoglobin binding(GO:0030492) |
| 0.0 | 0.1 | GO:0036435 | K48-linked polyubiquitin binding(GO:0036435) |
| 0.0 | 0.0 | GO:0051538 | 3 iron, 4 sulfur cluster binding(GO:0051538) |
| 0.0 | 0.2 | GO:0005344 | oxygen transporter activity(GO:0005344) |
| 0.0 | 0.4 | GO:0034237 | protein kinase A regulatory subunit binding(GO:0034237) |
| 0.0 | 0.2 | GO:0005041 | low-density lipoprotein receptor activity(GO:0005041) |
| 0.0 | 0.1 | GO:0003910 | DNA ligase (ATP) activity(GO:0003910) |
| 0.0 | 0.1 | GO:0102337 | fatty acid elongase activity(GO:0009922) 3-oxo-arachidoyl-CoA synthase activity(GO:0102336) 3-oxo-cerotoyl-CoA synthase activity(GO:0102337) 3-oxo-lignoceronyl-CoA synthase activity(GO:0102338) |
| 0.0 | 0.3 | GO:0017075 | syntaxin-1 binding(GO:0017075) |
| 0.0 | 0.2 | GO:0017049 | GTP-Rho binding(GO:0017049) |
| 0.0 | 0.0 | GO:0033823 | procollagen-lysine 5-dioxygenase activity(GO:0008475) procollagen glucosyltransferase activity(GO:0033823) procollagen galactosyltransferase activity(GO:0050211) |
| 0.0 | 0.1 | GO:0071535 | RING-like zinc finger domain binding(GO:0071535) |
| 0.0 | 0.1 | GO:0004704 | NF-kappaB-inducing kinase activity(GO:0004704) |
| 0.0 | 1.4 | GO:0005518 | collagen binding(GO:0005518) |
| 0.0 | 0.1 | GO:0046790 | virion binding(GO:0046790) |
Gene overrepresentation in curated gene sets: canonical pathways category:
| Log-likelihood per target | Total log-likelihood | Term | Description |
|---|---|---|---|
| 0.1 | 0.6 | SA CASPASE CASCADE | Apoptosis is mediated by caspases, cysteine proteases arranged in a proteolytic cascade. |
| 0.1 | 1.3 | PID TCR RAS PATHWAY | Ras signaling in the CD4+ TCR pathway |
| 0.1 | 4.6 | PID RXR VDR PATHWAY | RXR and RAR heterodimerization with other nuclear receptor |
| 0.1 | 6.3 | PID AR TF PATHWAY | Regulation of Androgen receptor activity |
| 0.1 | 2.3 | PID ANTHRAX PATHWAY | Cellular roles of Anthrax toxin |
| 0.1 | 0.9 | PID P38 GAMMA DELTA PATHWAY | Signaling mediated by p38-gamma and p38-delta |
| 0.0 | 1.2 | PID LPA4 PATHWAY | LPA4-mediated signaling events |
| 0.0 | 0.1 | PID THROMBIN PAR1 PATHWAY | PAR1-mediated thrombin signaling events |
| 0.0 | 2.6 | PID HEDGEHOG GLI PATHWAY | Hedgehog signaling events mediated by Gli proteins |
| 0.0 | 0.1 | PID AR NONGENOMIC PATHWAY | Nongenotropic Androgen signaling |
| 0.0 | 2.1 | PID ERA GENOMIC PATHWAY | Validated nuclear estrogen receptor alpha network |
| 0.0 | 1.0 | PID HIF1A PATHWAY | Hypoxic and oxygen homeostasis regulation of HIF-1-alpha |
| 0.0 | 2.0 | PID HES HEY PATHWAY | Notch-mediated HES/HEY network |
| 0.0 | 1.1 | PID HDAC CLASSIII PATHWAY | Signaling events mediated by HDAC Class III |
| 0.0 | 2.7 | PID LYSOPHOSPHOLIPID PATHWAY | LPA receptor mediated events |
| 0.0 | 3.7 | PID AR PATHWAY | Coregulation of Androgen receptor activity |
| 0.0 | 1.4 | PID EPHRINB REV PATHWAY | Ephrin B reverse signaling |
| 0.0 | 2.4 | PID RB 1PATHWAY | Regulation of retinoblastoma protein |
| 0.0 | 0.3 | PID ERBB2 ERBB3 PATHWAY | ErbB2/ErbB3 signaling events |
| 0.0 | 0.5 | PID S1P META PATHWAY | Sphingosine 1-phosphate (S1P) pathway |
| 0.0 | 0.9 | PID CONE PATHWAY | Visual signal transduction: Cones |
| 0.0 | 0.2 | PID HDAC CLASSII PATHWAY | Signaling events mediated by HDAC Class II |
| 0.0 | 0.9 | PID MYC PATHWAY | C-MYC pathway |
| 0.0 | 1.5 | PID HNF3A PATHWAY | FOXA1 transcription factor network |
| 0.0 | 1.1 | PID TCR CALCIUM PATHWAY | Calcium signaling in the CD4+ TCR pathway |
| 0.0 | 1.7 | PID REG GR PATHWAY | Glucocorticoid receptor regulatory network |
| 0.0 | 1.6 | PID LKB1 PATHWAY | LKB1 signaling events |
| 0.0 | 0.2 | PID IL2 PI3K PATHWAY | IL2 signaling events mediated by PI3K |
| 0.0 | 0.4 | PID MAPK TRK PATHWAY | Trk receptor signaling mediated by the MAPK pathway |
| 0.0 | 0.8 | PID FRA PATHWAY | Validated transcriptional targets of AP1 family members Fra1 and Fra2 |
| 0.0 | 0.6 | PID WNT SIGNALING PATHWAY | Wnt signaling network |
| 0.0 | 0.3 | PID P38 MK2 PATHWAY | p38 signaling mediated by MAPKAP kinases |
| 0.0 | 0.5 | PID INSULIN GLUCOSE PATHWAY | Insulin-mediated glucose transport |
| 0.0 | 0.8 | PID RAC1 PATHWAY | RAC1 signaling pathway |
| 0.0 | 0.3 | ST G ALPHA S PATHWAY | G alpha s Pathway |
| 0.0 | 0.3 | PID ALK2 PATHWAY | ALK2 signaling events |
| 0.0 | 0.4 | PID EPHA FWDPATHWAY | EPHA forward signaling |
| 0.0 | 0.7 | PID AURORA B PATHWAY | Aurora B signaling |
| 0.0 | 0.1 | PID P38 MKK3 6PATHWAY | p38 MAPK signaling pathway |
Gene overrepresentation in curated gene sets: REACTOME pathways category:
| Log-likelihood per target | Total log-likelihood | Term | Description |
|---|---|---|---|
| 0.1 | 1.8 | REACTOME PASSIVE TRANSPORT BY AQUAPORINS | Genes involved in Passive Transport by Aquaporins |
| 0.1 | 3.3 | REACTOME BRANCHED CHAIN AMINO ACID CATABOLISM | Genes involved in Branched-chain amino acid catabolism |
| 0.1 | 1.4 | REACTOME MRNA DECAY BY 3 TO 5 EXORIBONUCLEASE | Genes involved in mRNA Decay by 3' to 5' Exoribonuclease |
| 0.1 | 1.2 | REACTOME ETHANOL OXIDATION | Genes involved in Ethanol oxidation |
| 0.1 | 1.4 | REACTOME MITOCHONDRIAL FATTY ACID BETA OXIDATION | Genes involved in Mitochondrial Fatty Acid Beta-Oxidation |
| 0.1 | 1.2 | REACTOME NFKB IS ACTIVATED AND SIGNALS SURVIVAL | Genes involved in NF-kB is activated and signals survival |
| 0.1 | 1.1 | REACTOME UNWINDING OF DNA | Genes involved in Unwinding of DNA |
| 0.1 | 2.3 | REACTOME POST TRANSLATIONAL MODIFICATION SYNTHESIS OF GPI ANCHORED PROTEINS | Genes involved in Post-translational modification: synthesis of GPI-anchored proteins |
| 0.1 | 2.8 | REACTOME CGMP EFFECTS | Genes involved in cGMP effects |
| 0.1 | 1.3 | REACTOME ADVANCED GLYCOSYLATION ENDPRODUCT RECEPTOR SIGNALING | Genes involved in Advanced glycosylation endproduct receptor signaling |
| 0.1 | 2.3 | REACTOME SPHINGOLIPID DE NOVO BIOSYNTHESIS | Genes involved in Sphingolipid de novo biosynthesis |
| 0.1 | 5.1 | REACTOME RESPIRATORY ELECTRON TRANSPORT | Genes involved in Respiratory electron transport |
| 0.1 | 1.5 | REACTOME ACTIVATION OF THE AP1 FAMILY OF TRANSCRIPTION FACTORS | Genes involved in Activation of the AP-1 family of transcription factors |
| 0.1 | 1.0 | REACTOME TGF BETA RECEPTOR SIGNALING IN EMT EPITHELIAL TO MESENCHYMAL TRANSITION | Genes involved in TGF-beta receptor signaling in EMT (epithelial to mesenchymal transition) |
| 0.1 | 0.3 | REACTOME RNA POL I PROMOTER OPENING | Genes involved in RNA Polymerase I Promoter Opening |
| 0.1 | 3.7 | REACTOME MYOGENESIS | Genes involved in Myogenesis |
| 0.1 | 1.1 | REACTOME MITOCHONDRIAL TRNA AMINOACYLATION | Genes involved in Mitochondrial tRNA aminoacylation |
| 0.0 | 1.1 | REACTOME TRAF3 DEPENDENT IRF ACTIVATION PATHWAY | Genes involved in TRAF3-dependent IRF activation pathway |
| 0.0 | 6.3 | REACTOME PEPTIDE CHAIN ELONGATION | Genes involved in Peptide chain elongation |
| 0.0 | 0.9 | REACTOME CTNNB1 PHOSPHORYLATION CASCADE | Genes involved in Beta-catenin phosphorylation cascade |
| 0.0 | 0.4 | REACTOME RAF MAP KINASE CASCADE | Genes involved in RAF/MAP kinase cascade |
| 0.0 | 1.1 | REACTOME NUCLEOTIDE LIKE PURINERGIC RECEPTORS | Genes involved in Nucleotide-like (purinergic) receptors |
| 0.0 | 1.8 | REACTOME RECYCLING PATHWAY OF L1 | Genes involved in Recycling pathway of L1 |
| 0.0 | 1.2 | REACTOME GLUTAMATE NEUROTRANSMITTER RELEASE CYCLE | Genes involved in Glutamate Neurotransmitter Release Cycle |
| 0.0 | 4.8 | REACTOME CLASS B 2 SECRETIN FAMILY RECEPTORS | Genes involved in Class B/2 (Secretin family receptors) |
| 0.0 | 3.8 | REACTOME NUCLEAR RECEPTOR TRANSCRIPTION PATHWAY | Genes involved in Nuclear Receptor transcription pathway |
| 0.0 | 3.5 | REACTOME TRANSCRIPTIONAL REGULATION OF WHITE ADIPOCYTE DIFFERENTIATION | Genes involved in Transcriptional Regulation of White Adipocyte Differentiation |
| 0.0 | 0.5 | REACTOME TIE2 SIGNALING | Genes involved in Tie2 Signaling |
| 0.0 | 2.1 | REACTOME SPHINGOLIPID METABOLISM | Genes involved in Sphingolipid metabolism |
| 0.0 | 0.7 | REACTOME CS DS DEGRADATION | Genes involved in CS/DS degradation |
| 0.0 | 1.1 | REACTOME SYNTHESIS AND INTERCONVERSION OF NUCLEOTIDE DI AND TRIPHOSPHATES | Genes involved in Synthesis and interconversion of nucleotide di- and triphosphates |
| 0.0 | 0.9 | REACTOME METABOLISM OF PORPHYRINS | Genes involved in Metabolism of porphyrins |
| 0.0 | 3.2 | REACTOME RECRUITMENT OF MITOTIC CENTROSOME PROTEINS AND COMPLEXES | Genes involved in Recruitment of mitotic centrosome proteins and complexes |
| 0.0 | 0.7 | REACTOME SYNTHESIS OF PA | Genes involved in Synthesis of PA |
| 0.0 | 0.5 | REACTOME VITAMIN B5 PANTOTHENATE METABOLISM | Genes involved in Vitamin B5 (pantothenate) metabolism |
| 0.0 | 0.7 | REACTOME REGULATION OF INSULIN LIKE GROWTH FACTOR IGF ACTIVITY BY INSULIN LIKE GROWTH FACTOR BINDING PROTEINS IGFBPS | Genes involved in Regulation of Insulin-like Growth Factor (IGF) Activity by Insulin-like Growth Factor Binding Proteins (IGFBPs) |
| 0.0 | 0.1 | REACTOME DOPAMINE NEUROTRANSMITTER RELEASE CYCLE | Genes involved in Dopamine Neurotransmitter Release Cycle |
| 0.0 | 0.4 | REACTOME REMOVAL OF THE FLAP INTERMEDIATE FROM THE C STRAND | Genes involved in Removal of the Flap Intermediate from the C-strand |
| 0.0 | 0.3 | REACTOME CALNEXIN CALRETICULIN CYCLE | Genes involved in Calnexin/calreticulin cycle |
| 0.0 | 0.7 | REACTOME GLYCOGEN BREAKDOWN GLYCOGENOLYSIS | Genes involved in Glycogen breakdown (glycogenolysis) |
| 0.0 | 0.3 | REACTOME GPCR DOWNSTREAM SIGNALING | Genes involved in GPCR downstream signaling |
| 0.0 | 0.9 | REACTOME FORMATION OF FIBRIN CLOT CLOTTING CASCADE | Genes involved in Formation of Fibrin Clot (Clotting Cascade) |
| 0.0 | 0.7 | REACTOME SULFUR AMINO ACID METABOLISM | Genes involved in Sulfur amino acid metabolism |
| 0.0 | 0.3 | REACTOME ACYL CHAIN REMODELLING OF PS | Genes involved in Acyl chain remodelling of PS |
| 0.0 | 0.1 | REACTOME IRAK2 MEDIATED ACTIVATION OF TAK1 COMPLEX UPON TLR7 8 OR 9 STIMULATION | Genes involved in IRAK2 mediated activation of TAK1 complex upon TLR7/8 or 9 stimulation |
| 0.0 | 0.6 | REACTOME KINESINS | Genes involved in Kinesins |
| 0.0 | 0.3 | REACTOME TRAF6 MEDIATED IRF7 ACTIVATION | Genes involved in TRAF6 mediated IRF7 activation |
| 0.0 | 0.1 | REACTOME ACYL CHAIN REMODELLING OF PE | Genes involved in Acyl chain remodelling of PE |
| 0.0 | 0.9 | REACTOME MEIOTIC SYNAPSIS | Genes involved in Meiotic Synapsis |
| 0.0 | 0.5 | REACTOME CONVERSION FROM APC C CDC20 TO APC C CDH1 IN LATE ANAPHASE | Genes involved in Conversion from APC/C:Cdc20 to APC/C:Cdh1 in late anaphase |
| 0.0 | 0.4 | REACTOME FANCONI ANEMIA PATHWAY | Genes involved in Fanconi Anemia pathway |
| 0.0 | 0.6 | REACTOME FATTY ACYL COA BIOSYNTHESIS | Genes involved in Fatty Acyl-CoA Biosynthesis |
| 0.0 | 0.1 | REACTOME BINDING AND ENTRY OF HIV VIRION | Genes involved in Binding and entry of HIV virion |
| 0.0 | 0.4 | REACTOME REGULATION OF HYPOXIA INDUCIBLE FACTOR HIF BY OXYGEN | Genes involved in Regulation of Hypoxia-inducible Factor (HIF) by Oxygen |
| 0.0 | 0.5 | REACTOME ACTIVATED AMPK STIMULATES FATTY ACID OXIDATION IN MUSCLE | Genes involved in Activated AMPK stimulates fatty-acid oxidation in muscle |
| 0.0 | 1.5 | REACTOME FACTORS INVOLVED IN MEGAKARYOCYTE DEVELOPMENT AND PLATELET PRODUCTION | Genes involved in Factors involved in megakaryocyte development and platelet production |
| 0.0 | 0.2 | REACTOME TRAFFICKING OF GLUR2 CONTAINING AMPA RECEPTORS | Genes involved in Trafficking of GluR2-containing AMPA receptors |
| 0.0 | 0.3 | REACTOME CTLA4 INHIBITORY SIGNALING | Genes involved in CTLA4 inhibitory signaling |
| 0.0 | 0.4 | REACTOME DEGRADATION OF THE EXTRACELLULAR MATRIX | Genes involved in Degradation of the extracellular matrix |
| 0.0 | 0.3 | REACTOME PTM GAMMA CARBOXYLATION HYPUSINE FORMATION AND ARYLSULFATASE ACTIVATION | Genes involved in PTM: gamma carboxylation, hypusine formation and arylsulfatase activation |
| 0.0 | 0.2 | REACTOME ALPHA LINOLENIC ACID ALA METABOLISM | Genes involved in alpha-linolenic acid (ALA) metabolism |
| 0.0 | 1.2 | REACTOME PHASE II CONJUGATION | Genes involved in Phase II conjugation |
| 0.0 | 0.5 | REACTOME PYRIMIDINE METABOLISM | Genes involved in Pyrimidine metabolism |
| 0.0 | 1.0 | REACTOME INTERFERON ALPHA BETA SIGNALING | Genes involved in Interferon alpha/beta signaling |
| 0.0 | 0.1 | REACTOME REGULATED PROTEOLYSIS OF P75NTR | Genes involved in Regulated proteolysis of p75NTR |
| 0.0 | 0.6 | REACTOME SIGNALING BY ROBO RECEPTOR | Genes involved in Signaling by Robo receptor |
| 0.0 | 0.1 | REACTOME TRAFFICKING OF AMPA RECEPTORS | Genes involved in Trafficking of AMPA receptors |
| 0.0 | 0.3 | REACTOME ABORTIVE ELONGATION OF HIV1 TRANSCRIPT IN THE ABSENCE OF TAT | Genes involved in Abortive elongation of HIV-1 transcript in the absence of Tat |
| 0.0 | 0.3 | REACTOME SIGNALING BY BMP | Genes involved in Signaling by BMP |
| 0.0 | 0.2 | REACTOME REGULATION OF PYRUVATE DEHYDROGENASE PDH COMPLEX | Genes involved in Regulation of pyruvate dehydrogenase (PDH) complex |