Project
Inflammatory response time course, HUVEC (Wada, 2009)
Navigation
Downloads
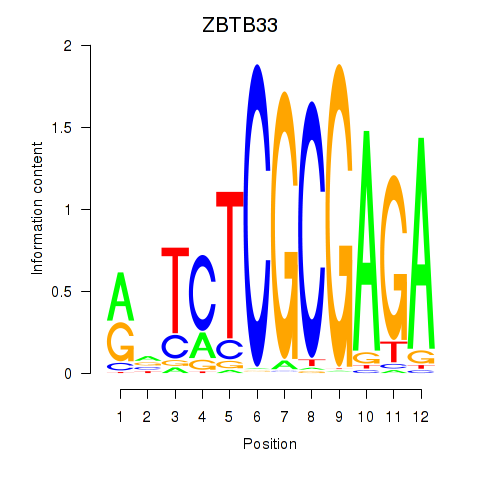
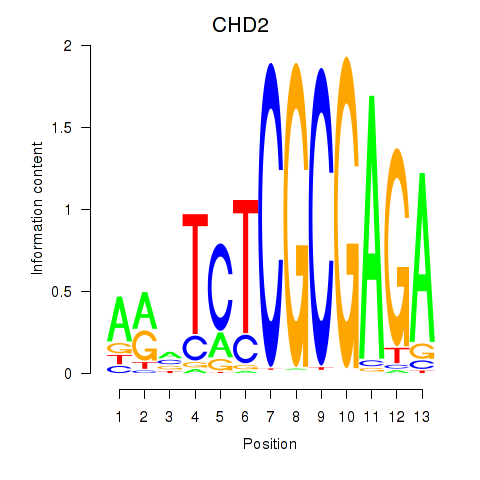
Results for ZBTB33_CHD2
Z-value: 1.13
Motif logo
Transcription factors associated with ZBTB33_CHD2
| Gene Symbol | Gene ID | Gene Info |
|---|---|---|
|
ZBTB33
|
ENSG00000177485.7 | ZBTB33 |
|
CHD2
|
ENSG00000173575.22 | CHD2 |
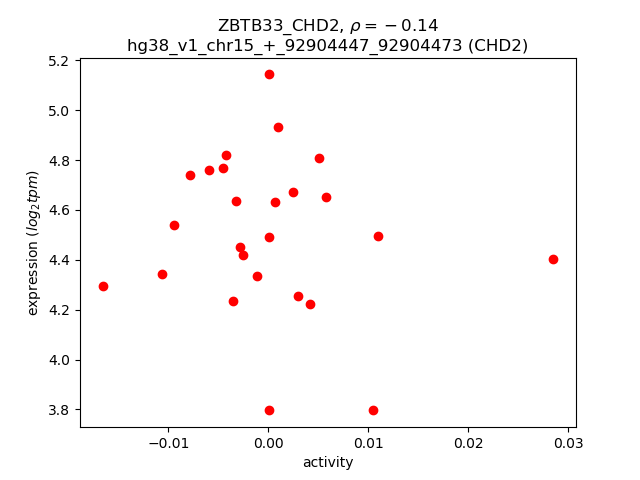
Activity-expression correlation:
| Gene | Promoter | Pearson corr. coef. | P-value | Plot |
|---|---|---|---|---|
| ZBTB33 | hg38_v1_chrX_+_120250752_120250866 | 0.23 | 2.7e-01 | Click! |
| CHD2 | hg38_v1_chr15_+_92904447_92904473 | -0.14 | 5.1e-01 | Click! |
Activity profile of ZBTB33_CHD2 motif
Sorted Z-values of ZBTB33_CHD2 motif
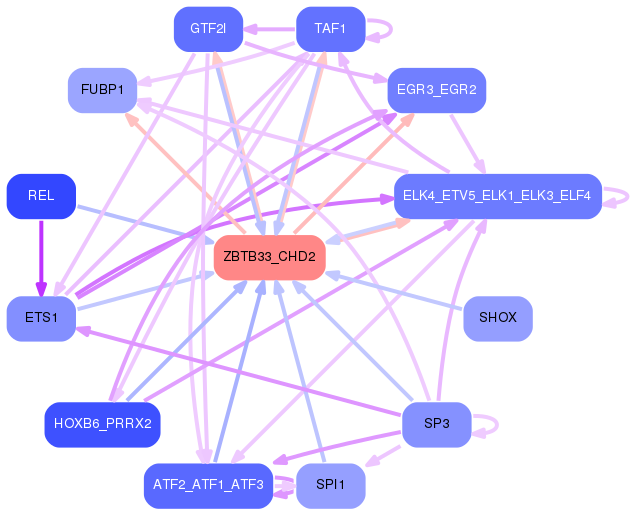
Network of associatons between targets according to the STRING database.

First level regulatory network of ZBTB33_CHD2
Gene Ontology Analysis
Gene overrepresentation in biological process category:
| Log-likelihood per target | Total log-likelihood | Term | Description |
|---|---|---|---|
| 0.5 | 1.4 | GO:0021658 | rhombomere morphogenesis(GO:0021593) rhombomere 3 morphogenesis(GO:0021658) |
| 0.4 | 1.9 | GO:0043504 | mitochondrial DNA repair(GO:0043504) |
| 0.4 | 2.2 | GO:0014835 | myoblast differentiation involved in skeletal muscle regeneration(GO:0014835) positive regulation of interleukin-12 secretion(GO:2001184) |
| 0.3 | 1.0 | GO:1902363 | regulation of spindle elongation(GO:0032887) regulation of mitotic spindle elongation(GO:0032888) anastral spindle assembly(GO:0055048) protein localization to spindle pole body(GO:0071988) regulation of protein localization to spindle pole body(GO:1902363) positive regulation of protein localization to spindle pole body(GO:1902365) positive regulation of mitotic spindle elongation(GO:1902846) |
| 0.3 | 2.3 | GO:1903300 | negative regulation of glucokinase activity(GO:0033132) negative regulation of hexokinase activity(GO:1903300) |
| 0.3 | 1.2 | GO:0007181 | transforming growth factor beta receptor complex assembly(GO:0007181) |
| 0.3 | 1.3 | GO:0080154 | regulation of fertilization(GO:0080154) |
| 0.3 | 0.8 | GO:0014016 | neuroblast differentiation(GO:0014016) |
| 0.3 | 0.8 | GO:0051695 | actin filament uncapping(GO:0051695) |
| 0.2 | 0.7 | GO:0060266 | negative regulation of respiratory burst involved in inflammatory response(GO:0060266) |
| 0.2 | 2.2 | GO:0035507 | regulation of myosin-light-chain-phosphatase activity(GO:0035507) |
| 0.2 | 0.9 | GO:1901895 | negative regulation of calcium-transporting ATPase activity(GO:1901895) |
| 0.2 | 0.9 | GO:0071596 | ubiquitin-dependent protein catabolic process via the N-end rule pathway(GO:0071596) |
| 0.2 | 0.7 | GO:1904956 | regulation of midbrain dopaminergic neuron differentiation(GO:1904956) |
| 0.2 | 0.6 | GO:0002023 | reduction of food intake in response to dietary excess(GO:0002023) |
| 0.2 | 0.8 | GO:0051562 | negative regulation of mitochondrial calcium ion concentration(GO:0051562) |
| 0.2 | 0.7 | GO:0002188 | translation reinitiation(GO:0002188) |
| 0.2 | 0.5 | GO:0036451 | cap mRNA methylation(GO:0036451) |
| 0.2 | 0.3 | GO:1901979 | regulation of inward rectifier potassium channel activity(GO:1901979) |
| 0.2 | 0.5 | GO:0061698 | protein demalonylation(GO:0036046) peptidyl-lysine demalonylation(GO:0036047) protein desuccinylation(GO:0036048) peptidyl-lysine desuccinylation(GO:0036049) protein deglutarylation(GO:0061698) peptidyl-lysine deglutarylation(GO:0061699) |
| 0.2 | 0.5 | GO:1902683 | regulation of receptor localization to synapse(GO:1902683) |
| 0.2 | 0.5 | GO:0070682 | proteasome regulatory particle assembly(GO:0070682) |
| 0.1 | 0.3 | GO:0035721 | intraciliary retrograde transport(GO:0035721) |
| 0.1 | 0.4 | GO:2000646 | positive regulation of receptor catabolic process(GO:2000646) |
| 0.1 | 0.6 | GO:0006669 | sphinganine-1-phosphate biosynthetic process(GO:0006669) |
| 0.1 | 0.8 | GO:0010032 | meiotic chromosome condensation(GO:0010032) |
| 0.1 | 0.9 | GO:0031860 | telomeric 3' overhang formation(GO:0031860) |
| 0.1 | 0.4 | GO:0036292 | DNA rewinding(GO:0036292) |
| 0.1 | 0.7 | GO:0048388 | endosomal lumen acidification(GO:0048388) |
| 0.1 | 0.4 | GO:0021986 | epithalamus development(GO:0021538) habenula development(GO:0021986) |
| 0.1 | 0.4 | GO:0097187 | dentinogenesis(GO:0097187) |
| 0.1 | 0.5 | GO:0006272 | leading strand elongation(GO:0006272) |
| 0.1 | 0.4 | GO:0038098 | sequestering of BMP from receptor via BMP binding(GO:0038098) |
| 0.1 | 0.4 | GO:0042335 | cuticle development(GO:0042335) |
| 0.1 | 0.5 | GO:0061760 | antifungal innate immune response(GO:0061760) |
| 0.1 | 0.4 | GO:0031161 | phosphatidylinositol catabolic process(GO:0031161) |
| 0.1 | 0.3 | GO:0031393 | negative regulation of prostaglandin biosynthetic process(GO:0031393) |
| 0.1 | 3.2 | GO:0070886 | positive regulation of calcineurin-NFAT signaling cascade(GO:0070886) |
| 0.1 | 0.5 | GO:0042264 | peptidyl-aspartic acid hydroxylation(GO:0042264) |
| 0.1 | 0.6 | GO:0051012 | microtubule sliding(GO:0051012) |
| 0.1 | 0.2 | GO:0018312 | peptidyl-serine ADP-ribosylation(GO:0018312) |
| 0.1 | 0.4 | GO:1990637 | response to prolactin(GO:1990637) |
| 0.1 | 0.4 | GO:0036369 | transcription factor catabolic process(GO:0036369) |
| 0.1 | 0.7 | GO:0051418 | interphase microtubule nucleation by interphase microtubule organizing center(GO:0051415) microtubule nucleation by microtubule organizing center(GO:0051418) |
| 0.1 | 0.4 | GO:0044565 | dendritic cell proliferation(GO:0044565) |
| 0.1 | 0.4 | GO:0033484 | nitric oxide homeostasis(GO:0033484) |
| 0.1 | 1.8 | GO:0061470 | T follicular helper cell differentiation(GO:0061470) |
| 0.1 | 0.5 | GO:0030950 | establishment or maintenance of actin cytoskeleton polarity(GO:0030950) |
| 0.1 | 0.6 | GO:0042078 | germ-line stem cell division(GO:0042078) male germ-line stem cell asymmetric division(GO:0048133) germline stem cell asymmetric division(GO:0098728) |
| 0.1 | 0.2 | GO:2000174 | regulation of pro-T cell differentiation(GO:2000174) positive regulation of pro-T cell differentiation(GO:2000176) |
| 0.1 | 0.2 | GO:0002101 | tRNA wobble cytosine modification(GO:0002101) |
| 0.1 | 0.3 | GO:0031627 | telomeric loop formation(GO:0031627) regulation of telomere maintenance via semi-conservative replication(GO:0032213) negative regulation of telomere maintenance via semi-conservative replication(GO:0032214) establishment of RNA localization to telomere(GO:0097694) establishment of macromolecular complex localization to telomere(GO:0097695) |
| 0.1 | 0.4 | GO:0018343 | protein farnesylation(GO:0018343) |
| 0.1 | 0.2 | GO:0034758 | antigen processing and presentation of peptide antigen via MHC class Ib(GO:0002428) positive regulation of iron ion transport(GO:0034758) positive regulation of iron ion transmembrane transport(GO:0034761) cellular response to iron(III) ion(GO:0071283) regulation of iron ion import(GO:1900390) regulation of ferrous iron import into cell(GO:1903989) positive regulation of ferrous iron import into cell(GO:1903991) regulation of ferrous iron binding(GO:1904432) positive regulation of ferrous iron binding(GO:1904434) regulation of transferrin receptor binding(GO:1904435) positive regulation of transferrin receptor binding(GO:1904437) regulation of ferrous iron import across plasma membrane(GO:1904438) positive regulation of ferrous iron import across plasma membrane(GO:1904440) |
| 0.1 | 0.8 | GO:2000042 | negative regulation of double-strand break repair via homologous recombination(GO:2000042) |
| 0.1 | 0.4 | GO:0071460 | cellular response to cell-matrix adhesion(GO:0071460) |
| 0.1 | 1.1 | GO:0045722 | positive regulation of gluconeogenesis(GO:0045722) |
| 0.1 | 1.0 | GO:0043374 | CD8-positive, alpha-beta T cell differentiation(GO:0043374) |
| 0.1 | 0.5 | GO:0016584 | nucleosome positioning(GO:0016584) |
| 0.1 | 3.8 | GO:0035735 | intraciliary transport involved in cilium morphogenesis(GO:0035735) |
| 0.1 | 0.3 | GO:0019626 | short-chain fatty acid catabolic process(GO:0019626) |
| 0.1 | 1.1 | GO:0070072 | proton-transporting V-type ATPase complex assembly(GO:0070070) vacuolar proton-transporting V-type ATPase complex assembly(GO:0070072) |
| 0.1 | 0.7 | GO:0001955 | blood vessel maturation(GO:0001955) |
| 0.1 | 0.7 | GO:2000288 | positive regulation of myoblast proliferation(GO:2000288) |
| 0.1 | 0.9 | GO:0060287 | epithelial cilium movement involved in determination of left/right asymmetry(GO:0060287) |
| 0.1 | 2.6 | GO:0010738 | regulation of protein kinase A signaling(GO:0010738) |
| 0.1 | 0.2 | GO:1903070 | negative regulation of ER-associated ubiquitin-dependent protein catabolic process(GO:1903070) |
| 0.1 | 1.0 | GO:0051256 | mitotic spindle midzone assembly(GO:0051256) |
| 0.1 | 0.3 | GO:0015853 | adenine transport(GO:0015853) |
| 0.1 | 0.6 | GO:0007076 | mitotic chromosome condensation(GO:0007076) |
| 0.1 | 0.2 | GO:0060931 | sinoatrial node cell development(GO:0060931) |
| 0.1 | 0.2 | GO:0021965 | spinal cord ventral commissure morphogenesis(GO:0021965) |
| 0.1 | 0.2 | GO:0006393 | termination of mitochondrial transcription(GO:0006393) |
| 0.1 | 0.3 | GO:0006850 | mitochondrial pyruvate transport(GO:0006850) mitochondrial pyruvate transmembrane transport(GO:1902361) |
| 0.1 | 0.2 | GO:1990180 | mitochondrial tRNA 3'-end processing(GO:1990180) |
| 0.1 | 0.6 | GO:0010499 | proteasomal ubiquitin-independent protein catabolic process(GO:0010499) |
| 0.1 | 0.2 | GO:1903778 | protein localization to vacuolar membrane(GO:1903778) |
| 0.1 | 0.1 | GO:0070318 | positive regulation of G0 to G1 transition(GO:0070318) |
| 0.0 | 0.2 | GO:1901097 | negative regulation of autophagosome maturation(GO:1901097) |
| 0.0 | 0.2 | GO:0071163 | DNA replication preinitiation complex assembly(GO:0071163) |
| 0.0 | 0.3 | GO:0033133 | positive regulation of glucokinase activity(GO:0033133) |
| 0.0 | 0.2 | GO:1902162 | regulation of DNA damage response, signal transduction by p53 class mediator resulting in transcription of p21 class mediator(GO:1902162) positive regulation of DNA damage response, signal transduction by p53 class mediator resulting in transcription of p21 class mediator(GO:1902164) |
| 0.0 | 0.3 | GO:1900264 | regulation of DNA-directed DNA polymerase activity(GO:1900262) positive regulation of DNA-directed DNA polymerase activity(GO:1900264) |
| 0.0 | 0.3 | GO:0042780 | tRNA 3'-end processing(GO:0042780) |
| 0.0 | 0.4 | GO:2000483 | negative regulation of interleukin-8 secretion(GO:2000483) |
| 0.0 | 0.5 | GO:0046654 | tetrahydrofolate biosynthetic process(GO:0046654) |
| 0.0 | 0.4 | GO:0036123 | histone H3-K9 dimethylation(GO:0036123) |
| 0.0 | 0.2 | GO:1904045 | cellular response to aldosterone(GO:1904045) |
| 0.0 | 0.6 | GO:0051315 | attachment of mitotic spindle microtubules to kinetochore(GO:0051315) |
| 0.0 | 0.4 | GO:0006621 | protein retention in ER lumen(GO:0006621) |
| 0.0 | 0.6 | GO:0006600 | creatine metabolic process(GO:0006600) |
| 0.0 | 0.1 | GO:0015917 | aminophospholipid transport(GO:0015917) |
| 0.0 | 0.3 | GO:0000389 | mRNA 3'-splice site recognition(GO:0000389) |
| 0.0 | 1.2 | GO:0006907 | pinocytosis(GO:0006907) |
| 0.0 | 0.8 | GO:0044342 | type B pancreatic cell proliferation(GO:0044342) |
| 0.0 | 0.1 | GO:0007079 | mitotic chromosome movement towards spindle pole(GO:0007079) |
| 0.0 | 0.2 | GO:0046504 | ether lipid biosynthetic process(GO:0008611) glycerol ether biosynthetic process(GO:0046504) ether biosynthetic process(GO:1901503) |
| 0.0 | 1.4 | GO:0005980 | glycogen catabolic process(GO:0005980) |
| 0.0 | 0.9 | GO:0006744 | ubiquinone biosynthetic process(GO:0006744) quinone biosynthetic process(GO:1901663) |
| 0.0 | 0.1 | GO:0051877 | pigment granule aggregation in cell center(GO:0051877) |
| 0.0 | 0.2 | GO:0061091 | regulation of phospholipid translocation(GO:0061091) positive regulation of phospholipid translocation(GO:0061092) |
| 0.0 | 0.3 | GO:0070236 | negative regulation of activation-induced cell death of T cells(GO:0070236) |
| 0.0 | 0.1 | GO:1903722 | regulation of centriole elongation(GO:1903722) |
| 0.0 | 0.3 | GO:0090308 | regulation of methylation-dependent chromatin silencing(GO:0090308) |
| 0.0 | 0.1 | GO:1900220 | semaphorin-plexin signaling pathway involved in bone trabecula morphogenesis(GO:1900220) |
| 0.0 | 0.1 | GO:0071494 | cellular response to UV-C(GO:0071494) |
| 0.0 | 0.4 | GO:0015693 | magnesium ion transport(GO:0015693) |
| 0.0 | 0.3 | GO:0034350 | regulation of glial cell apoptotic process(GO:0034350) negative regulation of glial cell apoptotic process(GO:0034351) |
| 0.0 | 0.2 | GO:0007198 | adenylate cyclase-inhibiting serotonin receptor signaling pathway(GO:0007198) |
| 0.0 | 0.4 | GO:0021796 | cerebral cortex regionalization(GO:0021796) |
| 0.0 | 0.7 | GO:0016254 | preassembly of GPI anchor in ER membrane(GO:0016254) |
| 0.0 | 0.3 | GO:0042532 | negative regulation of tyrosine phosphorylation of STAT protein(GO:0042532) |
| 0.0 | 0.1 | GO:2000255 | negative regulation of male germ cell proliferation(GO:2000255) |
| 0.0 | 0.3 | GO:0032049 | cardiolipin biosynthetic process(GO:0032049) |
| 0.0 | 0.6 | GO:1904714 | regulation of chaperone-mediated autophagy(GO:1904714) |
| 0.0 | 0.2 | GO:0001661 | conditioned taste aversion(GO:0001661) |
| 0.0 | 0.4 | GO:0021869 | forebrain ventricular zone progenitor cell division(GO:0021869) |
| 0.0 | 0.7 | GO:0070987 | error-free translesion synthesis(GO:0070987) |
| 0.0 | 0.1 | GO:0010607 | negative regulation of cytoplasmic mRNA processing body assembly(GO:0010607) |
| 0.0 | 0.2 | GO:1903433 | regulation of constitutive secretory pathway(GO:1903433) |
| 0.0 | 2.3 | GO:0045652 | regulation of megakaryocyte differentiation(GO:0045652) |
| 0.0 | 0.1 | GO:0070966 | nuclear-transcribed mRNA catabolic process, no-go decay(GO:0070966) |
| 0.0 | 0.1 | GO:1902626 | assembly of large subunit precursor of preribosome(GO:1902626) |
| 0.0 | 0.1 | GO:0010286 | heat acclimation(GO:0010286) cellular heat acclimation(GO:0070370) |
| 0.0 | 0.1 | GO:0030047 | actin modification(GO:0030047) |
| 0.0 | 0.8 | GO:0006517 | protein deglycosylation(GO:0006517) |
| 0.0 | 0.8 | GO:0000132 | establishment of mitotic spindle orientation(GO:0000132) |
| 0.0 | 0.1 | GO:2000813 | negative regulation of barbed-end actin filament capping(GO:2000813) |
| 0.0 | 0.3 | GO:0044829 | positive regulation by host of viral genome replication(GO:0044829) |
| 0.0 | 0.2 | GO:1905066 | regulation of canonical Wnt signaling pathway involved in cardiac muscle cell fate commitment(GO:1901295) regulation of canonical Wnt signaling pathway involved in heart development(GO:1905066) |
| 0.0 | 0.1 | GO:0019918 | peptidyl-arginine methylation, to symmetrical-dimethyl arginine(GO:0019918) |
| 0.0 | 0.2 | GO:0060011 | Sertoli cell proliferation(GO:0060011) |
| 0.0 | 0.3 | GO:0042670 | retinal cone cell differentiation(GO:0042670) retinal cone cell development(GO:0046549) |
| 0.0 | 0.5 | GO:0019371 | cyclooxygenase pathway(GO:0019371) |
| 0.0 | 3.1 | GO:0072332 | intrinsic apoptotic signaling pathway by p53 class mediator(GO:0072332) |
| 0.0 | 0.1 | GO:1901069 | guanosine-containing compound catabolic process(GO:1901069) |
| 0.0 | 0.3 | GO:0006268 | DNA unwinding involved in DNA replication(GO:0006268) |
| 0.0 | 0.4 | GO:0060340 | positive regulation of type I interferon-mediated signaling pathway(GO:0060340) |
| 0.0 | 0.0 | GO:0071072 | negative regulation of phospholipid biosynthetic process(GO:0071072) |
| 0.0 | 1.4 | GO:0000413 | protein peptidyl-prolyl isomerization(GO:0000413) |
| 0.0 | 0.4 | GO:0030208 | dermatan sulfate biosynthetic process(GO:0030208) |
| 0.0 | 0.1 | GO:1902659 | regulation of glucose mediated signaling pathway(GO:1902659) |
| 0.0 | 0.2 | GO:1902741 | interferon-alpha secretion(GO:0072642) regulation of interferon-alpha secretion(GO:1902739) positive regulation of interferon-alpha secretion(GO:1902741) |
| 0.0 | 0.5 | GO:0006337 | nucleosome disassembly(GO:0006337) |
| 0.0 | 0.1 | GO:0045204 | MAPK export from nucleus(GO:0045204) |
| 0.0 | 0.1 | GO:0016240 | autophagosome docking(GO:0016240) |
| 0.0 | 0.2 | GO:0010606 | positive regulation of cytoplasmic mRNA processing body assembly(GO:0010606) |
| 0.0 | 2.4 | GO:0006334 | nucleosome assembly(GO:0006334) |
| 0.0 | 0.2 | GO:0001833 | inner cell mass cell proliferation(GO:0001833) |
| 0.0 | 0.1 | GO:0006620 | posttranslational protein targeting to membrane(GO:0006620) |
| 0.0 | 0.3 | GO:0006048 | UDP-N-acetylglucosamine biosynthetic process(GO:0006048) |
| 0.0 | 0.3 | GO:0043248 | proteasome assembly(GO:0043248) |
| 0.0 | 1.4 | GO:0000266 | mitochondrial fission(GO:0000266) |
| 0.0 | 0.2 | GO:0006528 | asparagine metabolic process(GO:0006528) |
| 0.0 | 0.1 | GO:0032070 | regulation of deoxyribonuclease activity(GO:0032070) |
| 0.0 | 0.1 | GO:0014886 | transition between slow and fast fiber(GO:0014886) |
| 0.0 | 0.2 | GO:0036158 | outer dynein arm assembly(GO:0036158) |
| 0.0 | 0.6 | GO:0008210 | estrogen metabolic process(GO:0008210) |
| 0.0 | 0.0 | GO:0034729 | histone H3-K79 methylation(GO:0034729) |
| 0.0 | 1.4 | GO:0031110 | regulation of microtubule polymerization or depolymerization(GO:0031110) |
| 0.0 | 0.0 | GO:2000291 | regulation of myoblast proliferation(GO:2000291) |
| 0.0 | 0.1 | GO:0045541 | negative regulation of cholesterol biosynthetic process(GO:0045541) negative regulation of cholesterol metabolic process(GO:0090206) |
| 0.0 | 0.1 | GO:0072156 | distal tubule morphogenesis(GO:0072156) |
| 0.0 | 0.3 | GO:0097264 | self proteolysis(GO:0097264) |
| 0.0 | 0.1 | GO:0015015 | heparan sulfate proteoglycan biosynthetic process, enzymatic modification(GO:0015015) |
| 0.0 | 0.1 | GO:0019509 | L-methionine biosynthetic process from methylthioadenosine(GO:0019509) |
| 0.0 | 0.3 | GO:0030213 | hyaluronan biosynthetic process(GO:0030213) |
| 0.0 | 0.1 | GO:0007000 | nucleolus organization(GO:0007000) |
| 0.0 | 0.1 | GO:2000535 | regulation of entry of bacterium into host cell(GO:2000535) |
| 0.0 | 0.1 | GO:0033504 | floor plate development(GO:0033504) |
| 0.0 | 0.1 | GO:0036159 | inner dynein arm assembly(GO:0036159) |
| 0.0 | 0.1 | GO:0030242 | pexophagy(GO:0030242) |
| 0.0 | 0.1 | GO:0007161 | calcium-independent cell-matrix adhesion(GO:0007161) |
| 0.0 | 0.1 | GO:0090267 | positive regulation of mitotic cell cycle spindle assembly checkpoint(GO:0090267) |
| 0.0 | 0.3 | GO:1902230 | negative regulation of intrinsic apoptotic signaling pathway in response to DNA damage(GO:1902230) |
| 0.0 | 0.1 | GO:0010265 | SCF complex assembly(GO:0010265) |
| 0.0 | 0.9 | GO:0060416 | response to growth hormone(GO:0060416) |
| 0.0 | 0.1 | GO:0033615 | mitochondrial proton-transporting ATP synthase complex assembly(GO:0033615) |
| 0.0 | 0.3 | GO:0051131 | chaperone-mediated protein complex assembly(GO:0051131) |
| 0.0 | 0.1 | GO:0098582 | innate vocalization behavior(GO:0098582) positive regulation of histone H4-K16 acetylation(GO:2000620) |
| 0.0 | 0.2 | GO:1901750 | leukotriene D4 metabolic process(GO:1901748) leukotriene D4 biosynthetic process(GO:1901750) |
| 0.0 | 0.2 | GO:0071313 | cellular response to caffeine(GO:0071313) |
| 0.0 | 0.1 | GO:0035095 | behavioral response to nicotine(GO:0035095) |
| 0.0 | 0.3 | GO:0009650 | UV protection(GO:0009650) |
| 0.0 | 0.2 | GO:2001014 | regulation of skeletal muscle cell differentiation(GO:2001014) |
| 0.0 | 0.1 | GO:0010796 | regulation of multivesicular body size(GO:0010796) |
| 0.0 | 0.3 | GO:0006123 | mitochondrial electron transport, cytochrome c to oxygen(GO:0006123) |
| 0.0 | 0.2 | GO:0016024 | CDP-diacylglycerol biosynthetic process(GO:0016024) |
| 0.0 | 0.4 | GO:0006308 | DNA catabolic process(GO:0006308) |
| 0.0 | 0.1 | GO:0006398 | mRNA 3'-end processing by stem-loop binding and cleavage(GO:0006398) |
| 0.0 | 0.3 | GO:0060236 | regulation of mitotic spindle organization(GO:0060236) |
| 0.0 | 0.1 | GO:1903677 | regulation of cap-independent translational initiation(GO:1903677) positive regulation of cap-independent translational initiation(GO:1903679) regulation of cytoplasmic translational initiation(GO:1904688) positive regulation of cytoplasmic translational initiation(GO:1904690) |
| 0.0 | 0.7 | GO:0061001 | regulation of dendritic spine morphogenesis(GO:0061001) |
| 0.0 | 0.2 | GO:0034587 | piRNA metabolic process(GO:0034587) |
| 0.0 | 0.1 | GO:0015074 | DNA integration(GO:0015074) |
| 0.0 | 0.0 | GO:0019521 | aldonic acid metabolic process(GO:0019520) D-gluconate metabolic process(GO:0019521) |
Gene overrepresentation in cellular component category:
| Log-likelihood per target | Total log-likelihood | Term | Description |
|---|---|---|---|
| 0.4 | 1.3 | GO:0070685 | macropinocytic cup(GO:0070685) |
| 0.3 | 1.0 | GO:0055028 | cortical microtubule(GO:0055028) |
| 0.3 | 1.1 | GO:0030289 | protein phosphatase 4 complex(GO:0030289) |
| 0.3 | 2.0 | GO:0000796 | condensin complex(GO:0000796) |
| 0.2 | 1.3 | GO:0034673 | inhibin-betaglycan-ActRII complex(GO:0034673) |
| 0.2 | 1.1 | GO:0043291 | RAVE complex(GO:0043291) |
| 0.2 | 2.2 | GO:0072357 | PTW/PP1 phosphatase complex(GO:0072357) |
| 0.2 | 2.6 | GO:0044666 | MLL3/4 complex(GO:0044666) |
| 0.2 | 0.6 | GO:1990716 | axonemal central apparatus(GO:1990716) |
| 0.2 | 2.5 | GO:0000940 | condensed chromosome outer kinetochore(GO:0000940) |
| 0.1 | 0.8 | GO:1990393 | 3M complex(GO:1990393) |
| 0.1 | 1.4 | GO:0098554 | cytoplasmic side of endoplasmic reticulum membrane(GO:0098554) |
| 0.1 | 0.7 | GO:1990246 | uniplex complex(GO:1990246) |
| 0.1 | 0.7 | GO:0031417 | NatC complex(GO:0031417) |
| 0.1 | 3.8 | GO:0030992 | intraciliary transport particle B(GO:0030992) |
| 0.1 | 2.7 | GO:0000786 | nucleosome(GO:0000786) |
| 0.1 | 0.4 | GO:0005965 | protein farnesyltransferase complex(GO:0005965) |
| 0.1 | 0.7 | GO:0000923 | equatorial microtubule organizing center(GO:0000923) |
| 0.1 | 1.7 | GO:0005641 | nuclear envelope lumen(GO:0005641) |
| 0.1 | 0.2 | GO:0070195 | growth hormone receptor complex(GO:0070195) |
| 0.1 | 0.5 | GO:0090571 | RNA polymerase II transcription repressor complex(GO:0090571) |
| 0.1 | 0.6 | GO:0000836 | ER ubiquitin ligase complex(GO:0000835) Hrd1p ubiquitin ligase complex(GO:0000836) |
| 0.1 | 0.5 | GO:0008622 | epsilon DNA polymerase complex(GO:0008622) |
| 0.1 | 1.6 | GO:0005671 | Ada2/Gcn5/Ada3 transcription activator complex(GO:0005671) |
| 0.1 | 1.0 | GO:1990023 | mitotic spindle midzone(GO:1990023) |
| 0.1 | 0.9 | GO:0030870 | Mre11 complex(GO:0030870) |
| 0.1 | 0.5 | GO:0000778 | condensed nuclear chromosome kinetochore(GO:0000778) |
| 0.1 | 0.5 | GO:0016589 | NURF complex(GO:0016589) |
| 0.1 | 0.2 | GO:0031251 | PAN complex(GO:0031251) |
| 0.1 | 0.7 | GO:0044354 | pinosome(GO:0044352) macropinosome(GO:0044354) |
| 0.1 | 0.6 | GO:0005853 | eukaryotic translation elongation factor 1 complex(GO:0005853) |
| 0.1 | 0.1 | GO:1902636 | kinociliary basal body(GO:1902636) |
| 0.0 | 1.3 | GO:0005689 | U12-type spliceosomal complex(GO:0005689) |
| 0.0 | 0.9 | GO:0005662 | DNA replication factor A complex(GO:0005662) |
| 0.0 | 0.2 | GO:0033186 | CAF-1 complex(GO:0033186) |
| 0.0 | 0.6 | GO:0097433 | dense body(GO:0097433) |
| 0.0 | 0.2 | GO:0031905 | early endosome lumen(GO:0031905) |
| 0.0 | 1.7 | GO:0080008 | Cul4-RING E3 ubiquitin ligase complex(GO:0080008) |
| 0.0 | 0.3 | GO:0005663 | DNA replication factor C complex(GO:0005663) |
| 0.0 | 0.3 | GO:0070187 | telosome(GO:0070187) |
| 0.0 | 0.2 | GO:0005971 | ribonucleoside-diphosphate reductase complex(GO:0005971) |
| 0.0 | 0.5 | GO:0000124 | SAGA complex(GO:0000124) |
| 0.0 | 0.4 | GO:0005688 | U6 snRNP(GO:0005688) |
| 0.0 | 0.3 | GO:0005964 | phosphorylase kinase complex(GO:0005964) |
| 0.0 | 0.4 | GO:0030991 | intraciliary transport particle A(GO:0030991) |
| 0.0 | 0.2 | GO:0035976 | AP1 complex(GO:0035976) |
| 0.0 | 0.2 | GO:0030868 | smooth endoplasmic reticulum membrane(GO:0030868) smooth endoplasmic reticulum part(GO:0097425) |
| 0.0 | 0.1 | GO:0034677 | integrin alpha7-beta1 complex(GO:0034677) |
| 0.0 | 0.3 | GO:0032593 | insulin-responsive compartment(GO:0032593) |
| 0.0 | 0.2 | GO:0044294 | dendritic growth cone(GO:0044294) |
| 0.0 | 0.1 | GO:0034455 | t-UTP complex(GO:0034455) |
| 0.0 | 0.4 | GO:0070531 | BRCA1-A complex(GO:0070531) |
| 0.0 | 0.5 | GO:0031089 | platelet dense granule lumen(GO:0031089) |
| 0.0 | 1.2 | GO:0034451 | centriolar satellite(GO:0034451) |
| 0.0 | 0.1 | GO:0036156 | inner dynein arm(GO:0036156) |
| 0.0 | 0.2 | GO:0031314 | extrinsic component of mitochondrial inner membrane(GO:0031314) |
| 0.0 | 0.5 | GO:0005652 | nuclear lamina(GO:0005652) |
| 0.0 | 0.2 | GO:0042584 | chromaffin granule membrane(GO:0042584) |
| 0.0 | 0.2 | GO:0070652 | HAUS complex(GO:0070652) |
| 0.0 | 0.9 | GO:0005720 | nuclear heterochromatin(GO:0005720) |
| 0.0 | 0.2 | GO:0032541 | cortical endoplasmic reticulum(GO:0032541) |
| 0.0 | 0.5 | GO:0031932 | TORC2 complex(GO:0031932) |
| 0.0 | 0.1 | GO:0034274 | Atg12-Atg5-Atg16 complex(GO:0034274) |
| 0.0 | 0.2 | GO:0002193 | MAML1-RBP-Jkappa- ICN1 complex(GO:0002193) |
| 0.0 | 0.3 | GO:0008540 | proteasome regulatory particle, base subcomplex(GO:0008540) |
| 0.0 | 0.2 | GO:0017059 | serine C-palmitoyltransferase complex(GO:0017059) endoplasmic reticulum palmitoyltransferase complex(GO:0031211) |
| 0.0 | 0.1 | GO:0070545 | PeBoW complex(GO:0070545) |
| 0.0 | 0.1 | GO:0071547 | piP-body(GO:0071547) |
| 0.0 | 0.3 | GO:0030008 | TRAPP complex(GO:0030008) |
| 0.0 | 0.0 | GO:0055087 | Ski complex(GO:0055087) |
| 0.0 | 0.2 | GO:0061574 | ASAP complex(GO:0061574) |
| 0.0 | 0.1 | GO:1990425 | ryanodine receptor complex(GO:1990425) |
| 0.0 | 0.3 | GO:0060077 | inhibitory synapse(GO:0060077) |
| 0.0 | 0.1 | GO:0098837 | postsynaptic recycling endosome(GO:0098837) |
| 0.0 | 0.3 | GO:0045277 | respiratory chain complex IV(GO:0045277) |
| 0.0 | 0.9 | GO:0019005 | SCF ubiquitin ligase complex(GO:0019005) |
| 0.0 | 0.0 | GO:0019034 | viral replication complex(GO:0019034) |
| 0.0 | 0.2 | GO:0008385 | IkappaB kinase complex(GO:0008385) |
| 0.0 | 0.1 | GO:0070937 | CRD-mediated mRNA stability complex(GO:0070937) |
| 0.0 | 0.5 | GO:0016514 | SWI/SNF complex(GO:0016514) |
| 0.0 | 0.1 | GO:0005797 | Golgi medial cisterna(GO:0005797) |
| 0.0 | 0.1 | GO:0042788 | polysomal ribosome(GO:0042788) |
| 0.0 | 0.1 | GO:0097470 | ribbon synapse(GO:0097470) |
| 0.0 | 1.0 | GO:0016529 | sarcoplasmic reticulum(GO:0016529) |
| 0.0 | 0.1 | GO:0071204 | histone pre-mRNA 3'end processing complex(GO:0071204) |
Gene overrepresentation in molecular function category:
| Log-likelihood per target | Total log-likelihood | Term | Description |
|---|---|---|---|
| 0.2 | 0.7 | GO:0051377 | mannose-ethanolamine phosphotransferase activity(GO:0051377) |
| 0.2 | 0.7 | GO:0030350 | iron-responsive element binding(GO:0030350) |
| 0.2 | 0.8 | GO:0033265 | acetylcholinesterase activity(GO:0003990) choline binding(GO:0033265) |
| 0.2 | 2.1 | GO:0051525 | NFAT protein binding(GO:0051525) |
| 0.2 | 0.7 | GO:0071987 | WD40-repeat domain binding(GO:0071987) |
| 0.2 | 0.5 | GO:0004483 | mRNA (nucleoside-2'-O-)-methyltransferase activity(GO:0004483) |
| 0.2 | 0.5 | GO:0036055 | protein-malonyllysine demalonylase activity(GO:0036054) protein-succinyllysine desuccinylase activity(GO:0036055) protein-glutaryllysine deglutarylase activity(GO:0061697) |
| 0.2 | 0.7 | GO:0072320 | volume-sensitive chloride channel activity(GO:0072320) |
| 0.2 | 0.8 | GO:0043515 | kinetochore binding(GO:0043515) |
| 0.2 | 2.0 | GO:0008297 | single-stranded DNA exodeoxyribonuclease activity(GO:0008297) |
| 0.1 | 0.3 | GO:0000386 | second spliceosomal transesterification activity(GO:0000386) |
| 0.1 | 1.0 | GO:0090599 | alpha-glucosidase activity(GO:0090599) |
| 0.1 | 0.5 | GO:0004597 | peptide-aspartate beta-dioxygenase activity(GO:0004597) |
| 0.1 | 1.6 | GO:0051011 | microtubule minus-end binding(GO:0051011) |
| 0.1 | 1.5 | GO:0097157 | pre-mRNA intronic binding(GO:0097157) |
| 0.1 | 0.5 | GO:0004146 | dihydrofolate reductase activity(GO:0004146) |
| 0.1 | 0.4 | GO:0004660 | protein farnesyltransferase activity(GO:0004660) |
| 0.1 | 0.3 | GO:0090541 | MIT domain binding(GO:0090541) |
| 0.1 | 0.8 | GO:0051998 | carboxyl-O-methyltransferase activity(GO:0010340) protein carboxyl O-methyltransferase activity(GO:0051998) |
| 0.1 | 2.3 | GO:0042800 | histone methyltransferase activity (H3-K4 specific)(GO:0042800) |
| 0.1 | 0.5 | GO:0005105 | type 1 fibroblast growth factor receptor binding(GO:0005105) |
| 0.1 | 1.2 | GO:0005114 | type II transforming growth factor beta receptor binding(GO:0005114) |
| 0.1 | 0.4 | GO:0008169 | C-methyltransferase activity(GO:0008169) |
| 0.1 | 0.3 | GO:0004583 | dolichyl-phosphate-glucose-glycolipid alpha-glucosyltransferase activity(GO:0004583) |
| 0.1 | 0.6 | GO:0008481 | sphinganine kinase activity(GO:0008481) D-erythro-sphingosine kinase activity(GO:0017050) |
| 0.1 | 0.4 | GO:0004666 | prostaglandin-endoperoxide synthase activity(GO:0004666) |
| 0.1 | 0.3 | GO:0005136 | interleukin-4 receptor binding(GO:0005136) |
| 0.1 | 2.6 | GO:0016676 | cytochrome-c oxidase activity(GO:0004129) heme-copper terminal oxidase activity(GO:0015002) oxidoreductase activity, acting on a heme group of donors, oxygen as acceptor(GO:0016676) |
| 0.1 | 0.3 | GO:0004768 | stearoyl-CoA 9-desaturase activity(GO:0004768) acyl-CoA desaturase activity(GO:0016215) |
| 0.1 | 0.3 | GO:0032422 | purine-rich negative regulatory element binding(GO:0032422) |
| 0.1 | 1.3 | GO:0016018 | cyclosporin A binding(GO:0016018) |
| 0.1 | 0.9 | GO:0000014 | single-stranded DNA endodeoxyribonuclease activity(GO:0000014) |
| 0.1 | 0.5 | GO:0047756 | chondroitin 4-sulfotransferase activity(GO:0047756) |
| 0.1 | 0.4 | GO:0004366 | glycerol-3-phosphate O-acyltransferase activity(GO:0004366) |
| 0.1 | 0.9 | GO:0004726 | non-membrane spanning protein tyrosine phosphatase activity(GO:0004726) |
| 0.1 | 0.2 | GO:0016428 | tRNA (cytosine-5-)-methyltransferase activity(GO:0016428) |
| 0.1 | 0.2 | GO:0008384 | IkappaB kinase activity(GO:0008384) |
| 0.1 | 0.3 | GO:0051032 | nucleic acid transmembrane transporter activity(GO:0051032) RNA transmembrane transporter activity(GO:0051033) |
| 0.1 | 0.3 | GO:0004699 | calcium-independent protein kinase C activity(GO:0004699) |
| 0.1 | 0.4 | GO:0052834 | inositol monophosphate 1-phosphatase activity(GO:0008934) inositol monophosphate 3-phosphatase activity(GO:0052832) inositol monophosphate 4-phosphatase activity(GO:0052833) inositol monophosphate phosphatase activity(GO:0052834) |
| 0.1 | 0.3 | GO:0032038 | myosin II heavy chain binding(GO:0032038) |
| 0.1 | 0.3 | GO:0004800 | thyroxine 5'-deiodinase activity(GO:0004800) |
| 0.0 | 0.4 | GO:0009008 | DNA-methyltransferase activity(GO:0009008) |
| 0.0 | 0.3 | GO:0003873 | 6-phosphofructo-2-kinase activity(GO:0003873) |
| 0.0 | 2.2 | GO:0071889 | 14-3-3 protein binding(GO:0071889) |
| 0.0 | 2.1 | GO:0008157 | protein phosphatase 1 binding(GO:0008157) |
| 0.0 | 0.2 | GO:0008798 | beta-aspartyl-peptidase activity(GO:0008798) |
| 0.0 | 0.9 | GO:0034452 | dynactin binding(GO:0034452) |
| 0.0 | 1.4 | GO:0050750 | low-density lipoprotein particle receptor binding(GO:0050750) |
| 0.0 | 0.1 | GO:0052739 | phosphatidylserine 1-acylhydrolase activity(GO:0052739) |
| 0.0 | 0.2 | GO:0004427 | inorganic diphosphatase activity(GO:0004427) |
| 0.0 | 0.4 | GO:0036122 | BMP binding(GO:0036122) |
| 0.0 | 0.2 | GO:0048763 | calcium-induced calcium release activity(GO:0048763) |
| 0.0 | 1.4 | GO:0071837 | HMG box domain binding(GO:0071837) |
| 0.0 | 0.1 | GO:0004492 | methylmalonyl-CoA decarboxylase activity(GO:0004492) |
| 0.0 | 1.5 | GO:0043015 | gamma-tubulin binding(GO:0043015) |
| 0.0 | 0.3 | GO:0071532 | ankyrin repeat binding(GO:0071532) |
| 0.0 | 0.4 | GO:0046974 | histone methyltransferase activity (H3-K9 specific)(GO:0046974) |
| 0.0 | 0.4 | GO:0036310 | annealing helicase activity(GO:0036310) |
| 0.0 | 0.2 | GO:0001129 | RNA polymerase II transcription factor activity, TBP-class protein binding, involved in preinitiation complex assembly(GO:0001129) RNA polymerase II transcription factor activity, TBP-class protein binding(GO:0001132) |
| 0.0 | 0.2 | GO:0016728 | ribonucleoside-diphosphate reductase activity, thioredoxin disulfide as acceptor(GO:0004748) oxidoreductase activity, acting on CH or CH2 groups, disulfide as acceptor(GO:0016728) ribonucleoside-diphosphate reductase activity(GO:0061731) |
| 0.0 | 0.2 | GO:0080019 | fatty-acyl-CoA reductase (alcohol-forming) activity(GO:0080019) |
| 0.0 | 0.1 | GO:0035241 | protein-arginine omega-N monomethyltransferase activity(GO:0035241) |
| 0.0 | 0.3 | GO:0003689 | DNA clamp loader activity(GO:0003689) protein-DNA loading ATPase activity(GO:0033170) |
| 0.0 | 0.3 | GO:0004689 | phosphorylase kinase activity(GO:0004689) |
| 0.0 | 0.3 | GO:0070569 | uridylyltransferase activity(GO:0070569) |
| 0.0 | 0.3 | GO:0015288 | porin activity(GO:0015288) |
| 0.0 | 0.3 | GO:0043426 | MRF binding(GO:0043426) |
| 0.0 | 0.3 | GO:0050833 | pyruvate transmembrane transporter activity(GO:0050833) |
| 0.0 | 0.3 | GO:0004176 | ATP-dependent peptidase activity(GO:0004176) |
| 0.0 | 0.2 | GO:0004758 | serine C-palmitoyltransferase activity(GO:0004758) C-palmitoyltransferase activity(GO:0016454) |
| 0.0 | 0.5 | GO:1904264 | ubiquitin protein ligase activity involved in ERAD pathway(GO:1904264) |
| 0.0 | 0.2 | GO:0042030 | ATPase inhibitor activity(GO:0042030) |
| 0.0 | 0.1 | GO:0071207 | histone pre-mRNA stem-loop binding(GO:0071207) |
| 0.0 | 3.2 | GO:0002039 | p53 binding(GO:0002039) |
| 0.0 | 1.0 | GO:0017134 | fibroblast growth factor binding(GO:0017134) |
| 0.0 | 0.3 | GO:0001162 | RNA polymerase II intronic transcription regulatory region sequence-specific DNA binding(GO:0001162) |
| 0.0 | 1.4 | GO:0005487 | nucleocytoplasmic transporter activity(GO:0005487) |
| 0.0 | 0.1 | GO:0017095 | heparan sulfate 6-O-sulfotransferase activity(GO:0017095) |
| 0.0 | 0.3 | GO:0004075 | biotin carboxylase activity(GO:0004075) |
| 0.0 | 0.7 | GO:0070742 | C2H2 zinc finger domain binding(GO:0070742) |
| 0.0 | 0.2 | GO:0004095 | carnitine O-palmitoyltransferase activity(GO:0004095) |
| 0.0 | 0.1 | GO:0030375 | thyroid hormone receptor activator activity(GO:0010861) thyroid hormone receptor coactivator activity(GO:0030375) |
| 0.0 | 0.2 | GO:0000405 | bubble DNA binding(GO:0000405) |
| 0.0 | 0.1 | GO:0004803 | transposase activity(GO:0004803) |
| 0.0 | 0.1 | GO:0010698 | acetyltransferase activator activity(GO:0010698) |
| 0.0 | 0.2 | GO:0003726 | double-stranded RNA adenosine deaminase activity(GO:0003726) |
| 0.0 | 0.2 | GO:0003910 | DNA ligase activity(GO:0003909) DNA ligase (ATP) activity(GO:0003910) |
| 0.0 | 0.2 | GO:0000150 | recombinase activity(GO:0000150) |
| 0.0 | 0.1 | GO:0004773 | steryl-sulfatase activity(GO:0004773) |
| 0.0 | 0.1 | GO:0004802 | transketolase activity(GO:0004802) |
| 0.0 | 0.3 | GO:0004439 | phosphatidylinositol-4,5-bisphosphate 5-phosphatase activity(GO:0004439) |
| 0.0 | 0.6 | GO:0003746 | translation elongation factor activity(GO:0003746) |
| 0.0 | 0.5 | GO:0008191 | metalloendopeptidase inhibitor activity(GO:0008191) |
| 0.0 | 0.1 | GO:0004040 | amidase activity(GO:0004040) |
| 0.0 | 0.1 | GO:0030267 | hydroxypyruvate reductase activity(GO:0016618) glyoxylate reductase (NADP) activity(GO:0030267) |
| 0.0 | 0.1 | GO:0042392 | sphingosine-1-phosphate phosphatase activity(GO:0042392) |
| 0.0 | 0.1 | GO:0098821 | BMP receptor activity(GO:0098821) |
| 0.0 | 0.1 | GO:0051731 | polynucleotide 5'-hydroxyl-kinase activity(GO:0051731) |
| 0.0 | 0.2 | GO:0047522 | 13-prostaglandin reductase activity(GO:0036132) 15-oxoprostaglandin 13-oxidase activity(GO:0047522) |
| 0.0 | 0.5 | GO:0004859 | phospholipase inhibitor activity(GO:0004859) |
| 0.0 | 0.2 | GO:0016312 | inositol bisphosphate phosphatase activity(GO:0016312) |
| 0.0 | 0.4 | GO:0015095 | magnesium ion transmembrane transporter activity(GO:0015095) |
| 0.0 | 0.4 | GO:0005542 | folic acid binding(GO:0005542) |
| 0.0 | 0.1 | GO:0019776 | Atg8 ligase activity(GO:0019776) |
| 0.0 | 0.0 | GO:0000403 | Y-form DNA binding(GO:0000403) |
| 0.0 | 0.6 | GO:0003950 | NAD+ ADP-ribosyltransferase activity(GO:0003950) |
| 0.0 | 0.1 | GO:0005151 | interleukin-1, Type II receptor binding(GO:0005151) |
| 0.0 | 0.6 | GO:0017075 | syntaxin-1 binding(GO:0017075) |
| 0.0 | 0.4 | GO:0005521 | lamin binding(GO:0005521) |
| 0.0 | 0.1 | GO:0001165 | RNA polymerase I upstream control element sequence-specific DNA binding(GO:0001165) |
| 0.0 | 0.2 | GO:0070087 | chromo shadow domain binding(GO:0070087) |
| 0.0 | 0.2 | GO:0001206 | transcriptional repressor activity, RNA polymerase II distal enhancer sequence-specific binding(GO:0001206) |
| 0.0 | 0.5 | GO:0071949 | FAD binding(GO:0071949) |
| 0.0 | 0.1 | GO:0004487 | formate-tetrahydrofolate ligase activity(GO:0004329) methylenetetrahydrofolate dehydrogenase (NAD+) activity(GO:0004487) |
| 0.0 | 0.3 | GO:0043225 | anion transmembrane-transporting ATPase activity(GO:0043225) |
| 0.0 | 0.0 | GO:0061649 | ubiquitinated histone binding(GO:0061649) |
| 0.0 | 0.3 | GO:0004143 | diacylglycerol kinase activity(GO:0004143) |
| 0.0 | 0.5 | GO:0031492 | nucleosomal DNA binding(GO:0031492) |
| 0.0 | 0.1 | GO:0004667 | prostaglandin-D synthase activity(GO:0004667) |
| 0.0 | 0.1 | GO:0004525 | ribonuclease III activity(GO:0004525) double-stranded RNA-specific ribonuclease activity(GO:0032296) |
| 0.0 | 0.2 | GO:0036374 | glutathione hydrolase activity(GO:0036374) |
| 0.0 | 0.0 | GO:0008523 | sodium-dependent multivitamin transmembrane transporter activity(GO:0008523) |
| 0.0 | 0.3 | GO:0035259 | glucocorticoid receptor binding(GO:0035259) |
| 0.0 | 0.2 | GO:0051378 | amine binding(GO:0043176) serotonin binding(GO:0051378) |
| 0.0 | 0.1 | GO:0005021 | vascular endothelial growth factor-activated receptor activity(GO:0005021) |
| 0.0 | 0.3 | GO:0031491 | nucleosome binding(GO:0031491) |
| 0.0 | 0.1 | GO:0061575 | cyclin-dependent protein serine/threonine kinase activator activity(GO:0061575) |
| 0.0 | 0.2 | GO:0016846 | carbon-sulfur lyase activity(GO:0016846) |
| 0.0 | 0.1 | GO:0019237 | centromeric DNA binding(GO:0019237) |
| 0.0 | 0.1 | GO:0047179 | platelet-activating factor acetyltransferase activity(GO:0047179) |
| 0.0 | 1.5 | GO:0003697 | single-stranded DNA binding(GO:0003697) |
| 0.0 | 0.3 | GO:0070628 | proteasome binding(GO:0070628) |
| 0.0 | 7.2 | GO:0004842 | ubiquitin-protein transferase activity(GO:0004842) |
| 0.0 | 0.1 | GO:0030983 | mismatched DNA binding(GO:0030983) |
| 0.0 | 0.0 | GO:0047192 | 1-alkylglycerophosphocholine O-acetyltransferase activity(GO:0047192) |
| 0.0 | 0.6 | GO:0005158 | insulin receptor binding(GO:0005158) |
| 0.0 | 0.1 | GO:0019960 | C-X3-C chemokine binding(GO:0019960) |
| 0.0 | 0.3 | GO:0004012 | phospholipid-translocating ATPase activity(GO:0004012) |
| 0.0 | 0.1 | GO:0017154 | semaphorin receptor activity(GO:0017154) |
Gene overrepresentation in curated gene sets: canonical pathways category:
| Log-likelihood per target | Total log-likelihood | Term | Description |
|---|---|---|---|
| 0.1 | 0.2 | PID RANBP2 PATHWAY | Sumoylation by RanBP2 regulates transcriptional repression |
| 0.1 | 2.2 | PID NFKAPPAB ATYPICAL PATHWAY | Atypical NF-kappaB pathway |
| 0.0 | 1.9 | PID PLK1 PATHWAY | PLK1 signaling events |
| 0.0 | 0.3 | PID PI3K PLC TRK PATHWAY | Trk receptor signaling mediated by PI3K and PLC-gamma |
| 0.0 | 1.0 | ST GA12 PATHWAY | G alpha 12 Pathway |
| 0.0 | 0.2 | PID INSULIN PATHWAY | Insulin Pathway |
| 0.0 | 0.2 | ST GRANULE CELL SURVIVAL PATHWAY | Granule Cell Survival Pathway is a specific case of more general PAC1 Receptor Pathway. |
| 0.0 | 1.4 | ST DIFFERENTIATION PATHWAY IN PC12 CELLS | Differentiation Pathway in PC12 Cells; this is a specific case of PAC1 Receptor Pathway. |
| 0.0 | 2.1 | PID CASPASE PATHWAY | Caspase cascade in apoptosis |
| 0.0 | 0.3 | ST ADRENERGIC | Adrenergic Pathway |
| 0.0 | 0.9 | PID ARF6 PATHWAY | Arf6 signaling events |
| 0.0 | 0.6 | PID S1P META PATHWAY | Sphingosine 1-phosphate (S1P) pathway |
| 0.0 | 0.8 | PID AURORA B PATHWAY | Aurora B signaling |
| 0.0 | 0.6 | PID MYC PATHWAY | C-MYC pathway |
| 0.0 | 0.1 | PID VEGF VEGFR PATHWAY | VEGF and VEGFR signaling network |
| 0.0 | 0.8 | PID PS1 PATHWAY | Presenilin action in Notch and Wnt signaling |
| 0.0 | 0.1 | ST MYOCYTE AD PATHWAY | Myocyte Adrenergic Pathway is a specific case of the generalized Adrenergic Pathway. |
| 0.0 | 0.6 | PID IL12 STAT4 PATHWAY | IL12 signaling mediated by STAT4 |
| 0.0 | 0.3 | PID TGFBR PATHWAY | TGF-beta receptor signaling |
| 0.0 | 0.1 | ST IL 13 PATHWAY | Interleukin 13 (IL-13) Pathway |
| 0.0 | 0.2 | PID HES HEY PATHWAY | Notch-mediated HES/HEY network |
| 0.0 | 0.4 | PID RHODOPSIN PATHWAY | Visual signal transduction: Rods |
Gene overrepresentation in curated gene sets: REACTOME pathways category:
| Log-likelihood per target | Total log-likelihood | Term | Description |
|---|---|---|---|
| 0.1 | 2.2 | REACTOME DSCAM INTERACTIONS | Genes involved in DSCAM interactions |
| 0.1 | 1.6 | REACTOME RECRUITMENT OF NUMA TO MITOTIC CENTROSOMES | Genes involved in Recruitment of NuMA to mitotic centrosomes |
| 0.0 | 1.4 | REACTOME GLYCOGEN BREAKDOWN GLYCOGENOLYSIS | Genes involved in Glycogen breakdown (glycogenolysis) |
| 0.0 | 0.8 | REACTOME REPAIR SYNTHESIS FOR GAP FILLING BY DNA POL IN TC NER | Genes involved in Repair synthesis for gap-filling by DNA polymerase in TC-NER |
| 0.0 | 0.3 | REACTOME CELL CYCLE CHECKPOINTS | Genes involved in Cell Cycle Checkpoints |
| 0.0 | 0.8 | REACTOME SYNTHESIS SECRETION AND DEACYLATION OF GHRELIN | Genes involved in Synthesis, Secretion, and Deacylation of Ghrelin |
| 0.0 | 0.8 | REACTOME DEPOSITION OF NEW CENPA CONTAINING NUCLEOSOMES AT THE CENTROMERE | Genes involved in Deposition of New CENPA-containing Nucleosomes at the Centromere |
| 0.0 | 0.3 | REACTOME PACKAGING OF TELOMERE ENDS | Genes involved in Packaging Of Telomere Ends |
| 0.0 | 0.7 | REACTOME SYNTHESIS OF GLYCOSYLPHOSPHATIDYLINOSITOL GPI | Genes involved in Synthesis of glycosylphosphatidylinositol (GPI) |
| 0.0 | 0.7 | REACTOME PHOSPHORYLATION OF THE APC C | Genes involved in Phosphorylation of the APC/C |
| 0.0 | 0.1 | REACTOME VEGF LIGAND RECEPTOR INTERACTIONS | Genes involved in VEGF ligand-receptor interactions |
| 0.0 | 0.3 | REACTOME SLBP DEPENDENT PROCESSING OF REPLICATION DEPENDENT HISTONE PRE MRNAS | Genes involved in SLBP Dependent Processing of Replication-Dependent Histone Pre-mRNAs |
| 0.0 | 0.2 | REACTOME ENDOSOMAL VACUOLAR PATHWAY | Genes involved in Endosomal/Vacuolar pathway |
| 0.0 | 0.1 | REACTOME RNA POL I PROMOTER OPENING | Genes involved in RNA Polymerase I Promoter Opening |
| 0.0 | 0.2 | REACTOME ASSOCIATION OF LICENSING FACTORS WITH THE PRE REPLICATIVE COMPLEX | Genes involved in Association of licensing factors with the pre-replicative complex |
| 0.0 | 0.4 | REACTOME SIGNALING BY FGFR1 FUSION MUTANTS | Genes involved in Signaling by FGFR1 fusion mutants |
| 0.0 | 0.8 | REACTOME GROWTH HORMONE RECEPTOR SIGNALING | Genes involved in Growth hormone receptor signaling |
| 0.0 | 2.4 | REACTOME PEPTIDE CHAIN ELONGATION | Genes involved in Peptide chain elongation |
| 0.0 | 1.5 | REACTOME GOLGI ASSOCIATED VESICLE BIOGENESIS | Genes involved in Golgi Associated Vesicle Biogenesis |
| 0.0 | 0.2 | REACTOME IRAK1 RECRUITS IKK COMPLEX | Genes involved in IRAK1 recruits IKK complex |
| 0.0 | 0.2 | REACTOME APOPTOSIS INDUCED DNA FRAGMENTATION | Genes involved in Apoptosis induced DNA fragmentation |
| 0.0 | 0.5 | REACTOME CHONDROITIN SULFATE BIOSYNTHESIS | Genes involved in Chondroitin sulfate biosynthesis |
| 0.0 | 0.2 | REACTOME SIGNAL ATTENUATION | Genes involved in Signal attenuation |
| 0.0 | 0.4 | REACTOME SIGNALING BY HIPPO | Genes involved in Signaling by Hippo |
| 0.0 | 0.3 | REACTOME AMINE DERIVED HORMONES | Genes involved in Amine-derived hormones |
| 0.0 | 0.4 | REACTOME BIOSYNTHESIS OF THE N GLYCAN PRECURSOR DOLICHOL LIPID LINKED OLIGOSACCHARIDE LLO AND TRANSFER TO A NASCENT PROTEIN | Genes involved in Biosynthesis of the N-glycan precursor (dolichol lipid-linked oligosaccharide, LLO) and transfer to a nascent protein |
| 0.0 | 0.9 | REACTOME APOPTOTIC CLEAVAGE OF CELLULAR PROTEINS | Genes involved in Apoptotic cleavage of cellular proteins |