Project
Inflammatory response time course, HUVEC (Wada, 2009)
Navigation
Downloads
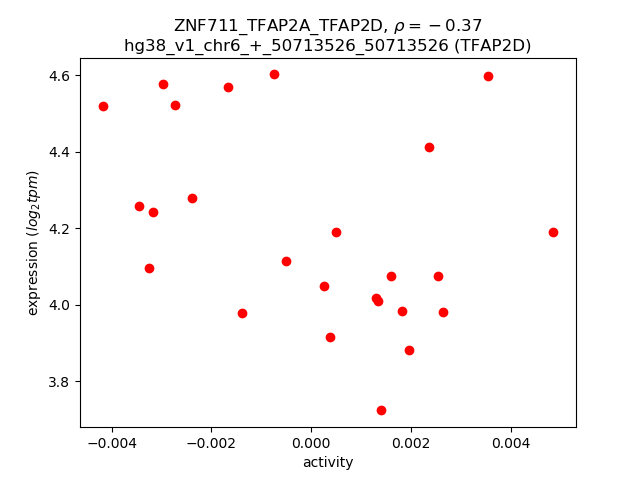
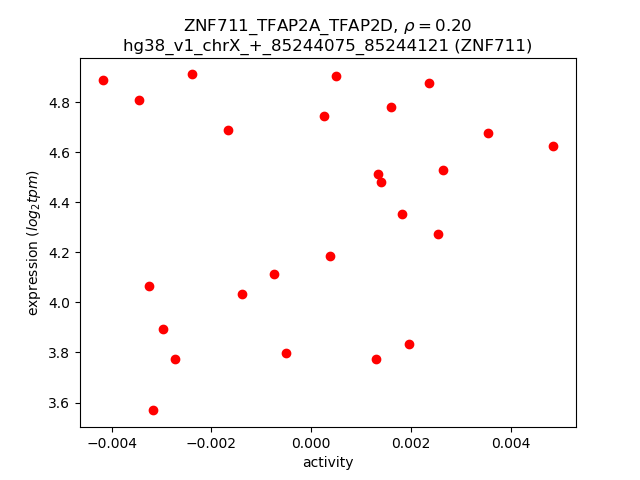
Results for ZNF711_TFAP2A_TFAP2D
Z-value: 1.25
Motif logo
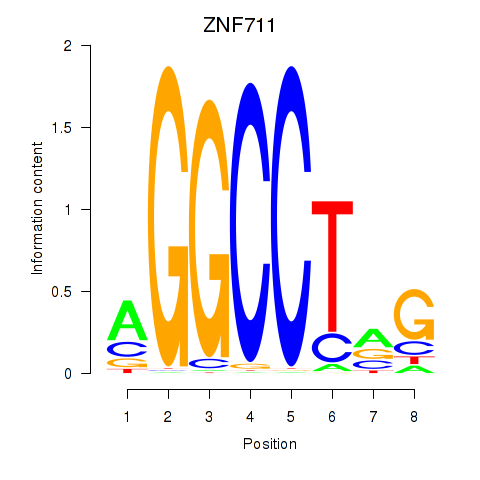
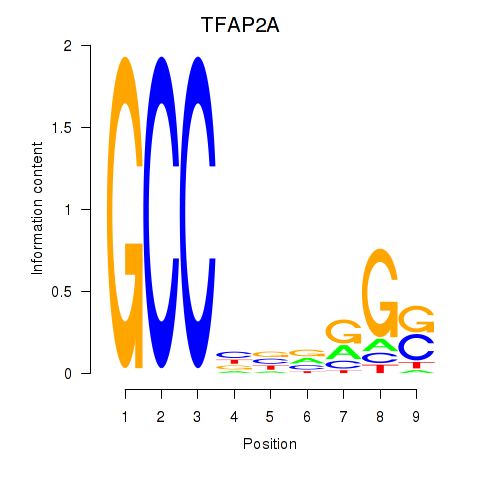
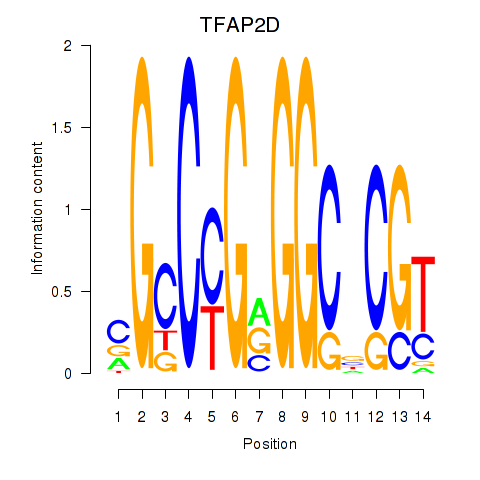
Transcription factors associated with ZNF711_TFAP2A_TFAP2D
| Gene Symbol | Gene ID | Gene Info |
|---|---|---|
|
ZNF711
|
ENSG00000147180.17 | ZNF711 |
|
TFAP2A
|
ENSG00000137203.15 | TFAP2A |
|
TFAP2D
|
ENSG00000008197.5 | TFAP2D |
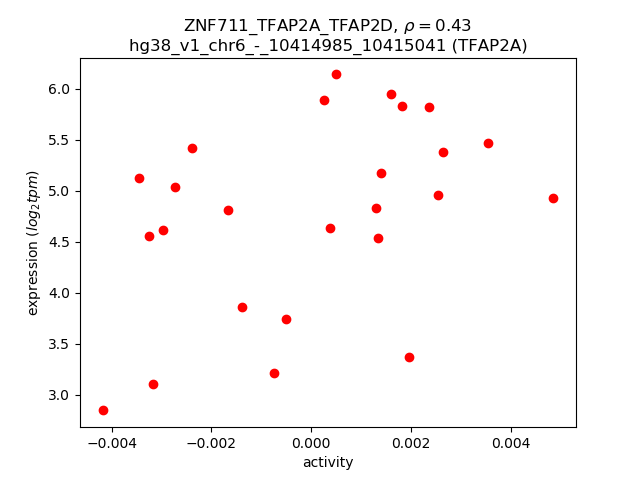
Activity-expression correlation:
| Gene | Promoter | Pearson corr. coef. | P-value | Plot |
|---|---|---|---|---|
| TFAP2A | hg38_v1_chr6_-_10414985_10415041 | 0.43 | 3.4e-02 | Click! |
| TFAP2D | hg38_v1_chr6_+_50713526_50713526 | -0.37 | 6.7e-02 | Click! |
| ZNF711 | hg38_v1_chrX_+_85244075_85244121 | 0.20 | 3.3e-01 | Click! |
Activity profile of ZNF711_TFAP2A_TFAP2D motif
Sorted Z-values of ZNF711_TFAP2A_TFAP2D motif
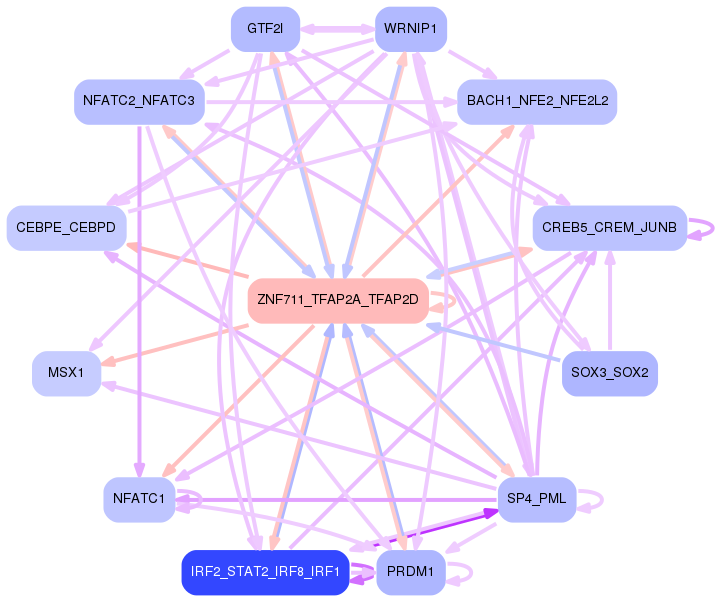
Network of associatons between targets according to the STRING database.

First level regulatory network of ZNF711_TFAP2A_TFAP2D
Gene Ontology Analysis
Gene overrepresentation in biological process category:
| Log-likelihood per target | Total log-likelihood | Term | Description |
|---|---|---|---|
| 2.9 | 11.6 | GO:0002541 | activation of plasma proteins involved in acute inflammatory response(GO:0002541) |
| 1.8 | 5.4 | GO:0060086 | circadian temperature homeostasis(GO:0060086) |
| 1.3 | 3.8 | GO:2000752 | regulation of phospholipid scramblase activity(GO:1900161) positive regulation of phospholipid scramblase activity(GO:1900163) regulation of glucosylceramide catabolic process(GO:2000752) positive regulation of glucosylceramide catabolic process(GO:2000753) regulation of sphingomyelin catabolic process(GO:2000754) positive regulation of sphingomyelin catabolic process(GO:2000755) |
| 1.1 | 3.3 | GO:0061027 | umbilical cord morphogenesis(GO:0036304) umbilical cord development(GO:0061027) |
| 0.9 | 2.8 | GO:1903892 | negative regulation of ATF6-mediated unfolded protein response(GO:1903892) |
| 0.9 | 2.7 | GO:0051040 | regulation of calcium-independent cell-cell adhesion(GO:0051040) |
| 0.9 | 3.6 | GO:0042091 | interleukin-10 biosynthetic process(GO:0042091) regulation of interleukin-10 biosynthetic process(GO:0045074) |
| 0.8 | 3.4 | GO:1901377 | mycotoxin catabolic process(GO:0043387) aflatoxin catabolic process(GO:0046223) organic heteropentacyclic compound catabolic process(GO:1901377) regulation of glutathione biosynthetic process(GO:1903786) positive regulation of glutathione biosynthetic process(GO:1903788) |
| 0.8 | 2.5 | GO:0070429 | regulation of toll-like receptor 5 signaling pathway(GO:0034147) negative regulation of toll-like receptor 5 signaling pathway(GO:0034148) negative regulation of nucleotide-binding oligomerization domain containing 1 signaling pathway(GO:0070429) |
| 0.8 | 2.4 | GO:1901301 | regulation of cargo loading into COPII-coated vesicle(GO:1901301) |
| 0.6 | 1.9 | GO:2000661 | positive regulation of interleukin-1-mediated signaling pathway(GO:2000661) |
| 0.6 | 2.5 | GO:0090427 | activation of meiosis(GO:0090427) |
| 0.6 | 1.8 | GO:0090038 | negative regulation of protein kinase C signaling(GO:0090038) |
| 0.6 | 0.6 | GO:0031443 | fast-twitch skeletal muscle fiber contraction(GO:0031443) |
| 0.6 | 1.1 | GO:0072209 | metanephric mesangial cell differentiation(GO:0072209) metanephric glomerular mesangial cell differentiation(GO:0072254) |
| 0.6 | 2.3 | GO:0046368 | GDP-L-fucose metabolic process(GO:0046368) |
| 0.6 | 1.1 | GO:0035992 | tendon cell differentiation(GO:0035990) tendon formation(GO:0035992) |
| 0.5 | 2.2 | GO:0060994 | regulation of transcription from RNA polymerase II promoter involved in kidney development(GO:0060994) |
| 0.5 | 1.6 | GO:0006683 | galactosylceramide catabolic process(GO:0006683) |
| 0.5 | 1.6 | GO:1905064 | negative regulation of vascular smooth muscle cell differentiation(GO:1905064) |
| 0.5 | 1.6 | GO:0019542 | acetate biosynthetic process(GO:0019413) acetyl-CoA biosynthetic process from acetate(GO:0019427) propionate biosynthetic process(GO:0019542) |
| 0.5 | 1.6 | GO:2000097 | regulation of smooth muscle cell-matrix adhesion(GO:2000097) |
| 0.5 | 3.0 | GO:0006021 | inositol biosynthetic process(GO:0006021) |
| 0.5 | 2.0 | GO:0045084 | positive regulation of interleukin-12 biosynthetic process(GO:0045084) |
| 0.5 | 2.0 | GO:0070378 | positive regulation of ERK5 cascade(GO:0070378) |
| 0.5 | 2.0 | GO:0048073 | regulation of eye pigmentation(GO:0048073) |
| 0.5 | 0.5 | GO:0032912 | negative regulation of transforming growth factor beta2 production(GO:0032912) |
| 0.5 | 1.4 | GO:0070662 | mast cell proliferation(GO:0070662) |
| 0.5 | 3.6 | GO:0014916 | regulation of lung blood pressure(GO:0014916) |
| 0.5 | 3.6 | GO:2000630 | positive regulation of miRNA metabolic process(GO:2000630) |
| 0.5 | 1.4 | GO:0015917 | aminophospholipid transport(GO:0015917) |
| 0.5 | 1.4 | GO:2000777 | positive regulation of proteasomal ubiquitin-dependent protein catabolic process involved in cellular response to hypoxia(GO:2000777) |
| 0.4 | 1.8 | GO:1903173 | phytol metabolic process(GO:0033306) fatty alcohol metabolic process(GO:1903173) |
| 0.4 | 1.8 | GO:0070427 | nucleotide-binding oligomerization domain containing 1 signaling pathway(GO:0070427) |
| 0.4 | 1.3 | GO:0046108 | uridine metabolic process(GO:0046108) |
| 0.4 | 3.0 | GO:1905123 | regulation of glucosylceramidase activity(GO:1905123) |
| 0.4 | 1.3 | GO:0052151 | positive regulation by symbiont of host apoptotic process(GO:0052151) positive regulation of apoptotic process by virus(GO:0060139) |
| 0.4 | 1.3 | GO:0060003 | copper ion export(GO:0060003) |
| 0.4 | 0.8 | GO:0034140 | negative regulation of toll-like receptor 3 signaling pathway(GO:0034140) |
| 0.4 | 1.6 | GO:0003409 | optic cup structural organization(GO:0003409) |
| 0.4 | 0.8 | GO:0072011 | glomerular endothelium development(GO:0072011) |
| 0.4 | 1.2 | GO:1904899 | regulation of hepatic stellate cell proliferation(GO:1904897) positive regulation of hepatic stellate cell proliferation(GO:1904899) hepatic stellate cell proliferation(GO:1990922) |
| 0.4 | 2.0 | GO:0090272 | negative regulation of fibroblast growth factor production(GO:0090272) |
| 0.4 | 1.2 | GO:0030327 | prenylated protein catabolic process(GO:0030327) |
| 0.4 | 1.2 | GO:1902908 | regulation of melanosome transport(GO:1902908) |
| 0.4 | 1.2 | GO:0002416 | IgG immunoglobulin transcytosis in epithelial cells mediated by FcRn immunoglobulin receptor(GO:0002416) |
| 0.4 | 1.5 | GO:1904381 | Golgi apparatus mannose trimming(GO:1904381) |
| 0.4 | 1.1 | GO:0001560 | regulation of cell growth by extracellular stimulus(GO:0001560) |
| 0.4 | 0.4 | GO:0034395 | regulation of transcription from RNA polymerase II promoter in response to iron(GO:0034395) |
| 0.4 | 2.3 | GO:0032252 | secretory granule localization(GO:0032252) |
| 0.4 | 1.1 | GO:1904717 | excitatory chemical synaptic transmission(GO:0098976) regulation of AMPA glutamate receptor clustering(GO:1904717) positive regulation of AMPA glutamate receptor clustering(GO:1904719) |
| 0.4 | 0.7 | GO:0043465 | fermentation(GO:0006113) regulation of fermentation(GO:0043465) |
| 0.4 | 2.6 | GO:0090210 | regulation of establishment of blood-brain barrier(GO:0090210) |
| 0.4 | 2.6 | GO:0071351 | interleukin-18-mediated signaling pathway(GO:0035655) cellular response to interleukin-18(GO:0071351) |
| 0.4 | 0.4 | GO:2001301 | lipoxin biosynthetic process(GO:2001301) lipoxin A4 metabolic process(GO:2001302) lipoxin A4 biosynthetic process(GO:2001303) |
| 0.4 | 1.8 | GO:0001575 | globoside metabolic process(GO:0001575) |
| 0.4 | 1.1 | GO:1902823 | negative regulation of late endosome to lysosome transport(GO:1902823) |
| 0.4 | 1.1 | GO:1900224 | positive regulation of nodal signaling pathway involved in determination of lateral mesoderm left/right asymmetry(GO:1900224) |
| 0.4 | 2.1 | GO:0046086 | adenosine biosynthetic process(GO:0046086) |
| 0.4 | 1.8 | GO:0001315 | age-dependent response to oxidative stress(GO:0001306) age-dependent response to reactive oxygen species(GO:0001315) regulation of systemic arterial blood pressure by acetylcholine(GO:0003068) vasodilation by acetylcholine involved in regulation of systemic arterial blood pressure(GO:0003069) regulation of systemic arterial blood pressure by neurotransmitter(GO:0003070) age-dependent general metabolic decline(GO:0007571) |
| 0.4 | 1.1 | GO:0032887 | regulation of spindle elongation(GO:0032887) regulation of mitotic spindle elongation(GO:0032888) anastral spindle assembly(GO:0055048) protein localization to spindle pole body(GO:0071988) regulation of protein localization to spindle pole body(GO:1902363) positive regulation of protein localization to spindle pole body(GO:1902365) positive regulation of mitotic spindle elongation(GO:1902846) |
| 0.4 | 1.1 | GO:1903028 | positive regulation of opsonization(GO:1903028) |
| 0.4 | 1.1 | GO:0090341 | negative regulation of secretion of lysosomal enzymes(GO:0090341) |
| 0.3 | 1.0 | GO:0006097 | glyoxylate cycle(GO:0006097) |
| 0.3 | 2.4 | GO:0006269 | DNA replication, synthesis of RNA primer(GO:0006269) |
| 0.3 | 0.7 | GO:0001300 | chronological cell aging(GO:0001300) |
| 0.3 | 1.4 | GO:1990535 | neuron projection maintenance(GO:1990535) |
| 0.3 | 0.3 | GO:0006083 | acetate metabolic process(GO:0006083) |
| 0.3 | 2.3 | GO:0033578 | protein glycosylation in Golgi(GO:0033578) |
| 0.3 | 1.3 | GO:0097089 | methyl-branched fatty acid metabolic process(GO:0097089) |
| 0.3 | 1.0 | GO:1905237 | response to cyclosporin A(GO:1905237) |
| 0.3 | 1.3 | GO:1905167 | positive regulation of lysosomal protein catabolic process(GO:1905167) |
| 0.3 | 2.3 | GO:0036484 | trunk segmentation(GO:0035290) trunk neural crest cell migration(GO:0036484) ventral trunk neural crest cell migration(GO:0036486) |
| 0.3 | 1.0 | GO:0034635 | glutathione transport(GO:0034635) tripeptide transport(GO:0042939) |
| 0.3 | 1.3 | GO:0006663 | platelet activating factor biosynthetic process(GO:0006663) |
| 0.3 | 1.9 | GO:0046092 | deoxycytidine metabolic process(GO:0046092) |
| 0.3 | 1.0 | GO:1903400 | L-arginine transmembrane transport(GO:1903400) |
| 0.3 | 1.3 | GO:1902228 | positive regulation of odontogenesis of dentin-containing tooth(GO:0042488) mammary gland fat development(GO:0060611) positive regulation of macrophage colony-stimulating factor signaling pathway(GO:1902228) positive regulation of response to macrophage colony-stimulating factor(GO:1903971) positive regulation of cellular response to macrophage colony-stimulating factor stimulus(GO:1903974) positive regulation of microglial cell migration(GO:1904141) |
| 0.3 | 1.6 | GO:0014886 | transition between slow and fast fiber(GO:0014886) |
| 0.3 | 0.9 | GO:1901675 | negative regulation of histone H3-K27 acetylation(GO:1901675) |
| 0.3 | 1.3 | GO:1901382 | chorionic trophoblast cell proliferation(GO:0097360) regulation of chorionic trophoblast cell proliferation(GO:1901382) |
| 0.3 | 0.9 | GO:0046521 | sphingoid catabolic process(GO:0046521) |
| 0.3 | 0.9 | GO:1902524 | positive regulation of protein K48-linked ubiquitination(GO:1902524) |
| 0.3 | 1.2 | GO:1903984 | positive regulation of TRAIL-activated apoptotic signaling pathway(GO:1903984) |
| 0.3 | 1.2 | GO:0006542 | glutamine biosynthetic process(GO:0006542) |
| 0.3 | 0.9 | GO:0043490 | malate-aspartate shuttle(GO:0043490) |
| 0.3 | 0.9 | GO:0035720 | intraciliary anterograde transport(GO:0035720) |
| 0.3 | 2.2 | GO:0070560 | protein secretion by platelet(GO:0070560) |
| 0.3 | 2.5 | GO:0097084 | vascular smooth muscle cell development(GO:0097084) |
| 0.3 | 0.9 | GO:0046707 | IDP metabolic process(GO:0046707) IDP catabolic process(GO:0046709) |
| 0.3 | 1.5 | GO:0016480 | negative regulation of transcription from RNA polymerase III promoter(GO:0016480) |
| 0.3 | 0.3 | GO:0071284 | cellular response to lead ion(GO:0071284) |
| 0.3 | 1.5 | GO:0002545 | chronic inflammatory response to non-antigenic stimulus(GO:0002545) regulation of chronic inflammatory response to non-antigenic stimulus(GO:0002880) |
| 0.3 | 0.3 | GO:0036216 | response to stem cell factor(GO:0036215) cellular response to stem cell factor stimulus(GO:0036216) Kit signaling pathway(GO:0038109) |
| 0.3 | 0.9 | GO:0050717 | positive regulation of interleukin-1 alpha secretion(GO:0050717) |
| 0.3 | 1.2 | GO:0015670 | carbon dioxide transport(GO:0015670) |
| 0.3 | 1.2 | GO:0015910 | peroxisomal long-chain fatty acid import(GO:0015910) |
| 0.3 | 1.4 | GO:0098904 | regulation of AV node cell action potential(GO:0098904) |
| 0.3 | 0.9 | GO:1904580 | regulation of intracellular mRNA localization(GO:1904580) positive regulation of intracellular mRNA localization(GO:1904582) |
| 0.3 | 0.3 | GO:0018242 | protein O-linked glycosylation via serine(GO:0018242) |
| 0.3 | 2.0 | GO:0045629 | negative regulation of T-helper 2 cell differentiation(GO:0045629) |
| 0.3 | 0.9 | GO:1900194 | negative regulation of oocyte maturation(GO:1900194) |
| 0.3 | 0.3 | GO:1904933 | regulation of cell proliferation in midbrain(GO:1904933) |
| 0.3 | 0.9 | GO:0014740 | negative regulation of muscle hyperplasia(GO:0014740) |
| 0.3 | 0.3 | GO:0035787 | cell migration involved in kidney development(GO:0035787) |
| 0.3 | 1.1 | GO:0006172 | ADP biosynthetic process(GO:0006172) |
| 0.3 | 1.1 | GO:0000023 | maltose metabolic process(GO:0000023) |
| 0.3 | 0.8 | GO:1903949 | positive regulation of atrial cardiac muscle cell action potential(GO:1903949) |
| 0.3 | 1.1 | GO:0045658 | regulation of neutrophil differentiation(GO:0045658) negative regulation of neutrophil differentiation(GO:0045659) |
| 0.3 | 0.5 | GO:0097017 | renal protein absorption(GO:0097017) |
| 0.3 | 1.4 | GO:0003199 | endocardial cushion to mesenchymal transition involved in heart valve formation(GO:0003199) |
| 0.3 | 0.5 | GO:0070673 | response to interleukin-18(GO:0070673) |
| 0.3 | 1.1 | GO:0015680 | intracellular copper ion transport(GO:0015680) |
| 0.3 | 3.0 | GO:1903944 | regulation of hepatocyte apoptotic process(GO:1903943) negative regulation of hepatocyte apoptotic process(GO:1903944) |
| 0.3 | 1.1 | GO:1904045 | cellular response to aldosterone(GO:1904045) |
| 0.3 | 3.5 | GO:0001766 | membrane raft polarization(GO:0001766) membrane raft distribution(GO:0031580) |
| 0.3 | 0.8 | GO:0051793 | medium-chain fatty acid catabolic process(GO:0051793) |
| 0.3 | 0.3 | GO:2000395 | regulation of ubiquitin-dependent endocytosis(GO:2000395) positive regulation of ubiquitin-dependent endocytosis(GO:2000397) |
| 0.3 | 0.8 | GO:0021793 | chemorepulsion of branchiomotor axon(GO:0021793) |
| 0.3 | 2.1 | GO:0007506 | gonadal mesoderm development(GO:0007506) |
| 0.3 | 1.0 | GO:1905205 | positive regulation of connective tissue replacement(GO:1905205) |
| 0.3 | 0.8 | GO:0031508 | pericentric heterochromatin assembly(GO:0031508) |
| 0.3 | 1.8 | GO:0006003 | fructose 2,6-bisphosphate metabolic process(GO:0006003) |
| 0.3 | 1.0 | GO:0071110 | protein biotinylation(GO:0009305) histone biotinylation(GO:0071110) |
| 0.3 | 0.3 | GO:1904684 | negative regulation of metalloendopeptidase activity(GO:1904684) |
| 0.3 | 1.5 | GO:0060988 | lipid tube assembly(GO:0060988) |
| 0.3 | 0.8 | GO:2000491 | positive regulation of hepatic stellate cell activation(GO:2000491) |
| 0.2 | 1.7 | GO:0022614 | membrane to membrane docking(GO:0022614) |
| 0.2 | 1.7 | GO:0035434 | copper ion transmembrane transport(GO:0035434) |
| 0.2 | 2.5 | GO:2000586 | regulation of platelet-derived growth factor receptor-beta signaling pathway(GO:2000586) |
| 0.2 | 0.7 | GO:1901069 | guanosine-containing compound catabolic process(GO:1901069) |
| 0.2 | 0.2 | GO:0090164 | asymmetric Golgi ribbon formation(GO:0090164) |
| 0.2 | 0.7 | GO:0019243 | methylglyoxal catabolic process to D-lactate via S-lactoyl-glutathione(GO:0019243) methylglyoxal catabolic process(GO:0051596) methylglyoxal catabolic process to lactate(GO:0061727) |
| 0.2 | 1.7 | GO:0001705 | ectoderm formation(GO:0001705) ectodermal cell fate commitment(GO:0001712) |
| 0.2 | 1.0 | GO:0032474 | otolith morphogenesis(GO:0032474) |
| 0.2 | 4.1 | GO:1901725 | regulation of histone deacetylase activity(GO:1901725) |
| 0.2 | 0.5 | GO:0061428 | negative regulation of transcription from RNA polymerase II promoter in response to hypoxia(GO:0061428) |
| 0.2 | 0.7 | GO:0071529 | cementum mineralization(GO:0071529) |
| 0.2 | 0.7 | GO:0072308 | negative regulation by virus of viral protein levels in host cell(GO:0046725) negative regulation of metanephric nephron tubule epithelial cell differentiation(GO:0072308) |
| 0.2 | 1.0 | GO:0090235 | regulation of metaphase plate congression(GO:0090235) |
| 0.2 | 1.4 | GO:0010757 | negative regulation of plasminogen activation(GO:0010757) |
| 0.2 | 1.4 | GO:0071051 | polyadenylation-dependent snoRNA 3'-end processing(GO:0071051) |
| 0.2 | 1.4 | GO:1901963 | glial cell fate determination(GO:0007403) canonical Wnt signaling pathway involved in positive regulation of cardiac outflow tract cell proliferation(GO:0061324) regulation of cell proliferation involved in outflow tract morphogenesis(GO:1901963) regulation of chromatin-mediated maintenance of transcription(GO:1904499) positive regulation of chromatin-mediated maintenance of transcription(GO:1904501) regulation of euchromatin binding(GO:1904793) |
| 0.2 | 0.9 | GO:1903296 | regulation of glutamate secretion, neurotransmission(GO:1903294) positive regulation of glutamate secretion, neurotransmission(GO:1903296) |
| 0.2 | 0.9 | GO:1901079 | positive regulation of relaxation of muscle(GO:1901079) |
| 0.2 | 1.1 | GO:0002019 | regulation of renal output by angiotensin(GO:0002019) |
| 0.2 | 0.5 | GO:0030223 | neutrophil differentiation(GO:0030223) |
| 0.2 | 2.0 | GO:0032511 | late endosome to vacuole transport via multivesicular body sorting pathway(GO:0032511) |
| 0.2 | 0.7 | GO:0099557 | trans-synaptic signaling by trans-synaptic complex, modulating synaptic transmission(GO:0099557) |
| 0.2 | 0.9 | GO:1900535 | medium-chain fatty-acyl-CoA catabolic process(GO:0036114) long-chain fatty-acyl-CoA catabolic process(GO:0036116) palmitic acid metabolic process(GO:1900533) palmitic acid biosynthetic process(GO:1900535) |
| 0.2 | 0.7 | GO:0001544 | initiation of primordial ovarian follicle growth(GO:0001544) |
| 0.2 | 1.6 | GO:0018211 | protein C-linked glycosylation(GO:0018103) peptidyl-tryptophan modification(GO:0018211) protein C-linked glycosylation via tryptophan(GO:0018317) protein C-linked glycosylation via 2'-alpha-mannosyl-L-tryptophan(GO:0018406) |
| 0.2 | 0.9 | GO:0060734 | regulation of endoplasmic reticulum stress-induced eIF2 alpha phosphorylation(GO:0060734) |
| 0.2 | 0.7 | GO:0050976 | detection of mechanical stimulus involved in sensory perception of touch(GO:0050976) |
| 0.2 | 0.2 | GO:0031990 | mRNA export from nucleus in response to heat stress(GO:0031990) |
| 0.2 | 0.7 | GO:0046080 | dUTP metabolic process(GO:0046080) dUTP catabolic process(GO:0046081) |
| 0.2 | 0.9 | GO:2000681 | negative regulation of rubidium ion transport(GO:2000681) negative regulation of rubidium ion transmembrane transporter activity(GO:2000687) |
| 0.2 | 4.9 | GO:0040015 | negative regulation of multicellular organism growth(GO:0040015) |
| 0.2 | 0.6 | GO:0021538 | epithalamus development(GO:0021538) habenula development(GO:0021986) |
| 0.2 | 1.7 | GO:0038028 | insulin receptor signaling pathway via phosphatidylinositol 3-kinase(GO:0038028) |
| 0.2 | 0.9 | GO:0021592 | fourth ventricle development(GO:0021592) |
| 0.2 | 1.1 | GO:1904753 | negative regulation of vascular associated smooth muscle cell migration(GO:1904753) |
| 0.2 | 2.5 | GO:0045176 | apical protein localization(GO:0045176) |
| 0.2 | 1.1 | GO:0019075 | virus maturation(GO:0019075) |
| 0.2 | 2.3 | GO:2000795 | negative regulation of epithelial cell proliferation involved in lung morphogenesis(GO:2000795) |
| 0.2 | 0.6 | GO:0038033 | positive regulation of endothelial cell chemotaxis by VEGF-activated vascular endothelial growth factor receptor signaling pathway(GO:0038033) |
| 0.2 | 0.4 | GO:0009631 | cold acclimation(GO:0009631) |
| 0.2 | 0.2 | GO:0000720 | pyrimidine dimer repair by nucleotide-excision repair(GO:0000720) |
| 0.2 | 1.2 | GO:0044339 | canonical Wnt signaling pathway involved in osteoblast differentiation(GO:0044339) |
| 0.2 | 4.8 | GO:0060347 | heart trabecula formation(GO:0060347) |
| 0.2 | 1.4 | GO:0043461 | proton-transporting ATP synthase complex assembly(GO:0043461) proton-transporting ATP synthase complex biogenesis(GO:0070272) |
| 0.2 | 1.2 | GO:0016036 | cellular response to phosphate starvation(GO:0016036) positive regulation of sulfur amino acid metabolic process(GO:0031337) positive regulation of homocysteine metabolic process(GO:0050668) |
| 0.2 | 0.4 | GO:0036146 | cellular response to mycotoxin(GO:0036146) |
| 0.2 | 1.4 | GO:0097338 | response to clozapine(GO:0097338) |
| 0.2 | 0.4 | GO:0035928 | rRNA import into mitochondrion(GO:0035928) |
| 0.2 | 0.2 | GO:0006447 | regulation of translational initiation by iron(GO:0006447) |
| 0.2 | 0.6 | GO:0042779 | tRNA 3'-trailer cleavage, endonucleolytic(GO:0034414) tRNA 3'-trailer cleavage(GO:0042779) |
| 0.2 | 1.2 | GO:0033591 | response to L-ascorbic acid(GO:0033591) |
| 0.2 | 2.7 | GO:0000290 | deadenylation-dependent decapping of nuclear-transcribed mRNA(GO:0000290) |
| 0.2 | 0.2 | GO:0023021 | termination of signal transduction(GO:0023021) |
| 0.2 | 0.6 | GO:0018282 | metal incorporation into metallo-sulfur cluster(GO:0018282) iron incorporation into metallo-sulfur cluster(GO:0018283) |
| 0.2 | 0.6 | GO:2000342 | negative regulation of chemokine (C-X-C motif) ligand 2 production(GO:2000342) |
| 0.2 | 1.4 | GO:0045079 | negative regulation of chemokine biosynthetic process(GO:0045079) |
| 0.2 | 0.6 | GO:0097187 | dentinogenesis(GO:0097187) |
| 0.2 | 0.2 | GO:0045653 | negative regulation of megakaryocyte differentiation(GO:0045653) |
| 0.2 | 0.4 | GO:1903903 | regulation of establishment of T cell polarity(GO:1903903) |
| 0.2 | 1.0 | GO:0046963 | 3'-phosphoadenosine 5'-phosphosulfate transport(GO:0046963) 3'-phospho-5'-adenylyl sulfate transmembrane transport(GO:1902559) |
| 0.2 | 0.8 | GO:0070836 | caveola assembly(GO:0070836) |
| 0.2 | 0.4 | GO:0001916 | positive regulation of T cell mediated cytotoxicity(GO:0001916) |
| 0.2 | 1.3 | GO:0042539 | hypotonic salinity response(GO:0042539) cellular hypotonic salinity response(GO:0071477) |
| 0.2 | 0.9 | GO:0060282 | positive regulation of oocyte development(GO:0060282) |
| 0.2 | 0.9 | GO:0060355 | positive regulation of cell adhesion molecule production(GO:0060355) |
| 0.2 | 0.9 | GO:2001181 | positive regulation of interleukin-10 secretion(GO:2001181) |
| 0.2 | 0.7 | GO:0044210 | 'de novo' CTP biosynthetic process(GO:0044210) |
| 0.2 | 0.2 | GO:1900086 | positive regulation of peptidyl-tyrosine autophosphorylation(GO:1900086) |
| 0.2 | 0.4 | GO:0043000 | Golgi to plasma membrane CFTR protein transport(GO:0043000) |
| 0.2 | 1.3 | GO:0035739 | CD4-positive, alpha-beta T cell proliferation(GO:0035739) regulation of CD4-positive, alpha-beta T cell proliferation(GO:2000561) |
| 0.2 | 0.6 | GO:1902462 | regulation of mesenchymal stem cell proliferation(GO:1902460) positive regulation of mesenchymal stem cell proliferation(GO:1902462) |
| 0.2 | 0.2 | GO:0003343 | proepicardium development(GO:0003342) septum transversum development(GO:0003343) |
| 0.2 | 0.2 | GO:0036462 | TRAIL-activated apoptotic signaling pathway(GO:0036462) |
| 0.2 | 1.6 | GO:0006686 | sphingomyelin biosynthetic process(GO:0006686) |
| 0.2 | 2.0 | GO:0032525 | somite rostral/caudal axis specification(GO:0032525) |
| 0.2 | 0.2 | GO:1903337 | positive regulation of vacuolar transport(GO:1903337) |
| 0.2 | 0.7 | GO:0046356 | acetyl-CoA catabolic process(GO:0046356) |
| 0.2 | 0.7 | GO:1904849 | positive regulation of cell chemotaxis to fibroblast growth factor(GO:1904849) positive regulation of endothelial cell chemotaxis to fibroblast growth factor(GO:2000546) |
| 0.2 | 1.6 | GO:0045647 | negative regulation of erythrocyte differentiation(GO:0045647) |
| 0.2 | 0.5 | GO:0001579 | medium-chain fatty acid transport(GO:0001579) |
| 0.2 | 0.9 | GO:0006931 | substrate-dependent cell migration, cell attachment to substrate(GO:0006931) |
| 0.2 | 2.7 | GO:2000781 | positive regulation of double-strand break repair(GO:2000781) |
| 0.2 | 1.2 | GO:0007406 | negative regulation of neuroblast proliferation(GO:0007406) |
| 0.2 | 0.4 | GO:0002268 | follicular dendritic cell differentiation(GO:0002268) |
| 0.2 | 2.3 | GO:0010457 | centriole-centriole cohesion(GO:0010457) |
| 0.2 | 3.0 | GO:0045008 | depyrimidination(GO:0045008) |
| 0.2 | 0.7 | GO:0044805 | late nucleophagy(GO:0044805) |
| 0.2 | 0.7 | GO:0021965 | spinal cord ventral commissure morphogenesis(GO:0021965) |
| 0.2 | 0.2 | GO:0014718 | positive regulation of satellite cell activation involved in skeletal muscle regeneration(GO:0014718) |
| 0.2 | 0.7 | GO:1990834 | response to odorant(GO:1990834) |
| 0.2 | 0.7 | GO:1903243 | negative regulation of cardiac muscle adaptation(GO:0010616) negative regulation of cardiac muscle hypertrophy in response to stress(GO:1903243) |
| 0.2 | 0.3 | GO:1902512 | positive regulation of apoptotic DNA fragmentation(GO:1902512) |
| 0.2 | 1.0 | GO:0033490 | cholesterol biosynthetic process via desmosterol(GO:0033489) cholesterol biosynthetic process via lathosterol(GO:0033490) |
| 0.2 | 0.8 | GO:0097155 | fasciculation of sensory neuron axon(GO:0097155) |
| 0.2 | 0.3 | GO:1903301 | positive regulation of hexokinase activity(GO:1903301) |
| 0.2 | 0.5 | GO:0046110 | xanthine metabolic process(GO:0046110) |
| 0.2 | 0.7 | GO:1903232 | melanosome assembly(GO:1903232) |
| 0.2 | 0.5 | GO:1902309 | negative regulation of peptidyl-serine dephosphorylation(GO:1902309) |
| 0.2 | 0.8 | GO:1904491 | protein localization to ciliary transition zone(GO:1904491) |
| 0.2 | 0.5 | GO:2001153 | regulation of renal water transport(GO:2001151) positive regulation of renal water transport(GO:2001153) |
| 0.2 | 1.1 | GO:0060715 | syncytiotrophoblast cell differentiation involved in labyrinthine layer development(GO:0060715) |
| 0.2 | 0.5 | GO:0042270 | protection from natural killer cell mediated cytotoxicity(GO:0042270) |
| 0.2 | 0.8 | GO:0048745 | smooth muscle tissue development(GO:0048745) |
| 0.2 | 1.3 | GO:0002943 | tRNA dihydrouridine synthesis(GO:0002943) |
| 0.2 | 0.2 | GO:0051533 | positive regulation of NFAT protein import into nucleus(GO:0051533) |
| 0.2 | 0.8 | GO:0048170 | positive regulation of long-term neuronal synaptic plasticity(GO:0048170) |
| 0.2 | 1.0 | GO:0044791 | modulation by host of viral release from host cell(GO:0044789) positive regulation by host of viral release from host cell(GO:0044791) |
| 0.2 | 1.1 | GO:0034316 | negative regulation of Arp2/3 complex-mediated actin nucleation(GO:0034316) |
| 0.2 | 1.4 | GO:0031914 | negative regulation of synaptic plasticity(GO:0031914) |
| 0.2 | 0.6 | GO:0001927 | exocyst assembly(GO:0001927) |
| 0.2 | 1.0 | GO:0032713 | negative regulation of interleukin-4 production(GO:0032713) |
| 0.2 | 2.5 | GO:0015871 | choline transport(GO:0015871) |
| 0.2 | 0.5 | GO:1901491 | negative regulation of lymphangiogenesis(GO:1901491) |
| 0.2 | 0.3 | GO:1901421 | positive regulation of response to alcohol(GO:1901421) |
| 0.2 | 1.0 | GO:0036324 | vascular endothelial growth factor receptor-2 signaling pathway(GO:0036324) |
| 0.2 | 0.9 | GO:0015911 | plasma membrane long-chain fatty acid transport(GO:0015911) |
| 0.2 | 0.5 | GO:0042040 | molybdenum incorporation into molybdenum-molybdopterin complex(GO:0018315) metal incorporation into metallo-molybdopterin complex(GO:0042040) glycine receptor clustering(GO:0072579) |
| 0.2 | 0.3 | GO:0043382 | positive regulation of memory T cell differentiation(GO:0043382) |
| 0.2 | 1.4 | GO:2000286 | receptor internalization involved in canonical Wnt signaling pathway(GO:2000286) |
| 0.2 | 0.5 | GO:0015920 | lipopolysaccharide transport(GO:0015920) |
| 0.2 | 0.6 | GO:0060057 | apoptotic process involved in mammary gland involution(GO:0060057) positive regulation of apoptotic process involved in mammary gland involution(GO:0060058) positive regulation of apoptotic process involved in morphogenesis(GO:1902339) regulation of mammary gland involution(GO:1903519) positive regulation of mammary gland involution(GO:1903521) positive regulation of apoptotic process involved in development(GO:1904747) |
| 0.2 | 1.7 | GO:0030050 | vesicle transport along actin filament(GO:0030050) |
| 0.2 | 0.8 | GO:0032049 | phosphatidylglycerol biosynthetic process(GO:0006655) cardiolipin biosynthetic process(GO:0032049) |
| 0.2 | 0.3 | GO:0035494 | SNARE complex disassembly(GO:0035494) |
| 0.2 | 0.6 | GO:0000415 | negative regulation of histone H3-K36 methylation(GO:0000415) |
| 0.2 | 0.3 | GO:0021558 | oculomotor nerve development(GO:0021557) trochlear nerve development(GO:0021558) |
| 0.2 | 0.6 | GO:0038145 | macrophage colony-stimulating factor signaling pathway(GO:0038145) |
| 0.2 | 0.5 | GO:0042727 | flavin-containing compound biosynthetic process(GO:0042727) |
| 0.2 | 0.6 | GO:0060672 | epithelial cell differentiation involved in embryonic placenta development(GO:0060671) epithelial cell morphogenesis involved in placental branching(GO:0060672) |
| 0.2 | 0.8 | GO:0010814 | substance P catabolic process(GO:0010814) calcitonin catabolic process(GO:0010816) endothelin maturation(GO:0034959) |
| 0.2 | 0.5 | GO:1902202 | regulation of hepatocyte growth factor receptor signaling pathway(GO:1902202) |
| 0.2 | 2.9 | GO:0032495 | response to muramyl dipeptide(GO:0032495) |
| 0.2 | 2.3 | GO:0001778 | plasma membrane repair(GO:0001778) |
| 0.2 | 0.5 | GO:0034351 | regulation of glial cell apoptotic process(GO:0034350) negative regulation of glial cell apoptotic process(GO:0034351) |
| 0.2 | 0.6 | GO:0090076 | relaxation of skeletal muscle(GO:0090076) |
| 0.2 | 0.5 | GO:0006500 | N-terminal protein palmitoylation(GO:0006500) |
| 0.2 | 1.1 | GO:0007000 | nucleolus organization(GO:0007000) |
| 0.1 | 0.4 | GO:1903576 | response to L-arginine(GO:1903576) |
| 0.1 | 0.6 | GO:0019859 | pyrimidine nucleobase catabolic process(GO:0006208) thymine catabolic process(GO:0006210) thymine metabolic process(GO:0019859) |
| 0.1 | 0.4 | GO:0002528 | regulation of vascular permeability involved in acute inflammatory response(GO:0002528) |
| 0.1 | 0.9 | GO:0010732 | protein glutathionylation(GO:0010731) regulation of protein glutathionylation(GO:0010732) negative regulation of protein glutathionylation(GO:0010734) |
| 0.1 | 1.2 | GO:0010792 | DNA double-strand break processing involved in repair via single-strand annealing(GO:0010792) double-strand break repair via single-strand annealing(GO:0045002) |
| 0.1 | 0.9 | GO:2000158 | positive regulation of ubiquitin-specific protease activity(GO:2000158) |
| 0.1 | 0.4 | GO:0036510 | trimming of terminal mannose on C branch(GO:0036510) |
| 0.1 | 1.0 | GO:0045541 | negative regulation of cholesterol biosynthetic process(GO:0045541) negative regulation of cholesterol metabolic process(GO:0090206) |
| 0.1 | 0.4 | GO:1904438 | positive regulation of iron ion transport(GO:0034758) positive regulation of iron ion transmembrane transport(GO:0034761) regulation of iron ion import(GO:1900390) regulation of ferrous iron import into cell(GO:1903989) positive regulation of ferrous iron import into cell(GO:1903991) regulation of ferrous iron binding(GO:1904432) positive regulation of ferrous iron binding(GO:1904434) regulation of transferrin receptor binding(GO:1904435) positive regulation of transferrin receptor binding(GO:1904437) regulation of ferrous iron import across plasma membrane(GO:1904438) positive regulation of ferrous iron import across plasma membrane(GO:1904440) |
| 0.1 | 0.3 | GO:0045715 | negative regulation of low-density lipoprotein particle receptor biosynthetic process(GO:0045715) |
| 0.1 | 0.1 | GO:1900222 | negative regulation of beta-amyloid clearance(GO:1900222) |
| 0.1 | 0.9 | GO:0061302 | smooth muscle cell-matrix adhesion(GO:0061302) |
| 0.1 | 0.4 | GO:1902746 | regulation of lens fiber cell differentiation(GO:1902746) |
| 0.1 | 0.4 | GO:0036363 | transforming growth factor beta activation(GO:0036363) |
| 0.1 | 1.1 | GO:0031086 | nuclear-transcribed mRNA catabolic process, deadenylation-independent decay(GO:0031086) |
| 0.1 | 1.1 | GO:0051918 | negative regulation of fibrinolysis(GO:0051918) |
| 0.1 | 0.9 | GO:0034128 | negative regulation of MyD88-independent toll-like receptor signaling pathway(GO:0034128) |
| 0.1 | 1.0 | GO:0035726 | common myeloid progenitor cell proliferation(GO:0035726) |
| 0.1 | 0.4 | GO:0031959 | mineralocorticoid receptor signaling pathway(GO:0031959) |
| 0.1 | 0.7 | GO:0009082 | branched-chain amino acid biosynthetic process(GO:0009082) leucine biosynthetic process(GO:0009098) valine biosynthetic process(GO:0009099) |
| 0.1 | 0.4 | GO:1990169 | detoxification of copper ion(GO:0010273) stress response to copper ion(GO:1990169) |
| 0.1 | 0.4 | GO:1901073 | N-acetylglucosamine biosynthetic process(GO:0006045) glucosamine-containing compound biosynthetic process(GO:1901073) |
| 0.1 | 0.8 | GO:0019509 | L-methionine biosynthetic process from methylthioadenosine(GO:0019509) |
| 0.1 | 1.9 | GO:0061179 | negative regulation of insulin secretion involved in cellular response to glucose stimulus(GO:0061179) |
| 0.1 | 4.0 | GO:0035767 | endothelial cell chemotaxis(GO:0035767) |
| 0.1 | 0.1 | GO:0061441 | renal artery morphogenesis(GO:0061441) |
| 0.1 | 0.7 | GO:0006549 | isoleucine metabolic process(GO:0006549) |
| 0.1 | 0.5 | GO:1990108 | protein linear deubiquitination(GO:1990108) |
| 0.1 | 0.5 | GO:0009450 | gamma-aminobutyric acid catabolic process(GO:0009450) |
| 0.1 | 1.5 | GO:0006552 | leucine catabolic process(GO:0006552) |
| 0.1 | 0.1 | GO:1900110 | negative regulation of histone H3-K9 dimethylation(GO:1900110) |
| 0.1 | 0.7 | GO:0006404 | RNA import into nucleus(GO:0006404) |
| 0.1 | 0.8 | GO:2000418 | positive regulation of eosinophil migration(GO:2000418) |
| 0.1 | 0.8 | GO:0032237 | activation of store-operated calcium channel activity(GO:0032237) positive regulation of store-operated calcium channel activity(GO:1901341) |
| 0.1 | 2.4 | GO:0060044 | negative regulation of cardiac muscle cell proliferation(GO:0060044) |
| 0.1 | 1.1 | GO:0090625 | mRNA cleavage involved in gene silencing by siRNA(GO:0090625) |
| 0.1 | 0.4 | GO:0044778 | meiotic DNA integrity checkpoint(GO:0044778) |
| 0.1 | 0.3 | GO:1902174 | positive regulation of keratinocyte apoptotic process(GO:1902174) |
| 0.1 | 0.4 | GO:0009720 | detection of hormone stimulus(GO:0009720) |
| 0.1 | 0.5 | GO:0050703 | interleukin-1 alpha secretion(GO:0050703) |
| 0.1 | 1.7 | GO:0090168 | Golgi reassembly(GO:0090168) |
| 0.1 | 0.5 | GO:0014736 | negative regulation of muscle atrophy(GO:0014736) |
| 0.1 | 3.2 | GO:0016254 | preassembly of GPI anchor in ER membrane(GO:0016254) |
| 0.1 | 1.1 | GO:0035879 | plasma membrane lactate transport(GO:0035879) |
| 0.1 | 0.3 | GO:1902525 | regulation of protein monoubiquitination(GO:1902525) |
| 0.1 | 0.4 | GO:0070124 | mitochondrial translational initiation(GO:0070124) |
| 0.1 | 1.4 | GO:0048251 | elastic fiber assembly(GO:0048251) |
| 0.1 | 1.7 | GO:0051601 | exocyst localization(GO:0051601) |
| 0.1 | 0.4 | GO:1903939 | regulation of TORC2 signaling(GO:1903939) |
| 0.1 | 0.5 | GO:0009447 | putrescine catabolic process(GO:0009447) |
| 0.1 | 0.5 | GO:0090191 | negative regulation of branching involved in ureteric bud morphogenesis(GO:0090191) |
| 0.1 | 0.4 | GO:0050760 | negative regulation of thymidylate synthase biosynthetic process(GO:0050760) |
| 0.1 | 0.3 | GO:0070842 | aggresome assembly(GO:0070842) |
| 0.1 | 0.5 | GO:0060741 | prostate gland stromal morphogenesis(GO:0060741) |
| 0.1 | 0.6 | GO:0006574 | valine metabolic process(GO:0006573) valine catabolic process(GO:0006574) |
| 0.1 | 0.5 | GO:1904978 | regulation of endosome organization(GO:1904978) |
| 0.1 | 0.1 | GO:0007113 | endomitotic cell cycle(GO:0007113) |
| 0.1 | 0.4 | GO:1903595 | positive regulation of histamine secretion by mast cell(GO:1903595) |
| 0.1 | 0.3 | GO:0097252 | oligodendrocyte apoptotic process(GO:0097252) |
| 0.1 | 0.9 | GO:0035166 | post-embryonic hemopoiesis(GO:0035166) |
| 0.1 | 0.8 | GO:0044332 | Wnt signaling pathway involved in dorsal/ventral axis specification(GO:0044332) |
| 0.1 | 1.0 | GO:0045329 | carnitine biosynthetic process(GO:0045329) |
| 0.1 | 1.8 | GO:0044351 | macropinocytosis(GO:0044351) |
| 0.1 | 1.7 | GO:0048845 | venous blood vessel morphogenesis(GO:0048845) |
| 0.1 | 0.3 | GO:2001200 | positive regulation of dendritic cell differentiation(GO:2001200) |
| 0.1 | 0.1 | GO:0021539 | subthalamus development(GO:0021539) |
| 0.1 | 0.4 | GO:0019287 | isopentenyl diphosphate biosynthetic process, mevalonate pathway(GO:0019287) |
| 0.1 | 0.8 | GO:0030205 | dermatan sulfate metabolic process(GO:0030205) |
| 0.1 | 0.8 | GO:0090116 | C-5 methylation of cytosine(GO:0090116) |
| 0.1 | 0.1 | GO:0032902 | nerve growth factor production(GO:0032902) |
| 0.1 | 0.6 | GO:0060754 | positive regulation of mast cell chemotaxis(GO:0060754) |
| 0.1 | 0.4 | GO:0042357 | thiamine diphosphate metabolic process(GO:0042357) |
| 0.1 | 0.4 | GO:0046338 | phosphatidylethanolamine catabolic process(GO:0046338) |
| 0.1 | 0.8 | GO:2000468 | negative regulation of catecholamine metabolic process(GO:0045914) negative regulation of dopamine metabolic process(GO:0045963) negative regulation of dopamine uptake involved in synaptic transmission(GO:0051585) norepinephrine uptake(GO:0051620) regulation of norepinephrine uptake(GO:0051621) negative regulation of norepinephrine uptake(GO:0051622) negative regulation of catecholamine uptake involved in synaptic transmission(GO:0051945) regulation of glutathione peroxidase activity(GO:1903282) positive regulation of glutathione peroxidase activity(GO:1903284) positive regulation of hydrogen peroxide catabolic process(GO:1903285) regulation of peroxidase activity(GO:2000468) positive regulation of peroxidase activity(GO:2000470) |
| 0.1 | 0.8 | GO:0002318 | myeloid progenitor cell differentiation(GO:0002318) |
| 0.1 | 1.2 | GO:0034138 | toll-like receptor 3 signaling pathway(GO:0034138) |
| 0.1 | 1.4 | GO:0048386 | positive regulation of retinoic acid receptor signaling pathway(GO:0048386) |
| 0.1 | 0.5 | GO:0070495 | regulation of thrombin receptor signaling pathway(GO:0070494) negative regulation of thrombin receptor signaling pathway(GO:0070495) |
| 0.1 | 0.6 | GO:1901503 | ether lipid biosynthetic process(GO:0008611) glycerol ether biosynthetic process(GO:0046504) ether biosynthetic process(GO:1901503) |
| 0.1 | 1.1 | GO:0033234 | negative regulation of protein sumoylation(GO:0033234) |
| 0.1 | 0.4 | GO:0044240 | multicellular organism lipid catabolic process(GO:0044240) |
| 0.1 | 0.2 | GO:0061687 | detoxification of inorganic compound(GO:0061687) |
| 0.1 | 1.2 | GO:0036444 | calcium ion transmembrane import into mitochondrion(GO:0036444) |
| 0.1 | 1.9 | GO:0035269 | protein O-linked mannosylation(GO:0035269) |
| 0.1 | 0.6 | GO:0032417 | positive regulation of sodium:proton antiporter activity(GO:0032417) |
| 0.1 | 1.2 | GO:0042492 | gamma-delta T cell differentiation(GO:0042492) |
| 0.1 | 0.2 | GO:1905071 | occluding junction disassembly(GO:1905071) regulation of occluding junction disassembly(GO:1905073) positive regulation of occluding junction disassembly(GO:1905075) |
| 0.1 | 0.4 | GO:0034769 | basement membrane disassembly(GO:0034769) |
| 0.1 | 1.3 | GO:1990403 | embryonic brain development(GO:1990403) |
| 0.1 | 1.0 | GO:0090336 | positive regulation of brown fat cell differentiation(GO:0090336) |
| 0.1 | 1.0 | GO:1900028 | negative regulation of ruffle assembly(GO:1900028) |
| 0.1 | 2.3 | GO:1904261 | regulation of basement membrane assembly involved in embryonic body morphogenesis(GO:1904259) positive regulation of basement membrane assembly involved in embryonic body morphogenesis(GO:1904261) basement membrane assembly involved in embryonic body morphogenesis(GO:2001197) |
| 0.1 | 0.9 | GO:0061469 | regulation of type B pancreatic cell proliferation(GO:0061469) |
| 0.1 | 1.0 | GO:1902969 | mitotic DNA replication(GO:1902969) |
| 0.1 | 0.4 | GO:1901874 | negative regulation of post-translational protein modification(GO:1901874) |
| 0.1 | 0.6 | GO:2000535 | regulation of entry of bacterium into host cell(GO:2000535) |
| 0.1 | 1.0 | GO:0034773 | histone H4-K20 trimethylation(GO:0034773) |
| 0.1 | 1.1 | GO:0032482 | Rab protein signal transduction(GO:0032482) |
| 0.1 | 0.1 | GO:0032290 | peripheral nervous system myelin formation(GO:0032290) |
| 0.1 | 2.2 | GO:0009313 | oligosaccharide catabolic process(GO:0009313) |
| 0.1 | 0.2 | GO:1902953 | positive regulation of ER to Golgi vesicle-mediated transport(GO:1902953) |
| 0.1 | 0.1 | GO:0099590 | neurotransmitter receptor internalization(GO:0099590) |
| 0.1 | 0.4 | GO:0051710 | regulation of cytolysis in other organism(GO:0051710) positive regulation of cytolysis in other organism(GO:0051714) |
| 0.1 | 0.2 | GO:2000834 | androgen secretion(GO:0035935) regulation of androgen secretion(GO:2000834) positive regulation of androgen secretion(GO:2000836) |
| 0.1 | 0.5 | GO:0008215 | spermine metabolic process(GO:0008215) |
| 0.1 | 1.2 | GO:0008063 | Toll signaling pathway(GO:0008063) |
| 0.1 | 0.6 | GO:1901202 | negative regulation of extracellular matrix assembly(GO:1901202) |
| 0.1 | 0.4 | GO:0007518 | myoblast fate determination(GO:0007518) |
| 0.1 | 1.1 | GO:0048245 | eosinophil chemotaxis(GO:0048245) |
| 0.1 | 0.5 | GO:0032286 | central nervous system myelin maintenance(GO:0032286) |
| 0.1 | 0.5 | GO:0051410 | detoxification of nitrogen compound(GO:0051410) cellular detoxification of nitrogen compound(GO:0070458) |
| 0.1 | 2.0 | GO:0030043 | actin filament fragmentation(GO:0030043) |
| 0.1 | 0.2 | GO:1903826 | arginine transmembrane transport(GO:1903826) |
| 0.1 | 0.2 | GO:1905051 | regulation of base-excision repair(GO:1905051) positive regulation of base-excision repair(GO:1905053) |
| 0.1 | 0.5 | GO:0000821 | regulation of arginine metabolic process(GO:0000821) |
| 0.1 | 1.9 | GO:0036150 | phosphatidylserine acyl-chain remodeling(GO:0036150) |
| 0.1 | 0.6 | GO:0072385 | minus-end-directed organelle transport along microtubule(GO:0072385) |
| 0.1 | 6.1 | GO:0033173 | calcineurin-NFAT signaling cascade(GO:0033173) |
| 0.1 | 0.2 | GO:0035509 | negative regulation of myosin-light-chain-phosphatase activity(GO:0035509) |
| 0.1 | 0.1 | GO:0010609 | mRNA localization resulting in posttranscriptional regulation of gene expression(GO:0010609) |
| 0.1 | 0.5 | GO:1903070 | negative regulation of ER-associated ubiquitin-dependent protein catabolic process(GO:1903070) |
| 0.1 | 0.3 | GO:0006679 | glucosylceramide biosynthetic process(GO:0006679) |
| 0.1 | 0.5 | GO:0018125 | peptidyl-cysteine methylation(GO:0018125) |
| 0.1 | 0.3 | GO:0000710 | meiotic mismatch repair(GO:0000710) |
| 0.1 | 1.4 | GO:0035413 | positive regulation of catenin import into nucleus(GO:0035413) |
| 0.1 | 0.1 | GO:0090118 | receptor-mediated endocytosis of low-density lipoprotein particle involved in cholesterol transport(GO:0090118) |
| 0.1 | 0.3 | GO:0071963 | establishment or maintenance of cell polarity regulating cell shape(GO:0071963) |
| 0.1 | 0.7 | GO:0070424 | regulation of nucleotide-binding oligomerization domain containing signaling pathway(GO:0070424) |
| 0.1 | 0.2 | GO:0010593 | negative regulation of lamellipodium assembly(GO:0010593) negative regulation of lamellipodium organization(GO:1902744) |
| 0.1 | 0.3 | GO:0032639 | TRAIL production(GO:0032639) regulation of TRAIL production(GO:0032679) positive regulation of TRAIL production(GO:0032759) TRAIL biosynthetic process(GO:0045553) regulation of TRAIL biosynthetic process(GO:0045554) positive regulation of TRAIL biosynthetic process(GO:0045556) |
| 0.1 | 0.3 | GO:1901253 | negative regulation of intracellular transport of viral material(GO:1901253) |
| 0.1 | 0.2 | GO:0032455 | nerve growth factor processing(GO:0032455) |
| 0.1 | 0.3 | GO:0010520 | regulation of reciprocal meiotic recombination(GO:0010520) |
| 0.1 | 0.6 | GO:0018076 | N-terminal peptidyl-lysine acetylation(GO:0018076) |
| 0.1 | 0.3 | GO:0060166 | olfactory pit development(GO:0060166) |
| 0.1 | 0.9 | GO:2001137 | positive regulation of endocytic recycling(GO:2001137) |
| 0.1 | 0.1 | GO:0098905 | regulation of bundle of His cell action potential(GO:0098905) |
| 0.1 | 0.6 | GO:0046629 | gamma-delta T cell activation(GO:0046629) |
| 0.1 | 0.9 | GO:0060574 | intestinal epithelial cell maturation(GO:0060574) |
| 0.1 | 0.6 | GO:0018243 | protein O-linked glycosylation via threonine(GO:0018243) |
| 0.1 | 0.1 | GO:0021555 | midbrain-hindbrain boundary morphogenesis(GO:0021555) |
| 0.1 | 0.7 | GO:0075071 | autophagy of host cells involved in interaction with symbiont(GO:0075044) autophagy involved in symbiotic interaction(GO:0075071) |
| 0.1 | 1.1 | GO:0098967 | exocytic insertion of neurotransmitter receptor to plasma membrane(GO:0098881) exocytic insertion of neurotransmitter receptor to postsynaptic membrane(GO:0098967) |
| 0.1 | 0.4 | GO:0032916 | positive regulation of transforming growth factor beta3 production(GO:0032916) |
| 0.1 | 3.2 | GO:0090023 | positive regulation of neutrophil chemotaxis(GO:0090023) |
| 0.1 | 0.2 | GO:0002302 | CD8-positive, alpha-beta T cell differentiation involved in immune response(GO:0002302) |
| 0.1 | 0.3 | GO:0043988 | histone H3-S28 phosphorylation(GO:0043988) |
| 0.1 | 0.3 | GO:1901053 | sarcosine metabolic process(GO:1901052) sarcosine catabolic process(GO:1901053) |
| 0.1 | 1.5 | GO:0046831 | regulation of RNA export from nucleus(GO:0046831) |
| 0.1 | 2.3 | GO:0006012 | galactose metabolic process(GO:0006012) |
| 0.1 | 3.4 | GO:0090083 | regulation of inclusion body assembly(GO:0090083) |
| 0.1 | 0.4 | GO:0032487 | regulation of Rap protein signal transduction(GO:0032487) |
| 0.1 | 0.6 | GO:0097327 | response to antineoplastic agent(GO:0097327) |
| 0.1 | 0.3 | GO:1903378 | positive regulation of oxidative stress-induced neuron intrinsic apoptotic signaling pathway(GO:1903378) |
| 0.1 | 0.3 | GO:0070358 | actin polymerization-dependent cell motility(GO:0070358) |
| 0.1 | 1.0 | GO:1900119 | positive regulation of execution phase of apoptosis(GO:1900119) |
| 0.1 | 1.9 | GO:0014850 | response to muscle activity(GO:0014850) |
| 0.1 | 1.3 | GO:0015074 | DNA integration(GO:0015074) |
| 0.1 | 0.1 | GO:0021644 | vagus nerve morphogenesis(GO:0021644) |
| 0.1 | 0.4 | GO:0097045 | phosphatidylserine exposure on blood platelet(GO:0097045) |
| 0.1 | 1.2 | GO:0071318 | cellular response to ATP(GO:0071318) |
| 0.1 | 0.7 | GO:0008354 | germ cell migration(GO:0008354) |
| 0.1 | 0.5 | GO:0048630 | skeletal muscle tissue growth(GO:0048630) |
| 0.1 | 0.7 | GO:0006432 | phenylalanyl-tRNA aminoacylation(GO:0006432) |
| 0.1 | 0.3 | GO:0045829 | negative regulation of isotype switching(GO:0045829) |
| 0.1 | 0.8 | GO:0035897 | proteolysis in other organism(GO:0035897) |
| 0.1 | 0.4 | GO:0035750 | protein localization to myelin sheath abaxonal region(GO:0035750) |
| 0.1 | 0.2 | GO:0070245 | positive regulation of thymocyte apoptotic process(GO:0070245) |
| 0.1 | 0.3 | GO:0060392 | negative regulation of SMAD protein import into nucleus(GO:0060392) |
| 0.1 | 0.3 | GO:1900226 | negative regulation of NLRP3 inflammasome complex assembly(GO:1900226) |
| 0.1 | 0.3 | GO:0097350 | neutrophil clearance(GO:0097350) |
| 0.1 | 0.4 | GO:0015772 | disaccharide transport(GO:0015766) sucrose transport(GO:0015770) oligosaccharide transport(GO:0015772) |
| 0.1 | 0.2 | GO:0045348 | positive regulation of MHC class II biosynthetic process(GO:0045348) |
| 0.1 | 0.1 | GO:0072003 | kidney rudiment formation(GO:0072003) |
| 0.1 | 0.4 | GO:0051541 | elastin metabolic process(GO:0051541) |
| 0.1 | 0.1 | GO:0010735 | positive regulation of transcription via serum response element binding(GO:0010735) |
| 0.1 | 1.1 | GO:0042985 | negative regulation of amyloid precursor protein biosynthetic process(GO:0042985) |
| 0.1 | 2.2 | GO:0007183 | SMAD protein complex assembly(GO:0007183) |
| 0.1 | 1.0 | GO:0033210 | leptin-mediated signaling pathway(GO:0033210) |
| 0.1 | 0.1 | GO:0044205 | 'de novo' UMP biosynthetic process(GO:0044205) |
| 0.1 | 0.8 | GO:0019377 | glycolipid catabolic process(GO:0019377) |
| 0.1 | 0.7 | GO:0070537 | histone H2A K63-linked deubiquitination(GO:0070537) |
| 0.1 | 0.9 | GO:0048625 | myoblast fate commitment(GO:0048625) |
| 0.1 | 0.2 | GO:0045819 | positive regulation of glycogen catabolic process(GO:0045819) |
| 0.1 | 0.4 | GO:0052651 | monoacylglycerol metabolic process(GO:0046462) monoacylglycerol catabolic process(GO:0052651) |
| 0.1 | 0.8 | GO:0015014 | heparan sulfate proteoglycan biosynthetic process, polysaccharide chain biosynthetic process(GO:0015014) |
| 0.1 | 0.4 | GO:0051167 | glucuronate catabolic process(GO:0006064) glucuronate catabolic process to xylulose 5-phosphate(GO:0019640) xylulose 5-phosphate metabolic process(GO:0051167) xylulose 5-phosphate biosynthetic process(GO:1901159) |
| 0.1 | 0.5 | GO:1901350 | cell-cell signaling involved in cell-cell junction organization(GO:1901350) |
| 0.1 | 2.9 | GO:1901685 | glutathione derivative metabolic process(GO:1901685) glutathione derivative biosynthetic process(GO:1901687) |
| 0.1 | 1.5 | GO:0045078 | positive regulation of interferon-gamma biosynthetic process(GO:0045078) |
| 0.1 | 2.3 | GO:0072189 | ureter development(GO:0072189) |
| 0.1 | 0.9 | GO:0000395 | mRNA 5'-splice site recognition(GO:0000395) |
| 0.1 | 0.3 | GO:0060033 | anatomical structure regression(GO:0060033) |
| 0.1 | 1.3 | GO:0006975 | DNA damage induced protein phosphorylation(GO:0006975) |
| 0.1 | 0.7 | GO:0006729 | tetrahydrobiopterin biosynthetic process(GO:0006729) tetrahydrobiopterin metabolic process(GO:0046146) |
| 0.1 | 0.3 | GO:0000103 | sulfate assimilation(GO:0000103) |
| 0.1 | 0.5 | GO:0014004 | microglia differentiation(GO:0014004) microglia development(GO:0014005) |
| 0.1 | 0.5 | GO:0006788 | heme oxidation(GO:0006788) |
| 0.1 | 0.4 | GO:0031296 | B cell costimulation(GO:0031296) |
| 0.1 | 0.9 | GO:0044800 | fusion of virus membrane with host plasma membrane(GO:0019064) membrane fusion involved in viral entry into host cell(GO:0039663) multi-organism membrane fusion(GO:0044800) |
| 0.1 | 1.2 | GO:0046007 | negative regulation of activated T cell proliferation(GO:0046007) |
| 0.1 | 0.5 | GO:0071557 | histone H3-K27 demethylation(GO:0071557) |
| 0.1 | 1.6 | GO:0033235 | positive regulation of protein sumoylation(GO:0033235) |
| 0.1 | 0.4 | GO:0019348 | dolichol metabolic process(GO:0019348) |
| 0.1 | 0.7 | GO:0030421 | defecation(GO:0030421) |
| 0.1 | 1.8 | GO:0032926 | negative regulation of activin receptor signaling pathway(GO:0032926) |
| 0.1 | 0.4 | GO:2001106 | regulation of Rho guanyl-nucleotide exchange factor activity(GO:2001106) |
| 0.1 | 0.3 | GO:0050992 | dimethylallyl diphosphate biosynthetic process(GO:0050992) dimethylallyl diphosphate metabolic process(GO:0050993) |
| 0.1 | 0.6 | GO:0048739 | cardiac muscle fiber development(GO:0048739) |
| 0.1 | 0.7 | GO:0016584 | nucleosome positioning(GO:0016584) |
| 0.1 | 0.4 | GO:1902775 | mitochondrial large ribosomal subunit assembly(GO:1902775) |
| 0.1 | 0.6 | GO:0097384 | ergosterol biosynthetic process(GO:0006696) ergosterol metabolic process(GO:0008204) cellular lipid biosynthetic process(GO:0097384) |
| 0.1 | 0.3 | GO:0044725 | chromatin reprogramming in the zygote(GO:0044725) |
| 0.1 | 0.3 | GO:0090187 | positive regulation of pancreatic juice secretion(GO:0090187) |
| 0.1 | 0.2 | GO:0033563 | dorsal/ventral axon guidance(GO:0033563) |
| 0.1 | 1.0 | GO:0060390 | regulation of SMAD protein import into nucleus(GO:0060390) |
| 0.1 | 1.7 | GO:0051770 | positive regulation of nitric-oxide synthase biosynthetic process(GO:0051770) |
| 0.1 | 0.3 | GO:0070682 | proteasome regulatory particle assembly(GO:0070682) |
| 0.1 | 0.3 | GO:0006120 | mitochondrial electron transport, NADH to ubiquinone(GO:0006120) |
| 0.1 | 0.6 | GO:1900425 | negative regulation of defense response to bacterium(GO:1900425) |
| 0.1 | 0.5 | GO:1903385 | regulation of homophilic cell adhesion(GO:1903385) |
| 0.1 | 0.3 | GO:0033037 | polysaccharide localization(GO:0033037) |
| 0.1 | 0.4 | GO:0070574 | cadmium ion transport(GO:0015691) cadmium ion transmembrane transport(GO:0070574) |
| 0.1 | 0.5 | GO:1990262 | regulation of anti-Mullerian hormone signaling pathway(GO:1902612) negative regulation of anti-Mullerian hormone signaling pathway(GO:1902613) anti-Mullerian hormone signaling pathway(GO:1990262) |
| 0.1 | 0.7 | GO:1900016 | negative regulation of cytokine production involved in inflammatory response(GO:1900016) |
| 0.1 | 0.2 | GO:0061643 | chemorepulsion of axon(GO:0061643) |
| 0.1 | 0.2 | GO:0061051 | positive regulation of cell growth involved in cardiac muscle cell development(GO:0061051) |
| 0.1 | 0.8 | GO:0006627 | protein processing involved in protein targeting to mitochondrion(GO:0006627) |
| 0.1 | 0.4 | GO:1905146 | lysosomal protein catabolic process(GO:1905146) |
| 0.1 | 0.2 | GO:0086021 | SA node cell to atrial cardiac muscle cell communication by electrical coupling(GO:0086021) |
| 0.1 | 0.2 | GO:0048254 | snoRNA localization(GO:0048254) |
| 0.1 | 0.4 | GO:0098957 | anterograde axonal transport of mitochondrion(GO:0098957) |
| 0.1 | 0.4 | GO:0051987 | positive regulation of attachment of spindle microtubules to kinetochore(GO:0051987) |
| 0.1 | 0.6 | GO:1904627 | response to phorbol 13-acetate 12-myristate(GO:1904627) cellular response to phorbol 13-acetate 12-myristate(GO:1904628) |
| 0.1 | 0.3 | GO:0032776 | DNA methylation on cytosine(GO:0032776) |
| 0.1 | 0.1 | GO:0021842 | directional guidance of interneurons involved in migration from the subpallium to the cortex(GO:0021840) chemorepulsion involved in interneuron migration from the subpallium to the cortex(GO:0021842) |
| 0.1 | 0.7 | GO:0003185 | primary heart field specification(GO:0003138) sinoatrial valve development(GO:0003172) sinoatrial valve morphogenesis(GO:0003185) |
| 0.1 | 0.3 | GO:1902445 | regulation of mitochondrial membrane permeability involved in programmed necrotic cell death(GO:1902445) |
| 0.1 | 0.5 | GO:0060370 | susceptibility to T cell mediated cytotoxicity(GO:0060370) |
| 0.1 | 0.6 | GO:0038165 | oncostatin-M-mediated signaling pathway(GO:0038165) |
| 0.1 | 0.3 | GO:0061182 | negative regulation of chondrocyte development(GO:0061182) |
| 0.1 | 1.6 | GO:0051044 | positive regulation of membrane protein ectodomain proteolysis(GO:0051044) |
| 0.1 | 1.5 | GO:0032688 | negative regulation of interferon-beta production(GO:0032688) |
| 0.1 | 0.7 | GO:1904263 | positive regulation of TORC1 signaling(GO:1904263) |
| 0.1 | 0.6 | GO:0033227 | dsRNA transport(GO:0033227) |
| 0.1 | 0.3 | GO:0090154 | positive regulation of sphingolipid biosynthetic process(GO:0090154) positive regulation of ceramide biosynthetic process(GO:2000304) |
| 0.1 | 0.1 | GO:0097374 | sensory neuron axon guidance(GO:0097374) |
| 0.1 | 0.3 | GO:0010133 | proline catabolic process to glutamate(GO:0010133) |
| 0.1 | 0.5 | GO:0006348 | chromatin silencing at telomere(GO:0006348) |
| 0.1 | 0.3 | GO:1900153 | regulation of nuclear-transcribed mRNA catabolic process, deadenylation-dependent decay(GO:1900151) positive regulation of nuclear-transcribed mRNA catabolic process, deadenylation-dependent decay(GO:1900153) |
| 0.1 | 0.3 | GO:1904732 | regulation of electron carrier activity(GO:1904732) |
| 0.1 | 0.3 | GO:0036111 | very long-chain fatty-acyl-CoA metabolic process(GO:0036111) |
| 0.1 | 0.4 | GO:0044794 | positive regulation by host of viral process(GO:0044794) |
| 0.1 | 0.1 | GO:1904528 | regulation of microtubule plus-end binding(GO:1903031) positive regulation of microtubule plus-end binding(GO:1903033) positive regulation of microtubule binding(GO:1904528) |
| 0.1 | 0.5 | GO:0070940 | dephosphorylation of RNA polymerase II C-terminal domain(GO:0070940) |
| 0.1 | 0.1 | GO:0044335 | canonical Wnt signaling pathway involved in neural crest cell differentiation(GO:0044335) |
| 0.1 | 8.0 | GO:0097031 | NADH dehydrogenase complex assembly(GO:0010257) mitochondrial respiratory chain complex I assembly(GO:0032981) mitochondrial respiratory chain complex I biogenesis(GO:0097031) |
| 0.1 | 0.1 | GO:2000393 | negative regulation of lamellipodium morphogenesis(GO:2000393) |
| 0.1 | 1.8 | GO:0070314 | G1 to G0 transition(GO:0070314) |
| 0.1 | 0.2 | GO:0060268 | negative regulation of respiratory burst(GO:0060268) |
| 0.1 | 0.3 | GO:0038195 | urokinase plasminogen activator signaling pathway(GO:0038195) |
| 0.1 | 0.6 | GO:0030949 | positive regulation of vascular endothelial growth factor receptor signaling pathway(GO:0030949) |
| 0.1 | 0.4 | GO:0050847 | progesterone receptor signaling pathway(GO:0050847) |
| 0.1 | 0.2 | GO:1905049 | negative regulation of metallopeptidase activity(GO:1905049) |
| 0.1 | 0.4 | GO:2000672 | negative regulation of motor neuron apoptotic process(GO:2000672) |
| 0.1 | 0.3 | GO:1990523 | bone regeneration(GO:1990523) |
| 0.1 | 0.8 | GO:1901223 | negative regulation of NIK/NF-kappaB signaling(GO:1901223) |
| 0.1 | 0.2 | GO:0035425 | autocrine signaling(GO:0035425) |
| 0.1 | 0.4 | GO:1903566 | positive regulation of protein localization to cilium(GO:1903566) |
| 0.1 | 0.2 | GO:0000189 | MAPK import into nucleus(GO:0000189) regulation of Golgi inheritance(GO:0090170) |
| 0.1 | 0.7 | GO:0044362 | modulation of molecular function in other organism(GO:0044359) negative regulation of molecular function in other organism(GO:0044362) negative regulation of molecular function in other organism involved in symbiotic interaction(GO:0052204) modulation of molecular function in other organism involved in symbiotic interaction(GO:0052205) negative regulation by host of symbiont molecular function(GO:0052405) modification by host of symbiont molecular function(GO:0052428) |
| 0.1 | 0.1 | GO:0052173 | response to defenses of other organism involved in symbiotic interaction(GO:0052173) response to host defenses(GO:0052200) response to host(GO:0075136) |
| 0.1 | 1.6 | GO:0033540 | fatty acid beta-oxidation using acyl-CoA oxidase(GO:0033540) |
| 0.1 | 0.3 | GO:0009177 | dTMP biosynthetic process(GO:0006231) pyrimidine deoxyribonucleoside monophosphate biosynthetic process(GO:0009177) dTMP metabolic process(GO:0046073) |
| 0.1 | 1.5 | GO:0007021 | tubulin complex assembly(GO:0007021) |
| 0.1 | 1.0 | GO:0003179 | heart valve morphogenesis(GO:0003179) |
| 0.1 | 0.3 | GO:0007228 | positive regulation of hh target transcription factor activity(GO:0007228) |
| 0.1 | 0.3 | GO:0070904 | L-ascorbic acid transport(GO:0015882) transepithelial L-ascorbic acid transport(GO:0070904) |
| 0.1 | 0.7 | GO:0071763 | nuclear membrane organization(GO:0071763) |
| 0.1 | 0.8 | GO:2000601 | positive regulation of Arp2/3 complex-mediated actin nucleation(GO:2000601) |
| 0.1 | 0.1 | GO:0090269 | fibroblast growth factor production(GO:0090269) regulation of fibroblast growth factor production(GO:0090270) |
| 0.1 | 0.4 | GO:0015862 | uridine transport(GO:0015862) |
| 0.1 | 0.3 | GO:0002415 | immunoglobulin transcytosis in epithelial cells mediated by polymeric immunoglobulin receptor(GO:0002415) |
| 0.1 | 0.2 | GO:0048861 | leukemia inhibitory factor signaling pathway(GO:0048861) |
| 0.1 | 1.2 | GO:0016322 | neuron remodeling(GO:0016322) |
| 0.1 | 1.9 | GO:0046341 | CDP-diacylglycerol metabolic process(GO:0046341) |
| 0.1 | 1.2 | GO:1904424 | regulation of GTP binding(GO:1904424) |
| 0.1 | 0.3 | GO:1900736 | regulation of phospholipase C-activating G-protein coupled receptor signaling pathway(GO:1900736) |
| 0.1 | 0.3 | GO:0060644 | mammary gland epithelial cell differentiation(GO:0060644) |
| 0.1 | 0.1 | GO:0061056 | sclerotome development(GO:0061056) |
| 0.1 | 0.7 | GO:0090043 | regulation of tubulin deacetylation(GO:0090043) |
| 0.1 | 0.3 | GO:0006121 | mitochondrial electron transport, succinate to ubiquinone(GO:0006121) |
| 0.1 | 1.4 | GO:0036149 | phosphatidylinositol acyl-chain remodeling(GO:0036149) |
| 0.1 | 0.8 | GO:0043568 | positive regulation of insulin-like growth factor receptor signaling pathway(GO:0043568) |
| 0.1 | 0.3 | GO:0072695 | negative regulation of DNA recombination at telomere(GO:0048239) regulation of DNA recombination at telomere(GO:0072695) |
| 0.1 | 0.4 | GO:0071787 | endoplasmic reticulum tubular network assembly(GO:0071787) |
| 0.1 | 2.3 | GO:0042104 | positive regulation of activated T cell proliferation(GO:0042104) |
| 0.1 | 1.7 | GO:0097067 | cellular response to thyroid hormone stimulus(GO:0097067) |
| 0.1 | 0.5 | GO:0015853 | adenine transport(GO:0015853) |
| 0.1 | 0.3 | GO:1903490 | regulation of cytokinetic process(GO:0032954) regulation of mitotic cytokinetic process(GO:1903436) positive regulation of mitotic cytokinetic process(GO:1903438) positive regulation of mitotic cytokinesis(GO:1903490) |
| 0.1 | 0.3 | GO:2000271 | positive regulation of fibroblast apoptotic process(GO:2000271) |
| 0.1 | 1.5 | GO:0035024 | negative regulation of Rho protein signal transduction(GO:0035024) |
| 0.1 | 1.0 | GO:0009081 | branched-chain amino acid metabolic process(GO:0009081) branched-chain amino acid catabolic process(GO:0009083) |
| 0.1 | 1.4 | GO:0051256 | mitotic spindle midzone assembly(GO:0051256) |
| 0.1 | 0.1 | GO:0006668 | sphinganine-1-phosphate metabolic process(GO:0006668) |
| 0.1 | 0.3 | GO:0010760 | negative regulation of macrophage chemotaxis(GO:0010760) |
| 0.1 | 0.3 | GO:0090045 | positive regulation of deacetylase activity(GO:0090045) |
| 0.1 | 0.2 | GO:2001168 | regulation of histone H2B ubiquitination(GO:2001166) positive regulation of histone H2B ubiquitination(GO:2001168) |
| 0.1 | 0.1 | GO:0019918 | peptidyl-arginine methylation, to symmetrical-dimethyl arginine(GO:0019918) |
| 0.1 | 0.5 | GO:0000973 | posttranscriptional tethering of RNA polymerase II gene DNA at nuclear periphery(GO:0000973) |
| 0.1 | 0.1 | GO:0075509 | receptor-mediated endocytosis of virus by host cell(GO:0019065) endocytosis involved in viral entry into host cell(GO:0075509) |
| 0.1 | 0.8 | GO:0061087 | positive regulation of histone H3-K27 methylation(GO:0061087) |
| 0.1 | 0.2 | GO:0090071 | negative regulation of ribosome biogenesis(GO:0090071) |
| 0.1 | 0.6 | GO:0045292 | mRNA cis splicing, via spliceosome(GO:0045292) |
| 0.1 | 0.1 | GO:0003032 | detection of oxygen(GO:0003032) |
| 0.1 | 1.0 | GO:0006768 | biotin metabolic process(GO:0006768) |
| 0.1 | 0.6 | GO:0000389 | mRNA 3'-splice site recognition(GO:0000389) |
| 0.1 | 0.7 | GO:0033623 | regulation of integrin activation(GO:0033623) |
| 0.1 | 0.2 | GO:0035063 | nuclear speck organization(GO:0035063) |
| 0.1 | 0.2 | GO:0030920 | N-terminal peptidyl-serine acetylation(GO:0017198) N-terminal peptidyl-glutamic acid acetylation(GO:0018002) peptidyl-serine acetylation(GO:0030920) |
| 0.1 | 1.3 | GO:0000050 | urea cycle(GO:0000050) |
| 0.1 | 3.4 | GO:0045540 | regulation of cholesterol biosynthetic process(GO:0045540) |
| 0.1 | 2.3 | GO:0048268 | clathrin coat assembly(GO:0048268) |
| 0.1 | 1.1 | GO:0017187 | peptidyl-glutamic acid carboxylation(GO:0017187) protein carboxylation(GO:0018214) |
| 0.1 | 0.6 | GO:0098789 | pre-mRNA cleavage required for polyadenylation(GO:0098789) |
| 0.1 | 2.0 | GO:0006743 | ubiquinone metabolic process(GO:0006743) |
| 0.1 | 1.1 | GO:2001256 | regulation of store-operated calcium entry(GO:2001256) |
| 0.1 | 0.1 | GO:0048370 | lateral mesoderm morphogenesis(GO:0048369) lateral mesoderm formation(GO:0048370) |
| 0.1 | 0.2 | GO:1901143 | insulin catabolic process(GO:1901143) |
| 0.1 | 2.2 | GO:0001893 | maternal placenta development(GO:0001893) |
| 0.1 | 0.6 | GO:0033689 | negative regulation of osteoblast proliferation(GO:0033689) |
| 0.1 | 0.5 | GO:1903435 | positive regulation of constitutive secretory pathway(GO:1903435) |
| 0.1 | 0.3 | GO:0021691 | cerebellar Purkinje cell layer maturation(GO:0021691) |
| 0.1 | 0.3 | GO:0061034 | olfactory bulb mitral cell layer development(GO:0061034) |
| 0.1 | 0.3 | GO:0010025 | wax biosynthetic process(GO:0010025) wax metabolic process(GO:0010166) |
| 0.1 | 0.1 | GO:0048749 | compound eye development(GO:0048749) |
| 0.1 | 0.3 | GO:1904751 | positive regulation of protein localization to nucleolus(GO:1904751) |
| 0.1 | 1.5 | GO:0035728 | response to hepatocyte growth factor(GO:0035728) |
| 0.1 | 0.2 | GO:0090500 | endocardial cushion to mesenchymal transition(GO:0090500) |
| 0.1 | 0.5 | GO:1901142 | insulin metabolic process(GO:1901142) |
| 0.1 | 1.8 | GO:0070423 | nucleotide-binding oligomerization domain containing signaling pathway(GO:0070423) |
| 0.1 | 0.2 | GO:1904017 | cellular response to Thyroglobulin triiodothyronine(GO:1904017) |
| 0.1 | 1.4 | GO:0090036 | regulation of protein kinase C signaling(GO:0090036) |
| 0.1 | 0.3 | GO:0031579 | membrane raft organization(GO:0031579) |
| 0.1 | 1.5 | GO:0046051 | UTP metabolic process(GO:0046051) |
| 0.1 | 0.2 | GO:0043589 | skin morphogenesis(GO:0043589) |
| 0.1 | 0.1 | GO:0003183 | mitral valve morphogenesis(GO:0003183) |
| 0.1 | 3.8 | GO:0048384 | retinoic acid receptor signaling pathway(GO:0048384) |
| 0.1 | 1.3 | GO:0045116 | protein neddylation(GO:0045116) |
| 0.1 | 1.3 | GO:0043162 | ubiquitin-dependent protein catabolic process via the multivesicular body sorting pathway(GO:0043162) |
| 0.1 | 0.9 | GO:2000480 | negative regulation of cAMP-dependent protein kinase activity(GO:2000480) |
| 0.1 | 0.1 | GO:0061394 | regulation of transcription from RNA polymerase II promoter in response to arsenic-containing substance(GO:0061394) |
| 0.1 | 0.6 | GO:0045039 | protein import into mitochondrial inner membrane(GO:0045039) |
| 0.1 | 0.1 | GO:0033160 | positive regulation of protein import into nucleus, translocation(GO:0033160) |
| 0.1 | 0.2 | GO:0030505 | inorganic diphosphate transport(GO:0030505) |
| 0.1 | 1.1 | GO:0045636 | positive regulation of melanocyte differentiation(GO:0045636) |
| 0.1 | 0.2 | GO:0070370 | heat acclimation(GO:0010286) cellular heat acclimation(GO:0070370) |
| 0.1 | 0.2 | GO:0036265 | RNA (guanine-N7)-methylation(GO:0036265) rRNA (guanine-N7)-methylation(GO:0070476) |
| 0.1 | 0.3 | GO:0070901 | mitochondrial tRNA methylation(GO:0070901) |
| 0.1 | 0.4 | GO:1990504 | dense core granule exocytosis(GO:1990504) |
| 0.1 | 0.1 | GO:0033594 | response to hydroxyisoflavone(GO:0033594) |
| 0.1 | 0.2 | GO:0014859 | negative regulation of skeletal muscle cell proliferation(GO:0014859) negative regulation of skeletal muscle satellite cell proliferation(GO:1902723) |
| 0.1 | 1.4 | GO:0006517 | protein deglycosylation(GO:0006517) |
| 0.1 | 1.9 | GO:0006884 | cell volume homeostasis(GO:0006884) |
| 0.1 | 0.1 | GO:0061188 | regulation of chromatin silencing at rDNA(GO:0061187) negative regulation of chromatin silencing at rDNA(GO:0061188) |
| 0.1 | 0.5 | GO:1900745 | positive regulation of p38MAPK cascade(GO:1900745) |
| 0.1 | 0.6 | GO:0097033 | respiratory chain complex III assembly(GO:0017062) mitochondrial respiratory chain complex III assembly(GO:0034551) mitochondrial respiratory chain complex III biogenesis(GO:0097033) |
| 0.1 | 1.2 | GO:0021854 | hypothalamus development(GO:0021854) |
| 0.1 | 0.4 | GO:0033088 | negative regulation of immature T cell proliferation in thymus(GO:0033088) |
| 0.1 | 0.6 | GO:0000707 | meiotic DNA recombinase assembly(GO:0000707) |
| 0.1 | 0.1 | GO:0003164 | His-Purkinje system development(GO:0003164) |
| 0.1 | 0.2 | GO:0071344 | diphosphate metabolic process(GO:0071344) |
| 0.1 | 0.1 | GO:0070634 | transepithelial ammonium transport(GO:0070634) |
| 0.1 | 0.6 | GO:0098582 | innate vocalization behavior(GO:0098582) |
| 0.1 | 0.3 | GO:0050823 | peptide stabilization(GO:0050822) peptide antigen stabilization(GO:0050823) |
| 0.1 | 0.1 | GO:0051343 | positive regulation of cyclic-nucleotide phosphodiesterase activity(GO:0051343) |
| 0.1 | 0.5 | GO:0051151 | negative regulation of smooth muscle cell differentiation(GO:0051151) |
| 0.1 | 0.4 | GO:0061042 | vascular wound healing(GO:0061042) |
| 0.1 | 0.8 | GO:0042407 | cristae formation(GO:0042407) |
| 0.1 | 0.1 | GO:1990502 | dense core granule maturation(GO:1990502) |
| 0.1 | 1.2 | GO:0030497 | fatty acid elongation(GO:0030497) |
| 0.1 | 0.6 | GO:1904153 | negative regulation of protein exit from endoplasmic reticulum(GO:0070862) negative regulation of retrograde protein transport, ER to cytosol(GO:1904153) |
| 0.1 | 0.3 | GO:0071985 | multivesicular body sorting pathway(GO:0071985) |
| 0.1 | 0.4 | GO:0090069 | regulation of ribosome biogenesis(GO:0090069) positive regulation of ribosome biogenesis(GO:0090070) regulation of rRNA processing(GO:2000232) positive regulation of rRNA processing(GO:2000234) |
| 0.1 | 0.6 | GO:0070649 | formin-nucleated actin cable assembly(GO:0070649) |
| 0.1 | 0.3 | GO:0035022 | positive regulation of Rac protein signal transduction(GO:0035022) |
| 0.1 | 0.2 | GO:0035570 | N-terminal protein amino acid methylation(GO:0006480) N-terminal peptidyl-alanine methylation(GO:0018011) N-terminal peptidyl-alanine trimethylation(GO:0018012) N-terminal peptidyl-glycine methylation(GO:0018013) N-terminal peptidyl-proline dimethylation(GO:0018016) peptidyl-alanine modification(GO:0018194) N-terminal peptidyl-proline methylation(GO:0035568) N-terminal peptidyl-serine methylation(GO:0035570) N-terminal peptidyl-serine dimethylation(GO:0035572) N-terminal peptidyl-serine trimethylation(GO:0035573) |
| 0.1 | 0.7 | GO:0010898 | positive regulation of triglyceride catabolic process(GO:0010898) |
| 0.1 | 0.3 | GO:1902268 | negative regulation of polyamine transmembrane transport(GO:1902268) |
| 0.1 | 1.4 | GO:0031033 | myosin filament organization(GO:0031033) |
| 0.1 | 0.4 | GO:0010668 | ectodermal cell differentiation(GO:0010668) |
| 0.1 | 0.7 | GO:0030473 | nucleokinesis involved in cell motility in cerebral cortex radial glia guided migration(GO:0021817) nuclear migration along microtubule(GO:0030473) |
| 0.1 | 0.2 | GO:1903676 | regulation of cap-dependent translational initiation(GO:1903674) positive regulation of cap-dependent translational initiation(GO:1903676) |
| 0.1 | 0.3 | GO:0097211 | response to gonadotropin-releasing hormone(GO:0097210) cellular response to gonadotropin-releasing hormone(GO:0097211) |
| 0.1 | 0.3 | GO:0007386 | compartment pattern specification(GO:0007386) |
| 0.1 | 1.2 | GO:1901748 | leukotriene D4 metabolic process(GO:1901748) leukotriene D4 biosynthetic process(GO:1901750) |
| 0.1 | 0.1 | GO:0060352 | cell adhesion molecule production(GO:0060352) |
| 0.1 | 0.4 | GO:0072733 | response to staurosporine(GO:0072733) cellular response to staurosporine(GO:0072734) |
| 0.1 | 0.4 | GO:0009223 | pyrimidine deoxyribonucleotide catabolic process(GO:0009223) |
| 0.1 | 0.8 | GO:0043562 | cellular response to nitrogen starvation(GO:0006995) cellular response to nitrogen levels(GO:0043562) |
| 0.1 | 0.4 | GO:0060907 | positive regulation of macrophage cytokine production(GO:0060907) |
| 0.1 | 0.3 | GO:1903445 | intermembrane transport(GO:0046909) protein transport from ciliary membrane to plasma membrane(GO:1903445) |
| 0.1 | 0.3 | GO:0051136 | regulation of NK T cell differentiation(GO:0051136) positive regulation of NK T cell differentiation(GO:0051138) |
| 0.1 | 0.1 | GO:0036152 | phosphatidylethanolamine acyl-chain remodeling(GO:0036152) |
| 0.1 | 2.4 | GO:0018345 | protein palmitoylation(GO:0018345) |
| 0.1 | 0.2 | GO:0007315 | oocyte construction(GO:0007308) oocyte axis specification(GO:0007309) oocyte anterior/posterior axis specification(GO:0007314) pole plasm assembly(GO:0007315) maternal determination of anterior/posterior axis, embryo(GO:0008358) P granule organization(GO:0030719) |
| 0.1 | 0.8 | GO:0014029 | neural crest formation(GO:0014029) |
| 0.1 | 1.0 | GO:0051292 | nuclear pore complex assembly(GO:0051292) |
| 0.1 | 0.4 | GO:1903800 | positive regulation of production of miRNAs involved in gene silencing by miRNA(GO:1903800) |
| 0.1 | 0.4 | GO:0044387 | negative regulation of protein kinase activity by regulation of protein phosphorylation(GO:0044387) |
| 0.1 | 1.0 | GO:0035518 | histone H2A monoubiquitination(GO:0035518) |
| 0.1 | 0.2 | GO:0046416 | D-amino acid metabolic process(GO:0046416) |
| 0.1 | 0.1 | GO:0030953 | astral microtubule organization(GO:0030953) |
| 0.1 | 0.5 | GO:0045324 | late endosome to vacuole transport(GO:0045324) |
| 0.1 | 0.3 | GO:0019285 | glycine betaine biosynthetic process from choline(GO:0019285) glycine betaine metabolic process(GO:0031455) glycine betaine biosynthetic process(GO:0031456) |
| 0.1 | 0.1 | GO:0035546 | interferon-beta secretion(GO:0035546) regulation of interferon-beta secretion(GO:0035547) positive regulation of interferon-beta secretion(GO:0035549) |
| 0.1 | 0.3 | GO:0060696 | regulation of phospholipid catabolic process(GO:0060696) |
| 0.1 | 0.4 | GO:0038092 | nodal signaling pathway(GO:0038092) |
| 0.1 | 0.3 | GO:0010868 | negative regulation of triglyceride biosynthetic process(GO:0010868) |
| 0.1 | 0.9 | GO:0043983 | histone H4-K12 acetylation(GO:0043983) |
| 0.1 | 0.3 | GO:0021903 | rostrocaudal neural tube patterning(GO:0021903) |
| 0.1 | 0.4 | GO:0071550 | death-inducing signaling complex assembly(GO:0071550) |
| 0.1 | 0.1 | GO:0032289 | central nervous system myelin formation(GO:0032289) |
| 0.1 | 0.4 | GO:0060430 | lung saccule development(GO:0060430) |
| 0.1 | 0.1 | GO:0048850 | hypophysis morphogenesis(GO:0048850) |
| 0.1 | 0.6 | GO:2000582 | regulation of ATP-dependent microtubule motor activity, plus-end-directed(GO:2000580) positive regulation of ATP-dependent microtubule motor activity, plus-end-directed(GO:2000582) |
| 0.1 | 0.1 | GO:0051454 | pH elevation(GO:0045852) intracellular pH elevation(GO:0051454) |
| 0.1 | 3.8 | GO:0032784 | regulation of DNA-templated transcription, elongation(GO:0032784) |
| 0.1 | 0.1 | GO:0061198 | fungiform papilla formation(GO:0061198) |
| 0.1 | 0.2 | GO:1990822 | basic amino acid transmembrane transport(GO:1990822) |
| 0.1 | 0.2 | GO:0000738 | DNA catabolic process, exonucleolytic(GO:0000738) |
| 0.1 | 0.1 | GO:0035261 | external genitalia morphogenesis(GO:0035261) |
| 0.1 | 0.4 | GO:0007296 | vitellogenesis(GO:0007296) |
| 0.1 | 0.1 | GO:0009826 | unidimensional cell growth(GO:0009826) |
| 0.1 | 0.2 | GO:2000623 | regulation of nuclear-transcribed mRNA catabolic process, nonsense-mediated decay(GO:2000622) negative regulation of nuclear-transcribed mRNA catabolic process, nonsense-mediated decay(GO:2000623) |
| 0.1 | 0.1 | GO:0035740 | CD8-positive, alpha-beta T cell proliferation(GO:0035740) regulation of CD8-positive, alpha-beta T cell proliferation(GO:2000564) |
| 0.1 | 1.1 | GO:1902083 | negative regulation of peptidyl-cysteine S-nitrosylation(GO:1902083) |
| 0.1 | 0.3 | GO:0043374 | CD8-positive, alpha-beta T cell differentiation(GO:0043374) |
| 0.1 | 0.3 | GO:1902361 | mitochondrial pyruvate transport(GO:0006850) mitochondrial pyruvate transmembrane transport(GO:1902361) |
| 0.1 | 0.4 | GO:0048050 | post-embryonic eye morphogenesis(GO:0048050) |
| 0.1 | 3.5 | GO:0000186 | activation of MAPKK activity(GO:0000186) |
| 0.1 | 0.3 | GO:1903553 | positive regulation of extracellular exosome assembly(GO:1903553) |
| 0.1 | 0.2 | GO:0007089 | traversing start control point of mitotic cell cycle(GO:0007089) |
| 0.1 | 0.8 | GO:0048227 | plasma membrane to endosome transport(GO:0048227) |
| 0.1 | 0.5 | GO:0010918 | positive regulation of mitochondrial membrane potential(GO:0010918) |
| 0.1 | 0.2 | GO:1900138 | negative regulation of phospholipase A2 activity(GO:1900138) |
| 0.1 | 0.1 | GO:0003057 | regulation of the force of heart contraction by chemical signal(GO:0003057) |
| 0.1 | 2.2 | GO:1901224 | positive regulation of NIK/NF-kappaB signaling(GO:1901224) |
| 0.1 | 2.9 | GO:1904837 | beta-catenin-TCF complex assembly(GO:1904837) |
| 0.1 | 0.1 | GO:2000410 | tolerance induction to self antigen(GO:0002513) regulation of thymocyte migration(GO:2000410) |
| 0.1 | 1.0 | GO:0032625 | interleukin-21 production(GO:0032625) interleukin-21 secretion(GO:0072619) |
| 0.1 | 3.8 | GO:0000289 | nuclear-transcribed mRNA poly(A) tail shortening(GO:0000289) |
| 0.1 | 0.2 | GO:0018343 | protein farnesylation(GO:0018343) |
| 0.1 | 0.1 | GO:1903588 | regulation of blood vessel endothelial cell proliferation involved in sprouting angiogenesis(GO:1903587) negative regulation of blood vessel endothelial cell proliferation involved in sprouting angiogenesis(GO:1903588) |
| 0.1 | 0.1 | GO:0042494 | detection of bacterial lipoprotein(GO:0042494) |
| 0.1 | 0.1 | GO:0002188 | translation reinitiation(GO:0002188) |
| 0.1 | 0.1 | GO:1900272 | negative regulation of long-term synaptic potentiation(GO:1900272) |
| 0.1 | 0.2 | GO:0034378 | chylomicron assembly(GO:0034378) |
| 0.1 | 0.2 | GO:0060931 | sinoatrial node cell development(GO:0060931) |
| 0.1 | 0.2 | GO:0009405 | pathogenesis(GO:0009405) |
| 0.1 | 0.2 | GO:1904706 | negative regulation of vascular smooth muscle cell proliferation(GO:1904706) |
| 0.1 | 0.3 | GO:2000484 | positive regulation of interleukin-8 secretion(GO:2000484) |
| 0.1 | 1.2 | GO:1901222 | regulation of NIK/NF-kappaB signaling(GO:1901222) |
| 0.1 | 0.7 | GO:0006703 | estrogen biosynthetic process(GO:0006703) |
| 0.1 | 0.3 | GO:0048194 | Golgi vesicle budding(GO:0048194) |
| 0.1 | 0.4 | GO:0010482 | epidermal cell division(GO:0010481) regulation of epidermal cell division(GO:0010482) |
| 0.1 | 0.2 | GO:0071460 | cellular response to cell-matrix adhesion(GO:0071460) |
| 0.1 | 0.2 | GO:1902255 | positive regulation of intrinsic apoptotic signaling pathway by p53 class mediator(GO:1902255) |
| 0.1 | 0.1 | GO:0014878 | response to electrical stimulus involved in regulation of muscle adaptation(GO:0014878) |
| 0.1 | 0.6 | GO:0035331 | negative regulation of hippo signaling(GO:0035331) |
| 0.1 | 0.1 | GO:0003406 | retinal pigment epithelium development(GO:0003406) |
| 0.1 | 0.4 | GO:0046618 | drug export(GO:0046618) |
| 0.1 | 0.2 | GO:0002572 | pro-T cell differentiation(GO:0002572) |
| 0.1 | 0.2 | GO:1990637 | response to prolactin(GO:1990637) |
| 0.1 | 0.2 | GO:0006999 | nuclear pore organization(GO:0006999) |
| 0.1 | 0.4 | GO:0001780 | neutrophil homeostasis(GO:0001780) |
| 0.1 | 0.9 | GO:0003322 | pancreatic A cell development(GO:0003322) |
| 0.1 | 0.2 | GO:0021648 | vestibulocochlear nerve morphogenesis(GO:0021648) |
| 0.1 | 0.2 | GO:0038060 | nitric oxide-cGMP-mediated signaling pathway(GO:0038060) |
| 0.1 | 0.1 | GO:0002581 | negative regulation of antigen processing and presentation of peptide or polysaccharide antigen via MHC class II(GO:0002581) |
| 0.1 | 0.1 | GO:0071033 | nuclear retention of pre-mRNA at the site of transcription(GO:0071033) |
| 0.1 | 0.1 | GO:0071603 | endothelial cell-cell adhesion(GO:0071603) |
| 0.1 | 0.1 | GO:0042271 | susceptibility to natural killer cell mediated cytotoxicity(GO:0042271) |
| 0.1 | 0.6 | GO:0043985 | histone H4-R3 methylation(GO:0043985) |
| 0.1 | 0.3 | GO:0070973 | protein localization to endoplasmic reticulum exit site(GO:0070973) |
| 0.1 | 0.8 | GO:2000251 | positive regulation of actin cytoskeleton reorganization(GO:2000251) |
| 0.1 | 0.4 | GO:0072257 | metanephric nephron tubule epithelial cell differentiation(GO:0072257) regulation of metanephric nephron tubule epithelial cell differentiation(GO:0072307) |
| 0.1 | 0.2 | GO:1903259 | exon-exon junction complex disassembly(GO:1903259) |
| 0.1 | 0.5 | GO:0042256 | mature ribosome assembly(GO:0042256) |
| 0.1 | 0.2 | GO:0046379 | extracellular polysaccharide biosynthetic process(GO:0045226) extracellular polysaccharide metabolic process(GO:0046379) |
| 0.1 | 0.4 | GO:2000353 | positive regulation of endothelial cell apoptotic process(GO:2000353) |
| 0.1 | 0.4 | GO:0009597 | detection of virus(GO:0009597) |
| 0.1 | 0.2 | GO:0030576 | Cajal body organization(GO:0030576) |
| 0.1 | 0.3 | GO:0032057 | negative regulation of translational initiation in response to stress(GO:0032057) |
| 0.1 | 1.6 | GO:0045737 | positive regulation of cyclin-dependent protein serine/threonine kinase activity(GO:0045737) |
| 0.1 | 1.3 | GO:0071470 | cellular response to osmotic stress(GO:0071470) |
| 0.1 | 0.2 | GO:0001828 | inner cell mass cellular morphogenesis(GO:0001828) |
| 0.1 | 0.2 | GO:0002818 | intracellular defense response(GO:0002818) |
| 0.1 | 0.2 | GO:0032048 | cardiolipin metabolic process(GO:0032048) |
| 0.1 | 1.6 | GO:0050434 | positive regulation of viral transcription(GO:0050434) |
| 0.1 | 0.2 | GO:0051039 | histone displacement(GO:0001207) positive regulation of transcription involved in meiotic cell cycle(GO:0051039) |
| 0.1 | 1.3 | GO:0006695 | cholesterol biosynthetic process(GO:0006695) secondary alcohol biosynthetic process(GO:1902653) |
| 0.1 | 5.9 | GO:0070125 | mitochondrial translational elongation(GO:0070125) |
| 0.1 | 0.2 | GO:0033076 | isoquinoline alkaloid metabolic process(GO:0033076) |
| 0.1 | 0.2 | GO:0061026 | cardiac muscle tissue regeneration(GO:0061026) |
| 0.1 | 0.2 | GO:0061732 | mitochondrial acetyl-CoA biosynthetic process from pyruvate(GO:0061732) |
| 0.1 | 0.5 | GO:0006983 | ER overload response(GO:0006983) |
| 0.1 | 0.3 | GO:0008218 | bioluminescence(GO:0008218) |
| 0.1 | 0.2 | GO:0030451 | regulation of complement activation, alternative pathway(GO:0030451) negative regulation of complement activation, alternative pathway(GO:0045957) |
| 0.1 | 1.5 | GO:0006376 | mRNA splice site selection(GO:0006376) |
| 0.1 | 0.7 | GO:0007398 | ectoderm development(GO:0007398) |
| 0.1 | 0.1 | GO:1901407 | regulation of phosphorylation of RNA polymerase II C-terminal domain(GO:1901407) |
| 0.1 | 0.6 | GO:0097094 | craniofacial suture morphogenesis(GO:0097094) |
| 0.1 | 1.1 | GO:1900739 | regulation of protein insertion into mitochondrial membrane involved in apoptotic signaling pathway(GO:1900739) positive regulation of protein insertion into mitochondrial membrane involved in apoptotic signaling pathway(GO:1900740) |
| 0.1 | 0.1 | GO:2000255 | negative regulation of male germ cell proliferation(GO:2000255) |
| 0.1 | 0.8 | GO:0000028 | ribosomal small subunit assembly(GO:0000028) |
| 0.1 | 0.2 | GO:1903358 | regulation of Golgi organization(GO:1903358) |
| 0.1 | 0.3 | GO:0072393 | microtubule anchoring at microtubule organizing center(GO:0072393) |
| 0.1 | 0.4 | GO:0010499 | proteasomal ubiquitin-independent protein catabolic process(GO:0010499) |
| 0.1 | 0.5 | GO:0042908 | xenobiotic transport(GO:0042908) |
| 0.1 | 0.2 | GO:0010933 | macrophage tolerance induction(GO:0010931) regulation of macrophage tolerance induction(GO:0010932) positive regulation of macrophage tolerance induction(GO:0010933) |
| 0.1 | 0.2 | GO:2000437 | monocyte extravasation(GO:0035696) regulation of monocyte extravasation(GO:2000437) positive regulation of monocyte extravasation(GO:2000439) |
| 0.1 | 0.3 | GO:0007497 | posterior midgut development(GO:0007497) negative regulation of neuron maturation(GO:0014043) enteric smooth muscle cell differentiation(GO:0035645) |
| 0.1 | 0.1 | GO:2000576 | positive regulation of microtubule motor activity(GO:2000576) |
| 0.0 | 0.2 | GO:0007252 | I-kappaB phosphorylation(GO:0007252) |
| 0.0 | 0.6 | GO:0007220 | Notch receptor processing(GO:0007220) |
| 0.0 | 0.3 | GO:0006824 | cobalt ion transport(GO:0006824) |
| 0.0 | 0.2 | GO:0098886 | modification of dendritic spine(GO:0098886) |
| 0.0 | 0.4 | GO:0016255 | attachment of GPI anchor to protein(GO:0016255) |
| 0.0 | 0.1 | GO:0090611 | ubiquitin-independent protein catabolic process via the multivesicular body sorting pathway(GO:0090611) |
| 0.0 | 1.3 | GO:0035455 | response to interferon-alpha(GO:0035455) |
| 0.0 | 0.1 | GO:0034134 | toll-like receptor 2 signaling pathway(GO:0034134) |
| 0.0 | 0.2 | GO:0061763 | multivesicular body-lysosome fusion(GO:0061763) |
| 0.0 | 0.6 | GO:0061298 | retina vasculature development in camera-type eye(GO:0061298) |
| 0.0 | 0.7 | GO:0001682 | tRNA 5'-leader removal(GO:0001682) |
| 0.0 | 2.2 | GO:0035735 | intraciliary transport involved in cilium morphogenesis(GO:0035735) |
| 0.0 | 0.0 | GO:0030853 | negative regulation of granulocyte differentiation(GO:0030853) |
| 0.0 | 0.2 | GO:0072383 | plus-end-directed vesicle transport along microtubule(GO:0072383) |
| 0.0 | 0.2 | GO:0019919 | peptidyl-arginine methylation, to asymmetrical-dimethyl arginine(GO:0019919) |
| 0.0 | 4.1 | GO:2000134 | negative regulation of G1/S transition of mitotic cell cycle(GO:2000134) |
| 0.0 | 0.0 | GO:0006166 | purine ribonucleoside salvage(GO:0006166) |
| 0.0 | 0.5 | GO:0000492 | box C/D snoRNP assembly(GO:0000492) |
| 0.0 | 0.2 | GO:0060263 | regulation of respiratory burst(GO:0060263) |
| 0.0 | 0.1 | GO:0072156 | distal tubule morphogenesis(GO:0072156) |
| 0.0 | 2.0 | GO:0000188 | inactivation of MAPK activity(GO:0000188) |
| 0.0 | 0.1 | GO:0061762 | CAMKK-AMPK signaling cascade(GO:0061762) |
| 0.0 | 0.5 | GO:0043249 | erythrocyte maturation(GO:0043249) |
| 0.0 | 0.1 | GO:0033148 | positive regulation of intracellular estrogen receptor signaling pathway(GO:0033148) |
| 0.0 | 1.0 | GO:0007216 | G-protein coupled glutamate receptor signaling pathway(GO:0007216) |
| 0.0 | 0.1 | GO:0018364 | peptidyl-glutamine methylation(GO:0018364) |
| 0.0 | 0.2 | GO:0061760 | antifungal innate immune response(GO:0061760) |
| 0.0 | 1.2 | GO:0046337 | phosphatidylethanolamine metabolic process(GO:0046337) |
| 0.0 | 0.5 | GO:0061635 | regulation of protein complex stability(GO:0061635) |
| 0.0 | 0.5 | GO:0006268 | DNA unwinding involved in DNA replication(GO:0006268) |
| 0.0 | 0.2 | GO:0035493 | SNARE complex assembly(GO:0035493) |
| 0.0 | 0.2 | GO:0033183 | negative regulation of histone ubiquitination(GO:0033183) histone H2A K63-linked ubiquitination(GO:0070535) regulation of histone H2A K63-linked ubiquitination(GO:1901314) negative regulation of histone H2A K63-linked ubiquitination(GO:1901315) |
| 0.0 | 0.0 | GO:0006288 | base-excision repair, DNA ligation(GO:0006288) |
| 0.0 | 0.1 | GO:0014041 | regulation of neuron maturation(GO:0014041) |
| 0.0 | 0.2 | GO:0048682 | axon extension involved in regeneration(GO:0048677) sprouting of injured axon(GO:0048682) |
| 0.0 | 0.2 | GO:0038016 | insulin receptor internalization(GO:0038016) |
| 0.0 | 0.4 | GO:1904896 | ESCRT complex disassembly(GO:1904896) ESCRT III complex disassembly(GO:1904903) |
| 0.0 | 0.5 | GO:2001288 | positive regulation of caveolin-mediated endocytosis(GO:2001288) |
| 0.0 | 0.3 | GO:0010042 | response to manganese ion(GO:0010042) |
| 0.0 | 0.5 | GO:0030091 | protein repair(GO:0030091) |
| 0.0 | 1.8 | GO:0030206 | chondroitin sulfate biosynthetic process(GO:0030206) |
| 0.0 | 1.4 | GO:0006101 | citrate metabolic process(GO:0006101) |
| 0.0 | 0.0 | GO:0034653 | diterpenoid catabolic process(GO:0016103) retinoic acid catabolic process(GO:0034653) |
| 0.0 | 0.1 | GO:0035521 | monoubiquitinated histone deubiquitination(GO:0035521) monoubiquitinated histone H2A deubiquitination(GO:0035522) |
| 0.0 | 1.1 | GO:0042347 | negative regulation of NF-kappaB import into nucleus(GO:0042347) |
| 0.0 | 0.0 | GO:0035927 | RNA import into mitochondrion(GO:0035927) |
| 0.0 | 0.2 | GO:0093001 | glycolysis from storage polysaccharide through glucose-1-phosphate(GO:0093001) |
| 0.0 | 3.2 | GO:0048278 | vesicle docking(GO:0048278) |
| 0.0 | 0.4 | GO:1901552 | positive regulation of endothelial cell development(GO:1901552) positive regulation of establishment of endothelial barrier(GO:1903142) |
| 0.0 | 1.6 | GO:0010803 | regulation of tumor necrosis factor-mediated signaling pathway(GO:0010803) |
| 0.0 | 1.8 | GO:0008333 | endosome to lysosome transport(GO:0008333) |
| 0.0 | 0.2 | GO:0035523 | protein K29-linked deubiquitination(GO:0035523) |
| 0.0 | 0.3 | GO:0060576 | intestinal epithelial cell development(GO:0060576) |
| 0.0 | 0.2 | GO:0032594 | protein transport within lipid bilayer(GO:0032594) protein transport into membrane raft(GO:0032596) |
| 0.0 | 0.3 | GO:0010592 | positive regulation of lamellipodium assembly(GO:0010592) |
| 0.0 | 0.2 | GO:0010716 | negative regulation of extracellular matrix disassembly(GO:0010716) |
| 0.0 | 0.3 | GO:0071105 | response to interleukin-11(GO:0071105) |
| 0.0 | 0.1 | GO:0060743 | epithelial cell maturation involved in prostate gland development(GO:0060743) |
| 0.0 | 0.0 | GO:2000381 | negative regulation of mesoderm development(GO:2000381) |
| 0.0 | 0.1 | GO:0071962 | mitotic sister chromatid cohesion, centromeric(GO:0071962) |
| 0.0 | 0.2 | GO:0032466 | negative regulation of cytokinesis(GO:0032466) |
| 0.0 | 0.9 | GO:0000291 | nuclear-transcribed mRNA catabolic process, exonucleolytic(GO:0000291) |
| 0.0 | 0.4 | GO:0000463 | maturation of LSU-rRNA from tricistronic rRNA transcript (SSU-rRNA, 5.8S rRNA, LSU-rRNA)(GO:0000463) |
| 0.0 | 0.2 | GO:0015742 | alpha-ketoglutarate transport(GO:0015742) |
| 0.0 | 0.2 | GO:1902807 | negative regulation of cell cycle G1/S phase transition(GO:1902807) |
| 0.0 | 0.6 | GO:0003334 | keratinocyte development(GO:0003334) |
| 0.0 | 0.0 | GO:0070676 | intralumenal vesicle formation(GO:0070676) |
| 0.0 | 0.1 | GO:0046021 | regulation of transcription from RNA polymerase II promoter, mitotic(GO:0046021) |
| 0.0 | 0.7 | GO:0034587 | piRNA metabolic process(GO:0034587) |
| 0.0 | 0.8 | GO:0006388 | tRNA splicing, via endonucleolytic cleavage and ligation(GO:0006388) |
| 0.0 | 0.7 | GO:0010569 | regulation of double-strand break repair via homologous recombination(GO:0010569) |
| 0.0 | 0.0 | GO:0097112 | gamma-aminobutyric acid receptor clustering(GO:0097112) |
| 0.0 | 0.2 | GO:0015688 | iron chelate transport(GO:0015688) siderophore transport(GO:0015891) |
| 0.0 | 0.5 | GO:0006069 | ethanol oxidation(GO:0006069) |
| 0.0 | 0.2 | GO:0015677 | copper ion import(GO:0015677) |
| 0.0 | 0.0 | GO:0044333 | Wnt signaling pathway involved in digestive tract morphogenesis(GO:0044333) |
| 0.0 | 0.4 | GO:0051683 | establishment of Golgi localization(GO:0051683) |
| 0.0 | 0.2 | GO:0044565 | dendritic cell proliferation(GO:0044565) |
| 0.0 | 0.3 | GO:0061737 | leukotriene signaling pathway(GO:0061737) |
| 0.0 | 0.1 | GO:1990918 | double-strand break repair involved in meiotic recombination(GO:1990918) |
| 0.0 | 0.1 | GO:2001045 | negative regulation of integrin-mediated signaling pathway(GO:2001045) |
| 0.0 | 0.3 | GO:0002430 | complement receptor mediated signaling pathway(GO:0002430) |
| 0.0 | 0.2 | GO:0009120 | deoxyribonucleoside metabolic process(GO:0009120) |
| 0.0 | 0.2 | GO:0006286 | base-excision repair, base-free sugar-phosphate removal(GO:0006286) |
| 0.0 | 0.0 | GO:0071680 | response to indole-3-methanol(GO:0071680) cellular response to indole-3-methanol(GO:0071681) |
| 0.0 | 0.5 | GO:0021796 | cerebral cortex regionalization(GO:0021796) |
| 0.0 | 0.2 | GO:0002353 | kinin cascade(GO:0002254) plasma kallikrein-kinin cascade(GO:0002353) |
| 0.0 | 0.4 | GO:0031339 | negative regulation of vesicle fusion(GO:0031339) |
| 0.0 | 0.2 | GO:0071461 | cellular response to redox state(GO:0071461) |
| 0.0 | 0.4 | GO:0031642 | negative regulation of myelination(GO:0031642) |
| 0.0 | 1.0 | GO:0006123 | mitochondrial electron transport, cytochrome c to oxygen(GO:0006123) |
| 0.0 | 0.1 | GO:0097032 | respiratory chain complex II assembly(GO:0034552) mitochondrial respiratory chain complex II assembly(GO:0034553) mitochondrial respiratory chain complex II biogenesis(GO:0097032) |
| 0.0 | 0.6 | GO:0016226 | iron-sulfur cluster assembly(GO:0016226) metallo-sulfur cluster assembly(GO:0031163) |
| 0.0 | 0.2 | GO:1901662 | phylloquinone metabolic process(GO:0042374) phylloquinone catabolic process(GO:0042376) quinone catabolic process(GO:1901662) |
| 0.0 | 0.1 | GO:1904729 | regulation of intestinal cholesterol absorption(GO:0030300) regulation of intestinal lipid absorption(GO:1904729) |
| 0.0 | 0.2 | GO:0071880 | adenylate cyclase-activating adrenergic receptor signaling pathway(GO:0071880) |
| 0.0 | 0.1 | GO:0033861 | negative regulation of NAD(P)H oxidase activity(GO:0033861) |
| 0.0 | 0.5 | GO:1990874 | regulation of vascular smooth muscle cell proliferation(GO:1904705) positive regulation of vascular smooth muscle cell proliferation(GO:1904707) vascular smooth muscle cell proliferation(GO:1990874) |
| 0.0 | 0.7 | GO:0021680 | cerebellar Purkinje cell layer development(GO:0021680) |
| 0.0 | 0.1 | GO:0030836 | positive regulation of actin filament depolymerization(GO:0030836) |
| 0.0 | 0.5 | GO:0045899 | positive regulation of RNA polymerase II transcriptional preinitiation complex assembly(GO:0045899) |
| 0.0 | 0.1 | GO:1902630 | regulation of membrane hyperpolarization(GO:1902630) |
| 0.0 | 0.1 | GO:0010759 | positive regulation of macrophage chemotaxis(GO:0010759) |
| 0.0 | 0.3 | GO:0006741 | NADP biosynthetic process(GO:0006741) |
| 0.0 | 0.2 | GO:0006015 | 5-phosphoribose 1-diphosphate biosynthetic process(GO:0006015) 5-phosphoribose 1-diphosphate metabolic process(GO:0046391) |
| 0.0 | 0.0 | GO:0090335 | regulation of brown fat cell differentiation(GO:0090335) |
| 0.0 | 0.2 | GO:1905244 | regulation of modification of synaptic structure(GO:1905244) |
| 0.0 | 0.1 | GO:0009386 | translational attenuation(GO:0009386) |
| 0.0 | 0.4 | GO:0031274 | positive regulation of pseudopodium assembly(GO:0031274) |
| 0.0 | 0.1 | GO:1904116 | response to vasopressin(GO:1904116) cellular response to vasopressin(GO:1904117) |
| 0.0 | 0.1 | GO:0061084 | regulation of protein refolding(GO:0061083) negative regulation of protein refolding(GO:0061084) |
| 0.0 | 0.0 | GO:0060534 | trachea cartilage development(GO:0060534) |
| 0.0 | 0.2 | GO:0006420 | arginyl-tRNA aminoacylation(GO:0006420) |
| 0.0 | 0.1 | GO:0033327 | Leydig cell differentiation(GO:0033327) |
| 0.0 | 0.3 | GO:0032790 | ribosome disassembly(GO:0032790) |
| 0.0 | 0.2 | GO:1902902 | negative regulation of autophagosome assembly(GO:1902902) |
| 0.0 | 0.2 | GO:0038066 | p38MAPK cascade(GO:0038066) |
| 0.0 | 0.1 | GO:0006167 | AMP biosynthetic process(GO:0006167) |
| 0.0 | 0.3 | GO:2001206 | positive regulation of osteoclast development(GO:2001206) |
| 0.0 | 0.2 | GO:1904274 | tricellular tight junction assembly(GO:1904274) |
| 0.0 | 0.2 | GO:0015727 | lactate transport(GO:0015727) lactate transmembrane transport(GO:0035873) |
| 0.0 | 0.1 | GO:0003245 | cardiac muscle tissue growth involved in heart morphogenesis(GO:0003245) |
| 0.0 | 0.1 | GO:1900165 | negative regulation of interleukin-6 secretion(GO:1900165) |
| 0.0 | 0.0 | GO:1903004 | regulation of protein K63-linked deubiquitination(GO:1903004) positive regulation of protein K63-linked deubiquitination(GO:1903006) |
| 0.0 | 0.4 | GO:0006685 | sphingomyelin catabolic process(GO:0006685) |
| 0.0 | 0.2 | GO:0045023 | G0 to G1 transition(GO:0045023) |
| 0.0 | 0.2 | GO:0032485 | Ral protein signal transduction(GO:0032484) regulation of Ral protein signal transduction(GO:0032485) |
| 0.0 | 0.1 | GO:0035552 | oxidative single-stranded DNA demethylation(GO:0035552) |
| 0.0 | 1.0 | GO:0043631 | mRNA polyadenylation(GO:0006378) RNA polyadenylation(GO:0043631) |
| 0.0 | 0.7 | GO:0097352 | autophagosome maturation(GO:0097352) |
| 0.0 | 0.2 | GO:0002357 | defense response to tumor cell(GO:0002357) |
| 0.0 | 0.1 | GO:1904569 | regulation of selenocysteine incorporation(GO:1904569) |
| 0.0 | 0.1 | GO:0019303 | D-ribose catabolic process(GO:0019303) |
| 0.0 | 0.1 | GO:0018032 | protein amidation(GO:0018032) |
| 0.0 | 0.2 | GO:2000312 | regulation of kainate selective glutamate receptor activity(GO:2000312) |
| 0.0 | 0.7 | GO:0006488 | dolichol-linked oligosaccharide biosynthetic process(GO:0006488) |
| 0.0 | 0.1 | GO:0009436 | glyoxylate catabolic process(GO:0009436) |
| 0.0 | 0.1 | GO:1901897 | regulation of relaxation of cardiac muscle(GO:1901897) |
| 0.0 | 0.1 | GO:0061536 | glycine secretion(GO:0061536) glycine secretion, neurotransmission(GO:0061537) |
| 0.0 | 0.5 | GO:0042994 | cytoplasmic sequestering of transcription factor(GO:0042994) |
| 0.0 | 0.0 | GO:0071941 | nitrogen cycle metabolic process(GO:0071941) |
| 0.0 | 0.1 | GO:0009437 | carnitine metabolic process(GO:0009437) |
| 0.0 | 0.2 | GO:0001971 | negative regulation of activation of membrane attack complex(GO:0001971) |
| 0.0 | 0.1 | GO:0090073 | positive regulation of protein homodimerization activity(GO:0090073) |
| 0.0 | 0.1 | GO:0007525 | somatic muscle development(GO:0007525) |
| 0.0 | 0.3 | GO:0021534 | cell proliferation in hindbrain(GO:0021534) cell proliferation in external granule layer(GO:0021924) cerebellar granule cell precursor proliferation(GO:0021930) |
| 0.0 | 1.0 | GO:0030866 | cortical actin cytoskeleton organization(GO:0030866) |
| 0.0 | 0.0 | GO:0072717 | response to actinomycin D(GO:0072716) cellular response to actinomycin D(GO:0072717) |
| 0.0 | 0.1 | GO:0003415 | chondrocyte hypertrophy(GO:0003415) |
| 0.0 | 0.0 | GO:0035791 | platelet-derived growth factor receptor-beta signaling pathway(GO:0035791) |
| 0.0 | 0.1 | GO:0090219 | negative regulation of lipid kinase activity(GO:0090219) |
| 0.0 | 0.5 | GO:0071294 | cellular response to zinc ion(GO:0071294) |
| 0.0 | 0.2 | GO:0071894 | histone H2B conserved C-terminal lysine ubiquitination(GO:0071894) |
| 0.0 | 0.1 | GO:1904690 | regulation of cap-independent translational initiation(GO:1903677) positive regulation of cap-independent translational initiation(GO:1903679) regulation of cytoplasmic translational initiation(GO:1904688) positive regulation of cytoplasmic translational initiation(GO:1904690) |
| 0.0 | 0.1 | GO:0014067 | negative regulation of phosphatidylinositol 3-kinase signaling(GO:0014067) |
| 0.0 | 0.5 | GO:0071447 | cellular response to hydroperoxide(GO:0071447) |
| 0.0 | 0.4 | GO:0043031 | negative regulation of macrophage activation(GO:0043031) |
| 0.0 | 0.3 | GO:0051715 | cytolysis in other organism(GO:0051715) |
| 0.0 | 0.4 | GO:0045879 | negative regulation of smoothened signaling pathway(GO:0045879) |
| 0.0 | 0.1 | GO:0006777 | Mo-molybdopterin cofactor biosynthetic process(GO:0006777) Mo-molybdopterin cofactor metabolic process(GO:0019720) |
| 0.0 | 0.1 | GO:0018874 | benzoate metabolic process(GO:0018874) |
| 0.0 | 0.1 | GO:0002879 | positive regulation of acute inflammatory response to non-antigenic stimulus(GO:0002879) |
| 0.0 | 0.3 | GO:0044030 | regulation of DNA methylation(GO:0044030) |
| 0.0 | 0.2 | GO:0060160 | negative regulation of dopamine receptor signaling pathway(GO:0060160) |
| 0.0 | 0.1 | GO:0018101 | protein citrullination(GO:0018101) histone citrullination(GO:0036414) |
| 0.0 | 0.1 | GO:1902177 | positive regulation of oxidative stress-induced intrinsic apoptotic signaling pathway(GO:1902177) |
| 0.0 | 0.1 | GO:0038018 | Wnt receptor catabolic process(GO:0038018) |
| 0.0 | 0.3 | GO:0033539 | fatty acid beta-oxidation using acyl-CoA dehydrogenase(GO:0033539) |
| 0.0 | 0.1 | GO:0032471 | negative regulation of endoplasmic reticulum calcium ion concentration(GO:0032471) |
| 0.0 | 0.1 | GO:1904587 | response to glycoprotein(GO:1904587) cellular response to glycoprotein(GO:1904588) response to thyrotropin-releasing hormone(GO:1905225) cellular response to thyrotropin-releasing hormone(GO:1905229) |
| 0.0 | 0.0 | GO:0002679 | respiratory burst involved in defense response(GO:0002679) |
| 0.0 | 0.5 | GO:0006295 | nucleotide-excision repair, DNA incision, 3'-to lesion(GO:0006295) |
| 0.0 | 0.0 | GO:0080184 | response to stilbenoid(GO:0035634) response to phenylpropanoid(GO:0080184) |
| 0.0 | 0.1 | GO:1904977 | lymphatic endothelial cell migration(GO:1904977) |
| 0.0 | 0.2 | GO:0016926 | protein desumoylation(GO:0016926) |
| 0.0 | 0.0 | GO:0051919 | positive regulation of fibrinolysis(GO:0051919) |
| 0.0 | 0.2 | GO:2000059 | negative regulation of protein ubiquitination involved in ubiquitin-dependent protein catabolic process(GO:2000059) |
| 0.0 | 0.4 | GO:0030318 | melanocyte differentiation(GO:0030318) |
| 0.0 | 0.4 | GO:0043586 | tongue development(GO:0043586) |
| 0.0 | 0.2 | GO:0090527 | actin filament reorganization(GO:0090527) |
| 0.0 | 0.5 | GO:0071801 | regulation of podosome assembly(GO:0071801) |
| 0.0 | 0.3 | GO:0002523 | leukocyte migration involved in inflammatory response(GO:0002523) |
| 0.0 | 0.5 | GO:0015937 | coenzyme A biosynthetic process(GO:0015937) |
| 0.0 | 0.1 | GO:0098507 | polynucleotide 5' dephosphorylation(GO:0098507) |
| 0.0 | 0.1 | GO:0032431 | activation of phospholipase A2 activity(GO:0032431) |
| 0.0 | 0.2 | GO:0050957 | equilibrioception(GO:0050957) |
| 0.0 | 0.1 | GO:0051971 | positive regulation of transmission of nerve impulse(GO:0051971) |
| 0.0 | 0.1 | GO:0044314 | protein K27-linked ubiquitination(GO:0044314) |
| 0.0 | 0.1 | GO:2000354 | regulation of ovarian follicle development(GO:2000354) |
| 0.0 | 0.1 | GO:0016256 | N-glycan processing to lysosome(GO:0016256) |
| 0.0 | 0.1 | GO:0010216 | maintenance of DNA methylation(GO:0010216) |
| 0.0 | 0.1 | GO:1904715 | negative regulation of chaperone-mediated autophagy(GO:1904715) |
| 0.0 | 0.1 | GO:0051414 | response to cortisol(GO:0051414) |
| 0.0 | 0.1 | GO:1900225 | NLRP3 inflammasome complex assembly(GO:0044546) regulation of NLRP3 inflammasome complex assembly(GO:1900225) |
| 0.0 | 0.1 | GO:0071376 | response to corticotropin-releasing hormone(GO:0043435) cellular response to corticotropin-releasing hormone stimulus(GO:0071376) |
| 0.0 | 0.1 | GO:1902951 | negative regulation of dendritic spine maintenance(GO:1902951) |
| 0.0 | 0.1 | GO:0033123 | positive regulation of purine nucleotide catabolic process(GO:0033123) |
| 0.0 | 0.1 | GO:0045903 | positive regulation of translational fidelity(GO:0045903) |
| 0.0 | 0.1 | GO:0072641 | type I interferon secretion(GO:0072641) |
| 0.0 | 0.3 | GO:0010818 | T cell chemotaxis(GO:0010818) |
| 0.0 | 0.1 | GO:1901029 | negative regulation of mitochondrial outer membrane permeabilization involved in apoptotic signaling pathway(GO:1901029) |
| 0.0 | 0.4 | GO:0040032 | post-embryonic body morphogenesis(GO:0040032) |
| 0.0 | 0.3 | GO:0006265 | DNA topological change(GO:0006265) |
| 0.0 | 0.1 | GO:0097026 | dendritic cell dendrite assembly(GO:0097026) |
| 0.0 | 0.1 | GO:0055005 | ventricular cardiac myofibril assembly(GO:0055005) |
| 0.0 | 0.2 | GO:0046600 | negative regulation of centriole replication(GO:0046600) |
| 0.0 | 0.1 | GO:0071883 | activation of MAPK activity by adrenergic receptor signaling pathway(GO:0071883) |
| 0.0 | 0.1 | GO:0071850 | mitotic cell cycle arrest(GO:0071850) |
| 0.0 | 0.1 | GO:1903012 | positive regulation of bone development(GO:1903012) |
| 0.0 | 0.0 | GO:0010982 | regulation of high-density lipoprotein particle clearance(GO:0010982) |
| 0.0 | 0.2 | GO:0000012 | single strand break repair(GO:0000012) |
| 0.0 | 0.1 | GO:1904379 | protein localization to cytosolic proteasome complex(GO:1904327) protein localization to cytosolic proteasome complex involved in ERAD pathway(GO:1904379) |
| 0.0 | 0.4 | GO:0001675 | acrosome assembly(GO:0001675) |
| 0.0 | 0.7 | GO:0007566 | embryo implantation(GO:0007566) |
| 0.0 | 0.1 | GO:0072321 | chaperone-mediated protein transport(GO:0072321) |
| 0.0 | 0.0 | GO:2000767 | positive regulation of cytoplasmic translation(GO:2000767) |
| 0.0 | 0.3 | GO:0033081 | regulation of T cell differentiation in thymus(GO:0033081) regulation of thymocyte aggregation(GO:2000398) |
| 0.0 | 0.6 | GO:0044458 | motile cilium assembly(GO:0044458) |
| 0.0 | 0.2 | GO:2000427 | positive regulation of apoptotic cell clearance(GO:2000427) |
| 0.0 | 0.5 | GO:0090162 | establishment of epithelial cell polarity(GO:0090162) |
| 0.0 | 0.1 | GO:0032927 | positive regulation of activin receptor signaling pathway(GO:0032927) |
| 0.0 | 0.3 | GO:0070934 | CRD-mediated mRNA stabilization(GO:0070934) |
| 0.0 | 0.4 | GO:0021904 | dorsal/ventral neural tube patterning(GO:0021904) |
| 0.0 | 0.1 | GO:0070902 | mitochondrial tRNA pseudouridine synthesis(GO:0070902) |
| 0.0 | 0.0 | GO:0072204 | cell-cell signaling involved in kidney development(GO:0060995) Wnt signaling pathway involved in kidney development(GO:0061289) canonical Wnt signaling pathway involved in metanephric kidney development(GO:0061290) cell-cell signaling involved in metanephros development(GO:0072204) |
| 0.0 | 0.3 | GO:0045577 | regulation of B cell differentiation(GO:0045577) |
| 0.0 | 0.3 | GO:0030422 | production of siRNA involved in RNA interference(GO:0030422) |
| 0.0 | 0.6 | GO:0050832 | defense response to fungus(GO:0050832) |
| 0.0 | 0.3 | GO:0098535 | de novo centriole assembly(GO:0098535) |
| 0.0 | 0.5 | GO:0034389 | lipid particle organization(GO:0034389) |
| 0.0 | 0.2 | GO:0070863 | positive regulation of protein exit from endoplasmic reticulum(GO:0070863) |
| 0.0 | 0.8 | GO:0000245 | spliceosomal complex assembly(GO:0000245) |
| 0.0 | 0.2 | GO:0007168 | receptor guanylyl cyclase signaling pathway(GO:0007168) |
| 0.0 | 0.1 | GO:0035803 | egg coat formation(GO:0035803) |
| 0.0 | 0.3 | GO:0003301 | physiological muscle hypertrophy(GO:0003298) physiological cardiac muscle hypertrophy(GO:0003301) cell growth involved in cardiac muscle cell development(GO:0061049) |
| 0.0 | 0.1 | GO:0071922 | establishment of sister chromatid cohesion(GO:0034085) cohesin loading(GO:0071921) regulation of cohesin loading(GO:0071922) |
| 0.0 | 0.0 | GO:0006452 | translational frameshifting(GO:0006452) positive regulation of translational termination(GO:0045905) |
| 0.0 | 0.1 | GO:0035886 | vascular smooth muscle cell differentiation(GO:0035886) |
| 0.0 | 0.1 | GO:0071918 | urea transmembrane transport(GO:0071918) |
| 0.0 | 0.0 | GO:0047484 | regulation of response to osmotic stress(GO:0047484) |
| 0.0 | 0.0 | GO:0045838 | positive regulation of membrane potential(GO:0045838) |
| 0.0 | 0.1 | GO:0072718 | response to cisplatin(GO:0072718) |
| 0.0 | 0.1 | GO:0048213 | Golgi vesicle prefusion complex stabilization(GO:0048213) |
| 0.0 | 0.0 | GO:0061101 | neuroendocrine cell differentiation(GO:0061101) |
| 0.0 | 0.1 | GO:0042416 | dopamine biosynthetic process(GO:0042416) |
| 0.0 | 0.4 | GO:0090557 | establishment of endothelial intestinal barrier(GO:0090557) |
| 0.0 | 0.0 | GO:0010643 | cell communication by chemical coupling(GO:0010643) |
| 0.0 | 0.0 | GO:0043380 | regulation of memory T cell differentiation(GO:0043380) |
| 0.0 | 0.0 | GO:0051771 | negative regulation of nitric-oxide synthase biosynthetic process(GO:0051771) |
| 0.0 | 0.2 | GO:0051725 | protein de-ADP-ribosylation(GO:0051725) |
| 0.0 | 0.2 | GO:1900262 | regulation of DNA-directed DNA polymerase activity(GO:1900262) positive regulation of DNA-directed DNA polymerase activity(GO:1900264) |
| 0.0 | 0.0 | GO:0042636 | negative regulation of hair cycle(GO:0042636) |
| 0.0 | 0.1 | GO:1903376 | neuron intrinsic apoptotic signaling pathway in response to oxidative stress(GO:0036480) regulation of oxidative stress-induced neuron intrinsic apoptotic signaling pathway(GO:1903376) |
| 0.0 | 0.1 | GO:1904806 | regulation of protein oxidation(GO:1904806) positive regulation of protein oxidation(GO:1904808) |
| 0.0 | 0.1 | GO:0006421 | asparaginyl-tRNA aminoacylation(GO:0006421) |
| 0.0 | 0.0 | GO:0072334 | UDP-galactose transport(GO:0015785) UDP-galactose transmembrane transport(GO:0072334) |
| 0.0 | 0.4 | GO:0006337 | nucleosome disassembly(GO:0006337) protein-DNA complex disassembly(GO:0032986) |
| 0.0 | 0.1 | GO:0035947 | regulation of gluconeogenesis by regulation of transcription from RNA polymerase II promoter(GO:0035947) |
| 0.0 | 0.1 | GO:0016259 | selenocysteine metabolic process(GO:0016259) |
| 0.0 | 0.1 | GO:0042023 | regulation of DNA endoreduplication(GO:0032875) DNA endoreduplication(GO:0042023) |
| 0.0 | 0.1 | GO:0000920 | cell separation after cytokinesis(GO:0000920) |
| 0.0 | 0.1 | GO:0048712 | negative regulation of astrocyte differentiation(GO:0048712) |
| 0.0 | 0.1 | GO:0052150 | suppression by virus of host apoptotic process(GO:0019050) negative regulation by symbiont of host apoptotic process(GO:0033668) modulation by virus of host apoptotic process(GO:0039526) modulation of programmed cell death in other organism(GO:0044531) modulation of apoptotic process in other organism(GO:0044532) modulation by symbiont of host programmed cell death(GO:0052040) negative regulation by symbiont of host programmed cell death(GO:0052041) modulation by symbiont of host apoptotic process(GO:0052150) modulation of programmed cell death in other organism involved in symbiotic interaction(GO:0052248) modulation by organism of apoptotic process in other organism involved in symbiotic interaction(GO:0052433) negative regulation by organism of programmed cell death in other organism involved in symbiotic interaction(GO:0052490) |
| 0.0 | 0.1 | GO:2000870 | regulation of progesterone secretion(GO:2000870) |
| 0.0 | 0.1 | GO:0032691 | negative regulation of interleukin-1 beta production(GO:0032691) |
| 0.0 | 0.1 | GO:0034312 | diol biosynthetic process(GO:0034312) sphingosine biosynthetic process(GO:0046512) |
| 0.0 | 0.1 | GO:1900042 | positive regulation of interleukin-2 secretion(GO:1900042) |
| 0.0 | 0.1 | GO:0031643 | positive regulation of myelination(GO:0031643) |
| 0.0 | 0.4 | GO:0046501 | protoporphyrinogen IX metabolic process(GO:0046501) |
| 0.0 | 0.0 | GO:0046203 | spermidine catabolic process(GO:0046203) |
| 0.0 | 0.1 | GO:0006183 | GTP biosynthetic process(GO:0006183) |
| 0.0 | 0.2 | GO:0042036 | negative regulation of cytokine biosynthetic process(GO:0042036) |
| 0.0 | 0.5 | GO:0022900 | electron transport chain(GO:0022900) |
| 0.0 | 0.0 | GO:0048550 | negative regulation of pinocytosis(GO:0048550) |
| 0.0 | 0.1 | GO:0030472 | mitotic spindle organization in nucleus(GO:0030472) |
| 0.0 | 0.1 | GO:1901842 | negative regulation of high voltage-gated calcium channel activity(GO:1901842) |
| 0.0 | 0.1 | GO:0071394 | cellular response to testosterone stimulus(GO:0071394) |
| 0.0 | 0.1 | GO:0010836 | negative regulation of protein ADP-ribosylation(GO:0010836) |
| 0.0 | 0.0 | GO:0048339 | paraxial mesoderm development(GO:0048339) |
| 0.0 | 0.2 | GO:0046475 | glycerophospholipid catabolic process(GO:0046475) |
| 0.0 | 0.2 | GO:0042532 | negative regulation of tyrosine phosphorylation of STAT protein(GO:0042532) |
| 0.0 | 0.2 | GO:0090136 | epithelial cell-cell adhesion(GO:0090136) |
| 0.0 | 0.0 | GO:0061357 | positive regulation of Wnt protein secretion(GO:0061357) |
| 0.0 | 0.1 | GO:0072365 | regulation of cellular ketone metabolic process by negative regulation of transcription from RNA polymerase II promoter(GO:0072365) |
| 0.0 | 0.1 | GO:0034315 | regulation of Arp2/3 complex-mediated actin nucleation(GO:0034315) |
| 0.0 | 0.2 | GO:0097267 | omega-hydroxylase P450 pathway(GO:0097267) |
| 0.0 | 0.1 | GO:0042447 | hormone catabolic process(GO:0042447) |
| 0.0 | 0.1 | GO:0090666 | scaRNA localization to Cajal body(GO:0090666) |
| 0.0 | 0.2 | GO:0035608 | protein deglutamylation(GO:0035608) |
| 0.0 | 0.2 | GO:0032331 | negative regulation of chondrocyte differentiation(GO:0032331) |
| 0.0 | 0.1 | GO:0072697 | protein localization to cell cortex(GO:0072697) |
| 0.0 | 0.0 | GO:2000642 | negative regulation of early endosome to late endosome transport(GO:2000642) |
| 0.0 | 0.3 | GO:0031639 | plasminogen activation(GO:0031639) |
| 0.0 | 0.2 | GO:0046836 | glycolipid transport(GO:0046836) |
| 0.0 | 0.0 | GO:2000504 | positive regulation of blood vessel remodeling(GO:2000504) |
| 0.0 | 0.1 | GO:0097021 | lymphocyte migration into lymphoid organs(GO:0097021) |
| 0.0 | 0.2 | GO:0018202 | peptidyl-histidine modification(GO:0018202) |
| 0.0 | 0.1 | GO:1904970 | brush border assembly(GO:1904970) |
| 0.0 | 0.1 | GO:1990022 | RNA polymerase II complex import to nucleus(GO:0044376) RNA polymerase III complex localization to nucleus(GO:1990022) |
| 0.0 | 0.1 | GO:0001865 | NK T cell differentiation(GO:0001865) |
| 0.0 | 0.1 | GO:1904245 | regulation of polynucleotide adenylyltransferase activity(GO:1904245) |
| 0.0 | 0.2 | GO:1901661 | quinone metabolic process(GO:1901661) |
| 0.0 | 0.2 | GO:2000675 | negative regulation of type B pancreatic cell apoptotic process(GO:2000675) |
| 0.0 | 0.3 | GO:2000052 | positive regulation of non-canonical Wnt signaling pathway(GO:2000052) |
| 0.0 | 0.1 | GO:0030157 | pancreatic juice secretion(GO:0030157) |
| 0.0 | 0.3 | GO:0016578 | histone deubiquitination(GO:0016578) |
| 0.0 | 0.0 | GO:0042904 | 9-cis-retinoic acid biosynthetic process(GO:0042904) 9-cis-retinoic acid metabolic process(GO:0042905) |
| 0.0 | 0.0 | GO:0060631 | regulation of meiosis I(GO:0060631) |
| 0.0 | 0.0 | GO:0042182 | ketone catabolic process(GO:0042182) |
| 0.0 | 0.6 | GO:0045669 | positive regulation of osteoblast differentiation(GO:0045669) |
| 0.0 | 0.0 | GO:0045919 | positive regulation of cytolysis(GO:0045919) |
| 0.0 | 0.1 | GO:0090131 | mesenchyme migration(GO:0090131) |
| 0.0 | 0.3 | GO:0036066 | protein O-linked fucosylation(GO:0036066) |
| 0.0 | 0.0 | GO:0002717 | positive regulation of natural killer cell mediated immunity(GO:0002717) |
| 0.0 | 0.0 | GO:0003221 | right ventricular cardiac muscle tissue morphogenesis(GO:0003221) |
| 0.0 | 0.1 | GO:0021966 | corticospinal neuron axon guidance(GO:0021966) |
| 0.0 | 0.1 | GO:0018094 | protein polyglycylation(GO:0018094) |
| 0.0 | 0.1 | GO:0060561 | apoptotic process involved in morphogenesis(GO:0060561) |
| 0.0 | 0.0 | GO:0048388 | endosomal lumen acidification(GO:0048388) |
| 0.0 | 0.1 | GO:0045423 | regulation of granulocyte macrophage colony-stimulating factor biosynthetic process(GO:0045423) |
| 0.0 | 0.0 | GO:0097490 | sympathetic neuron projection extension(GO:0097490) sympathetic neuron projection guidance(GO:0097491) |
| 0.0 | 0.1 | GO:2000253 | positive regulation of feeding behavior(GO:2000253) |
| 0.0 | 0.1 | GO:0046784 | viral mRNA export from host cell nucleus(GO:0046784) |
| 0.0 | 0.2 | GO:2000651 | positive regulation of sodium ion transmembrane transporter activity(GO:2000651) |
| 0.0 | 0.1 | GO:0001561 | fatty acid alpha-oxidation(GO:0001561) |
| 0.0 | 0.1 | GO:0006659 | phosphatidylserine biosynthetic process(GO:0006659) |
| 0.0 | 0.1 | GO:2000909 | regulation of cholesterol import(GO:0060620) regulation of sterol import(GO:2000909) |
| 0.0 | 0.1 | GO:0006620 | posttranslational protein targeting to membrane(GO:0006620) |
| 0.0 | 0.9 | GO:0018279 | peptidyl-asparagine modification(GO:0018196) protein N-linked glycosylation via asparagine(GO:0018279) |
| 0.0 | 0.1 | GO:0034983 | peptidyl-lysine deacetylation(GO:0034983) |
| 0.0 | 0.6 | GO:0007077 | mitotic nuclear envelope disassembly(GO:0007077) |
| 0.0 | 0.0 | GO:1902959 | regulation of aspartic-type endopeptidase activity involved in amyloid precursor protein catabolic process(GO:1902959) regulation of aspartic-type peptidase activity(GO:1905245) |
| 0.0 | 0.1 | GO:0043981 | histone H4-K5 acetylation(GO:0043981) histone H4-K8 acetylation(GO:0043982) |
| 0.0 | 0.1 | GO:0035635 | entry of bacterium into host cell(GO:0035635) |
| 0.0 | 0.0 | GO:0006478 | peptidyl-tyrosine sulfation(GO:0006478) |
| 0.0 | 0.1 | GO:0035583 | sequestering of TGFbeta in extracellular matrix(GO:0035583) |
| 0.0 | 0.0 | GO:0001868 | regulation of complement activation, lectin pathway(GO:0001868) negative regulation of complement activation, lectin pathway(GO:0001869) |
| 0.0 | 1.6 | GO:0006614 | SRP-dependent cotranslational protein targeting to membrane(GO:0006614) |
| 0.0 | 0.0 | GO:0002386 | immune response in mucosal-associated lymphoid tissue(GO:0002386) |
| 0.0 | 0.1 | GO:0006558 | L-phenylalanine metabolic process(GO:0006558) L-phenylalanine catabolic process(GO:0006559) erythrose 4-phosphate/phosphoenolpyruvate family amino acid metabolic process(GO:1902221) erythrose 4-phosphate/phosphoenolpyruvate family amino acid catabolic process(GO:1902222) |
| 0.0 | 0.0 | GO:0038183 | bile acid signaling pathway(GO:0038183) |
| 0.0 | 0.0 | GO:1903778 | protein localization to vacuolar membrane(GO:1903778) |
| 0.0 | 0.2 | GO:0042269 | regulation of natural killer cell mediated cytotoxicity(GO:0042269) |
| 0.0 | 0.0 | GO:2000617 | positive regulation of histone H3-K9 acetylation(GO:2000617) |
| 0.0 | 0.0 | GO:1990426 | homologous recombination-dependent replication fork processing(GO:1990426) |
| 0.0 | 0.1 | GO:0090022 | regulation of neutrophil chemotaxis(GO:0090022) |
| 0.0 | 0.1 | GO:0022417 | protein maturation by protein folding(GO:0022417) |
| 0.0 | 0.1 | GO:0010039 | response to iron ion(GO:0010039) |
| 0.0 | 0.5 | GO:0030032 | lamellipodium assembly(GO:0030032) |
| 0.0 | 0.0 | GO:2000449 | CD8-positive, alpha-beta T cell extravasation(GO:0035697) CD8-positive, alpha-beta cytotoxic T cell extravasation(GO:0035698) T cell extravasation(GO:0072683) regulation of T cell extravasation(GO:2000407) regulation of CD8-positive, alpha-beta T cell extravasation(GO:2000449) regulation of CD8-positive, alpha-beta cytotoxic T cell extravasation(GO:2000452) |
| 0.0 | 0.2 | GO:0007026 | negative regulation of microtubule depolymerization(GO:0007026) |
| 0.0 | 0.0 | GO:1901881 | positive regulation of protein depolymerization(GO:1901881) |
| 0.0 | 0.1 | GO:0031120 | snRNA pseudouridine synthesis(GO:0031120) |
| 0.0 | 0.1 | GO:0000338 | protein deneddylation(GO:0000338) |
| 0.0 | 0.1 | GO:1990440 | positive regulation of transcription from RNA polymerase II promoter in response to endoplasmic reticulum stress(GO:1990440) |
| 0.0 | 0.2 | GO:0070584 | mitochondrion morphogenesis(GO:0070584) |
| 0.0 | 0.1 | GO:1903361 | protein localization to basolateral plasma membrane(GO:1903361) |
| 0.0 | 0.0 | GO:0071635 | negative regulation of transforming growth factor beta production(GO:0071635) |
| 0.0 | 0.1 | GO:0061366 | behavioral response to chemical pain(GO:0061366) behavioral response to formalin induced pain(GO:0061368) |
| 0.0 | 0.2 | GO:2001244 | positive regulation of intrinsic apoptotic signaling pathway(GO:2001244) |
| 0.0 | 0.0 | GO:1900154 | regulation of bone trabecula formation(GO:1900154) negative regulation of bone trabecula formation(GO:1900155) |
| 0.0 | 0.0 | GO:0007023 | post-chaperonin tubulin folding pathway(GO:0007023) |
| 0.0 | 0.2 | GO:0071554 | cell wall macromolecule metabolic process(GO:0044036) cell wall organization or biogenesis(GO:0071554) |
| 0.0 | 0.5 | GO:0030593 | neutrophil chemotaxis(GO:0030593) |
| 0.0 | 0.1 | GO:0036438 | maintenance of lens transparency(GO:0036438) |
| 0.0 | 0.0 | GO:0071372 | cellular response to follicle-stimulating hormone stimulus(GO:0071372) |
| 0.0 | 0.0 | GO:0099566 | regulation of postsynaptic cytosolic calcium ion concentration(GO:0099566) |
| 0.0 | 0.0 | GO:0060830 | ciliary receptor clustering involved in smoothened signaling pathway(GO:0060830) |
| 0.0 | 0.1 | GO:0009220 | pyrimidine ribonucleotide biosynthetic process(GO:0009220) |
| 0.0 | 0.0 | GO:0006393 | termination of mitochondrial transcription(GO:0006393) |
| 0.0 | 0.4 | GO:0046839 | phospholipid dephosphorylation(GO:0046839) |
| 0.0 | 0.0 | GO:0051599 | response to hydrostatic pressure(GO:0051599) |
| 0.0 | 0.3 | GO:0070536 | protein K63-linked deubiquitination(GO:0070536) |
| 0.0 | 0.0 | GO:0010835 | regulation of protein ADP-ribosylation(GO:0010835) |
| 0.0 | 0.2 | GO:0030150 | protein import into mitochondrial matrix(GO:0030150) |
| 0.0 | 0.1 | GO:1904816 | positive regulation of protein localization to chromosome, telomeric region(GO:1904816) |
| 0.0 | 0.0 | GO:0080154 | regulation of fertilization(GO:0080154) |
| 0.0 | 0.0 | GO:0007198 | adenylate cyclase-inhibiting serotonin receptor signaling pathway(GO:0007198) |
| 0.0 | 0.0 | GO:0071109 | superior temporal gyrus development(GO:0071109) |
| 0.0 | 0.0 | GO:0038044 | transforming growth factor-beta secretion(GO:0038044) |
Gene overrepresentation in cellular component category:
| Log-likelihood per target | Total log-likelihood | Term | Description |
|---|---|---|---|
| 0.6 | 2.4 | GO:0032937 | SREBP-SCAP-Insig complex(GO:0032937) |
| 0.6 | 1.7 | GO:0044753 | amphisome(GO:0044753) |
| 0.5 | 7.1 | GO:0033256 | I-kappaB/NF-kappaB complex(GO:0033256) |
| 0.5 | 2.3 | GO:0072558 | NLRP1 inflammasome complex(GO:0072558) |
| 0.4 | 3.6 | GO:0098560 | cytoplasmic side of late endosome membrane(GO:0098560) |
| 0.4 | 1.6 | GO:0097196 | Shu complex(GO:0097196) |
| 0.4 | 1.2 | GO:1990666 | PCSK9-LDLR complex(GO:1990666) |
| 0.4 | 3.4 | GO:0071144 | SMAD2-SMAD3 protein complex(GO:0071144) |
| 0.4 | 1.1 | GO:0055028 | cortical microtubule(GO:0055028) |
| 0.3 | 0.3 | GO:0019034 | viral replication complex(GO:0019034) |
| 0.3 | 2.7 | GO:1903440 | calcitonin family receptor complex(GO:1903439) amylin receptor complex(GO:1903440) |
| 0.3 | 11.5 | GO:0031233 | intrinsic component of external side of plasma membrane(GO:0031233) |
| 0.3 | 1.4 | GO:1990796 | photoreceptor cell terminal bouton(GO:1990796) |
| 0.3 | 1.6 | GO:1990682 | CSF1-CSF1R complex(GO:1990682) |
| 0.3 | 1.5 | GO:0009331 | glycerol-3-phosphate dehydrogenase complex(GO:0009331) |
| 0.2 | 1.2 | GO:0016533 | cyclin-dependent protein kinase 5 holoenzyme complex(GO:0016533) |
| 0.2 | 1.4 | GO:0070022 | transforming growth factor beta receptor homodimeric complex(GO:0070022) |
| 0.2 | 0.9 | GO:0005595 | collagen type XII trimer(GO:0005595) |
| 0.2 | 1.1 | GO:0005927 | muscle tendon junction(GO:0005927) |
| 0.2 | 1.9 | GO:0042406 | extrinsic component of endoplasmic reticulum membrane(GO:0042406) |
| 0.2 | 2.5 | GO:0032593 | insulin-responsive compartment(GO:0032593) |
| 0.2 | 1.4 | GO:0034750 | Scrib-APC-beta-catenin complex(GO:0034750) |
| 0.2 | 1.5 | GO:0005797 | Golgi medial cisterna(GO:0005797) |
| 0.2 | 0.8 | GO:0010009 | cytoplasmic side of endosome membrane(GO:0010009) |
| 0.2 | 6.3 | GO:0016327 | apicolateral plasma membrane(GO:0016327) |
| 0.2 | 0.5 | GO:0031251 | PAN complex(GO:0031251) |
| 0.2 | 0.9 | GO:0097513 | myosin II filament(GO:0097513) |
| 0.2 | 2.0 | GO:0016600 | flotillin complex(GO:0016600) |
| 0.2 | 0.9 | GO:0070557 | PCNA-p21 complex(GO:0070557) |
| 0.2 | 0.5 | GO:0098592 | cytoplasmic side of apical plasma membrane(GO:0098592) |
| 0.2 | 1.4 | GO:0002169 | 3-methylcrotonyl-CoA carboxylase complex, mitochondrial(GO:0002169) methylcrotonoyl-CoA carboxylase complex(GO:1905202) |
| 0.2 | 0.2 | GO:0098576 | lumenal side of membrane(GO:0098576) |
| 0.2 | 1.0 | GO:0005955 | calcineurin complex(GO:0005955) |
| 0.2 | 0.5 | GO:0008623 | CHRAC(GO:0008623) |
| 0.2 | 1.0 | GO:1990246 | uniplex complex(GO:1990246) |
| 0.2 | 0.5 | GO:0097135 | cyclin E2-CDK2 complex(GO:0097135) |
| 0.2 | 0.8 | GO:1902560 | GMP reductase complex(GO:1902560) |
| 0.2 | 0.2 | GO:0034667 | integrin alpha3-beta1 complex(GO:0034667) |
| 0.2 | 3.3 | GO:0000177 | cytoplasmic exosome (RNase complex)(GO:0000177) |
| 0.2 | 4.5 | GO:0000145 | exocyst(GO:0000145) |
| 0.2 | 0.5 | GO:0097057 | TRAF2-GSTP1 complex(GO:0097057) |
| 0.2 | 0.5 | GO:0071148 | TEAD-1-YAP complex(GO:0071148) |
| 0.2 | 0.5 | GO:0071006 | U2-type catalytic step 1 spliceosome(GO:0071006) |
| 0.2 | 0.8 | GO:0031302 | intrinsic component of endosome membrane(GO:0031302) |
| 0.2 | 1.2 | GO:0097443 | sorting endosome(GO:0097443) |
| 0.1 | 0.1 | GO:0020016 | ciliary pocket(GO:0020016) ciliary pocket membrane(GO:0020018) |
| 0.1 | 0.4 | GO:1990917 | sperm head plasma membrane(GO:1990913) ooplasm(GO:1990917) |
| 0.1 | 1.3 | GO:0071546 | pi-body(GO:0071546) |
| 0.1 | 2.1 | GO:0000124 | SAGA complex(GO:0000124) |
| 0.1 | 1.6 | GO:0000506 | glycosylphosphatidylinositol-N-acetylglucosaminyltransferase (GPI-GnT) complex(GO:0000506) |
| 0.1 | 0.5 | GO:0032144 | 4-aminobutyrate transaminase complex(GO:0032144) |
| 0.1 | 0.4 | GO:1990590 | ATF1-ATF4 transcription factor complex(GO:1990590) |
| 0.1 | 3.1 | GO:0097342 | ripoptosome(GO:0097342) |
| 0.1 | 1.2 | GO:0097470 | ribbon synapse(GO:0097470) |
| 0.1 | 0.4 | GO:0034271 | phosphatidylinositol 3-kinase complex, class III, type I(GO:0034271) phosphatidylinositol 3-kinase complex, class III, type II(GO:0034272) |
| 0.1 | 0.8 | GO:1990131 | Gtr1-Gtr2 GTPase complex(GO:1990131) |
| 0.1 | 0.3 | GO:0031088 | platelet dense granule membrane(GO:0031088) |
| 0.1 | 0.9 | GO:0005947 | mitochondrial alpha-ketoglutarate dehydrogenase complex(GO:0005947) |
| 0.1 | 0.5 | GO:0035517 | PR-DUB complex(GO:0035517) |
| 0.1 | 0.7 | GO:0005967 | mitochondrial pyruvate dehydrogenase complex(GO:0005967) |
| 0.1 | 0.4 | GO:0005900 | oncostatin-M receptor complex(GO:0005900) |
| 0.1 | 2.5 | GO:0005845 | mRNA cap binding complex(GO:0005845) |
| 0.1 | 0.9 | GO:0043541 | UDP-N-acetylglucosamine transferase complex(GO:0043541) |
| 0.1 | 0.4 | GO:0070195 | growth hormone receptor complex(GO:0070195) |
| 0.1 | 0.6 | GO:0034666 | integrin alpha2-beta1 complex(GO:0034666) |
| 0.1 | 0.6 | GO:0032301 | MutSalpha complex(GO:0032301) |
| 0.1 | 0.8 | GO:1990597 | AIP1-IRE1 complex(GO:1990597) |
| 0.1 | 0.1 | GO:0030062 | mitochondrial tricarboxylic acid cycle enzyme complex(GO:0030062) |
| 0.1 | 2.1 | GO:0045180 | basal cortex(GO:0045180) |
| 0.1 | 0.2 | GO:0033185 | dolichol-phosphate-mannose synthase complex(GO:0033185) |
| 0.1 | 0.7 | GO:0048787 | presynaptic active zone membrane(GO:0048787) |
| 0.1 | 0.5 | GO:0042720 | mitochondrial inner membrane peptidase complex(GO:0042720) |
| 0.1 | 1.5 | GO:0097136 | Bcl-2 family protein complex(GO:0097136) |
| 0.1 | 0.5 | GO:0031510 | SUMO activating enzyme complex(GO:0031510) |
| 0.1 | 0.6 | GO:0030906 | retromer, cargo-selective complex(GO:0030906) |
| 0.1 | 0.3 | GO:1990622 | CHOP-ATF3 complex(GO:1990622) |
| 0.1 | 0.7 | GO:0000221 | vacuolar proton-transporting V-type ATPase, V1 domain(GO:0000221) |
| 0.1 | 0.7 | GO:0032541 | cortical endoplasmic reticulum(GO:0032541) |
| 0.1 | 0.7 | GO:0005663 | DNA replication factor C complex(GO:0005663) |
| 0.1 | 0.3 | GO:0097232 | lamellar body membrane(GO:0097232) alveolar lamellar body membrane(GO:0097233) |
| 0.1 | 0.4 | GO:1990589 | ATF4-CREB1 transcription factor complex(GO:1990589) |
| 0.1 | 0.5 | GO:0070826 | paraferritin complex(GO:0070826) |
| 0.1 | 0.8 | GO:0033503 | HULC complex(GO:0033503) |
| 0.1 | 1.0 | GO:0065010 | extracellular membrane-bounded organelle(GO:0065010) |
| 0.1 | 2.6 | GO:0005686 | U2 snRNP(GO:0005686) |
| 0.1 | 2.4 | GO:0005952 | cAMP-dependent protein kinase complex(GO:0005952) |
| 0.1 | 0.3 | GO:0071062 | alphav-beta3 integrin-vitronectin complex(GO:0071062) |
| 0.1 | 1.7 | GO:0042555 | MCM complex(GO:0042555) |
| 0.1 | 0.6 | GO:0000125 | PCAF complex(GO:0000125) |
| 0.1 | 0.7 | GO:1990812 | growth cone filopodium(GO:1990812) |
| 0.1 | 0.3 | GO:0005674 | transcription factor TFIIF complex(GO:0005674) |
| 0.1 | 0.2 | GO:0000805 | X chromosome(GO:0000805) |
| 0.1 | 0.1 | GO:0034274 | Atg12-Atg5-Atg16 complex(GO:0034274) |
| 0.1 | 0.2 | GO:0032127 | dense core granule membrane(GO:0032127) |
| 0.1 | 0.8 | GO:0016589 | NURF complex(GO:0016589) |
| 0.1 | 0.2 | GO:0071437 | invadopodium(GO:0071437) |
| 0.1 | 6.4 | GO:0005782 | peroxisomal matrix(GO:0005782) microbody lumen(GO:0031907) |
| 0.1 | 0.5 | GO:0000138 | Golgi trans cisterna(GO:0000138) |
| 0.1 | 0.6 | GO:0000308 | cytoplasmic cyclin-dependent protein kinase holoenzyme complex(GO:0000308) |
| 0.1 | 0.4 | GO:0031314 | extrinsic component of mitochondrial inner membrane(GO:0031314) |
| 0.1 | 0.5 | GO:0043527 | tRNA methyltransferase complex(GO:0043527) |
| 0.1 | 2.3 | GO:0031095 | platelet dense tubular network membrane(GO:0031095) |
| 0.1 | 0.1 | GO:0030981 | cortical microtubule cytoskeleton(GO:0030981) |
| 0.1 | 0.5 | GO:0042765 | GPI-anchor transamidase complex(GO:0042765) |
| 0.1 | 1.4 | GO:0001741 | XY body(GO:0001741) |
| 0.1 | 0.4 | GO:0031905 | early endosome lumen(GO:0031905) |
| 0.1 | 0.8 | GO:0001940 | male pronucleus(GO:0001940) |
| 0.1 | 1.1 | GO:0033588 | Elongator holoenzyme complex(GO:0033588) |
| 0.1 | 0.4 | GO:0005899 | insulin receptor complex(GO:0005899) |
| 0.1 | 0.3 | GO:0071001 | U4/U6 snRNP(GO:0071001) |
| 0.1 | 0.3 | GO:1990879 | CST complex(GO:1990879) |
| 0.1 | 0.7 | GO:0071986 | Ragulator complex(GO:0071986) |
| 0.1 | 0.3 | GO:0044615 | nuclear pore nuclear basket(GO:0044615) |
| 0.1 | 0.7 | GO:0005851 | eukaryotic translation initiation factor 2B complex(GO:0005851) |
| 0.1 | 0.1 | GO:0000220 | vacuolar proton-transporting V-type ATPase, V0 domain(GO:0000220) |
| 0.1 | 1.8 | GO:0005682 | U5 snRNP(GO:0005682) |
| 0.1 | 0.3 | GO:0098647 | collagen type VI trimer(GO:0005589) collagen beaded filament(GO:0098647) |
| 0.1 | 0.4 | GO:0005749 | mitochondrial respiratory chain complex II, succinate dehydrogenase complex (ubiquinone)(GO:0005749) succinate dehydrogenase complex (ubiquinone)(GO:0045257) respiratory chain complex II(GO:0045273) succinate dehydrogenase complex(GO:0045281) fumarate reductase complex(GO:0045283) |
| 0.1 | 1.3 | GO:0000813 | ESCRT I complex(GO:0000813) |
| 0.1 | 0.5 | GO:0097013 | phagocytic vesicle lumen(GO:0097013) |
| 0.1 | 1.0 | GO:0016593 | Cdc73/Paf1 complex(GO:0016593) |
| 0.1 | 1.1 | GO:0072546 | ER membrane protein complex(GO:0072546) |
| 0.1 | 2.2 | GO:0043218 | compact myelin(GO:0043218) |
| 0.1 | 0.9 | GO:0016011 | dystroglycan complex(GO:0016011) |
| 0.1 | 0.9 | GO:0033018 | sarcoplasmic reticulum lumen(GO:0033018) |
| 0.1 | 0.6 | GO:0044614 | nuclear pore cytoplasmic filaments(GO:0044614) |
| 0.1 | 0.6 | GO:0033063 | Rad51B-Rad51C-Rad51D-XRCC2 complex(GO:0033063) |
| 0.1 | 0.9 | GO:0070652 | HAUS complex(GO:0070652) |
| 0.1 | 0.2 | GO:0036117 | hyaluranon cable(GO:0036117) |
| 0.1 | 0.6 | GO:0000110 | nucleotide-excision repair factor 1 complex(GO:0000110) |
| 0.1 | 1.2 | GO:0005862 | muscle thin filament tropomyosin(GO:0005862) |
| 0.1 | 0.3 | GO:0071817 | MMXD complex(GO:0071817) |
| 0.1 | 2.4 | GO:0035098 | ESC/E(Z) complex(GO:0035098) |
| 0.1 | 0.5 | GO:0005658 | alpha DNA polymerase:primase complex(GO:0005658) |
| 0.1 | 0.8 | GO:0042567 | insulin-like growth factor ternary complex(GO:0042567) |
| 0.1 | 5.4 | GO:0005747 | mitochondrial respiratory chain complex I(GO:0005747) NADH dehydrogenase complex(GO:0030964) respiratory chain complex I(GO:0045271) |
| 0.1 | 0.3 | GO:0071203 | WASH complex(GO:0071203) |
| 0.1 | 0.4 | GO:0042643 | actomyosin, actin portion(GO:0042643) |
| 0.1 | 0.2 | GO:0097058 | CRLF-CLCF1 complex(GO:0097058) |
| 0.1 | 0.5 | GO:0036021 | endolysosome lumen(GO:0036021) |
| 0.1 | 0.7 | GO:0005655 | nucleolar ribonuclease P complex(GO:0005655) |
| 0.1 | 0.9 | GO:0000322 | storage vacuole(GO:0000322) |
| 0.1 | 0.2 | GO:0034657 | GID complex(GO:0034657) |
| 0.1 | 0.7 | GO:0002116 | semaphorin receptor complex(GO:0002116) |
| 0.1 | 0.8 | GO:0031465 | Cul4B-RING E3 ubiquitin ligase complex(GO:0031465) |
| 0.1 | 0.5 | GO:0033180 | proton-transporting V-type ATPase, V1 domain(GO:0033180) |
| 0.1 | 0.4 | GO:0097255 | R2TP complex(GO:0097255) |
| 0.1 | 0.6 | GO:0032777 | Piccolo NuA4 histone acetyltransferase complex(GO:0032777) |
| 0.1 | 0.2 | GO:0034686 | integrin alphav-beta8 complex(GO:0034686) |
| 0.1 | 0.3 | GO:0035032 | phosphatidylinositol 3-kinase complex, class III(GO:0035032) |
| 0.1 | 1.1 | GO:0035327 | transcriptionally active chromatin(GO:0035327) |
| 0.1 | 4.0 | GO:0030173 | integral component of Golgi membrane(GO:0030173) |
| 0.1 | 0.6 | GO:0042719 | mitochondrial intermembrane space protein transporter complex(GO:0042719) |
| 0.1 | 1.2 | GO:0097386 | glial cell projection(GO:0097386) |
| 0.1 | 0.6 | GO:0098845 | postsynaptic endosome(GO:0098845) |
| 0.1 | 1.0 | GO:0031209 | SCAR complex(GO:0031209) |
| 0.1 | 0.1 | GO:0048237 | rough endoplasmic reticulum lumen(GO:0048237) |
| 0.1 | 0.8 | GO:0031298 | replication fork protection complex(GO:0031298) |
| 0.1 | 0.3 | GO:0045323 | interleukin-1 receptor complex(GO:0045323) |
| 0.1 | 0.2 | GO:0060187 | cell pole(GO:0060187) |
| 0.1 | 0.6 | GO:0030877 | beta-catenin destruction complex(GO:0030877) |
| 0.1 | 0.5 | GO:0045252 | oxoglutarate dehydrogenase complex(GO:0045252) |
| 0.1 | 0.3 | GO:0098554 | cytoplasmic side of endoplasmic reticulum membrane(GO:0098554) |
| 0.1 | 0.6 | GO:0070765 | gamma-secretase complex(GO:0070765) |
| 0.1 | 10.4 | GO:0043202 | lysosomal lumen(GO:0043202) |
| 0.1 | 3.0 | GO:0005859 | muscle myosin complex(GO:0005859) |
| 0.1 | 2.3 | GO:0071564 | npBAF complex(GO:0071564) |
| 0.1 | 0.3 | GO:0032449 | CBM complex(GO:0032449) |
| 0.1 | 0.5 | GO:0016272 | prefoldin complex(GO:0016272) |
| 0.1 | 0.5 | GO:0030915 | Smc5-Smc6 complex(GO:0030915) |
| 0.1 | 1.5 | GO:0046930 | pore complex(GO:0046930) |
| 0.1 | 0.7 | GO:0031595 | nuclear proteasome complex(GO:0031595) |
| 0.1 | 1.4 | GO:0044300 | cerebellar mossy fiber(GO:0044300) |
| 0.1 | 0.3 | GO:1990769 | proximal neuron projection(GO:1990769) |
| 0.1 | 0.3 | GO:0036396 | MIS complex(GO:0036396) mRNA editing complex(GO:0045293) |
| 0.1 | 0.2 | GO:0044611 | nuclear pore inner ring(GO:0044611) |
| 0.1 | 0.7 | GO:0060091 | kinocilium(GO:0060091) |
| 0.1 | 0.1 | GO:0042721 | mitochondrial inner membrane protein insertion complex(GO:0042721) |
| 0.1 | 1.7 | GO:0000421 | autophagosome membrane(GO:0000421) |
| 0.1 | 0.8 | GO:0034464 | BBSome(GO:0034464) |
| 0.1 | 0.3 | GO:0005726 | perichromatin fibrils(GO:0005726) |
| 0.1 | 0.4 | GO:0070531 | BRCA1-A complex(GO:0070531) |
| 0.1 | 0.5 | GO:0030896 | checkpoint clamp complex(GO:0030896) |
| 0.1 | 1.1 | GO:0005847 | mRNA cleavage and polyadenylation specificity factor complex(GO:0005847) |
| 0.1 | 0.3 | GO:0032044 | DSIF complex(GO:0032044) |
| 0.1 | 0.3 | GO:0001405 | presequence translocase-associated import motor(GO:0001405) |
| 0.1 | 0.4 | GO:0008540 | proteasome regulatory particle, base subcomplex(GO:0008540) |
| 0.1 | 4.8 | GO:0035580 | specific granule lumen(GO:0035580) |
| 0.1 | 0.1 | GO:0010370 | perinucleolar chromocenter(GO:0010370) |
| 0.1 | 0.1 | GO:1990761 | growth cone lamellipodium(GO:1990761) |
| 0.1 | 0.6 | GO:0042382 | paraspeckles(GO:0042382) |
| 0.1 | 0.6 | GO:0070552 | BRISC complex(GO:0070552) |
| 0.1 | 0.5 | GO:0071953 | elastic fiber(GO:0071953) |
| 0.1 | 0.3 | GO:0005958 | DNA-dependent protein kinase-DNA ligase 4 complex(GO:0005958) |
| 0.1 | 0.6 | GO:0005964 | phosphorylase kinase complex(GO:0005964) |
| 0.1 | 0.2 | GO:0005715 | late recombination nodule(GO:0005715) |
| 0.1 | 0.5 | GO:0051286 | cell tip(GO:0051286) |
| 0.1 | 0.9 | GO:0031414 | N-terminal protein acetyltransferase complex(GO:0031414) |
| 0.1 | 3.8 | GO:0005762 | organellar large ribosomal subunit(GO:0000315) mitochondrial large ribosomal subunit(GO:0005762) |
| 0.1 | 0.2 | GO:0071920 | cleavage body(GO:0071920) |
| 0.1 | 0.4 | GO:0005785 | signal recognition particle receptor complex(GO:0005785) |
| 0.1 | 0.2 | GO:1990730 | VCP-NSFL1C complex(GO:1990730) |
| 0.1 | 0.1 | GO:0034719 | SMN-Sm protein complex(GO:0034719) |
| 0.1 | 0.5 | GO:0031466 | Cul5-RING ubiquitin ligase complex(GO:0031466) |
| 0.1 | 0.2 | GO:0097444 | spine apparatus(GO:0097444) |
| 0.1 | 0.7 | GO:0032432 | actin filament bundle(GO:0032432) |
| 0.1 | 0.6 | GO:0033162 | melanosome membrane(GO:0033162) chitosome(GO:0045009) |
| 0.1 | 0.4 | GO:0070436 | Grb2-EGFR complex(GO:0070436) |
| 0.1 | 0.2 | GO:0032982 | myosin filament(GO:0032982) |
| 0.1 | 0.2 | GO:0039713 | viral factory(GO:0039713) cytoplasmic viral factory(GO:0039714) host cell viral assembly compartment(GO:0072517) |
| 0.0 | 2.0 | GO:0000407 | pre-autophagosomal structure(GO:0000407) |
| 0.0 | 0.5 | GO:0044354 | pinosome(GO:0044352) macropinosome(GO:0044354) |
| 0.0 | 0.1 | GO:0031501 | mannosyltransferase complex(GO:0031501) |
| 0.0 | 0.8 | GO:0043020 | NADPH oxidase complex(GO:0043020) |
| 0.0 | 1.0 | GO:0031143 | pseudopodium(GO:0031143) |
| 0.0 | 0.8 | GO:0036513 | Derlin-1 retrotranslocation complex(GO:0036513) |
| 0.0 | 0.1 | GO:0031084 | BLOC-2 complex(GO:0031084) |
| 0.0 | 0.2 | GO:0045254 | pyruvate dehydrogenase complex(GO:0045254) |
| 0.0 | 0.7 | GO:0042641 | actomyosin(GO:0042641) |
| 0.0 | 0.1 | GO:0005753 | mitochondrial proton-transporting ATP synthase complex(GO:0005753) proton-transporting ATP synthase complex(GO:0045259) |
| 0.0 | 1.6 | GO:0031092 | platelet alpha granule membrane(GO:0031092) |
| 0.0 | 0.1 | GO:0030678 | mitochondrial ribonuclease P complex(GO:0030678) |
| 0.0 | 1.2 | GO:0031527 | filopodium membrane(GO:0031527) |
| 0.0 | 0.0 | GO:0000835 | ER ubiquitin ligase complex(GO:0000835) Hrd1p ubiquitin ligase complex(GO:0000836) |
| 0.0 | 0.3 | GO:0001652 | granular component(GO:0001652) |
| 0.0 | 0.4 | GO:0097442 | CA3 pyramidal cell dendrite(GO:0097442) |
| 0.0 | 0.7 | GO:0005751 | mitochondrial respiratory chain complex IV(GO:0005751) |
| 0.0 | 0.2 | GO:0044307 | dendritic branch(GO:0044307) |
| 0.0 | 0.2 | GO:0030897 | HOPS complex(GO:0030897) |
| 0.0 | 0.4 | GO:0097197 | tetraspanin-enriched microdomain(GO:0097197) |
| 0.0 | 0.4 | GO:0017059 | serine C-palmitoyltransferase complex(GO:0017059) endoplasmic reticulum palmitoyltransferase complex(GO:0031211) |
| 0.0 | 0.6 | GO:0008290 | F-actin capping protein complex(GO:0008290) |
| 0.0 | 0.1 | GO:0032116 | SMC loading complex(GO:0032116) |
| 0.0 | 2.4 | GO:0031201 | SNARE complex(GO:0031201) |
| 0.0 | 2.3 | GO:0008023 | transcription elongation factor complex(GO:0008023) |
| 0.0 | 3.2 | GO:0045178 | basal part of cell(GO:0045178) |
| 0.0 | 0.1 | GO:0035189 | Rb-E2F complex(GO:0035189) |
| 0.0 | 1.0 | GO:0035371 | microtubule plus-end(GO:0035371) |
| 0.0 | 0.3 | GO:0032389 | MutLalpha complex(GO:0032389) |
| 0.0 | 2.7 | GO:0016459 | myosin complex(GO:0016459) |
| 0.0 | 5.4 | GO:0070821 | tertiary granule membrane(GO:0070821) |
| 0.0 | 0.2 | GO:0071438 | invadopodium membrane(GO:0071438) |
| 0.0 | 0.6 | GO:0005790 | smooth endoplasmic reticulum(GO:0005790) |
| 0.0 | 1.8 | GO:0035869 | ciliary transition zone(GO:0035869) |
| 0.0 | 0.1 | GO:0032002 | interleukin-28 receptor complex(GO:0032002) |
| 0.0 | 0.3 | GO:0014731 | spectrin-associated cytoskeleton(GO:0014731) |
| 0.0 | 0.2 | GO:0031523 | Myb complex(GO:0031523) |
| 0.0 | 0.1 | GO:0000814 | ESCRT II complex(GO:0000814) |
| 0.0 | 1.0 | GO:0005746 | mitochondrial respiratory chain(GO:0005746) |
| 0.0 | 0.3 | GO:0034388 | Pwp2p-containing subcomplex of 90S preribosome(GO:0034388) |
| 0.0 | 0.6 | GO:0030478 | actin cap(GO:0030478) |
| 0.0 | 0.7 | GO:0097431 | mitotic spindle pole(GO:0097431) |
| 0.0 | 0.5 | GO:0031616 | spindle pole centrosome(GO:0031616) |
| 0.0 | 0.2 | GO:0005971 | ribonucleoside-diphosphate reductase complex(GO:0005971) |
| 0.0 | 1.6 | GO:0002080 | acrosomal membrane(GO:0002080) |
| 0.0 | 3.8 | GO:0031093 | platelet alpha granule lumen(GO:0031093) |
| 0.0 | 0.4 | GO:0032797 | SMN complex(GO:0032797) |
| 0.0 | 1.2 | GO:0005640 | nuclear outer membrane(GO:0005640) |
| 0.0 | 1.7 | GO:0101003 | ficolin-1-rich granule membrane(GO:0101003) |
| 0.0 | 3.9 | GO:0005758 | mitochondrial intermembrane space(GO:0005758) |
| 0.0 | 0.4 | GO:0000808 | origin recognition complex(GO:0000808) nuclear origin of replication recognition complex(GO:0005664) |
| 0.0 | 0.4 | GO:0042588 | zymogen granule(GO:0042588) |
| 0.0 | 0.1 | GO:0098843 | postsynaptic endocytic zone(GO:0098843) |
| 0.0 | 2.9 | GO:0030864 | cortical actin cytoskeleton(GO:0030864) |
| 0.0 | 0.7 | GO:0097526 | spliceosomal tri-snRNP complex(GO:0097526) |
| 0.0 | 0.3 | GO:0061617 | MICOS complex(GO:0061617) |
| 0.0 | 0.2 | GO:0044326 | dendritic spine neck(GO:0044326) |
| 0.0 | 0.2 | GO:0033263 | CORVET complex(GO:0033263) |
| 0.0 | 1.3 | GO:0070820 | tertiary granule(GO:0070820) |
| 0.0 | 0.5 | GO:0031080 | nuclear pore outer ring(GO:0031080) |
| 0.0 | 0.1 | GO:0032444 | activin responsive factor complex(GO:0032444) |
| 0.0 | 5.6 | GO:0000932 | cytoplasmic mRNA processing body(GO:0000932) |
| 0.0 | 0.2 | GO:0030891 | VCB complex(GO:0030891) |
| 0.0 | 0.2 | GO:0072557 | IPAF inflammasome complex(GO:0072557) |
| 0.0 | 0.3 | GO:0032585 | multivesicular body membrane(GO:0032585) |
| 0.0 | 0.4 | GO:0043190 | ATP-binding cassette (ABC) transporter complex(GO:0043190) |
| 0.0 | 0.5 | GO:0031906 | late endosome lumen(GO:0031906) |
| 0.0 | 1.3 | GO:0030140 | trans-Golgi network transport vesicle(GO:0030140) |
| 0.0 | 0.1 | GO:0034455 | t-UTP complex(GO:0034455) |
| 0.0 | 3.3 | GO:0031463 | Cul3-RING ubiquitin ligase complex(GO:0031463) |
| 0.0 | 0.1 | GO:0070876 | SOSS complex(GO:0070876) |
| 0.0 | 0.6 | GO:0000164 | protein phosphatase type 1 complex(GO:0000164) |
| 0.0 | 1.2 | GO:0000314 | organellar small ribosomal subunit(GO:0000314) mitochondrial small ribosomal subunit(GO:0005763) |
| 0.0 | 0.1 | GO:0034993 | microtubule organizing center attachment site(GO:0034992) LINC complex(GO:0034993) |
| 0.0 | 0.4 | GO:0031931 | TORC1 complex(GO:0031931) |
| 0.0 | 0.2 | GO:0061689 | tricellular tight junction(GO:0061689) |
| 0.0 | 0.1 | GO:0097598 | sperm cytoplasmic droplet(GO:0097598) |
| 0.0 | 0.2 | GO:0035976 | AP1 complex(GO:0035976) |
| 0.0 | 0.7 | GO:0044613 | nuclear pore central transport channel(GO:0044613) |
| 0.0 | 0.3 | GO:0072687 | meiotic spindle(GO:0072687) |
| 0.0 | 7.5 | GO:0030027 | lamellipodium(GO:0030027) |
| 0.0 | 0.1 | GO:0005853 | eukaryotic translation elongation factor 1 complex(GO:0005853) |
| 0.0 | 0.5 | GO:0030122 | AP-2 adaptor complex(GO:0030122) |
| 0.0 | 0.2 | GO:0070369 | beta-catenin-TCF7L2 complex(GO:0070369) |
| 0.0 | 2.3 | GO:0042581 | specific granule(GO:0042581) |
| 0.0 | 0.0 | GO:0030061 | mitochondrial crista(GO:0030061) |
| 0.0 | 2.5 | GO:0030175 | filopodium(GO:0030175) |
| 0.0 | 1.7 | GO:0097542 | ciliary tip(GO:0097542) |
| 0.0 | 5.2 | GO:0030176 | integral component of endoplasmic reticulum membrane(GO:0030176) |
| 0.0 | 2.8 | GO:0035578 | azurophil granule lumen(GO:0035578) |
| 0.0 | 1.0 | GO:0043034 | costamere(GO:0043034) |
| 0.0 | 0.2 | GO:0005885 | Arp2/3 protein complex(GO:0005885) |
| 0.0 | 0.8 | GO:0031011 | Ino80 complex(GO:0031011) DNA helicase complex(GO:0033202) |
| 0.0 | 0.5 | GO:0042827 | platelet dense granule(GO:0042827) |
| 0.0 | 0.3 | GO:0032059 | bleb(GO:0032059) |
| 0.0 | 0.1 | GO:0071752 | dimeric IgA immunoglobulin complex(GO:0071750) secretory dimeric IgA immunoglobulin complex(GO:0071752) |
| 0.0 | 0.9 | GO:0035145 | exon-exon junction complex(GO:0035145) |
| 0.0 | 0.1 | GO:0071012 | catalytic step 1 spliceosome(GO:0071012) |
| 0.0 | 0.4 | GO:0030008 | TRAPP complex(GO:0030008) |
| 0.0 | 0.6 | GO:0005736 | DNA-directed RNA polymerase I complex(GO:0005736) |
| 0.0 | 0.2 | GO:0000408 | EKC/KEOPS complex(GO:0000408) |
| 0.0 | 0.4 | GO:0000347 | THO complex(GO:0000347) THO complex part of transcription export complex(GO:0000445) |
| 0.0 | 13.9 | GO:0005924 | cell-substrate adherens junction(GO:0005924) |
| 0.0 | 0.1 | GO:0033178 | proton-transporting two-sector ATPase complex, catalytic domain(GO:0033178) |
| 0.0 | 14.0 | GO:0005764 | lytic vacuole(GO:0000323) lysosome(GO:0005764) |
| 0.0 | 0.2 | GO:0045179 | apical cortex(GO:0045179) |
| 0.0 | 0.1 | GO:0000176 | nuclear exosome (RNase complex)(GO:0000176) |
| 0.0 | 1.0 | GO:0031519 | PcG protein complex(GO:0031519) |
| 0.0 | 8.9 | GO:0005743 | mitochondrial inner membrane(GO:0005743) |
| 0.0 | 0.6 | GO:0000930 | gamma-tubulin complex(GO:0000930) |
| 0.0 | 0.0 | GO:0005828 | kinetochore microtubule(GO:0005828) |
| 0.0 | 0.4 | GO:0000815 | ESCRT III complex(GO:0000815) |
| 0.0 | 0.2 | GO:0072487 | MSL complex(GO:0072487) |
| 0.0 | 0.3 | GO:0035253 | ciliary rootlet(GO:0035253) |
| 0.0 | 0.2 | GO:0005956 | protein kinase CK2 complex(GO:0005956) |
| 0.0 | 0.1 | GO:0070939 | Dsl1p complex(GO:0070939) |
| 0.0 | 0.3 | GO:0005775 | vacuolar lumen(GO:0005775) |
| 0.0 | 0.1 | GO:0071598 | neuronal ribonucleoprotein granule(GO:0071598) |
| 0.0 | 0.0 | GO:0044609 | DBIRD complex(GO:0044609) |
| 0.0 | 0.4 | GO:0016281 | eukaryotic translation initiation factor 4F complex(GO:0016281) |
| 0.0 | 0.1 | GO:0000243 | commitment complex(GO:0000243) |
| 0.0 | 1.7 | GO:0005901 | caveola(GO:0005901) |
| 0.0 | 1.4 | GO:0005643 | nuclear pore(GO:0005643) |
| 0.0 | 2.8 | GO:0031901 | early endosome membrane(GO:0031901) |
| 0.0 | 0.0 | GO:0000942 | condensed nuclear chromosome outer kinetochore(GO:0000942) |
| 0.0 | 1.4 | GO:0016529 | sarcoplasmic reticulum(GO:0016529) |
| 0.0 | 1.0 | GO:0016592 | mediator complex(GO:0016592) |
| 0.0 | 0.3 | GO:0005675 | holo TFIIH complex(GO:0005675) |
| 0.0 | 0.1 | GO:1990356 | sumoylated E2 ligase complex(GO:1990356) |
| 0.0 | 0.5 | GO:0034706 | sodium channel complex(GO:0034706) |
| 0.0 | 0.1 | GO:0005602 | complement component C1 complex(GO:0005602) |
| 0.0 | 0.1 | GO:0097129 | cyclin D2-CDK4 complex(GO:0097129) |
| 0.0 | 0.7 | GO:0072686 | mitotic spindle(GO:0072686) |
| 0.0 | 0.1 | GO:0097125 | cyclin B1-CDK1 complex(GO:0097125) |
| 0.0 | 0.0 | GO:0044393 | microspike(GO:0044393) |
| 0.0 | 0.0 | GO:0005713 | recombination nodule(GO:0005713) |
| 0.0 | 1.7 | GO:0030018 | Z disc(GO:0030018) |
| 0.0 | 0.1 | GO:0031265 | CD95 death-inducing signaling complex(GO:0031265) |
| 0.0 | 0.0 | GO:0071149 | TEAD-2-YAP complex(GO:0071149) |
| 0.0 | 0.1 | GO:0000137 | Golgi cis cisterna(GO:0000137) |
| 0.0 | 0.0 | GO:1990851 | Wnt-Frizzled-LRP5/6 complex(GO:1990851) |
| 0.0 | 0.1 | GO:0017109 | glutamate-cysteine ligase complex(GO:0017109) |
| 0.0 | 0.2 | GO:0070937 | CRD-mediated mRNA stability complex(GO:0070937) |
| 0.0 | 0.3 | GO:0060077 | inhibitory synapse(GO:0060077) |
| 0.0 | 0.3 | GO:0030126 | COPI vesicle coat(GO:0030126) |
| 0.0 | 0.8 | GO:0030667 | secretory granule membrane(GO:0030667) |
| 0.0 | 0.9 | GO:0032588 | trans-Golgi network membrane(GO:0032588) |
| 0.0 | 0.1 | GO:0048500 | signal recognition particle, endoplasmic reticulum targeting(GO:0005786) signal recognition particle(GO:0048500) |
| 0.0 | 0.2 | GO:0008385 | IkappaB kinase complex(GO:0008385) |
| 0.0 | 0.0 | GO:0070435 | Shc-EGFR complex(GO:0070435) |
| 0.0 | 0.2 | GO:0000974 | Prp19 complex(GO:0000974) |
| 0.0 | 0.0 | GO:0097224 | sperm connecting piece(GO:0097224) |
| 0.0 | 6.0 | GO:0005759 | mitochondrial matrix(GO:0005759) |
| 0.0 | 0.1 | GO:0043564 | Ku70:Ku80 complex(GO:0043564) |
| 0.0 | 0.5 | GO:0032155 | cell division site(GO:0032153) cell division site part(GO:0032155) |
| 0.0 | 0.6 | GO:0030687 | preribosome, large subunit precursor(GO:0030687) |
| 0.0 | 0.0 | GO:0035061 | interchromatin granule(GO:0035061) |
| 0.0 | 0.2 | GO:0005833 | hemoglobin complex(GO:0005833) |
| 0.0 | 0.1 | GO:0005854 | nascent polypeptide-associated complex(GO:0005854) |
| 0.0 | 7.2 | GO:0005813 | centrosome(GO:0005813) |
| 0.0 | 0.0 | GO:0030663 | COPI-coated vesicle membrane(GO:0030663) |
| 0.0 | 0.0 | GO:0030677 | ribonuclease P complex(GO:0030677) |
| 0.0 | 0.0 | GO:0035867 | alphav-beta3 integrin-IGF-1-IGF1R complex(GO:0035867) |
| 0.0 | 0.1 | GO:0031464 | Cul4A-RING E3 ubiquitin ligase complex(GO:0031464) |
| 0.0 | 1.0 | GO:0030136 | clathrin-coated vesicle(GO:0030136) |
| 0.0 | 0.5 | GO:0032420 | stereocilium(GO:0032420) |
| 0.0 | 0.1 | GO:0072589 | box H/ACA snoRNP complex(GO:0031429) box H/ACA RNP complex(GO:0072588) box H/ACA scaRNP complex(GO:0072589) box H/ACA telomerase RNP complex(GO:0090661) |
| 0.0 | 0.4 | GO:0022627 | cytosolic small ribosomal subunit(GO:0022627) |
| 0.0 | 0.0 | GO:0000799 | nuclear condensin complex(GO:0000799) |
| 0.0 | 0.1 | GO:0061700 | GATOR2 complex(GO:0061700) |
| 0.0 | 0.0 | GO:0034715 | pICln-Sm protein complex(GO:0034715) |
| 0.0 | 0.1 | GO:0005945 | 6-phosphofructokinase complex(GO:0005945) |
| 0.0 | 0.0 | GO:0031205 | endoplasmic reticulum Sec complex(GO:0031205) |
| 0.0 | 0.0 | GO:0044308 | axonal spine(GO:0044308) |
| 0.0 | 0.0 | GO:0060342 | photoreceptor inner segment membrane(GO:0060342) |
| 0.0 | 0.3 | GO:0045335 | phagocytic vesicle(GO:0045335) |
| 0.0 | 0.1 | GO:1990635 | proximal dendrite(GO:1990635) |
Gene overrepresentation in molecular function category:
| Log-likelihood per target | Total log-likelihood | Term | Description |
|---|---|---|---|
| 1.0 | 3.1 | GO:0042008 | interleukin-18 receptor activity(GO:0042008) |
| 0.9 | 6.0 | GO:0001225 | RNA polymerase II transcription coactivator binding(GO:0001225) |
| 0.8 | 3.2 | GO:0035939 | microsatellite binding(GO:0035939) |
| 0.7 | 4.5 | GO:0004699 | calcium-independent protein kinase C activity(GO:0004699) |
| 0.6 | 2.4 | GO:0050262 | ribosylnicotinamide kinase activity(GO:0050262) ribosylnicotinate kinase activity(GO:0061769) |
| 0.6 | 1.7 | GO:0046577 | long-chain-alcohol oxidase activity(GO:0046577) |
| 0.6 | 4.6 | GO:0008269 | JAK pathway signal transduction adaptor activity(GO:0008269) |
| 0.6 | 1.7 | GO:0072590 | N-acetyl-L-aspartate-L-glutamate ligase activity(GO:0072590) |
| 0.5 | 1.6 | GO:0051990 | (R)-2-hydroxyglutarate dehydrogenase activity(GO:0051990) |
| 0.5 | 1.6 | GO:0004336 | galactosylceramidase activity(GO:0004336) |
| 0.5 | 1.6 | GO:0030549 | acetylcholine receptor activator activity(GO:0030549) |
| 0.5 | 2.0 | GO:0004909 | interleukin-1, Type I, activating receptor activity(GO:0004909) |
| 0.5 | 1.4 | GO:0046921 | glycoprotein 6-alpha-L-fucosyltransferase activity(GO:0008424) alpha-(1->6)-fucosyltransferase activity(GO:0046921) |
| 0.5 | 1.4 | GO:0047256 | beta-galactosyl-N-acetylglucosaminylgalactosylglucosyl-ceramide beta-1,3-acetylglucosaminyltransferase activity(GO:0008457) lactosylceramide 1,3-N-acetyl-beta-D-glucosaminyltransferase activity(GO:0047256) |
| 0.4 | 1.3 | GO:0004850 | uridine phosphorylase activity(GO:0004850) |
| 0.4 | 2.2 | GO:0003896 | DNA primase activity(GO:0003896) |
| 0.4 | 1.3 | GO:0008431 | vitamin E binding(GO:0008431) |
| 0.4 | 1.3 | GO:0004008 | copper-exporting ATPase activity(GO:0004008) copper-transporting ATPase activity(GO:0043682) |
| 0.4 | 2.1 | GO:0046624 | sphingolipid transporter activity(GO:0046624) |
| 0.4 | 5.0 | GO:0005114 | type II transforming growth factor beta receptor binding(GO:0005114) |
| 0.4 | 2.0 | GO:0047280 | nicotinamide phosphoribosyltransferase activity(GO:0047280) |
| 0.4 | 1.2 | GO:0003826 | alpha-ketoacid dehydrogenase activity(GO:0003826) 3-methyl-2-oxobutanoate dehydrogenase (2-methylpropanoyl-transferring) activity(GO:0003863) |
| 0.4 | 1.6 | GO:0004906 | interferon-gamma receptor activity(GO:0004906) |
| 0.4 | 2.3 | GO:0031962 | mineralocorticoid receptor binding(GO:0031962) |
| 0.4 | 6.5 | GO:0008140 | cAMP response element binding protein binding(GO:0008140) |
| 0.4 | 5.4 | GO:0045236 | CXCR chemokine receptor binding(GO:0045236) |
| 0.3 | 1.7 | GO:0030298 | receptor signaling protein tyrosine kinase activator activity(GO:0030298) |
| 0.3 | 2.7 | GO:0052832 | inositol monophosphate 1-phosphatase activity(GO:0008934) inositol monophosphate 3-phosphatase activity(GO:0052832) inositol monophosphate 4-phosphatase activity(GO:0052833) inositol monophosphate phosphatase activity(GO:0052834) |
| 0.3 | 1.7 | GO:0070573 | metallodipeptidase activity(GO:0070573) |
| 0.3 | 1.0 | GO:0017099 | very-long-chain-acyl-CoA dehydrogenase activity(GO:0017099) |
| 0.3 | 1.0 | GO:1904713 | beta-catenin destruction complex binding(GO:1904713) |
| 0.3 | 2.0 | GO:0003873 | 6-phosphofructo-2-kinase activity(GO:0003873) |
| 0.3 | 2.7 | GO:0097643 | amylin receptor activity(GO:0097643) |
| 0.3 | 1.6 | GO:0004905 | type I interferon receptor activity(GO:0004905) |
| 0.3 | 1.6 | GO:0004719 | protein-L-isoaspartate (D-aspartate) O-methyltransferase activity(GO:0004719) |
| 0.3 | 1.3 | GO:0098808 | mRNA cap binding(GO:0098808) |
| 0.3 | 1.9 | GO:0090554 | phosphatidylcholine-translocating ATPase activity(GO:0090554) |
| 0.3 | 1.0 | GO:0005292 | high-affinity basic amino acid transmembrane transporter activity(GO:0005287) high-affinity arginine transmembrane transporter activity(GO:0005289) high-affinity lysine transmembrane transporter activity(GO:0005292) |
| 0.3 | 1.3 | GO:0004609 | phosphatidylserine decarboxylase activity(GO:0004609) |
| 0.3 | 0.9 | GO:0008903 | hydroxypyruvate isomerase activity(GO:0008903) |
| 0.3 | 1.6 | GO:0004803 | transposase activity(GO:0004803) |
| 0.3 | 3.1 | GO:0004784 | superoxide dismutase activity(GO:0004784) oxidoreductase activity, acting on superoxide radicals as acceptor(GO:0016721) |
| 0.3 | 1.2 | GO:0003987 | acetate-CoA ligase activity(GO:0003987) |
| 0.3 | 1.2 | GO:0016880 | glutamate-ammonia ligase activity(GO:0004356) ammonia ligase activity(GO:0016211) acid-ammonia (or amide) ligase activity(GO:0016880) |
| 0.3 | 2.4 | GO:0009008 | DNA-methyltransferase activity(GO:0009008) |
| 0.3 | 0.3 | GO:0016531 | copper chaperone activity(GO:0016531) |
| 0.3 | 0.9 | GO:0004119 | cGMP-inhibited cyclic-nucleotide phosphodiesterase activity(GO:0004119) |
| 0.3 | 2.0 | GO:0004797 | thymidine kinase activity(GO:0004797) |
| 0.3 | 1.2 | GO:0047192 | 1-alkylglycerophosphocholine O-acetyltransferase activity(GO:0047192) |
| 0.3 | 0.9 | GO:0050509 | N-acetylglucosaminyl-proteoglycan 4-beta-glucuronosyltransferase activity(GO:0050509) |
| 0.3 | 0.9 | GO:0052856 | NADHX epimerase activity(GO:0052856) NADPHX epimerase activity(GO:0052857) |
| 0.3 | 1.1 | GO:0098770 | FBXO family protein binding(GO:0098770) |
| 0.3 | 1.1 | GO:0032450 | maltose alpha-glucosidase activity(GO:0032450) |
| 0.3 | 0.8 | GO:0050613 | delta14-sterol reductase activity(GO:0050613) |
| 0.3 | 1.1 | GO:0019770 | IgG receptor activity(GO:0019770) |
| 0.3 | 0.3 | GO:0008969 | phosphohistidine phosphatase activity(GO:0008969) |
| 0.3 | 1.6 | GO:0050659 | N-acetylgalactosamine 4-sulfate 6-O-sulfotransferase activity(GO:0050659) |
| 0.3 | 0.8 | GO:0030158 | protein xylosyltransferase activity(GO:0030158) |
| 0.3 | 0.8 | GO:0031783 | corticotropin hormone receptor binding(GO:0031780) type 5 melanocortin receptor binding(GO:0031783) |
| 0.3 | 1.1 | GO:0016524 | latrotoxin receptor activity(GO:0016524) |
| 0.3 | 0.8 | GO:0070991 | medium-chain-acyl-CoA dehydrogenase activity(GO:0070991) |
| 0.3 | 0.3 | GO:0046790 | virion binding(GO:0046790) |
| 0.3 | 1.0 | GO:0045569 | TRAIL binding(GO:0045569) |
| 0.3 | 0.8 | GO:0016401 | palmitoyl-CoA oxidase activity(GO:0016401) |
| 0.3 | 4.6 | GO:0031996 | thioesterase binding(GO:0031996) |
| 0.3 | 7.8 | GO:0005035 | tumor necrosis factor-activated receptor activity(GO:0005031) death receptor activity(GO:0005035) |
| 0.3 | 1.0 | GO:0004079 | biotin-[acetyl-CoA-carboxylase] ligase activity(GO:0004077) biotin-[methylcrotonoyl-CoA-carboxylase] ligase activity(GO:0004078) biotin-[methylmalonyl-CoA-carboxytransferase] ligase activity(GO:0004079) biotin-[propionyl-CoA-carboxylase (ATP-hydrolyzing)] ligase activity(GO:0004080) biotin-protein ligase activity(GO:0018271) |
| 0.2 | 1.0 | GO:0022865 | transmembrane electron transfer carrier(GO:0022865) |
| 0.2 | 0.7 | GO:0004416 | hydroxyacylglutathione hydrolase activity(GO:0004416) |
| 0.2 | 2.8 | GO:0039706 | co-receptor binding(GO:0039706) |
| 0.2 | 2.1 | GO:0008597 | calcium-dependent protein serine/threonine phosphatase regulator activity(GO:0008597) |
| 0.2 | 1.1 | GO:1903135 | cupric ion binding(GO:1903135) |
| 0.2 | 3.0 | GO:0071933 | Arp2/3 complex binding(GO:0071933) |
| 0.2 | 1.4 | GO:0039552 | RIG-I binding(GO:0039552) |
| 0.2 | 0.9 | GO:0016262 | protein N-acetylglucosaminyltransferase activity(GO:0016262) |
| 0.2 | 0.7 | GO:0055077 | gap junction hemi-channel activity(GO:0055077) |
| 0.2 | 0.5 | GO:0008665 | 2'-phosphotransferase activity(GO:0008665) |
| 0.2 | 1.8 | GO:0004046 | aminoacylase activity(GO:0004046) |
| 0.2 | 0.7 | GO:0004170 | dUTP diphosphatase activity(GO:0004170) |
| 0.2 | 0.9 | GO:0016215 | stearoyl-CoA 9-desaturase activity(GO:0004768) acyl-CoA desaturase activity(GO:0016215) |
| 0.2 | 0.9 | GO:1904408 | dihydronicotinamide riboside quinone reductase activity(GO:0001512) melatonin binding(GO:1904408) |
| 0.2 | 1.9 | GO:0004571 | mannosyl-oligosaccharide 1,2-alpha-mannosidase activity(GO:0004571) |
| 0.2 | 1.7 | GO:0015923 | mannosidase activity(GO:0015923) |
| 0.2 | 0.2 | GO:0005176 | ErbB-2 class receptor binding(GO:0005176) |
| 0.2 | 1.0 | GO:0047631 | ADP-ribose diphosphatase activity(GO:0047631) |
| 0.2 | 0.6 | GO:0035650 | AP-1 adaptor complex binding(GO:0035650) |
| 0.2 | 1.2 | GO:0042392 | sphingosine-1-phosphate phosphatase activity(GO:0042392) |
| 0.2 | 0.6 | GO:0005011 | macrophage colony-stimulating factor receptor activity(GO:0005011) |
| 0.2 | 0.8 | GO:0047493 | sphingomyelin synthase activity(GO:0033188) ceramide cholinephosphotransferase activity(GO:0047493) |
| 0.2 | 0.6 | GO:0004165 | dodecenoyl-CoA delta-isomerase activity(GO:0004165) |
| 0.2 | 0.6 | GO:0015275 | stretch-activated, cation-selective, calcium channel activity(GO:0015275) |
| 0.2 | 0.8 | GO:0003985 | acetyl-CoA C-acetyltransferase activity(GO:0003985) |
| 0.2 | 0.6 | GO:0042781 | 3'-tRNA processing endoribonuclease activity(GO:0042781) |
| 0.2 | 0.6 | GO:0005519 | cytoskeletal regulatory protein binding(GO:0005519) |
| 0.2 | 1.4 | GO:0004305 | ethanolamine kinase activity(GO:0004305) |
| 0.2 | 0.4 | GO:0008494 | translation activator activity(GO:0008494) |
| 0.2 | 1.6 | GO:0005087 | Ran guanyl-nucleotide exchange factor activity(GO:0005087) |
| 0.2 | 0.4 | GO:0004677 | DNA-dependent protein kinase activity(GO:0004677) |
| 0.2 | 1.8 | GO:0005375 | copper ion transmembrane transporter activity(GO:0005375) |
| 0.2 | 0.6 | GO:0031071 | cysteine desulfurase activity(GO:0031071) |
| 0.2 | 1.0 | GO:0046964 | 3'-phosphoadenosine 5'-phosphosulfate transmembrane transporter activity(GO:0046964) |
| 0.2 | 0.9 | GO:0008263 | pyrimidine-specific mismatch base pair DNA N-glycosylase activity(GO:0008263) |
| 0.2 | 0.9 | GO:0019912 | cyclin-dependent protein kinase activating kinase activity(GO:0019912) |
| 0.2 | 2.2 | GO:0030976 | thiamine pyrophosphate binding(GO:0030976) |
| 0.2 | 0.7 | GO:0003883 | CTP synthase activity(GO:0003883) |
| 0.2 | 0.6 | GO:0000773 | phosphatidyl-N-methylethanolamine N-methyltransferase activity(GO:0000773) phosphatidylethanolamine N-methyltransferase activity(GO:0004608) phosphatidyl-N-dimethylethanolamine N-methyltransferase activity(GO:0080101) |
| 0.2 | 1.8 | GO:0004565 | beta-galactosidase activity(GO:0004565) |
| 0.2 | 0.5 | GO:0090541 | MIT domain binding(GO:0090541) |
| 0.2 | 0.5 | GO:0097604 | temperature-gated cation channel activity(GO:0097604) |
| 0.2 | 0.2 | GO:0090555 | phosphatidylethanolamine-translocating ATPase activity(GO:0090555) |
| 0.2 | 1.4 | GO:0030620 | U2 snRNA binding(GO:0030620) |
| 0.2 | 0.5 | GO:0000252 | C-3 sterol dehydrogenase (C-4 sterol decarboxylase) activity(GO:0000252) sterol-4-alpha-carboxylate 3-dehydrogenase (decarboxylating) activity(GO:0047012) |
| 0.2 | 1.4 | GO:0004485 | methylcrotonoyl-CoA carboxylase activity(GO:0004485) |
| 0.2 | 2.4 | GO:0015379 | potassium:chloride symporter activity(GO:0015379) potassium ion symporter activity(GO:0022820) |
| 0.2 | 0.7 | GO:0033829 | O-fucosylpeptide 3-beta-N-acetylglucosaminyltransferase activity(GO:0033829) |
| 0.2 | 1.9 | GO:0051425 | PTB domain binding(GO:0051425) |
| 0.2 | 2.1 | GO:0005021 | vascular endothelial growth factor-activated receptor activity(GO:0005021) |
| 0.2 | 0.5 | GO:0060001 | minus-end directed microfilament motor activity(GO:0060001) |
| 0.2 | 0.5 | GO:1904928 | coreceptor activity involved in canonical Wnt signaling pathway(GO:1904928) |
| 0.2 | 0.5 | GO:0050309 | glucose-6-phosphatase activity(GO:0004346) sugar-terminal-phosphatase activity(GO:0050309) |
| 0.2 | 3.7 | GO:0004535 | poly(A)-specific ribonuclease activity(GO:0004535) |
| 0.2 | 3.2 | GO:0061578 | Lys63-specific deubiquitinase activity(GO:0061578) |
| 0.2 | 0.5 | GO:0052825 | inositol tetrakisphosphate 1-kinase activity(GO:0047325) inositol-1,3,4-trisphosphate 6-kinase activity(GO:0052725) inositol-1,3,4-trisphosphate 5-kinase activity(GO:0052726) inositol-1,3,4,5,6-pentakisphosphate 1-phosphatase activity(GO:0052825) inositol-1,3,4,6-tetrakisphosphate 6-phosphatase activity(GO:0052830) inositol-1,3,4,6-tetrakisphosphate 1-phosphatase activity(GO:0052831) inositol-3,4,6-trisphosphate 1-kinase activity(GO:0052835) |
| 0.2 | 0.2 | GO:0016453 | C-acetyltransferase activity(GO:0016453) |
| 0.2 | 0.8 | GO:1904288 | BAT3 complex binding(GO:1904288) |
| 0.2 | 0.5 | GO:0033699 | DNA 5'-adenosine monophosphate hydrolase activity(GO:0033699) |
| 0.2 | 0.2 | GO:0032767 | copper-dependent protein binding(GO:0032767) |
| 0.2 | 0.7 | GO:0004306 | ethanolamine-phosphate cytidylyltransferase activity(GO:0004306) |
| 0.2 | 1.7 | GO:0043813 | phosphatidylinositol-3,5-bisphosphate 5-phosphatase activity(GO:0043813) |
| 0.2 | 0.8 | GO:0008160 | protein tyrosine phosphatase activator activity(GO:0008160) |
| 0.2 | 0.8 | GO:0008453 | alanine-glyoxylate transaminase activity(GO:0008453) |
| 0.2 | 0.5 | GO:0070506 | high-density lipoprotein particle receptor activity(GO:0070506) |
| 0.2 | 1.3 | GO:0017150 | tRNA dihydrouridine synthase activity(GO:0017150) |
| 0.2 | 0.8 | GO:0003920 | GMP reductase activity(GO:0003920) oxidoreductase activity, acting on NAD(P)H, nitrogenous group as acceptor(GO:0016657) |
| 0.2 | 1.3 | GO:0015235 | cobalamin transporter activity(GO:0015235) |
| 0.2 | 0.5 | GO:0003692 | left-handed Z-DNA binding(GO:0003692) |
| 0.2 | 0.3 | GO:0004999 | vasoactive intestinal polypeptide receptor activity(GO:0004999) |
| 0.2 | 0.5 | GO:0032090 | Pyrin domain binding(GO:0032090) |
| 0.2 | 1.6 | GO:0001042 | RNA polymerase I core binding(GO:0001042) |
| 0.2 | 0.5 | GO:0035730 | S-nitrosoglutathione binding(GO:0035730) dinitrosyl-iron complex binding(GO:0035731) |
| 0.2 | 0.5 | GO:0008670 | 2,4-dienoyl-CoA reductase (NADPH) activity(GO:0008670) |
| 0.2 | 0.5 | GO:0008940 | nitrate reductase activity(GO:0008940) molybdopterin adenylyltransferase activity(GO:0061598) molybdopterin molybdotransferase activity(GO:0061599) |
| 0.2 | 0.8 | GO:0032810 | sterol response element binding(GO:0032810) |
| 0.2 | 0.8 | GO:0043183 | vascular endothelial growth factor receptor 1 binding(GO:0043183) |
| 0.2 | 2.8 | GO:0035259 | glucocorticoid receptor binding(GO:0035259) |
| 0.2 | 1.5 | GO:0017176 | phosphatidylinositol N-acetylglucosaminyltransferase activity(GO:0017176) |
| 0.2 | 0.3 | GO:0004605 | phosphatidate cytidylyltransferase activity(GO:0004605) |
| 0.2 | 1.2 | GO:0001025 | RNA polymerase III transcription factor binding(GO:0001025) |
| 0.1 | 1.3 | GO:0036042 | long-chain fatty acyl-CoA binding(GO:0036042) |
| 0.1 | 0.6 | GO:0070053 | thrombospondin receptor activity(GO:0070053) |
| 0.1 | 3.1 | GO:0008253 | 5'-nucleotidase activity(GO:0008253) |
| 0.1 | 0.4 | GO:0080023 | 3R-hydroxyacyl-CoA dehydratase activity(GO:0080023) |
| 0.1 | 0.4 | GO:0000293 | ferric-chelate reductase activity(GO:0000293) |
| 0.1 | 0.4 | GO:0003860 | 3-hydroxyisobutyryl-CoA hydrolase activity(GO:0003860) |
| 0.1 | 0.3 | GO:0015925 | galactosidase activity(GO:0015925) |
| 0.1 | 0.7 | GO:0047066 | phospholipid-hydroperoxide glutathione peroxidase activity(GO:0047066) |
| 0.1 | 0.9 | GO:0035800 | deubiquitinase activator activity(GO:0035800) |
| 0.1 | 2.3 | GO:0019911 | structural constituent of myelin sheath(GO:0019911) |
| 0.1 | 0.9 | GO:0038062 | protein tyrosine kinase collagen receptor activity(GO:0038062) |
| 0.1 | 0.4 | GO:0002135 | CTP binding(GO:0002135) |
| 0.1 | 0.7 | GO:0004084 | branched-chain-amino-acid transaminase activity(GO:0004084) L-leucine transaminase activity(GO:0052654) L-valine transaminase activity(GO:0052655) L-isoleucine transaminase activity(GO:0052656) |
| 0.1 | 1.4 | GO:0071253 | connexin binding(GO:0071253) |
| 0.1 | 0.6 | GO:0032440 | 2-alkenal reductase [NAD(P)] activity(GO:0032440) |
| 0.1 | 1.4 | GO:0017169 | CDP-alcohol phosphatidyltransferase activity(GO:0017169) |
| 0.1 | 0.4 | GO:0008534 | oxidized purine nucleobase lesion DNA N-glycosylase activity(GO:0008534) |
| 0.1 | 0.1 | GO:0008311 | double-stranded DNA 3'-5' exodeoxyribonuclease activity(GO:0008311) |
| 0.1 | 1.0 | GO:0005324 | long-chain fatty acid transporter activity(GO:0005324) |
| 0.1 | 0.7 | GO:0004464 | leukotriene-C4 synthase activity(GO:0004464) |
| 0.1 | 0.4 | GO:0003941 | L-serine ammonia-lyase activity(GO:0003941) |
| 0.1 | 0.5 | GO:1990430 | extracellular matrix protein binding(GO:1990430) |
| 0.1 | 0.1 | GO:0048763 | calcium-induced calcium release activity(GO:0048763) |
| 0.1 | 2.2 | GO:0000014 | single-stranded DNA endodeoxyribonuclease activity(GO:0000014) |
| 0.1 | 0.5 | GO:0070404 | NADH binding(GO:0070404) |
| 0.1 | 0.7 | GO:0001888 | glucuronyl-galactosyl-proteoglycan 4-alpha-N-acetylglucosaminyltransferase activity(GO:0001888) |
| 0.1 | 0.1 | GO:0050816 | phosphothreonine binding(GO:0050816) |
| 0.1 | 0.7 | GO:0031750 | D3 dopamine receptor binding(GO:0031750) |
| 0.1 | 0.1 | GO:0051765 | inositol tetrakisphosphate kinase activity(GO:0051765) |
| 0.1 | 0.3 | GO:0044390 | ubiquitin-like protein conjugating enzyme binding(GO:0044390) |
| 0.1 | 0.4 | GO:0004531 | deoxyribonuclease II activity(GO:0004531) |
| 0.1 | 0.5 | GO:0047298 | 4-aminobutyrate transaminase activity(GO:0003867) succinate-semialdehyde dehydrogenase binding(GO:0032145) (S)-3-amino-2-methylpropionate transaminase activity(GO:0047298) |
| 0.1 | 0.9 | GO:0043199 | sulfate binding(GO:0043199) |
| 0.1 | 0.4 | GO:1902271 | D3 vitamins binding(GO:1902271) |
| 0.1 | 0.4 | GO:0047184 | 1-acylglycerophosphocholine O-acyltransferase activity(GO:0047184) |
| 0.1 | 0.4 | GO:0008267 | poly-glutamine tract binding(GO:0008267) |
| 0.1 | 0.5 | GO:0035033 | histone deacetylase regulator activity(GO:0035033) |
| 0.1 | 0.9 | GO:0030267 | hydroxypyruvate reductase activity(GO:0016618) glyoxylate reductase (NADP) activity(GO:0030267) |
| 0.1 | 2.0 | GO:0005007 | fibroblast growth factor-activated receptor activity(GO:0005007) |
| 0.1 | 0.3 | GO:0016742 | hydroxymethyl-, formyl- and related transferase activity(GO:0016742) |
| 0.1 | 1.2 | GO:0004727 | prenylated protein tyrosine phosphatase activity(GO:0004727) |
| 0.1 | 0.4 | GO:0005150 | interleukin-1, Type I receptor binding(GO:0005150) |
| 0.1 | 1.0 | GO:0051766 | inositol trisphosphate kinase activity(GO:0051766) |
| 0.1 | 0.8 | GO:0060961 | phospholipase D inhibitor activity(GO:0060961) |
| 0.1 | 2.0 | GO:0015280 | ligand-gated sodium channel activity(GO:0015280) |
| 0.1 | 0.6 | GO:0080019 | fatty-acyl-CoA reductase (alcohol-forming) activity(GO:0080019) |
| 0.1 | 0.3 | GO:0035402 | histone kinase activity (H3-T11 specific)(GO:0035402) |
| 0.1 | 0.5 | GO:0005173 | stem cell factor receptor binding(GO:0005173) |
| 0.1 | 0.1 | GO:0005119 | smoothened binding(GO:0005119) |
| 0.1 | 2.6 | GO:0035925 | mRNA 3'-UTR AU-rich region binding(GO:0035925) |
| 0.1 | 0.5 | GO:0003680 | AT DNA binding(GO:0003680) |
| 0.1 | 0.6 | GO:0032143 | single thymine insertion binding(GO:0032143) |
| 0.1 | 2.5 | GO:0016892 | endoribonuclease activity, producing 3'-phosphomonoesters(GO:0016892) |
| 0.1 | 0.6 | GO:0042015 | interleukin-20 binding(GO:0042015) |
| 0.1 | 1.4 | GO:0015129 | lactate transmembrane transporter activity(GO:0015129) |
| 0.1 | 2.7 | GO:0019871 | sodium channel inhibitor activity(GO:0019871) |
| 0.1 | 0.4 | GO:0019777 | Atg12 transferase activity(GO:0019777) |
| 0.1 | 0.8 | GO:0005157 | macrophage colony-stimulating factor receptor binding(GO:0005157) |
| 0.1 | 0.9 | GO:0050733 | RS domain binding(GO:0050733) |
| 0.1 | 0.2 | GO:0038064 | collagen receptor activity(GO:0038064) |
| 0.1 | 0.4 | GO:0051377 | mannose-ethanolamine phosphotransferase activity(GO:0051377) |
| 0.1 | 0.3 | GO:0003839 | gamma-glutamylcyclotransferase activity(GO:0003839) |
| 0.1 | 1.4 | GO:0003857 | 3-hydroxyacyl-CoA dehydrogenase activity(GO:0003857) |
| 0.1 | 0.7 | GO:0004924 | oncostatin-M receptor activity(GO:0004924) |
| 0.1 | 0.6 | GO:1990460 | leptin receptor binding(GO:1990460) |
| 0.1 | 0.2 | GO:0051731 | polynucleotide 5'-hydroxyl-kinase activity(GO:0051731) |
| 0.1 | 3.4 | GO:0005545 | 1-phosphatidylinositol binding(GO:0005545) |
| 0.1 | 0.5 | GO:0005219 | ryanodine-sensitive calcium-release channel activity(GO:0005219) |
| 0.1 | 2.2 | GO:0019992 | diacylglycerol binding(GO:0019992) |
| 0.1 | 0.3 | GO:0000253 | 3-keto sterol reductase activity(GO:0000253) |
| 0.1 | 0.7 | GO:0071074 | eukaryotic initiation factor eIF2 binding(GO:0071074) |
| 0.1 | 22.8 | GO:0002020 | protease binding(GO:0002020) |
| 0.1 | 0.6 | GO:0047756 | chondroitin 4-sulfotransferase activity(GO:0047756) |
| 0.1 | 0.4 | GO:0047708 | biotinidase activity(GO:0047708) |
| 0.1 | 0.7 | GO:0070008 | serine-type exopeptidase activity(GO:0070008) |
| 0.1 | 0.3 | GO:0008480 | sarcosine dehydrogenase activity(GO:0008480) |
| 0.1 | 1.6 | GO:0017034 | Rap guanyl-nucleotide exchange factor activity(GO:0017034) |
| 0.1 | 2.0 | GO:0055106 | ubiquitin-protein transferase regulator activity(GO:0055106) |
| 0.1 | 0.4 | GO:0008798 | beta-aspartyl-peptidase activity(GO:0008798) |
| 0.1 | 0.6 | GO:0047288 | monosialoganglioside sialyltransferase activity(GO:0047288) |
| 0.1 | 0.3 | GO:0034046 | poly(G) binding(GO:0034046) |
| 0.1 | 0.9 | GO:0017040 | ceramidase activity(GO:0017040) |
| 0.1 | 0.7 | GO:0004826 | phenylalanine-tRNA ligase activity(GO:0004826) |
| 0.1 | 0.4 | GO:0015157 | sucrose:proton symporter activity(GO:0008506) sucrose transmembrane transporter activity(GO:0008515) disaccharide transmembrane transporter activity(GO:0015154) oligosaccharide transmembrane transporter activity(GO:0015157) |
| 0.1 | 0.6 | GO:0003960 | NADPH:quinone reductase activity(GO:0003960) |
| 0.1 | 2.1 | GO:0098748 | clathrin adaptor activity(GO:0035615) endocytic adaptor activity(GO:0098748) |
| 0.1 | 0.2 | GO:0004566 | beta-glucuronidase activity(GO:0004566) |
| 0.1 | 0.5 | GO:0030622 | U4atac snRNA binding(GO:0030622) |
| 0.1 | 0.4 | GO:0050698 | proteoglycan sulfotransferase activity(GO:0050698) |
| 0.1 | 0.4 | GO:0015181 | arginine transmembrane transporter activity(GO:0015181) |
| 0.1 | 0.3 | GO:0045145 | single-stranded DNA 5'-3' exodeoxyribonuclease activity(GO:0045145) |
| 0.1 | 0.1 | GO:0000247 | C-8 sterol isomerase activity(GO:0000247) |
| 0.1 | 0.8 | GO:0004075 | biotin carboxylase activity(GO:0004075) |
| 0.1 | 0.9 | GO:0033192 | calmodulin-dependent protein phosphatase activity(GO:0033192) |
| 0.1 | 0.1 | GO:0008941 | nitric oxide dioxygenase activity(GO:0008941) oxidoreductase activity, acting on paired donors, with incorporation or reduction of molecular oxygen, NAD(P)H as one donor, and incorporation of two atoms of oxygen into one donor(GO:0016708) |
| 0.1 | 3.5 | GO:0016505 | peptidase activator activity involved in apoptotic process(GO:0016505) |
| 0.1 | 0.5 | GO:0047179 | platelet-activating factor acetyltransferase activity(GO:0047179) |
| 0.1 | 0.1 | GO:0031753 | endothelial differentiation G-protein coupled receptor binding(GO:0031753) Edg-2 lysophosphatidic acid receptor binding(GO:0031755) |
| 0.1 | 1.3 | GO:0016538 | cyclin-dependent protein serine/threonine kinase regulator activity(GO:0016538) |
| 0.1 | 0.5 | GO:0004392 | heme oxygenase (decyclizing) activity(GO:0004392) |
| 0.1 | 0.3 | GO:0004577 | N-acetylglucosaminyldiphosphodolichol N-acetylglucosaminyltransferase activity(GO:0004577) |
| 0.1 | 0.8 | GO:1904264 | ubiquitin protein ligase activity involved in ERAD pathway(GO:1904264) |
| 0.1 | 0.6 | GO:0004563 | beta-N-acetylhexosaminidase activity(GO:0004563) |
| 0.1 | 0.4 | GO:0051538 | 3 iron, 4 sulfur cluster binding(GO:0051538) |
| 0.1 | 5.7 | GO:0001205 | transcriptional activator activity, RNA polymerase II distal enhancer sequence-specific binding(GO:0001205) |
| 0.1 | 0.4 | GO:0004583 | dolichyl-phosphate-glucose-glycolipid alpha-glucosyltransferase activity(GO:0004583) |
| 0.1 | 0.9 | GO:0001665 | alpha-N-acetylgalactosaminide alpha-2,6-sialyltransferase activity(GO:0001665) |
| 0.1 | 0.3 | GO:0004452 | isopentenyl-diphosphate delta-isomerase activity(GO:0004452) |
| 0.1 | 1.9 | GO:0008179 | adenylate cyclase binding(GO:0008179) |
| 0.1 | 0.3 | GO:0047750 | cholestenol delta-isomerase activity(GO:0047750) |
| 0.1 | 2.0 | GO:0031957 | very long-chain fatty acid-CoA ligase activity(GO:0031957) |
| 0.1 | 0.6 | GO:0004310 | farnesyl-diphosphate farnesyltransferase activity(GO:0004310) squalene synthase activity(GO:0051996) |
| 0.1 | 1.0 | GO:0016312 | inositol bisphosphate phosphatase activity(GO:0016312) |
| 0.1 | 2.2 | GO:0008349 | MAP kinase kinase kinase kinase activity(GO:0008349) |
| 0.1 | 1.4 | GO:0015643 | toxic substance binding(GO:0015643) |
| 0.1 | 0.9 | GO:0016206 | catechol O-methyltransferase activity(GO:0016206) |
| 0.1 | 1.5 | GO:0045159 | myosin II binding(GO:0045159) |
| 0.1 | 0.5 | GO:0005223 | intracellular cGMP activated cation channel activity(GO:0005223) |
| 0.1 | 0.5 | GO:0008113 | peptide-methionine (S)-S-oxide reductase activity(GO:0008113) |
| 0.1 | 0.5 | GO:0008607 | phosphorylase kinase regulator activity(GO:0008607) |
| 0.1 | 1.9 | GO:0017049 | GTP-Rho binding(GO:0017049) |
| 0.1 | 1.4 | GO:0070878 | primary miRNA binding(GO:0070878) |
| 0.1 | 0.2 | GO:0086020 | gap junction channel activity involved in SA node cell-atrial cardiac muscle cell electrical coupling(GO:0086020) |
| 0.1 | 0.4 | GO:0102344 | 3-hydroxy-behenoyl-CoA dehydratase activity(GO:0102344) 3-hydroxy-lignoceroyl-CoA dehydratase activity(GO:0102345) |
| 0.1 | 0.5 | GO:0008449 | N-acetylglucosamine-6-sulfatase activity(GO:0008449) |
| 0.1 | 0.5 | GO:0003986 | acetyl-CoA hydrolase activity(GO:0003986) |
| 0.1 | 2.1 | GO:0030957 | Tat protein binding(GO:0030957) |
| 0.1 | 0.6 | GO:0016019 | peptidoglycan receptor activity(GO:0016019) |
| 0.1 | 0.7 | GO:0001517 | N-acetylglucosamine 6-O-sulfotransferase activity(GO:0001517) |
| 0.1 | 0.6 | GO:0004301 | epoxide hydrolase activity(GO:0004301) |
| 0.1 | 0.4 | GO:0010521 | telomerase inhibitor activity(GO:0010521) |
| 0.1 | 0.2 | GO:0003955 | NAD(P)H dehydrogenase (quinone) activity(GO:0003955) 3-oxoacyl-[acyl-carrier-protein] reductase (NADH) activity(GO:0047025) |
| 0.1 | 0.4 | GO:0001855 | complement component C4b binding(GO:0001855) |
| 0.1 | 0.6 | GO:0015183 | L-aspartate transmembrane transporter activity(GO:0015183) |
| 0.1 | 0.7 | GO:0046870 | cadmium ion binding(GO:0046870) |
| 0.1 | 0.3 | GO:0043141 | ATP-dependent 5'-3' DNA helicase activity(GO:0043141) |
| 0.1 | 0.3 | GO:0005055 | laminin receptor activity(GO:0005055) |
| 0.1 | 0.5 | GO:0043208 | glycosphingolipid binding(GO:0043208) |
| 0.1 | 0.5 | GO:0003923 | GPI-anchor transamidase activity(GO:0003923) |
| 0.1 | 0.3 | GO:0005010 | insulin-like growth factor-activated receptor activity(GO:0005010) |
| 0.1 | 0.6 | GO:0015057 | thrombin receptor activity(GO:0015057) |
| 0.1 | 0.9 | GO:0046703 | natural killer cell lectin-like receptor binding(GO:0046703) |
| 0.1 | 0.1 | GO:0004800 | thyroxine 5'-deiodinase activity(GO:0004800) |
| 0.1 | 0.2 | GO:0032795 | heterotrimeric G-protein binding(GO:0032795) |
| 0.1 | 0.1 | GO:0019166 | trans-2-enoyl-CoA reductase (NADPH) activity(GO:0019166) |
| 0.1 | 0.6 | GO:0047429 | nucleoside-triphosphate diphosphatase activity(GO:0047429) |
| 0.1 | 0.3 | GO:0004132 | dCMP deaminase activity(GO:0004132) |
| 0.1 | 1.0 | GO:0005005 | transmembrane-ephrin receptor activity(GO:0005005) |
| 0.1 | 0.3 | GO:0005483 | soluble NSF attachment protein activity(GO:0005483) |
| 0.1 | 0.6 | GO:0071558 | histone demethylase activity (H3-K27 specific)(GO:0071558) |
| 0.1 | 0.3 | GO:0004739 | pyruvate dehydrogenase (acetyl-transferring) activity(GO:0004739) |
| 0.1 | 0.3 | GO:0072320 | volume-sensitive chloride channel activity(GO:0072320) |
| 0.1 | 0.3 | GO:0046592 | polyamine oxidase activity(GO:0046592) spermine:oxygen oxidoreductase (spermidine-forming) activity(GO:0052901) |
| 0.1 | 0.3 | GO:0015229 | L-ascorbate:sodium symporter activity(GO:0008520) L-ascorbic acid transporter activity(GO:0015229) sodium-dependent L-ascorbate transmembrane transporter activity(GO:0070890) |
| 0.1 | 0.3 | GO:0019150 | D-ribulokinase activity(GO:0019150) |
| 0.1 | 0.3 | GO:0016717 | C-5 sterol desaturase activity(GO:0000248) oxidoreductase activity, acting on paired donors, with oxidation of a pair of donors resulting in the reduction of molecular oxygen to two molecules of water(GO:0016717) sterol desaturase activity(GO:0070704) |
| 0.1 | 0.6 | GO:0017050 | sphinganine kinase activity(GO:0008481) D-erythro-sphingosine kinase activity(GO:0017050) |
| 0.1 | 0.6 | GO:0048406 | nerve growth factor binding(GO:0048406) |
| 0.1 | 0.4 | GO:0004758 | serine C-palmitoyltransferase activity(GO:0004758) C-palmitoyltransferase activity(GO:0016454) |
| 0.1 | 0.8 | GO:0051434 | BH3 domain binding(GO:0051434) |
| 0.1 | 0.3 | GO:0008426 | protein kinase C inhibitor activity(GO:0008426) |
| 0.1 | 1.6 | GO:0008603 | cAMP-dependent protein kinase regulator activity(GO:0008603) |
| 0.1 | 1.2 | GO:0050544 | arachidonic acid binding(GO:0050544) |
| 0.1 | 1.2 | GO:0003995 | acyl-CoA dehydrogenase activity(GO:0003995) |
| 0.1 | 2.7 | GO:0050431 | transforming growth factor beta binding(GO:0050431) |
| 0.1 | 1.0 | GO:0035240 | dopamine binding(GO:0035240) |
| 0.1 | 0.4 | GO:0098519 | nucleotide phosphatase activity, acting on free nucleotides(GO:0098519) |
| 0.1 | 0.3 | GO:0001632 | leukotriene B4 receptor activity(GO:0001632) |
| 0.1 | 0.3 | GO:0016418 | S-acetyltransferase activity(GO:0016418) |
| 0.1 | 0.7 | GO:0015174 | basic amino acid transmembrane transporter activity(GO:0015174) |
| 0.1 | 2.6 | GO:0043027 | cysteine-type endopeptidase inhibitor activity involved in apoptotic process(GO:0043027) |
| 0.1 | 0.5 | GO:0003998 | acylphosphatase activity(GO:0003998) |
| 0.1 | 0.3 | GO:0043273 | CTPase activity(GO:0043273) |
| 0.1 | 0.4 | GO:0048407 | platelet-derived growth factor binding(GO:0048407) |
| 0.1 | 3.1 | GO:0004709 | MAP kinase kinase kinase activity(GO:0004709) |
| 0.1 | 1.4 | GO:0017160 | Ral GTPase binding(GO:0017160) |
| 0.1 | 0.1 | GO:0002134 | pyrimidine nucleoside binding(GO:0001884) UTP binding(GO:0002134) pyrimidine ribonucleoside binding(GO:0032551) |
| 0.1 | 4.0 | GO:0050699 | WW domain binding(GO:0050699) |
| 0.1 | 0.2 | GO:0017116 | single-stranded DNA-dependent ATP-dependent DNA helicase activity(GO:0017116) |
| 0.1 | 0.2 | GO:0051998 | carboxyl-O-methyltransferase activity(GO:0010340) protein carboxyl O-methyltransferase activity(GO:0051998) |
| 0.1 | 0.2 | GO:1990190 | peptide-glutamate-N-acetyltransferase activity(GO:1990190) |
| 0.1 | 0.5 | GO:0000298 | endopolyphosphatase activity(GO:0000298) diphosphoinositol-polyphosphate diphosphatase activity(GO:0008486) bis(5'-adenosyl)-hexaphosphatase activity(GO:0034431) bis(5'-adenosyl)-pentaphosphatase activity(GO:0034432) inositol diphosphate tetrakisphosphate diphosphatase activity(GO:0052840) inositol bisdiphosphate tetrakisphosphate diphosphatase activity(GO:0052841) inositol diphosphate pentakisphosphate diphosphatase activity(GO:0052842) inositol-1-diphosphate-2,3,4,5,6-pentakisphosphate diphosphatase activity(GO:0052843) inositol-3-diphosphate-1,2,4,5,6-pentakisphosphate diphosphatase activity(GO:0052844) inositol-5-diphosphate-1,2,3,4,6-pentakisphosphate diphosphatase activity(GO:0052845) inositol-1,5-bisdiphosphate-2,3,4,6-tetrakisphosphate 1-diphosphatase activity(GO:0052846) inositol-1,5-bisdiphosphate-2,3,4,6-tetrakisphosphate 5-diphosphatase activity(GO:0052847) inositol-3,5-bisdiphosphate-2,3,4,6-tetrakisphosphate 5-diphosphatase activity(GO:0052848) |
| 0.1 | 0.5 | GO:0005143 | interleukin-12 receptor binding(GO:0005143) |
| 0.1 | 0.7 | GO:0019211 | phosphatase activator activity(GO:0019211) |
| 0.1 | 0.4 | GO:0004096 | catalase activity(GO:0004096) |
| 0.1 | 0.5 | GO:0004035 | alkaline phosphatase activity(GO:0004035) |
| 0.1 | 0.2 | GO:0031626 | beta-endorphin binding(GO:0031626) |
| 0.1 | 4.7 | GO:0033613 | activating transcription factor binding(GO:0033613) |
| 0.1 | 0.8 | GO:0004065 | arylsulfatase activity(GO:0004065) |
| 0.1 | 0.4 | GO:0016823 | hydrolase activity, acting on acid carbon-carbon bonds(GO:0016822) hydrolase activity, acting on acid carbon-carbon bonds, in ketonic substances(GO:0016823) |
| 0.1 | 0.2 | GO:0005127 | ciliary neurotrophic factor receptor binding(GO:0005127) |
| 0.1 | 0.2 | GO:0003918 | DNA topoisomerase type II (ATP-hydrolyzing) activity(GO:0003918) DNA topoisomerase II activity(GO:0061505) |
| 0.1 | 0.1 | GO:0003996 | acyl-CoA ligase activity(GO:0003996) |
| 0.1 | 1.0 | GO:0051011 | microtubule minus-end binding(GO:0051011) |
| 0.1 | 0.9 | GO:0048185 | activin binding(GO:0048185) |
| 0.1 | 1.0 | GO:0001206 | transcriptional repressor activity, RNA polymerase II distal enhancer sequence-specific binding(GO:0001206) |
| 0.1 | 0.3 | GO:0004001 | adenosine kinase activity(GO:0004001) |
| 0.1 | 0.4 | GO:0016230 | sphingomyelin phosphodiesterase activator activity(GO:0016230) |
| 0.1 | 0.4 | GO:0070180 | large ribosomal subunit rRNA binding(GO:0070180) |
| 0.1 | 0.3 | GO:0047522 | 13-prostaglandin reductase activity(GO:0036132) 15-oxoprostaglandin 13-oxidase activity(GO:0047522) |
| 0.1 | 0.6 | GO:0016670 | oxidoreductase activity, acting on a sulfur group of donors, oxygen as acceptor(GO:0016670) |
| 0.1 | 1.4 | GO:0071949 | FAD binding(GO:0071949) |
| 0.1 | 0.5 | GO:0008559 | xenobiotic-transporting ATPase activity(GO:0008559) |
| 0.1 | 1.2 | GO:0044213 | intronic transcription regulatory region sequence-specific DNA binding(GO:0001161) intronic transcription regulatory region DNA binding(GO:0044213) |
| 0.1 | 1.0 | GO:0035613 | RNA stem-loop binding(GO:0035613) |
| 0.1 | 1.5 | GO:0000175 | 3'-5'-exoribonuclease activity(GO:0000175) |
| 0.1 | 1.1 | GO:0043295 | glutathione binding(GO:0043295) |
| 0.1 | 0.3 | GO:0051022 | GDP-dissociation inhibitor binding(GO:0051021) Rho GDP-dissociation inhibitor binding(GO:0051022) |
| 0.1 | 0.8 | GO:0070181 | small ribosomal subunit rRNA binding(GO:0070181) |
| 0.1 | 0.9 | GO:0043422 | protein kinase B binding(GO:0043422) |
| 0.1 | 0.3 | GO:0031826 | type 2A serotonin receptor binding(GO:0031826) |
| 0.1 | 0.3 | GO:0003906 | DNA-(apurinic or apyrimidinic site) lyase activity(GO:0003906) |
| 0.1 | 0.1 | GO:0043546 | molybdopterin cofactor binding(GO:0043546) |
| 0.1 | 0.2 | GO:0004958 | prostaglandin F receptor activity(GO:0004958) |
| 0.1 | 0.3 | GO:0003943 | N-acetylgalactosamine-4-sulfatase activity(GO:0003943) |
| 0.1 | 0.3 | GO:0008158 | hedgehog receptor activity(GO:0008158) |
| 0.1 | 0.3 | GO:0034713 | type I transforming growth factor beta receptor binding(GO:0034713) |
| 0.1 | 0.1 | GO:0005168 | neurotrophin TRKA receptor binding(GO:0005168) |
| 0.1 | 0.2 | GO:0008988 | rRNA (adenine-N6-)-methyltransferase activity(GO:0008988) |
| 0.1 | 0.3 | GO:0071987 | WD40-repeat domain binding(GO:0071987) |
| 0.1 | 0.7 | GO:0070569 | uridylyltransferase activity(GO:0070569) |
| 0.1 | 0.3 | GO:0035497 | cAMP response element binding(GO:0035497) |
| 0.1 | 0.4 | GO:0051033 | nucleic acid transmembrane transporter activity(GO:0051032) RNA transmembrane transporter activity(GO:0051033) |
| 0.1 | 0.2 | GO:0071885 | N-terminal protein N-methyltransferase activity(GO:0071885) |
| 0.1 | 0.3 | GO:0008073 | ornithine decarboxylase inhibitor activity(GO:0008073) |
| 0.1 | 0.4 | GO:0035243 | protein-arginine omega-N symmetric methyltransferase activity(GO:0035243) |
| 0.1 | 2.4 | GO:0001105 | RNA polymerase II transcription coactivator activity(GO:0001105) |
| 0.1 | 0.2 | GO:0010698 | acetyltransferase activator activity(GO:0010698) |
| 0.1 | 0.6 | GO:0036402 | proteasome-activating ATPase activity(GO:0036402) |
| 0.1 | 0.3 | GO:0004652 | polynucleotide adenylyltransferase activity(GO:0004652) |
| 0.1 | 1.2 | GO:0036374 | glutathione hydrolase activity(GO:0036374) |
| 0.1 | 0.2 | GO:0046848 | hydroxyapatite binding(GO:0046848) |
| 0.1 | 1.0 | GO:0043225 | anion transmembrane-transporting ATPase activity(GO:0043225) |
| 0.1 | 0.5 | GO:0050700 | CARD domain binding(GO:0050700) |
| 0.1 | 0.2 | GO:0019826 | oxygen sensor activity(GO:0019826) |
| 0.1 | 1.2 | GO:0004708 | MAP kinase kinase activity(GO:0004708) |
| 0.1 | 0.8 | GO:0004551 | nucleotide diphosphatase activity(GO:0004551) |
| 0.1 | 0.3 | GO:0097108 | hedgehog family protein binding(GO:0097108) |
| 0.1 | 0.1 | GO:0097363 | protein O-GlcNAc transferase activity(GO:0097363) |
| 0.1 | 0.7 | GO:0001609 | G-protein coupled adenosine receptor activity(GO:0001609) |
| 0.1 | 0.5 | GO:0031369 | translation initiation factor binding(GO:0031369) |
| 0.1 | 0.3 | GO:0050211 | procollagen galactosyltransferase activity(GO:0050211) |
| 0.1 | 2.1 | GO:0051019 | mitogen-activated protein kinase binding(GO:0051019) |
| 0.1 | 0.3 | GO:0016882 | cyclo-ligase activity(GO:0016882) |
| 0.1 | 3.8 | GO:0050136 | NADH dehydrogenase (ubiquinone) activity(GO:0008137) NADH dehydrogenase (quinone) activity(GO:0050136) |
| 0.1 | 0.4 | GO:0015307 | drug:proton antiporter activity(GO:0015307) |
| 0.1 | 0.2 | GO:0008410 | CoA-transferase activity(GO:0008410) |
| 0.1 | 0.6 | GO:0004064 | arylesterase activity(GO:0004064) |
| 0.1 | 0.6 | GO:0030332 | cyclin binding(GO:0030332) |
| 0.1 | 0.8 | GO:0004526 | ribonuclease P activity(GO:0004526) |
| 0.1 | 0.1 | GO:0004450 | isocitrate dehydrogenase (NADP+) activity(GO:0004450) |
| 0.1 | 0.3 | GO:0005471 | ATP:ADP antiporter activity(GO:0005471) adenine transmembrane transporter activity(GO:0015207) |
| 0.1 | 0.1 | GO:0005105 | type 1 fibroblast growth factor receptor binding(GO:0005105) |
| 0.1 | 0.4 | GO:0047057 | oxidoreductase activity, acting on the CH-OH group of donors, disulfide as acceptor(GO:0016900) vitamin-K-epoxide reductase (warfarin-sensitive) activity(GO:0047057) |
| 0.1 | 1.0 | GO:0004861 | cyclin-dependent protein serine/threonine kinase inhibitor activity(GO:0004861) |
| 0.1 | 0.1 | GO:0035651 | AP-3 adaptor complex binding(GO:0035651) |
| 0.1 | 2.7 | GO:0031624 | ubiquitin conjugating enzyme binding(GO:0031624) |
| 0.1 | 0.4 | GO:0008142 | oxysterol binding(GO:0008142) |
| 0.1 | 1.9 | GO:0004707 | MAP kinase activity(GO:0004707) |
| 0.1 | 2.3 | GO:0046875 | ephrin receptor binding(GO:0046875) |
| 0.1 | 0.2 | GO:0008336 | gamma-butyrobetaine dioxygenase activity(GO:0008336) |
| 0.1 | 0.4 | GO:0033592 | RNA strand annealing activity(GO:0033592) |
| 0.1 | 0.5 | GO:0035612 | AP-2 adaptor complex binding(GO:0035612) |
| 0.1 | 0.7 | GO:0005161 | platelet-derived growth factor receptor binding(GO:0005161) |
| 0.1 | 0.5 | GO:0015220 | choline transmembrane transporter activity(GO:0015220) |
| 0.1 | 0.4 | GO:0004740 | pyruvate dehydrogenase (acetyl-transferring) kinase activity(GO:0004740) |
| 0.1 | 0.5 | GO:0003872 | 6-phosphofructokinase activity(GO:0003872) |
| 0.1 | 0.3 | GO:0050833 | pyruvate transmembrane transporter activity(GO:0050833) |
| 0.1 | 1.3 | GO:0019104 | DNA N-glycosylase activity(GO:0019104) |
| 0.1 | 0.4 | GO:0016778 | diphosphotransferase activity(GO:0016778) |
| 0.1 | 0.1 | GO:0051717 | inositol-1,3,4,5-tetrakisphosphate 3-phosphatase activity(GO:0051717) |
| 0.1 | 0.5 | GO:0031995 | insulin-like growth factor II binding(GO:0031995) |
| 0.1 | 0.6 | GO:0001135 | transcription factor activity, RNA polymerase II transcription factor recruiting(GO:0001135) |
| 0.1 | 0.2 | GO:0004348 | glucosylceramidase activity(GO:0004348) |
| 0.1 | 0.8 | GO:0097100 | supercoiled DNA binding(GO:0097100) |
| 0.1 | 0.9 | GO:0019855 | calcium channel inhibitor activity(GO:0019855) |
| 0.1 | 0.2 | GO:0005111 | type 2 fibroblast growth factor receptor binding(GO:0005111) |
| 0.1 | 2.3 | GO:0030544 | Hsp70 protein binding(GO:0030544) |
| 0.1 | 1.5 | GO:0071617 | lysophosphatidic acid acyltransferase activity(GO:0042171) lysophospholipid acyltransferase activity(GO:0071617) |
| 0.1 | 0.7 | GO:0004726 | non-membrane spanning protein tyrosine phosphatase activity(GO:0004726) |
| 0.1 | 1.6 | GO:0051059 | NF-kappaB binding(GO:0051059) |
| 0.1 | 0.2 | GO:0052798 | beta-galactoside alpha-2,3-sialyltransferase activity(GO:0052798) |
| 0.1 | 0.3 | GO:0016429 | tRNA (adenine-N1-)-methyltransferase activity(GO:0016429) |
| 0.1 | 0.3 | GO:0031728 | CCR3 chemokine receptor binding(GO:0031728) |
| 0.1 | 0.2 | GO:0017095 | heparan sulfate 6-O-sulfotransferase activity(GO:0017095) |
| 0.1 | 0.1 | GO:0016406 | carnitine O-acyltransferase activity(GO:0016406) |
| 0.1 | 1.0 | GO:0000400 | four-way junction DNA binding(GO:0000400) |
| 0.1 | 1.2 | GO:0005527 | macrolide binding(GO:0005527) FK506 binding(GO:0005528) |
| 0.1 | 1.3 | GO:0005112 | Notch binding(GO:0005112) |
| 0.1 | 0.1 | GO:0042134 | rRNA primary transcript binding(GO:0042134) |
| 0.1 | 0.2 | GO:0090599 | alpha-glucosidase activity(GO:0090599) |
| 0.1 | 0.6 | GO:0004689 | phosphorylase kinase activity(GO:0004689) |
| 0.1 | 1.8 | GO:0008327 | methyl-CpG binding(GO:0008327) |
| 0.1 | 0.2 | GO:0032137 | guanine/thymine mispair binding(GO:0032137) |
| 0.1 | 0.2 | GO:0050253 | retinyl-palmitate esterase activity(GO:0050253) |
| 0.1 | 0.2 | GO:0051431 | corticotropin-releasing hormone receptor 2 binding(GO:0051431) |
| 0.1 | 0.2 | GO:0000994 | RNA polymerase III core binding(GO:0000994) |
| 0.1 | 0.2 | GO:0033677 | DNA/RNA helicase activity(GO:0033677) |
| 0.1 | 0.4 | GO:0061665 | SUMO ligase activity(GO:0061665) |
| 0.1 | 2.6 | GO:0016409 | palmitoyltransferase activity(GO:0016409) |
| 0.1 | 0.3 | GO:0004793 | glycine hydroxymethyltransferase activity(GO:0004372) threonine aldolase activity(GO:0004793) L-allo-threonine aldolase activity(GO:0008732) |
| 0.1 | 0.2 | GO:0070320 | inward rectifier potassium channel inhibitor activity(GO:0070320) |
| 0.1 | 0.2 | GO:0016841 | ammonia-lyase activity(GO:0016841) |
| 0.1 | 0.2 | GO:0004487 | methylenetetrahydrofolate dehydrogenase (NAD+) activity(GO:0004487) |
| 0.1 | 0.1 | GO:0010858 | calcium-dependent protein kinase inhibitor activity(GO:0008427) calcium-dependent protein kinase regulator activity(GO:0010858) |
| 0.1 | 0.2 | GO:0010348 | lithium:proton antiporter activity(GO:0010348) |
| 0.1 | 0.3 | GO:0030197 | extracellular matrix constituent, lubricant activity(GO:0030197) |
| 0.1 | 1.9 | GO:0017046 | peptide hormone binding(GO:0017046) |
| 0.1 | 0.2 | GO:0044323 | retinoic acid-responsive element binding(GO:0044323) |
| 0.1 | 0.3 | GO:0016941 | natriuretic peptide receptor activity(GO:0016941) |
| 0.1 | 0.2 | GO:0019834 | phospholipase A2 inhibitor activity(GO:0019834) |
| 0.1 | 0.9 | GO:0034450 | ubiquitin-ubiquitin ligase activity(GO:0034450) |
| 0.1 | 0.4 | GO:0097322 | 7SK snRNA binding(GO:0097322) |
| 0.1 | 5.5 | GO:0008307 | structural constituent of muscle(GO:0008307) |
| 0.1 | 0.2 | GO:0035242 | protein-arginine omega-N asymmetric methyltransferase activity(GO:0035242) |
| 0.1 | 0.2 | GO:0036487 | nitric-oxide synthase inhibitor activity(GO:0036487) |
| 0.1 | 0.4 | GO:0033743 | peptide-methionine (R)-S-oxide reductase activity(GO:0033743) |
| 0.1 | 0.2 | GO:0030348 | syntaxin-3 binding(GO:0030348) |
| 0.0 | 0.2 | GO:0015562 | efflux transmembrane transporter activity(GO:0015562) |
| 0.0 | 4.4 | GO:0019003 | GDP binding(GO:0019003) |
| 0.0 | 0.2 | GO:0008184 | glycogen phosphorylase activity(GO:0008184) |
| 0.0 | 0.5 | GO:0070628 | proteasome binding(GO:0070628) |
| 0.0 | 0.2 | GO:0005113 | patched binding(GO:0005113) |
| 0.0 | 0.1 | GO:0033142 | progesterone receptor binding(GO:0033142) |
| 0.0 | 0.1 | GO:0004584 | dolichyl-phosphate-mannose-glycolipid alpha-mannosyltransferase activity(GO:0004584) |
| 0.0 | 0.3 | GO:0034618 | arginine binding(GO:0034618) |
| 0.0 | 0.2 | GO:0004792 | thiosulfate sulfurtransferase activity(GO:0004792) |
| 0.0 | 1.5 | GO:0070412 | R-SMAD binding(GO:0070412) |
| 0.0 | 0.5 | GO:0008526 | phosphatidylinositol transporter activity(GO:0008526) |
| 0.0 | 0.2 | GO:0003963 | RNA-3'-phosphate cyclase activity(GO:0003963) |
| 0.0 | 0.2 | GO:0032138 | single base insertion or deletion binding(GO:0032138) |
| 0.0 | 0.6 | GO:0004691 | cAMP-dependent protein kinase activity(GO:0004691) |
| 0.0 | 0.5 | GO:0035256 | G-protein coupled glutamate receptor binding(GO:0035256) |
| 0.0 | 0.3 | GO:0016435 | rRNA (guanine) methyltransferase activity(GO:0016435) |
| 0.0 | 0.5 | GO:0016290 | palmitoyl-CoA hydrolase activity(GO:0016290) |
| 0.0 | 0.9 | GO:0042809 | vitamin D receptor binding(GO:0042809) |
| 0.0 | 0.3 | GO:0004862 | cAMP-dependent protein kinase inhibitor activity(GO:0004862) |
| 0.0 | 0.1 | GO:0035514 | DNA demethylase activity(GO:0035514) |
| 0.0 | 0.2 | GO:0047751 | 3-oxo-5-alpha-steroid 4-dehydrogenase activity(GO:0003865) steroid dehydrogenase activity, acting on the CH-CH group of donors(GO:0033765) cholestenone 5-alpha-reductase activity(GO:0047751) |
| 0.0 | 0.2 | GO:0030171 | voltage-gated proton channel activity(GO:0030171) |
| 0.0 | 0.1 | GO:1990259 | protein-glutamine N-methyltransferase activity(GO:0036009) histone-glutamine methyltransferase activity(GO:1990259) |
| 0.0 | 0.1 | GO:0070984 | SET domain binding(GO:0070984) |
| 0.0 | 0.5 | GO:0008641 | small protein activating enzyme activity(GO:0008641) |
| 0.0 | 0.1 | GO:0055100 | adiponectin binding(GO:0055100) |
| 0.0 | 0.7 | GO:0004697 | protein kinase C activity(GO:0004697) |
| 0.0 | 0.1 | GO:0005128 | erythropoietin receptor binding(GO:0005128) |
| 0.0 | 1.4 | GO:0017075 | syntaxin-1 binding(GO:0017075) |
| 0.0 | 0.4 | GO:0005068 | transmembrane receptor protein tyrosine kinase adaptor activity(GO:0005068) |
| 0.0 | 0.7 | GO:0017134 | fibroblast growth factor binding(GO:0017134) |
| 0.0 | 0.5 | GO:0008553 | hydrogen-exporting ATPase activity, phosphorylative mechanism(GO:0008553) |
| 0.0 | 1.8 | GO:0005484 | SNAP receptor activity(GO:0005484) |
| 0.0 | 1.0 | GO:0001087 | transcription factor activity, sequence-specific DNA binding, RNA polymerase recruiting(GO:0001011) transcription factor activity, TFIIB-class binding(GO:0001087) |
| 0.0 | 0.2 | GO:0036033 | mediator complex binding(GO:0036033) |
| 0.0 | 0.3 | GO:0031419 | cobalamin binding(GO:0031419) |
| 0.0 | 0.1 | GO:0033981 | D-dopachrome decarboxylase activity(GO:0033981) |
| 0.0 | 0.3 | GO:0061575 | cyclin-dependent protein serine/threonine kinase activator activity(GO:0061575) |
| 0.0 | 1.6 | GO:0005164 | tumor necrosis factor receptor binding(GO:0005164) |
| 0.0 | 0.0 | GO:0035184 | histone threonine kinase activity(GO:0035184) |
| 0.0 | 0.3 | GO:0030144 | alpha-1,6-mannosylglycoprotein 6-beta-N-acetylglucosaminyltransferase activity(GO:0030144) |
| 0.0 | 0.1 | GO:0017002 | activin-activated receptor activity(GO:0017002) |
| 0.0 | 2.2 | GO:0004693 | cyclin-dependent protein serine/threonine kinase activity(GO:0004693) |
| 0.0 | 0.6 | GO:1990247 | N6-methyladenosine-containing RNA binding(GO:1990247) |
| 0.0 | 0.5 | GO:0004767 | sphingomyelin phosphodiesterase activity(GO:0004767) |
| 0.0 | 0.1 | GO:0052858 | peptidyl-lysine N-acetyltransferase activity, acting on acetyl phosphate as donor(GO:0052858) |
| 0.0 | 1.4 | GO:0001848 | complement binding(GO:0001848) |
| 0.0 | 0.1 | GO:0017077 | oxidative phosphorylation uncoupler activity(GO:0017077) |
| 0.0 | 0.4 | GO:0035174 | histone serine kinase activity(GO:0035174) |
| 0.0 | 2.9 | GO:0008138 | protein tyrosine/serine/threonine phosphatase activity(GO:0008138) |
| 0.0 | 0.1 | GO:0000104 | succinate dehydrogenase activity(GO:0000104) |
| 0.0 | 0.4 | GO:0042731 | PH domain binding(GO:0042731) |
| 0.0 | 0.2 | GO:0051499 | D-aminoacyl-tRNA deacylase activity(GO:0051499) D-tyrosyl-tRNA(Tyr) deacylase activity(GO:0051500) |
| 0.0 | 1.4 | GO:0008009 | chemokine activity(GO:0008009) |
| 0.0 | 3.0 | GO:0017112 | Rab guanyl-nucleotide exchange factor activity(GO:0017112) |
| 0.0 | 0.2 | GO:0004140 | dephospho-CoA kinase activity(GO:0004140) |
| 0.0 | 0.1 | GO:1990932 | 5.8S rRNA binding(GO:1990932) |
| 0.0 | 6.2 | GO:0051082 | unfolded protein binding(GO:0051082) |
| 0.0 | 0.1 | GO:0000386 | second spliceosomal transesterification activity(GO:0000386) |
| 0.0 | 0.2 | GO:0016723 | cupric reductase activity(GO:0008823) oxidoreductase activity, oxidizing metal ions, NAD or NADP as acceptor(GO:0016723) ferric-chelate reductase (NADPH) activity(GO:0052851) |
| 0.0 | 0.7 | GO:1901611 | phosphatidylglycerol binding(GO:1901611) |
| 0.0 | 0.2 | GO:0004748 | ribonucleoside-diphosphate reductase activity, thioredoxin disulfide as acceptor(GO:0004748) oxidoreductase activity, acting on CH or CH2 groups, disulfide as acceptor(GO:0016728) ribonucleoside-diphosphate reductase activity(GO:0061731) |
| 0.0 | 0.6 | GO:0097153 | cysteine-type endopeptidase activity involved in apoptotic process(GO:0097153) |
| 0.0 | 0.1 | GO:0004967 | glucagon receptor activity(GO:0004967) |
| 0.0 | 0.4 | GO:0043024 | ribosomal small subunit binding(GO:0043024) |
| 0.0 | 0.1 | GO:1990763 | arrestin family protein binding(GO:1990763) |
| 0.0 | 1.1 | GO:0000030 | mannosyltransferase activity(GO:0000030) |
| 0.0 | 0.1 | GO:0008192 | RNA guanylyltransferase activity(GO:0008192) |
| 0.0 | 0.0 | GO:0032089 | NACHT domain binding(GO:0032089) |
| 0.0 | 0.2 | GO:0050501 | hyaluronan synthase activity(GO:0050501) |
| 0.0 | 0.1 | GO:0001537 | N-acetylgalactosamine 4-O-sulfotransferase activity(GO:0001537) |
| 0.0 | 0.0 | GO:0044715 | 8-oxo-dGDP phosphatase activity(GO:0044715) |
| 0.0 | 0.5 | GO:0047498 | calcium-dependent phospholipase A2 activity(GO:0047498) |
| 0.0 | 0.4 | GO:0019534 | toxin transporter activity(GO:0019534) |
| 0.0 | 0.2 | GO:0030060 | L-malate dehydrogenase activity(GO:0030060) |
| 0.0 | 0.1 | GO:0071532 | ankyrin repeat binding(GO:0071532) |
| 0.0 | 0.3 | GO:0003831 | beta-N-acetylglucosaminylglycopeptide beta-1,4-galactosyltransferase activity(GO:0003831) |
| 0.0 | 0.1 | GO:1903763 | gap junction channel activity involved in cell communication by electrical coupling(GO:1903763) |
| 0.0 | 0.7 | GO:0004602 | glutathione peroxidase activity(GO:0004602) |
| 0.0 | 0.2 | GO:0004853 | uroporphyrinogen decarboxylase activity(GO:0004853) |
| 0.0 | 0.2 | GO:0042903 | tubulin deacetylase activity(GO:0042903) |
| 0.0 | 1.1 | GO:0043175 | RNA polymerase core enzyme binding(GO:0043175) |
| 0.0 | 1.1 | GO:0070530 | K63-linked polyubiquitin binding(GO:0070530) |
| 0.0 | 0.5 | GO:0017154 | semaphorin receptor activity(GO:0017154) |
| 0.0 | 0.2 | GO:0030395 | lactose binding(GO:0030395) |
| 0.0 | 1.3 | GO:0005159 | insulin-like growth factor receptor binding(GO:0005159) |
| 0.0 | 0.3 | GO:0030169 | low-density lipoprotein particle binding(GO:0030169) |
| 0.0 | 2.9 | GO:0050840 | extracellular matrix binding(GO:0050840) |
| 0.0 | 0.1 | GO:0034353 | RNA pyrophosphohydrolase activity(GO:0034353) |
| 0.0 | 0.8 | GO:0019843 | rRNA binding(GO:0019843) |
| 0.0 | 1.4 | GO:0016303 | 1-phosphatidylinositol-3-kinase activity(GO:0016303) |
| 0.0 | 0.2 | GO:0004814 | arginine-tRNA ligase activity(GO:0004814) |
| 0.0 | 1.0 | GO:0070330 | aromatase activity(GO:0070330) |
| 0.0 | 0.1 | GO:0047389 | glycerophosphocholine phosphodiesterase activity(GO:0047389) |
| 0.0 | 0.3 | GO:0008121 | ubiquinol-cytochrome-c reductase activity(GO:0008121) oxidoreductase activity, acting on diphenols and related substances as donors, cytochrome as acceptor(GO:0016681) |
| 0.0 | 0.3 | GO:0051400 | BH domain binding(GO:0051400) |
| 0.0 | 0.2 | GO:0004300 | enoyl-CoA hydratase activity(GO:0004300) |
| 0.0 | 0.2 | GO:1990226 | histone methyltransferase binding(GO:1990226) |
| 0.0 | 0.1 | GO:0017089 | glycolipid transporter activity(GO:0017089) |
| 0.0 | 0.5 | GO:0030306 | ADP-ribosylation factor binding(GO:0030306) |
| 0.0 | 0.0 | GO:0002046 | opsin binding(GO:0002046) |
| 0.0 | 0.3 | GO:0070883 | pre-miRNA binding(GO:0070883) |
| 0.0 | 0.6 | GO:0004623 | phospholipase A2 activity(GO:0004623) |
| 0.0 | 0.2 | GO:0043023 | ribosomal large subunit binding(GO:0043023) |
| 0.0 | 0.1 | GO:0004618 | phosphoglycerate kinase activity(GO:0004618) |
| 0.0 | 0.5 | GO:0004568 | chitinase activity(GO:0004568) |
| 0.0 | 0.0 | GO:0018812 | 3-hydroxyacyl-CoA dehydratase activity(GO:0018812) |
| 0.0 | 1.2 | GO:0004129 | cytochrome-c oxidase activity(GO:0004129) heme-copper terminal oxidase activity(GO:0015002) oxidoreductase activity, acting on a heme group of donors, oxygen as acceptor(GO:0016676) |
| 0.0 | 0.4 | GO:0005225 | volume-sensitive anion channel activity(GO:0005225) |
| 0.0 | 0.7 | GO:0043495 | protein anchor(GO:0043495) |
| 0.0 | 2.3 | GO:0043621 | protein self-association(GO:0043621) |
| 0.0 | 0.1 | GO:0004421 | hydroxymethylglutaryl-CoA synthase activity(GO:0004421) |
| 0.0 | 0.2 | GO:0030942 | endoplasmic reticulum signal peptide binding(GO:0030942) |
| 0.0 | 1.3 | GO:0004003 | ATP-dependent DNA helicase activity(GO:0004003) |
| 0.0 | 0.1 | GO:0004504 | peptidylglycine monooxygenase activity(GO:0004504) peptidylamidoglycolate lyase activity(GO:0004598) |
| 0.0 | 0.1 | GO:0004514 | nicotinate-nucleotide diphosphorylase (carboxylating) activity(GO:0004514) |
| 0.0 | 0.2 | GO:0019958 | C-X-C chemokine binding(GO:0019958) |
| 0.0 | 0.1 | GO:1904493 | Ac-Asp-Glu binding(GO:1904492) tetrahydrofolyl-poly(glutamate) polymer binding(GO:1904493) |
| 0.0 | 0.1 | GO:0034191 | apolipoprotein A-I receptor binding(GO:0034191) |
| 0.0 | 1.2 | GO:0000146 | microfilament motor activity(GO:0000146) |
| 0.0 | 0.2 | GO:0050254 | rhodopsin kinase activity(GO:0050254) |
| 0.0 | 1.0 | GO:0070840 | dynein complex binding(GO:0070840) |
| 0.0 | 0.1 | GO:0047977 | hepoxilin-epoxide hydrolase activity(GO:0047977) |
| 0.0 | 0.2 | GO:0008379 | thioredoxin peroxidase activity(GO:0008379) |
| 0.0 | 0.6 | GO:0005522 | profilin binding(GO:0005522) |
| 0.0 | 2.5 | GO:0005544 | calcium-dependent phospholipid binding(GO:0005544) |
| 0.0 | 0.7 | GO:0030515 | snoRNA binding(GO:0030515) |
| 0.0 | 0.1 | GO:0004507 | steroid 11-beta-monooxygenase activity(GO:0004507) corticosterone 18-monooxygenase activity(GO:0047783) |
| 0.0 | 1.8 | GO:0034987 | immunoglobulin receptor binding(GO:0034987) |
| 0.0 | 0.1 | GO:0000995 | transcription factor activity, core RNA polymerase III binding(GO:0000995) |
| 0.0 | 0.5 | GO:0016805 | dipeptidase activity(GO:0016805) |
| 0.0 | 0.2 | GO:0032052 | bile acid binding(GO:0032052) |
| 0.0 | 0.1 | GO:0004723 | calcium-dependent protein serine/threonine phosphatase activity(GO:0004723) |
| 0.0 | 0.2 | GO:0005315 | inorganic phosphate transmembrane transporter activity(GO:0005315) |
| 0.0 | 0.1 | GO:0000179 | rRNA (adenine-N6,N6-)-dimethyltransferase activity(GO:0000179) |
| 0.0 | 0.2 | GO:0050072 | m7G(5')pppN diphosphatase activity(GO:0050072) |
| 0.0 | 0.0 | GO:0004992 | platelet activating factor receptor activity(GO:0004992) |
| 0.0 | 0.1 | GO:0005006 | epidermal growth factor-activated receptor activity(GO:0005006) |
| 0.0 | 0.2 | GO:1990050 | phosphatidic acid transporter activity(GO:1990050) |
| 0.0 | 5.0 | GO:0005089 | Rho guanyl-nucleotide exchange factor activity(GO:0005089) |
| 0.0 | 0.2 | GO:0016403 | dimethylargininase activity(GO:0016403) |
| 0.0 | 0.3 | GO:0004303 | estradiol 17-beta-dehydrogenase activity(GO:0004303) |
| 0.0 | 0.2 | GO:0003916 | DNA topoisomerase activity(GO:0003916) |
| 0.0 | 0.3 | GO:0004128 | cytochrome-b5 reductase activity, acting on NAD(P)H(GO:0004128) |
| 0.0 | 0.1 | GO:0004668 | protein-arginine deiminase activity(GO:0004668) |
| 0.0 | 0.5 | GO:0008190 | eukaryotic initiation factor 4E binding(GO:0008190) |
| 0.0 | 0.4 | GO:0001223 | transcription coactivator binding(GO:0001223) |
| 0.0 | 0.1 | GO:0008746 | NAD(P)+ transhydrogenase activity(GO:0008746) oxidoreductase activity, acting on NAD(P)H, NAD(P) as acceptor(GO:0016652) |
| 0.0 | 0.1 | GO:0016671 | oxidoreductase activity, acting on a sulfur group of donors, disulfide as acceptor(GO:0016671) |
| 0.0 | 0.1 | GO:0004996 | thyroid-stimulating hormone receptor activity(GO:0004996) |
| 0.0 | 1.6 | GO:0004180 | carboxypeptidase activity(GO:0004180) |
| 0.0 | 0.2 | GO:0016929 | SUMO-specific protease activity(GO:0016929) |
| 0.0 | 0.2 | GO:0008430 | selenium binding(GO:0008430) |
| 0.0 | 0.2 | GO:0032036 | myosin heavy chain binding(GO:0032036) |
| 0.0 | 1.5 | GO:0001540 | beta-amyloid binding(GO:0001540) |
| 0.0 | 0.2 | GO:0004720 | protein-lysine 6-oxidase activity(GO:0004720) |
| 0.0 | 0.5 | GO:0015299 | solute:proton antiporter activity(GO:0015299) |
| 0.0 | 0.6 | GO:0001054 | RNA polymerase I activity(GO:0001054) |
| 0.0 | 0.4 | GO:0043522 | leucine zipper domain binding(GO:0043522) |
| 0.0 | 0.3 | GO:0032027 | myosin light chain binding(GO:0032027) |
| 0.0 | 6.4 | GO:0003735 | structural constituent of ribosome(GO:0003735) |
| 0.0 | 0.1 | GO:0004874 | aryl hydrocarbon receptor activity(GO:0004874) |
| 0.0 | 0.1 | GO:0016639 | oxidoreductase activity, acting on the CH-NH2 group of donors, NAD or NADP as acceptor(GO:0016639) |
| 0.0 | 0.4 | GO:0051010 | microtubule plus-end binding(GO:0051010) |
| 0.0 | 0.6 | GO:0051537 | 2 iron, 2 sulfur cluster binding(GO:0051537) |
| 0.0 | 0.2 | GO:0004013 | adenosylhomocysteinase activity(GO:0004013) trialkylsulfonium hydrolase activity(GO:0016802) |
| 0.0 | 0.8 | GO:0030371 | translation repressor activity(GO:0030371) |
| 0.0 | 0.1 | GO:0016655 | oxidoreductase activity, acting on NAD(P)H, quinone or similar compound as acceptor(GO:0016655) |
| 0.0 | 0.5 | GO:0070410 | co-SMAD binding(GO:0070410) |
| 0.0 | 2.2 | GO:0003730 | mRNA 3'-UTR binding(GO:0003730) |
| 0.0 | 0.1 | GO:0015056 | corticotrophin-releasing factor receptor activity(GO:0015056) |
| 0.0 | 0.8 | GO:0017025 | TBP-class protein binding(GO:0017025) |
| 0.0 | 0.3 | GO:0047760 | butyrate-CoA ligase activity(GO:0047760) |
| 0.0 | 0.3 | GO:0008432 | JUN kinase binding(GO:0008432) |
| 0.0 | 0.3 | GO:0070016 | armadillo repeat domain binding(GO:0070016) |
| 0.0 | 0.1 | GO:0032217 | riboflavin transporter activity(GO:0032217) |
| 0.0 | 0.1 | GO:0010484 | H3 histone acetyltransferase activity(GO:0010484) |
| 0.0 | 0.2 | GO:0043995 | histone acetyltransferase activity (H4-K5 specific)(GO:0043995) histone acetyltransferase activity (H4-K8 specific)(GO:0043996) histone acetyltransferase activity (H4-K16 specific)(GO:0046972) |
| 0.0 | 0.1 | GO:0004157 | dihydropyrimidinase activity(GO:0004157) |
| 0.0 | 10.8 | GO:0001077 | transcriptional activator activity, RNA polymerase II core promoter proximal region sequence-specific binding(GO:0001077) |
| 0.0 | 0.1 | GO:0015375 | glycine:sodium symporter activity(GO:0015375) |
| 0.0 | 0.1 | GO:0004920 | interleukin-10 receptor activity(GO:0004920) |
| 0.0 | 0.2 | GO:0016748 | succinyltransferase activity(GO:0016748) |
| 0.0 | 0.4 | GO:0002162 | dystroglycan binding(GO:0002162) |
| 0.0 | 0.2 | GO:0010859 | calcium-dependent cysteine-type endopeptidase inhibitor activity(GO:0010859) |
| 0.0 | 0.0 | GO:0050508 | glucuronosyl-N-acetylglucosaminyl-proteoglycan 4-alpha-N-acetylglucosaminyltransferase activity(GO:0050508) |
| 0.0 | 0.4 | GO:0005537 | mannose binding(GO:0005537) |
| 0.0 | 0.3 | GO:0016846 | carbon-sulfur lyase activity(GO:0016846) |
| 0.0 | 0.1 | GO:0003976 | UDP-N-acetylglucosamine-lysosomal-enzyme N-acetylglucosaminephosphotransferase activity(GO:0003976) |
| 0.0 | 0.1 | GO:0005415 | nucleoside:sodium symporter activity(GO:0005415) |
| 0.0 | 0.0 | GO:0097677 | STAT family protein binding(GO:0097677) |
| 0.0 | 0.1 | GO:0004161 | dimethylallyltranstransferase activity(GO:0004161) geranyltranstransferase activity(GO:0004337) |
| 0.0 | 0.1 | GO:0004910 | interleukin-1, Type II, blocking receptor activity(GO:0004910) |
| 0.0 | 0.1 | GO:0004730 | pseudouridylate synthase activity(GO:0004730) |
| 0.0 | 0.3 | GO:1990841 | promoter-specific chromatin binding(GO:1990841) |
| 0.0 | 0.2 | GO:0036312 | phosphatidylinositol 3-kinase regulatory subunit binding(GO:0036312) |
| 0.0 | 0.1 | GO:0015450 | P-P-bond-hydrolysis-driven protein transmembrane transporter activity(GO:0015450) |
| 0.0 | 0.2 | GO:0019788 | NEDD8 transferase activity(GO:0019788) |
| 0.0 | 0.3 | GO:0000774 | adenyl-nucleotide exchange factor activity(GO:0000774) |
| 0.0 | 0.1 | GO:0048408 | epidermal growth factor binding(GO:0048408) |
| 0.0 | 0.2 | GO:0008420 | CTD phosphatase activity(GO:0008420) |
| 0.0 | 0.2 | GO:0008454 | alpha-1,3-mannosylglycoprotein 4-beta-N-acetylglucosaminyltransferase activity(GO:0008454) |
| 0.0 | 0.1 | GO:0015204 | urea transmembrane transporter activity(GO:0015204) |
| 0.0 | 1.3 | GO:0003743 | translation initiation factor activity(GO:0003743) |
| 0.0 | 0.4 | GO:0098847 | sequence-specific single stranded DNA binding(GO:0098847) |
| 0.0 | 0.2 | GO:0071837 | HMG box domain binding(GO:0071837) |
| 0.0 | 0.4 | GO:0045499 | chemorepellent activity(GO:0045499) |
| 0.0 | 0.6 | GO:0001103 | RNA polymerase II repressing transcription factor binding(GO:0001103) |
| 0.0 | 0.7 | GO:0005154 | epidermal growth factor receptor binding(GO:0005154) |
| 0.0 | 0.0 | GO:0008384 | IkappaB kinase activity(GO:0008384) |
| 0.0 | 0.1 | GO:0016405 | CoA-ligase activity(GO:0016405) |
| 0.0 | 0.3 | GO:0008020 | G-protein coupled photoreceptor activity(GO:0008020) |
| 0.0 | 0.0 | GO:0031716 | calcitonin receptor binding(GO:0031716) |
| 0.0 | 0.1 | GO:0044183 | protein binding involved in protein folding(GO:0044183) |
| 0.0 | 0.8 | GO:0017022 | myosin binding(GO:0017022) |
| 0.0 | 0.1 | GO:0005459 | UDP-galactose transmembrane transporter activity(GO:0005459) |
| 0.0 | 0.1 | GO:0050252 | retinol O-fatty-acyltransferase activity(GO:0050252) |
| 0.0 | 0.1 | GO:0043398 | HLH domain binding(GO:0043398) |
| 0.0 | 1.7 | GO:0001618 | virus receptor activity(GO:0001618) |
| 0.0 | 0.4 | GO:0016627 | oxidoreductase activity, acting on the CH-CH group of donors(GO:0016627) |
| 0.0 | 0.0 | GO:0061676 | importin-alpha family protein binding(GO:0061676) |
| 0.0 | 1.8 | GO:0032947 | protein complex scaffold(GO:0032947) |
| 0.0 | 0.1 | GO:0003910 | DNA ligase activity(GO:0003909) DNA ligase (ATP) activity(GO:0003910) |
| 0.0 | 0.3 | GO:0004791 | thioredoxin-disulfide reductase activity(GO:0004791) |
| 0.0 | 0.1 | GO:0003938 | IMP dehydrogenase activity(GO:0003938) |
| 0.0 | 0.1 | GO:0003726 | double-stranded RNA adenosine deaminase activity(GO:0003726) |
| 0.0 | 0.6 | GO:0005001 | transmembrane receptor protein tyrosine phosphatase activity(GO:0005001) transmembrane receptor protein phosphatase activity(GO:0019198) |
| 0.0 | 0.0 | GO:0097642 | calcitonin family receptor activity(GO:0097642) |
| 0.0 | 0.6 | GO:0003785 | actin monomer binding(GO:0003785) |
| 0.0 | 0.1 | GO:0002094 | polyprenyltransferase activity(GO:0002094) |
| 0.0 | 0.2 | GO:0032051 | clathrin light chain binding(GO:0032051) |
| 0.0 | 0.2 | GO:0030020 | extracellular matrix structural constituent conferring tensile strength(GO:0030020) |
| 0.0 | 0.1 | GO:0004357 | glutamate-cysteine ligase activity(GO:0004357) |
| 0.0 | 0.1 | GO:0046625 | sphingolipid binding(GO:0046625) |
| 0.0 | 0.3 | GO:0010857 | calcium-dependent protein kinase activity(GO:0010857) |
| 0.0 | 0.5 | GO:0070491 | repressing transcription factor binding(GO:0070491) |
| 0.0 | 0.1 | GO:0048495 | Roundabout binding(GO:0048495) |
| 0.0 | 0.1 | GO:1990239 | steroid hormone binding(GO:1990239) |
| 0.0 | 0.1 | GO:0004614 | phosphoglucomutase activity(GO:0004614) |
| 0.0 | 0.0 | GO:0030337 | DNA polymerase processivity factor activity(GO:0030337) |
| 0.0 | 0.3 | GO:0031492 | nucleosomal DNA binding(GO:0031492) |
| 0.0 | 0.1 | GO:0072345 | NAADP-sensitive calcium-release channel activity(GO:0072345) |
| 0.0 | 0.1 | GO:0042954 | lipoprotein transporter activity(GO:0042954) |
| 0.0 | 0.1 | GO:0004782 | sulfinoalanine decarboxylase activity(GO:0004782) |
| 0.0 | 0.0 | GO:0030619 | U1 snRNA binding(GO:0030619) |
| 0.0 | 0.7 | GO:0017080 | sodium channel regulator activity(GO:0017080) |
| 0.0 | 0.2 | GO:0043325 | phosphatidylinositol-3,4-bisphosphate binding(GO:0043325) |
| 0.0 | 0.8 | GO:0000149 | SNARE binding(GO:0000149) |
| 0.0 | 0.1 | GO:0019797 | procollagen-proline 3-dioxygenase activity(GO:0019797) |
| 0.0 | 0.1 | GO:0019784 | NEDD8-specific protease activity(GO:0019784) |
| 0.0 | 0.1 | GO:0043138 | 3'-5' DNA helicase activity(GO:0043138) |
| 0.0 | 0.1 | GO:0015321 | sodium-dependent phosphate transmembrane transporter activity(GO:0015321) |
| 0.0 | 0.0 | GO:0016886 | ligase activity, forming phosphoric ester bonds(GO:0016886) |
| 0.0 | 0.0 | GO:0008240 | tripeptidyl-peptidase activity(GO:0008240) |
| 0.0 | 0.0 | GO:1990446 | U1 snRNP binding(GO:1990446) |
| 0.0 | 0.3 | GO:0019206 | nucleoside kinase activity(GO:0019206) |
| 0.0 | 0.1 | GO:0043142 | single-stranded DNA-dependent ATPase activity(GO:0043142) |
| 0.0 | 0.0 | GO:0001129 | RNA polymerase II transcription factor activity, TBP-class protein binding, involved in preinitiation complex assembly(GO:0001129) RNA polymerase II transcription factor activity, TBP-class protein binding(GO:0001132) |
| 0.0 | 0.0 | GO:0000990 | transcription factor activity, core RNA polymerase binding(GO:0000990) |
| 0.0 | 0.1 | GO:0042975 | peroxisome proliferator activated receptor binding(GO:0042975) |
| 0.0 | 0.4 | GO:0004029 | aldehyde dehydrogenase (NAD) activity(GO:0004029) |
| 0.0 | 0.1 | GO:0097617 | annealing activity(GO:0097617) |
| 0.0 | 0.1 | GO:0070735 | protein-glycine ligase activity(GO:0070735) |
| 0.0 | 0.1 | GO:0016411 | acylglycerol O-acyltransferase activity(GO:0016411) |
| 0.0 | 0.0 | GO:0071535 | RING-like zinc finger domain binding(GO:0071535) |
| 0.0 | 0.4 | GO:0022848 | acetylcholine-gated cation channel activity(GO:0022848) |
| 0.0 | 0.0 | GO:0001716 | L-amino-acid oxidase activity(GO:0001716) |
| 0.0 | 0.2 | GO:0008239 | dipeptidyl-peptidase activity(GO:0008239) |
| 0.0 | 0.3 | GO:0001085 | RNA polymerase II transcription factor binding(GO:0001085) |
| 0.0 | 0.0 | GO:0008476 | protein-tyrosine sulfotransferase activity(GO:0008476) |
| 0.0 | 0.3 | GO:0005247 | voltage-gated chloride channel activity(GO:0005247) |
| 0.0 | 0.2 | GO:0070742 | C2H2 zinc finger domain binding(GO:0070742) |
| 0.0 | 0.0 | GO:0050693 | LBD domain binding(GO:0050693) |
| 0.0 | 0.0 | GO:0038181 | bile acid receptor activity(GO:0038181) |
| 0.0 | 0.1 | GO:0004359 | glutaminase activity(GO:0004359) |
| 0.0 | 0.1 | GO:0003978 | UDP-N-acetylglucosamine 4-epimerase activity(GO:0003974) UDP-glucose 4-epimerase activity(GO:0003978) |
| 0.0 | 0.0 | GO:0008970 | phosphatidylcholine 1-acylhydrolase activity(GO:0008970) |
| 0.0 | 0.2 | GO:0050811 | GABA receptor binding(GO:0050811) |
| 0.0 | 0.2 | GO:0003756 | protein disulfide isomerase activity(GO:0003756) intramolecular oxidoreductase activity, transposing S-S bonds(GO:0016864) |
| 0.0 | 0.2 | GO:0005095 | GTPase inhibitor activity(GO:0005095) |
| 0.0 | 0.3 | GO:0031418 | L-ascorbic acid binding(GO:0031418) |
| 0.0 | 0.0 | GO:0001032 | RNA polymerase III type 3 promoter DNA binding(GO:0001032) |
| 0.0 | 0.0 | GO:0004982 | N-formyl peptide receptor activity(GO:0004982) |
| 0.0 | 0.4 | GO:0080025 | phosphatidylinositol-3,5-bisphosphate binding(GO:0080025) |
| 0.0 | 0.1 | GO:0097016 | L27 domain binding(GO:0097016) |
| 0.0 | 0.1 | GO:0017056 | structural constituent of nuclear pore(GO:0017056) |
| 0.0 | 0.2 | GO:0003796 | lysozyme activity(GO:0003796) |
| 0.0 | 0.1 | GO:0004447 | iodide peroxidase activity(GO:0004447) |
| 0.0 | 0.0 | GO:0003854 | 3-beta-hydroxy-delta5-steroid dehydrogenase activity(GO:0003854) |
| 0.0 | 0.7 | GO:0051219 | phosphoprotein binding(GO:0051219) |
| 0.0 | 0.1 | GO:0071936 | coreceptor activity involved in Wnt signaling pathway(GO:0071936) |
| 0.0 | 0.3 | GO:0035326 | enhancer binding(GO:0035326) |
| 0.0 | 0.9 | GO:0004519 | endonuclease activity(GO:0004519) |
| 0.0 | 0.4 | GO:0005487 | nucleocytoplasmic transporter activity(GO:0005487) |
| 0.0 | 0.1 | GO:0060228 | phosphatidylcholine-sterol O-acyltransferase activator activity(GO:0060228) |
| 0.0 | 0.0 | GO:0045131 | pre-mRNA branch point binding(GO:0045131) |
Gene overrepresentation in curated gene sets: canonical pathways category:
| Log-likelihood per target | Total log-likelihood | Term | Description |
|---|---|---|---|
| 0.2 | 1.4 | ST IL 13 PATHWAY | Interleukin 13 (IL-13) Pathway |
| 0.2 | 14.4 | PID TCR CALCIUM PATHWAY | Calcium signaling in the CD4+ TCR pathway |
| 0.2 | 13.3 | PID CD40 PATHWAY | CD40/CD40L signaling |
| 0.2 | 3.0 | PID VEGF VEGFR PATHWAY | VEGF and VEGFR signaling network |
| 0.2 | 2.5 | PID TCR RAS PATHWAY | Ras signaling in the CD4+ TCR pathway |
| 0.2 | 6.4 | PID SMAD2 3PATHWAY | Regulation of cytoplasmic and nuclear SMAD2/3 signaling |
| 0.2 | 8.2 | PID MAPK TRK PATHWAY | Trk receptor signaling mediated by the MAPK pathway |
| 0.2 | 1.6 | ST PHOSPHOINOSITIDE 3 KINASE PATHWAY | PI3K Pathway |
| 0.1 | 2.9 | PID NFKAPPAB ATYPICAL PATHWAY | Atypical NF-kappaB pathway |
| 0.1 | 5.0 | PID IL2 1PATHWAY | IL2-mediated signaling events |
| 0.1 | 4.7 | PID EPHRINB REV PATHWAY | Ephrin B reverse signaling |
| 0.1 | 2.0 | PID AVB3 OPN PATHWAY | Osteopontin-mediated events |
| 0.1 | 0.1 | PID FAS PATHWAY | FAS (CD95) signaling pathway |
| 0.1 | 0.7 | PID IL2 PI3K PATHWAY | IL2 signaling events mediated by PI3K |
| 0.1 | 4.2 | PID HDAC CLASSIII PATHWAY | Signaling events mediated by HDAC Class III |
| 0.1 | 0.9 | ST INTERFERON GAMMA PATHWAY | Interferon gamma pathway. |
| 0.1 | 7.8 | PID HES HEY PATHWAY | Notch-mediated HES/HEY network |
| 0.1 | 1.3 | ST PAC1 RECEPTOR PATHWAY | PAC1 Receptor Pathway |
| 0.1 | 6.3 | PID IL6 7 PATHWAY | IL6-mediated signaling events |
| 0.1 | 3.8 | ST P38 MAPK PATHWAY | p38 MAPK Pathway |
| 0.1 | 5.1 | PID NCADHERIN PATHWAY | N-cadherin signaling events |
| 0.1 | 0.5 | PID PI3KCI AKT PATHWAY | Class I PI3K signaling events mediated by Akt |
| 0.1 | 3.6 | PID TRAIL PATHWAY | TRAIL signaling pathway |
| 0.1 | 2.7 | PID ALPHA SYNUCLEIN PATHWAY | Alpha-synuclein signaling |
| 0.1 | 1.6 | PID NFAT 3PATHWAY | Role of Calcineurin-dependent NFAT signaling in lymphocytes |
| 0.1 | 0.3 | PID ERBB1 RECEPTOR PROXIMAL PATHWAY | EGF receptor (ErbB1) signaling pathway |
| 0.1 | 2.7 | SA MMP CYTOKINE CONNECTION | Cytokines can induce activation of matrix metalloproteinases, which degrade extracellular matrix. |
| 0.1 | 1.3 | PID PI3K PLC TRK PATHWAY | Trk receptor signaling mediated by PI3K and PLC-gamma |
| 0.1 | 1.8 | PID GMCSF PATHWAY | GMCSF-mediated signaling events |
| 0.1 | 2.4 | PID IL23 PATHWAY | IL23-mediated signaling events |
| 0.1 | 0.8 | PID VEGFR1 PATHWAY | VEGFR1 specific signals |
| 0.1 | 0.5 | PID WNT SIGNALING PATHWAY | Wnt signaling network |
| 0.1 | 1.2 | PID INTEGRIN A4B1 PATHWAY | Alpha4 beta1 integrin signaling events |
| 0.1 | 0.4 | PID RANBP2 PATHWAY | Sumoylation by RanBP2 regulates transcriptional repression |
| 0.1 | 0.6 | PID PDGFRA PATHWAY | PDGFR-alpha signaling pathway |
| 0.1 | 0.3 | PID SYNDECAN 1 PATHWAY | Syndecan-1-mediated signaling events |
| 0.1 | 0.1 | ST GAQ PATHWAY | G alpha q Pathway |
| 0.1 | 8.0 | PID CMYB PATHWAY | C-MYB transcription factor network |
| 0.1 | 4.0 | PID FOXO PATHWAY | FoxO family signaling |
| 0.1 | 1.2 | PID ANTHRAX PATHWAY | Cellular roles of Anthrax toxin |
| 0.1 | 0.2 | SA G1 AND S PHASES | Cdk2, 4, and 6 bind cyclin D in G1, while cdk2/cyclin E promotes the G1/S transition. |
| 0.1 | 4.5 | PID CASPASE PATHWAY | Caspase cascade in apoptosis |
| 0.1 | 2.1 | PID TNF PATHWAY | TNF receptor signaling pathway |
| 0.1 | 1.7 | PID IGF1 PATHWAY | IGF1 pathway |
| 0.1 | 3.8 | PID TGFBR PATHWAY | TGF-beta receptor signaling |
| 0.1 | 4.8 | PID HNF3A PATHWAY | FOXA1 transcription factor network |
| 0.1 | 1.0 | PID IL2 STAT5 PATHWAY | IL2 signaling events mediated by STAT5 |
| 0.1 | 1.0 | PID IFNG PATHWAY | IFN-gamma pathway |
| 0.1 | 0.1 | PID CXCR3 PATHWAY | CXCR3-mediated signaling events |
| 0.1 | 0.9 | PID P38 MKK3 6PATHWAY | p38 MAPK signaling pathway |
| 0.1 | 0.6 | ST GRANULE CELL SURVIVAL PATHWAY | Granule Cell Survival Pathway is a specific case of more general PAC1 Receptor Pathway. |
| 0.1 | 0.1 | SA TRKA RECEPTOR | The TrkA receptor binds nerve growth factor to activate MAP kinase pathways and promote cell growth. |
| 0.1 | 1.1 | PID NFKAPPAB CANONICAL PATHWAY | Canonical NF-kappaB pathway |
| 0.1 | 0.4 | PID NECTIN PATHWAY | Nectin adhesion pathway |
| 0.1 | 1.7 | PID ANGIOPOIETIN RECEPTOR PATHWAY | Angiopoietin receptor Tie2-mediated signaling |
| 0.1 | 1.3 | PID ERB GENOMIC PATHWAY | Validated nuclear estrogen receptor beta network |
| 0.1 | 0.1 | SIG IL4RECEPTOR IN B LYPHOCYTES | Genes related to IL4 rceptor signaling in B lymphocytes |
| 0.1 | 1.6 | PID MYC PATHWAY | C-MYC pathway |
| 0.1 | 0.2 | SA CASPASE CASCADE | Apoptosis is mediated by caspases, cysteine proteases arranged in a proteolytic cascade. |
| 0.0 | 1.1 | PID S1P S1P1 PATHWAY | S1P1 pathway |
| 0.0 | 1.6 | PID SYNDECAN 2 PATHWAY | Syndecan-2-mediated signaling events |
| 0.0 | 0.1 | PID EPO PATHWAY | EPO signaling pathway |
| 0.0 | 0.6 | SIG CD40PATHWAYMAP | Genes related to CD40 signaling |
| 0.0 | 2.3 | SIG INSULIN RECEPTOR PATHWAY IN CARDIAC MYOCYTES | Genes related to the insulin receptor pathway |
| 0.0 | 0.1 | ST TYPE I INTERFERON PATHWAY | Type I Interferon (alpha/beta IFN) Pathway |
| 0.0 | 0.3 | SA REG CASCADE OF CYCLIN EXPR | Expression of cyclins regulates progression through the cell cycle by activating cyclin-dependent kinases. |
| 0.0 | 0.4 | PID TCPTP PATHWAY | Signaling events mediated by TCPTP |
| 0.0 | 0.1 | SA B CELL RECEPTOR COMPLEXES | Antigen binding to B cell receptors activates protein tyrosine kinases, such as the Src family, which ultimate activate MAP kinases. |
| 0.0 | 0.4 | PID P38 GAMMA DELTA PATHWAY | Signaling mediated by p38-gamma and p38-delta |
| 0.0 | 0.8 | PID ARF6 DOWNSTREAM PATHWAY | Arf6 downstream pathway |
| 0.0 | 0.3 | PID HDAC CLASSII PATHWAY | Signaling events mediated by HDAC Class II |
| 0.0 | 1.3 | PID RB 1PATHWAY | Regulation of retinoblastoma protein |
| 0.0 | 0.9 | PID PRL SIGNALING EVENTS PATHWAY | Signaling events mediated by PRL |
| 0.0 | 0.2 | PID BETA CATENIN DEG PATHWAY | Degradation of beta catenin |
| 0.0 | 0.7 | PID RETINOIC ACID PATHWAY | Retinoic acid receptors-mediated signaling |
| 0.0 | 0.2 | ST GA13 PATHWAY | G alpha 13 Pathway |
| 0.0 | 0.5 | PID INTEGRIN A9B1 PATHWAY | Alpha9 beta1 integrin signaling events |
| 0.0 | 0.7 | PID IL12 2PATHWAY | IL12-mediated signaling events |
| 0.0 | 0.4 | PID ERBB2 ERBB3 PATHWAY | ErbB2/ErbB3 signaling events |
| 0.0 | 0.6 | PID CERAMIDE PATHWAY | Ceramide signaling pathway |
| 0.0 | 0.8 | PID AURORA A PATHWAY | Aurora A signaling |
| 0.0 | 1.4 | PID MTOR 4PATHWAY | mTOR signaling pathway |
| 0.0 | 0.6 | SIG PIP3 SIGNALING IN CARDIAC MYOCTES | Genes related to PIP3 signaling in cardiac myocytes |
| 0.0 | 0.5 | PID SYNDECAN 3 PATHWAY | Syndecan-3-mediated signaling events |
| 0.0 | 0.7 | PID SYNDECAN 4 PATHWAY | Syndecan-4-mediated signaling events |
| 0.0 | 0.9 | PID FAK PATHWAY | Signaling events mediated by focal adhesion kinase |
| 0.0 | 1.8 | PID E2F PATHWAY | E2F transcription factor network |
| 0.0 | 0.3 | PID P38 MK2 PATHWAY | p38 signaling mediated by MAPKAP kinases |
| 0.0 | 0.2 | PID P38 ALPHA BETA PATHWAY | Regulation of p38-alpha and p38-beta |
| 0.0 | 0.4 | PID IL1 PATHWAY | IL1-mediated signaling events |
| 0.0 | 0.3 | PID EPHB FWD PATHWAY | EPHB forward signaling |
| 0.0 | 0.8 | PID TAP63 PATHWAY | Validated transcriptional targets of TAp63 isoforms |
| 0.0 | 0.6 | PID ATF2 PATHWAY | ATF-2 transcription factor network |
| 0.0 | 0.3 | PID INTEGRIN CS PATHWAY | Integrin family cell surface interactions |
| 0.0 | 0.3 | SA FAS SIGNALING | The TNF-type receptor Fas induces apoptosis on ligand binding. |
| 0.0 | 1.0 | PID ARF6 TRAFFICKING PATHWAY | Arf6 trafficking events |
| 0.0 | 1.4 | PID P73PATHWAY | p73 transcription factor network |
| 0.0 | 0.4 | PID CXCR4 PATHWAY | CXCR4-mediated signaling events |
| 0.0 | 0.7 | PID AMB2 NEUTROPHILS PATHWAY | amb2 Integrin signaling |
| 0.0 | 0.1 | PID S1P S1P4 PATHWAY | S1P4 pathway |
| 0.0 | 0.4 | NABA BASEMENT MEMBRANES | Genes encoding structural components of basement membranes |
| 0.0 | 0.7 | PID RAS PATHWAY | Regulation of Ras family activation |
| 0.0 | 0.5 | PID ECADHERIN STABILIZATION PATHWAY | Stabilization and expansion of the E-cadherin adherens junction |
| 0.0 | 0.5 | PID HEDGEHOG 2PATHWAY | Signaling events mediated by the Hedgehog family |
| 0.0 | 0.4 | PID ATM PATHWAY | ATM pathway |
| 0.0 | 0.1 | PID S1P S1P2 PATHWAY | S1P2 pathway |
| 0.0 | 0.0 | PID INSULIN PATHWAY | Insulin Pathway |
| 0.0 | 0.1 | PID IL8 CXCR1 PATHWAY | IL8- and CXCR1-mediated signaling events |
| 0.0 | 0.3 | ST T CELL SIGNAL TRANSDUCTION | T Cell Signal Transduction |
| 0.0 | 1.6 | PID BETA CATENIN NUC PATHWAY | Regulation of nuclear beta catenin signaling and target gene transcription |
| 0.0 | 0.4 | PID ARF6 PATHWAY | Arf6 signaling events |
| 0.0 | 0.9 | PID HNF3B PATHWAY | FOXA2 and FOXA3 transcription factor networks |
| 0.0 | 0.1 | PID AR NONGENOMIC PATHWAY | Nongenotropic Androgen signaling |
| 0.0 | 0.4 | PID TOLL ENDOGENOUS PATHWAY | Endogenous TLR signaling |
| 0.0 | 0.1 | ST ERK1 ERK2 MAPK PATHWAY | ERK1/ERK2 MAPK Pathway |
| 0.0 | 0.3 | PID FRA PATHWAY | Validated transcriptional targets of AP1 family members Fra1 and Fra2 |
| 0.0 | 0.4 | PID REG GR PATHWAY | Glucocorticoid receptor regulatory network |
| 0.0 | 0.5 | PID CONE PATHWAY | Visual signal transduction: Cones |
| 0.0 | 1.0 | PID MYC REPRESS PATHWAY | Validated targets of C-MYC transcriptional repression |
| 0.0 | 0.4 | PID CD8 TCR DOWNSTREAM PATHWAY | Downstream signaling in naïve CD8+ T cells |
| 0.0 | 4.4 | NABA SECRETED FACTORS | Genes encoding secreted soluble factors |
| 0.0 | 0.0 | SA G2 AND M PHASES | Cdc25 activates the cdc2/cyclin B complex to induce the G2/M transition. |
| 0.0 | 0.4 | PID HIF2PATHWAY | HIF-2-alpha transcription factor network |
| 0.0 | 0.1 | PID UPA UPAR PATHWAY | Urokinase-type plasminogen activator (uPA) and uPAR-mediated signaling |
| 0.0 | 0.1 | PID NEPHRIN NEPH1 PATHWAY | Nephrin/Neph1 signaling in the kidney podocyte |
| 0.0 | 0.2 | PID PDGFRB PATHWAY | PDGFR-beta signaling pathway |
| 0.0 | 0.3 | PID HEDGEHOG GLI PATHWAY | Hedgehog signaling events mediated by Gli proteins |
Gene overrepresentation in curated gene sets: REACTOME pathways category:
| Log-likelihood per target | Total log-likelihood | Term | Description |
|---|---|---|---|
| 0.3 | 0.9 | REACTOME ACTIVATION OF IRF3 IRF7 MEDIATED BY TBK1 IKK EPSILON | Genes involved in Activation of IRF3/IRF7 mediated by TBK1/IKK epsilon |
| 0.3 | 13.1 | REACTOME FORMATION OF FIBRIN CLOT CLOTTING CASCADE | Genes involved in Formation of Fibrin Clot (Clotting Cascade) |
| 0.2 | 0.2 | REACTOME ARMS MEDIATED ACTIVATION | Genes involved in ARMS-mediated activation |
| 0.2 | 1.6 | REACTOME ACTIVATION OF NF KAPPAB IN B CELLS | Genes involved in Activation of NF-kappaB in B Cells |
| 0.2 | 9.8 | REACTOME NOD1 2 SIGNALING PATHWAY | Genes involved in NOD1/2 Signaling Pathway |
| 0.2 | 3.8 | REACTOME SEMA3A PLEXIN REPULSION SIGNALING BY INHIBITING INTEGRIN ADHESION | Genes involved in SEMA3A-Plexin repulsion signaling by inhibiting Integrin adhesion |
| 0.2 | 2.0 | REACTOME NFKB IS ACTIVATED AND SIGNALS SURVIVAL | Genes involved in NF-kB is activated and signals survival |
| 0.2 | 7.9 | REACTOME GROWTH HORMONE RECEPTOR SIGNALING | Genes involved in Growth hormone receptor signaling |
| 0.2 | 0.8 | REACTOME ACTIVATED TAK1 MEDIATES P38 MAPK ACTIVATION | Genes involved in activated TAK1 mediates p38 MAPK activation |
| 0.1 | 0.4 | REACTOME SIGNALING BY FGFR3 MUTANTS | Genes involved in Signaling by FGFR3 mutants |
| 0.1 | 0.6 | REACTOME IRAK1 RECRUITS IKK COMPLEX | Genes involved in IRAK1 recruits IKK complex |
| 0.1 | 5.3 | REACTOME IL1 SIGNALING | Genes involved in Interleukin-1 signaling |
| 0.1 | 5.0 | REACTOME PEROXISOMAL LIPID METABOLISM | Genes involved in Peroxisomal lipid metabolism |
| 0.1 | 0.4 | REACTOME DESTABILIZATION OF MRNA BY AUF1 HNRNP D0 | Genes involved in Destabilization of mRNA by AUF1 (hnRNP D0) |
| 0.1 | 4.3 | REACTOME BRANCHED CHAIN AMINO ACID CATABOLISM | Genes involved in Branched-chain amino acid catabolism |
| 0.1 | 2.6 | REACTOME MITOCHONDRIAL FATTY ACID BETA OXIDATION | Genes involved in Mitochondrial Fatty Acid Beta-Oxidation |
| 0.1 | 3.1 | REACTOME NOTCH HLH TRANSCRIPTION PATHWAY | Genes involved in Notch-HLH transcription pathway |
| 0.1 | 6.8 | REACTOME SMAD2 SMAD3 SMAD4 HETEROTRIMER REGULATES TRANSCRIPTION | Genes involved in SMAD2/SMAD3:SMAD4 heterotrimer regulates transcription |
| 0.1 | 1.2 | REACTOME UNFOLDED PROTEIN RESPONSE | Genes involved in Unfolded Protein Response |
| 0.1 | 1.8 | REACTOME ETHANOL OXIDATION | Genes involved in Ethanol oxidation |
| 0.1 | 0.1 | REACTOME BILE ACID AND BILE SALT METABOLISM | Genes involved in Bile acid and bile salt metabolism |
| 0.1 | 3.0 | REACTOME REGULATION OF INSULIN LIKE GROWTH FACTOR IGF ACTIVITY BY INSULIN LIKE GROWTH FACTOR BINDING PROTEINS IGFBPS | Genes involved in Regulation of Insulin-like Growth Factor (IGF) Activity by Insulin-like Growth Factor Binding Proteins (IGFBPs) |
| 0.1 | 1.7 | REACTOME VEGF LIGAND RECEPTOR INTERACTIONS | Genes involved in VEGF ligand-receptor interactions |
| 0.1 | 0.9 | REACTOME INHIBITION OF REPLICATION INITIATION OF DAMAGED DNA BY RB1 E2F1 | Genes involved in Inhibition of replication initiation of damaged DNA by RB1/E2F1 |
| 0.1 | 2.3 | REACTOME PURINE CATABOLISM | Genes involved in Purine catabolism |
| 0.1 | 3.2 | REACTOME SYNTHESIS OF GLYCOSYLPHOSPHATIDYLINOSITOL GPI | Genes involved in Synthesis of glycosylphosphatidylinositol (GPI) |
| 0.1 | 2.9 | REACTOME ACTIVATION OF BH3 ONLY PROTEINS | Genes involved in Activation of BH3-only proteins |
| 0.1 | 3.2 | REACTOME INFLAMMASOMES | Genes involved in Inflammasomes |
| 0.1 | 3.1 | REACTOME PROTEOLYTIC CLEAVAGE OF SNARE COMPLEX PROTEINS | Genes involved in Proteolytic cleavage of SNARE complex proteins |
| 0.1 | 4.1 | REACTOME SYNTHESIS AND INTERCONVERSION OF NUCLEOTIDE DI AND TRIPHOSPHATES | Genes involved in Synthesis and interconversion of nucleotide di- and triphosphates |
| 0.1 | 0.5 | REACTOME PECAM1 INTERACTIONS | Genes involved in PECAM1 interactions |
| 0.1 | 4.7 | REACTOME CHOLESTEROL BIOSYNTHESIS | Genes involved in Cholesterol biosynthesis |
| 0.1 | 0.2 | REACTOME ACYL CHAIN REMODELLING OF PI | Genes involved in Acyl chain remodelling of PI |
| 0.1 | 2.4 | REACTOME TETRAHYDROBIOPTERIN BH4 SYNTHESIS RECYCLING SALVAGE AND REGULATION | Genes involved in Tetrahydrobiopterin (BH4) synthesis, recycling, salvage and regulation |
| 0.1 | 3.1 | REACTOME EXTRINSIC PATHWAY FOR APOPTOSIS | Genes involved in Extrinsic Pathway for Apoptosis |
| 0.1 | 1.5 | REACTOME MRNA DECAY BY 3 TO 5 EXORIBONUCLEASE | Genes involved in mRNA Decay by 3' to 5' Exoribonuclease |
| 0.1 | 1.2 | REACTOME SYNTHESIS OF BILE ACIDS AND BILE SALTS VIA 7ALPHA HYDROXYCHOLESTEROL | Genes involved in Synthesis of bile acids and bile salts via 7alpha-hydroxycholesterol |
| 0.1 | 1.0 | REACTOME SIGNALING BY CONSTITUTIVELY ACTIVE EGFR | Genes involved in Signaling by constitutively active EGFR |
| 0.1 | 6.3 | REACTOME NOTCH1 INTRACELLULAR DOMAIN REGULATES TRANSCRIPTION | Genes involved in NOTCH1 Intracellular Domain Regulates Transcription |
| 0.1 | 0.5 | REACTOME RECEPTOR LIGAND BINDING INITIATES THE SECOND PROTEOLYTIC CLEAVAGE OF NOTCH RECEPTOR | Genes involved in Receptor-ligand binding initiates the second proteolytic cleavage of Notch receptor |
| 0.1 | 5.1 | REACTOME CA DEPENDENT EVENTS | Genes involved in Ca-dependent events |
| 0.1 | 0.5 | REACTOME RIP MEDIATED NFKB ACTIVATION VIA DAI | Genes involved in RIP-mediated NFkB activation via DAI |
| 0.1 | 0.6 | REACTOME BINDING AND ENTRY OF HIV VIRION | Genes involved in Binding and entry of HIV virion |
| 0.1 | 1.0 | REACTOME CS DS DEGRADATION | Genes involved in CS/DS degradation |
| 0.1 | 2.5 | REACTOME ACYL CHAIN REMODELLING OF PC | Genes involved in Acyl chain remodelling of PC |
| 0.1 | 1.6 | REACTOME SIGNALING BY HIPPO | Genes involved in Signaling by Hippo |
| 0.1 | 5.9 | REACTOME CHEMOKINE RECEPTORS BIND CHEMOKINES | Genes involved in Chemokine receptors bind chemokines |
| 0.1 | 1.8 | REACTOME SIGNALING BY ACTIVATED POINT MUTANTS OF FGFR1 | Genes involved in Signaling by activated point mutants of FGFR1 |
| 0.1 | 2.8 | REACTOME DOWNREGULATION OF TGF BETA RECEPTOR SIGNALING | Genes involved in Downregulation of TGF-beta receptor signaling |
| 0.1 | 2.9 | REACTOME DARPP 32 EVENTS | Genes involved in DARPP-32 events |
| 0.1 | 0.3 | REACTOME P53 DEPENDENT G1 DNA DAMAGE RESPONSE | Genes involved in p53-Dependent G1 DNA Damage Response |
| 0.1 | 2.3 | REACTOME INSULIN SYNTHESIS AND PROCESSING | Genes involved in Insulin Synthesis and Processing |
| 0.1 | 0.7 | REACTOME ADVANCED GLYCOSYLATION ENDPRODUCT RECEPTOR SIGNALING | Genes involved in Advanced glycosylation endproduct receptor signaling |
| 0.1 | 4.2 | REACTOME ABC FAMILY PROTEINS MEDIATED TRANSPORT | Genes involved in ABC-family proteins mediated transport |
| 0.1 | 1.1 | REACTOME REGULATION OF IFNG SIGNALING | Genes involved in Regulation of IFNG signaling |
| 0.1 | 1.5 | REACTOME REGULATION OF KIT SIGNALING | Genes involved in Regulation of KIT signaling |
| 0.1 | 2.4 | REACTOME NUCLEAR EVENTS KINASE AND TRANSCRIPTION FACTOR ACTIVATION | Genes involved in Nuclear Events (kinase and transcription factor activation) |
| 0.1 | 1.7 | REACTOME TRAF6 MEDIATED IRF7 ACTIVATION | Genes involved in TRAF6 mediated IRF7 activation |
| 0.1 | 0.5 | REACTOME NGF SIGNALLING VIA TRKA FROM THE PLASMA MEMBRANE | Genes involved in NGF signalling via TRKA from the plasma membrane |
| 0.1 | 1.6 | REACTOME SYNTHESIS OF PE | Genes involved in Synthesis of PE |
| 0.1 | 1.5 | REACTOME BILE SALT AND ORGANIC ANION SLC TRANSPORTERS | Genes involved in Bile salt and organic anion SLC transporters |
| 0.1 | 0.9 | REACTOME SHC RELATED EVENTS | Genes involved in SHC-related events |
| 0.1 | 0.6 | REACTOME IKK COMPLEX RECRUITMENT MEDIATED BY RIP1 | Genes involved in IKK complex recruitment mediated by RIP1 |
| 0.1 | 0.2 | REACTOME G PROTEIN ACTIVATION | Genes involved in G-protein activation |
| 0.1 | 1.2 | REACTOME UNWINDING OF DNA | Genes involved in Unwinding of DNA |
| 0.1 | 1.1 | REACTOME ROLE OF DCC IN REGULATING APOPTOSIS | Genes involved in Role of DCC in regulating apoptosis |
| 0.1 | 1.5 | REACTOME SYNTHESIS OF PA | Genes involved in Synthesis of PA |
| 0.1 | 1.8 | REACTOME APOPTOTIC CLEAVAGE OF CELL ADHESION PROTEINS | Genes involved in Apoptotic cleavage of cell adhesion proteins |
| 0.1 | 2.8 | REACTOME SEMA4D INDUCED CELL MIGRATION AND GROWTH CONE COLLAPSE | Genes involved in Sema4D induced cell migration and growth-cone collapse |
| 0.1 | 3.1 | REACTOME GLUTATHIONE CONJUGATION | Genes involved in Glutathione conjugation |
| 0.1 | 0.3 | REACTOME CROSS PRESENTATION OF SOLUBLE EXOGENOUS ANTIGENS ENDOSOMES | Genes involved in Cross-presentation of soluble exogenous antigens (endosomes) |
| 0.1 | 1.3 | REACTOME BASE FREE SUGAR PHOSPHATE REMOVAL VIA THE SINGLE NUCLEOTIDE REPLACEMENT PATHWAY | Genes involved in Base-free sugar-phosphate removal via the single-nucleotide replacement pathway |
| 0.1 | 0.5 | REACTOME PLATELET ADHESION TO EXPOSED COLLAGEN | Genes involved in Platelet Adhesion to exposed collagen |
| 0.1 | 1.1 | REACTOME SIGNALING BY FGFR1 MUTANTS | Genes involved in Signaling by FGFR1 mutants |
| 0.1 | 6.5 | REACTOME TRANS GOLGI NETWORK VESICLE BUDDING | Genes involved in trans-Golgi Network Vesicle Budding |
| 0.1 | 5.5 | REACTOME RESPIRATORY ELECTRON TRANSPORT | Genes involved in Respiratory electron transport |
| 0.1 | 2.0 | REACTOME ABORTIVE ELONGATION OF HIV1 TRANSCRIPT IN THE ABSENCE OF TAT | Genes involved in Abortive elongation of HIV-1 transcript in the absence of Tat |
| 0.1 | 0.5 | REACTOME SIGNALING BY NOTCH4 | Genes involved in Signaling by NOTCH4 |
| 0.1 | 0.3 | REACTOME TRANSPORT OF MATURE MRNA DERIVED FROM AN INTRONLESS TRANSCRIPT | Genes involved in Transport of Mature mRNA Derived from an Intronless Transcript |
| 0.1 | 0.9 | REACTOME RECRUITMENT OF NUMA TO MITOTIC CENTROSOMES | Genes involved in Recruitment of NuMA to mitotic centrosomes |
| 0.1 | 2.2 | REACTOME PYRIMIDINE METABOLISM | Genes involved in Pyrimidine metabolism |
| 0.1 | 1.5 | REACTOME RNA POL III TRANSCRIPTION TERMINATION | Genes involved in RNA Polymerase III Transcription Termination |
| 0.1 | 1.3 | REACTOME REGULATION OF IFNA SIGNALING | Genes involved in Regulation of IFNA signaling |
| 0.1 | 1.9 | REACTOME INTEGRIN ALPHAIIB BETA3 SIGNALING | Genes involved in Integrin alphaIIb beta3 signaling |
| 0.1 | 0.1 | REACTOME PI3K AKT ACTIVATION | Genes involved in PI3K/AKT activation |
| 0.1 | 1.6 | REACTOME CASPASE MEDIATED CLEAVAGE OF CYTOSKELETAL PROTEINS | Genes involved in Caspase-mediated cleavage of cytoskeletal proteins |
| 0.1 | 0.1 | REACTOME THROMBOXANE SIGNALLING THROUGH TP RECEPTOR | Genes involved in Thromboxane signalling through TP receptor |
| 0.1 | 0.8 | REACTOME TRAF6 MEDIATED NFKB ACTIVATION | Genes involved in TRAF6 mediated NF-kB activation |
| 0.1 | 1.2 | REACTOME REGULATION OF COMPLEMENT CASCADE | Genes involved in Regulation of Complement cascade |
| 0.1 | 2.6 | REACTOME INTERACTIONS OF VPR WITH HOST CELLULAR PROTEINS | Genes involved in Interactions of Vpr with host cellular proteins |
| 0.1 | 0.6 | REACTOME POST TRANSLATIONAL MODIFICATION SYNTHESIS OF GPI ANCHORED PROTEINS | Genes involved in Post-translational modification: synthesis of GPI-anchored proteins |
| 0.1 | 1.9 | REACTOME CHONDROITIN SULFATE BIOSYNTHESIS | Genes involved in Chondroitin sulfate biosynthesis |
| 0.1 | 0.7 | REACTOME MRNA CAPPING | Genes involved in mRNA Capping |
| 0.1 | 1.2 | REACTOME SIGNAL REGULATORY PROTEIN SIRP FAMILY INTERACTIONS | Genes involved in Signal regulatory protein (SIRP) family interactions |
| 0.0 | 1.0 | REACTOME GLYCOGEN BREAKDOWN GLYCOGENOLYSIS | Genes involved in Glycogen breakdown (glycogenolysis) |
| 0.0 | 0.0 | REACTOME P53 INDEPENDENT G1 S DNA DAMAGE CHECKPOINT | Genes involved in p53-Independent G1/S DNA damage checkpoint |
| 0.0 | 1.4 | REACTOME N GLYCAN ANTENNAE ELONGATION IN THE MEDIAL TRANS GOLGI | Genes involved in N-glycan antennae elongation in the medial/trans-Golgi |
| 0.0 | 0.0 | REACTOME P75NTR RECRUITS SIGNALLING COMPLEXES | Genes involved in p75NTR recruits signalling complexes |
| 0.0 | 0.7 | REACTOME TRAFFICKING AND PROCESSING OF ENDOSOMAL TLR | Genes involved in Trafficking and processing of endosomal TLR |
| 0.0 | 1.0 | REACTOME PURINE SALVAGE | Genes involved in Purine salvage |
| 0.0 | 0.9 | REACTOME MTORC1 MEDIATED SIGNALLING | Genes involved in mTORC1-mediated signalling |
| 0.0 | 0.5 | REACTOME SIGNALLING TO P38 VIA RIT AND RIN | Genes involved in Signalling to p38 via RIT and RIN |
| 0.0 | 0.0 | REACTOME REGULATION OF SIGNALING BY CBL | Genes involved in Regulation of signaling by CBL |
| 0.0 | 2.7 | REACTOME SIGNALING BY SCF KIT | Genes involved in Signaling by SCF-KIT |
| 0.0 | 2.9 | REACTOME TRAFFICKING OF AMPA RECEPTORS | Genes involved in Trafficking of AMPA receptors |
| 0.0 | 0.0 | REACTOME ACTIVATION OF THE PRE REPLICATIVE COMPLEX | Genes involved in Activation of the pre-replicative complex |
| 0.0 | 0.2 | REACTOME GAMMA CARBOXYLATION TRANSPORT AND AMINO TERMINAL CLEAVAGE OF PROTEINS | Genes involved in Gamma-carboxylation, transport, and amino-terminal cleavage of proteins |
| 0.0 | 0.9 | REACTOME CITRIC ACID CYCLE TCA CYCLE | Genes involved in Citric acid cycle (TCA cycle) |
| 0.0 | 1.3 | REACTOME GABA SYNTHESIS RELEASE REUPTAKE AND DEGRADATION | Genes involved in GABA synthesis, release, reuptake and degradation |
| 0.0 | 0.3 | REACTOME SEMA3A PAK DEPENDENT AXON REPULSION | Genes involved in Sema3A PAK dependent Axon repulsion |
| 0.0 | 0.2 | REACTOME PLATELET AGGREGATION PLUG FORMATION | Genes involved in Platelet Aggregation (Plug Formation) |
| 0.0 | 1.8 | REACTOME COSTIMULATION BY THE CD28 FAMILY | Genes involved in Costimulation by the CD28 family |
| 0.0 | 2.1 | REACTOME MITOCHONDRIAL PROTEIN IMPORT | Genes involved in Mitochondrial Protein Import |
| 0.0 | 1.6 | REACTOME SMOOTH MUSCLE CONTRACTION | Genes involved in Smooth Muscle Contraction |
| 0.0 | 0.5 | REACTOME RECYCLING PATHWAY OF L1 | Genes involved in Recycling pathway of L1 |
| 0.0 | 2.8 | REACTOME NRAGE SIGNALS DEATH THROUGH JNK | Genes involved in NRAGE signals death through JNK |
| 0.0 | 0.8 | REACTOME CHYLOMICRON MEDIATED LIPID TRANSPORT | Genes involved in Chylomicron-mediated lipid transport |
| 0.0 | 0.4 | REACTOME JNK C JUN KINASES PHOSPHORYLATION AND ACTIVATION MEDIATED BY ACTIVATED HUMAN TAK1 | Genes involved in JNK (c-Jun kinases) phosphorylation and activation mediated by activated human TAK1 |
| 0.0 | 0.3 | REACTOME COPI MEDIATED TRANSPORT | Genes involved in COPI Mediated Transport |
| 0.0 | 0.0 | REACTOME CELL DEATH SIGNALLING VIA NRAGE NRIF AND NADE | Genes involved in Cell death signalling via NRAGE, NRIF and NADE |
| 0.0 | 1.3 | REACTOME MEIOTIC RECOMBINATION | Genes involved in Meiotic Recombination |
| 0.0 | 0.0 | REACTOME PROLONGED ERK ACTIVATION EVENTS | Genes involved in Prolonged ERK activation events |
| 0.0 | 0.5 | REACTOME PASSIVE TRANSPORT BY AQUAPORINS | Genes involved in Passive Transport by Aquaporins |
| 0.0 | 1.2 | REACTOME SPHINGOLIPID DE NOVO BIOSYNTHESIS | Genes involved in Sphingolipid de novo biosynthesis |
| 0.0 | 0.3 | REACTOME P38MAPK EVENTS | Genes involved in p38MAPK events |
| 0.0 | 0.4 | REACTOME FORMATION OF TUBULIN FOLDING INTERMEDIATES BY CCT TRIC | Genes involved in Formation of tubulin folding intermediates by CCT/TriC |
| 0.0 | 0.6 | REACTOME PRE NOTCH PROCESSING IN GOLGI | Genes involved in Pre-NOTCH Processing in Golgi |
| 0.0 | 0.5 | REACTOME REGULATION OF PYRUVATE DEHYDROGENASE PDH COMPLEX | Genes involved in Regulation of pyruvate dehydrogenase (PDH) complex |
| 0.0 | 0.7 | REACTOME SYNTHESIS OF PC | Genes involved in Synthesis of PC |
| 0.0 | 3.4 | REACTOME FACTORS INVOLVED IN MEGAKARYOCYTE DEVELOPMENT AND PLATELET PRODUCTION | Genes involved in Factors involved in megakaryocyte development and platelet production |
| 0.0 | 0.0 | REACTOME CDK MEDIATED PHOSPHORYLATION AND REMOVAL OF CDC6 | Genes involved in CDK-mediated phosphorylation and removal of Cdc6 |
| 0.0 | 0.1 | REACTOME ADP SIGNALLING THROUGH P2RY1 | Genes involved in ADP signalling through P2Y purinoceptor 1 |
| 0.0 | 0.3 | REACTOME ENOS ACTIVATION AND REGULATION | Genes involved in eNOS activation and regulation |
| 0.0 | 1.6 | REACTOME O LINKED GLYCOSYLATION OF MUCINS | Genes involved in O-linked glycosylation of mucins |
| 0.0 | 0.2 | REACTOME HORMONE SENSITIVE LIPASE HSL MEDIATED TRIACYLGLYCEROL HYDROLYSIS | Genes involved in Hormone-sensitive lipase (HSL)-mediated triacylglycerol hydrolysis |
| 0.0 | 0.1 | REACTOME SIGNALING BY THE B CELL RECEPTOR BCR | Genes involved in Signaling by the B Cell Receptor (BCR) |
| 0.0 | 0.2 | REACTOME DESTABILIZATION OF MRNA BY TRISTETRAPROLIN TTP | Genes involved in Destabilization of mRNA by Tristetraprolin (TTP) |
| 0.0 | 0.6 | REACTOME MRNA SPLICING MINOR PATHWAY | Genes involved in mRNA Splicing - Minor Pathway |
| 0.0 | 0.8 | REACTOME DEADENYLATION OF MRNA | Genes involved in Deadenylation of mRNA |
| 0.0 | 2.4 | REACTOME TRANSCRIPTIONAL REGULATION OF WHITE ADIPOCYTE DIFFERENTIATION | Genes involved in Transcriptional Regulation of White Adipocyte Differentiation |
| 0.0 | 0.5 | REACTOME HS GAG DEGRADATION | Genes involved in HS-GAG degradation |
| 0.0 | 0.4 | REACTOME METABOLISM OF NON CODING RNA | Genes involved in Metabolism of non-coding RNA |
| 0.0 | 0.8 | REACTOME GLOBAL GENOMIC NER GG NER | Genes involved in Global Genomic NER (GG-NER) |
| 0.0 | 0.7 | REACTOME METABOLISM OF PORPHYRINS | Genes involved in Metabolism of porphyrins |
| 0.0 | 1.8 | REACTOME LOSS OF NLP FROM MITOTIC CENTROSOMES | Genes involved in Loss of Nlp from mitotic centrosomes |
| 0.0 | 0.6 | REACTOME EFFECTS OF PIP2 HYDROLYSIS | Genes involved in Effects of PIP2 hydrolysis |
| 0.0 | 0.5 | REACTOME COMPLEMENT CASCADE | Genes involved in Complement cascade |
| 0.0 | 0.3 | REACTOME CALNEXIN CALRETICULIN CYCLE | Genes involved in Calnexin/calreticulin cycle |
| 0.0 | 0.1 | REACTOME GAP JUNCTION DEGRADATION | Genes involved in Gap junction degradation |
| 0.0 | 0.1 | REACTOME REGULATION OF GLUCOKINASE BY GLUCOKINASE REGULATORY PROTEIN | Genes involved in Regulation of Glucokinase by Glucokinase Regulatory Protein |
| 0.0 | 1.1 | REACTOME GLYCOSPHINGOLIPID METABOLISM | Genes involved in Glycosphingolipid metabolism |
| 0.0 | 0.3 | REACTOME IONOTROPIC ACTIVITY OF KAINATE RECEPTORS | Genes involved in Ionotropic activity of Kainate Receptors |
| 0.0 | 0.2 | REACTOME ADENYLATE CYCLASE INHIBITORY PATHWAY | Genes involved in Adenylate cyclase inhibitory pathway |
| 0.0 | 0.2 | REACTOME MEMBRANE BINDING AND TARGETTING OF GAG PROTEINS | Genes involved in Membrane binding and targetting of GAG proteins |
| 0.0 | 1.0 | REACTOME MEIOTIC SYNAPSIS | Genes involved in Meiotic Synapsis |
| 0.0 | 0.2 | REACTOME DCC MEDIATED ATTRACTIVE SIGNALING | Genes involved in DCC mediated attractive signaling |
| 0.0 | 0.8 | REACTOME GLYCOLYSIS | Genes involved in Glycolysis |
| 0.0 | 1.8 | REACTOME MRNA SPLICING | Genes involved in mRNA Splicing |
| 0.0 | 0.2 | REACTOME ACTIVATION OF CHAPERONES BY ATF6 ALPHA | Genes involved in Activation of Chaperones by ATF6-alpha |
| 0.0 | 0.2 | REACTOME SIGNAL TRANSDUCTION BY L1 | Genes involved in Signal transduction by L1 |
| 0.0 | 1.1 | REACTOME ACTIVATION OF THE MRNA UPON BINDING OF THE CAP BINDING COMPLEX AND EIFS AND SUBSEQUENT BINDING TO 43S | Genes involved in Activation of the mRNA upon binding of the cap-binding complex and eIFs, and subsequent binding to 43S |
| 0.0 | 0.6 | REACTOME SYNTHESIS SECRETION AND INACTIVATION OF GLP1 | Genes involved in Synthesis, Secretion, and Inactivation of Glucagon-like Peptide-1 (GLP-1) |
| 0.0 | 0.3 | REACTOME TRANSPORT TO THE GOLGI AND SUBSEQUENT MODIFICATION | Genes involved in Transport to the Golgi and subsequent modification |
| 0.0 | 0.1 | REACTOME DIABETES PATHWAYS | Genes involved in Diabetes pathways |
| 0.0 | 0.2 | REACTOME REVERSIBLE HYDRATION OF CARBON DIOXIDE | Genes involved in Reversible Hydration of Carbon Dioxide |
| 0.0 | 0.2 | REACTOME TANDEM PORE DOMAIN POTASSIUM CHANNELS | Genes involved in Tandem pore domain potassium channels |
| 0.0 | 0.2 | REACTOME VITAMIN B5 PANTOTHENATE METABOLISM | Genes involved in Vitamin B5 (pantothenate) metabolism |
| 0.0 | 1.2 | REACTOME 3 UTR MEDIATED TRANSLATIONAL REGULATION | Genes involved in 3' -UTR-mediated translational regulation |
| 0.0 | 0.2 | REACTOME HORMONE LIGAND BINDING RECEPTORS | Genes involved in Hormone ligand-binding receptors |
| 0.0 | 0.1 | REACTOME RECYCLING OF BILE ACIDS AND SALTS | Genes involved in Recycling of bile acids and salts |
| 0.0 | 0.0 | REACTOME NOREPINEPHRINE NEUROTRANSMITTER RELEASE CYCLE | Genes involved in Norepinephrine Neurotransmitter Release Cycle |
| 0.0 | 0.2 | REACTOME PRESYNAPTIC NICOTINIC ACETYLCHOLINE RECEPTORS | Genes involved in Presynaptic nicotinic acetylcholine receptors |