Project
Illumina Body Map 2 (GSE30611)
Navigation
Downloads
Results for AACAGUC
Z-value: 0.53
Motif logo

miRNA associated with seed AACAGUC
| Name | miRBASE accession |
|---|---|
|
hsa-miR-132-3p
|
MIMAT0000426 |
|
hsa-miR-212-3p
|
MIMAT0000269 |
Activity profile of AACAGUC motif
Sorted Z-values of AACAGUC motif
Network of associatons between targets according to the STRING database.

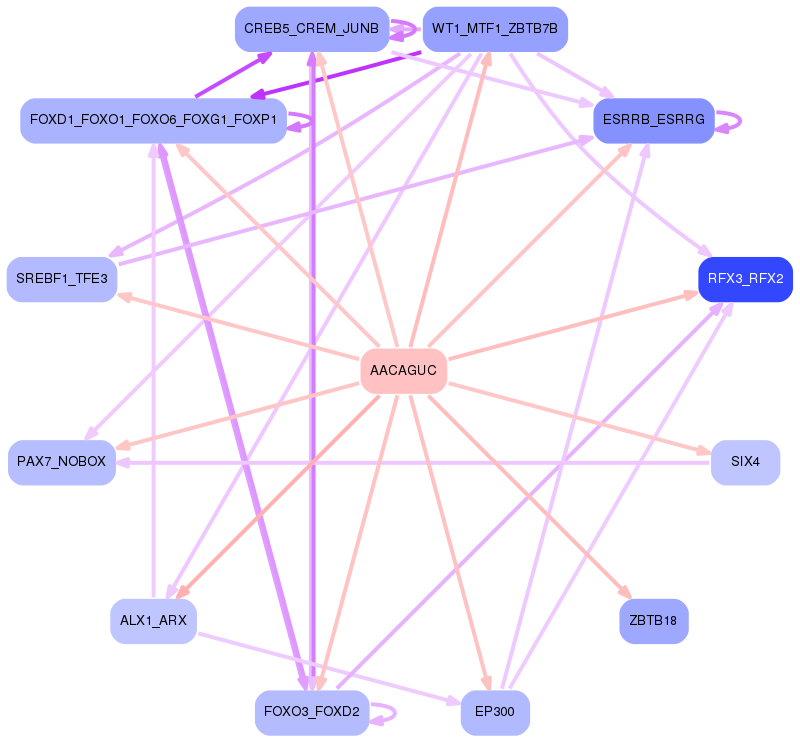
First level regulatory network of AACAGUC
Gene Ontology Analysis
Gene overrepresentation in biological process category:
| Log-likelihood per target | Total log-likelihood | Term | Description |
|---|---|---|---|
| 0.4 | 1.1 | GO:0051939 | gamma-aminobutyric acid import(GO:0051939) |
| 0.2 | 0.7 | GO:0019858 | cytosine metabolic process(GO:0019858) |
| 0.1 | 0.6 | GO:0072299 | negative regulation of metanephric glomerulus development(GO:0072299) negative regulation of metanephric glomerular mesangial cell proliferation(GO:0072302) |
| 0.1 | 0.8 | GO:0006127 | glycerophosphate shuttle(GO:0006127) |
| 0.1 | 0.5 | GO:0072560 | type B pancreatic cell maturation(GO:0072560) |
| 0.1 | 0.4 | GO:0001544 | initiation of primordial ovarian follicle growth(GO:0001544) |
| 0.1 | 0.1 | GO:0035802 | adrenal cortex development(GO:0035801) adrenal cortex formation(GO:0035802) |
| 0.1 | 1.1 | GO:0021831 | globus pallidus development(GO:0021759) embryonic olfactory bulb interneuron precursor migration(GO:0021831) |
| 0.1 | 0.3 | GO:1902630 | regulation of membrane hyperpolarization(GO:1902630) |
| 0.1 | 0.8 | GO:1902231 | positive regulation of intrinsic apoptotic signaling pathway in response to DNA damage(GO:1902231) |
| 0.1 | 0.3 | GO:0099526 | presynaptic signal transduction(GO:0098928) presynapse to nucleus signaling pathway(GO:0099526) |
| 0.1 | 0.3 | GO:0014813 | skeletal muscle satellite cell commitment(GO:0014813) |
| 0.1 | 0.5 | GO:0090258 | negative regulation of mitochondrial fission(GO:0090258) |
| 0.1 | 0.4 | GO:1903566 | positive regulation of protein localization to cilium(GO:1903566) |
| 0.1 | 0.7 | GO:0051534 | negative regulation of NFAT protein import into nucleus(GO:0051534) |
| 0.1 | 0.2 | GO:0033563 | spinal cord ventral commissure morphogenesis(GO:0021965) dorsal/ventral axon guidance(GO:0033563) |
| 0.1 | 0.5 | GO:0099590 | neurotransmitter receptor internalization(GO:0099590) |
| 0.1 | 0.2 | GO:2000639 | regulation of SREBP signaling pathway(GO:2000638) negative regulation of SREBP signaling pathway(GO:2000639) |
| 0.1 | 0.6 | GO:0021940 | positive regulation of cerebellar granule cell precursor proliferation(GO:0021940) |
| 0.1 | 0.2 | GO:0061055 | myotome development(GO:0061055) |
| 0.1 | 0.2 | GO:0051228 | mitotic spindle disassembly(GO:0051228) spindle disassembly(GO:0051230) |
| 0.1 | 0.2 | GO:0072720 | response to dithiothreitol(GO:0072720) |
| 0.0 | 0.3 | GO:0031064 | negative regulation of histone deacetylation(GO:0031064) |
| 0.0 | 0.4 | GO:0006990 | positive regulation of transcription from RNA polymerase II promoter involved in unfolded protein response(GO:0006990) |
| 0.0 | 0.7 | GO:0032927 | positive regulation of activin receptor signaling pathway(GO:0032927) |
| 0.0 | 0.1 | GO:0060957 | endocardial cell fate commitment(GO:0060957) endocardial cushion cell fate commitment(GO:0061445) |
| 0.0 | 0.1 | GO:0072361 | regulation of glycolytic process by regulation of transcription from RNA polymerase II promoter(GO:0072361) |
| 0.0 | 0.2 | GO:0042539 | hypotonic salinity response(GO:0042539) cellular hypotonic salinity response(GO:0071477) |
| 0.0 | 0.0 | GO:0003032 | detection of oxygen(GO:0003032) |
| 0.0 | 0.2 | GO:0010587 | miRNA catabolic process(GO:0010587) |
| 0.0 | 0.1 | GO:0071930 | negative regulation of transcription involved in G1/S transition of mitotic cell cycle(GO:0071930) |
| 0.0 | 0.1 | GO:0070904 | L-ascorbic acid transport(GO:0015882) molecular hydrogen transport(GO:0015993) transepithelial L-ascorbic acid transport(GO:0070904) |
| 0.0 | 0.3 | GO:0006398 | mRNA 3'-end processing by stem-loop binding and cleavage(GO:0006398) |
| 0.0 | 0.2 | GO:0090116 | C-5 methylation of cytosine(GO:0090116) |
| 0.0 | 0.1 | GO:0035574 | histone H4-K20 demethylation(GO:0035574) |
| 0.0 | 0.3 | GO:1902748 | positive regulation of lens fiber cell differentiation(GO:1902748) |
| 0.0 | 0.2 | GO:0090625 | mRNA cleavage involved in gene silencing by siRNA(GO:0090625) |
| 0.0 | 0.2 | GO:1902613 | regulation of anti-Mullerian hormone signaling pathway(GO:1902612) negative regulation of anti-Mullerian hormone signaling pathway(GO:1902613) anti-Mullerian hormone signaling pathway(GO:1990262) |
| 0.0 | 0.1 | GO:0061034 | olfactory bulb mitral cell layer development(GO:0061034) |
| 0.0 | 0.3 | GO:0098735 | positive regulation of the force of heart contraction(GO:0098735) |
| 0.0 | 0.4 | GO:0035404 | histone-serine phosphorylation(GO:0035404) |
| 0.0 | 0.2 | GO:1902617 | response to fluoride(GO:1902617) |
| 0.0 | 0.4 | GO:1902004 | positive regulation of beta-amyloid formation(GO:1902004) |
| 0.0 | 0.1 | GO:0035616 | histone H2B conserved C-terminal lysine deubiquitination(GO:0035616) |
| 0.0 | 0.1 | GO:0009441 | glycolate metabolic process(GO:0009441) |
| 0.0 | 0.3 | GO:0030043 | actin filament fragmentation(GO:0030043) |
| 0.0 | 0.2 | GO:0007185 | transmembrane receptor protein tyrosine phosphatase signaling pathway(GO:0007185) |
| 0.0 | 0.2 | GO:0045542 | positive regulation of cholesterol biosynthetic process(GO:0045542) |
| 0.0 | 0.4 | GO:0048739 | cardiac muscle fiber development(GO:0048739) |
| 0.0 | 0.6 | GO:0043101 | purine-containing compound salvage(GO:0043101) |
| 0.0 | 0.1 | GO:0006344 | maintenance of chromatin silencing(GO:0006344) |
| 0.0 | 0.2 | GO:2000582 | regulation of ATP-dependent microtubule motor activity, plus-end-directed(GO:2000580) positive regulation of ATP-dependent microtubule motor activity, plus-end-directed(GO:2000582) |
| 0.0 | 0.1 | GO:0002357 | defense response to tumor cell(GO:0002357) |
| 0.0 | 0.3 | GO:0097094 | craniofacial suture morphogenesis(GO:0097094) |
| 0.0 | 0.2 | GO:0090110 | cargo loading into COPII-coated vesicle(GO:0090110) |
| 0.0 | 0.1 | GO:0051835 | positive regulation of synapse structural plasticity(GO:0051835) |
| 0.0 | 0.0 | GO:0044313 | protein K6-linked deubiquitination(GO:0044313) protein K27-linked deubiquitination(GO:1990167) |
| 0.0 | 0.1 | GO:1905205 | positive regulation of connective tissue replacement(GO:1905205) |
| 0.0 | 0.1 | GO:0035881 | amacrine cell differentiation(GO:0035881) |
Gene overrepresentation in cellular component category:
| Log-likelihood per target | Total log-likelihood | Term | Description |
|---|---|---|---|
| 0.1 | 0.8 | GO:0009331 | glycerol-3-phosphate dehydrogenase complex(GO:0009331) |
| 0.1 | 0.3 | GO:0099569 | cytoskeleton of presynaptic active zone(GO:0048788) presynaptic active zone cytoplasmic component(GO:0098831) presynaptic cytoskeleton(GO:0099569) |
| 0.1 | 0.6 | GO:1902560 | GMP reductase complex(GO:1902560) |
| 0.1 | 0.5 | GO:0045298 | tubulin complex(GO:0045298) |
| 0.1 | 0.4 | GO:0042272 | nuclear RNA export factor complex(GO:0042272) |
| 0.0 | 0.1 | GO:0035189 | Rb-E2F complex(GO:0035189) |
| 0.0 | 0.3 | GO:0019907 | cyclin-dependent protein kinase activating kinase holoenzyme complex(GO:0019907) |
| 0.0 | 0.2 | GO:0005683 | U7 snRNP(GO:0005683) |
| 0.0 | 0.2 | GO:1990452 | Parkin-FBXW7-Cul1 ubiquitin ligase complex(GO:1990452) |
| 0.0 | 0.5 | GO:0098839 | postsynaptic density membrane(GO:0098839) |
| 0.0 | 1.0 | GO:0090545 | NuRD complex(GO:0016581) CHD-type complex(GO:0090545) |
| 0.0 | 0.1 | GO:0048179 | activin receptor complex(GO:0048179) |
| 0.0 | 0.7 | GO:0031143 | pseudopodium(GO:0031143) |
| 0.0 | 0.2 | GO:0016589 | NURF complex(GO:0016589) |
| 0.0 | 0.2 | GO:0097413 | Cul4A-RING E3 ubiquitin ligase complex(GO:0031464) Lewy body(GO:0097413) |
| 0.0 | 0.5 | GO:0070971 | endoplasmic reticulum exit site(GO:0070971) |
| 0.0 | 0.2 | GO:0035068 | micro-ribonucleoprotein complex(GO:0035068) |
| 0.0 | 0.3 | GO:0031588 | nucleotide-activated protein kinase complex(GO:0031588) |
| 0.0 | 0.1 | GO:0032777 | Piccolo NuA4 histone acetyltransferase complex(GO:0032777) |
| 0.0 | 0.2 | GO:0000815 | ESCRT III complex(GO:0000815) |
Gene overrepresentation in molecular function category:
| Log-likelihood per target | Total log-likelihood | Term | Description |
|---|---|---|---|
| 0.2 | 0.8 | GO:0052590 | sn-glycerol-3-phosphate:ubiquinone oxidoreductase activity(GO:0052590) sn-glycerol-3-phosphate:ubiquinone-8 oxidoreductase activity(GO:0052591) |
| 0.1 | 0.4 | GO:0036505 | prosaposin receptor activity(GO:0036505) |
| 0.1 | 0.5 | GO:0099609 | microtubule lateral binding(GO:0099609) |
| 0.1 | 0.3 | GO:0047322 | [hydroxymethylglutaryl-CoA reductase (NADPH)] kinase activity(GO:0047322) [acetyl-CoA carboxylase] kinase activity(GO:0050405) |
| 0.1 | 1.1 | GO:0005332 | gamma-aminobutyric acid:sodium symporter activity(GO:0005332) |
| 0.1 | 0.4 | GO:0044378 | non-sequence-specific DNA binding, bending(GO:0044378) |
| 0.1 | 0.6 | GO:0016657 | GMP reductase activity(GO:0003920) oxidoreductase activity, acting on NAD(P)H, nitrogenous group as acceptor(GO:0016657) |
| 0.1 | 0.2 | GO:0071209 | U7 snRNA binding(GO:0071209) |
| 0.1 | 0.4 | GO:0042954 | lipoprotein transporter activity(GO:0042954) |
| 0.1 | 0.2 | GO:0005042 | netrin receptor activity(GO:0005042) |
| 0.1 | 0.8 | GO:0017002 | activin-activated receptor activity(GO:0017002) |
| 0.1 | 0.2 | GO:0008426 | protein kinase C inhibitor activity(GO:0008426) |
| 0.1 | 1.1 | GO:0001206 | transcriptional repressor activity, RNA polymerase II distal enhancer sequence-specific binding(GO:0001206) |
| 0.0 | 0.1 | GO:0052852 | (S)-2-hydroxy-acid oxidase activity(GO:0003973) very-long-chain-(S)-2-hydroxy-acid oxidase activity(GO:0052852) long-chain-(S)-2-hydroxy-long-chain-acid oxidase activity(GO:0052853) medium-chain-(S)-2-hydroxy-acid oxidase activity(GO:0052854) |
| 0.0 | 0.4 | GO:0004468 | lysine N-acetyltransferase activity, acting on acetyl phosphate as donor(GO:0004468) |
| 0.0 | 0.4 | GO:0034046 | poly(G) binding(GO:0034046) |
| 0.0 | 0.3 | GO:0099580 | ion antiporter activity involved in regulation of postsynaptic membrane potential(GO:0099580) |
| 0.0 | 0.1 | GO:0008520 | L-ascorbate:sodium symporter activity(GO:0008520) L-ascorbic acid transporter activity(GO:0015229) sodium-dependent L-ascorbate transmembrane transporter activity(GO:0070890) |
| 0.0 | 0.3 | GO:0050682 | AF-2 domain binding(GO:0050682) |
| 0.0 | 0.3 | GO:0016286 | small conductance calcium-activated potassium channel activity(GO:0016286) |
| 0.0 | 0.7 | GO:0008353 | RNA polymerase II carboxy-terminal domain kinase activity(GO:0008353) |
| 0.0 | 0.2 | GO:0050816 | phosphothreonine binding(GO:0050816) |
| 0.0 | 0.2 | GO:0032810 | sterol response element binding(GO:0032810) |
| 0.0 | 0.2 | GO:0003886 | DNA (cytosine-5-)-methyltransferase activity(GO:0003886) |
| 0.0 | 0.1 | GO:0035575 | histone demethylase activity (H4-K20 specific)(GO:0035575) |
| 0.0 | 0.6 | GO:0015467 | G-protein activated inward rectifier potassium channel activity(GO:0015467) |
| 0.0 | 0.1 | GO:0034647 | histone demethylase activity (H3-trimethyl-K4 specific)(GO:0034647) |
| 0.0 | 0.1 | GO:0061649 | ubiquitinated histone binding(GO:0061649) |
| 0.0 | 0.4 | GO:0017017 | MAP kinase tyrosine/serine/threonine phosphatase activity(GO:0017017) |
| 0.0 | 0.1 | GO:0035501 | MH1 domain binding(GO:0035501) |
| 0.0 | 0.1 | GO:0061676 | importin-alpha family protein binding(GO:0061676) |
| 0.0 | 0.1 | GO:0098808 | mRNA cap binding(GO:0098808) |
| 0.0 | 0.2 | GO:0043237 | laminin-1 binding(GO:0043237) |
| 0.0 | 0.2 | GO:0033592 | RNA strand annealing activity(GO:0033592) |
| 0.0 | 0.6 | GO:0070742 | C2H2 zinc finger domain binding(GO:0070742) |
| 0.0 | 0.1 | GO:0004706 | JUN kinase kinase kinase activity(GO:0004706) |
| 0.0 | 0.2 | GO:0008568 | microtubule-severing ATPase activity(GO:0008568) |
| 0.0 | 0.2 | GO:0015379 | potassium:chloride symporter activity(GO:0015379) potassium ion symporter activity(GO:0022820) |
| 0.0 | 0.3 | GO:0008140 | cAMP response element binding protein binding(GO:0008140) |
| 0.0 | 0.1 | GO:0046912 | transferase activity, transferring acyl groups, acyl groups converted into alkyl on transfer(GO:0046912) |
| 0.0 | 0.4 | GO:0043422 | protein kinase B binding(GO:0043422) |
| 0.0 | 0.0 | GO:0071208 | histone pre-mRNA stem-loop binding(GO:0071207) histone pre-mRNA DCP binding(GO:0071208) |
| 0.0 | 0.4 | GO:0051371 | muscle alpha-actinin binding(GO:0051371) |
Gene overrepresentation in curated gene sets: canonical pathways category:
| Log-likelihood per target | Total log-likelihood | Term | Description |
|---|---|---|---|
| 0.0 | 1.5 | PID ALK1 PATHWAY | ALK1 signaling events |
| 0.0 | 0.5 | PID P38 GAMMA DELTA PATHWAY | Signaling mediated by p38-gamma and p38-delta |
| 0.0 | 0.9 | PID HDAC CLASSIII PATHWAY | Signaling events mediated by HDAC Class III |
| 0.0 | 0.1 | PID PI3KCI AKT PATHWAY | Class I PI3K signaling events mediated by Akt |
Gene overrepresentation in curated gene sets: REACTOME pathways category:
| Log-likelihood per target | Total log-likelihood | Term | Description |
|---|---|---|---|
| 0.0 | 0.7 | REACTOME RAF MAP KINASE CASCADE | Genes involved in RAF/MAP kinase cascade |
| 0.0 | 1.1 | REACTOME NA CL DEPENDENT NEUROTRANSMITTER TRANSPORTERS | Genes involved in Na+/Cl- dependent neurotransmitter transporters |
| 0.0 | 1.0 | REACTOME SIGNALING BY NODAL | Genes involved in Signaling by NODAL |
| 0.0 | 0.6 | REACTOME PURINE SALVAGE | Genes involved in Purine salvage |
| 0.0 | 0.2 | REACTOME ROLE OF SECOND MESSENGERS IN NETRIN1 SIGNALING | Genes involved in Role of second messengers in netrin-1 signaling |
| 0.0 | 0.4 | REACTOME TRAF3 DEPENDENT IRF ACTIVATION PATHWAY | Genes involved in TRAF3-dependent IRF activation pathway |
| 0.0 | 0.3 | REACTOME REGULATION OF RHEB GTPASE ACTIVITY BY AMPK | Genes involved in Regulation of Rheb GTPase activity by AMPK |
| 0.0 | 0.3 | REACTOME SLBP DEPENDENT PROCESSING OF REPLICATION DEPENDENT HISTONE PRE MRNAS | Genes involved in SLBP Dependent Processing of Replication-Dependent Histone Pre-mRNAs |
| 0.0 | 0.5 | REACTOME CASPASE MEDIATED CLEAVAGE OF CYTOSKELETAL PROTEINS | Genes involved in Caspase-mediated cleavage of cytoskeletal proteins |
| 0.0 | 0.6 | REACTOME INHIBITION OF VOLTAGE GATED CA2 CHANNELS VIA GBETA GAMMA SUBUNITS | Genes involved in Inhibition of voltage gated Ca2+ channels via Gbeta/gamma subunits |