Project
Illumina Body Map 2 (GSE30611)
Navigation
Downloads
Results for AACCUGG
Z-value: 0.15
Motif logo

miRNA associated with seed AACCUGG
| Name | miRBASE accession |
|---|---|
|
hsa-miR-490-3p
|
MIMAT0002806 |
Activity profile of AACCUGG motif
Sorted Z-values of AACCUGG motif
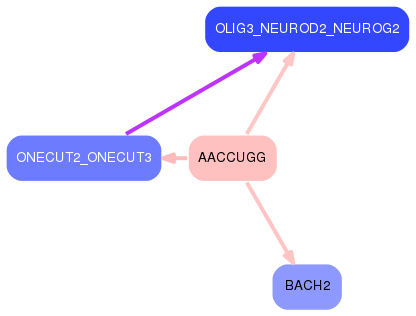
Network of associatons between targets according to the STRING database.

First level regulatory network of AACCUGG
Gene Ontology Analysis
Gene overrepresentation in biological process category:
| Log-likelihood per target | Total log-likelihood | Term | Description |
|---|---|---|---|
| 0.0 | 0.1 | GO:0035574 | histone H4-K20 demethylation(GO:0035574) |
| 0.0 | 0.1 | GO:0043686 | co-translational protein modification(GO:0043686) |
| 0.0 | 0.1 | GO:0006013 | mannose metabolic process(GO:0006013) |
| 0.0 | 0.0 | GO:1902269 | positive regulation of polyamine transmembrane transport(GO:1902269) |
| 0.0 | 0.1 | GO:0042271 | susceptibility to natural killer cell mediated cytotoxicity(GO:0042271) |
Gene overrepresentation in cellular component category:
| Log-likelihood per target | Total log-likelihood | Term | Description |
|---|---|---|---|
| 0.0 | 0.1 | GO:0005797 | Golgi medial cisterna(GO:0005797) |
Gene overrepresentation in molecular function category:
| Log-likelihood per target | Total log-likelihood | Term | Description |
|---|---|---|---|
| 0.0 | 0.1 | GO:0004572 | mannosyl-oligosaccharide 1,3-1,6-alpha-mannosidase activity(GO:0004572) |
| 0.0 | 0.1 | GO:0035575 | histone demethylase activity (H4-K20 specific)(GO:0035575) |
| 0.0 | 0.1 | GO:0019797 | procollagen-proline 3-dioxygenase activity(GO:0019797) |
| 0.0 | 0.1 | GO:0008332 | low voltage-gated calcium channel activity(GO:0008332) |