Project
Illumina Body Map 2 (GSE30611)
Navigation
Downloads
Results for AACGGAA
Z-value: 0.20
Motif logo

miRNA associated with seed AACGGAA
| Name | miRBASE accession |
|---|---|
|
hsa-miR-191-5p
|
MIMAT0000440 |
Activity profile of AACGGAA motif
Sorted Z-values of AACGGAA motif
Network of associatons between targets according to the STRING database.

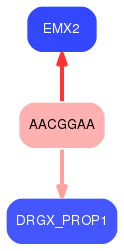
First level regulatory network of AACGGAA
Gene Ontology Analysis
Gene overrepresentation in biological process category:
| Log-likelihood per target | Total log-likelihood | Term | Description |
|---|---|---|---|
| 0.0 | 0.1 | GO:0043321 | regulation of natural killer cell degranulation(GO:0043321) positive regulation of natural killer cell degranulation(GO:0043323) |
| 0.0 | 0.1 | GO:0060061 | Spemann organizer formation(GO:0060061) |
| 0.0 | 0.1 | GO:0030860 | regulation of polarized epithelial cell differentiation(GO:0030860) |
| 0.0 | 0.1 | GO:0051987 | positive regulation of attachment of spindle microtubules to kinetochore(GO:0051987) |
| 0.0 | 0.2 | GO:0016198 | axon choice point recognition(GO:0016198) |
| 0.0 | 0.2 | GO:0006477 | protein sulfation(GO:0006477) heparan sulfate proteoglycan biosynthetic process, polysaccharide chain biosynthetic process(GO:0015014) |
Gene overrepresentation in cellular component category:
| Log-likelihood per target | Total log-likelihood | Term | Description |
|---|---|---|---|
| 0.0 | 0.1 | GO:0044214 | spanning component of plasma membrane(GO:0044214) spanning component of membrane(GO:0089717) |
| 0.0 | 0.2 | GO:0032584 | growth cone membrane(GO:0032584) |
Gene overrepresentation in molecular function category:
| Log-likelihood per target | Total log-likelihood | Term | Description |
|---|---|---|---|
| 0.0 | 0.2 | GO:0050119 | N-acetylglucosamine deacetylase activity(GO:0050119) |
| 0.0 | 0.2 | GO:0035727 | lysophosphatidic acid binding(GO:0035727) |
| 0.0 | 0.1 | GO:0098770 | FBXO family protein binding(GO:0098770) |
| 0.0 | 0.1 | GO:0047757 | chondroitin-glucuronate 5-epimerase activity(GO:0047757) |