Project
Illumina Body Map 2 (GSE30611)
Navigation
Downloads
Results for AAGUGCU
Z-value: 0.82
Motif logo

miRNA associated with seed AAGUGCU
| Name | miRBASE accession |
|---|---|
|
hsa-miR-302a-3p
|
MIMAT0000684 |
|
hsa-miR-302b-3p
|
MIMAT0000715 |
|
hsa-miR-302c-3p.1
|
MIMAT0000717 |
|
hsa-miR-302d-3p
|
MIMAT0000718 |
|
hsa-miR-302e
|
MIMAT0005931 |
|
hsa-miR-372-3p
|
MIMAT0000724 |
|
hsa-miR-373-3p
|
MIMAT0000726 |
|
hsa-miR-520a-3p
|
MIMAT0002834 |
|
hsa-miR-520b
|
MIMAT0002843 |
|
hsa-miR-520c-3p
|
MIMAT0002846 |
|
hsa-miR-520d-3p
|
MIMAT0002856 |
|
hsa-miR-520e
|
MIMAT0002825 |
Activity profile of AAGUGCU motif
Sorted Z-values of AAGUGCU motif
| Promoter | Log-likelihood | Transcript | Gene | Gene Info |
|---|---|---|---|---|
| chr4_-_108168919 | 2.53 |
ENST00000265165.6
|
LEF1
|
lymphoid enhancer binding factor 1 |
| chr20_-_4823597 | 2.16 |
ENST00000379400.8
|
RASSF2
|
Ras association domain family member 2 |
| chr8_-_66613208 | 1.92 |
ENST00000522677.8
|
MYBL1
|
MYB proto-oncogene like 1 |
| chr1_-_24964984 | 1.88 |
ENST00000338888.3
ENST00000399916.5 |
RUNX3
|
RUNX family transcription factor 3 |
| chr6_-_159044980 | 1.82 |
ENST00000367066.8
|
TAGAP
|
T cell activation RhoGTPase activating protein |
| chr14_-_99272184 | 1.80 |
ENST00000357195.8
|
BCL11B
|
BAF chromatin remodeling complex subunit BCL11B |
| chr20_-_32207708 | 1.65 |
ENST00000246229.5
|
PLAGL2
|
PLAG1 like zinc finger 2 |
| chr5_-_115180037 | 1.63 |
ENST00000514154.1
ENST00000282369.7 |
TRIM36
|
tripartite motif containing 36 |
| chr12_-_44875647 | 1.46 |
ENST00000395487.6
|
NELL2
|
neural EGFL like 2 |
| chrX_-_25015924 | 1.42 |
ENST00000379044.5
|
ARX
|
aristaless related homeobox |
| chr2_-_181680490 | 1.36 |
ENST00000684145.1
ENST00000295108.4 ENST00000684079.1 ENST00000683430.1 |
CERKL
NEUROD1
|
ceramide kinase like neuronal differentiation 1 |
| chr9_-_131270493 | 1.35 |
ENST00000372269.7
ENST00000464831.1 |
FAM78A
|
family with sequence similarity 78 member A |
| chr5_+_56815534 | 1.32 |
ENST00000399503.4
|
MAP3K1
|
mitogen-activated protein kinase kinase kinase 1 |
| chr9_+_79571767 | 1.30 |
ENST00000376544.7
|
TLE4
|
TLE family member 4, transcriptional corepressor |
| chr12_+_94148553 | 1.26 |
ENST00000258526.9
|
PLXNC1
|
plexin C1 |
| chr9_-_127980976 | 1.24 |
ENST00000373095.6
|
FAM102A
|
family with sequence similarity 102 member A |
| chr14_+_70641896 | 1.21 |
ENST00000256367.3
|
TTC9
|
tetratricopeptide repeat domain 9 |
| chr2_-_96145431 | 1.17 |
ENST00000288943.5
|
DUSP2
|
dual specificity phosphatase 2 |
| chr21_-_31558977 | 1.15 |
ENST00000286827.7
ENST00000541036.5 |
TIAM1
|
TIAM Rac1 associated GEF 1 |
| chr17_-_68291116 | 1.13 |
ENST00000327268.8
ENST00000580666.6 |
SLC16A6
|
solute carrier family 16 member 6 |
| chr8_-_59119121 | 1.09 |
ENST00000361421.2
|
TOX
|
thymocyte selection associated high mobility group box |
| chr10_-_22714531 | 1.03 |
ENST00000376573.9
|
PIP4K2A
|
phosphatidylinositol-5-phosphate 4-kinase type 2 alpha |
| chr13_+_77697679 | 1.02 |
ENST00000418532.6
|
SLAIN1
|
SLAIN motif family member 1 |
| chr1_+_226223618 | 1.01 |
ENST00000542034.5
ENST00000366810.6 |
MIXL1
|
Mix paired-like homeobox |
| chr12_+_4273751 | 1.01 |
ENST00000675880.1
ENST00000261254.8 |
CCND2
|
cyclin D2 |
| chr12_+_67648737 | 0.97 |
ENST00000344096.4
ENST00000393555.3 |
DYRK2
|
dual specificity tyrosine phosphorylation regulated kinase 2 |
| chr20_+_9514562 | 0.94 |
ENST00000246070.3
|
LAMP5
|
lysosomal associated membrane protein family member 5 |
| chr1_-_225941383 | 0.94 |
ENST00000420304.6
|
LEFTY2
|
left-right determination factor 2 |
| chr18_-_69956924 | 0.92 |
ENST00000581982.5
ENST00000280200.8 |
CD226
|
CD226 molecule |
| chr6_-_89352706 | 0.92 |
ENST00000435041.3
|
UBE2J1
|
ubiquitin conjugating enzyme E2 J1 |
| chr8_-_81112055 | 0.92 |
ENST00000220597.4
|
PAG1
|
phosphoprotein membrane anchor with glycosphingolipid microdomains 1 |
| chr10_+_96043394 | 0.91 |
ENST00000403870.7
ENST00000265992.9 ENST00000465148.3 |
CCNJ
|
cyclin J |
| chr14_-_53152371 | 0.88 |
ENST00000323669.10
|
DDHD1
|
DDHD domain containing 1 |
| chr15_-_83284645 | 0.86 |
ENST00000345382.7
|
BNC1
|
basonuclin 1 |
| chr2_-_73269483 | 0.86 |
ENST00000295133.9
|
FBXO41
|
F-box protein 41 |
| chr1_-_23531206 | 0.83 |
ENST00000361729.3
|
E2F2
|
E2F transcription factor 2 |
| chr1_+_244051275 | 0.80 |
ENST00000358704.4
|
ZBTB18
|
zinc finger and BTB domain containing 18 |
| chr19_-_4066892 | 0.79 |
ENST00000322357.9
|
ZBTB7A
|
zinc finger and BTB domain containing 7A |
| chr3_-_197749688 | 0.79 |
ENST00000273582.9
|
RUBCN
|
rubicon autophagy regulator |
| chr19_+_7395112 | 0.79 |
ENST00000319670.14
|
ARHGEF18
|
Rho/Rac guanine nucleotide exchange factor 18 |
| chr7_-_5781594 | 0.78 |
ENST00000416985.5
ENST00000389902.8 ENST00000425013.6 |
RNF216
|
ring finger protein 216 |
| chr9_-_23821275 | 0.77 |
ENST00000380110.8
|
ELAVL2
|
ELAV like RNA binding protein 2 |
| chr6_+_33454543 | 0.77 |
ENST00000621915.1
ENST00000395064.3 |
ZBTB9
|
zinc finger and BTB domain containing 9 |
| chr1_-_53328053 | 0.76 |
ENST00000371454.6
ENST00000667377.1 ENST00000306052.12 ENST00000668448.1 |
LRP8
|
LDL receptor related protein 8 |
| chr3_+_151086889 | 0.76 |
ENST00000474524.5
ENST00000273432.8 |
MED12L
|
mediator complex subunit 12L |
| chr2_-_55419565 | 0.75 |
ENST00000647341.1
ENST00000647401.1 ENST00000336838.10 ENST00000621814.4 ENST00000644033.1 ENST00000645477.1 ENST00000647517.1 |
CCDC88A
|
coiled-coil domain containing 88A |
| chr2_+_73984902 | 0.73 |
ENST00000409262.8
|
TET3
|
tet methylcytosine dioxygenase 3 |
| chr3_-_12967668 | 0.72 |
ENST00000273221.8
|
IQSEC1
|
IQ motif and Sec7 domain ArfGEF 1 |
| chr6_-_16761447 | 0.72 |
ENST00000244769.8
ENST00000436367.6 |
ATXN1
|
ataxin 1 |
| chr14_-_59630582 | 0.70 |
ENST00000395090.5
|
RTN1
|
reticulon 1 |
| chr8_-_37899454 | 0.70 |
ENST00000522727.5
ENST00000287263.8 ENST00000330843.9 |
RAB11FIP1
|
RAB11 family interacting protein 1 |
| chr10_+_3067496 | 0.70 |
ENST00000381125.9
|
PFKP
|
phosphofructokinase, platelet |
| chr19_-_14136553 | 0.69 |
ENST00000592798.5
ENST00000474890.1 ENST00000263382.8 |
ASF1B
|
anti-silencing function 1B histone chaperone |
| chr9_+_126805003 | 0.68 |
ENST00000449886.5
ENST00000450858.1 ENST00000373464.5 |
ZBTB43
|
zinc finger and BTB domain containing 43 |
| chr8_-_56211257 | 0.67 |
ENST00000316981.8
ENST00000423799.6 ENST00000429357.2 |
PLAG1
|
PLAG1 zinc finger |
| chr17_-_29294141 | 0.66 |
ENST00000225388.9
|
NUFIP2
|
nuclear FMR1 interacting protein 2 |
| chr11_+_122655712 | 0.66 |
ENST00000284273.6
|
UBASH3B
|
ubiquitin associated and SH3 domain containing B |
| chr7_+_77696423 | 0.66 |
ENST00000334955.13
|
RSBN1L
|
round spermatid basic protein 1 like |
| chr1_-_161069666 | 0.65 |
ENST00000368016.7
|
ARHGAP30
|
Rho GTPase activating protein 30 |
| chr22_+_21417357 | 0.65 |
ENST00000407464.7
|
HIC2
|
HIC ZBTB transcriptional repressor 2 |
| chr8_+_85177225 | 0.64 |
ENST00000418930.6
|
E2F5
|
E2F transcription factor 5 |
| chr17_+_40121955 | 0.63 |
ENST00000398532.9
|
MSL1
|
MSL complex subunit 1 |
| chr3_-_56801939 | 0.63 |
ENST00000296315.8
ENST00000495373.5 |
ARHGEF3
|
Rho guanine nucleotide exchange factor 3 |
| chr3_+_141231770 | 0.62 |
ENST00000286353.9
ENST00000502783.5 ENST00000393010.6 ENST00000514680.5 |
PXYLP1
|
2-phosphoxylose phosphatase 1 |
| chr12_+_32502114 | 0.61 |
ENST00000682739.1
ENST00000427716.7 ENST00000583694.2 |
FGD4
|
FYVE, RhoGEF and PH domain containing 4 |
| chr22_+_29883158 | 0.61 |
ENST00000333027.7
ENST00000401950.7 ENST00000445401.5 ENST00000323630.9 ENST00000351488.7 |
MTMR3
|
myotubularin related protein 3 |
| chr16_+_88453260 | 0.60 |
ENST00000319555.8
|
ZFPM1
|
zinc finger protein, FOG family member 1 |
| chr14_+_52267683 | 0.60 |
ENST00000306051.3
ENST00000553372.1 |
PTGDR
|
prostaglandin D2 receptor |
| chr7_+_120273129 | 0.59 |
ENST00000331113.9
|
KCND2
|
potassium voltage-gated channel subfamily D member 2 |
| chr10_+_1049476 | 0.58 |
ENST00000358220.5
|
WDR37
|
WD repeat domain 37 |
| chr15_-_52191387 | 0.58 |
ENST00000261837.12
|
GNB5
|
G protein subunit beta 5 |
| chr2_-_234497035 | 0.58 |
ENST00000390645.2
ENST00000339728.6 |
ARL4C
|
ADP ribosylation factor like GTPase 4C |
| chr8_+_28494190 | 0.58 |
ENST00000537916.2
ENST00000240093.8 ENST00000523546.1 |
FZD3
|
frizzled class receptor 3 |
| chr2_+_134120169 | 0.57 |
ENST00000409645.5
|
MGAT5
|
alpha-1,6-mannosylglycoprotein 6-beta-N-acetylglucosaminyltransferase |
| chr10_+_100535927 | 0.57 |
ENST00000299163.7
|
HIF1AN
|
hypoxia inducible factor 1 subunit alpha inhibitor |
| chr3_-_101677119 | 0.57 |
ENST00000312938.5
|
ZBTB11
|
zinc finger and BTB domain containing 11 |
| chr11_+_118436464 | 0.56 |
ENST00000389506.10
ENST00000534358.8 ENST00000531904.6 ENST00000649699.1 |
KMT2A
|
lysine methyltransferase 2A |
| chr22_-_50474942 | 0.56 |
ENST00000348911.10
ENST00000380817.8 |
SBF1
|
SET binding factor 1 |
| chr2_-_2331225 | 0.56 |
ENST00000648627.1
ENST00000649663.1 ENST00000650560.1 ENST00000428368.7 ENST00000648316.1 ENST00000648665.1 ENST00000649313.1 ENST00000399161.7 ENST00000647738.2 |
MYT1L
|
myelin transcription factor 1 like |
| chr1_-_207051202 | 0.56 |
ENST00000315927.9
|
YOD1
|
YOD1 deubiquitinase |
| chr6_-_154356735 | 0.55 |
ENST00000367220.8
ENST00000265198.8 ENST00000520261.1 |
IPCEF1
|
interaction protein for cytohesin exchange factors 1 |
| chr10_-_45535346 | 0.55 |
ENST00000453424.7
ENST00000395769.6 |
MARCHF8
|
membrane associated ring-CH-type finger 8 |
| chr11_+_61752603 | 0.54 |
ENST00000278836.10
|
MYRF
|
myelin regulatory factor |
| chr16_-_71724700 | 0.54 |
ENST00000568954.5
|
PHLPP2
|
PH domain and leucine rich repeat protein phosphatase 2 |
| chrX_-_24027186 | 0.54 |
ENST00000328046.8
|
KLHL15
|
kelch like family member 15 |
| chr3_-_48188356 | 0.54 |
ENST00000351231.7
ENST00000437972.1 ENST00000302506.8 |
CDC25A
|
cell division cycle 25A |
| chr4_-_78939352 | 0.53 |
ENST00000512733.5
|
PAQR3
|
progestin and adipoQ receptor family member 3 |
| chr8_-_73878816 | 0.53 |
ENST00000602593.6
ENST00000651945.1 ENST00000419880.7 ENST00000517608.5 ENST00000650817.1 |
UBE2W
|
ubiquitin conjugating enzyme E2 W |
| chr6_-_31902041 | 0.53 |
ENST00000375527.3
|
ZBTB12
|
zinc finger and BTB domain containing 12 |
| chr2_+_46698909 | 0.52 |
ENST00000650611.1
ENST00000306503.5 |
LINC01118
SOCS5
|
long intergenic non-protein coding RNA 1118 suppressor of cytokine signaling 5 |
| chr7_+_6104881 | 0.52 |
ENST00000306177.9
ENST00000465073.6 |
USP42
|
ubiquitin specific peptidase 42 |
| chr17_+_4833331 | 0.51 |
ENST00000355280.11
ENST00000347992.11 |
MINK1
|
misshapen like kinase 1 |
| chr9_-_19102887 | 0.51 |
ENST00000380502.8
|
HAUS6
|
HAUS augmin like complex subunit 6 |
| chr4_+_56907876 | 0.51 |
ENST00000640168.2
ENST00000309042.12 |
REST
|
RE1 silencing transcription factor |
| chr20_-_33686371 | 0.51 |
ENST00000343380.6
|
E2F1
|
E2F transcription factor 1 |
| chr9_+_112750722 | 0.51 |
ENST00000374232.8
|
SNX30
|
sorting nexin family member 30 |
| chr3_+_156674579 | 0.51 |
ENST00000295924.12
|
TIPARP
|
TCDD inducible poly(ADP-ribose) polymerase |
| chr3_+_14947568 | 0.50 |
ENST00000413118.5
ENST00000425241.5 |
NR2C2
|
nuclear receptor subfamily 2 group C member 2 |
| chr2_-_227164194 | 0.50 |
ENST00000396625.5
|
COL4A4
|
collagen type IV alpha 4 chain |
| chr2_-_73113018 | 0.50 |
ENST00000258098.6
|
RAB11FIP5
|
RAB11 family interacting protein 5 |
| chr9_-_16870662 | 0.49 |
ENST00000380672.9
|
BNC2
|
basonuclin 2 |
| chr2_+_15940537 | 0.49 |
ENST00000281043.4
ENST00000638417.1 |
MYCN
|
MYCN proto-oncogene, bHLH transcription factor |
| chr17_+_68035722 | 0.49 |
ENST00000679078.1
ENST00000330459.8 ENST00000584026.6 |
KPNA2
|
karyopherin subunit alpha 2 |
| chr10_+_59176600 | 0.49 |
ENST00000373880.9
|
PHYHIPL
|
phytanoyl-CoA 2-hydroxylase interacting protein like |
| chr12_-_92145838 | 0.48 |
ENST00000256015.5
|
BTG1
|
BTG anti-proliferation factor 1 |
| chr12_-_57742120 | 0.48 |
ENST00000257897.7
|
AGAP2
|
ArfGAP with GTPase domain, ankyrin repeat and PH domain 2 |
| chr6_+_157381133 | 0.48 |
ENST00000414563.6
ENST00000359775.10 |
ZDHHC14
|
zinc finger DHHC-type palmitoyltransferase 14 |
| chr3_+_32817990 | 0.47 |
ENST00000383763.6
|
TRIM71
|
tripartite motif containing 71 |
| chr6_+_45328203 | 0.47 |
ENST00000371432.7
ENST00000647337.2 ENST00000371438.5 |
RUNX2
|
RUNX family transcription factor 2 |
| chr9_-_96418334 | 0.47 |
ENST00000375256.5
|
ZNF367
|
zinc finger protein 367 |
| chr1_+_28369705 | 0.47 |
ENST00000373839.8
|
PHACTR4
|
phosphatase and actin regulator 4 |
| chr5_-_56952107 | 0.46 |
ENST00000381226.7
ENST00000381199.8 ENST00000381213.7 |
MIER3
|
MIER family member 3 |
| chr12_+_55743110 | 0.45 |
ENST00000257868.10
|
GDF11
|
growth differentiation factor 11 |
| chr1_+_26529745 | 0.45 |
ENST00000374168.7
ENST00000374166.8 |
RPS6KA1
|
ribosomal protein S6 kinase A1 |
| chr2_-_196171565 | 0.45 |
ENST00000263955.9
|
STK17B
|
serine/threonine kinase 17b |
| chr19_+_4402615 | 0.45 |
ENST00000301280.10
|
CHAF1A
|
chromatin assembly factor 1 subunit A |
| chr9_-_109167159 | 0.44 |
ENST00000561981.5
|
FRRS1L
|
ferric chelate reductase 1 like |
| chr1_-_23369813 | 0.43 |
ENST00000314011.9
|
ZNF436
|
zinc finger protein 436 |
| chr12_-_31591129 | 0.42 |
ENST00000389082.10
|
DENND5B
|
DENN domain containing 5B |
| chr6_+_118894144 | 0.42 |
ENST00000229595.6
|
ASF1A
|
anti-silencing function 1A histone chaperone |
| chr2_+_174334947 | 0.42 |
ENST00000394967.3
|
SP9
|
Sp9 transcription factor |
| chr3_-_69386079 | 0.42 |
ENST00000398540.8
|
FRMD4B
|
FERM domain containing 4B |
| chr17_+_82519694 | 0.41 |
ENST00000335255.10
|
FOXK2
|
forkhead box K2 |
| chr16_-_46973634 | 0.41 |
ENST00000317089.10
|
DNAJA2
|
DnaJ heat shock protein family (Hsp40) member A2 |
| chr19_+_37907200 | 0.41 |
ENST00000222345.11
|
SIPA1L3
|
signal induced proliferation associated 1 like 3 |
| chr17_-_49764123 | 0.40 |
ENST00000240364.7
ENST00000506156.1 |
FAM117A
|
family with sequence similarity 117 member A |
| chr3_+_11272413 | 0.40 |
ENST00000446450.6
ENST00000354956.9 ENST00000354449.7 ENST00000419112.5 |
ATG7
|
autophagy related 7 |
| chr11_-_132943671 | 0.40 |
ENST00000331898.11
|
OPCML
|
opioid binding protein/cell adhesion molecule like |
| chr4_+_73740541 | 0.40 |
ENST00000401931.1
ENST00000307407.8 |
CXCL8
|
C-X-C motif chemokine ligand 8 |
| chr10_-_59709842 | 0.39 |
ENST00000395348.8
|
SLC16A9
|
solute carrier family 16 member 9 |
| chr15_+_68578970 | 0.39 |
ENST00000261861.10
|
CORO2B
|
coronin 2B |
| chr7_-_41703062 | 0.39 |
ENST00000242208.5
|
INHBA
|
inhibin subunit beta A |
| chr7_-_105876575 | 0.38 |
ENST00000318724.8
ENST00000419735.8 |
ATXN7L1
|
ataxin 7 like 1 |
| chr18_+_57352541 | 0.38 |
ENST00000324000.4
|
ST8SIA3
|
ST8 alpha-N-acetyl-neuraminide alpha-2,8-sialyltransferase 3 |
| chr3_+_152299392 | 0.38 |
ENST00000498502.5
ENST00000545754.5 ENST00000357472.7 ENST00000324196.9 |
MBNL1
|
muscleblind like splicing regulator 1 |
| chr13_+_51584435 | 0.38 |
ENST00000612477.1
ENST00000298125.7 |
WDFY2
|
WD repeat and FYVE domain containing 2 |
| chr3_-_121545962 | 0.37 |
ENST00000264233.6
|
POLQ
|
DNA polymerase theta |
| chr2_-_213151590 | 0.37 |
ENST00000374319.8
ENST00000457361.5 ENST00000451136.6 ENST00000434687.6 |
IKZF2
|
IKAROS family zinc finger 2 |
| chr9_-_37576365 | 0.36 |
ENST00000432825.7
|
FBXO10
|
F-box protein 10 |
| chr8_-_94949350 | 0.36 |
ENST00000448464.6
ENST00000342697.5 |
TP53INP1
|
tumor protein p53 inducible nuclear protein 1 |
| chr17_+_48997377 | 0.36 |
ENST00000290341.8
|
IGF2BP1
|
insulin like growth factor 2 mRNA binding protein 1 |
| chr2_-_23927107 | 0.35 |
ENST00000238789.10
|
ATAD2B
|
ATPase family AAA domain containing 2B |
| chr16_-_3443446 | 0.35 |
ENST00000301744.7
|
ZNF597
|
zinc finger protein 597 |
| chr11_+_22338333 | 0.35 |
ENST00000263160.4
|
SLC17A6
|
solute carrier family 17 member 6 |
| chr2_-_24971900 | 0.35 |
ENST00000264711.7
|
DNAJC27
|
DnaJ heat shock protein family (Hsp40) member C27 |
| chr11_+_32893246 | 0.35 |
ENST00000399302.7
ENST00000527250.5 |
QSER1
|
glutamine and serine rich 1 |
| chr4_-_184474518 | 0.35 |
ENST00000393593.8
|
IRF2
|
interferon regulatory factor 2 |
| chr9_+_6413191 | 0.34 |
ENST00000276893.10
|
UHRF2
|
ubiquitin like with PHD and ring finger domains 2 |
| chr19_-_17075418 | 0.34 |
ENST00000253669.10
|
HAUS8
|
HAUS augmin like complex subunit 8 |
| chr6_-_89118002 | 0.34 |
ENST00000452027.3
|
SRSF12
|
serine and arginine rich splicing factor 12 |
| chr8_-_130443581 | 0.34 |
ENST00000357668.2
ENST00000518721.6 |
ASAP1
|
ArfGAP with SH3 domain, ankyrin repeat and PH domain 1 |
| chr6_+_87155537 | 0.33 |
ENST00000369577.8
ENST00000518845.1 ENST00000339907.8 ENST00000496806.2 |
ZNF292
|
zinc finger protein 292 |
| chr4_-_82798735 | 0.33 |
ENST00000273908.4
ENST00000319540.9 |
SCD5
|
stearoyl-CoA desaturase 5 |
| chr9_-_122913299 | 0.33 |
ENST00000373659.4
|
ZBTB6
|
zinc finger and BTB domain containing 6 |
| chr10_+_96832252 | 0.32 |
ENST00000676187.1
ENST00000675687.1 ENST00000676123.1 ENST00000675471.1 ENST00000371103.8 ENST00000421806.4 ENST00000675250.1 ENST00000540664.6 ENST00000676414.1 |
LCOR
|
ligand dependent nuclear receptor corepressor |
| chrX_+_14873399 | 0.32 |
ENST00000380492.8
ENST00000482354.5 |
MOSPD2
|
motile sperm domain containing 2 |
| chr11_-_77820706 | 0.32 |
ENST00000440064.2
ENST00000528095.5 ENST00000308488.11 |
RSF1
|
remodeling and spacing factor 1 |
| chr2_+_173354820 | 0.32 |
ENST00000347703.7
ENST00000410101.7 ENST00000410019.3 ENST00000306721.8 |
CDCA7
|
cell division cycle associated 7 |
| chr18_-_21704763 | 0.32 |
ENST00000580981.5
ENST00000289119.7 |
ABHD3
|
abhydrolase domain containing 3, phospholipase |
| chr15_+_31326807 | 0.31 |
ENST00000307145.4
|
KLF13
|
Kruppel like factor 13 |
| chrX_+_120250752 | 0.31 |
ENST00000326624.2
ENST00000557385.2 |
ZBTB33
|
zinc finger and BTB domain containing 33 |
| chr3_-_50567646 | 0.31 |
ENST00000426034.5
ENST00000441239.5 |
C3orf18
|
chromosome 3 open reading frame 18 |
| chr2_-_224585354 | 0.31 |
ENST00000264414.9
ENST00000344951.8 |
CUL3
|
cullin 3 |
| chr13_-_25172278 | 0.31 |
ENST00000515384.2
ENST00000357816.2 |
AMER2
|
APC membrane recruitment protein 2 |
| chr6_+_42782020 | 0.30 |
ENST00000314073.9
|
BICRAL
|
BRD4 interacting chromatin remodeling complex associated protein like |
| chr7_-_28180735 | 0.30 |
ENST00000283928.10
|
JAZF1
|
JAZF zinc finger 1 |
| chr2_+_96816236 | 0.29 |
ENST00000377060.7
ENST00000305510.4 |
CNNM3
|
cyclin and CBS domain divalent metal cation transport mediator 3 |
| chr1_-_84690406 | 0.29 |
ENST00000605755.5
ENST00000342203.8 ENST00000437941.6 |
SSX2IP
|
SSX family member 2 interacting protein |
| chr16_+_24539536 | 0.29 |
ENST00000568015.5
ENST00000319715.10 |
RBBP6
|
RB binding protein 6, ubiquitin ligase |
| chr12_-_107761113 | 0.29 |
ENST00000228437.10
|
PRDM4
|
PR/SET domain 4 |
| chr5_+_180494430 | 0.29 |
ENST00000393356.7
ENST00000618123.4 |
CNOT6
|
CCR4-NOT transcription complex subunit 6 |
| chr1_+_84078043 | 0.28 |
ENST00000370689.6
ENST00000370688.7 |
PRKACB
|
protein kinase cAMP-activated catalytic subunit beta |
| chr1_+_3690654 | 0.28 |
ENST00000378285.5
ENST00000378280.5 ENST00000378288.8 |
TP73
|
tumor protein p73 |
| chr16_-_71289609 | 0.28 |
ENST00000338099.9
ENST00000563876.1 |
CMTR2
|
cap methyltransferase 2 |
| chr13_-_74133892 | 0.28 |
ENST00000377669.7
|
KLF12
|
Kruppel like factor 12 |
| chr20_+_52972347 | 0.28 |
ENST00000371497.10
|
TSHZ2
|
teashirt zinc finger homeobox 2 |
| chr5_+_96936071 | 0.28 |
ENST00000231368.10
|
LNPEP
|
leucyl and cystinyl aminopeptidase |
| chr20_-_462485 | 0.28 |
ENST00000681414.1
ENST00000680050.1 ENST00000681129.1 ENST00000354200.5 ENST00000679895.1 ENST00000681551.1 ENST00000681539.1 |
TBC1D20
|
TBC1 domain family member 20 |
| chr1_-_235328147 | 0.28 |
ENST00000264183.9
ENST00000418304.1 ENST00000349213.7 |
ARID4B
|
AT-rich interaction domain 4B |
| chr1_-_32702736 | 0.28 |
ENST00000373484.4
ENST00000409190.8 |
SYNC
|
syncoilin, intermediate filament protein |
| chr2_+_165239388 | 0.28 |
ENST00000424833.5
ENST00000375437.7 ENST00000631182.3 |
SCN2A
|
sodium voltage-gated channel alpha subunit 2 |
| chr14_+_64465491 | 0.28 |
ENST00000394718.4
|
AKAP5
|
A-kinase anchoring protein 5 |
| chr11_-_64972070 | 0.27 |
ENST00000301896.6
|
MAJIN
|
membrane anchored junction protein |
| chr1_-_225889143 | 0.27 |
ENST00000272134.5
|
LEFTY1
|
left-right determination factor 1 |
| chr1_-_115841116 | 0.27 |
ENST00000320238.3
|
NHLH2
|
nescient helix-loop-helix 2 |
| chr1_-_74673786 | 0.27 |
ENST00000326665.10
|
ERICH3
|
glutamate rich 3 |
| chr17_+_31936993 | 0.26 |
ENST00000322652.10
|
SUZ12
|
SUZ12 polycomb repressive complex 2 subunit |
| chr10_-_92243246 | 0.26 |
ENST00000412050.8
ENST00000614585.4 |
CPEB3
|
cytoplasmic polyadenylation element binding protein 3 |
| chr10_+_69318831 | 0.26 |
ENST00000359426.7
|
HK1
|
hexokinase 1 |
| chr7_-_5423543 | 0.26 |
ENST00000399537.8
|
TNRC18
|
trinucleotide repeat containing 18 |
| chr17_+_29593118 | 0.26 |
ENST00000394859.8
|
ANKRD13B
|
ankyrin repeat domain 13B |
| chr2_+_149330506 | 0.26 |
ENST00000334166.9
|
LYPD6
|
LY6/PLAUR domain containing 6 |
| chr4_+_98995709 | 0.25 |
ENST00000296411.11
ENST00000625963.1 |
METAP1
|
methionyl aminopeptidase 1 |
| chr2_+_69915100 | 0.25 |
ENST00000264444.7
|
MXD1
|
MAX dimerization protein 1 |
| chr16_-_4273014 | 0.25 |
ENST00000204517.11
|
TFAP4
|
transcription factor AP-4 |
| chr3_+_172750682 | 0.25 |
ENST00000232458.9
ENST00000540509.5 |
ECT2
|
epithelial cell transforming 2 |
| chr10_+_68560317 | 0.25 |
ENST00000373644.5
|
TET1
|
tet methylcytosine dioxygenase 1 |
| chr8_-_42051978 | 0.24 |
ENST00000265713.8
ENST00000648335.1 ENST00000485568.5 ENST00000426524.6 ENST00000396930.4 ENST00000406337.6 |
KAT6A
|
lysine acetyltransferase 6A |
| chr8_-_100952918 | 0.24 |
ENST00000395957.6
ENST00000395948.6 ENST00000457309.2 |
YWHAZ
|
tyrosine 3-monooxygenase/tryptophan 5-monooxygenase activation protein zeta |
| chr2_+_148644706 | 0.24 |
ENST00000258484.11
|
EPC2
|
enhancer of polycomb homolog 2 |
Network of associatons between targets according to the STRING database.

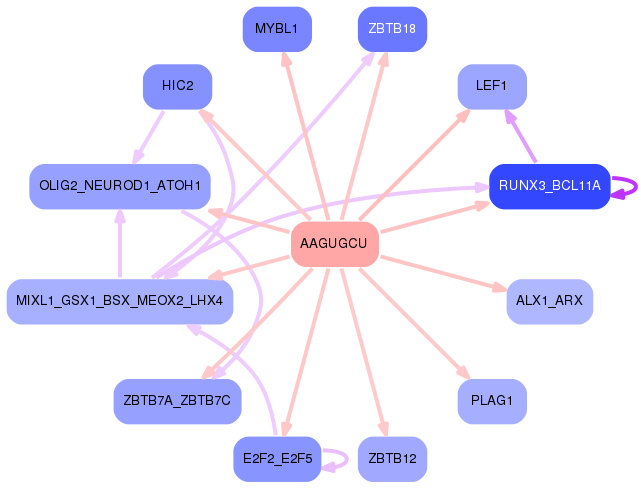
First level regulatory network of AAGUGCU
Gene Ontology Analysis
Gene overrepresentation in biological process category:
| Log-likelihood per target | Total log-likelihood | Term | Description |
|---|---|---|---|
| 0.4 | 1.8 | GO:0097535 | lymphoid lineage cell migration(GO:0097534) lymphoid lineage cell migration into thymus(GO:0097535) |
| 0.4 | 1.3 | GO:0060730 | regulation of intestinal epithelial structure maintenance(GO:0060730) |
| 0.4 | 1.1 | GO:1904266 | positive regulation of Schwann cell migration(GO:1900149) regulation of Schwann cell chemotaxis(GO:1904266) positive regulation of Schwann cell chemotaxis(GO:1904268) Schwann cell chemotaxis(GO:1990751) |
| 0.4 | 2.5 | GO:0061152 | trachea submucosa development(GO:0061152) trachea gland development(GO:0061153) |
| 0.3 | 1.0 | GO:1990086 | lens fiber cell apoptotic process(GO:1990086) |
| 0.2 | 0.7 | GO:0044725 | chromatin reprogramming in the zygote(GO:0044725) |
| 0.2 | 0.6 | GO:1904562 | phosphatidylinositol 5-phosphate metabolic process(GO:1904562) |
| 0.2 | 0.6 | GO:0003192 | mitral valve formation(GO:0003192) |
| 0.2 | 0.6 | GO:2001025 | positive regulation of response to drug(GO:2001025) |
| 0.2 | 0.5 | GO:2000706 | amniotic stem cell differentiation(GO:0097086) negative regulation of dense core granule biogenesis(GO:2000706) negative regulation of mesenchymal stem cell differentiation(GO:2000740) regulation of amniotic stem cell differentiation(GO:2000797) negative regulation of amniotic stem cell differentiation(GO:2000798) |
| 0.2 | 1.4 | GO:0021759 | globus pallidus development(GO:0021759) embryonic olfactory bulb interneuron precursor migration(GO:0021831) |
| 0.2 | 0.9 | GO:0002729 | positive regulation of natural killer cell cytokine production(GO:0002729) |
| 0.1 | 0.6 | GO:1990168 | protein K33-linked deubiquitination(GO:1990168) |
| 0.1 | 1.6 | GO:0006335 | DNA replication-dependent nucleosome assembly(GO:0006335) DNA replication-dependent nucleosome organization(GO:0034723) |
| 0.1 | 0.6 | GO:1904761 | negative regulation of myofibroblast differentiation(GO:1904761) |
| 0.1 | 0.8 | GO:0071630 | nucleus-associated proteasomal ubiquitin-dependent protein catabolic process(GO:0071630) |
| 0.1 | 0.4 | GO:0016237 | lysosomal microautophagy(GO:0016237) piecemeal microautophagy of nucleus(GO:0034727) suppression by virus of host autophagy(GO:0039521) |
| 0.1 | 1.2 | GO:0070164 | negative regulation of adiponectin secretion(GO:0070164) |
| 0.1 | 0.8 | GO:1901097 | negative regulation of autophagosome maturation(GO:1901097) |
| 0.1 | 0.7 | GO:1903566 | positive regulation of protein localization to cilium(GO:1903566) |
| 0.1 | 1.6 | GO:0034378 | chylomicron assembly(GO:0034378) |
| 0.1 | 0.5 | GO:0061386 | closure of optic fissure(GO:0061386) |
| 0.1 | 0.3 | GO:1903527 | positive regulation of membrane tubulation(GO:1903527) |
| 0.1 | 2.2 | GO:1901223 | negative regulation of NIK/NF-kappaB signaling(GO:1901223) |
| 0.1 | 1.0 | GO:2000382 | positive regulation of mesoderm development(GO:2000382) |
| 0.1 | 0.4 | GO:0045578 | negative regulation of B cell differentiation(GO:0045578) |
| 0.1 | 0.6 | GO:0061428 | negative regulation of transcription from RNA polymerase II promoter in response to hypoxia(GO:0061428) |
| 0.1 | 0.3 | GO:0036451 | cap mRNA methylation(GO:0036451) |
| 0.1 | 1.0 | GO:0051534 | negative regulation of NFAT protein import into nucleus(GO:0051534) |
| 0.1 | 0.3 | GO:1900365 | positive regulation of mRNA polyadenylation(GO:1900365) |
| 0.1 | 0.2 | GO:0090310 | negative regulation of methylation-dependent chromatin silencing(GO:0090310) |
| 0.1 | 0.6 | GO:0036515 | serotonergic neuron axon guidance(GO:0036515) |
| 0.1 | 1.0 | GO:2000786 | positive regulation of autophagosome assembly(GO:2000786) |
| 0.1 | 1.5 | GO:0070050 | neuron cellular homeostasis(GO:0070050) |
| 0.1 | 1.1 | GO:2000271 | positive regulation of fibroblast apoptotic process(GO:2000271) |
| 0.1 | 0.9 | GO:0070862 | negative regulation of protein exit from endoplasmic reticulum(GO:0070862) negative regulation of retrograde protein transport, ER to cytosol(GO:1904153) |
| 0.1 | 0.2 | GO:0030221 | basophil differentiation(GO:0030221) |
| 0.1 | 0.2 | GO:1903414 | spleen trabecula formation(GO:0060345) iron cation export(GO:1903414) ferrous iron export(GO:1903988) |
| 0.1 | 0.2 | GO:0090176 | microtubule cytoskeleton organization involved in establishment of planar polarity(GO:0090176) |
| 0.1 | 0.2 | GO:0071626 | mastication(GO:0071626) learned vocalization behavior(GO:0098583) |
| 0.1 | 0.1 | GO:0070839 | divalent metal ion export(GO:0070839) |
| 0.1 | 0.1 | GO:0071930 | negative regulation of transcription involved in G1/S transition of mitotic cell cycle(GO:0071930) |
| 0.1 | 0.6 | GO:0071799 | response to prostaglandin D(GO:0071798) cellular response to prostaglandin D stimulus(GO:0071799) |
| 0.1 | 0.5 | GO:0045627 | positive regulation of T-helper 1 cell differentiation(GO:0045627) |
| 0.1 | 0.3 | GO:2000325 | regulation of ligand-dependent nuclear receptor transcription coactivator activity(GO:2000325) positive regulation of ligand-dependent nuclear receptor transcription coactivator activity(GO:2000327) |
| 0.1 | 1.5 | GO:0048935 | peripheral nervous system neuron differentiation(GO:0048934) peripheral nervous system neuron development(GO:0048935) |
| 0.1 | 0.2 | GO:1905053 | regulation of base-excision repair(GO:1905051) positive regulation of base-excision repair(GO:1905053) |
| 0.1 | 0.2 | GO:0060164 | regulation of timing of neuron differentiation(GO:0060164) |
| 0.0 | 0.3 | GO:0045204 | MAPK export from nucleus(GO:0045204) |
| 0.0 | 0.1 | GO:0048250 | mitochondrial iron ion transport(GO:0048250) |
| 0.0 | 0.2 | GO:0070213 | protein auto-ADP-ribosylation(GO:0070213) |
| 0.0 | 0.2 | GO:0060928 | atrioventricular node development(GO:0003162) cardiac septum cell differentiation(GO:0003292) atrioventricular node cell differentiation(GO:0060922) atrioventricular node cell development(GO:0060928) |
| 0.0 | 0.4 | GO:2000491 | positive regulation of hepatic stellate cell activation(GO:2000491) |
| 0.0 | 0.7 | GO:0060252 | positive regulation of glial cell proliferation(GO:0060252) |
| 0.0 | 0.3 | GO:0098700 | neurotransmitter loading into synaptic vesicle(GO:0098700) |
| 0.0 | 0.4 | GO:0034773 | histone H4-K20 trimethylation(GO:0034773) |
| 0.0 | 0.5 | GO:0002051 | osteoblast fate commitment(GO:0002051) |
| 0.0 | 0.5 | GO:0032286 | central nervous system myelin maintenance(GO:0032286) |
| 0.0 | 0.4 | GO:2000042 | negative regulation of double-strand break repair via homologous recombination(GO:2000042) |
| 0.0 | 0.4 | GO:0031936 | negative regulation of chromatin silencing(GO:0031936) |
| 0.0 | 0.2 | GO:0048686 | regulation of sprouting of injured axon(GO:0048686) regulation of axon extension involved in regeneration(GO:0048690) |
| 0.0 | 0.3 | GO:0000395 | mRNA 5'-splice site recognition(GO:0000395) |
| 0.0 | 0.7 | GO:0006002 | fructose 6-phosphate metabolic process(GO:0006002) |
| 0.0 | 0.6 | GO:0010908 | regulation of heparan sulfate proteoglycan biosynthetic process(GO:0010908) positive regulation of heparan sulfate proteoglycan biosynthetic process(GO:0010909) positive regulation of proteoglycan biosynthetic process(GO:1902730) |
| 0.0 | 0.4 | GO:2000535 | regulation of entry of bacterium into host cell(GO:2000535) |
| 0.0 | 0.3 | GO:0016584 | nucleosome positioning(GO:0016584) |
| 0.0 | 1.0 | GO:0071481 | cellular response to X-ray(GO:0071481) |
| 0.0 | 0.3 | GO:0072656 | maintenance of protein location in mitochondrion(GO:0072656) |
| 0.0 | 0.7 | GO:0045779 | negative regulation of bone resorption(GO:0045779) |
| 0.0 | 0.6 | GO:0045475 | locomotor rhythm(GO:0045475) |
| 0.0 | 0.3 | GO:0046726 | positive regulation by virus of viral protein levels in host cell(GO:0046726) positive regulation of ER to Golgi vesicle-mediated transport(GO:1902953) |
| 0.0 | 0.7 | GO:0035278 | miRNA mediated inhibition of translation(GO:0035278) negative regulation of translation, ncRNA-mediated(GO:0040033) regulation of translation, ncRNA-mediated(GO:0045974) |
| 0.0 | 0.1 | GO:1903998 | regulation of eating behavior(GO:1903998) |
| 0.0 | 0.1 | GO:0008611 | ether lipid biosynthetic process(GO:0008611) glycerol ether biosynthetic process(GO:0046504) ether biosynthetic process(GO:1901503) |
| 0.0 | 0.1 | GO:0044314 | protein K27-linked ubiquitination(GO:0044314) |
| 0.0 | 0.3 | GO:0097338 | response to clozapine(GO:0097338) |
| 0.0 | 0.1 | GO:1990709 | presynaptic active zone organization(GO:1990709) |
| 0.0 | 0.3 | GO:0002480 | antigen processing and presentation of exogenous peptide antigen via MHC class I, TAP-independent(GO:0002480) |
| 0.0 | 1.6 | GO:0007340 | acrosome reaction(GO:0007340) |
| 0.0 | 0.9 | GO:0090141 | positive regulation of mitochondrial fission(GO:0090141) |
| 0.0 | 0.1 | GO:0018242 | protein O-linked glycosylation via serine(GO:0018242) |
| 0.0 | 0.1 | GO:0016256 | N-glycan processing to lysosome(GO:0016256) |
| 0.0 | 0.3 | GO:0010216 | maintenance of DNA methylation(GO:0010216) |
| 0.0 | 0.3 | GO:0010739 | positive regulation of protein kinase A signaling(GO:0010739) |
| 0.0 | 0.1 | GO:1902162 | mRNA localization resulting in posttranscriptional regulation of gene expression(GO:0010609) platelet alpha granule organization(GO:0070889) regulation of DNA damage response, signal transduction by p53 class mediator resulting in transcription of p21 class mediator(GO:1902162) positive regulation of DNA damage response, signal transduction by p53 class mediator resulting in transcription of p21 class mediator(GO:1902164) |
| 0.0 | 0.5 | GO:1903800 | positive regulation of production of miRNAs involved in gene silencing by miRNA(GO:1903800) |
| 0.0 | 1.4 | GO:0071526 | semaphorin-plexin signaling pathway(GO:0071526) |
| 0.0 | 0.3 | GO:0007256 | activation of JNKK activity(GO:0007256) |
| 0.0 | 0.5 | GO:0032836 | glomerular basement membrane development(GO:0032836) |
| 0.0 | 0.2 | GO:0032494 | response to peptidoglycan(GO:0032494) |
| 0.0 | 0.3 | GO:0045647 | negative regulation of erythrocyte differentiation(GO:0045647) |
| 0.0 | 0.4 | GO:0070934 | CRD-mediated mRNA stabilization(GO:0070934) |
| 0.0 | 0.3 | GO:0031507 | heterochromatin assembly(GO:0031507) |
| 0.0 | 0.1 | GO:0052572 | response to immune response of other organism involved in symbiotic interaction(GO:0052564) response to host immune response(GO:0052572) |
| 0.0 | 0.4 | GO:0071397 | cellular response to cholesterol(GO:0071397) |
| 0.0 | 0.6 | GO:1901386 | negative regulation of voltage-gated calcium channel activity(GO:1901386) |
| 0.0 | 0.2 | GO:0007185 | transmembrane receptor protein tyrosine phosphatase signaling pathway(GO:0007185) |
| 0.0 | 0.3 | GO:0043985 | histone H4-R3 methylation(GO:0043985) |
| 0.0 | 0.4 | GO:0014877 | response to muscle inactivity involved in regulation of muscle adaptation(GO:0014877) response to denervation involved in regulation of muscle adaptation(GO:0014894) |
| 0.0 | 0.4 | GO:0001574 | ganglioside biosynthetic process(GO:0001574) |
| 0.0 | 0.9 | GO:0032012 | regulation of ARF protein signal transduction(GO:0032012) |
| 0.0 | 0.2 | GO:0061709 | reticulophagy(GO:0061709) |
| 0.0 | 0.3 | GO:0043922 | negative regulation by host of viral transcription(GO:0043922) |
| 0.0 | 0.6 | GO:0048665 | neuron fate specification(GO:0048665) |
| 0.0 | 0.6 | GO:0015671 | oxygen transport(GO:0015671) |
| 0.0 | 0.1 | GO:0061536 | glycine secretion(GO:0061536) glycine secretion, neurotransmission(GO:0061537) |
| 0.0 | 0.3 | GO:0070197 | meiotic telomere tethering at nuclear periphery(GO:0044821) meiotic attachment of telomere to nuclear envelope(GO:0070197) chromosome attachment to the nuclear envelope(GO:0097240) |
| 0.0 | 1.1 | GO:1904837 | beta-catenin-TCF complex assembly(GO:1904837) |
| 0.0 | 0.8 | GO:0000188 | inactivation of MAPK activity(GO:0000188) |
| 0.0 | 0.4 | GO:0046415 | urate metabolic process(GO:0046415) |
| 0.0 | 0.1 | GO:2000364 | cardiac muscle tissue regeneration(GO:0061026) regulation of STAT protein import into nucleus(GO:2000364) positive regulation of STAT protein import into nucleus(GO:2000366) |
| 0.0 | 0.6 | GO:0000470 | maturation of LSU-rRNA(GO:0000470) |
| 0.0 | 0.5 | GO:0070734 | histone H3-K27 methylation(GO:0070734) |
| 0.0 | 0.3 | GO:0018206 | peptidyl-methionine modification(GO:0018206) |
| 0.0 | 0.2 | GO:0031125 | rRNA 3'-end processing(GO:0031125) |
| 0.0 | 0.8 | GO:0050691 | regulation of defense response to virus by host(GO:0050691) |
| 0.0 | 0.5 | GO:0000185 | activation of MAPKKK activity(GO:0000185) |
| 0.0 | 0.1 | GO:0060523 | prostate epithelial cord elongation(GO:0060523) |
| 0.0 | 0.3 | GO:0008627 | intrinsic apoptotic signaling pathway in response to osmotic stress(GO:0008627) |
| 0.0 | 0.8 | GO:0090162 | establishment of epithelial cell polarity(GO:0090162) |
| 0.0 | 0.2 | GO:0097012 | cellular response to granulocyte macrophage colony-stimulating factor stimulus(GO:0097011) response to granulocyte macrophage colony-stimulating factor(GO:0097012) response to phorbol 13-acetate 12-myristate(GO:1904627) cellular response to phorbol 13-acetate 12-myristate(GO:1904628) |
| 0.0 | 0.0 | GO:0075044 | autophagy of host cells involved in interaction with symbiont(GO:0075044) autophagy involved in symbiotic interaction(GO:0075071) |
| 0.0 | 0.1 | GO:0006398 | mRNA 3'-end processing by stem-loop binding and cleavage(GO:0006398) |
| 0.0 | 0.2 | GO:0090168 | Golgi reassembly(GO:0090168) |
| 0.0 | 0.2 | GO:0036123 | histone H3-K9 dimethylation(GO:0036123) |
| 0.0 | 0.2 | GO:0008343 | adult feeding behavior(GO:0008343) |
| 0.0 | 1.1 | GO:0002755 | MyD88-dependent toll-like receptor signaling pathway(GO:0002755) |
| 0.0 | 0.1 | GO:0033029 | neutrophil apoptotic process(GO:0001781) regulation of neutrophil apoptotic process(GO:0033029) |
| 0.0 | 0.3 | GO:1902083 | negative regulation of peptidyl-cysteine S-nitrosylation(GO:1902083) |
| 0.0 | 0.2 | GO:0051988 | regulation of attachment of spindle microtubules to kinetochore(GO:0051988) |
| 0.0 | 0.3 | GO:0060044 | negative regulation of cardiac muscle cell proliferation(GO:0060044) |
| 0.0 | 0.1 | GO:0035513 | oxidative RNA demethylation(GO:0035513) oxidative single-stranded RNA demethylation(GO:0035553) |
| 0.0 | 0.0 | GO:0001544 | initiation of primordial ovarian follicle growth(GO:0001544) |
| 0.0 | 0.5 | GO:0071218 | cellular response to misfolded protein(GO:0071218) |
| 0.0 | 0.5 | GO:0021511 | spinal cord patterning(GO:0021511) |
| 0.0 | 0.5 | GO:0003416 | endochondral bone growth(GO:0003416) |
| 0.0 | 0.6 | GO:0034067 | protein localization to Golgi apparatus(GO:0034067) |
| 0.0 | 0.7 | GO:0043984 | histone H4-K16 acetylation(GO:0043984) |
| 0.0 | 0.5 | GO:0006607 | NLS-bearing protein import into nucleus(GO:0006607) |
| 0.0 | 0.5 | GO:0008210 | estrogen metabolic process(GO:0008210) |
| 0.0 | 0.1 | GO:0055129 | L-proline biosynthetic process(GO:0055129) |
Gene overrepresentation in cellular component category:
| Log-likelihood per target | Total log-likelihood | Term | Description |
|---|---|---|---|
| 0.2 | 0.5 | GO:0035189 | Rb-E2F complex(GO:0035189) |
| 0.1 | 0.4 | GO:0043512 | inhibin complex(GO:0043511) inhibin A complex(GO:0043512) |
| 0.1 | 2.5 | GO:1990907 | beta-catenin-TCF complex(GO:1990907) |
| 0.1 | 1.0 | GO:0097129 | cyclin D2-CDK4 complex(GO:0097129) |
| 0.1 | 0.9 | GO:0032584 | growth cone membrane(GO:0032584) |
| 0.1 | 0.7 | GO:0042272 | nuclear RNA export factor complex(GO:0042272) |
| 0.1 | 0.6 | GO:0070545 | PeBoW complex(GO:0070545) |
| 0.1 | 0.4 | GO:0033186 | CAF-1 complex(GO:0033186) |
| 0.1 | 0.9 | GO:0070652 | HAUS complex(GO:0070652) |
| 0.1 | 0.7 | GO:0001940 | male pronucleus(GO:0001940) |
| 0.1 | 0.3 | GO:0031905 | early endosome lumen(GO:0031905) |
| 0.0 | 0.6 | GO:0072487 | MSL complex(GO:0072487) |
| 0.0 | 0.2 | GO:0071204 | histone pre-mRNA 3'end processing complex(GO:0071204) |
| 0.0 | 0.6 | GO:0042788 | polysomal ribosome(GO:0042788) |
| 0.0 | 0.2 | GO:0072534 | perineuronal net(GO:0072534) |
| 0.0 | 0.5 | GO:0005587 | collagen type IV trimer(GO:0005587) |
| 0.0 | 0.2 | GO:0097149 | centralspindlin complex(GO:0097149) |
| 0.0 | 0.2 | GO:0071547 | piP-body(GO:0071547) |
| 0.0 | 0.4 | GO:0061689 | tricellular tight junction(GO:0061689) |
| 0.0 | 2.5 | GO:0001917 | photoreceptor inner segment(GO:0001917) |
| 0.0 | 0.3 | GO:0005827 | polar microtubule(GO:0005827) |
| 0.0 | 0.3 | GO:0001739 | sex chromatin(GO:0001739) |
| 0.0 | 0.2 | GO:0032777 | Piccolo NuA4 histone acetyltransferase complex(GO:0032777) |
| 0.0 | 0.6 | GO:0032433 | filopodium tip(GO:0032433) |
| 0.0 | 1.1 | GO:0044295 | axonal growth cone(GO:0044295) |
| 0.0 | 0.1 | GO:0035525 | NF-kappaB p50/p65 complex(GO:0035525) |
| 0.0 | 0.3 | GO:0005677 | chromatin silencing complex(GO:0005677) |
| 0.0 | 0.3 | GO:0031010 | ISWI-type complex(GO:0031010) |
| 0.0 | 0.4 | GO:0070937 | CRD-mediated mRNA stability complex(GO:0070937) |
| 0.0 | 0.2 | GO:0097197 | tetraspanin-enriched microdomain(GO:0097197) |
| 0.0 | 0.2 | GO:0005955 | calcineurin complex(GO:0005955) |
| 0.0 | 0.2 | GO:1990316 | ATG1/ULK1 kinase complex(GO:1990316) |
| 0.0 | 0.2 | GO:0035068 | micro-ribonucleoprotein complex(GO:0035068) |
| 0.0 | 0.6 | GO:0030014 | CCR4-NOT complex(GO:0030014) |
| 0.0 | 0.9 | GO:0016592 | mediator complex(GO:0016592) |
| 0.0 | 0.2 | GO:0070776 | H3 histone acetyltransferase complex(GO:0070775) MOZ/MORF histone acetyltransferase complex(GO:0070776) |
| 0.0 | 1.1 | GO:0045171 | intercellular bridge(GO:0045171) |
| 0.0 | 0.2 | GO:0002193 | MAML1-RBP-Jkappa- ICN1 complex(GO:0002193) |
| 0.0 | 0.1 | GO:0033165 | interphotoreceptor matrix(GO:0033165) |
| 0.0 | 0.2 | GO:0000780 | condensed nuclear chromosome, centromeric region(GO:0000780) |
| 0.0 | 0.6 | GO:0044665 | MLL1/2 complex(GO:0044665) MLL1 complex(GO:0071339) |
| 0.0 | 1.9 | GO:0000777 | condensed chromosome kinetochore(GO:0000777) |
| 0.0 | 0.4 | GO:0005720 | nuclear heterochromatin(GO:0005720) |
| 0.0 | 0.2 | GO:0000235 | astral microtubule(GO:0000235) aster(GO:0005818) |
| 0.0 | 0.0 | GO:0097637 | intrinsic component of autophagosome membrane(GO:0097636) integral component of autophagosome membrane(GO:0097637) |
Gene overrepresentation in molecular function category:
| Log-likelihood per target | Total log-likelihood | Term | Description |
|---|---|---|---|
| 0.4 | 1.2 | GO:0008330 | protein tyrosine/threonine phosphatase activity(GO:0008330) |
| 0.3 | 1.0 | GO:0016309 | 1-phosphatidylinositol-5-phosphate 4-kinase activity(GO:0016309) |
| 0.2 | 1.0 | GO:0070579 | methylcytosine dioxygenase activity(GO:0070579) |
| 0.2 | 2.6 | GO:0030284 | estrogen receptor activity(GO:0030284) |
| 0.1 | 0.6 | GO:0045322 | unmethylated CpG binding(GO:0045322) |
| 0.1 | 0.6 | GO:1904455 | ubiquitin-specific protease activity involved in negative regulation of ERAD pathway(GO:1904455) |
| 0.1 | 0.4 | GO:0019779 | Atg12 activating enzyme activity(GO:0019778) Atg8 activating enzyme activity(GO:0019779) |
| 0.1 | 1.7 | GO:0001135 | transcription factor activity, RNA polymerase II transcription factor recruiting(GO:0001135) |
| 0.1 | 0.3 | GO:0052739 | phosphatidylserine 1-acylhydrolase activity(GO:0052739) |
| 0.1 | 0.3 | GO:0004483 | mRNA (nucleoside-2'-O-)-methyltransferase activity(GO:0004483) |
| 0.1 | 0.6 | GO:0030144 | alpha-1,6-mannosylglycoprotein 6-beta-N-acetylglucosaminyltransferase activity(GO:0030144) |
| 0.1 | 0.7 | GO:0003872 | 6-phosphofructokinase activity(GO:0003872) |
| 0.1 | 0.3 | GO:0031208 | POZ domain binding(GO:0031208) |
| 0.1 | 0.4 | GO:0001069 | regulatory region RNA binding(GO:0001069) |
| 0.1 | 0.2 | GO:0097689 | iron channel activity(GO:0097689) |
| 0.1 | 0.6 | GO:0005250 | A-type (transient outward) potassium channel activity(GO:0005250) |
| 0.1 | 0.7 | GO:0034046 | poly(G) binding(GO:0034046) |
| 0.1 | 1.4 | GO:0001206 | transcriptional repressor activity, RNA polymerase II distal enhancer sequence-specific binding(GO:0001206) |
| 0.1 | 0.2 | GO:0071207 | histone pre-mRNA stem-loop binding(GO:0071207) |
| 0.1 | 0.3 | GO:0030550 | acetylcholine receptor inhibitor activity(GO:0030550) |
| 0.1 | 1.4 | GO:0046625 | sphingolipid binding(GO:0046625) |
| 0.1 | 1.4 | GO:0017154 | semaphorin receptor activity(GO:0017154) |
| 0.1 | 0.6 | GO:0004957 | prostaglandin E receptor activity(GO:0004957) |
| 0.1 | 0.7 | GO:0071532 | ankyrin repeat binding(GO:0071532) |
| 0.0 | 0.3 | GO:0004768 | stearoyl-CoA 9-desaturase activity(GO:0004768) acyl-CoA desaturase activity(GO:0016215) |
| 0.0 | 0.4 | GO:0034711 | inhibin binding(GO:0034711) |
| 0.0 | 1.2 | GO:0005068 | transmembrane receptor protein tyrosine kinase adaptor activity(GO:0005068) |
| 0.0 | 0.4 | GO:0003828 | alpha-N-acetylneuraminate alpha-2,8-sialyltransferase activity(GO:0003828) |
| 0.0 | 0.3 | GO:0050733 | RS domain binding(GO:0050733) |
| 0.0 | 0.4 | GO:0070087 | chromo shadow domain binding(GO:0070087) |
| 0.0 | 0.8 | GO:0052629 | phosphatidylinositol-3,5-bisphosphate 3-phosphatase activity(GO:0052629) |
| 0.0 | 0.4 | GO:0051575 | 5'-deoxyribose-5-phosphate lyase activity(GO:0051575) |
| 0.0 | 0.8 | GO:0008035 | high-density lipoprotein particle binding(GO:0008035) |
| 0.0 | 0.7 | GO:0008349 | MAP kinase kinase kinase kinase activity(GO:0008349) |
| 0.0 | 0.7 | GO:0043422 | protein kinase B binding(GO:0043422) |
| 0.0 | 0.3 | GO:0030346 | protein phosphatase 2B binding(GO:0030346) |
| 0.0 | 1.3 | GO:0004709 | MAP kinase kinase kinase activity(GO:0004709) |
| 0.0 | 0.3 | GO:0004340 | glucokinase activity(GO:0004340) hexokinase activity(GO:0004396) fructokinase activity(GO:0008865) mannokinase activity(GO:0019158) |
| 0.0 | 0.3 | GO:1990226 | histone methyltransferase binding(GO:1990226) |
| 0.0 | 0.4 | GO:0045236 | CXCR chemokine receptor binding(GO:0045236) |
| 0.0 | 0.2 | GO:1904047 | S-adenosyl-L-methionine binding(GO:1904047) |
| 0.0 | 0.6 | GO:0005344 | oxygen transporter activity(GO:0005344) |
| 0.0 | 0.7 | GO:0035198 | miRNA binding(GO:0035198) |
| 0.0 | 0.5 | GO:0072542 | protein phosphatase activator activity(GO:0072542) |
| 0.0 | 0.6 | GO:0003993 | acid phosphatase activity(GO:0003993) |
| 0.0 | 0.1 | GO:0003976 | UDP-N-acetylglucosamine-lysosomal-enzyme N-acetylglucosaminephosphotransferase activity(GO:0003976) |
| 0.0 | 0.2 | GO:0001025 | RNA polymerase III transcription factor binding(GO:0001025) |
| 0.0 | 1.1 | GO:0030676 | Rac guanyl-nucleotide exchange factor activity(GO:0030676) |
| 0.0 | 0.3 | GO:0046976 | histone methyltransferase activity (H3-K27 specific)(GO:0046976) |
| 0.0 | 0.3 | GO:0097371 | MDM2/MDM4 family protein binding(GO:0097371) |
| 0.0 | 2.8 | GO:0070491 | repressing transcription factor binding(GO:0070491) |
| 0.0 | 1.2 | GO:0004407 | histone deacetylase activity(GO:0004407) |
| 0.0 | 0.7 | GO:0003950 | NAD+ ADP-ribosyltransferase activity(GO:0003950) |
| 0.0 | 0.9 | GO:0005086 | ARF guanyl-nucleotide exchange factor activity(GO:0005086) |
| 0.0 | 0.2 | GO:0004723 | calcium-dependent protein serine/threonine phosphatase activity(GO:0004723) |
| 0.0 | 0.1 | GO:1990829 | C-rich single-stranded DNA binding(GO:1990829) |
| 0.0 | 1.4 | GO:0008028 | monocarboxylic acid transmembrane transporter activity(GO:0008028) |
| 0.0 | 0.9 | GO:0061631 | ubiquitin conjugating enzyme activity(GO:0061631) |
| 0.0 | 0.4 | GO:0035925 | mRNA 3'-UTR AU-rich region binding(GO:0035925) |
| 0.0 | 0.1 | GO:0008440 | inositol-1,4,5-trisphosphate 3-kinase activity(GO:0008440) |
| 0.0 | 0.1 | GO:0015375 | glycine:sodium symporter activity(GO:0015375) |
| 0.0 | 1.2 | GO:0030145 | manganese ion binding(GO:0030145) |
| 0.0 | 0.1 | GO:0003831 | beta-N-acetylglucosaminylglycopeptide beta-1,4-galactosyltransferase activity(GO:0003831) |
| 0.0 | 0.2 | GO:0042799 | histone methyltransferase activity (H4-K20 specific)(GO:0042799) |
| 0.0 | 0.3 | GO:0004691 | cAMP-dependent protein kinase activity(GO:0004691) |
| 0.0 | 0.1 | GO:0035515 | oxidative RNA demethylase activity(GO:0035515) |
| 0.0 | 1.0 | GO:0017112 | Rab guanyl-nucleotide exchange factor activity(GO:0017112) |
| 0.0 | 0.1 | GO:0004735 | pyrroline-5-carboxylate reductase activity(GO:0004735) |
| 0.0 | 0.6 | GO:0043014 | alpha-tubulin binding(GO:0043014) |
| 0.0 | 0.9 | GO:0001102 | RNA polymerase II activating transcription factor binding(GO:0001102) |
| 0.0 | 0.2 | GO:0034452 | dynactin binding(GO:0034452) |
| 0.0 | 0.3 | GO:0004535 | poly(A)-specific ribonuclease activity(GO:0004535) |
| 0.0 | 0.5 | GO:0043027 | cysteine-type endopeptidase inhibitor activity involved in apoptotic process(GO:0043027) |
Gene overrepresentation in curated gene sets: canonical pathways category:
| Log-likelihood per target | Total log-likelihood | Term | Description |
|---|---|---|---|
| 0.1 | 0.4 | SA REG CASCADE OF CYCLIN EXPR | Expression of cyclins regulates progression through the cell cycle by activating cyclin-dependent kinases. |
| 0.0 | 1.1 | PID TCR JNK PATHWAY | JNK signaling in the CD4+ TCR pathway |
| 0.0 | 0.5 | SA G2 AND M PHASES | Cdc25 activates the cdc2/cyclin B complex to induce the G2/M transition. |
| 0.0 | 1.2 | PID IL2 STAT5 PATHWAY | IL2 signaling events mediated by STAT5 |
| 0.0 | 1.1 | PID ARF6 DOWNSTREAM PATHWAY | Arf6 downstream pathway |
| 0.0 | 0.5 | PID TCR CALCIUM PATHWAY | Calcium signaling in the CD4+ TCR pathway |
| 0.0 | 3.0 | PID SMAD2 3NUCLEAR PATHWAY | Regulation of nuclear SMAD2/3 signaling |
| 0.0 | 0.2 | ST TYPE I INTERFERON PATHWAY | Type I Interferon (alpha/beta IFN) Pathway |
| 0.0 | 2.0 | PID NFAT TFPATHWAY | Calcineurin-regulated NFAT-dependent transcription in lymphocytes |
| 0.0 | 0.5 | PID SMAD2 3PATHWAY | Regulation of cytoplasmic and nuclear SMAD2/3 signaling |
| 0.0 | 0.5 | SA B CELL RECEPTOR COMPLEXES | Antigen binding to B cell receptors activates protein tyrosine kinases, such as the Src family, which ultimate activate MAP kinases. |
| 0.0 | 2.3 | PID IL4 2PATHWAY | IL4-mediated signaling events |
| 0.0 | 0.5 | PID IL3 PATHWAY | IL3-mediated signaling events |
| 0.0 | 0.6 | SA PTEN PATHWAY | PTEN is a tumor suppressor that dephosphorylates the lipid messenger phosphatidylinositol triphosphate. |
| 0.0 | 0.6 | PID HIF1A PATHWAY | Hypoxic and oxygen homeostasis regulation of HIF-1-alpha |
| 0.0 | 0.6 | PID CONE PATHWAY | Visual signal transduction: Cones |
| 0.0 | 2.1 | PID CMYB PATHWAY | C-MYB transcription factor network |
| 0.0 | 1.0 | PID BCR 5PATHWAY | BCR signaling pathway |
| 0.0 | 0.3 | PID ARF 3PATHWAY | Arf1 pathway |
| 0.0 | 0.3 | PID INSULIN GLUCOSE PATHWAY | Insulin-mediated glucose transport |
| 0.0 | 0.6 | ST P38 MAPK PATHWAY | p38 MAPK Pathway |
Gene overrepresentation in curated gene sets: REACTOME pathways category:
| Log-likelihood per target | Total log-likelihood | Term | Description |
|---|---|---|---|
| 0.1 | 0.5 | REACTOME E2F ENABLED INHIBITION OF PRE REPLICATION COMPLEX FORMATION | Genes involved in E2F-enabled inhibition of pre-replication complex formation |
| 0.1 | 1.3 | REACTOME CDC6 ASSOCIATION WITH THE ORC ORIGIN COMPLEX | Genes involved in CDC6 association with the ORC:origin complex |
| 0.1 | 0.2 | REACTOME PROLONGED ERK ACTIVATION EVENTS | Genes involved in Prolonged ERK activation events |
| 0.0 | 0.6 | REACTOME PROSTANOID LIGAND RECEPTORS | Genes involved in Prostanoid ligand receptors |
| 0.0 | 1.4 | REACTOME OTHER SEMAPHORIN INTERACTIONS | Genes involved in Other semaphorin interactions |
| 0.0 | 1.1 | REACTOME N GLYCAN ANTENNAE ELONGATION | Genes involved in N-Glycan antennae elongation |
| 0.0 | 0.9 | REACTOME PHOSPHORYLATION OF CD3 AND TCR ZETA CHAINS | Genes involved in Phosphorylation of CD3 and TCR zeta chains |
| 0.0 | 1.1 | REACTOME TRAF6 MEDIATED NFKB ACTIVATION | Genes involved in TRAF6 mediated NF-kB activation |
| 0.0 | 0.3 | REACTOME ENDOSOMAL VACUOLAR PATHWAY | Genes involved in Endosomal/Vacuolar pathway |
| 0.0 | 1.4 | REACTOME REGULATION OF GENE EXPRESSION IN BETA CELLS | Genes involved in Regulation of gene expression in beta cells |
| 0.0 | 1.6 | REACTOME SYNTHESIS OF PIPS AT THE PLASMA MEMBRANE | Genes involved in Synthesis of PIPs at the plasma membrane |
| 0.0 | 2.8 | REACTOME NRAGE SIGNALS DEATH THROUGH JNK | Genes involved in NRAGE signals death through JNK |
| 0.0 | 0.9 | REACTOME SIGNALING BY NODAL | Genes involved in Signaling by NODAL |
| 0.0 | 0.8 | REACTOME PLATELET SENSITIZATION BY LDL | Genes involved in Platelet sensitization by LDL |
| 0.0 | 0.6 | REACTOME G BETA GAMMA SIGNALLING THROUGH PI3KGAMMA | Genes involved in G beta:gamma signalling through PI3Kgamma |
| 0.0 | 0.8 | REACTOME SMAD2 SMAD3 SMAD4 HETEROTRIMER REGULATES TRANSCRIPTION | Genes involved in SMAD2/SMAD3:SMAD4 heterotrimer regulates transcription |
| 0.0 | 0.5 | REACTOME YAP1 AND WWTR1 TAZ STIMULATED GENE EXPRESSION | Genes involved in YAP1- and WWTR1 (TAZ)-stimulated gene expression |
| 0.0 | 1.5 | REACTOME NOTCH1 INTRACELLULAR DOMAIN REGULATES TRANSCRIPTION | Genes involved in NOTCH1 Intracellular Domain Regulates Transcription |
| 0.0 | 0.2 | REACTOME SYNTHESIS OF PIPS AT THE EARLY ENDOSOME MEMBRANE | Genes involved in Synthesis of PIPs at the early endosome membrane |
| 0.0 | 0.7 | REACTOME GLYCOLYSIS | Genes involved in Glycolysis |
| 0.0 | 4.0 | REACTOME ANTIGEN PROCESSING UBIQUITINATION PROTEASOME DEGRADATION | Genes involved in Antigen processing: Ubiquitination & Proteasome degradation |
| 0.0 | 0.3 | REACTOME TRAF6 MEDIATED IRF7 ACTIVATION | Genes involved in TRAF6 mediated IRF7 activation |