Project
Illumina Body Map 2 (GSE30611)
Navigation
Downloads
Results for ACAUUCA
Z-value: 1.03
Motif logo

miRNA associated with seed ACAUUCA
| Name | miRBASE accession |
|---|---|
|
hsa-miR-181a-5p
|
MIMAT0000256 |
|
hsa-miR-181b-5p
|
MIMAT0000257 |
|
hsa-miR-181c-5p
|
MIMAT0000258 |
|
hsa-miR-181d-5p
|
MIMAT0002821 |
|
hsa-miR-4262
|
MIMAT0016894 |
Activity profile of ACAUUCA motif
Sorted Z-values of ACAUUCA motif
| Promoter | Log-likelihood | Transcript | Gene | Gene Info |
|---|---|---|---|---|
| chr17_-_10026265 | 2.46 |
ENST00000437099.6
ENST00000396115.6 |
GAS7
|
growth arrest specific 7 |
| chr20_+_10218808 | 2.38 |
ENST00000254976.7
ENST00000304886.6 |
SNAP25
|
synaptosome associated protein 25 |
| chr7_+_30134956 | 2.05 |
ENST00000324453.13
ENST00000409688.1 |
MTURN
|
maturin, neural progenitor differentiation regulator homolog |
| chr1_+_50108856 | 1.95 |
ENST00000650764.1
ENST00000494555.2 ENST00000371824.7 ENST00000371823.8 ENST00000652693.1 |
ELAVL4
|
ELAV like RNA binding protein 4 |
| chr10_-_73874502 | 1.84 |
ENST00000372765.5
ENST00000351293.7 ENST00000441192.2 ENST00000423381.6 |
CAMK2G
|
calcium/calmodulin dependent protein kinase II gamma |
| chr5_-_132737518 | 1.83 |
ENST00000403231.6
ENST00000378735.5 ENST00000618515.4 ENST00000378746.8 |
KIF3A
|
kinesin family member 3A |
| chr22_+_41976933 | 1.83 |
ENST00000396425.7
|
SEPTIN3
|
septin 3 |
| chr22_-_38844020 | 1.82 |
ENST00000333039.4
|
NPTXR
|
neuronal pentraxin receptor |
| chr13_-_25172278 | 1.81 |
ENST00000515384.2
ENST00000357816.2 |
AMER2
|
APC membrane recruitment protein 2 |
| chr5_+_58583068 | 1.72 |
ENST00000282878.6
|
RAB3C
|
RAB3C, member RAS oncogene family |
| chr5_-_96433214 | 1.70 |
ENST00000311106.8
|
PCSK1
|
proprotein convertase subtilisin/kexin type 1 |
| chr14_+_90397019 | 1.65 |
ENST00000447653.8
ENST00000356978.9 ENST00000626705.2 |
CALM1
|
calmodulin 1 |
| chr5_+_157460173 | 1.63 |
ENST00000435489.7
ENST00000311946.8 |
NIPAL4
|
NIPA like domain containing 4 |
| chr6_+_44270434 | 1.61 |
ENST00000451188.7
|
TMEM151B
|
transmembrane protein 151B |
| chr6_+_117907226 | 1.59 |
ENST00000360388.9
|
SLC35F1
|
solute carrier family 35 member F1 |
| chr4_-_46993520 | 1.53 |
ENST00000264318.4
|
GABRA4
|
gamma-aminobutyric acid type A receptor subunit alpha4 |
| chr8_-_59119121 | 1.53 |
ENST00000361421.2
|
TOX
|
thymocyte selection associated high mobility group box |
| chr6_+_123803853 | 1.52 |
ENST00000368417.6
|
NKAIN2
|
sodium/potassium transporting ATPase interacting 2 |
| chr5_+_83471736 | 1.51 |
ENST00000265077.8
|
VCAN
|
versican |
| chr17_+_44758958 | 1.51 |
ENST00000200557.11
|
ADAM11
|
ADAM metallopeptidase domain 11 |
| chr17_+_45894515 | 1.48 |
ENST00000680674.1
ENST00000535772.6 ENST00000351559.10 ENST00000262410.10 ENST00000344290.10 |
MAPT
|
microtubule associated protein tau |
| chr16_+_11668414 | 1.48 |
ENST00000329565.6
|
SNN
|
stannin |
| chr1_-_72282457 | 1.44 |
ENST00000357731.10
|
NEGR1
|
neuronal growth regulator 1 |
| chr18_+_57352541 | 1.43 |
ENST00000324000.4
|
ST8SIA3
|
ST8 alpha-N-acetyl-neuraminide alpha-2,8-sialyltransferase 3 |
| chr9_-_89178810 | 1.42 |
ENST00000375835.9
|
SHC3
|
SHC adaptor protein 3 |
| chr19_+_589873 | 1.40 |
ENST00000251287.3
|
HCN2
|
hyperpolarization activated cyclic nucleotide gated potassium and sodium channel 2 |
| chr9_+_74497308 | 1.37 |
ENST00000376896.8
|
RORB
|
RAR related orphan receptor B |
| chr2_-_50347710 | 1.34 |
ENST00000342183.9
ENST00000401710.5 |
NRXN1
|
neurexin 1 |
| chr8_+_26577843 | 1.34 |
ENST00000311151.9
|
DPYSL2
|
dihydropyrimidinase like 2 |
| chr2_-_40452046 | 1.34 |
ENST00000406785.6
|
SLC8A1
|
solute carrier family 8 member A1 |
| chr7_+_153887081 | 1.34 |
ENST00000404039.5
|
DPP6
|
dipeptidyl peptidase like 6 |
| chr22_-_44312894 | 1.32 |
ENST00000381176.5
|
SHISAL1
|
shisa like 1 |
| chr1_-_84690406 | 1.31 |
ENST00000605755.5
ENST00000342203.8 ENST00000437941.6 |
SSX2IP
|
SSX family member 2 interacting protein |
| chr15_+_43510945 | 1.25 |
ENST00000382031.5
|
MAP1A
|
microtubule associated protein 1A |
| chr4_-_173334249 | 1.25 |
ENST00000506267.1
ENST00000296503.10 |
HMGB2
|
high mobility group box 2 |
| chr6_-_99349647 | 1.22 |
ENST00000389677.6
|
FAXC
|
failed axon connections homolog, metaxin like GST domain containing |
| chr5_-_45696326 | 1.21 |
ENST00000673735.1
ENST00000303230.6 |
HCN1
|
hyperpolarization activated cyclic nucleotide gated potassium channel 1 |
| chr3_-_119146014 | 1.20 |
ENST00000441144.6
ENST00000425327.6 |
IGSF11
|
immunoglobulin superfamily member 11 |
| chr12_-_62192762 | 1.20 |
ENST00000416284.8
|
TAFA2
|
TAFA chemokine like family member 2 |
| chr7_+_141074038 | 1.20 |
ENST00000565468.6
ENST00000610315.1 |
TMEM178B
|
transmembrane protein 178B |
| chr2_+_167868948 | 1.20 |
ENST00000392690.3
|
B3GALT1
|
beta-1,3-galactosyltransferase 1 |
| chr5_+_132813283 | 1.16 |
ENST00000378693.4
|
SOWAHA
|
sosondowah ankyrin repeat domain family member A |
| chr5_+_80035341 | 1.13 |
ENST00000350881.6
|
THBS4
|
thrombospondin 4 |
| chr15_-_51622798 | 1.11 |
ENST00000251076.9
|
DMXL2
|
Dmx like 2 |
| chr19_+_30372364 | 1.10 |
ENST00000355537.4
|
ZNF536
|
zinc finger protein 536 |
| chr3_+_32106612 | 1.09 |
ENST00000282541.10
ENST00000425459.5 ENST00000431009.1 |
GPD1L
|
glycerol-3-phosphate dehydrogenase 1 like |
| chr1_-_83999097 | 1.08 |
ENST00000260505.13
ENST00000610996.1 |
TTLL7
|
tubulin tyrosine ligase like 7 |
| chr4_-_42657085 | 1.08 |
ENST00000264449.14
ENST00000510289.1 ENST00000381668.9 |
ATP8A1
|
ATPase phospholipid transporting 8A1 |
| chr2_+_190408324 | 1.07 |
ENST00000417958.5
ENST00000432036.5 ENST00000392328.6 |
MFSD6
|
major facilitator superfamily domain containing 6 |
| chr7_+_146116772 | 1.07 |
ENST00000361727.8
|
CNTNAP2
|
contactin associated protein 2 |
| chr6_+_138161932 | 1.06 |
ENST00000251691.5
|
ARFGEF3
|
ARFGEF family member 3 |
| chr11_+_47269641 | 1.06 |
ENST00000428807.5
ENST00000402799.5 ENST00000406482.5 ENST00000349238.7 ENST00000311027.9 ENST00000407859.7 ENST00000395344.7 ENST00000444117.5 |
MADD
|
MAP kinase activating death domain |
| chr1_+_40161355 | 1.05 |
ENST00000372771.5
|
RLF
|
RLF zinc finger |
| chrX_-_153886132 | 1.05 |
ENST00000370055.5
ENST00000370060.7 ENST00000420165.5 |
L1CAM
|
L1 cell adhesion molecule |
| chr16_-_77435006 | 1.03 |
ENST00000282849.10
|
ADAMTS18
|
ADAM metallopeptidase with thrombospondin type 1 motif 18 |
| chr16_-_62036399 | 1.02 |
ENST00000584337.5
|
CDH8
|
cadherin 8 |
| chr10_-_1737516 | 1.02 |
ENST00000381312.6
|
ADARB2
|
adenosine deaminase RNA specific B2 (inactive) |
| chr12_-_75209422 | 1.01 |
ENST00000393288.2
ENST00000540018.5 |
KCNC2
|
potassium voltage-gated channel subfamily C member 2 |
| chr2_-_36966503 | 0.98 |
ENST00000263918.9
|
STRN
|
striatin |
| chr2_-_9003657 | 0.97 |
ENST00000462696.1
ENST00000305997.8 |
MBOAT2
|
membrane bound O-acyltransferase domain containing 2 |
| chr16_+_56191476 | 0.97 |
ENST00000262493.12
|
GNAO1
|
G protein subunit alpha o1 |
| chr14_+_55271344 | 0.96 |
ENST00000681400.1
ENST00000679934.1 ENST00000681904.1 ENST00000313833.5 |
FBXO34
|
F-box protein 34 |
| chr4_+_157220691 | 0.94 |
ENST00000509417.5
ENST00000645636.1 ENST00000296526.12 ENST00000264426.14 |
GRIA2
|
glutamate ionotropic receptor AMPA type subunit 2 |
| chr2_-_171894227 | 0.94 |
ENST00000422440.7
|
SLC25A12
|
solute carrier family 25 member 12 |
| chr20_-_4823597 | 0.93 |
ENST00000379400.8
|
RASSF2
|
Ras association domain family member 2 |
| chr13_-_27969295 | 0.93 |
ENST00000381020.8
|
CDX2
|
caudal type homeobox 2 |
| chr2_-_16665816 | 0.92 |
ENST00000406434.5
ENST00000381323.7 |
CYRIA
|
CYFIP related Rac1 interactor A |
| chr8_+_11284789 | 0.91 |
ENST00000221086.8
|
MTMR9
|
myotubularin related protein 9 |
| chrX_+_28587411 | 0.91 |
ENST00000378993.6
|
IL1RAPL1
|
interleukin 1 receptor accessory protein like 1 |
| chr9_+_100442271 | 0.88 |
ENST00000502978.1
|
MSANTD3-TMEFF1
|
MSANTD3-TMEFF1 readthrough |
| chr11_-_74398378 | 0.88 |
ENST00000298198.5
|
PGM2L1
|
phosphoglucomutase 2 like 1 |
| chr19_+_40191410 | 0.87 |
ENST00000253055.8
|
MAP3K10
|
mitogen-activated protein kinase kinase kinase 10 |
| chr8_-_66613208 | 0.87 |
ENST00000522677.8
|
MYBL1
|
MYB proto-oncogene like 1 |
| chr17_-_40665121 | 0.87 |
ENST00000394052.5
|
KRT222
|
keratin 222 |
| chr5_-_65722094 | 0.87 |
ENST00000381007.9
|
SGTB
|
small glutamine rich tetratricopeptide repeat containing beta |
| chr1_+_101237009 | 0.86 |
ENST00000305352.7
|
S1PR1
|
sphingosine-1-phosphate receptor 1 |
| chr2_-_86563382 | 0.85 |
ENST00000263856.9
|
CHMP3
|
charged multivesicular body protein 3 |
| chr9_-_23821275 | 0.84 |
ENST00000380110.8
|
ELAVL2
|
ELAV like RNA binding protein 2 |
| chr17_+_29390326 | 0.84 |
ENST00000261716.8
|
TAOK1
|
TAO kinase 1 |
| chr7_-_105388881 | 0.83 |
ENST00000460391.5
ENST00000393651.8 |
SRPK2
|
SRSF protein kinase 2 |
| chr12_+_752551 | 0.83 |
ENST00000315939.11
ENST00000340908.9 ENST00000535572.5 |
WNK1
|
WNK lysine deficient protein kinase 1 |
| chr2_+_209771972 | 0.83 |
ENST00000439458.5
ENST00000272845.10 |
UNC80
|
unc-80 homolog, NALCN channel complex subunit |
| chr2_-_221572272 | 0.83 |
ENST00000409854.5
ENST00000443796.5 ENST00000281821.7 |
EPHA4
|
EPH receptor A4 |
| chr3_+_186783567 | 0.82 |
ENST00000323963.10
ENST00000440191.6 |
EIF4A2
|
eukaryotic translation initiation factor 4A2 |
| chr3_+_159839847 | 0.82 |
ENST00000445224.6
|
SCHIP1
|
schwannomin interacting protein 1 |
| chr5_+_140827950 | 0.82 |
ENST00000378126.4
ENST00000529310.6 ENST00000527624.1 |
PCDHA6
|
protocadherin alpha 6 |
| chr8_+_22057857 | 0.82 |
ENST00000517305.4
ENST00000265800.9 ENST00000517418.5 |
DMTN
|
dematin actin binding protein |
| chr11_-_83071819 | 0.82 |
ENST00000524635.1
ENST00000526205.5 ENST00000533486.5 ENST00000533276.6 ENST00000527633.6 |
RAB30
|
RAB30, member RAS oncogene family |
| chr6_+_68635273 | 0.82 |
ENST00000370598.6
|
ADGRB3
|
adhesion G protein-coupled receptor B3 |
| chrX_+_135985416 | 0.81 |
ENST00000370698.7
ENST00000627534.2 ENST00000370695.8 ENST00000630721.3 ENST00000678163.1 |
SLC9A6
|
solute carrier family 9 member A6 |
| chr17_+_28042660 | 0.80 |
ENST00000407008.8
|
NLK
|
nemo like kinase |
| chr12_-_7936177 | 0.80 |
ENST00000544291.1
ENST00000075120.12 |
SLC2A3
|
solute carrier family 2 member 3 |
| chr5_-_109409938 | 0.80 |
ENST00000361189.7
|
PJA2
|
praja ring finger ubiquitin ligase 2 |
| chr4_+_37244735 | 0.80 |
ENST00000309447.6
|
NWD2
|
NACHT and WD repeat domain containing 2 |
| chr22_-_21867610 | 0.79 |
ENST00000215832.11
ENST00000398822.7 |
MAPK1
|
mitogen-activated protein kinase 1 |
| chr15_+_80404320 | 0.79 |
ENST00000303329.9
ENST00000622346.4 |
ARNT2
|
aryl hydrocarbon receptor nuclear translocator 2 |
| chr7_-_28180735 | 0.79 |
ENST00000283928.10
|
JAZF1
|
JAZF zinc finger 1 |
| chr12_-_89656051 | 0.78 |
ENST00000261173.6
|
ATP2B1
|
ATPase plasma membrane Ca2+ transporting 1 |
| chr9_-_136050502 | 0.78 |
ENST00000371753.5
|
NACC2
|
NACC family member 2 |
| chr4_+_150582119 | 0.77 |
ENST00000317605.6
|
MAB21L2
|
mab-21 like 2 |
| chr18_+_8717371 | 0.77 |
ENST00000359865.7
|
MTCL1
|
microtubule crosslinking factor 1 |
| chr6_+_72622047 | 0.77 |
ENST00000370398.6
|
KCNQ5
|
potassium voltage-gated channel subfamily Q member 5 |
| chr11_-_77820706 | 0.77 |
ENST00000440064.2
ENST00000528095.5 ENST00000308488.11 |
RSF1
|
remodeling and spacing factor 1 |
| chr10_+_1049476 | 0.77 |
ENST00000358220.5
|
WDR37
|
WD repeat domain 37 |
| chr11_-_46918522 | 0.75 |
ENST00000378623.6
ENST00000534404.1 |
LRP4
|
LDL receptor related protein 4 |
| chr1_-_211134135 | 0.73 |
ENST00000638983.1
ENST00000271751.10 ENST00000639952.1 |
ENSG00000284299.1
KCNH1
|
novel protein potassium voltage-gated channel subfamily H member 1 |
| chr6_-_110179702 | 0.73 |
ENST00000392587.6
|
WASF1
|
WASP family member 1 |
| chr3_-_179451387 | 0.73 |
ENST00000675901.1
ENST00000232564.8 ENST00000674862.1 ENST00000497513.1 |
GNB4
|
G protein subunit beta 4 |
| chr16_+_81035830 | 0.73 |
ENST00000299575.5
|
ATMIN
|
ATM interactor |
| chr18_+_34978244 | 0.73 |
ENST00000436190.6
|
MAPRE2
|
microtubule associated protein RP/EB family member 2 |
| chr18_-_34224871 | 0.71 |
ENST00000261592.10
|
NOL4
|
nucleolar protein 4 |
| chr10_+_127907036 | 0.71 |
ENST00000254667.8
ENST00000442830.5 |
PTPRE
|
protein tyrosine phosphatase receptor type E |
| chr14_-_93788475 | 0.70 |
ENST00000393140.6
|
PRIMA1
|
proline rich membrane anchor 1 |
| chr2_-_86721122 | 0.70 |
ENST00000604011.5
|
RNF103-CHMP3
|
RNF103-CHMP3 readthrough |
| chrX_-_119943732 | 0.69 |
ENST00000371410.5
|
NKAP
|
NFKB activating protein |
| chr4_-_99946579 | 0.69 |
ENST00000610281.1
ENST00000442697.7 |
DNAJB14
|
DnaJ heat shock protein family (Hsp40) member B14 |
| chr1_+_99264473 | 0.68 |
ENST00000370185.9
|
PLPPR4
|
phospholipid phosphatase related 4 |
| chr12_-_76559504 | 0.68 |
ENST00000547544.5
ENST00000393249.6 |
OSBPL8
|
oxysterol binding protein like 8 |
| chr5_+_10564064 | 0.68 |
ENST00000296657.7
|
ANKRD33B
|
ankyrin repeat domain 33B |
| chr20_+_46029206 | 0.67 |
ENST00000243964.7
|
SLC12A5
|
solute carrier family 12 member 5 |
| chr14_+_105314711 | 0.67 |
ENST00000447393.6
ENST00000547217.5 |
PACS2
|
phosphofurin acidic cluster sorting protein 2 |
| chr20_+_11890723 | 0.66 |
ENST00000254977.7
|
BTBD3
|
BTB domain containing 3 |
| chr5_-_79512794 | 0.66 |
ENST00000282260.10
ENST00000508576.5 ENST00000535690.1 |
HOMER1
|
homer scaffold protein 1 |
| chr4_+_153204410 | 0.66 |
ENST00000675838.1
ENST00000674967.1 ENST00000632856.2 ENST00000441616.6 ENST00000433687.2 ENST00000494872.6 ENST00000460908.2 ENST00000675780.1 ENST00000674976.1 ENST00000338700.10 ENST00000675293.1 ENST00000676172.1 ENST00000675673.1 ENST00000675492.1 ENST00000675425.1 ENST00000675384.1 ENST00000675063.1 ENST00000675340.1 ENST00000675835.1 ENST00000675054.1 ENST00000675710.1 ENST00000502281.3 |
ENSG00000288637.1
TRIM2
|
novel protein tripartite motif containing 2 |
| chr5_+_144205250 | 0.65 |
ENST00000507359.3
|
KCTD16
|
potassium channel tetramerization domain containing 16 |
| chr12_+_50504970 | 0.64 |
ENST00000301180.10
|
DIP2B
|
disco interacting protein 2 homolog B |
| chr15_-_30991595 | 0.64 |
ENST00000435680.6
|
MTMR10
|
myotubularin related protein 10 |
| chr3_-_138834752 | 0.64 |
ENST00000477593.5
ENST00000483968.5 |
PIK3CB
|
phosphatidylinositol-4,5-bisphosphate 3-kinase catalytic subunit beta |
| chr12_+_121400041 | 0.63 |
ENST00000361234.9
ENST00000613529.4 |
RNF34
|
ring finger protein 34 |
| chr17_-_7479616 | 0.63 |
ENST00000380599.9
|
ZBTB4
|
zinc finger and BTB domain containing 4 |
| chr6_+_15246054 | 0.62 |
ENST00000341776.7
|
JARID2
|
jumonji and AT-rich interaction domain containing 2 |
| chr19_-_4066892 | 0.62 |
ENST00000322357.9
|
ZBTB7A
|
zinc finger and BTB domain containing 7A |
| chr18_-_5543988 | 0.62 |
ENST00000341928.7
|
EPB41L3
|
erythrocyte membrane protein band 4.1 like 3 |
| chr6_+_4889992 | 0.62 |
ENST00000343762.5
|
CDYL
|
chromodomain Y like |
| chr13_-_83882390 | 0.61 |
ENST00000377084.3
|
SLITRK1
|
SLIT and NTRK like family member 1 |
| chr20_+_44885679 | 0.60 |
ENST00000353703.9
ENST00000372839.7 ENST00000428262.1 ENST00000445830.1 |
YWHAB
|
tyrosine 3-monooxygenase/tryptophan 5-monooxygenase activation protein beta |
| chr2_+_60756226 | 0.60 |
ENST00000238714.8
|
PAPOLG
|
poly(A) polymerase gamma |
| chr6_+_163414637 | 0.60 |
ENST00000453779.6
ENST00000275262.11 ENST00000392127.6 |
QKI
|
QKI, KH domain containing RNA binding |
| chr14_+_64465491 | 0.60 |
ENST00000394718.4
|
AKAP5
|
A-kinase anchoring protein 5 |
| chr10_+_97584347 | 0.59 |
ENST00000370649.3
ENST00000370646.9 |
ENSG00000249967.1
HOGA1
|
novel protein 4-hydroxy-2-oxoglutarate aldolase 1 |
| chr17_+_56593685 | 0.59 |
ENST00000332822.6
|
NOG
|
noggin |
| chr3_-_171460368 | 0.58 |
ENST00000436636.7
ENST00000465393.1 ENST00000341852.10 |
TNIK
|
TRAF2 and NCK interacting kinase |
| chr5_+_72107453 | 0.58 |
ENST00000296755.12
ENST00000511641.2 |
MAP1B
|
microtubule associated protein 1B |
| chr17_+_47649899 | 0.57 |
ENST00000290158.9
|
KPNB1
|
karyopherin subunit beta 1 |
| chr6_-_93419545 | 0.56 |
ENST00000369297.1
ENST00000369303.9 ENST00000680224.1 ENST00000681532.1 ENST00000679565.1 |
EPHA7
|
EPH receptor A7 |
| chr15_-_93073111 | 0.56 |
ENST00000557420.1
ENST00000542321.6 |
RGMA
|
repulsive guidance molecule BMP co-receptor a |
| chr5_+_102755269 | 0.56 |
ENST00000304400.12
ENST00000455264.7 ENST00000684529.1 ENST00000438793.8 ENST00000682882.1 ENST00000682972.1 ENST00000348126.7 ENST00000512073.1 |
PAM
|
peptidylglycine alpha-amidating monooxygenase |
| chr8_+_38176802 | 0.56 |
ENST00000287322.5
|
BAG4
|
BAG cochaperone 4 |
| chr7_-_76358982 | 0.56 |
ENST00000307630.5
|
YWHAG
|
tyrosine 3-monooxygenase/tryptophan 5-monooxygenase activation protein gamma |
| chr9_-_3525968 | 0.56 |
ENST00000382004.7
ENST00000617270.5 ENST00000449190.5 |
RFX3
|
regulatory factor X3 |
| chrX_-_78139612 | 0.55 |
ENST00000341864.6
|
TAF9B
|
TATA-box binding protein associated factor 9b |
| chr5_+_140841183 | 0.55 |
ENST00000378123.4
ENST00000531613.2 |
PCDHA8
|
protocadherin alpha 8 |
| chrX_+_154437147 | 0.54 |
ENST00000447750.7
|
GDI1
|
GDP dissociation inhibitor 1 |
| chr4_+_47031551 | 0.54 |
ENST00000295454.8
|
GABRB1
|
gamma-aminobutyric acid type A receptor subunit beta1 |
| chr1_-_37034492 | 0.54 |
ENST00000373091.8
|
GRIK3
|
glutamate ionotropic receptor kainate type subunit 3 |
| chrX_-_53281609 | 0.54 |
ENST00000638630.1
ENST00000375365.2 |
IQSEC2
|
IQ motif and Sec7 domain ArfGEF 2 |
| chrX_+_73563190 | 0.54 |
ENST00000373504.10
ENST00000373502.9 |
CHIC1
|
cysteine rich hydrophobic domain 1 |
| chr2_-_121649431 | 0.54 |
ENST00000455322.6
ENST00000409078.8 ENST00000263710.8 ENST00000397587.7 ENST00000541377.5 |
CLASP1
|
cytoplasmic linker associated protein 1 |
| chr11_-_95231046 | 0.54 |
ENST00000416495.6
ENST00000536441.7 |
SESN3
|
sestrin 3 |
| chrX_+_21374357 | 0.53 |
ENST00000643841.1
ENST00000379510.5 ENST00000425654.7 ENST00000644798.1 ENST00000543067.6 |
CNKSR2
|
connector enhancer of kinase suppressor of Ras 2 |
| chr2_-_69643703 | 0.53 |
ENST00000406297.7
ENST00000409085.9 |
AAK1
|
AP2 associated kinase 1 |
| chr12_+_94148553 | 0.53 |
ENST00000258526.9
|
PLXNC1
|
plexin C1 |
| chr12_+_67648737 | 0.53 |
ENST00000344096.4
ENST00000393555.3 |
DYRK2
|
dual specificity tyrosine phosphorylation regulated kinase 2 |
| chr10_+_115093331 | 0.52 |
ENST00000609571.5
ENST00000355044.8 ENST00000526946.5 |
ATRNL1
|
attractin like 1 |
| chr5_+_140868945 | 0.52 |
ENST00000398640.7
|
PCDHA11
|
protocadherin alpha 11 |
| chr5_+_140966466 | 0.52 |
ENST00000615316.1
ENST00000289269.7 |
PCDHAC2
|
protocadherin alpha subfamily C, 2 |
| chr15_+_66386902 | 0.52 |
ENST00000307102.10
|
MAP2K1
|
mitogen-activated protein kinase kinase 1 |
| chr1_+_233904656 | 0.51 |
ENST00000366618.8
|
SLC35F3
|
solute carrier family 35 member F3 |
| chr1_+_203305510 | 0.51 |
ENST00000290551.5
|
BTG2
|
BTG anti-proliferation factor 2 |
| chr16_+_55509006 | 0.51 |
ENST00000262134.10
|
LPCAT2
|
lysophosphatidylcholine acyltransferase 2 |
| chr3_+_158571171 | 0.51 |
ENST00000484955.5
ENST00000359117.9 ENST00000619577.5 ENST00000471745.5 ENST00000477042.6 ENST00000650753.1 ENST00000651984.1 ENST00000355893.11 ENST00000466246.7 ENST00000469452.5 ENST00000482628.5 |
MLF1
|
myeloid leukemia factor 1 |
| chr18_-_12658052 | 0.51 |
ENST00000409402.8
|
SPIRE1
|
spire type actin nucleation factor 1 |
| chr5_+_140848360 | 0.51 |
ENST00000532602.2
|
PCDHA9
|
protocadherin alpha 9 |
| chr15_+_45587366 | 0.50 |
ENST00000220531.9
|
BLOC1S6
|
biogenesis of lysosomal organelles complex 1 subunit 6 |
| chr12_+_67269328 | 0.50 |
ENST00000545606.6
|
CAND1
|
cullin associated and neddylation dissociated 1 |
| chr6_-_136289824 | 0.50 |
ENST00000527536.5
ENST00000529826.5 ENST00000531224.6 ENST00000353331.8 ENST00000628517.2 |
BCLAF1
|
BCL2 associated transcription factor 1 |
| chr2_-_68252482 | 0.49 |
ENST00000234310.8
|
PPP3R1
|
protein phosphatase 3 regulatory subunit B, alpha |
| chr16_+_58463663 | 0.49 |
ENST00000258187.9
|
NDRG4
|
NDRG family member 4 |
| chr12_+_108131740 | 0.49 |
ENST00000332082.8
|
WSCD2
|
WSC domain containing 2 |
| chr13_+_99981775 | 0.49 |
ENST00000376335.8
|
ZIC2
|
Zic family member 2 |
| chr1_-_31065671 | 0.48 |
ENST00000440538.6
ENST00000424085.6 ENST00000257075.9 ENST00000373747.7 ENST00000426105.7 ENST00000525843.5 ENST00000373742.6 |
PUM1
|
pumilio RNA binding family member 1 |
| chr7_-_95596507 | 0.48 |
ENST00000005178.6
|
PDK4
|
pyruvate dehydrogenase kinase 4 |
| chr2_-_157628852 | 0.48 |
ENST00000243349.13
|
ACVR1C
|
activin A receptor type 1C |
| chr3_-_195442977 | 0.47 |
ENST00000326793.11
|
ACAP2
|
ArfGAP with coiled-coil, ankyrin repeat and PH domains 2 |
| chr11_-_30016945 | 0.47 |
ENST00000328224.7
|
KCNA4
|
potassium voltage-gated channel subfamily A member 4 |
| chr19_-_36418625 | 0.47 |
ENST00000392161.4
|
ZFP82
|
ZFP82 zinc finger protein |
| chr5_-_83720813 | 0.47 |
ENST00000515590.1
ENST00000274341.9 |
HAPLN1
|
hyaluronan and proteoglycan link protein 1 |
| chr6_+_147204405 | 0.47 |
ENST00000546097.5
ENST00000367481.7 |
STXBP5
|
syntaxin binding protein 5 |
| chr16_-_85011463 | 0.46 |
ENST00000564466.5
ENST00000313732.9 |
ZDHHC7
|
zinc finger DHHC-type palmitoyltransferase 7 |
| chr10_-_80205551 | 0.46 |
ENST00000372231.7
ENST00000438331.5 |
ANXA11
|
annexin A11 |
| chr6_+_43243468 | 0.46 |
ENST00000259750.9
|
TTBK1
|
tau tubulin kinase 1 |
| chr2_+_112275588 | 0.46 |
ENST00000409871.6
ENST00000343936.4 |
ZC3H6
|
zinc finger CCCH-type containing 6 |
| chr8_-_104588998 | 0.46 |
ENST00000424843.6
|
LRP12
|
LDL receptor related protein 12 |
| chr13_-_77327050 | 0.45 |
ENST00000684354.1
ENST00000682321.1 ENST00000683823.1 ENST00000683697.1 ENST00000357337.11 ENST00000544440.7 |
MYCBP2
|
MYC binding protein 2 |
| chr9_+_99105098 | 0.45 |
ENST00000374990.6
ENST00000374994.9 ENST00000552516.5 |
TGFBR1
|
transforming growth factor beta receptor 1 |
| chr6_+_139135063 | 0.45 |
ENST00000367658.3
|
HECA
|
hdc homolog, cell cycle regulator |
| chr9_+_100473140 | 0.45 |
ENST00000374879.5
|
TMEFF1
|
transmembrane protein with EGF like and two follistatin like domains 1 |
| chr5_+_140821598 | 0.45 |
ENST00000614258.1
ENST00000529859.2 ENST00000529619.5 |
PCDHA5
|
protocadherin alpha 5 |
| chr20_+_5126988 | 0.45 |
ENST00000460006.6
|
CDS2
|
CDP-diacylglycerol synthase 2 |
| chr11_-_117098415 | 0.44 |
ENST00000445177.6
ENST00000375300.6 ENST00000446921.6 |
SIK3
|
SIK family kinase 3 |
Network of associatons between targets according to the STRING database.

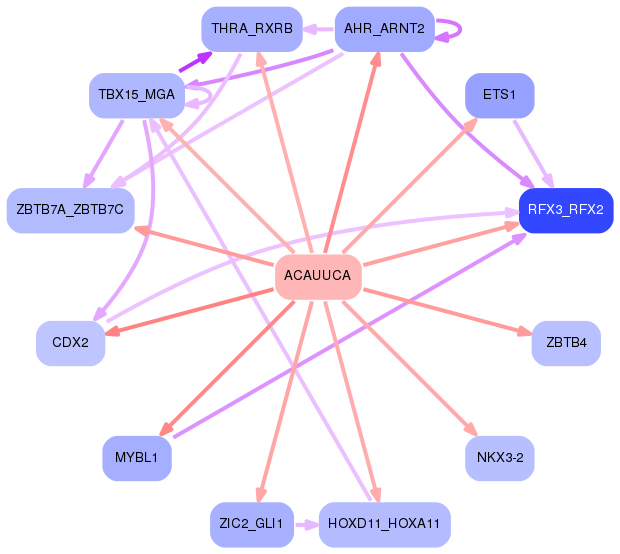
First level regulatory network of ACAUUCA
Gene Ontology Analysis
Gene overrepresentation in biological process category:
| Log-likelihood per target | Total log-likelihood | Term | Description |
|---|---|---|---|
| 0.6 | 2.4 | GO:1990926 | short-term synaptic potentiation(GO:1990926) |
| 0.3 | 0.9 | GO:0043490 | malate-aspartate shuttle(GO:0043490) |
| 0.3 | 0.3 | GO:2001025 | positive regulation of response to drug(GO:2001025) |
| 0.3 | 0.8 | GO:0019858 | cytosine metabolic process(GO:0019858) |
| 0.3 | 1.0 | GO:0038060 | nitric oxide-cGMP-mediated signaling pathway(GO:0038060) |
| 0.3 | 0.8 | GO:1904395 | positive regulation of skeletal muscle acetylcholine-gated channel clustering(GO:1904395) |
| 0.2 | 1.1 | GO:0071603 | endothelial cell-cell adhesion(GO:0071603) |
| 0.2 | 0.9 | GO:0061763 | multivesicular body-lysosome fusion(GO:0061763) |
| 0.2 | 0.6 | GO:2000374 | regulation of oxygen metabolic process(GO:2000374) |
| 0.2 | 1.5 | GO:0090258 | negative regulation of mitochondrial fission(GO:0090258) |
| 0.2 | 0.8 | GO:0097156 | fasciculation of motor neuron axon(GO:0097156) |
| 0.2 | 0.6 | GO:0060302 | negative regulation of cytokine activity(GO:0060302) negative regulation of epithelial to mesenchymal transition involved in endocardial cushion formation(GO:1905006) |
| 0.2 | 1.5 | GO:2001023 | regulation of response to drug(GO:2001023) |
| 0.2 | 0.6 | GO:0090365 | regulation of mRNA modification(GO:0090365) |
| 0.2 | 1.1 | GO:0061092 | regulation of phospholipid translocation(GO:0061091) positive regulation of phospholipid translocation(GO:0061092) |
| 0.2 | 0.9 | GO:0003245 | cardiac muscle tissue growth involved in heart morphogenesis(GO:0003245) |
| 0.2 | 0.7 | GO:0040040 | thermosensory behavior(GO:0040040) |
| 0.2 | 0.3 | GO:1904017 | cellular response to Thyroglobulin triiodothyronine(GO:1904017) |
| 0.2 | 2.6 | GO:0046549 | retinal cone cell differentiation(GO:0042670) retinal cone cell development(GO:0046549) |
| 0.2 | 0.5 | GO:1901383 | negative regulation of chorionic trophoblast cell proliferation(GO:1901383) |
| 0.2 | 0.8 | GO:0070837 | dehydroascorbic acid transport(GO:0070837) |
| 0.2 | 1.1 | GO:0090038 | negative regulation of protein kinase C signaling(GO:0090038) |
| 0.1 | 0.6 | GO:0009436 | glyoxylate catabolic process(GO:0009436) |
| 0.1 | 0.6 | GO:0072560 | type B pancreatic cell maturation(GO:0072560) |
| 0.1 | 0.8 | GO:0035063 | nuclear speck organization(GO:0035063) |
| 0.1 | 0.8 | GO:0023016 | signal transduction by trans-phosphorylation(GO:0023016) |
| 0.1 | 1.6 | GO:0007256 | activation of JNKK activity(GO:0007256) |
| 0.1 | 1.1 | GO:0071109 | superior temporal gyrus development(GO:0071109) |
| 0.1 | 1.6 | GO:0032482 | Rab protein signal transduction(GO:0032482) |
| 0.1 | 0.7 | GO:0007206 | phospholipase C-activating G-protein coupled glutamate receptor signaling pathway(GO:0007206) |
| 0.1 | 1.8 | GO:0034454 | microtubule anchoring at centrosome(GO:0034454) |
| 0.1 | 0.6 | GO:0033031 | positive regulation of neutrophil apoptotic process(GO:0033031) |
| 0.1 | 0.4 | GO:0045925 | positive regulation of female receptivity(GO:0045925) |
| 0.1 | 0.4 | GO:0060623 | regulation of chromosome condensation(GO:0060623) cellular response to iron(III) ion(GO:0071283) |
| 0.1 | 3.2 | GO:0097369 | sodium ion import(GO:0097369) |
| 0.1 | 0.8 | GO:0099558 | maintenance of synapse structure(GO:0099558) |
| 0.1 | 0.5 | GO:1905071 | occluding junction disassembly(GO:1905071) regulation of occluding junction disassembly(GO:1905073) positive regulation of occluding junction disassembly(GO:1905075) |
| 0.1 | 0.3 | GO:0006391 | transcription initiation from mitochondrial promoter(GO:0006391) |
| 0.1 | 0.4 | GO:1902683 | regulation of receptor localization to synapse(GO:1902683) |
| 0.1 | 0.3 | GO:0090176 | microtubule cytoskeleton organization involved in establishment of planar polarity(GO:0090176) |
| 0.1 | 1.6 | GO:0015693 | magnesium ion transport(GO:0015693) |
| 0.1 | 1.2 | GO:0006682 | galactosylceramide biosynthetic process(GO:0006682) galactolipid biosynthetic process(GO:0019375) |
| 0.1 | 0.6 | GO:0071955 | recycling endosome to Golgi transport(GO:0071955) |
| 0.1 | 0.7 | GO:1902857 | positive regulation of nonmotile primary cilium assembly(GO:1902857) |
| 0.1 | 0.9 | GO:0014807 | regulation of somitogenesis(GO:0014807) |
| 0.1 | 0.3 | GO:0035281 | pre-miRNA export from nucleus(GO:0035281) |
| 0.1 | 0.4 | GO:0006663 | platelet activating factor biosynthetic process(GO:0006663) |
| 0.1 | 1.3 | GO:0097116 | gephyrin clustering involved in postsynaptic density assembly(GO:0097116) |
| 0.1 | 0.8 | GO:0071386 | cellular response to corticosterone stimulus(GO:0071386) |
| 0.1 | 0.8 | GO:1902231 | positive regulation of intrinsic apoptotic signaling pathway in response to DNA damage(GO:1902231) |
| 0.1 | 1.7 | GO:0001574 | ganglioside biosynthetic process(GO:0001574) |
| 0.1 | 0.5 | GO:0090170 | regulation of Golgi inheritance(GO:0090170) |
| 0.1 | 0.8 | GO:0016584 | nucleosome positioning(GO:0016584) |
| 0.1 | 1.1 | GO:0018095 | protein polyglutamylation(GO:0018095) |
| 0.1 | 0.6 | GO:0031291 | Ran protein signal transduction(GO:0031291) |
| 0.1 | 0.6 | GO:0018032 | protein amidation(GO:0018032) |
| 0.1 | 0.2 | GO:0035668 | TRAM-dependent toll-like receptor signaling pathway(GO:0035668) TRAM-dependent toll-like receptor 4 signaling pathway(GO:0035669) |
| 0.1 | 1.2 | GO:0045654 | positive regulation of megakaryocyte differentiation(GO:0045654) |
| 0.1 | 0.4 | GO:0032848 | negative regulation of cellular pH reduction(GO:0032848) CD8-positive, alpha-beta T cell lineage commitment(GO:0043375) negative regulation of retinal cell programmed cell death(GO:0046671) |
| 0.1 | 0.5 | GO:0051534 | negative regulation of NFAT protein import into nucleus(GO:0051534) |
| 0.1 | 0.4 | GO:0035106 | operant conditioning(GO:0035106) |
| 0.1 | 1.0 | GO:2000576 | positive regulation of microtubule motor activity(GO:2000576) |
| 0.1 | 0.8 | GO:0070560 | protein secretion by platelet(GO:0070560) |
| 0.1 | 0.4 | GO:0015853 | adenine transport(GO:0015853) |
| 0.1 | 0.7 | GO:0000160 | phosphorelay signal transduction system(GO:0000160) |
| 0.1 | 0.1 | GO:0045196 | establishment or maintenance of neuroblast polarity(GO:0045196) establishment of neuroblast polarity(GO:0045200) |
| 0.1 | 0.2 | GO:0072720 | response to dithiothreitol(GO:0072720) |
| 0.1 | 0.5 | GO:0002318 | myeloid progenitor cell differentiation(GO:0002318) |
| 0.1 | 0.6 | GO:0030578 | PML body organization(GO:0030578) |
| 0.1 | 0.4 | GO:0033563 | dorsal/ventral axon guidance(GO:0033563) |
| 0.1 | 0.2 | GO:2000845 | testosterone secretion(GO:0035936) regulation of testosterone secretion(GO:2000843) positive regulation of testosterone secretion(GO:2000845) |
| 0.1 | 1.8 | GO:1901897 | regulation of relaxation of cardiac muscle(GO:1901897) |
| 0.1 | 1.1 | GO:0015074 | DNA integration(GO:0015074) |
| 0.1 | 0.3 | GO:0044861 | protein transport into plasma membrane raft(GO:0044861) |
| 0.1 | 0.2 | GO:0036215 | response to stem cell factor(GO:0036215) cellular response to stem cell factor stimulus(GO:0036216) Kit signaling pathway(GO:0038109) |
| 0.1 | 0.2 | GO:1990168 | protein K27-linked deubiquitination(GO:1990167) protein K33-linked deubiquitination(GO:1990168) |
| 0.1 | 0.1 | GO:1902954 | regulation of early endosome to recycling endosome transport(GO:1902954) |
| 0.1 | 0.2 | GO:0021764 | amygdala development(GO:0021764) |
| 0.1 | 0.7 | GO:2000601 | positive regulation of Arp2/3 complex-mediated actin nucleation(GO:2000601) |
| 0.1 | 0.7 | GO:0090204 | protein localization to nuclear pore(GO:0090204) |
| 0.1 | 0.5 | GO:0010265 | SCF complex assembly(GO:0010265) |
| 0.1 | 0.4 | GO:0001920 | negative regulation of receptor recycling(GO:0001920) |
| 0.1 | 0.3 | GO:0050915 | sensory perception of sour taste(GO:0050915) |
| 0.1 | 0.3 | GO:0071072 | negative regulation of phospholipid biosynthetic process(GO:0071072) |
| 0.1 | 0.2 | GO:0097051 | establishment of protein localization to endoplasmic reticulum membrane(GO:0097051) |
| 0.1 | 1.5 | GO:0030208 | dermatan sulfate biosynthetic process(GO:0030208) |
| 0.1 | 0.5 | GO:0070649 | formin-nucleated actin cable assembly(GO:0070649) |
| 0.0 | 0.6 | GO:0010739 | positive regulation of protein kinase A signaling(GO:0010739) |
| 0.0 | 1.0 | GO:0070070 | proton-transporting V-type ATPase complex assembly(GO:0070070) vacuolar proton-transporting V-type ATPase complex assembly(GO:0070072) |
| 0.0 | 0.3 | GO:0032439 | endosome localization(GO:0032439) positive regulation of pinocytosis(GO:0048549) |
| 0.0 | 0.9 | GO:0019388 | galactose catabolic process(GO:0019388) |
| 0.0 | 0.2 | GO:0046072 | dUDP biosynthetic process(GO:0006227) dTDP biosynthetic process(GO:0006233) pyrimidine nucleoside diphosphate biosynthetic process(GO:0009139) pyrimidine deoxyribonucleoside diphosphate metabolic process(GO:0009196) pyrimidine deoxyribonucleoside diphosphate biosynthetic process(GO:0009197) dTDP metabolic process(GO:0046072) dUDP metabolic process(GO:0046077) |
| 0.0 | 0.3 | GO:0006127 | glycerophosphate shuttle(GO:0006127) |
| 0.0 | 0.3 | GO:0031064 | negative regulation of histone deacetylation(GO:0031064) histone H3-K4 demethylation, trimethyl-H3-K4-specific(GO:0034721) |
| 0.0 | 0.1 | GO:0039521 | lysosomal microautophagy(GO:0016237) piecemeal microautophagy of nucleus(GO:0034727) suppression by virus of host autophagy(GO:0039521) |
| 0.0 | 1.2 | GO:0035020 | regulation of Rac protein signal transduction(GO:0035020) |
| 0.0 | 0.5 | GO:0018231 | peptidyl-L-cysteine S-palmitoylation(GO:0018230) peptidyl-S-diacylglycerol-L-cysteine biosynthetic process from peptidyl-cysteine(GO:0018231) |
| 0.0 | 0.6 | GO:0002175 | protein localization to paranode region of axon(GO:0002175) |
| 0.0 | 0.5 | GO:1900246 | positive regulation of RIG-I signaling pathway(GO:1900246) |
| 0.0 | 0.7 | GO:0007196 | adenylate cyclase-inhibiting G-protein coupled glutamate receptor signaling pathway(GO:0007196) |
| 0.0 | 0.1 | GO:0060666 | dichotomous subdivision of terminal units involved in salivary gland branching(GO:0060666) |
| 0.0 | 0.9 | GO:1901223 | negative regulation of NIK/NF-kappaB signaling(GO:1901223) |
| 0.0 | 0.7 | GO:0051574 | positive regulation of histone H3-K9 methylation(GO:0051574) |
| 0.0 | 0.1 | GO:0003358 | noradrenergic neuron development(GO:0003358) |
| 0.0 | 0.2 | GO:0042636 | negative regulation of hair cycle(GO:0042636) |
| 0.0 | 1.8 | GO:0007398 | ectoderm development(GO:0007398) |
| 0.0 | 0.2 | GO:0034402 | recruitment of 3'-end processing factors to RNA polymerase II holoenzyme complex(GO:0034402) |
| 0.0 | 0.4 | GO:0006655 | phosphatidylglycerol biosynthetic process(GO:0006655) |
| 0.0 | 1.3 | GO:0010172 | embryonic body morphogenesis(GO:0010172) |
| 0.0 | 1.7 | GO:0032012 | regulation of ARF protein signal transduction(GO:0032012) |
| 0.0 | 0.4 | GO:0016926 | protein desumoylation(GO:0016926) |
| 0.0 | 0.5 | GO:0097105 | presynaptic membrane assembly(GO:0097105) |
| 0.0 | 0.5 | GO:0048671 | negative regulation of collateral sprouting(GO:0048671) |
| 0.0 | 0.1 | GO:0086048 | membrane depolarization during bundle of His cell action potential(GO:0086048) |
| 0.0 | 0.1 | GO:0015788 | UDP-N-acetylglucosamine transport(GO:0015788) UDP-N-acetylglucosamine transmembrane transport(GO:1990569) |
| 0.0 | 0.2 | GO:0035616 | histone H2B conserved C-terminal lysine deubiquitination(GO:0035616) |
| 0.0 | 0.5 | GO:0036010 | protein localization to endosome(GO:0036010) |
| 0.0 | 0.1 | GO:0018171 | peptidyl-cysteine oxidation(GO:0018171) |
| 0.0 | 0.3 | GO:0090625 | mRNA cleavage involved in gene silencing by siRNA(GO:0090625) |
| 0.0 | 0.7 | GO:0042135 | neurotransmitter catabolic process(GO:0042135) |
| 0.0 | 0.7 | GO:0034497 | protein localization to pre-autophagosomal structure(GO:0034497) |
| 0.0 | 0.2 | GO:0006540 | glutamate decarboxylation to succinate(GO:0006540) |
| 0.0 | 0.8 | GO:0050942 | positive regulation of pigment cell differentiation(GO:0050942) |
| 0.0 | 0.2 | GO:1901097 | negative regulation of autophagosome maturation(GO:1901097) |
| 0.0 | 0.1 | GO:0051066 | dihydrobiopterin metabolic process(GO:0051066) |
| 0.0 | 1.8 | GO:1900739 | regulation of protein insertion into mitochondrial membrane involved in apoptotic signaling pathway(GO:1900739) positive regulation of protein insertion into mitochondrial membrane involved in apoptotic signaling pathway(GO:1900740) |
| 0.0 | 0.2 | GO:0006235 | dTTP biosynthetic process(GO:0006235) pyrimidine deoxyribonucleoside triphosphate biosynthetic process(GO:0009212) |
| 0.0 | 1.0 | GO:0036152 | phosphatidylethanolamine acyl-chain remodeling(GO:0036152) |
| 0.0 | 0.1 | GO:1990637 | response to prolactin(GO:1990637) |
| 0.0 | 0.3 | GO:2000324 | positive regulation of glucocorticoid receptor signaling pathway(GO:2000324) |
| 0.0 | 0.5 | GO:2001135 | regulation of endocytic recycling(GO:2001135) |
| 0.0 | 0.1 | GO:0048294 | negative regulation of isotype switching to IgE isotypes(GO:0048294) |
| 0.0 | 0.5 | GO:0070389 | chaperone cofactor-dependent protein refolding(GO:0070389) |
| 0.0 | 0.5 | GO:0038203 | TORC2 signaling(GO:0038203) |
| 0.0 | 1.0 | GO:0090331 | negative regulation of platelet aggregation(GO:0090331) |
| 0.0 | 0.4 | GO:0045876 | positive regulation of sister chromatid cohesion(GO:0045876) |
| 0.0 | 0.6 | GO:0070571 | negative regulation of axon regeneration(GO:0048681) negative regulation of neuron projection regeneration(GO:0070571) |
| 0.0 | 0.2 | GO:1902962 | regulation of metalloendopeptidase activity involved in amyloid precursor protein catabolic process(GO:1902962) negative regulation of metalloendopeptidase activity involved in amyloid precursor protein catabolic process(GO:1902963) |
| 0.0 | 1.1 | GO:0050772 | positive regulation of axonogenesis(GO:0050772) |
| 0.0 | 0.1 | GO:0072369 | regulation of lipid transport by positive regulation of transcription from RNA polymerase II promoter(GO:0072369) |
| 0.0 | 0.1 | GO:0006272 | leading strand elongation(GO:0006272) |
| 0.0 | 0.4 | GO:0097240 | meiotic telomere tethering at nuclear periphery(GO:0044821) meiotic attachment of telomere to nuclear envelope(GO:0070197) chromosome attachment to the nuclear envelope(GO:0097240) |
| 0.0 | 6.3 | GO:0007156 | homophilic cell adhesion via plasma membrane adhesion molecules(GO:0007156) |
| 0.0 | 0.9 | GO:2000369 | regulation of clathrin-mediated endocytosis(GO:2000369) |
| 0.0 | 0.1 | GO:0002270 | plasmacytoid dendritic cell activation(GO:0002270) regulation of restriction endodeoxyribonuclease activity(GO:0032072) |
| 0.0 | 0.2 | GO:0098935 | dendritic transport(GO:0098935) anterograde dendritic transport(GO:0098937) |
| 0.0 | 0.2 | GO:0060235 | lens induction in camera-type eye(GO:0060235) |
| 0.0 | 0.1 | GO:0010260 | organ senescence(GO:0010260) |
| 0.0 | 0.1 | GO:0031584 | activation of phospholipase D activity(GO:0031584) |
| 0.0 | 0.1 | GO:1905150 | regulation of voltage-gated sodium channel activity(GO:1905150) |
| 0.0 | 0.6 | GO:0061162 | establishment of monopolar cell polarity(GO:0061162) |
| 0.0 | 0.3 | GO:0033314 | mitotic DNA replication checkpoint(GO:0033314) |
| 0.0 | 0.6 | GO:0042759 | long-chain fatty acid biosynthetic process(GO:0042759) |
| 0.0 | 0.5 | GO:0010510 | regulation of acetyl-CoA biosynthetic process from pyruvate(GO:0010510) |
| 0.0 | 0.4 | GO:0060272 | embryonic skeletal joint morphogenesis(GO:0060272) |
| 0.0 | 0.4 | GO:0002315 | marginal zone B cell differentiation(GO:0002315) |
| 0.0 | 0.2 | GO:0046604 | positive regulation of mitotic centrosome separation(GO:0046604) |
| 0.0 | 1.8 | GO:0007223 | Wnt signaling pathway, calcium modulating pathway(GO:0007223) |
| 0.0 | 0.8 | GO:0000470 | maturation of LSU-rRNA(GO:0000470) |
| 0.0 | 0.3 | GO:0051127 | positive regulation of actin nucleation(GO:0051127) |
| 0.0 | 0.1 | GO:1904884 | signal transduction involved in G2 DNA damage checkpoint(GO:0072425) signal transduction involved in mitotic G2 DNA damage checkpoint(GO:0072434) telomerase catalytic core complex assembly(GO:1904868) regulation of telomerase catalytic core complex assembly(GO:1904882) positive regulation of telomerase catalytic core complex assembly(GO:1904884) |
| 0.0 | 1.2 | GO:0035235 | ionotropic glutamate receptor signaling pathway(GO:0035235) |
| 0.0 | 0.3 | GO:0070970 | interleukin-2 secretion(GO:0070970) |
| 0.0 | 0.4 | GO:1901673 | regulation of mitotic spindle assembly(GO:1901673) |
| 0.0 | 0.2 | GO:0038028 | insulin receptor signaling pathway via phosphatidylinositol 3-kinase(GO:0038028) |
| 0.0 | 0.3 | GO:0051601 | exocyst localization(GO:0051601) |
| 0.0 | 0.1 | GO:0015888 | thiamine transport(GO:0015888) |
| 0.0 | 0.5 | GO:0060213 | regulation of nuclear-transcribed mRNA poly(A) tail shortening(GO:0060211) positive regulation of nuclear-transcribed mRNA poly(A) tail shortening(GO:0060213) |
| 0.0 | 1.3 | GO:0016486 | peptide hormone processing(GO:0016486) |
| 0.0 | 0.5 | GO:0071420 | cellular response to histamine(GO:0071420) |
| 0.0 | 0.6 | GO:1902166 | regulation of intrinsic apoptotic signaling pathway in response to DNA damage by p53 class mediator(GO:1902165) negative regulation of intrinsic apoptotic signaling pathway in response to DNA damage by p53 class mediator(GO:1902166) |
| 0.0 | 0.1 | GO:0009048 | dosage compensation(GO:0007549) dosage compensation by inactivation of X chromosome(GO:0009048) |
| 0.0 | 0.1 | GO:0007185 | transmembrane receptor protein tyrosine phosphatase signaling pathway(GO:0007185) |
| 0.0 | 0.1 | GO:0002904 | positive regulation of B cell apoptotic process(GO:0002904) |
| 0.0 | 0.2 | GO:0010748 | regulation of plasma membrane long-chain fatty acid transport(GO:0010746) negative regulation of plasma membrane long-chain fatty acid transport(GO:0010748) |
| 0.0 | 0.1 | GO:1902528 | regulation of protein linear polyubiquitination(GO:1902528) positive regulation of protein linear polyubiquitination(GO:1902530) |
| 0.0 | 0.1 | GO:0001661 | conditioned taste aversion(GO:0001661) |
| 0.0 | 0.2 | GO:0007253 | cytoplasmic sequestering of NF-kappaB(GO:0007253) |
| 0.0 | 0.3 | GO:0001573 | ganglioside metabolic process(GO:0001573) |
| 0.0 | 0.3 | GO:0045793 | positive regulation of cell size(GO:0045793) |
| 0.0 | 0.3 | GO:0051152 | positive regulation of smooth muscle cell differentiation(GO:0051152) |
| 0.0 | 0.2 | GO:0001675 | acrosome assembly(GO:0001675) |
| 0.0 | 0.1 | GO:0015760 | hexose phosphate transport(GO:0015712) glucose-6-phosphate transport(GO:0015760) |
| 0.0 | 0.4 | GO:0035855 | megakaryocyte development(GO:0035855) |
| 0.0 | 0.9 | GO:0031577 | spindle checkpoint(GO:0031577) |
| 0.0 | 0.8 | GO:0030851 | granulocyte differentiation(GO:0030851) |
| 0.0 | 0.2 | GO:0000338 | protein deneddylation(GO:0000338) |
| 0.0 | 0.2 | GO:0090292 | nuclear matrix organization(GO:0043578) nuclear matrix anchoring at nuclear membrane(GO:0090292) |
| 0.0 | 0.0 | GO:0031585 | regulation of inositol 1,4,5-trisphosphate-sensitive calcium-release channel activity(GO:0031585) positive regulation of inositol 1,4,5-trisphosphate-sensitive calcium-release channel activity(GO:0031587) |
| 0.0 | 1.4 | GO:0035249 | synaptic transmission, glutamatergic(GO:0035249) |
| 0.0 | 0.4 | GO:0045292 | mRNA cis splicing, via spliceosome(GO:0045292) |
| 0.0 | 0.3 | GO:0090050 | positive regulation of cell migration involved in sprouting angiogenesis(GO:0090050) |
| 0.0 | 0.6 | GO:0007616 | long-term memory(GO:0007616) |
| 0.0 | 0.2 | GO:0032596 | protein transport into membrane raft(GO:0032596) |
| 0.0 | 0.3 | GO:0043568 | positive regulation of insulin-like growth factor receptor signaling pathway(GO:0043568) |
| 0.0 | 0.8 | GO:0000289 | nuclear-transcribed mRNA poly(A) tail shortening(GO:0000289) |
| 0.0 | 0.4 | GO:0030206 | chondroitin sulfate biosynthetic process(GO:0030206) |
| 0.0 | 0.5 | GO:0032506 | cytokinetic process(GO:0032506) |
| 0.0 | 0.4 | GO:0016048 | detection of temperature stimulus(GO:0016048) |
| 0.0 | 0.3 | GO:2001275 | positive regulation of glucose import in response to insulin stimulus(GO:2001275) |
| 0.0 | 0.4 | GO:0033173 | calcineurin-NFAT signaling cascade(GO:0033173) |
| 0.0 | 0.5 | GO:0071108 | protein K48-linked deubiquitination(GO:0071108) |
| 0.0 | 0.1 | GO:0006203 | dGTP catabolic process(GO:0006203) dATP catabolic process(GO:0046061) |
| 0.0 | 1.7 | GO:0030516 | regulation of axon extension(GO:0030516) |
| 0.0 | 0.1 | GO:2000812 | regulation of barbed-end actin filament capping(GO:2000812) |
| 0.0 | 0.1 | GO:0035093 | spermatogenesis, exchange of chromosomal proteins(GO:0035093) |
| 0.0 | 0.2 | GO:0051573 | negative regulation of histone H3-K9 methylation(GO:0051573) |
| 0.0 | 0.1 | GO:0043985 | histone H4-R3 methylation(GO:0043985) |
| 0.0 | 0.4 | GO:2000505 | regulation of energy homeostasis(GO:2000505) |
| 0.0 | 0.2 | GO:0090084 | negative regulation of inclusion body assembly(GO:0090084) |
| 0.0 | 0.1 | GO:0034316 | negative regulation of Arp2/3 complex-mediated actin nucleation(GO:0034316) |
| 0.0 | 0.1 | GO:0060335 | positive regulation of response to interferon-gamma(GO:0060332) positive regulation of interferon-gamma-mediated signaling pathway(GO:0060335) |
| 0.0 | 0.5 | GO:0051973 | positive regulation of telomerase activity(GO:0051973) |
| 0.0 | 0.1 | GO:0051461 | positive regulation of corticotropin secretion(GO:0051461) |
Gene overrepresentation in cellular component category:
| Log-likelihood per target | Total log-likelihood | Term | Description |
|---|---|---|---|
| 0.7 | 2.6 | GO:0098855 | HCN channel complex(GO:0098855) |
| 0.5 | 1.5 | GO:0016939 | kinesin II complex(GO:0016939) |
| 0.3 | 2.4 | GO:0070032 | synaptobrevin 2-SNAP-25-syntaxin-1a-complexin I complex(GO:0070032) |
| 0.2 | 1.4 | GO:0009331 | glycerol-3-phosphate dehydrogenase complex(GO:0009331) |
| 0.2 | 1.5 | GO:0045298 | tubulin complex(GO:0045298) |
| 0.2 | 1.1 | GO:0043291 | RAVE complex(GO:0043291) |
| 0.1 | 0.8 | GO:0044308 | axonal spine(GO:0044308) |
| 0.1 | 0.9 | GO:0098843 | postsynaptic endocytic zone(GO:0098843) |
| 0.1 | 0.8 | GO:0070545 | PeBoW complex(GO:0070545) |
| 0.1 | 1.8 | GO:0043083 | synaptic cleft(GO:0043083) |
| 0.1 | 0.3 | GO:0042565 | RNA nuclear export complex(GO:0042565) |
| 0.1 | 0.3 | GO:0034686 | integrin alphav-beta8 complex(GO:0034686) |
| 0.1 | 0.4 | GO:0097125 | cyclin B1-CDK1 complex(GO:0097125) |
| 0.1 | 0.5 | GO:0048179 | activin receptor complex(GO:0048179) |
| 0.1 | 0.8 | GO:0097427 | microtubule bundle(GO:0097427) |
| 0.1 | 0.4 | GO:0071006 | U2-type catalytic step 1 spliceosome(GO:0071006) |
| 0.1 | 1.1 | GO:0042584 | chromaffin granule membrane(GO:0042584) |
| 0.1 | 0.4 | GO:0042272 | nuclear RNA export factor complex(GO:0042272) |
| 0.1 | 1.1 | GO:0031209 | SCAR complex(GO:0031209) |
| 0.1 | 0.2 | GO:0030849 | X chromosome(GO:0000805) autosome(GO:0030849) |
| 0.1 | 1.0 | GO:0000815 | ESCRT III complex(GO:0000815) |
| 0.1 | 1.1 | GO:0033010 | paranodal junction(GO:0033010) |
| 0.0 | 2.1 | GO:1902711 | GABA-A receptor complex(GO:1902711) |
| 0.0 | 1.9 | GO:0044295 | axonal growth cone(GO:0044295) |
| 0.0 | 1.8 | GO:0044298 | neuronal cell body membrane(GO:0032809) cell body membrane(GO:0044298) |
| 0.0 | 0.5 | GO:0030981 | cortical microtubule cytoskeleton(GO:0030981) |
| 0.0 | 0.5 | GO:0005955 | calcineurin complex(GO:0005955) |
| 0.0 | 0.8 | GO:0016600 | flotillin complex(GO:0016600) |
| 0.0 | 0.7 | GO:0031010 | ISWI-type complex(GO:0031010) |
| 0.0 | 0.1 | GO:0035370 | UBC13-UEV1A complex(GO:0035370) |
| 0.0 | 0.2 | GO:0070381 | endosome to plasma membrane transport vesicle(GO:0070381) |
| 0.0 | 0.5 | GO:0061202 | clathrin-sculpted gamma-aminobutyric acid transport vesicle(GO:0061200) clathrin-sculpted gamma-aminobutyric acid transport vesicle membrane(GO:0061202) |
| 0.0 | 0.8 | GO:0016281 | eukaryotic translation initiation factor 4F complex(GO:0016281) |
| 0.0 | 0.1 | GO:0034657 | GID complex(GO:0034657) |
| 0.0 | 0.5 | GO:0072357 | PTW/PP1 phosphatase complex(GO:0072357) |
| 0.0 | 0.3 | GO:0000235 | astral microtubule(GO:0000235) aster(GO:0005818) |
| 0.0 | 1.7 | GO:0032839 | dendrite cytoplasm(GO:0032839) |
| 0.0 | 0.8 | GO:0031095 | platelet dense tubular network membrane(GO:0031095) |
| 0.0 | 0.3 | GO:0000798 | nuclear cohesin complex(GO:0000798) |
| 0.0 | 0.6 | GO:0000124 | SAGA complex(GO:0000124) |
| 0.0 | 0.3 | GO:0019907 | cyclin-dependent protein kinase activating kinase holoenzyme complex(GO:0019907) |
| 0.0 | 1.3 | GO:0034451 | centriolar satellite(GO:0034451) |
| 0.0 | 0.5 | GO:0061700 | GATOR2 complex(GO:0061700) |
| 0.0 | 0.1 | GO:0044611 | nuclear pore inner ring(GO:0044611) |
| 0.0 | 0.9 | GO:0005942 | phosphatidylinositol 3-kinase complex(GO:0005942) |
| 0.0 | 0.2 | GO:0032279 | asymmetric synapse(GO:0032279) |
| 0.0 | 1.2 | GO:0000159 | protein phosphatase type 2A complex(GO:0000159) |
| 0.0 | 0.6 | GO:0033270 | paranode region of axon(GO:0033270) |
| 0.0 | 0.4 | GO:0060077 | inhibitory synapse(GO:0060077) |
| 0.0 | 1.8 | GO:0033017 | sarcoplasmic reticulum membrane(GO:0033017) |
| 0.0 | 0.5 | GO:0005671 | Ada2/Gcn5/Ada3 transcription activator complex(GO:0005671) |
| 0.0 | 0.7 | GO:0005639 | integral component of nuclear inner membrane(GO:0005639) intrinsic component of nuclear inner membrane(GO:0031229) |
| 0.0 | 2.0 | GO:0043198 | dendritic shaft(GO:0043198) |
| 0.0 | 0.2 | GO:0031313 | extrinsic component of endosome membrane(GO:0031313) |
| 0.0 | 3.3 | GO:0008076 | voltage-gated potassium channel complex(GO:0008076) |
| 0.0 | 0.2 | GO:0030891 | VCB complex(GO:0030891) |
| 0.0 | 0.8 | GO:0016581 | NuRD complex(GO:0016581) CHD-type complex(GO:0090545) |
| 0.0 | 0.3 | GO:0035068 | micro-ribonucleoprotein complex(GO:0035068) |
| 0.0 | 0.1 | GO:0030121 | AP-1 adaptor complex(GO:0030121) |
| 0.0 | 0.2 | GO:0034992 | microtubule organizing center attachment site(GO:0034992) LINC complex(GO:0034993) |
| 0.0 | 0.6 | GO:0071782 | endoplasmic reticulum tubular network(GO:0071782) |
| 0.0 | 0.1 | GO:1990752 | microtubule end(GO:1990752) |
| 0.0 | 0.1 | GO:0005658 | alpha DNA polymerase:primase complex(GO:0005658) |
| 0.0 | 0.5 | GO:0031083 | BLOC-1 complex(GO:0031083) |
| 0.0 | 0.1 | GO:0005726 | perichromatin fibrils(GO:0005726) |
| 0.0 | 0.5 | GO:0005892 | acetylcholine-gated channel complex(GO:0005892) |
| 0.0 | 0.2 | GO:0005672 | transcription factor TFIIA complex(GO:0005672) |
| 0.0 | 0.4 | GO:0046930 | pore complex(GO:0046930) |
| 0.0 | 0.1 | GO:0042382 | paraspeckles(GO:0042382) |
| 0.0 | 1.1 | GO:0019005 | SCF ubiquitin ligase complex(GO:0019005) |
| 0.0 | 0.3 | GO:0030904 | retromer complex(GO:0030904) |
| 0.0 | 0.2 | GO:0016593 | Cdc73/Paf1 complex(GO:0016593) |
| 0.0 | 0.3 | GO:0035102 | PRC1 complex(GO:0035102) |
| 0.0 | 0.3 | GO:0000145 | exocyst(GO:0000145) |
| 0.0 | 0.1 | GO:0035976 | AP1 complex(GO:0035976) |
| 0.0 | 1.6 | GO:0042734 | presynaptic membrane(GO:0042734) |
| 0.0 | 0.5 | GO:0035371 | microtubule plus-end(GO:0035371) |
| 0.0 | 0.2 | GO:0032433 | filopodium tip(GO:0032433) |
| 0.0 | 0.3 | GO:0016529 | sarcoplasmic reticulum(GO:0016529) |
| 0.0 | 1.5 | GO:0017053 | transcriptional repressor complex(GO:0017053) |
| 0.0 | 0.8 | GO:0043034 | costamere(GO:0043034) |
Gene overrepresentation in molecular function category:
| Log-likelihood per target | Total log-likelihood | Term | Description |
|---|---|---|---|
| 0.4 | 1.5 | GO:0099609 | microtubule lateral binding(GO:0099609) |
| 0.3 | 2.6 | GO:0005222 | intracellular cAMP activated cation channel activity(GO:0005222) |
| 0.3 | 1.2 | GO:0044378 | non-sequence-specific DNA binding, bending(GO:0044378) |
| 0.3 | 1.3 | GO:0004157 | dihydropyrimidinase activity(GO:0004157) |
| 0.2 | 0.8 | GO:0047192 | 1-alkylglycerophosphocholine O-acetyltransferase activity(GO:0047192) |
| 0.2 | 1.7 | GO:0003828 | alpha-N-acetylneuraminate alpha-2,8-sialyltransferase activity(GO:0003828) |
| 0.2 | 0.5 | GO:0005093 | Rab GDP-dissociation inhibitor activity(GO:0005093) |
| 0.2 | 1.0 | GO:0004706 | JUN kinase kinase kinase activity(GO:0004706) |
| 0.2 | 0.5 | GO:0038100 | nodal binding(GO:0038100) |
| 0.2 | 0.8 | GO:0033300 | dehydroascorbic acid transporter activity(GO:0033300) |
| 0.2 | 0.9 | GO:0015183 | L-aspartate transmembrane transporter activity(GO:0015183) |
| 0.1 | 1.3 | GO:0099580 | ion antiporter activity involved in regulation of postsynaptic membrane potential(GO:0099580) |
| 0.1 | 0.6 | GO:0008426 | protein kinase C inhibitor activity(GO:0008426) |
| 0.1 | 2.3 | GO:0004723 | calcium-dependent protein serine/threonine phosphatase activity(GO:0004723) |
| 0.1 | 0.4 | GO:0035650 | AP-1 adaptor complex binding(GO:0035650) |
| 0.1 | 0.4 | GO:0030158 | protein xylosyltransferase activity(GO:0030158) |
| 0.1 | 0.4 | GO:0004605 | phosphatidate cytidylyltransferase activity(GO:0004605) |
| 0.1 | 0.9 | GO:0004614 | phosphoglucomutase activity(GO:0004614) |
| 0.1 | 1.1 | GO:0070740 | tubulin-glutamic acid ligase activity(GO:0070740) |
| 0.1 | 0.4 | GO:0015207 | ATP:ADP antiporter activity(GO:0005471) adenine transmembrane transporter activity(GO:0015207) |
| 0.1 | 0.4 | GO:0001588 | dopamine neurotransmitter receptor activity, coupled via Gs(GO:0001588) |
| 0.1 | 0.3 | GO:0050613 | delta14-sterol reductase activity(GO:0050613) |
| 0.1 | 0.3 | GO:0090631 | pre-miRNA transporter activity(GO:0090631) |
| 0.1 | 0.4 | GO:0070137 | ubiquitin-like protein-specific endopeptidase activity(GO:0070137) SUMO-specific endopeptidase activity(GO:0070139) |
| 0.1 | 1.1 | GO:0044323 | retinoic acid-responsive element binding(GO:0044323) |
| 0.1 | 0.6 | GO:0016833 | oxo-acid-lyase activity(GO:0016833) |
| 0.1 | 1.4 | GO:0005004 | GPI-linked ephrin receptor activity(GO:0005004) |
| 0.1 | 0.7 | GO:0098988 | adenylate cyclase inhibiting G-protein coupled glutamate receptor activity(GO:0001640) G-protein coupled glutamate receptor activity(GO:0098988) |
| 0.1 | 0.3 | GO:0070363 | mitochondrial light strand promoter sense binding(GO:0070363) |
| 0.1 | 0.2 | GO:0033862 | UMP kinase activity(GO:0033862) |
| 0.1 | 1.5 | GO:0008503 | benzodiazepine receptor activity(GO:0008503) |
| 0.1 | 0.5 | GO:0004740 | pyruvate dehydrogenase (acetyl-transferring) kinase activity(GO:0004740) |
| 0.1 | 0.6 | GO:0004598 | peptidylglycine monooxygenase activity(GO:0004504) peptidylamidoglycolate lyase activity(GO:0004598) |
| 0.1 | 0.9 | GO:0047144 | 2-acylglycerol-3-phosphate O-acyltransferase activity(GO:0047144) |
| 0.1 | 0.5 | GO:0043515 | kinetochore binding(GO:0043515) |
| 0.1 | 0.6 | GO:0050815 | phosphoserine binding(GO:0050815) |
| 0.1 | 0.6 | GO:0004652 | polynucleotide adenylyltransferase activity(GO:0004652) |
| 0.1 | 0.7 | GO:0000155 | phosphorelay sensor kinase activity(GO:0000155) |
| 0.1 | 1.6 | GO:0015095 | magnesium ion transmembrane transporter activity(GO:0015095) |
| 0.1 | 0.4 | GO:0005105 | type 1 fibroblast growth factor receptor binding(GO:0005105) |
| 0.1 | 0.6 | GO:0030346 | protein phosphatase 2B binding(GO:0030346) |
| 0.1 | 0.3 | GO:0045322 | unmethylated CpG binding(GO:0045322) |
| 0.1 | 0.3 | GO:0044736 | acid-sensing ion channel activity(GO:0044736) |
| 0.1 | 0.4 | GO:0061575 | cyclin-dependent protein serine/threonine kinase activator activity(GO:0061575) |
| 0.1 | 0.9 | GO:0004971 | AMPA glutamate receptor activity(GO:0004971) |
| 0.1 | 0.3 | GO:0052590 | sn-glycerol-3-phosphate:ubiquinone oxidoreductase activity(GO:0052590) sn-glycerol-3-phosphate:ubiquinone-8 oxidoreductase activity(GO:0052591) |
| 0.1 | 0.2 | GO:1904455 | ubiquitin-specific protease activity involved in negative regulation of ERAD pathway(GO:1904455) |
| 0.1 | 0.3 | GO:0030375 | thyroid hormone receptor activator activity(GO:0010861) thyroid hormone receptor coactivator activity(GO:0030375) |
| 0.1 | 0.3 | GO:1990430 | extracellular matrix protein binding(GO:1990430) |
| 0.1 | 1.7 | GO:0031489 | myosin V binding(GO:0031489) |
| 0.1 | 0.3 | GO:0045504 | dynein heavy chain binding(GO:0045504) |
| 0.0 | 0.5 | GO:0022851 | GABA-gated chloride ion channel activity(GO:0022851) |
| 0.0 | 0.1 | GO:0050309 | glucose-6-phosphatase activity(GO:0004346) sugar-terminal-phosphatase activity(GO:0050309) |
| 0.0 | 2.8 | GO:0017075 | syntaxin-1 binding(GO:0017075) |
| 0.0 | 0.3 | GO:0034647 | histone demethylase activity (H3-trimethyl-K4 specific)(GO:0034647) |
| 0.0 | 0.1 | GO:0086057 | voltage-gated calcium channel activity involved in bundle of His cell action potential(GO:0086057) |
| 0.0 | 0.1 | GO:0019778 | Atg12 activating enzyme activity(GO:0019778) Atg8 activating enzyme activity(GO:0019779) |
| 0.0 | 1.6 | GO:0008574 | ATP-dependent microtubule motor activity, plus-end-directed(GO:0008574) |
| 0.0 | 0.6 | GO:0035005 | 1-phosphatidylinositol-4-phosphate 3-kinase activity(GO:0035005) |
| 0.0 | 0.9 | GO:0019966 | interleukin-1 binding(GO:0019966) |
| 0.0 | 0.9 | GO:0038036 | sphingosine-1-phosphate receptor activity(GO:0038036) |
| 0.0 | 0.4 | GO:0008597 | calcium-dependent protein serine/threonine phosphatase regulator activity(GO:0008597) |
| 0.0 | 0.4 | GO:0048495 | Roundabout binding(GO:0048495) |
| 0.0 | 1.6 | GO:0004707 | MAP kinase activity(GO:0004707) |
| 0.0 | 0.2 | GO:0051765 | inositol tetrakisphosphate kinase activity(GO:0051765) |
| 0.0 | 1.3 | GO:0097109 | neuroligin family protein binding(GO:0097109) |
| 0.0 | 1.2 | GO:0008499 | UDP-galactose:beta-N-acetylglucosamine beta-1,3-galactosyltransferase activity(GO:0008499) |
| 0.0 | 0.2 | GO:0061649 | ubiquitinated histone binding(GO:0061649) |
| 0.0 | 0.9 | GO:0052629 | phosphatidylinositol-3,5-bisphosphate 3-phosphatase activity(GO:0052629) |
| 0.0 | 0.7 | GO:0015379 | potassium:chloride symporter activity(GO:0015379) potassium ion symporter activity(GO:0022820) |
| 0.0 | 0.6 | GO:0001075 | transcription factor activity, RNA polymerase II core promoter sequence-specific binding involved in preinitiation complex assembly(GO:0001075) |
| 0.0 | 0.2 | GO:0035276 | ethanol binding(GO:0035276) |
| 0.0 | 1.0 | GO:0004000 | adenosine deaminase activity(GO:0004000) |
| 0.0 | 1.0 | GO:0051430 | corticotropin-releasing hormone receptor 1 binding(GO:0051430) |
| 0.0 | 0.6 | GO:0000774 | adenyl-nucleotide exchange factor activity(GO:0000774) |
| 0.0 | 0.5 | GO:0035612 | AP-2 adaptor complex binding(GO:0035612) |
| 0.0 | 1.3 | GO:0008239 | dipeptidyl-peptidase activity(GO:0008239) |
| 0.0 | 0.1 | GO:0005462 | UDP-N-acetylglucosamine transmembrane transporter activity(GO:0005462) |
| 0.0 | 1.6 | GO:0005540 | hyaluronic acid binding(GO:0005540) |
| 0.0 | 1.0 | GO:0005251 | delayed rectifier potassium channel activity(GO:0005251) |
| 0.0 | 0.5 | GO:0005025 | transforming growth factor beta receptor activity, type I(GO:0005025) |
| 0.0 | 0.8 | GO:0019870 | potassium channel inhibitor activity(GO:0019870) |
| 0.0 | 1.7 | GO:0005086 | ARF guanyl-nucleotide exchange factor activity(GO:0005086) |
| 0.0 | 0.4 | GO:0015386 | potassium:proton antiporter activity(GO:0015386) |
| 0.0 | 0.5 | GO:0005078 | MAP-kinase scaffold activity(GO:0005078) |
| 0.0 | 0.1 | GO:0071987 | WD40-repeat domain binding(GO:0071987) |
| 0.0 | 1.0 | GO:0004012 | phospholipid-translocating ATPase activity(GO:0004012) |
| 0.0 | 0.9 | GO:0070016 | armadillo repeat domain binding(GO:0070016) |
| 0.0 | 0.6 | GO:1990459 | transferrin receptor binding(GO:1990459) |
| 0.0 | 0.3 | GO:0061665 | SUMO ligase activity(GO:0061665) |
| 0.0 | 0.1 | GO:0047389 | glycerophosphocholine phosphodiesterase activity(GO:0047389) |
| 0.0 | 0.2 | GO:0004351 | glutamate decarboxylase activity(GO:0004351) |
| 0.0 | 0.4 | GO:0051434 | BH3 domain binding(GO:0051434) |
| 0.0 | 0.1 | GO:0050115 | myosin-light-chain-phosphatase activity(GO:0050115) |
| 0.0 | 0.5 | GO:0017162 | aryl hydrocarbon receptor binding(GO:0017162) |
| 0.0 | 0.2 | GO:0004839 | ubiquitin activating enzyme activity(GO:0004839) |
| 0.0 | 0.5 | GO:0004708 | MAP kinase kinase activity(GO:0004708) |
| 0.0 | 0.2 | GO:0004322 | ferroxidase activity(GO:0004322) oxidoreductase activity, oxidizing metal ions, oxygen as acceptor(GO:0016724) |
| 0.0 | 0.8 | GO:0034237 | protein kinase A regulatory subunit binding(GO:0034237) |
| 0.0 | 0.5 | GO:0008429 | phosphatidylethanolamine binding(GO:0008429) |
| 0.0 | 0.2 | GO:0015277 | kainate selective glutamate receptor activity(GO:0015277) |
| 0.0 | 0.7 | GO:0035256 | G-protein coupled glutamate receptor binding(GO:0035256) |
| 0.0 | 0.1 | GO:0008832 | dGTPase activity(GO:0008832) triphosphoric monoester hydrolase activity(GO:0016793) guanyl deoxyribonucleotide binding(GO:0032560) dGTP binding(GO:0032567) |
| 0.0 | 1.0 | GO:0004709 | MAP kinase kinase kinase activity(GO:0004709) |
| 0.0 | 0.1 | GO:0016230 | sphingomyelin phosphodiesterase activator activity(GO:0016230) |
| 0.0 | 1.2 | GO:0017091 | AU-rich element binding(GO:0017091) |
| 0.0 | 0.8 | GO:0005388 | calcium-transporting ATPase activity(GO:0005388) |
| 0.0 | 0.2 | GO:0034046 | poly(G) binding(GO:0034046) |
| 0.0 | 0.9 | GO:0031210 | phosphatidylcholine binding(GO:0031210) |
| 0.0 | 2.3 | GO:0005546 | phosphatidylinositol-4,5-bisphosphate binding(GO:0005546) |
| 0.0 | 0.1 | GO:0016972 | thiol oxidase activity(GO:0016972) |
| 0.0 | 0.4 | GO:0017070 | U6 snRNA binding(GO:0017070) |
| 0.0 | 0.7 | GO:0070273 | phosphatidylinositol-4-phosphate binding(GO:0070273) |
| 0.0 | 0.3 | GO:0043008 | ATP-dependent protein binding(GO:0043008) |
| 0.0 | 0.3 | GO:0046935 | 1-phosphatidylinositol-3-kinase regulator activity(GO:0046935) |
| 0.0 | 0.3 | GO:0005225 | volume-sensitive anion channel activity(GO:0005225) |
| 0.0 | 1.1 | GO:0005123 | death receptor binding(GO:0005123) |
| 0.0 | 0.5 | GO:0008349 | MAP kinase kinase kinase kinase activity(GO:0008349) |
| 0.0 | 0.1 | GO:0070404 | NADH binding(GO:0070404) |
| 0.0 | 0.2 | GO:0004726 | non-membrane spanning protein tyrosine phosphatase activity(GO:0004726) |
| 0.0 | 0.1 | GO:0010858 | calcium-dependent protein kinase regulator activity(GO:0010858) |
| 0.0 | 0.1 | GO:0004677 | DNA-dependent protein kinase activity(GO:0004677) |
| 0.0 | 0.1 | GO:1990226 | histone methyltransferase binding(GO:1990226) |
| 0.0 | 0.2 | GO:0033857 | diphosphoinositol-pentakisphosphate kinase activity(GO:0033857) |
| 0.0 | 0.2 | GO:0042731 | PH domain binding(GO:0042731) |
| 0.0 | 0.9 | GO:0008139 | nuclear localization sequence binding(GO:0008139) |
| 0.0 | 1.9 | GO:0030971 | receptor tyrosine kinase binding(GO:0030971) |
| 0.0 | 0.7 | GO:0019198 | transmembrane receptor protein tyrosine phosphatase activity(GO:0005001) transmembrane receptor protein phosphatase activity(GO:0019198) |
| 0.0 | 0.3 | GO:0050700 | CARD domain binding(GO:0050700) |
| 0.0 | 0.5 | GO:0030955 | potassium ion binding(GO:0030955) |
| 0.0 | 3.6 | GO:0044325 | ion channel binding(GO:0044325) |
| 0.0 | 0.4 | GO:0017160 | Ral GTPase binding(GO:0017160) |
| 0.0 | 0.6 | GO:0008327 | methyl-CpG binding(GO:0008327) |
| 0.0 | 0.4 | GO:0004653 | polypeptide N-acetylgalactosaminyltransferase activity(GO:0004653) |
| 0.0 | 0.3 | GO:0070324 | thyroid hormone binding(GO:0070324) |
| 0.0 | 1.0 | GO:0030507 | spectrin binding(GO:0030507) |
| 0.0 | 0.8 | GO:0070840 | dynein complex binding(GO:0070840) |
| 0.0 | 0.1 | GO:0001069 | regulatory region RNA binding(GO:0001069) |
| 0.0 | 0.4 | GO:0030296 | protein tyrosine kinase activator activity(GO:0030296) |
| 0.0 | 0.2 | GO:0032050 | clathrin heavy chain binding(GO:0032050) |
| 0.0 | 1.6 | GO:0031490 | chromatin DNA binding(GO:0031490) |
| 0.0 | 0.6 | GO:0032452 | histone demethylase activity(GO:0032452) |
| 0.0 | 0.0 | GO:0031871 | proteinase activated receptor binding(GO:0031871) |
| 0.0 | 0.3 | GO:0031078 | histone deacetylase activity (H3-K14 specific)(GO:0031078) NAD-dependent histone deacetylase activity (H3-K14 specific)(GO:0032041) |
| 0.0 | 0.3 | GO:0051010 | microtubule plus-end binding(GO:0051010) |
| 0.0 | 0.5 | GO:0005158 | insulin receptor binding(GO:0005158) |
| 0.0 | 0.1 | GO:0004305 | ethanolamine kinase activity(GO:0004305) |
| 0.0 | 0.2 | GO:0001206 | transcriptional repressor activity, RNA polymerase II distal enhancer sequence-specific binding(GO:0001206) |
| 0.0 | 0.2 | GO:0003688 | DNA replication origin binding(GO:0003688) |
| 0.0 | 3.9 | GO:0008017 | microtubule binding(GO:0008017) |
Gene overrepresentation in curated gene sets: canonical pathways category:
| Log-likelihood per target | Total log-likelihood | Term | Description |
|---|---|---|---|
| 0.1 | 1.0 | PID ER NONGENOMIC PATHWAY | Plasma membrane estrogen receptor signaling |
| 0.1 | 1.6 | PID TCR RAS PATHWAY | Ras signaling in the CD4+ TCR pathway |
| 0.1 | 1.5 | PID P38 GAMMA DELTA PATHWAY | Signaling mediated by p38-gamma and p38-delta |
| 0.0 | 1.8 | PID S1P S1P1 PATHWAY | S1P1 pathway |
| 0.0 | 2.0 | PID P38 MKK3 6PATHWAY | p38 MAPK signaling pathway |
| 0.0 | 0.2 | PID WNT CANONICAL PATHWAY | Canonical Wnt signaling pathway |
| 0.0 | 1.6 | PID TOLL ENDOGENOUS PATHWAY | Endogenous TLR signaling |
| 0.0 | 1.6 | ST WNT CA2 CYCLIC GMP PATHWAY | Wnt/Ca2+/cyclic GMP signaling. |
| 0.0 | 1.6 | PID P38 MK2 PATHWAY | p38 signaling mediated by MAPKAP kinases |
| 0.0 | 0.9 | PID TRAIL PATHWAY | TRAIL signaling pathway |
| 0.0 | 2.3 | PID HEDGEHOG GLI PATHWAY | Hedgehog signaling events mediated by Gli proteins |
| 0.0 | 2.3 | PID TNF PATHWAY | TNF receptor signaling pathway |
| 0.0 | 1.4 | PID EPHA FWDPATHWAY | EPHA forward signaling |
| 0.0 | 1.2 | PID LIS1 PATHWAY | Lissencephaly gene (LIS1) in neuronal migration and development |
| 0.0 | 2.5 | PID NFAT 3PATHWAY | Role of Calcineurin-dependent NFAT signaling in lymphocytes |
| 0.0 | 0.8 | ST TUMOR NECROSIS FACTOR PATHWAY | Tumor Necrosis Factor Pathway. |
| 0.0 | 0.4 | SA G1 AND S PHASES | Cdk2, 4, and 6 bind cyclin D in G1, while cdk2/cyclin E promotes the G1/S transition. |
| 0.0 | 0.6 | PID INTEGRIN5 PATHWAY | Beta5 beta6 beta7 and beta8 integrin cell surface interactions |
| 0.0 | 2.5 | PID CMYB PATHWAY | C-MYB transcription factor network |
| 0.0 | 1.2 | SIG REGULATION OF THE ACTIN CYTOSKELETON BY RHO GTPASES | Genes related to regulation of the actin cytoskeleton |
| 0.0 | 0.4 | PID CERAMIDE PATHWAY | Ceramide signaling pathway |
| 0.0 | 1.1 | PID ERBB1 INTERNALIZATION PATHWAY | Internalization of ErbB1 |
| 0.0 | 0.4 | PID INTEGRIN3 PATHWAY | Beta3 integrin cell surface interactions |
| 0.0 | 0.7 | PID NCADHERIN PATHWAY | N-cadherin signaling events |
| 0.0 | 0.6 | SIG IL4RECEPTOR IN B LYPHOCYTES | Genes related to IL4 rceptor signaling in B lymphocytes |
| 0.0 | 0.3 | PID ERB GENOMIC PATHWAY | Validated nuclear estrogen receptor beta network |
| 0.0 | 0.4 | PID LKB1 PATHWAY | LKB1 signaling events |
Gene overrepresentation in curated gene sets: REACTOME pathways category:
| Log-likelihood per target | Total log-likelihood | Term | Description |
|---|---|---|---|
| 0.1 | 2.1 | REACTOME RAF MAP KINASE CASCADE | Genes involved in RAF/MAP kinase cascade |
| 0.1 | 4.1 | REACTOME INSULIN SYNTHESIS AND PROCESSING | Genes involved in Insulin Synthesis and Processing |
| 0.1 | 1.9 | REACTOME APOPTOSIS INDUCED DNA FRAGMENTATION | Genes involved in Apoptosis induced DNA fragmentation |
| 0.1 | 1.4 | REACTOME SHC MEDIATED SIGNALLING | Genes involved in SHC-mediated signalling |
| 0.1 | 0.2 | REACTOME SOS MEDIATED SIGNALLING | Genes involved in SOS-mediated signalling |
| 0.1 | 1.6 | REACTOME TETRAHYDROBIOPTERIN BH4 SYNTHESIS RECYCLING SALVAGE AND REGULATION | Genes involved in Tetrahydrobiopterin (BH4) synthesis, recycling, salvage and regulation |
| 0.1 | 1.6 | REACTOME ACYL CHAIN REMODELLING OF PC | Genes involved in Acyl chain remodelling of PC |
| 0.0 | 1.5 | REACTOME CS DS DEGRADATION | Genes involved in CS/DS degradation |
| 0.0 | 2.1 | REACTOME GABA A RECEPTOR ACTIVATION | Genes involved in GABA A receptor activation |
| 0.0 | 3.0 | REACTOME VOLTAGE GATED POTASSIUM CHANNELS | Genes involved in Voltage gated Potassium channels |
| 0.0 | 1.3 | REACTOME PLATELET CALCIUM HOMEOSTASIS | Genes involved in Platelet calcium homeostasis |
| 0.0 | 1.5 | REACTOME CASPASE MEDIATED CLEAVAGE OF CYTOSKELETAL PROTEINS | Genes involved in Caspase-mediated cleavage of cytoskeletal proteins |
| 0.0 | 0.9 | REACTOME SYNTHESIS OF PA | Genes involved in Synthesis of PA |
| 0.0 | 0.9 | REACTOME TRAFFICKING OF GLUR2 CONTAINING AMPA RECEPTORS | Genes involved in Trafficking of GluR2-containing AMPA receptors |
| 0.0 | 0.9 | REACTOME ACTIVATION OF BH3 ONLY PROTEINS | Genes involved in Activation of BH3-only proteins |
| 0.0 | 1.7 | REACTOME G PROTEIN ACTIVATION | Genes involved in G-protein activation |
| 0.0 | 0.8 | REACTOME FACILITATIVE NA INDEPENDENT GLUCOSE TRANSPORTERS | Genes involved in Facilitative Na+-independent glucose transporters |
| 0.0 | 0.4 | REACTOME E2F ENABLED INHIBITION OF PRE REPLICATION COMPLEX FORMATION | Genes involved in E2F-enabled inhibition of pre-replication complex formation |
| 0.0 | 0.8 | REACTOME DEPOSITION OF NEW CENPA CONTAINING NUCLEOSOMES AT THE CENTROMERE | Genes involved in Deposition of New CENPA-containing Nucleosomes at the Centromere |
| 0.0 | 1.5 | REACTOME RECYCLING PATHWAY OF L1 | Genes involved in Recycling pathway of L1 |
| 0.0 | 0.5 | REACTOME REGULATION OF PYRUVATE DEHYDROGENASE PDH COMPLEX | Genes involved in Regulation of pyruvate dehydrogenase (PDH) complex |
| 0.0 | 0.7 | REACTOME IONOTROPIC ACTIVITY OF KAINATE RECEPTORS | Genes involved in Ionotropic activity of Kainate Receptors |
| 0.0 | 2.2 | REACTOME POTASSIUM CHANNELS | Genes involved in Potassium Channels |
| 0.0 | 0.9 | REACTOME REGULATION OF SIGNALING BY CBL | Genes involved in Regulation of signaling by CBL |
| 0.0 | 0.9 | REACTOME ENDOSOMAL SORTING COMPLEX REQUIRED FOR TRANSPORT ESCRT | Genes involved in Endosomal Sorting Complex Required For Transport (ESCRT) |
| 0.0 | 0.9 | REACTOME SYNTHESIS SECRETION AND INACTIVATION OF GLP1 | Genes involved in Synthesis, Secretion, and Inactivation of Glucagon-like Peptide-1 (GLP-1) |
| 0.0 | 0.6 | REACTOME N GLYCAN ANTENNAE ELONGATION | Genes involved in N-Glycan antennae elongation |
| 0.0 | 1.2 | REACTOME MITOCHONDRIAL PROTEIN IMPORT | Genes involved in Mitochondrial Protein Import |
| 0.0 | 2.6 | REACTOME MITOTIC PROMETAPHASE | Genes involved in Mitotic Prometaphase |
| 0.0 | 0.6 | REACTOME TRAFFICKING OF AMPA RECEPTORS | Genes involved in Trafficking of AMPA receptors |
| 0.0 | 0.4 | REACTOME G BETA GAMMA SIGNALLING THROUGH PI3KGAMMA | Genes involved in G beta:gamma signalling through PI3Kgamma |
| 0.0 | 0.9 | REACTOME ION TRANSPORT BY P TYPE ATPASES | Genes involved in Ion transport by P-type ATPases |
| 0.0 | 0.1 | REACTOME INHIBITION OF REPLICATION INITIATION OF DAMAGED DNA BY RB1 E2F1 | Genes involved in Inhibition of replication initiation of damaged DNA by RB1/E2F1 |
| 0.0 | 0.8 | REACTOME ADHERENS JUNCTIONS INTERACTIONS | Genes involved in Adherens junctions interactions |
| 0.0 | 1.0 | REACTOME NETRIN1 SIGNALING | Genes involved in Netrin-1 signaling |
| 0.0 | 0.3 | REACTOME ACTIVATION OF NF KAPPAB IN B CELLS | Genes involved in Activation of NF-kappaB in B Cells |
| 0.0 | 0.4 | REACTOME DESTABILIZATION OF MRNA BY KSRP | Genes involved in Destabilization of mRNA by KSRP |
| 0.0 | 0.5 | REACTOME DEADENYLATION OF MRNA | Genes involved in Deadenylation of mRNA |
| 0.0 | 0.3 | REACTOME SIGNALING BY BMP | Genes involved in Signaling by BMP |
| 0.0 | 0.3 | REACTOME REGULATION OF IFNG SIGNALING | Genes involved in Regulation of IFNG signaling |
| 0.0 | 0.1 | REACTOME PROLONGED ERK ACTIVATION EVENTS | Genes involved in Prolonged ERK activation events |
| 0.0 | 0.1 | REACTOME REGULATION OF THE FANCONI ANEMIA PATHWAY | Genes involved in Regulation of the Fanconi anemia pathway |
| 0.0 | 0.1 | REACTOME GLUCOSE TRANSPORT | Genes involved in Glucose transport |