Project
Illumina Body Map 2 (GSE30611)
Navigation
Downloads
Results for ACCACAG
Z-value: 0.36
Motif logo

miRNA associated with seed ACCACAG
| Name | miRBASE accession |
|---|---|
|
hsa-miR-140-3p.2
|
MIMAT0004597 |
Activity profile of ACCACAG motif
Sorted Z-values of ACCACAG motif
| Promoter | Log-likelihood | Transcript | Gene | Gene Info |
|---|---|---|---|---|
| chr6_+_117265550 | 0.61 |
ENST00000352536.7
ENST00000326274.6 |
VGLL2
|
vestigial like family member 2 |
| chr14_+_64704380 | 0.48 |
ENST00000247226.13
ENST00000394691.7 |
PLEKHG3
|
pleckstrin homology and RhoGEF domain containing G3 |
| chr17_+_69414690 | 0.45 |
ENST00000590474.7
|
MAP2K6
|
mitogen-activated protein kinase kinase 6 |
| chr12_-_48999363 | 0.40 |
ENST00000421952.3
|
DDN
|
dendrin |
| chr6_+_34466059 | 0.37 |
ENST00000620693.4
ENST00000244458.7 ENST00000374043.6 |
PACSIN1
|
protein kinase C and casein kinase substrate in neurons 1 |
| chr19_+_19211949 | 0.37 |
ENST00000252575.11
|
NCAN
|
neurocan |
| chr11_+_73376365 | 0.35 |
ENST00000064780.7
ENST00000545687.5 |
RELT
|
RELT TNF receptor |
| chr12_+_57550027 | 0.35 |
ENST00000674619.1
ENST00000676359.1 ENST00000286452.5 ENST00000455537.7 ENST00000676457.1 |
KIF5A
|
kinesin family member 5A |
| chr11_+_119206298 | 0.33 |
ENST00000634586.1
ENST00000634840.1 ENST00000264033.6 ENST00000637974.1 |
CBL
|
Cbl proto-oncogene |
| chr3_-_186362223 | 0.33 |
ENST00000265022.8
|
DGKG
|
diacylglycerol kinase gamma |
| chr6_+_71288803 | 0.29 |
ENST00000370435.5
|
OGFRL1
|
opioid growth factor receptor like 1 |
| chr11_-_78341876 | 0.26 |
ENST00000340149.6
|
GAB2
|
GRB2 associated binding protein 2 |
| chr10_+_25174969 | 0.26 |
ENST00000376351.4
|
GPR158
|
G protein-coupled receptor 158 |
| chr1_-_182391783 | 0.26 |
ENST00000331872.11
ENST00000339526.8 |
GLUL
|
glutamate-ammonia ligase |
| chr4_-_152536045 | 0.26 |
ENST00000603548.6
ENST00000281708.10 |
FBXW7
|
F-box and WD repeat domain containing 7 |
| chr9_+_79571767 | 0.26 |
ENST00000376544.7
|
TLE4
|
TLE family member 4, transcriptional corepressor |
| chr22_-_21867610 | 0.26 |
ENST00000215832.11
ENST00000398822.7 |
MAPK1
|
mitogen-activated protein kinase 1 |
| chr18_+_54828406 | 0.24 |
ENST00000262094.10
|
RAB27B
|
RAB27B, member RAS oncogene family |
| chr1_+_244051275 | 0.24 |
ENST00000358704.4
|
ZBTB18
|
zinc finger and BTB domain containing 18 |
| chr2_-_178807415 | 0.24 |
ENST00000342992.10
ENST00000460472.6 ENST00000589042.5 ENST00000591111.5 ENST00000360870.10 |
TTN
|
titin |
| chr9_-_23821275 | 0.23 |
ENST00000380110.8
|
ELAVL2
|
ELAV like RNA binding protein 2 |
| chr20_+_10218808 | 0.23 |
ENST00000254976.7
ENST00000304886.6 |
SNAP25
|
synaptosome associated protein 25 |
| chr3_+_68004231 | 0.23 |
ENST00000478136.6
|
TAFA1
|
TAFA chemokine like family member 1 |
| chr6_+_123803853 | 0.22 |
ENST00000368417.6
|
NKAIN2
|
sodium/potassium transporting ATPase interacting 2 |
| chr2_-_239400949 | 0.22 |
ENST00000345617.7
|
HDAC4
|
histone deacetylase 4 |
| chr10_+_26216766 | 0.22 |
ENST00000376261.8
|
GAD2
|
glutamate decarboxylase 2 |
| chr3_-_171460368 | 0.22 |
ENST00000436636.7
ENST00000465393.1 ENST00000341852.10 |
TNIK
|
TRAF2 and NCK interacting kinase |
| chr2_-_27263034 | 0.21 |
ENST00000233535.9
|
SLC30A3
|
solute carrier family 30 member 3 |
| chr17_-_39864304 | 0.20 |
ENST00000346872.8
|
IKZF3
|
IKAROS family zinc finger 3 |
| chr3_-_192727500 | 0.20 |
ENST00000430714.5
ENST00000418610.1 ENST00000445105.7 ENST00000684728.1 ENST00000448795.5 ENST00000683935.1 ENST00000684282.1 ENST00000683451.1 |
FGF12
|
fibroblast growth factor 12 |
| chr20_-_62407274 | 0.20 |
ENST00000279101.9
|
CABLES2
|
Cdk5 and Abl enzyme substrate 2 |
| chr1_-_174022339 | 0.20 |
ENST00000367696.7
|
RC3H1
|
ring finger and CCCH-type domains 1 |
| chr13_-_52848632 | 0.19 |
ENST00000377942.7
ENST00000338862.5 |
PCDH8
|
protocadherin 8 |
| chr5_-_161546708 | 0.19 |
ENST00000393959.6
|
GABRB2
|
gamma-aminobutyric acid type A receptor subunit beta2 |
| chrX_+_56563569 | 0.18 |
ENST00000338222.7
|
UBQLN2
|
ubiquilin 2 |
| chr7_+_21428023 | 0.18 |
ENST00000432066.2
ENST00000222584.8 |
SP4
|
Sp4 transcription factor |
| chr3_+_159839847 | 0.18 |
ENST00000445224.6
|
SCHIP1
|
schwannomin interacting protein 1 |
| chr17_+_49788672 | 0.18 |
ENST00000454930.6
ENST00000259021.9 ENST00000509773.5 ENST00000510819.5 ENST00000424009.6 |
KAT7
|
lysine acetyltransferase 7 |
| chr3_+_49554436 | 0.18 |
ENST00000296452.5
|
BSN
|
bassoon presynaptic cytomatrix protein |
| chr8_-_81112055 | 0.18 |
ENST00000220597.4
|
PAG1
|
phosphoprotein membrane anchor with glycosphingolipid microdomains 1 |
| chr20_+_1894145 | 0.18 |
ENST00000400068.7
|
SIRPA
|
signal regulatory protein alpha |
| chr4_+_6782674 | 0.18 |
ENST00000307659.6
ENST00000425103.5 |
KIAA0232
|
KIAA0232 |
| chr7_-_76358982 | 0.17 |
ENST00000307630.5
|
YWHAG
|
tyrosine 3-monooxygenase/tryptophan 5-monooxygenase activation protein gamma |
| chr7_+_141074038 | 0.17 |
ENST00000565468.6
ENST00000610315.1 |
TMEM178B
|
transmembrane protein 178B |
| chr8_-_66667138 | 0.17 |
ENST00000310421.5
|
VCPIP1
|
valosin containing protein interacting protein 1 |
| chr11_+_73218274 | 0.16 |
ENST00000393597.7
ENST00000311131.6 |
P2RY2
|
purinergic receptor P2Y2 |
| chr5_+_10353668 | 0.16 |
ENST00000274140.10
ENST00000449913.6 ENST00000503788.5 |
MARCHF6
|
membrane associated ring-CH-type finger 6 |
| chr5_+_62306228 | 0.16 |
ENST00000381103.7
|
KIF2A
|
kinesin family member 2A |
| chr6_-_62286161 | 0.16 |
ENST00000281156.5
|
KHDRBS2
|
KH RNA binding domain containing, signal transduction associated 2 |
| chr13_-_26760741 | 0.16 |
ENST00000405846.5
|
GPR12
|
G protein-coupled receptor 12 |
| chr2_+_84971093 | 0.15 |
ENST00000456682.1
ENST00000409785.9 |
KCMF1
|
potassium channel modulatory factor 1 |
| chr12_+_94148553 | 0.15 |
ENST00000258526.9
|
PLXNC1
|
plexin C1 |
| chr17_+_4997901 | 0.15 |
ENST00000320785.10
ENST00000574165.1 |
KIF1C
|
kinesin family member 1C |
| chr5_+_157180816 | 0.14 |
ENST00000422843.8
|
ITK
|
IL2 inducible T cell kinase |
| chr3_-_122514876 | 0.14 |
ENST00000493510.1
ENST00000476916.5 ENST00000344337.11 ENST00000465882.5 |
KPNA1
|
karyopherin subunit alpha 1 |
| chrX_+_123961304 | 0.14 |
ENST00000371160.5
ENST00000435103.5 |
STAG2
|
stromal antigen 2 |
| chr11_+_63681483 | 0.14 |
ENST00000339997.8
ENST00000540798.5 ENST00000545432.5 ENST00000543552.5 ENST00000377819.10 ENST00000537981.5 |
RTN3
|
reticulon 3 |
| chr9_+_126326809 | 0.14 |
ENST00000361171.8
ENST00000489637.3 |
MVB12B
|
multivesicular body subunit 12B |
| chr3_+_151086889 | 0.14 |
ENST00000474524.5
ENST00000273432.8 |
MED12L
|
mediator complex subunit 12L |
| chr13_-_29595670 | 0.13 |
ENST00000380752.10
|
SLC7A1
|
solute carrier family 7 member 1 |
| chr2_+_112275588 | 0.13 |
ENST00000409871.6
ENST00000343936.4 |
ZC3H6
|
zinc finger CCCH-type containing 6 |
| chr1_-_230426293 | 0.13 |
ENST00000391860.7
|
PGBD5
|
piggyBac transposable element derived 5 |
| chr6_+_11093753 | 0.13 |
ENST00000416247.4
|
SMIM13
|
small integral membrane protein 13 |
| chr8_-_140635617 | 0.13 |
ENST00000220592.10
|
AGO2
|
argonaute RISC catalytic component 2 |
| chr5_+_154712824 | 0.12 |
ENST00000336314.9
|
LARP1
|
La ribonucleoprotein 1, translational regulator |
| chr1_+_62437015 | 0.12 |
ENST00000339950.5
|
USP1
|
ubiquitin specific peptidase 1 |
| chr11_-_83071819 | 0.12 |
ENST00000524635.1
ENST00000526205.5 ENST00000533486.5 ENST00000533276.6 ENST00000527633.6 |
RAB30
|
RAB30, member RAS oncogene family |
| chr3_-_160565560 | 0.12 |
ENST00000334256.9
ENST00000676866.1 ENST00000469804.1 |
KPNA4
|
karyopherin subunit alpha 4 |
| chr9_-_72364504 | 0.12 |
ENST00000237937.7
ENST00000343431.6 ENST00000376956.3 |
ZFAND5
|
zinc finger AN1-type containing 5 |
| chr17_+_18315273 | 0.12 |
ENST00000406438.5
|
SMCR8
|
SMCR8-C9orf72 complex subunit |
| chr12_+_71754834 | 0.12 |
ENST00000261263.5
|
RAB21
|
RAB21, member RAS oncogene family |
| chr9_-_97633343 | 0.12 |
ENST00000341170.5
|
TSTD2
|
thiosulfate sulfurtransferase like domain containing 2 |
| chr10_-_96513911 | 0.12 |
ENST00000357947.4
|
TLL2
|
tolloid like 2 |
| chr3_+_38453832 | 0.11 |
ENST00000352511.5
|
ACVR2B
|
activin A receptor type 2B |
| chr1_-_39691393 | 0.11 |
ENST00000372844.8
|
HPCAL4
|
hippocalcin like 4 |
| chr10_+_100535927 | 0.11 |
ENST00000299163.7
|
HIF1AN
|
hypoxia inducible factor 1 subunit alpha inhibitor |
| chr2_-_221572272 | 0.11 |
ENST00000409854.5
ENST00000443796.5 ENST00000281821.7 |
EPHA4
|
EPH receptor A4 |
| chr4_+_143336762 | 0.11 |
ENST00000262995.8
|
GAB1
|
GRB2 associated binding protein 1 |
| chrX_-_119943732 | 0.10 |
ENST00000371410.5
|
NKAP
|
NFKB activating protein |
| chr1_+_12063285 | 0.10 |
ENST00000263932.7
|
TNFRSF8
|
TNF receptor superfamily member 8 |
| chr1_-_151327684 | 0.10 |
ENST00000368874.8
|
PI4KB
|
phosphatidylinositol 4-kinase beta |
| chr1_-_19485468 | 0.10 |
ENST00000375142.5
|
CAPZB
|
capping actin protein of muscle Z-line subunit beta |
| chr17_+_47649899 | 0.10 |
ENST00000290158.9
|
KPNB1
|
karyopherin subunit beta 1 |
| chr6_+_156776020 | 0.10 |
ENST00000346085.10
|
ARID1B
|
AT-rich interaction domain 1B |
| chr1_+_35807974 | 0.10 |
ENST00000373210.4
|
AGO4
|
argonaute RISC component 4 |
| chr2_+_26970628 | 0.09 |
ENST00000233121.7
ENST00000405074.7 |
MAPRE3
|
microtubule associated protein RP/EB family member 3 |
| chr2_-_234497035 | 0.09 |
ENST00000390645.2
ENST00000339728.6 |
ARL4C
|
ADP ribosylation factor like GTPase 4C |
| chr2_-_9555738 | 0.09 |
ENST00000310823.8
|
ADAM17
|
ADAM metallopeptidase domain 17 |
| chr5_-_111757704 | 0.09 |
ENST00000379671.7
|
NREP
|
neuronal regeneration related protein |
| chr6_-_17706852 | 0.09 |
ENST00000262077.3
|
NUP153
|
nucleoporin 153 |
| chr12_-_389249 | 0.09 |
ENST00000535014.5
ENST00000543507.1 ENST00000544760.1 ENST00000399788.7 |
KDM5A
|
lysine demethylase 5A |
| chr17_-_62065248 | 0.09 |
ENST00000397786.7
|
MED13
|
mediator complex subunit 13 |
| chr12_+_74537787 | 0.09 |
ENST00000519948.4
|
ATXN7L3B
|
ataxin 7 like 3B |
| chr10_-_118754956 | 0.09 |
ENST00000369151.8
|
CACUL1
|
CDK2 associated cullin domain 1 |
| chr6_+_117907226 | 0.09 |
ENST00000360388.9
|
SLC35F1
|
solute carrier family 35 member F1 |
| chr10_+_75111595 | 0.09 |
ENST00000671800.1
ENST00000542569.6 ENST00000372687.4 |
SAMD8
|
sterile alpha motif domain containing 8 |
| chr8_+_22604632 | 0.09 |
ENST00000308511.8
ENST00000523801.5 ENST00000521301.5 |
CCAR2
|
cell cycle and apoptosis regulator 2 |
| chr12_-_56189548 | 0.09 |
ENST00000347471.8
ENST00000267064.8 ENST00000394023.7 |
SMARCC2
|
SWI/SNF related, matrix associated, actin dependent regulator of chromatin subfamily c member 2 |
| chr14_-_76812804 | 0.09 |
ENST00000556298.1
ENST00000251089.8 |
ANGEL1
|
angel homolog 1 |
| chr7_+_94509793 | 0.09 |
ENST00000297273.9
|
CASD1
|
CAS1 domain containing 1 |
| chr9_+_128947687 | 0.08 |
ENST00000372577.2
|
NUP188
|
nucleoporin 188 |
| chr7_+_139231225 | 0.08 |
ENST00000473989.8
|
UBN2
|
ubinuclein 2 |
| chr3_+_196739839 | 0.08 |
ENST00000327134.7
|
PAK2
|
p21 (RAC1) activated kinase 2 |
| chr1_-_32702736 | 0.08 |
ENST00000373484.4
ENST00000409190.8 |
SYNC
|
syncoilin, intermediate filament protein |
| chr17_-_39401593 | 0.08 |
ENST00000394294.7
ENST00000264658.11 ENST00000583610.5 ENST00000647139.1 |
FBXL20
|
F-box and leucine rich repeat protein 20 |
| chr2_-_37671633 | 0.08 |
ENST00000295324.4
|
CDC42EP3
|
CDC42 effector protein 3 |
| chr8_+_9555900 | 0.08 |
ENST00000310430.11
ENST00000520408.5 ENST00000522110.1 |
TNKS
|
tankyrase |
| chr11_-_40294089 | 0.08 |
ENST00000278198.2
|
LRRC4C
|
leucine rich repeat containing 4C |
| chr6_-_114343012 | 0.08 |
ENST00000312719.10
|
HS3ST5
|
heparan sulfate-glucosamine 3-sulfotransferase 5 |
| chr4_-_1248976 | 0.08 |
ENST00000514210.5
ENST00000382952.8 ENST00000290921.10 |
CTBP1
|
C-terminal binding protein 1 |
| chr3_+_51707059 | 0.08 |
ENST00000395052.8
|
GRM2
|
glutamate metabotropic receptor 2 |
| chr16_+_14833713 | 0.08 |
ENST00000287667.12
ENST00000620755.4 ENST00000610363.4 |
NOMO1
|
NODAL modulator 1 |
| chrX_+_101219769 | 0.08 |
ENST00000402866.5
ENST00000395209.8 |
DRP2
|
dystrophin related protein 2 |
| chr5_+_14664653 | 0.08 |
ENST00000284274.5
|
OTULIN
|
OTU deubiquitinase with linear linkage specificity |
| chr6_+_44387686 | 0.08 |
ENST00000371477.4
|
CDC5L
|
cell division cycle 5 like |
| chr7_-_149461056 | 0.08 |
ENST00000247930.5
|
ZNF777
|
zinc finger protein 777 |
| chrX_+_104166436 | 0.08 |
ENST00000493442.2
|
FAM199X
|
family with sequence similarity 199, X-linked |
| chr12_-_117190456 | 0.07 |
ENST00000330622.9
ENST00000622495.5 ENST00000427718.6 |
FBXO21
|
F-box protein 21 |
| chr21_-_15064934 | 0.07 |
ENST00000400199.5
ENST00000400202.5 ENST00000318948.7 |
NRIP1
|
nuclear receptor interacting protein 1 |
| chr2_-_192194908 | 0.07 |
ENST00000392314.5
ENST00000272771.10 |
TMEFF2
|
transmembrane protein with EGF like and two follistatin like domains 2 |
| chr9_+_5450503 | 0.07 |
ENST00000381573.8
ENST00000381577.4 |
CD274
|
CD274 molecule |
| chr8_+_60516947 | 0.07 |
ENST00000262646.12
|
RAB2A
|
RAB2A, member RAS oncogene family |
| chr22_+_35257452 | 0.07 |
ENST00000420166.5
ENST00000216106.6 ENST00000455359.5 |
HMGXB4
|
HMG-box containing 4 |
| chr11_+_33257265 | 0.07 |
ENST00000303296.9
ENST00000379016.7 |
HIPK3
|
homeodomain interacting protein kinase 3 |
| chr8_-_88327475 | 0.07 |
ENST00000286614.11
|
MMP16
|
matrix metallopeptidase 16 |
| chr5_-_176537361 | 0.07 |
ENST00000274811.9
|
RNF44
|
ring finger protein 44 |
| chr3_+_141231770 | 0.07 |
ENST00000286353.9
ENST00000502783.5 ENST00000393010.6 ENST00000514680.5 |
PXYLP1
|
2-phosphoxylose phosphatase 1 |
| chr8_-_100952918 | 0.07 |
ENST00000395957.6
ENST00000395948.6 ENST00000457309.2 |
YWHAZ
|
tyrosine 3-monooxygenase/tryptophan 5-monooxygenase activation protein zeta |
| chr9_+_2015335 | 0.06 |
ENST00000636559.1
ENST00000349721.8 |
SMARCA2
|
SWI/SNF related, matrix associated, actin dependent regulator of chromatin, subfamily a, member 2 |
| chr3_-_47781837 | 0.06 |
ENST00000254480.10
|
SMARCC1
|
SWI/SNF related, matrix associated, actin dependent regulator of chromatin subfamily c member 1 |
| chr4_+_48483324 | 0.06 |
ENST00000273861.5
|
SLC10A4
|
solute carrier family 10 member 4 |
| chr17_+_57256514 | 0.06 |
ENST00000284073.7
ENST00000674964.1 |
MSI2
|
musashi RNA binding protein 2 |
| chr6_+_37433197 | 0.06 |
ENST00000455891.5
ENST00000373451.9 |
CMTR1
|
cap methyltransferase 1 |
| chr2_-_206086057 | 0.06 |
ENST00000403263.6
|
INO80D
|
INO80 complex subunit D |
| chr3_-_48662877 | 0.06 |
ENST00000164024.5
|
CELSR3
|
cadherin EGF LAG seven-pass G-type receptor 3 |
| chr18_-_63319987 | 0.06 |
ENST00000398117.1
|
BCL2
|
BCL2 apoptosis regulator |
| chr13_+_57631735 | 0.06 |
ENST00000377918.8
|
PCDH17
|
protocadherin 17 |
| chr3_-_97972406 | 0.05 |
ENST00000394198.7
ENST00000333396.11 |
RIOX2
|
ribosomal oxygenase 2 |
| chr16_+_50025271 | 0.05 |
ENST00000562576.5
|
CNEP1R1
|
CTD nuclear envelope phosphatase 1 regulatory subunit 1 |
| chr2_-_174248360 | 0.05 |
ENST00000409546.5
ENST00000428402.6 ENST00000284719.8 |
OLA1
|
Obg like ATPase 1 |
| chr4_+_133149278 | 0.05 |
ENST00000264360.7
|
PCDH10
|
protocadherin 10 |
| chr15_+_88621290 | 0.05 |
ENST00000332810.4
ENST00000559528.1 |
AEN
|
apoptosis enhancing nuclease |
| chr10_+_112447198 | 0.05 |
ENST00000393077.3
ENST00000432306.5 |
VTI1A
|
vesicle transport through interaction with t-SNAREs 1A |
| chr8_+_60678705 | 0.05 |
ENST00000423902.7
|
CHD7
|
chromodomain helicase DNA binding protein 7 |
| chrX_+_41085436 | 0.05 |
ENST00000324545.9
ENST00000378308.7 |
USP9X
|
ubiquitin specific peptidase 9 X-linked |
| chr5_-_135452318 | 0.05 |
ENST00000537858.2
|
TIFAB
|
TIFA inhibitor |
| chr11_-_22860467 | 0.05 |
ENST00000532798.3
|
CCDC179
|
coiled-coil domain containing 179 |
| chr19_-_47113756 | 0.05 |
ENST00000253048.10
|
ZC3H4
|
zinc finger CCCH-type containing 4 |
| chr2_+_28751802 | 0.05 |
ENST00000296122.10
ENST00000395366.3 |
PPP1CB
|
protein phosphatase 1 catalytic subunit beta |
| chr15_+_72474305 | 0.05 |
ENST00000379887.9
|
ARIH1
|
ariadne RBR E3 ubiquitin protein ligase 1 |
| chr14_+_60249191 | 0.05 |
ENST00000395076.9
|
PPM1A
|
protein phosphatase, Mg2+/Mn2+ dependent 1A |
| chr20_-_5610980 | 0.05 |
ENST00000379019.7
|
GPCPD1
|
glycerophosphocholine phosphodiesterase 1 |
| chr13_+_51584435 | 0.05 |
ENST00000612477.1
ENST00000298125.7 |
WDFY2
|
WD repeat and FYVE domain containing 2 |
| chr5_+_322570 | 0.05 |
ENST00000510400.5
ENST00000316418.10 |
AHRR
|
aryl-hydrocarbon receptor repressor |
| chr2_-_231464475 | 0.04 |
ENST00000322723.9
ENST00000678828.1 ENST00000679348.1 ENST00000678246.1 ENST00000678364.1 ENST00000676690.1 |
NCL
|
nucleolin |
| chr5_+_43121596 | 0.04 |
ENST00000505606.6
ENST00000509634.5 ENST00000509341.5 |
ZNF131
|
zinc finger protein 131 |
| chr11_-_93741479 | 0.04 |
ENST00000448108.7
ENST00000532455.1 |
TAF1D
|
TATA-box binding protein associated factor, RNA polymerase I subunit D |
| chr5_+_140114085 | 0.04 |
ENST00000331327.5
|
PURA
|
purine rich element binding protein A |
| chr5_-_132963621 | 0.04 |
ENST00000265343.10
|
AFF4
|
AF4/FMR2 family member 4 |
| chr2_+_207529892 | 0.04 |
ENST00000432329.6
ENST00000445803.5 |
CREB1
|
cAMP responsive element binding protein 1 |
| chr15_-_58933668 | 0.04 |
ENST00000380516.7
|
SLTM
|
SAFB like transcription modulator |
| chr16_-_74607088 | 0.04 |
ENST00000565260.1
ENST00000447066.6 ENST00000205061.9 ENST00000422840.7 ENST00000627032.2 |
GLG1
|
golgi glycoprotein 1 |
| chr19_-_14006262 | 0.04 |
ENST00000588885.1
ENST00000254325.9 |
RFX1
|
regulatory factor X1 |
| chr5_+_80654644 | 0.04 |
ENST00000265081.7
|
MSH3
|
mutS homolog 3 |
| chr1_+_91500827 | 0.04 |
ENST00000234626.11
|
CDC7
|
cell division cycle 7 |
| chr12_+_67269328 | 0.04 |
ENST00000545606.6
|
CAND1
|
cullin associated and neddylation dissociated 1 |
| chr15_-_55588937 | 0.04 |
ENST00000302000.10
|
PYGO1
|
pygopus family PHD finger 1 |
| chr12_-_52652207 | 0.04 |
ENST00000309680.4
|
KRT2
|
keratin 2 |
| chr3_-_9249623 | 0.04 |
ENST00000383836.8
|
SRGAP3
|
SLIT-ROBO Rho GTPase activating protein 3 |
| chr7_-_27180013 | 0.04 |
ENST00000470747.4
|
ENSG00000257184.3
|
HOXA10-HOXA9 readthrough |
| chr3_+_141487008 | 0.04 |
ENST00000286364.9
ENST00000452898.2 |
RASA2
|
RAS p21 protein activator 2 |
| chr16_+_16232516 | 0.04 |
ENST00000399336.9
ENST00000678538.1 ENST00000678192.1 ENST00000677777.1 ENST00000677260.1 ENST00000676550.1 ENST00000263012.10 |
NOMO3
|
NODAL modulator 3 |
| chr15_+_63189554 | 0.04 |
ENST00000559006.1
ENST00000321437.9 |
RAB8B
|
RAB8B, member RAS oncogene family |
| chr3_+_77039836 | 0.04 |
ENST00000461745.5
|
ROBO2
|
roundabout guidance receptor 2 |
| chr6_+_107490103 | 0.03 |
ENST00000317357.10
|
SOBP
|
sine oculis binding protein homolog |
| chr22_+_32043253 | 0.03 |
ENST00000266088.9
|
SLC5A1
|
solute carrier family 5 member 1 |
| chr20_+_50510321 | 0.03 |
ENST00000541713.5
ENST00000371621.5 |
PTPN1
|
protein tyrosine phosphatase non-receptor type 1 |
| chr10_+_91220603 | 0.03 |
ENST00000336126.6
|
PCGF5
|
polycomb group ring finger 5 |
| chr11_-_62727444 | 0.03 |
ENST00000301785.7
|
HNRNPUL2
|
heterogeneous nuclear ribonucleoprotein U like 2 |
| chr18_+_13218769 | 0.03 |
ENST00000677055.1
ENST00000399848.7 |
LDLRAD4
|
low density lipoprotein receptor class A domain containing 4 |
| chr2_+_60881515 | 0.03 |
ENST00000295025.12
|
REL
|
REL proto-oncogene, NF-kB subunit |
| chrX_-_47619850 | 0.03 |
ENST00000295987.13
ENST00000340666.5 |
SYN1
|
synapsin I |
| chr12_-_77065526 | 0.03 |
ENST00000547316.1
ENST00000416496.6 ENST00000550669.5 ENST00000322886.12 |
E2F7
|
E2F transcription factor 7 |
| chr16_-_23149378 | 0.03 |
ENST00000219689.12
|
USP31
|
ubiquitin specific peptidase 31 |
| chr14_+_74239447 | 0.03 |
ENST00000261980.3
|
VSX2
|
visual system homeobox 2 |
| chrX_+_73563190 | 0.02 |
ENST00000373504.10
ENST00000373502.9 |
CHIC1
|
cysteine rich hydrophobic domain 1 |
| chr1_-_26890237 | 0.02 |
ENST00000431781.2
ENST00000374135.9 |
GPN2
|
GPN-loop GTPase 2 |
| chr17_-_81927699 | 0.02 |
ENST00000574686.1
ENST00000357736.9 |
MAFG
|
MAF bZIP transcription factor G |
| chr2_+_73984902 | 0.02 |
ENST00000409262.8
|
TET3
|
tet methylcytosine dioxygenase 3 |
| chr3_+_140941792 | 0.02 |
ENST00000446041.6
ENST00000324194.12 ENST00000507429.5 |
SLC25A36
|
solute carrier family 25 member 36 |
| chr3_+_32817990 | 0.02 |
ENST00000383763.6
|
TRIM71
|
tripartite motif containing 71 |
| chr3_-_9792404 | 0.02 |
ENST00000301964.7
|
TADA3
|
transcriptional adaptor 3 |
| chr10_+_73772270 | 0.02 |
ENST00000372841.8
ENST00000394790.2 |
FUT11
|
fucosyltransferase 11 |
| chr6_-_117602447 | 0.02 |
ENST00000368498.7
ENST00000052569.10 ENST00000535237.2 |
GOPC
|
golgi associated PDZ and coiled-coil motif containing |
| chr7_+_107168961 | 0.02 |
ENST00000468410.5
ENST00000478930.5 ENST00000464009.1 ENST00000222574.9 |
HBP1
|
HMG-box transcription factor 1 |
| chr14_-_56810448 | 0.02 |
ENST00000339475.10
ENST00000555006.5 ENST00000672264.2 ENST00000554559.5 ENST00000555804.1 |
OTX2
|
orthodenticle homeobox 2 |
| chr8_-_22131003 | 0.02 |
ENST00000381418.9
|
HR
|
HR lysine demethylase and nuclear receptor corepressor |
| chr1_-_38859669 | 0.02 |
ENST00000373001.4
|
RRAGC
|
Ras related GTP binding C |
| chr3_-_113746218 | 0.02 |
ENST00000497255.1
ENST00000240922.8 ENST00000478020.1 ENST00000493900.5 |
NAA50
|
N-alpha-acetyltransferase 50, NatE catalytic subunit |
| chr14_-_33951052 | 0.02 |
ENST00000250457.9
ENST00000547327.2 |
EGLN3
|
egl-9 family hypoxia inducible factor 3 |
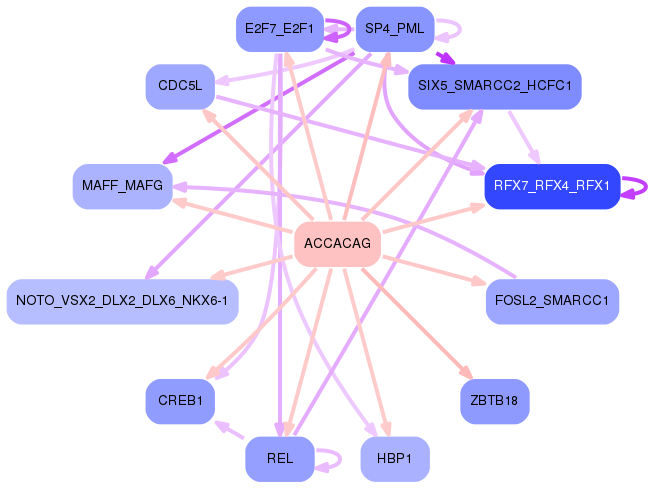
Network of associatons between targets according to the STRING database.

First level regulatory network of ACCACAG
Gene Ontology Analysis
Gene overrepresentation in biological process category:
| Log-likelihood per target | Total log-likelihood | Term | Description |
|---|---|---|---|
| 0.1 | 0.6 | GO:0072708 | response to sorbitol(GO:0072708) |
| 0.1 | 0.4 | GO:0098971 | anterograde dendritic transport of neurotransmitter receptor complex(GO:0098971) |
| 0.1 | 0.3 | GO:0019858 | cytosine metabolic process(GO:0019858) |
| 0.1 | 0.3 | GO:0006542 | glutamine biosynthetic process(GO:0006542) |
| 0.1 | 0.3 | GO:2000638 | regulation of SREBP signaling pathway(GO:2000638) negative regulation of SREBP signaling pathway(GO:2000639) |
| 0.1 | 0.2 | GO:0098928 | presynaptic signal transduction(GO:0098928) presynapse to nucleus signaling pathway(GO:0099526) |
| 0.1 | 0.2 | GO:1990926 | short-term synaptic potentiation(GO:1990926) |
| 0.1 | 0.2 | GO:1905150 | regulation of voltage-gated sodium channel activity(GO:1905150) |
| 0.0 | 0.2 | GO:1900186 | negative regulation of clathrin-mediated endocytosis(GO:1900186) |
| 0.0 | 0.1 | GO:0045556 | TRAIL biosynthetic process(GO:0045553) regulation of TRAIL biosynthetic process(GO:0045554) positive regulation of TRAIL biosynthetic process(GO:0045556) |
| 0.0 | 0.3 | GO:0090650 | response to oxygen-glucose deprivation(GO:0090649) cellular response to oxygen-glucose deprivation(GO:0090650) |
| 0.0 | 0.1 | GO:1903031 | regulation of microtubule plus-end binding(GO:1903031) positive regulation of microtubule plus-end binding(GO:1903033) |
| 0.0 | 0.2 | GO:0006540 | glutamate decarboxylation to succinate(GO:0006540) |
| 0.0 | 0.1 | GO:0033025 | mast cell homeostasis(GO:0033023) mast cell apoptotic process(GO:0033024) regulation of mast cell apoptotic process(GO:0033025) |
| 0.0 | 0.1 | GO:1902594 | viral penetration into host nucleus(GO:0075732) multi-organism nuclear import(GO:1902594) |
| 0.0 | 0.2 | GO:0030241 | skeletal muscle myosin thick filament assembly(GO:0030241) |
| 0.0 | 0.2 | GO:0090625 | mRNA cleavage involved in gene silencing by siRNA(GO:0090625) |
| 0.0 | 0.1 | GO:0034092 | negative regulation of maintenance of sister chromatid cohesion(GO:0034092) negative regulation of maintenance of mitotic sister chromatid cohesion(GO:0034183) maintenance of mitotic sister chromatid cohesion, telomeric(GO:0099403) mitotic sister chromatid cohesion, telomeric(GO:0099404) regulation of maintenance of mitotic sister chromatid cohesion, telomeric(GO:1904907) negative regulation of maintenance of mitotic sister chromatid cohesion, telomeric(GO:1904908) |
| 0.0 | 0.1 | GO:0097156 | fasciculation of motor neuron axon(GO:0097156) |
| 0.0 | 0.1 | GO:0001543 | ovarian follicle rupture(GO:0001543) |
| 0.0 | 0.1 | GO:0019075 | virus maturation(GO:0019075) |
| 0.0 | 0.1 | GO:0072752 | cellular response to rapamycin(GO:0072752) |
| 0.0 | 0.1 | GO:0036451 | cap mRNA methylation(GO:0036451) |
| 0.0 | 0.1 | GO:1990108 | protein linear deubiquitination(GO:1990108) |
| 0.0 | 0.1 | GO:1990637 | response to prolactin(GO:1990637) |
| 0.0 | 0.1 | GO:0048631 | regulation of skeletal muscle tissue growth(GO:0048631) |
| 0.0 | 0.1 | GO:1990709 | presynaptic active zone organization(GO:1990709) |
| 0.0 | 0.1 | GO:1903826 | arginine transmembrane transport(GO:1903826) |
| 0.0 | 0.1 | GO:0061428 | negative regulation of transcription from RNA polymerase II promoter in response to hypoxia(GO:0061428) |
| 0.0 | 0.2 | GO:0007256 | activation of JNKK activity(GO:0007256) |
| 0.0 | 0.0 | GO:0071626 | mastication(GO:0071626) learned vocalization behavior(GO:0098583) |
| 0.0 | 0.3 | GO:0046007 | negative regulation of activated T cell proliferation(GO:0046007) |
| 0.0 | 0.1 | GO:0034721 | negative regulation of histone deacetylation(GO:0031064) histone H3-K4 demethylation, trimethyl-H3-K4-specific(GO:0034721) |
| 0.0 | 0.2 | GO:0090168 | Golgi reassembly(GO:0090168) |
| 0.0 | 0.1 | GO:0031291 | Ran protein signal transduction(GO:0031291) |
| 0.0 | 0.1 | GO:2001271 | negative regulation of cysteine-type endopeptidase activity involved in execution phase of apoptosis(GO:2001271) |
| 0.0 | 0.2 | GO:0061088 | regulation of sequestering of zinc ion(GO:0061088) |
| 0.0 | 0.4 | GO:0030208 | dermatan sulfate biosynthetic process(GO:0030208) |
| 0.0 | 0.1 | GO:0051490 | negative regulation of filopodium assembly(GO:0051490) |
| 0.0 | 0.2 | GO:0014877 | response to muscle inactivity involved in regulation of muscle adaptation(GO:0014877) response to denervation involved in regulation of muscle adaptation(GO:0014894) |
| 0.0 | 0.1 | GO:0097026 | dendritic cell dendrite assembly(GO:0097026) |
| 0.0 | 0.1 | GO:0032876 | negative regulation of DNA endoreduplication(GO:0032876) |
| 0.0 | 0.1 | GO:1901098 | positive regulation of autophagosome maturation(GO:1901098) |
| 0.0 | 0.1 | GO:0071787 | endoplasmic reticulum tubular network assembly(GO:0071787) |
| 0.0 | 0.1 | GO:0043375 | negative regulation of cellular pH reduction(GO:0032848) CD8-positive, alpha-beta T cell lineage commitment(GO:0043375) negative regulation of retinal cell programmed cell death(GO:0046671) |
| 0.0 | 0.1 | GO:1903758 | regulation of transcription from RNA polymerase II promoter by histone modification(GO:1903756) negative regulation of transcription from RNA polymerase II promoter by histone modification(GO:1903758) |
| 0.0 | 0.1 | GO:0030961 | peptidyl-arginine hydroxylation(GO:0030961) |
| 0.0 | 0.0 | GO:2000646 | positive regulation of receptor catabolic process(GO:2000646) |
| 0.0 | 0.1 | GO:0045113 | regulation of integrin biosynthetic process(GO:0045113) |
| 0.0 | 0.2 | GO:0070257 | positive regulation of mucus secretion(GO:0070257) |
Gene overrepresentation in cellular component category:
| Log-likelihood per target | Total log-likelihood | Term | Description |
|---|---|---|---|
| 0.1 | 0.2 | GO:0099569 | cytoskeleton of presynaptic active zone(GO:0048788) presynaptic active zone cytoplasmic component(GO:0098831) presynaptic cytoskeleton(GO:0099569) |
| 0.0 | 0.2 | GO:0070032 | synaptobrevin 2-SNAP-25-syntaxin-1a-complexin I complex(GO:0070032) |
| 0.0 | 0.3 | GO:1990452 | Parkin-FBXW7-Cul1 ubiquitin ligase complex(GO:1990452) |
| 0.0 | 0.1 | GO:0044609 | DBIRD complex(GO:0044609) |
| 0.0 | 0.1 | GO:0044611 | nuclear pore inner ring(GO:0044611) |
| 0.0 | 0.4 | GO:0035253 | ciliary rootlet(GO:0035253) |
| 0.0 | 0.3 | GO:0016600 | flotillin complex(GO:0016600) |
| 0.0 | 0.4 | GO:0032591 | dendritic spine membrane(GO:0032591) |
| 0.0 | 0.2 | GO:0035068 | micro-ribonucleoprotein complex(GO:0035068) |
| 0.0 | 0.2 | GO:0042589 | zymogen granule membrane(GO:0042589) |
| 0.0 | 0.1 | GO:0071797 | LUBAC complex(GO:0071797) |
| 0.0 | 0.2 | GO:0061202 | clathrin-sculpted gamma-aminobutyric acid transport vesicle(GO:0061200) clathrin-sculpted gamma-aminobutyric acid transport vesicle membrane(GO:0061202) |
| 0.0 | 0.1 | GO:0098559 | cytoplasmic side of early endosome membrane(GO:0098559) |
Gene overrepresentation in molecular function category:
| Log-likelihood per target | Total log-likelihood | Term | Description |
|---|---|---|---|
| 0.1 | 0.2 | GO:0015633 | zinc transporting ATPase activity(GO:0015633) |
| 0.1 | 0.3 | GO:0016880 | glutamate-ammonia ligase activity(GO:0004356) ammonia ligase activity(GO:0016211) acid-ammonia (or amide) ligase activity(GO:0016880) |
| 0.0 | 0.2 | GO:0004351 | glutamate decarboxylase activity(GO:0004351) |
| 0.0 | 0.2 | GO:0008426 | protein kinase C inhibitor activity(GO:0008426) |
| 0.0 | 0.3 | GO:0050816 | phosphothreonine binding(GO:0050816) |
| 0.0 | 0.1 | GO:0005519 | cytoskeletal regulatory protein binding(GO:0005519) |
| 0.0 | 0.1 | GO:0098808 | mRNA cap binding(GO:0098808) |
| 0.0 | 0.2 | GO:0001025 | RNA polymerase III transcription factor binding(GO:0001025) |
| 0.0 | 0.3 | GO:0036312 | phosphatidylinositol 3-kinase regulatory subunit binding(GO:0036312) |
| 0.0 | 0.1 | GO:0004483 | mRNA (nucleoside-2'-O-)-methyltransferase activity(GO:0004483) |
| 0.0 | 0.1 | GO:0001641 | group II metabotropic glutamate receptor activity(GO:0001641) |
| 0.0 | 0.1 | GO:0071987 | WD40-repeat domain binding(GO:0071987) |
| 0.0 | 0.2 | GO:0005237 | inhibitory extracellular ligand-gated ion channel activity(GO:0005237) |
| 0.0 | 0.7 | GO:0004708 | MAP kinase kinase activity(GO:0004708) |
| 0.0 | 0.4 | GO:0005068 | transmembrane receptor protein tyrosine kinase adaptor activity(GO:0005068) |
| 0.0 | 0.0 | GO:0047389 | glycerophosphocholine phosphodiesterase activity(GO:0047389) |
| 0.0 | 0.1 | GO:0034647 | histone demethylase activity (H3-trimethyl-K4 specific)(GO:0034647) |
| 0.0 | 0.1 | GO:0015181 | arginine transmembrane transporter activity(GO:0015181) |
| 0.0 | 0.1 | GO:0047493 | sphingomyelin synthase activity(GO:0033188) ceramide cholinephosphotransferase activity(GO:0047493) |
| 0.0 | 0.2 | GO:0031433 | telethonin binding(GO:0031433) |
| 0.0 | 0.1 | GO:0004430 | 1-phosphatidylinositol 4-kinase activity(GO:0004430) |
| 0.0 | 0.3 | GO:0004143 | diacylglycerol kinase activity(GO:0004143) |
| 0.0 | 0.5 | GO:0005031 | tumor necrosis factor-activated receptor activity(GO:0005031) death receptor activity(GO:0005035) |
| 0.0 | 0.1 | GO:0008467 | [heparan sulfate]-glucosamine 3-sulfotransferase 1 activity(GO:0008467) |
| 0.0 | 0.4 | GO:0008574 | ATP-dependent microtubule motor activity, plus-end-directed(GO:0008574) |
Gene overrepresentation in curated gene sets: canonical pathways category:
| Log-likelihood per target | Total log-likelihood | Term | Description |
|---|---|---|---|
| 0.0 | 0.7 | PID ANTHRAX PATHWAY | Cellular roles of Anthrax toxin |
| 0.0 | 0.4 | PID SYNDECAN 3 PATHWAY | Syndecan-3-mediated signaling events |
Gene overrepresentation in curated gene sets: REACTOME pathways category:
| Log-likelihood per target | Total log-likelihood | Term | Description |
|---|---|---|---|
| 0.0 | 0.6 | REACTOME SPRY REGULATION OF FGF SIGNALING | Genes involved in Spry regulation of FGF signaling |
| 0.0 | 0.2 | REACTOME APOPTOSIS INDUCED DNA FRAGMENTATION | Genes involved in Apoptosis induced DNA fragmentation |
| 0.0 | 0.1 | REACTOME REGULATION OF THE FANCONI ANEMIA PATHWAY | Genes involved in Regulation of the Fanconi anemia pathway |
| 0.0 | 0.5 | REACTOME ACTIVATED TAK1 MEDIATES P38 MAPK ACTIVATION | Genes involved in activated TAK1 mediates p38 MAPK activation |
| 0.0 | 0.4 | REACTOME CS DS DEGRADATION | Genes involved in CS/DS degradation |
| 0.0 | 0.5 | REACTOME KINESINS | Genes involved in Kinesins |