Project
Illumina Body Map 2 (GSE30611)
Navigation
Downloads
Results for ACCCUGU
Z-value: 0.67
Motif logo

miRNA associated with seed ACCCUGU
| Name | miRBASE accession |
|---|---|
|
hsa-miR-10a-5p
|
MIMAT0000253 |
|
hsa-miR-10b-5p
|
MIMAT0000254 |
Activity profile of ACCCUGU motif
Sorted Z-values of ACCCUGU motif
Network of associatons between targets according to the STRING database.

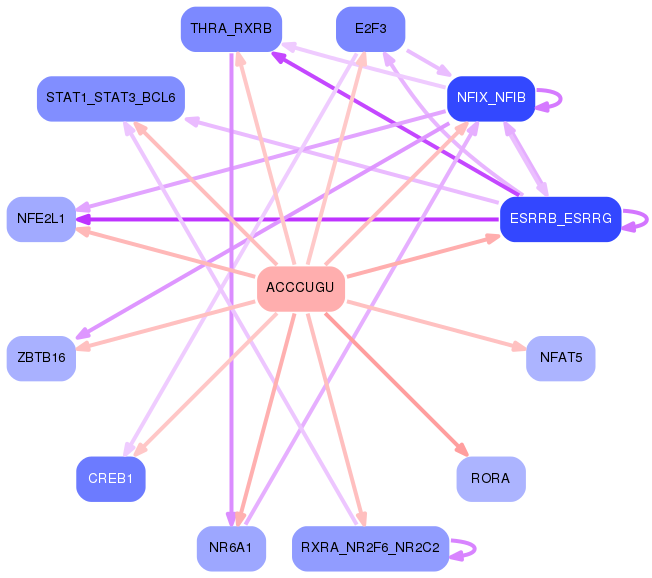
First level regulatory network of ACCCUGU
Gene Ontology Analysis
Gene overrepresentation in biological process category:
| Log-likelihood per target | Total log-likelihood | Term | Description |
|---|---|---|---|
| 0.4 | 1.1 | GO:0051821 | negative regulation of transcription from RNA polymerase II promoter in response to UV-induced DNA damage(GO:0010768) transmission of virus(GO:0019089) dissemination or transmission of symbiont from host(GO:0044007) dissemination or transmission of organism from other organism involved in symbiotic interaction(GO:0051821) |
| 0.2 | 1.3 | GO:0072658 | maintenance of protein location in membrane(GO:0072658) maintenance of protein location in plasma membrane(GO:0072660) positive regulation of membrane depolarization during cardiac muscle cell action potential(GO:1900827) |
| 0.1 | 0.4 | GO:0031587 | positive regulation of inositol 1,4,5-trisphosphate-sensitive calcium-release channel activity(GO:0031587) |
| 0.1 | 1.6 | GO:0046549 | retinal cone cell differentiation(GO:0042670) retinal cone cell development(GO:0046549) |
| 0.1 | 0.7 | GO:1905123 | regulation of glucosylceramidase activity(GO:1905123) |
| 0.1 | 0.4 | GO:0045763 | negative regulation of cellular amino acid metabolic process(GO:0045763) |
| 0.1 | 0.5 | GO:0032764 | negative regulation of mast cell cytokine production(GO:0032764) |
| 0.1 | 0.9 | GO:0016560 | protein import into peroxisome matrix, docking(GO:0016560) |
| 0.1 | 1.2 | GO:0008343 | adult feeding behavior(GO:0008343) |
| 0.1 | 1.6 | GO:0035404 | histone-serine phosphorylation(GO:0035404) |
| 0.1 | 0.4 | GO:0071409 | cellular response to cycloheximide(GO:0071409) |
| 0.1 | 1.4 | GO:0021694 | cerebellar Purkinje cell layer formation(GO:0021694) cerebellar Purkinje cell differentiation(GO:0021702) |
| 0.1 | 0.3 | GO:0002528 | regulation of vascular permeability involved in acute inflammatory response(GO:0002528) |
| 0.1 | 2.0 | GO:0071420 | cellular response to histamine(GO:0071420) |
| 0.1 | 0.4 | GO:0051138 | positive regulation of NK T cell differentiation(GO:0051138) |
| 0.1 | 0.3 | GO:2000686 | regulation of rubidium ion transmembrane transporter activity(GO:2000686) |
| 0.1 | 0.8 | GO:0019367 | fatty acid elongation, saturated fatty acid(GO:0019367) fatty acid elongation, unsaturated fatty acid(GO:0019368) fatty acid elongation, monounsaturated fatty acid(GO:0034625) fatty acid elongation, polyunsaturated fatty acid(GO:0034626) |
| 0.0 | 0.2 | GO:0046619 | optic placode formation involved in camera-type eye formation(GO:0046619) |
| 0.0 | 1.3 | GO:0051823 | regulation of synapse structural plasticity(GO:0051823) |
| 0.0 | 1.1 | GO:0097264 | self proteolysis(GO:0097264) |
| 0.0 | 0.3 | GO:0048549 | endosome localization(GO:0032439) positive regulation of pinocytosis(GO:0048549) |
| 0.0 | 0.3 | GO:0071947 | protein deubiquitination involved in ubiquitin-dependent protein catabolic process(GO:0071947) |
| 0.0 | 0.2 | GO:0045925 | positive regulation of female receptivity(GO:0045925) |
| 0.0 | 0.1 | GO:0009786 | regulation of asymmetric cell division(GO:0009786) |
| 0.0 | 0.1 | GO:0071930 | positive regulation of DNA endoreduplication(GO:0032877) negative regulation of transcription involved in G1/S transition of mitotic cell cycle(GO:0071930) |
| 0.0 | 0.1 | GO:1904562 | phosphatidylinositol 5-phosphate metabolic process(GO:1904562) |
| 0.0 | 0.8 | GO:0048172 | regulation of short-term neuronal synaptic plasticity(GO:0048172) |
| 0.0 | 0.3 | GO:0042271 | susceptibility to natural killer cell mediated cytotoxicity(GO:0042271) |
| 0.0 | 0.2 | GO:0034670 | chemotaxis to arachidonic acid(GO:0034670) response to arachidonic acid(GO:1904550) |
| 0.0 | 0.1 | GO:0036233 | glycine import(GO:0036233) |
| 0.0 | 0.8 | GO:0016024 | CDP-diacylglycerol biosynthetic process(GO:0016024) |
| 0.0 | 0.1 | GO:0072365 | regulation of cellular ketone metabolic process by negative regulation of transcription from RNA polymerase II promoter(GO:0072365) |
| 0.0 | 0.2 | GO:0090074 | negative regulation of protein homodimerization activity(GO:0090074) |
| 0.0 | 0.6 | GO:1990118 | sodium ion import across plasma membrane(GO:0098719) sodium ion import into cell(GO:1990118) |
| 0.0 | 0.2 | GO:0051694 | pointed-end actin filament capping(GO:0051694) |
| 0.0 | 0.3 | GO:0097105 | presynaptic membrane assembly(GO:0097105) |
| 0.0 | 1.0 | GO:2000369 | regulation of clathrin-mediated endocytosis(GO:2000369) |
| 0.0 | 0.4 | GO:0051574 | positive regulation of histone H3-K9 methylation(GO:0051574) |
| 0.0 | 0.2 | GO:0070940 | dephosphorylation of RNA polymerase II C-terminal domain(GO:0070940) |
| 0.0 | 0.0 | GO:0060623 | regulation of chromosome condensation(GO:0060623) |
| 0.0 | 0.5 | GO:0035020 | regulation of Rac protein signal transduction(GO:0035020) |
| 0.0 | 0.4 | GO:0035090 | maintenance of apical/basal cell polarity(GO:0035090) maintenance of epithelial cell apical/basal polarity(GO:0045199) |
| 0.0 | 0.3 | GO:0071372 | cellular response to follicle-stimulating hormone stimulus(GO:0071372) |
| 0.0 | 0.6 | GO:0006783 | heme biosynthetic process(GO:0006783) |
| 0.0 | 0.4 | GO:0042753 | positive regulation of circadian rhythm(GO:0042753) |
| 0.0 | 0.5 | GO:0003016 | respiratory system process(GO:0003016) |
| 0.0 | 0.1 | GO:0030050 | vesicle transport along actin filament(GO:0030050) |
| 0.0 | 0.1 | GO:0070345 | negative regulation of fat cell proliferation(GO:0070345) |
| 0.0 | 0.2 | GO:0035278 | miRNA mediated inhibition of translation(GO:0035278) negative regulation of translation, ncRNA-mediated(GO:0040033) regulation of translation, ncRNA-mediated(GO:0045974) |
| 0.0 | 0.9 | GO:0048384 | retinoic acid receptor signaling pathway(GO:0048384) |
| 0.0 | 0.4 | GO:0060384 | innervation(GO:0060384) |
| 0.0 | 0.8 | GO:0006198 | cAMP catabolic process(GO:0006198) |
| 0.0 | 0.2 | GO:0035331 | negative regulation of hippo signaling(GO:0035331) |
Gene overrepresentation in cellular component category:
| Log-likelihood per target | Total log-likelihood | Term | Description |
|---|---|---|---|
| 0.3 | 1.1 | GO:0098855 | HCN channel complex(GO:0098855) |
| 0.1 | 1.6 | GO:0031588 | nucleotide-activated protein kinase complex(GO:0031588) |
| 0.0 | 1.7 | GO:0014731 | spectrin-associated cytoskeleton(GO:0014731) |
| 0.0 | 2.0 | GO:1902711 | GABA-A receptor complex(GO:1902711) |
| 0.0 | 0.4 | GO:0031466 | Cul5-RING ubiquitin ligase complex(GO:0031466) |
| 0.0 | 1.1 | GO:0016327 | apicolateral plasma membrane(GO:0016327) |
| 0.0 | 0.2 | GO:1990589 | ATF4-CREB1 transcription factor complex(GO:1990589) |
| 0.0 | 0.1 | GO:0000811 | GINS complex(GO:0000811) |
| 0.0 | 0.3 | GO:0044354 | pinosome(GO:0044352) macropinosome(GO:0044354) |
| 0.0 | 0.3 | GO:0042584 | chromaffin granule membrane(GO:0042584) |
| 0.0 | 1.3 | GO:0033017 | sarcoplasmic reticulum membrane(GO:0033017) |
| 0.0 | 0.8 | GO:0032281 | AMPA glutamate receptor complex(GO:0032281) |
| 0.0 | 0.6 | GO:0034451 | centriolar satellite(GO:0034451) |
| 0.0 | 0.1 | GO:0002945 | cyclin K-CDK13 complex(GO:0002945) |
| 0.0 | 0.2 | GO:0042788 | polysomal ribosome(GO:0042788) |
| 0.0 | 0.1 | GO:0017109 | glutamate-cysteine ligase complex(GO:0017109) |
Gene overrepresentation in molecular function category:
| Log-likelihood per target | Total log-likelihood | Term | Description |
|---|---|---|---|
| 0.5 | 1.6 | GO:0050405 | [hydroxymethylglutaryl-CoA reductase (NADPH)] kinase activity(GO:0047322) [acetyl-CoA carboxylase] kinase activity(GO:0050405) |
| 0.1 | 1.1 | GO:0005222 | intracellular cAMP activated cation channel activity(GO:0005222) |
| 0.1 | 1.1 | GO:0050815 | phosphoserine binding(GO:0050815) phosphothreonine binding(GO:0050816) |
| 0.1 | 0.9 | GO:0032184 | SUMO polymer binding(GO:0032184) |
| 0.1 | 1.4 | GO:0008142 | oxysterol binding(GO:0008142) |
| 0.1 | 1.0 | GO:0005237 | inhibitory extracellular ligand-gated ion channel activity(GO:0005237) |
| 0.1 | 0.9 | GO:0005052 | peroxisome matrix targeting signal-1 binding(GO:0005052) |
| 0.1 | 1.0 | GO:0050682 | AF-2 domain binding(GO:0050682) |
| 0.1 | 0.4 | GO:0004534 | 5'-3' exoribonuclease activity(GO:0004534) |
| 0.1 | 0.8 | GO:0009922 | fatty acid elongase activity(GO:0009922) 3-oxo-arachidoyl-CoA synthase activity(GO:0102336) 3-oxo-cerotoyl-CoA synthase activity(GO:0102337) 3-oxo-lignoceronyl-CoA synthase activity(GO:0102338) |
| 0.1 | 0.9 | GO:0022851 | GABA-gated chloride ion channel activity(GO:0022851) |
| 0.0 | 0.9 | GO:0019966 | interleukin-1 binding(GO:0019966) |
| 0.0 | 0.1 | GO:0015375 | glycine:sodium symporter activity(GO:0015375) |
| 0.0 | 0.6 | GO:0015386 | potassium:proton antiporter activity(GO:0015386) |
| 0.0 | 0.5 | GO:0005004 | GPI-linked ephrin receptor activity(GO:0005004) |
| 0.0 | 0.8 | GO:0070016 | armadillo repeat domain binding(GO:0070016) |
| 0.0 | 0.2 | GO:1990763 | arrestin family protein binding(GO:1990763) |
| 0.0 | 0.5 | GO:0001161 | intronic transcription regulatory region sequence-specific DNA binding(GO:0001161) intronic transcription regulatory region DNA binding(GO:0044213) |
| 0.0 | 1.7 | GO:0030507 | spectrin binding(GO:0030507) |
| 0.0 | 0.3 | GO:0019869 | chloride channel inhibitor activity(GO:0019869) |
| 0.0 | 0.3 | GO:0035612 | AP-2 adaptor complex binding(GO:0035612) |
| 0.0 | 1.3 | GO:0004683 | calmodulin-dependent protein kinase activity(GO:0004683) |
| 0.0 | 0.8 | GO:0003841 | 1-acylglycerol-3-phosphate O-acyltransferase activity(GO:0003841) |
| 0.0 | 0.4 | GO:0005522 | profilin binding(GO:0005522) |
| 0.0 | 0.3 | GO:0001206 | transcriptional repressor activity, RNA polymerase II distal enhancer sequence-specific binding(GO:0001206) |
| 0.0 | 0.2 | GO:0048273 | mitogen-activated protein kinase p38 binding(GO:0048273) |
| 0.0 | 0.8 | GO:0004115 | 3',5'-cyclic-AMP phosphodiesterase activity(GO:0004115) |
| 0.0 | 0.8 | GO:0050699 | WW domain binding(GO:0050699) |
| 0.0 | 0.2 | GO:0004726 | non-membrane spanning protein tyrosine phosphatase activity(GO:0004726) |
| 0.0 | 0.1 | GO:0004357 | glutamate-cysteine ligase activity(GO:0004357) |
| 0.0 | 1.5 | GO:0004843 | thiol-dependent ubiquitin-specific protease activity(GO:0004843) |
Gene overrepresentation in curated gene sets: canonical pathways category:
| Log-likelihood per target | Total log-likelihood | Term | Description |
|---|---|---|---|
| 0.0 | 1.7 | ST WNT CA2 CYCLIC GMP PATHWAY | Wnt/Ca2+/cyclic GMP signaling. |
| 0.0 | 1.7 | PID LKB1 PATHWAY | LKB1 signaling events |
| 0.0 | 1.1 | PID PS1 PATHWAY | Presenilin action in Notch and Wnt signaling |
| 0.0 | 1.4 | PID HIF1 TFPATHWAY | HIF-1-alpha transcription factor network |
Gene overrepresentation in curated gene sets: REACTOME pathways category:
| Log-likelihood per target | Total log-likelihood | Term | Description |
|---|---|---|---|
| 0.1 | 1.6 | REACTOME REGULATION OF RHEB GTPASE ACTIVITY BY AMPK | Genes involved in Regulation of Rheb GTPase activity by AMPK |
| 0.0 | 2.0 | REACTOME GABA A RECEPTOR ACTIVATION | Genes involved in GABA A receptor activation |
| 0.0 | 1.5 | REACTOME CREB PHOSPHORYLATION THROUGH THE ACTIVATION OF CAMKII | Genes involved in CREB phosphorylation through the activation of CaMKII |
| 0.0 | 1.7 | REACTOME INTERACTION BETWEEN L1 AND ANKYRINS | Genes involved in Interaction between L1 and Ankyrins |
| 0.0 | 1.3 | REACTOME CIRCADIAN REPRESSION OF EXPRESSION BY REV ERBA | Genes involved in Circadian Repression of Expression by REV-ERBA |
| 0.0 | 0.6 | REACTOME ALPHA LINOLENIC ACID ALA METABOLISM | Genes involved in alpha-linolenic acid (ALA) metabolism |
| 0.0 | 0.8 | REACTOME SYNTHESIS OF PA | Genes involved in Synthesis of PA |
| 0.0 | 0.4 | REACTOME MRNA DECAY BY 5 TO 3 EXORIBONUCLEASE | Genes involved in mRNA Decay by 5' to 3' Exoribonuclease |
| 0.0 | 1.7 | REACTOME NUCLEAR RECEPTOR TRANSCRIPTION PATHWAY | Genes involved in Nuclear Receptor transcription pathway |
| 0.0 | 0.4 | REACTOME PROLACTIN RECEPTOR SIGNALING | Genes involved in Prolactin receptor signaling |